Carbon Pollution Emission Guidelines for Existing Stationary Sources: Electric Utility Generating Units
In this action, the Environmental Protection Agency (EPA) is establishing final emission guidelines for states to follow in developing plans to reduce greenhouse gas (GHG) emiss...
In this action, the Environmental Protection Agency (EPA) is establishing final emission guidelines for states to follow in developing plans to reduce greenhouse gas (GHG) emissions from existing fossil fuel-fired electric generating units (EGUs). Specifically, the EPA is establishing: Carbon dioxide (CO2) emission performance rates representing the best system of emission reduction (BSER) for two subcategories of existing fossil fuel-fired EGUs—fossil fuel-fired electric utility steam generating units and stationary combustion turbines; state-specific CO2
goals reflecting the CO2
emission performance rates; and guidelines for the development, submittal and implementation of state plans that establish emission standards or other measures to implement the CO2
emission performance rates, which may be accomplished by meeting the state goals. This final rule will continue progress already underway in the U.S. to reduce CO2
emissions from the utility power sector.
DATES:
This final rule is effective on December 22, 2015.
ADDRESSES:
Docket.
The EPA has established a docket for this action under Docket No. EPA-HQ-OAR-2013-0602. All documents in the docket are listed in the
https://www.regulations.gov
index. Although listed in the index, some information is not publicly available (
e.g.,
confidential business information (CBI) or other information for which disclosure is restricted by statute). Certain other material, such as copyrighted material, will be publicly available only in hard copy. Publicly available docket materials are available either electronically in
https://www.regulations.gov
or in hard copy at the EPA Docket Center, EPA WJC West Building, Room 3334, 1301 Constitution Ave. NW., Washington, DC. The Public Reading Room is open from 8:30 a.m. to 4:30 p.m., Monday through Friday, excluding federal holidays. The telephone number for the Public Reading Room is (202) 566-1744, and the telephone number for the Air Docket is (202) 566-1742. For additional information about the EPA's public docket, visit the EPA Docket Center homepage at
https://www2.epa.gov/dockets.
World Wide Web.
In addition to being available in the docket, an electronic copy of this final rule will be available on the World Wide Web (WWW). Following signature, a copy of this final rule will be posted at the following address:
https://www.epa.gov/cleanpowerplan/.
A number of documents relevant to this rulemaking, including technical support documents (TSDs), a legal memorandum, and the regulatory impact analysis (RIA), are also available at
https://www.epa.gov/cleanpowerplan/.
These and other related documents are also available for inspection and copying in the EPA docket for this rulemaking.
FOR FURTHER INFORMATION CONTACT:
Ms. Amy Vasu, Sector Policies and Programs Division (D205-01), U.S. EPA, Research Triangle Park, NC 27711; telephone number (919) 541-0107, facsimile number (919) 541-4991; email address:
vasu.amy@epa.gov
or Mr. Colin Boswell, Measurements Policy Group (D243-05), Sector Policies and Programs Division, U.S. EPA, Research Triangle Park, NC 27711; telephone number (919) 541-2034, facsimile number (919) 541-4991; email address:
boswell.colin@epa.gov.
SUPPLEMENTARY INFORMATION:
Acronyms.
A number of acronyms and chemical symbols are used in this preamble. While this may not be an exhaustive list, to ease the reading of this preamble and for reference purposes, the following terms and acronyms are defined as follows:
ACEEE American Council for an Energy-Efficient Economy
AEO Annual Energy Outlook
AFL-CIO American Federation of Labor and Congress of Industrial Organizations
ASTM American Society for Testing and Materials
BSER Best System of Emission Reduction
Btu/kWh British Thermal Units per Kilowatt-hour
CAA Clean Air Act
CBI Confidential Business Information
CCS Carbon Capture and Storage (or Sequestration)
CEIP Clean Energy Incentive Program
CEMS Continuous Emissions Monitoring System
CHP Combined Heat and Power
CO2
Carbon Dioxide
DOE U.S. Department of Energy
ECMPS Emission Collection and Monitoring Plan System
EE Energy Efficiency
EERS Energy Efficiency Resource Standard
EGU Electric Generating Unit
EIA Energy Information Administration
EM&V Evaluation, Measurement and Verification
EO Executive Order
EPA Environmental Protection Agency
FERC Federal Energy Regulatory Commission
ERC Emission Rate Credit
FR Federal Register
GHG Greenhouse Gas
GW Gigawatt
HAP Hazardous Air Pollutant
HRSG Heat Recovery Steam Generator
IGCC Integrated Gasification Combined Cycle
IPCC Intergovernmental Panel on Climate Change
IPM Integrated Planning Model
IRP Integrated Resource Plan
ISO Independent System Operator
kW Kilowatt
kWh Kilowatt-hour
lb CO2
/MWh Pounds of CO2
per Megawatt-hour
LBNL Lawrence Berkeley National Laboratory
MMBtu Million British Thermal Units
MW Megawatt
MWh Megawatt-hour
NAAQS National Ambient Air Quality Standards
NAICS North American Industry Classification System
NAS National Academy of Sciences
NGCC Natural Gas Combined Cycle
NOX
Nitrogen Oxides
NRC National Research Council
NSPS New Source Performance Standard
NSR New Source Review
NTTAA National Technology Transfer and Advancement Act
OMB Office of Management and Budget
PM Particulate Matter
PM2.5
Fine Particulate Matter
PRA Paperwork Reduction Act
PUC Public Utilities Commission
RE Renewable Energy
REC Renewable Energy Credit
RES Renewable Energy Standard
RFA Regulatory Flexibility Act
RGGI Regional Greenhouse Gas Initiative
RIA Regulatory Impact Analysis
RPS Renewable Portfolio Standard
RTO Regional Transmission Organization
SBA Small Business Administration
SCC Social Cost of Carbon
SIP State Implementation Plan
SO2
Sulfur Dioxide
Tg Teragram (one trillion (1012
) grams)
TSD Technical Support Document
TTN Technology Transfer Network
UMRA Unfunded Mandates Reform Act of 1995
UNFCCC United Nations Framework Convention on Climate Change
USGCRP U.S. Global Change Research Program
VCS Voluntary Consensus Standard
Organization of This Document.
The information presented in this preamble is organized as follows:
I. General Information
A. Executive Summary
B. Organization and Approach for This Final Rule
( printed page 64663)
II. Background
A. Climate Change Impacts From GHG Emissions
B. GHG Emissions From Fossil Fuel-Fired EGUs
C. The Utility Power Sector
D. Challenges in Controlling Carbon Dioxide Emissions
E. Clean Air Act Regulations for Power Plants
F. Congressional Awareness of Climate Change
G. International Agreements and Actions
H. Legislative and Regulatory Background for CAA Section 111
I. Statutory and Regulatory Requirements
J. Clean Power Plan Proposal and Supplemental Proposal
K. Stakeholder Outreach and Consultations
L. Comments on the Proposal
III. Rule Requirements and Legal Basis
A. Summary of Rule Requirements
B. Summary of Legal Basis
IV. Authority for This Rulemaking, Definition of Affected Sources, and Treatment of Categories
A. EPA's Authority Under CAA Section 111(d)
B. CAA Section 112 Exclusion to CAA Section 111(d) Authority
C. Authority To Regulate EGUs
D. Definition of Affected Sources
E. Combined Categories and Codification in the Code of Federal Regulations
V. The Best System of Emission Reduction and Associated Building Blocks
A. The Best System of Emission Reduction (BSER)
B. Legal Discussion of Certain Aspects of the BSER
C. Building Block 1—Efficiency Improvements at Affected Coal-Fired Steam EGUs
D. Building Block 2—Generation Shifts Among Affected EGUs
E. Building Block 3—Renewable Generating Capacity
VI. Subcategory-Specific CO2
Emission Performance Rates
A. Overview
B. Emission Performance Rate Requirements
C. Form of the Emission Performance Rates
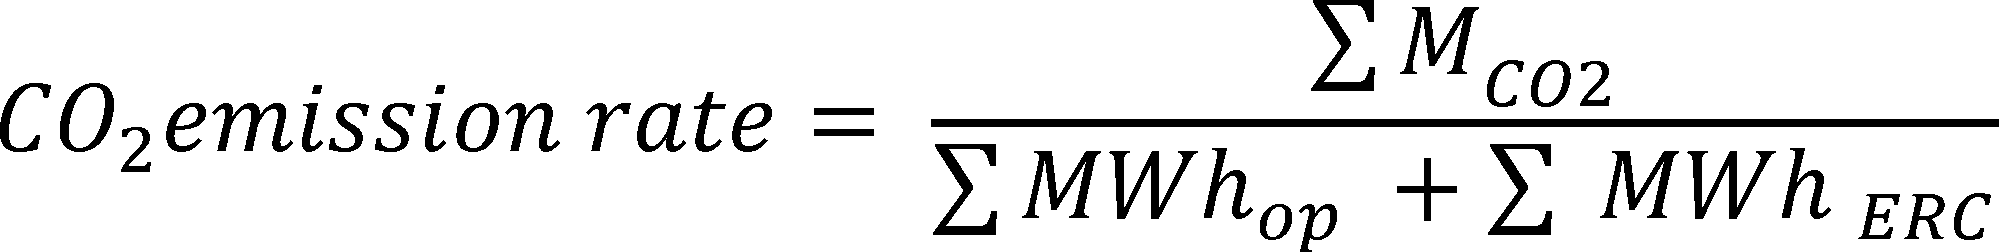
D. Emission Performance Rate-Setting Equation and Computation Procedure
VII. Statewide CO2
Goals
A. Overview
B. Reconstituting Statewide Rate-Based CO2
Emission Performance Goals From the Subcategory-Specific Emission Performance Rates
C. Quantifying Mass-Based CO2
Emission Performance Goals From the Statewide Rate-Based CO2
Emission Performance Goals
D. Addressing Potential Leakage in Determining the Equivalence of Statewide CO2
Emission Performance Goals
E. State Plan Adjustments of State Goals
F. Geographically Isolated States and Territories With Affected EGUs
VIII. State Plans
A. Overview
B. Timeline for State Plan Performance and Provisions To Encourage Early Action
C. State Plan Approaches
D. State Plan Components and Approvability Criteria
E. State Plan Submittal and Approval Process and Timing
F. State Plan Performance Demonstrations
G. Additional Considerations for State Plans
H. Resources for States to Consider in Developing Plans
I. Considerations for CO2
Emission Reduction Measures That Occur at Affected EGUs
J. Additional Considerations and Requirements for Mass-Based State Plans
K. Additional Considerations and Requirements for Rate-Based State Plans
L. Treatment of Interstate Effects
IX. Community and Environmental Justice Considerations
A. Proximity Analysis
B. Community Engagement in State Plan Development
C. Providing Communities With Access to Additional Resources
D. Federal Programs and Resources Available to Communities
F. Executive Order 13175, Consultation and Coordination With Indian Tribal Governments
G. Executive Order 13045, Protection of Children From Environmental Health Risks and Safety Risks
H. Executive Order 13211, Actions Concerning Regulations That Significantly Affect Energy Supply, Distribution, or Use
I. National Technology Transfer and Advancement Act (NTTAA)
J. Executive Order 12898, Federal Actions To Address Environmental Justice in Minority Populations and Low-Income Populations
K. Congressional Review Act (CRA)
XIII. Statutory Authority
I. General Information
A. Executive Summary
1. Introduction
This final rule is a significant step forward in reducing greenhouse gas (GHG) emissions in the U.S. In this action, the EPA is establishing for the first time GHG emission guidelines for existing power plants. These final emission guidelines, which rely in large part on already clearly emerging growth in clean energy innovation, development and deployment, will lead to significant carbon dioxide (CO2) emission reductions from the utility power sector that will help protect human health and the environment from the impacts of climate change. This rule establishes, at the same time, the foundation for longer term GHG emission reduction strategies necessary to address climate change and, in so doing, confirms the international leadership of the U.S. in the global effort to address climate change. In this final rule, we have taken care to ensure that achievement of the required emission reductions will not compromise the reliability of our electric system, or the affordability of electricity for consumers. This final rule is the result of unprecedented outreach and engagement with states, tribes, utilities, and other stakeholders, with stakeholders providing more than 4.3 million comments on the proposed rule. In this final rule, we have addressed the comments and concerns of states and other stakeholders while staying consistent with the law. As a result, we have followed through on our commitment to issue a plan that is fair, flexible and relies on the accelerating transition to cleaner power generation that is already well underway in the utility power sector.
Under the authority of Clean Air Act (CAA) section 111(d), the EPA is establishing CO2
emission guidelines for existing fossil fuel-fired electric generating units (EGUs)—the Clean Power Plan. These final guidelines, when fully implemented, will achieve significant reductions in CO2
emissions by 2030, while offering states and utilities substantial flexibility and latitude in achieving these reductions. In this final rule, the EPA is establishing a CO2
emission performance rate for each of two subcategories of fossil fuel-fired EGUs—fossil fuel-fired electric steam generating units and stationary combustion turbines—that expresses the “best system of emissions reduction . . . adequately demonstrated” (BSER)
( printed page 64664)
for CO2
from the power sector.[1]
The EPA is also establishing state-specific rate-based and mass-based goals that reflect the subcategory-specific CO2
emission performance rates and each state's mix of affected EGUs. The guidelines also provide for the development, submittal and implementation of state plans that implement the BSER—again, expressed as CO2
emission performance rates—either directly by means of source-specific emission standards or other requirements, or through measures that achieve equivalent CO2
reductions from the same group of EGUs.
States with one or more affected EGUs will be required to develop and implement plans that set emission standards for affected EGUs. The CAA section 111(d) emission guidelines that the EPA is promulgating in this action apply to only the 48 contiguous states and any Indian tribe that has been approved by the EPA pursuant to 40 CFR 49.9 as eligible to develop and implement a CAA section 111(d) plan.[2]
Because Vermont and the District of Columbia do not have affected EGUs, they will not be required to submit a state plan. Because the EPA does not possess all of the information or analytical tools needed to quantify the BSER for the two non-contiguous states with otherwise affected EGUs (Alaska and Hawaii) and the two U.S. territories with otherwise affected EGUs (Guam and Puerto Rico), these emission guidelines do not apply to those areas, and those areas will not be required to submit state plans on the schedule required by this final action.
The emission standards in a state's plan may incorporate the subcategory-specific CO2
emission performance rates set by the EPA or, in the alternative, may be set at levels that ensure that the state's affected EGUs, individually, in aggregate, or in combination with other measures undertaken by the state achieve the equivalent of the interim and final CO2
emission performance rates between 2022 and 2029 and by 2030, respectively. State plans must also: (1) Ensure that the period for emission reductions from the affected EGUs begin no later than 2022, (2) show how goals for the interim and final periods will be met, (3) ensure that, during the period from 2022 to 2029, affected EGUs in the state collectively meet the equivalent of the interim subcategory-specific CO2
emission performance rates, and (4) provide for periodic state-level demonstrations prior to and during the 2022-2029 period that will ensure required CO2
emission reductions are being accomplished and no increases in emissions relative to each state's planned emission reduction trajectory are occurring. A Clean Energy Incentive Program (CEIP) will provide opportunities for investments in renewable energy (RE) and demand-side energy efficiency (EE) that deliver results in 2020 and/or 2021. The plans must be submitted to the EPA in 2016, though an extension to 2018 is available to allow for the completion of stakeholder and administrative processes.
The EPA is promulgating: (1) Subcategory-specific CO2
emission performance rates, (2) state rate-based goals, and (3) state mass-based CO2
goals that represent the equivalent of each state's rate-based goal. This will facilitate states' choices in developing their plans, particularly for those seeking to adopt mass-based allowance trading programs or other statewide policy measures as well as, or instead of, source-specific requirements. The EPA received significant comment to the effect that mass-based allowance trading was not only highly familiar to states and EGUs, but that it could be more readily applied than rate-based trading for achieving emission reductions in ways that optimize affordability and electric system reliability.
In this summary, we discuss the purpose of this rule, the major provisions of the final rule, the context for the rulemaking, key changes from the proposal, the estimated CO2
emission reductions, and the costs and benefits expected to result from full implementation of this final action. Greater detail is provided in the body of this preamble, the RIA, the response to comments (RTC) documents, and various TSDs and memoranda addressing specific topics.
2. Purpose of This Rule
The purpose of this rule is to protect human health and the environment by reducing CO2
emissions from fossil fuel-fired power plants in the U.S. These plants are by far the largest domestic stationary source of emissions of CO2, the most prevalent of the group of air pollutant GHGs that the EPA has determined endangers public health and welfare through its contribution to climate change. This rule establishes for the first time emission guidelines for existing power plants. These guidelines will lead to significant reductions in CO2
emissions, result in cleaner generation from the existing power plant fleet, and support continued investments by the industry in cleaner power generation to ensure reliable, affordable electricity now and into the future.
Concurrent with this action, the EPA is also issuing a final rule that establishes CO2
emission standards of performance for new, modified, and reconstructed power plants. Together, these rules will reduce CO2
emissions by a substantial amount while ensuring that the utility power sector in the U.S. can continue to supply reliable and affordable electricity to all Americans using a diverse fuel supply. As with past EPA rules addressing air pollution from the utility power sector, these guidelines have been designed with a clear recognition of the unique features of this sector. Specifically, the agency recognizes that utilities provide an essential public service and are regulated and managed in ways unlike any other industrial activity. In providing assurances that the emission reductions required by this rule can be achieved without compromising continued reliable, affordable electricity, this final rule fully accounts for the critical service utilities provide.
As with past rules under CAA section 111, this rule relies on proven technologies and measures to set achievable emission performance rates that will lead to cost-effective pollutant emission reductions, in this case CO2
emission reductions at power plants, across the country. In fact, the emission guidelines reflect strategies, technologies and approaches already in widespread use by power companies and states. The vast preponderance of the input we received from stakeholders is supportive of this conclusion.
States will play a key role in ensuring that emission reductions are achieved at a reasonable cost. The experience of
( printed page 64665)
states in this regard is especially important because CAA section 111(d) relies on the well-established state-EPA partnership to accomplish the required CO2
emission reductions. States will have the flexibility to choose from a range of plan approaches and measures, including numerous measures beyond those considered in setting the CO2
emission performance rates, and this final rule allows and encourages states to adopt the most effective set of solutions for their circumstances, taking account of cost and other considerations. This rulemaking, which will be implemented through the state-EPA partnership, is a significant step that will reduce air pollution, in this case GHG emissions, in the U.S. At the same time, the final rule greatly facilitates flexibility for EGUs by establishing a basis for states to set trading-based emission standards and compliance strategies. The rule establishes this basis by including both uniform emission performance rates for the two subcategories of sources and also state-specific rate- and mass-based goals.
This final rule is a significant step forward in implementing the President's Climate Action Plan.[3]
To address the far-reaching harmful consequences and real economic costs of climate change, the President's Climate Action Plan details a broad array of actions to reduce GHG emissions that contribute to climate change and its harmful impacts on public health and the environment. Climate change is already occurring in this country, affecting the health, economic well-being and quality of life of Americans across the country, and especially those in the most vulnerable communities. This CAA section 111(d) rulemaking to reduce GHG emissions from existing power plants, and the concurrent CAA section 111(b) rulemaking to reduce GHG emissions from new, modified, and reconstructed power plants, implement one of the strategies of the Climate Action Plan.
Nationwide, by 2030, this final CAA section 111(d) existing source rule will achieve CO2
emission reductions from the utility power sector of approximately 32 percent from CO2
emission levels in 2005.
The EPA projects that these reductions, along with reductions in other air pollutants resulting directly from this rule, will result in net climate and health benefits of $25 billion to $45 billion in 2030. At the same time, coal and natural gas will remain the two leading sources of electricity generation in the U.S., with coal providing about 27 percent of the projected generation and natural gas providing about 33 percent of the projected generation.
3. Summary of Major Provisions
a.
Overview.
The fundamental goal of this rule is to reduce harmful emissions of CO2
from fossil fuel-fired EGUs in accordance with the requirements of the CAA. The June 2014 proposal for this rule was designed to meet this overarching goal while accommodating two important objectives. The first was to establish guidelines that reflect both the unique interconnected and interdependent manner in which the power system operates and the actions, strategies, and policies states and utilities have already been undertaking that are resulting in CO2
emission reductions. The second objective was to provide states and utilities with broad flexibility and choice in meeting those requirements in order to minimize costs to ratepayers and to ensure the reliability of electricity supply. In this final rule, the EPA has focused on changes that, in addition to being responsive to the critical concerns and priorities of stakeholders, more fully accomplish these objectives.
While our consideration of public input and additional information has led to notable revisions from the emission guidelines we proposed in June 2014, the proposed guidelines remain the foundation of this final rule. These final guidelines build on the progress already underway to reduce the carbon intensity of power generation in the U.S., especially through the lowest carbon-intensive technologies, while reflecting the unique interconnected and interdependent system within which EGUs operate. Thus, the BSER, as determined in these guidelines, incorporates a range of CO2
-reducing actions, while at the same time adhering to the fundamental approach the EPA has relied on for decades in implementing section 111 of the CAA. Specifically, in making its BSER determination, the EPA examined not only actions, technologies and measures already in use by EGUs and states, but also deliberately incorporated in its identification of the BSER the unique way in which affected EGUs actually operate in providing electricity services. This latter feature of the BSER mirrors Congress' approach to regulating air pollution in this sector, as exemplified by Title IV of the CAA. There, Congress established a pollution reduction program specifically for fossil fuel-fired EGUs and designed the sulfur dioxide (SO2) portion of that program with express recognition of the utility power sector's ability to shift generation among various EGUs, which enabled pollution reduction by increasing reliance on RE and even on demand-side EE. The result of our following Congress' recognition of the interdependent operation of EGUs within an interconnected grid is the incorporation in the BSER of measures, such as shifting generation to lower-emitting NGCC units and increased use of RE, that rely on the current interdependent operation of EGUs. As we noted in the proposal and note here as well, the EPA undertook an unprecedented and sustained process of engagement with the public and stakeholders. It is, in many ways, as a direct result of public discussion and input that the EPA came to recognize the substantial extent to which the BSER needed to account for the unique interconnected and interdependent operations of EGUs if it was to meet the criteria on which the EPA has long relied in making BSER determinations.
Equally important, these guidelines offer states and owners and operators of EGUs broad flexibility and latitude in complying with their obligations. Because affordability and electricity system reliability are of paramount importance, the rule provides states and utilities with time for planning and investment, which is instrumental to ensuring both manageable costs and system reliability, as well as to facilitating clean energy innovation. The final rule continues to express the CO2
emission reduction requirements in terms of state goals, as well as in terms of emission performance rates for the two subcategories of affected EGUs, reflecting the particular mix of power generation in each state, and it continues to provide until 2030, fifteen years from the date of this final rule, for states and sources to achieve the CO2
reductions. Numerous commenters, including most sources, states and energy agencies, indicated that this was a reasonable timeframe. The final guidelines also continue to provide an option where programs beyond those directly limiting power plant emission rates can be used for compliance (
i.e.,
policies, programs and other measures). The final rule also continues to allow, but not require, multi-state approaches. Finally, EPA took care to ensure that states could craft their own emissions reduction trajectories in meeting the interim goals included in this final rule.
b.
Opportunities for states.
As stated above, the final guidelines are designed to build on and reinforce progress by states, cities and towns, and companies on a growing variety of sustainable strategies to reduce power sector CO2
( printed page 64666)
emissions. States, in their CAA section 111(d) plans, will be able to rely on, and extend, programs they may already have created to address emissions of air pollutants, and in particular CO2, from the utility power sector or to address the sector from an overall perspective. Those states committed to Integrated Resource Planning (IRP) will be able to establish their CO2
reduction plans within that framework, while states with a more deregulated power sector system will be able to develop CO2
reduction plans within that specific framework. Each state will have the opportunity to take advantage of a wide variety of strategies for reducing CO2
emissions from affected EGUs, including demand-side EE programs and mass-based trading, which some suggested in their comments. The EPA and other federal entities, including the U.S. Department of Energy (DOE), the Federal Energy Regulatory Commission (FERC) and the U.S. Department of Agriculture (USDA), among others, are committed to sharing expertise with interested states as they develop and implement their plans.
States will be able to address the economic interests of their utilities and ratepayers by using the flexibilities in this final action to reduce costs to consumers, minimize stranded assets, and spur private investments in RE and EE technologies and businesses. They may also, if they choose, work with other states on multi-state approaches that reflect the regional structure of electricity operating systems that exists in most parts of the country and is critical to ensuring a reliable supply of affordable energy. The final rule gives states the flexibility to implement a broad range of approaches that recognize that the utility power sector is made up of a diverse range of companies of various sizes that own and operate fossil fuel-fired EGUs, including vertically integrated companies in regulated markets, independent power producers, rural cooperatives and municipally-owned utilities, some of which are likely to have more direct access than others to certain types of GHG emission reduction opportunities, but all of which have a wide range of opportunities to achieve reductions or acquire clean generation.
Again, with features that facilitate mass-based and/or interstate trading, the final guidelines also empower affected EGUs to pursue a broad range of choices for compliance and for integrating compliance action with the full range of their investments and operations.
c.
Main elements.
This final rule comprises three main elements: (1) Two subcategory-specific CO2
emission performance rates resulting from application of the BSER to the two subcategories of affected EGUs; (2) state-specific CO2
goals, expressed as both emission rates and as mass, that reflect the subcategory-specific CO2
emission performance rates and each state's mix of affected EGUs the two performance rates; and (3) guidelines for the development, submittal and implementation of state plans that implement those BSER emission performance rates either through emission standards for affected EGUs, or through measures that achieve the equivalent, in aggregate, of those rates as defined and expressed in the form of the state goals.
In this final action, the EPA is setting emission performance rates, phased in over the period from 2022 through 2030, for two subcategories of affected fossil fuel-fired EGUs—fossil fuel-fired electric utility steam-generating units and stationary combustion turbines. These rates, applied to each state's particular mix of fossil fuel-fired EGUs, generate the state's carbon intensity goal for 2030 (and interim rates for the period 2022-2029). Each state will determine whether to apply these to each affected EGU or to take an alternative approach and meet either an equivalent statewide rate-based goal or statewide mass-based goal. The EPA does not prescribe how a state must meet the emission guidelines, but, if a state chooses to take the path of meeting a state goal, these final guidelines identify the methods that a state can or, in some cases, must use to demonstrate that the combination of measures and standards that the state adopts meets its state-level CO2
goals. While the EPA accomplishes the phase-in of the interim goal by way of annual emission performance rates, states and EGUs may meet their respective emission reduction obligations “on average” over that period following whatever emission reduction trajectory they determine to pursue over that period.
CAA section 111(d) creates a partnership between the EPA and the states under which the EPA establishes emission guidelines and the states take the lead on implementing them by establishing emission standards or creating plans that are consistent with the EPA emission guidelines. The EPA recognizes that each state has differing policy considerations—including varying regional emission reduction opportunities and existing state programs and measures—and that the characteristics of the electricity system in each state (
e.g.,
utility regulatory structure and generation mix) also differ. Therefore, as in the proposal, each state will have the latitude to design a program to meet source-category specific emission performance rates or the equivalent statewide rate- or mass-based goal in a manner that reflects its particular circumstances and energy and environmental policy objectives. Each state can do so on its own, or a state can collaborate with other states and/or tribal governments on multi-state plans, or states can include in their plans the trading tools that EGUs can use to realize additional opportunities for cost savings while continuing to operate across the interstate system through which electricity is produced. A state would also have the option of adopting the model rules for either a rate- or a mass-based program that the EPA is proposing concurrently with this action.[4]
To facilitate the state planning process, this final rule establishes guidelines for the development, submittal, and implementation of state plans. The final rule describes the components of a state plan, the additional latitude states have in developing strategies to meet the emission guidelines, and the options they have in the timing of submittal of their plans. This final rule also gives states considerable flexibility with respect to the timeframes for plan development and implementation, as well as the choice of emission reduction measures. The final rule provides up to fifteen years for full implementation of all emission reduction measures, with incremental steps for planning and then for demonstration of CO2
reductions that will ensure that progress is being made in achieving CO2
emission reductions. States will be able to choose from a wide range of emission reduction measures, including measures that are not part of the BSER, as discussed in detail in section VIII.G of this preamble.
d.
Determining the BSER.
In issuing this final rulemaking, the EPA is implementing statutory provisions that have been in place since Congress first enacted the CAA in 1970 and that have been implemented pursuant to regulations promulgated in 1975 and followed in numerous subsequent CAA section 111 rulemakings. These requirements call on the EPA to develop emission guidelines that reflect the EPA's determination of the “best system of emission reduction . . . adequately demonstrated” for states to follow in
( printed page 64667)
formulating plans to establish emission standards to implement the BSER.
As the EPA has done in making BSER determinations in previous CAA section 111 rulemakings, for this final BSER determination, the agency considered the types of strategies that states and owners and operators of EGUs are already employing to reduce the covered pollutant (in this case, CO2
) from affected sources (in this case, fossil fuel-fired EGUs).[5]
In so doing, as has always been the case, our considerations were not limited solely to specific technologies or equipment in hypothetical operation; rather, our analysis encompassed the full range of operational practices, limitations, constraints and opportunities that bear upon EGUs' emission performance, and which reflect the unique interconnected and interdependent operations of EGUs and the overall electricity grid.
In this final action, the agency has determined that the BSER comprises the first three of the four proposed “building blocks,” with certain refinements to the three building blocks.
The three building blocks are:
1. Improving heat rate at affected coal-fired steam EGUs.
2. Substituting increased generation from lower-emitting existing natural gas combined cycle units for generation from higher-emitting affected steam generating units.
3. Substituting increased generation from new zero-emitting renewable energy generating capacity for generation from affected fossil fuel-fired generating units.
These three building blocks are approaches that are available to all affected EGUs, either through direct investment or operational shifts or through emissions trading where states, which must establish emission standards for affected EGUs, do so by incorporating emissions trading.[6]
At the same time, and as we noted in the proposal, there are numerous other measures available to reduce CO2
emissions from affected EGUs, and our determination of the BSER does not necessitate the use of the three building blocks to their maximum extent, or even at all. The building blocks and the BSER determination are described in detail in section V of this preamble.
e.
CO2state-level goals and subcategory-specific emission performance rates.
(1)
Final CO2goals and emission performance rates.
In this action, the EPA is establishing CO2
emission performance rates for two subcategories of affected EGUs—fossil fuel-fired electric utility steam generating units and stationary combustion turbines. For fossil fuel-fired steam generating units, we are finalizing an emission performance rate of 1,305 lb CO2
/MWh. For stationary combustion turbines, we are finalizing an emission performance rate of 771 lb CO2
/MWh. As we did at proposal, for each state, we are also promulgating rate-based CO2
goals that are the weighted aggregate of the emission performance rates for the state's EGUs. To ensure that states and sources can choose additional alternatives in meeting their obligations, the EPA is also promulgating each state's goal expressed as a CO2
mass goal. The inclusion of mass-based goals, along with information provided in the proposed federal plan and model rules that are being issued concurrently with this rule, paves the way for states to implement mass-based trading, as some states have requested, reflecting their view that mass-based trading provides significant advantages over rate-based trading.
Affected EGUs, individually, in aggregate, or in combination with other measures undertaken by the state, must achieve the equivalent of the CO2
emission performance rates, expressed via the state-specific rate- and mass-based goals, by 2030.
(2)
Interim CO2emission performance rates and state-specific goals.
The best system of emission reduction includes both the measures for reducing CO2
emissions and the timeframe over which they can be implemented. In this final action, the EPA is establishing an 8-year interim period, beginning in 2022 instead of 2020, over which to achieve the full required reductions to meet the CO2
performance rates, a commencement date more than six years from October 23, 2015, the date of this rulemaking. This 8-year interim period from 2022 through 2029 is separated into three steps, 2022-2024, 2025-2027, and 2028-2029, each associated with its own interim CO2
emission performance rates. The interim steps are presented both in terms of emission performance rates for the two subcategories of affected EGUs and in terms of state goals, expressed both as a rate and as a mass. A state may adopt emission standards for its sources that are identical to these interim emission performance rates or, alternatively, adapt these steps to accommodate the timing of expected reductions, as long as the state's interim goal is met over the 8-year period.
In this action, the EPA is establishing final guidelines for states to follow in developing, submitting and implementing their plans. In developing plans, states will need to choose the type of plan they will develop. They will also need to include required plan components in their plan submittals, meet plan submittal deadlines, achieve the required CO2
emission reductions over time, and provide for monitoring and periodic reporting of progress. As with the BSER determination, stakeholder comments have provided both data and recommendations to which these final guidelines are responsive.
(1)
Plan approaches.
To comply with these emission guidelines, a state will have to ensure, through its plan, that the emission standards it establishes for its sources individually, in aggregate, or in combination with other measures undertaken by the state, represent the equivalent of the subcategory-specific CO2
emission performance rates. This final rule includes several options for state plans, as discussed in the proposal and in many of the comments we received.
First, in the final rule, states may establish emission standards for their affected EGUs that mirror the uniform emission performance rates for the two subcategories of sources included in this final rule. They may also pursue alternative approaches that adopt emission standards that meet the
( printed page 64668)
uniform emission performance rates, or emission standards that meet either the rate-based goal promulgated for the state or the alternative mass-based goal promulgated for the state. It is for the purpose of providing states with these choices that the EPA is providing state-specific rate-based and mass-based goals equivalent to the emission performance rates that the EPA is establishing for the two subcategories of fossil fuel-fired EGUs. A detailed explanation of rate- and mass-based goals is provided in section VII of this preamble and in a TSD.[8]
In developing its plan, each state and eligible tribe electing to submit a plan will need to choose whether its plan will result in the achievement of the CO2
emission performance rates, statewide rate-based goals, or statewide mass-based goals by the affected EGUs.
The second major set of options provided in the final rule includes the types of measures states may rely on through the state plans. A state will be able to choose to establish emission standards for its affected EGUs sufficient to meet the requisite performance rates or state goal, thus placing all of the requirements directly on its affected EGUs, which we refer to as the “emission standards approach.” Alternatively, a state can adopt a “state measures approach,” which would result in the affected EGUs meeting the statewide mass-based goal by allowing a state to rely upon state-enforceable measures on entities other than affected EGUs, in conjunction with any federally enforceable emission standards the state chooses to impose on affected EGUs. With a state measures approach, the plan must also include a contingent backstop of federally enforceable emission standards for affected EGUs that fully meet the emission guidelines and that would be triggered if the plan failed to achieve the required emission reductions on schedule. A state would have the option of basing its backstop emission standards on the model rule, which focuses on the use of emissions trading as the core mechanism and which the EPA is proposing today. A state that adopts a state measures approach must use its mass CO2
emission goal as the metric for demonstrating plan performance.
The final rule requires that the state plan submittal include a timeline with all of the programmatic plan milestone steps the state will take between the time of the state plan submittal and the year 2022 to ensure that the plan is effective as of 2022. States must submit a report to the EPA in 2021 that demonstrates that the state has met the programmatic plan milestone steps that the state indicated it would take during the period from the submittal of the final plan through the end of 2020, and that the state is on track to implement the approved state plan as of January 1, 2022.
The plan must also include a process for reporting on plan implementation, progress toward achieving CO2
emission reductions, and implementation of corrective actions, in the event that the state fails to achieve required emission levels in a timely fashion. Beginning January 1, 2025, and then January 1, 2028, January 1, 2030, and then every two calendar years thereafter, the state will be required to compare emission levels achieved by affected EGUs in the state with the emission levels projected in the state plan and report the results of that comparison to the EPA by July 1 of those calendar years.
Existing state programs can be aligned with the various state plan options further described in Section VIII. A state plan that uses one of the finalized model rules, which the EPA is proposing concurrently with this action, could be presumptively approvable if the state plan meets all applicable requirements.[9]
The plan guidelines provide the states with the ability to achieve the full reductions over a multi-year period, through a variety of reduction strategies, using state-specific or multi-state approaches that can be achieved on either a rate or mass basis. They also address several key policy considerations that states can be expected to contemplate in developing their plans.
State plan approaches and plan guidelines are explained further in section VIII of this preamble.
(2)
State plan components and approvability criteria.
The EPA's implementing regulations provide certain basic elements required for state plans submitted pursuant to CAA section 111(d).[10]
In the proposal, the EPA identified certain additional elements that should be contained in state plans. In this final action, in response to comments, the EPA is making several revisions to the components required in a state plan submittal and is also incorporating the approvability criteria into the final list of components required in a state plan submittal. In addition, we have organized the state plan components to reflect: (1) Components required for all state plan submittals; (2) additional components required for the emission standards approach; and (3) additional components required for the state measures approach.
All state plans must include the following components:
Description of the plan
Applicability of state plans to affected EGUs
Demonstration that the plan submittal is projected to achieve the state's CO2
emission performance rates or state CO2
goal [11]
Monitoring, reporting and recordkeeping requirements for affected EGUs
State recordkeeping and reporting requirements
Public participation and certification of hearing on state plan
Supporting documentation
Also, in submitting state plans, states must provide documentation demonstrating that they have considered electric system reliability in developing their plans.
Further, in this final rule, the EPA is requiring states to demonstrate how they are meaningfully engaging all stakeholders, including workers and low-income communities, communities of color, and indigenous populations living near power plants and otherwise potentially affected by the state's plan. In their plan submittals, states must describe their engagement with their stakeholders, including their most vulnerable communities. The participation of these communities, along with that of ratepayers and the public, can be expected to help states ensure that state plans maintain the affordability of electricity for all and preserve and expand jobs and job opportunities as they move forward to develop and implement their plans.
State plan submittals using the emission standards approach must also include:
Identification of each affected EGU; identification of federally enforceable emission standards for the affected EGUs; and monitoring, recordkeeping and reporting requirements.
Demonstrations that each emission standard will result in reductions that are quantifiable, non-duplicative, permanent, verifiable, and enforceable.
State plan submittals using the state measures approach must also include:
Identification of each affected EGU; identification of federally enforceable emission standards for affected EGUs (if applicable); identification of backstop of
( printed page 64669)
federally enforceable emission standards; and monitoring, recordkeeping and reporting requirements.
Identification of each state measure and demonstration that each state measure will result in reductions that are quantifiable, non-duplicative, permanent, verifiable, and enforceable.
In addition to these requirements, each state plan must follow the EPA implementing regulations at 40 CFR 60.23.
(3)
Timing and process for state plan submittal and review.
Because of the compelling need for actions to begin the steps necessary to reduce GHG emissions from EGUs, the EPA proposed that states submit their plans within 13 months of the date of this final rule and that reductions begin in 2020. In light of the comments received and in order to provide maximum flexibility to states while still taking timely action to reduce CO2
emissions, in this final rule the EPA is allowing for a 2-year extension until September 6, 2018, for both individual and multi-state plans, to provide a total of 3 years for states to submit a final plan if an extension is received. Specifically, the final rule requires each state to submit a final plan by September 6, 2016. Since some states may need more than one year to complete all of the actions needed for their final state plans, including technical work, state legislative and rulemaking activities, a robust public participation process, coordination with third parties, coordination among states involved in multi-state plans, and consultation with reliability entities, the EPA is allowing an optional two-phased submittal process for state plans. If a state needs additional time to submit a final plan, then the state may request an extension by submitting an initial submittal by September 6, 2016. For the extension to be granted, the initial submittal must address three required components sufficiently to demonstrate that a state is able to undertake steps and processes necessary to timely submit a final plan by the extended date of September 6, 2018. These components are: An identification of final plan approach or approaches under consideration, including a description of progress made to date; an appropriate explanation for why the state needs additional time to submit a final plan beyond September 6, 2016; and a demonstration of how they have been engaging with the public, including vulnerable communities, and a description of how they intend to meaningfully engage with community stakeholders during the additional time (if an extension is granted) for development of the final plan, as described in section VIII.E of this preamble. As further described in section VIII.B of this preamble, the EPA is establishing a CEIP in order to promote early action. States' participation in the CEIP is optional. In order for a state to participate in the program, it must include in its initial submittal, if applicable, a non-binding statement of intent to participate in the CEIP; if a state is submitting a final plan by September 6, 2016, it must include such a statement of intent as part of its supporting documentation for the plan.
If the initial submittal includes those components and if the EPA does not notify the state that the initial submittal does not contain the required components, then, within 90 days of the submittal, the extension of time to submit a final plan will be deemed granted. A state will then have until no later than September 6, 2018, to submit a final plan. The EPA will also be working with states during the period after they make their initial submittals and provide states with any necessary information and assistance during the 90-day period. Further, states participating in a multi-state plan may submit a single joint plan on behalf of all of the participating states.
States and tribes that do not have any affected EGUs in their jurisdictional boundaries may provide emission rate credits (ERCs) to adjust CO2
emissions, provided they are connected to the contiguous U.S. grid and meet other requirements for eligibility. There are certain limitations and restrictions for generating ERCs, and these, as well as associated requirements, are explained in section VIII of this preamble.
Following submission of final plans, the EPA will review plan submittals for approvability. Given a similar timeline accorded under section 110 of the CAA, and the diverse approaches states may take to meet the CO2
emission performance rates or equivalent statewide goals in the emission guidelines, the EPA is extending the period for EPA review and approval or disapproval of plans from the four-month period provided in the EPA implementing regulations to a twelve-month period. This timeline will provide adequate time for the EPA to review plans and follow notice-and-comment rulemaking procedures to ensure an opportunity for public comment. The EPA, especially through our regional offices, will be available to work with states as they develop their plans, in order to make review of submitted plans more straightforward and to minimize the chances of unexpected issues that could slow down approval of state plans.
(4)
Timing for implementing the CO2emission guidelines.
The EPA recognizes that the measures states and utilities have been and will be taking to reduce CO2
emissions from existing EGUs can take time to implement. We also recognize that investments in low-carbon intensity and RE and in EE strategies are currently underway and in various stages of planning and implementation widely across the country. We carefully reviewed information submitted to us regarding the feasible timing of various measures and identifying concerns that the required CO2
emission reductions could not be achieved as early as 2020 without compromising electric system reliability, imposing unnecessary costs on ratepayers, and requiring investments in more carbon-intensive generation, while diverting investment in cleaner technologies. The record is compelling. To respond to these concerns and to reflect the period of time required for state plan development and submittal by states, review and approval by the EPA, and implementation of approved plans by states and affected EGUs, the EPA is determining in this final rule that affected EGUs will be required to begin to make reductions by 2022, instead of 2020, as proposed, and meet the final CO2
emission performance rates or equivalent statewide goals by no later than 2030. The EPA is establishing an 8-year interim period that begins in 2022 and goes through 2029, and which is separated into three steps, 2022-2024, 2025-2027, and 2028-2029, each associated with its own interim goal. Affected EGUs must meet each of the interim period step 1, 2, and 3 CO2
emission performance rates, or, following the emissions reduction trajectory designed by the state itself, must meet the equivalent statewide interim period goals, on average, that a state may establish over the 8-year period from 2022-2029. The CAA section 111(d) plan must include those specific requirements. Affected EGUs must also achieve the final CO2
performance rates or the equivalent statewide goal by 2030 and maintain that level subsequently. This approach reflects adjustments to the timeframe over which reductions must be achieved that mirror the determination of the final BSER, which incorporates the phasing in of the BSER measures in keeping with the achievability of those measures. The agency believes that this approach to timing is reasonable and appropriate, is consistent with many of the comments we received, and will
( printed page 64670)
best support the optimization of overall CO2
reductions, ratepayer affordability and electricity system reliability.
The EPA recognizes that successfully achieving reductions by 2022 will be facilitated by actions and investments that yield CO2
emission reductions prior to 2022. The final guidelines include provisions to encourage early actions. States will be able to take advantage of the impacts of early investments that occur prior to the beginning of a plan performance period. Under a mass-based plan, those impacts will be reflected in reductions in the reported CO2
emissions of affected EGUs during the plan performance period. Under a rate-based plan, states may recognize early actions implemented after 2012 by crediting MWh of electricity generation and savings that are achieved by those measures during the interim and final plan performance periods. This provision is discussed in section VIII.K of the preamble.
In addition, to encourage early investments in RE and demand-side EE, the EPA is establishing the CEIP. Through this program, detailed in section VIII.B of this preamble, states will have the opportunity to award allowances and ERCs to qualified providers that make early investments in RE, as well as in demand-side EE programs implemented in low-income communities. Those states that take advantage of this option will be eligible to receive from the EPA matching allowances or ERCs, up to a total for all states that represents the equivalent of 300 million short tons of CO2
emissions.
The EPA will address design and implementation details of the CEIP in a subsequent action. Prior to doing so, the EPA will engage with states, utilities and other stakeholders to gather information regarding their interests and priorities with regard to implementation of the CEIP.
The CEIP can play an important role in supporting one of the critical policy benefits of this rule. The incentives and market signal generated by the CEIP can help sustain the momentum toward greater RE investment in the period between now and 2022 so as to offset any dampening effects that might be created by setting the period for mandatory reductions to begin in 2022, two years later than at proposal.
(5)
Community and environmental justice considerations.
Climate change is an environmental justice issue. Low-income communities and communities of color already overburdened by pollution are disproportionately affected by climate change and are less resilient than others to adapt to or recover from climate-change impacts. While this rule will provide broad benefits to communities across the nation by reducing GHG emissions, it will be particularly beneficial to populations that are disproportionately vulnerable to the impacts of climate change and air pollution.
Conventional pollutants emitted by power plants, such as particulate matter (PM), SO2, hazardous air pollutants (HAP), and nitrogen oxides (NOx), will also be reduced as the plants reduce their carbon emissions. These pollutants can have significant adverse local and regional health impacts. The EPA analyzed the communities in closest proximity to power plants and found that they include a higher percentage of communities of color and low-income communities than national averages. We thus expect an important co-benefit of this rule to be a reduction in the adverse health impacts of air pollution on these low-income communities and communities of color. We refer to these communities generally as “vulnerable” or “overburdened,” to denote those communities least resilient to the impacts of climate change and central to environmental justice considerations.
While pollution will be cut from power plants overall, there may be some relatively small number of coal-fired plants whose operation and corresponding emissions increase as energy providers balance energy production across their fleets to comply with state plans. In addition, a number of the highest-efficiency natural gas-fired units are also expected to increase operations, but they have correspondingly low carbon emissions and are also characterized by low emissions of the conventional pollutants that contribute to adverse health effects in nearby communities and regionally. The EPA strongly encourages states to evaluate the effects of their plans on vulnerable communities and to take the steps necessary to ensure that all communities benefit from the implementation of this rule. In order to identify whether state plans are causing any adverse impacts on overburdened communities, mindful that substantial overall reductions, nevertheless, may be accompanied by potential localized increases, the EPA intends to perform an assessment of the implementation of this rule to determine whether it and other air quality rules are leading to improved air quality in all areas or whether there are localized impacts that need to be addressed.
Effective engagement between states and affected communities is critical to the development of state plans. The EPA encourages states to identify communities that may be currently experiencing adverse, disproportionate impacts of climate change and air pollution, how state plan designs may affect them, and how to most effectively reach out to them. This final rule requires that states include in their initial submittals a description of how they engaged with vulnerable communities as they developed their initial submittals, as well as the means by which they intend to involve communities and other stakeholders as they develop their final plans. The EPA will provide training and other resources for states and communities to facilitate meaningful engagement.
In addition to the benefits for vulnerable communities from reducing climate change impacts and effects of conventional pollutant emissions, this rule will also help communities by moving the utility industry toward cleaner generation and greater EE. The federal government is committed to ensuring that all communities share in these benefits.
The EPA also encourages states to consider how they may incorporate approaches already used by other states to help low-income communities share in the investments in infrastructure, job creation, and other benefits that RE and demand-side EE programs provide, have access to financial assistance programs, and minimize any adverse impacts that their plans could have on communities. To help support states in taking concrete actions that provide economic development, job and electricity bill-cutting benefits to low-income communities directly, the EPA has designed the CEIP specifically to target the incentives it creates on investments that benefit low-income communities.
Community and environmental justice considerations are discussed further in section IX of this preamble.
(6)
Addressing employment concerns.
In addition, the EPA encourages states in designing their state plans to consider the effects of their plans on employment and overall economic development to assure that the opportunities for economic growth and jobs that the plans offer are realized. To the extent possible, states should try to assure that communities that can be expected to experience job losses can also take advantage of the opportunities for job growth or otherwise transition to healthy, sustainable economic growth. The President has proposed the POWER+ Plan to help communities impacted by power sector transition. The POWER+ plan invests in workers and jobs, addresses important legacy costs in coal country, and drives
( printed page 64671)
development of coal technology.[12]
Implementation of one key part of the POWER+ Plan, the Partnerships for Opportunity and Workforce and Economic Revitalization (POWER) initiative, has already begun. The POWER initiative specifically targets economic and workforce development assistance to communities affected by ongoing changes in the coal industry and the utility power sector.[13]
(7)
Electric system reliability.
In no small part thanks to the comments we received and our extensive consultation with key agencies responsible for reliability, including FERC and DOE, among others, along with EPA's longstanding principles in setting emission standards for the utility power sector, these guidelines reflect the paramount importance of ensuring electric system reliability. The input we received on this issue focused heavily on the extent of the reductions required at the beginning of the interim period, proposed as 2020. We are addressing these concerns in large part by moving the beginning of the period for mandatory reductions under the program from 2020 to 2022 and significantly adjusting the interim goals so that they provide a less abrupt initial reduction expectation. This, in turn, will provide states and utilities with a great deal more latitude in determining their emission reduction trajectories over the interim period. As a result, there will be more time for planning, consultation and decision making in the formulation of state plans and in EGUs' choice of compliance strategies, all within the existing extensive structure of energy planning at the state and regional levels. These adjustments in the interim goals are supported by the information in the record concerning the time needed to develop and implement reductions under the BSER. In addition, the various forms of flexibility retained and enhanced in this final rule, including opportunities for trading within and between states, and other multi-state compliance approaches, will further support electric system reliability.
The final guidelines address electric system reliability in several additional important ways. Numerous commenters urged us to include, as part of the plan development or approval process, input from review by energy regulatory agencies and reliability entities. In the final rule, we are requiring that each state demonstrate in its final state plan submittal that it has considered reliability issues in developing its plan. Second, we recognize that issues may arise during the implementation of the guidelines that may warrant adjustments to a state's plan in order to maintain electric system reliability. The final guidelines make clear that states have the ability to propose amendments to approved plans in the event that unanticipated and significant electric system reliability challenges arise and compel affected EGUs to generate at levels that conflict with their compliance obligations under those plans.
As a final element of reliability assurance, the rule also provides for a reliability safety valve for individual sources where there is a conflict between the requirements the state plan imposes on a specific affected EGU and the maintenance of electric system reliability in the face of an extraordinary and unanticipated event that presents substantial reliability concerns.
We anticipate that these situations will be extremely rare because the states have the flexibility to craft requirements for their EGUs that will provide long averaging periods and/or compliance mechanisms, such as trading, whose inherent flexibility will make it unlikely that an individual unit will find itself in this kind of situation. As one example, under compliance regimes that allow individual EGUs to establish compliance through the acquisition and holding of allowances or ERCs equal to their emissions, an EGU's need to continue to operate—and emit—for the purposes of ensuring system reliability will not put the EGU into non-compliance, provided, of course, it obtains the needed allowances or credits in a timely fashion. We, nevertheless, agree with many commenters that it is prudent to provide an electric system reliability safety valve as a precaution.
Finally, the EPA, DOE and FERC have agreed to coordinate their efforts, at the federal level, to help ensure continued reliable electricity generation and transmission during the implementation of the final rule. The three agencies have set out a memorandum that reflects their joint understanding of how they will work together to monitor implementation, share information, and to resolve any difficulties that may be encountered.
As a result of the many features of this final rule that provide states and affected EGUs with meaningful time and decision making latitude, we believe that the comprehensive safeguards already in place in the U.S. to ensure electric system reliability will continue to operate effectively as affected EGUs reduce their CO2
emissions under this program.
(8)
Outreach and resources for stakeholders.
To provide states, U.S. territories, tribes, utilities, communities, and other interested stakeholders with understanding about the rule requirements, and to provide efficiencies where possible and reduce the cost and administrative burden, the EPA will continue to work with states, tribes, territories, and stakeholders to provide information and address questions about the final rule. Outreach will include opportunities for states and tribes to participate in briefings, teleconferences, and meetings about the final rule. The EPA's ten regional offices will continue to be the entry point for states, tribes and territories to ask technical and policy questions. The agency will host (or partner with appropriate groups to co-host) a number of webinars about various components of the final rule; these webinars are planned for the first two months after the final rule is issued. The EPA will also offer consultations with tribal governments. The EPA will continue outreach throughout the plan development and submittal process. The EPA will use information from this outreach process to inform the training and other tools that will be of most use to the state, tribes, and territories that are implementing the final rule.
The EPA has worked with communities, states, tribes and relevant associations to develop an extensive training plan that will continue in the months after the Clean Power Plan is finalized. The EPA has assembled resources from a variety of sources to create a comprehensive training curriculum for those implementing this rule. Recorded presentations from the EPA, DOE and other federal entities will be available for communities, states, and others involved in composing and participating in the development of state plans. This curriculum is available online at EPA's Air Pollution Training Institute.
The EPA also expects to issue guidance on specific topics. As guidance documents, tools, templates and other resources become available, the EPA, in consultation with DOE and other federal agencies, will continue to make these resources available via a dedicated Web site.[14]
We intend to continue to work actively with states and tribes, as appropriate, to provide information and technical support that will be helpful to
( printed page 64672)
them in developing and implementing their plans. The EPA will engage in formal consultations with tribal governments and provide training tailored to the needs of tribes and tribal governments.
Additional detail on aspects of the final rule is included in several technical support documents (TSDs) and memoranda that are available in the rulemaking docket.
4. Key Changes From Proposal
a.
Overview and highlights.
As noted earlier in this overview, the June 2014 proposal for the rule was designed to meet the fundamental goal of reducing harmful emissions of CO2
from fossil fuel-fired EGUs in a manner consistent with the CAA requirements, while accommodating two important objectives. The first objective was to establish guidelines that reflect both the manner in which the power system operates and the actions and measures already underway across states and the utility power sector that are resulting in CO2
emission reductions. The second objective was to provide states and utilities maximum flexibility, control and choice in meeting their compliance obligations. In this final rule, the EPA has focused on changes that, in addition to being responsive to the critical concerns and priorities of stakeholders, more fully accomplish these two crucial objectives.
To achieve these objectives, the June 2014 proposal featured several important elements: The building block approach for the BSER; state-specific, rather than source-specific, goals; a 10-year interim goal that could be met “on average” over the 10-year period between 2020 and 2029; and a “portfolio” option for state plans. These features were intended either to capture, in the emission guidelines, emission reduction measures already in widespread use or to maximize the range of choices that states and utilities could select in order to achieve their emission limitations at low cost while ensuring electric system reliability. In this final rule, we are retaining the key design elements of the proposal and making certain adjustments to respond to a variety of very constructive comments on ways that will implement the CAA section 111(d) requirements efficiently and effectively.
The building block approach is a key feature of the proposal that we are retaining in the final rule, but have refined to include only the first three building blocks and to reflect implementation of the measures encompassed in the building blocks on a broad regional grid-level. In the proposal, we expressed the emission limitation requirements reflecting the BSER in terms of the state goals in order to provide states with maximum flexibility and latitude. We viewed this as an important feature because each state has its own energy profile and state-specific policies and needs relative to the production and use of electricity. In the final rule, we extend that flexibility significantly in direct response to comments from states and utilities. The final rule establishes source-level emission performance rates for the source subcategories, while retaining state-level rate- and mass-based goals. One of the key messages conveyed by state and utility commenters was that the final rule should make it easier for states to adopt mass-based programs and for utilities accustomed to operating across broad multi-state grids to be able to avail themselves of more “ready-made” emissions trading regimes. The inclusion of both of these new features—mass-based state goals in addition to rate-based goals, and source-level emission performance rates for the two subcategories of sources—is intended to make it easier for states and utilities to achieve these outcomes. In fact, these additions, together with the model rules and federal plan being proposed concurrently with this rule, should demonstrate the relative ease with which states can adopt mass-based trading programs, including interstate mass-based programs that lend themselves to the kind of interstate compliance strategies so well suited for integration with the current interstate operations of the overall utility grid.
Many stakeholders conveyed to the EPA that the proposal's interim goals for the 2020-2029 period were designed in a way that defeated the EPA's objective of allowing states and utilities to shape their emission reduction trajectories. They pointed out that, in many cases, the timing and stringency of the states' interim goals could require actions that could result in high costs, threaten electric system reliability or hinder the deployment of renewable technology. In response, the EPA has revised the interim goals in two critical ways. First, the period for mandatory reductions begin in 2022 rather than 2020; second, in keeping with the BSER, emission reduction requirements are phased in more gradually over the interim period. These changes will allow states and utilities to delineate their own emission reduction trajectories so as to minimize costs and foster broader deployment of RE technologies. The value of these changes is demonstrated by our analysis of the final rule, which shows lower program costs, especially in the early years of the interim period, and greater RE deployment, relative to the analysis of the proposed rule. At the same time, this re-design of the interim goals, together with refinements we have made to state plan requirements and the inclusion of a reliability safety valve, provide states, utilities and other entities with the ability to continue to guarantee system reliability.
b.
Outreach, engagement and comment record.
This final rule is the product of one of the most extensive and long-running public engagement processes the EPA has ever conducted, starting in the summer of 2013, prior to proposal, and continuing through December 2014, when the public comment period ended, and continuing beyond that with consultations and meetings with stakeholders. The result of this extensive consultation was millions of comments from stakeholders, which we have carefully considered over the past several months. The EPA gained crucial insights from the more than 4 million comments that the agency received on the proposal and associated documents leading to this final rulemaking. Comments were provided by stakeholders that include state environmental and energy officials, tribal officials, public utility commissioners, system operators, owners and operators of every type of power generating facility, other industry representatives, labor leaders, public health leaders, public interest advocates, community and faith leaders, and members of the public.
The insights gained from public comments contributed to the development of final emission guidelines that build on the proposal and the alternatives on which we sought comment. The modifications incorporated in the final guidelines are directly responsive to the comments we received from the many and diverse stakeholders. The improved guidelines reflect information and ideas that states and utilities provided to us about both the best approach to establishing CO2
emission reduction requirements for EGUs and the most effective ways to create true flexibility for states and utilities in meeting these requirements. These final rules also reflect the results of EPA's robust consultation with federal, state and regional energy agencies and authorities, to ensure that the actions sources will take to reduce GHG emissions will not compromise electric system reliability or affordability of the U.S. electricity supply. Input and assistance from FERC
( printed page 64673)
and DOE have been particularly important in shaping some provisions in these final guidelines. At the same time, input from faith-based, community-based and environmental justice organizations, who provided thoughtful comments about the potential impacts of this rule on pollution levels in overburdened communities and economic impacts, including utility rates in low-income communities, is also reflected in this rule. The final rule also reflects our response to concerns raised by labor leaders regarding the potential effects on workers and communities of the transition away from higher-emitting power generation to lower- and zero-emitting power generation.
c.
Key changes.
The most significant changes in these final guidelines are: (1) The period for mandatory emission reductions beginning in 2022 instead of 2020 and a gradual application of the BSER over the 2022-2029 interim period, such that a state has substantial latitude in selecting its own emission reduction trajectory or “glide path” over that period, (2) a revised BSER determination that focuses on narrower generation options that do not include demand-side EE measures and that includes refinements to the building blocks, more complete incorporation in the BSER of the realities of electricity operations over the three regional interconnections, and up-to-date information about the cost and availability of clean generation options, (3) establishment of source-specific CO2
emission performance rates that are uniform across the two fossil fuel-fired subcategories covered in these guidelines, as well as rate- and mass-based state goals, to facilitate emission trading, including interstate trading and, in particular, mass-based trading, (4) a variation on the proposal's “portfolio” option for state plans—called here the “state measures” approach—that continues to provide states flexibility while ensuring that all state plans have federally enforceable measures as a backstop, (5) additional, more flexible options for states and utilities to adopt multi-state compliance strategies, (6) an extension of up to two years available to all states for submittal of their final compliance plans following making initial submittals in 2016, (7) provisions to encourage actions that achieve early reductions, including a Clean Energy Incentive Program (CEIP), (8) a combination of provisions expressly designed to ensure electric system reliability, (9) the addition of employment considerations for states in plan development, and (10) the expansion of considerations and programs for low-income and vulnerable communities.
We provide summary explanations in the following paragraphs and more detailed explanations of all of these changes in later sections of this preamble and associated documents.
(1)
Mandatory reduction period beginning in 2022 and a gradual glide path.
The proposal's mandatory emission reduction period beginning in 2020 and the trajectory of emission reduction requirements in the interim period were both the subjects of significant comment. Earlier this year, FERC conducted a series of technical conferences comprising one national session and three regional sessions. The information provided by workshop participants echoed much of the material that had been submitted to the comment record for this rulemaking. On May 15, 2015, the FERC Commissioners, drawing upon information highlighted at the technical conferences, transmitted to the EPA some suggestions for the final rule. In addition, via comments, states, utilities, and reliability entities asked us to ensure adequate time for them to implement strategies to achieve CO2
reductions. They expressed concern that, in the proposal, at least some states would be required to reduce emissions in 2020 to levels that would require abrupt shifts in generation in ways that raised concerns about impacts to electric system reliability and ratepayer bills, as well as about stranded assets. To many commenters, the proposal's requirement for CO2
emission reductions beginning in 2020, together with the stringency of the interim CO2
goal, posed significant reliability implications, in particular. In this final rule, the agency is addressing these concerns, in part, by adjusting the compliance timeframe from a 10-year interim period that begins in 2020 to an 8-year interim period that begins in 2022, and by refining the approach for meeting interim CO2
emission performance rates to be a gradual glide path separated into three steps, 2022-2024, 2025-2027, and 2028-2029, that is also achievable “on average” over the 8-year interim period. In response to the concerns of commenters that the proposal's 10-year interim target failed to afford sufficient flexibility, the final guidelines' approach will provide states with realistic options for customizing their emission reduction trajectories. Of equal importance, the approach provides more time for planning, consultation and decision making in the formulation of state plans and in EGUs' choices of compliance strategies. Both FERC's May 15, 2015 letter and the comment record, as well as other information sources, made it clear that providing sufficient time for planning and implementation was essential to ensuring electric system reliability.
The final guidelines' approach to the interim emission performance rates is the result of the application of the measures constituting the BSER in a more gradual way, reflecting stakeholder comments and information about the appropriate period of time over which those measures can be deployed consistent with the BSER factors of cost and feasibility. In addition to facilitating reliable system operations, these changes provide states and utilities with the latitude to consider a broader range of options to achieve the required reductions while addressing concerns about ratepayer impacts and stranded assets.
(2)
Revised BSER determination.
Commenters urged the EPA to confine its BSER determination to actions that involve what they characterized as more “traditional” generation. While some stakeholders recognized demand-side EE as being an integral part of the electricity system, with many of the characteristics of more traditional generating resources, other stakeholders did not. As explained in section V.B.3.c.(8) below, our traditional interpretation and implementation of CAA section 111 has allowed regulated entities to produce as much of a particular good as they desire, provided that they do so through an appropriately clean (or low-emitting) process. While building blocks 1, 2, and 3 fall squarely within this paradigm, the proposed building block 4 does not. In view of this, since the BSER must serve as the foundation of the emission guidelines, the EPA has not included demand-side EE as part of the final BSER determination. Thus, neither the final guidelines' BSER determination nor the emission performance rates for the two subcategories of affected EGUs take into account demand-side EE. However, many commenters also urged the EPA to allow states and sources to rely on demand-side EE as an element of their compliance strategies, as demand-side EE is treated as functionally interchangeable with other forms of generation for planning and operational purposes, as EE measures are in widespread use across the country and provide energy savings that reduce emissions, lower electric bills, and lead to positive investments and job creation. We agree, and the final guidelines provide ample latitude for states and utilities to rely on demand-side EE in
( printed page 64674)
meeting emission reduction requirements.
In response to stakeholder comments on the first three building blocks and considerable data in the record, the EPA has made refinements to the building blocks, and these are reflected in the final BSER. Refinements include adoption of a modified approach to quantification of the RE component, exclusion of the proposed nuclear generation components, and adoption of a consistent regionalized approach to quantification of all three building blocks. The agency also recognizes the important functional relationship between the period of time over which measures are deployed and the stringency of emission limitations those measures can achieve practically and at reasonable cost. Therefore, the final BSER also reflects adjustments to the stringency of the building blocks, after consideration of more and less stringent levels, and refinements to the timeframe over which reductions must be achieved. Sections V.C through V.E of this preamble provide further information on the refinements made to the building blocks and the rationale for doing so.
Commenters pointed out—and practical experience confirms—what is widely known: That the utility power sector operates over regional interconnections that are not constrained by state borders. Across a variety of issues raised in the proposal, many commenters urged that the EPA take that reality into account in developing this final rule. Consequently, the BSER determination itself (as well as a number of new compliance features included in this final rule) and the resulting subcategory-specific emission performance rates take into account the grid-level operations of the source category.
The final guidelines' BSER determination also takes into account recent reductions in the cost of clean energy technology, as well as projections of continuing cost reductions, and continuing increases in RE deployment. We also updated the underlying analysis with the most recent Energy Information Administration (EIA) projections that show lower growth in electricity demand between 2020 and 2030 than previously projected. In keeping with these recent EIA projections, we expect the final guidelines will be more conducive to compliance, consistent with a strategy that allows for the cleanest power generation and greater CO2
reductions in 2030 than the proposal. With a date of 2022, instead of 2020, as proposed, for the mandatory CO2
emission reduction period to begin, the final guidelines reflect that the additional time aligns with the adoption of lower-cost clean technology and, thus, its incorporation in the BSER at higher levels. At the same time, the 2022-2029 interim period will more easily allow for companies to take advantage of improved clean energy technologies as potential least cost options.
(3)
Uniform emission performance rates.
Some stakeholders commented that the proposal's approach of expressing the BSER in terms of state-specific goals deviated from the requirements of CAA section 111 and from previous new source performance standards (NSPS). The effect, they stated, was that the proposal created de facto emission standards for all affected EGUs but that these de facto standards varied widely depending on the state in which a given EGU happened to be located. Instead, these and other commenters stated, section 111 requires that EPA establish the BSER specifically for affected sources, rather than by means of merely setting state-specific goals, and that these standards be uniform. Still other commenters observed that the effect of the approach taken in the proposal of applying the BSER to each state's fleet was to put a greater burden of reductions on lower-emitting or less carbon-intensive states and a lesser emission reduction burden on sources and states that were higher-emitting or more carbon-intensive. This, they argued, was both inequitable and at odds with the way in which NSPS have been applied in the past, where the higher-emitting sources have made the greater and more cost-effective reductions, while lower-emitting sources, whose reduction opportunities tend to be less cost-effective, have been required to make fewer reductions to meet the applicable standard.
At the same time, state and utility commenters expressed concern that relying on state-specific goals and state-by-state planning could introduce complexity into the otherwise seamless integrated operation of affected EGUs across the multi-state grids on which system operators, states and utilities currently rely and intend to continue to rely. Accordingly, they recommended that the final guidelines facilitate emissions trading, in particular interstate trading, which would enable EGU operators to integrate compliance with CO2
emissions limitations with facility and grid-level operations. These sets of comments intersected at the point at which they focused on the fact that it is at the source level at which the standard is set for NSPS and at the source level at which compliance must be achieved.
The EPA carefully considered these comments and while we believe that the approach we took at proposal was well-founded and reflected a number of important considerations, we have concluded that there is a way to address these concerns while expanding upon the advantages offered by the proposal. Accordingly, the final guidelines establish uniform rates for the two subcategories of sources—an approach that is valuable for creating greater equity between and among utilities and states with widely varying emission levels and for expanding the flexibility of the program, especially in ways that have been identified as important to utilities and states. Specifically, the final guidelines express the BSER by means of performance-based CO2
emission rates that are uniform across each of two subcategories—fossil fuel-fired electric steam generating units and stationary combustion turbines—for the affected EGUs covered by the guidelines. The rates are determined, in part, by applying the methodology identified in the Notice of Data Availability (NODA) published on October 30, 2014, which was based on the proposal's building block approach. The final guidelines also maintain the approach adopted in the proposal of establishing state-level goals; in the final rule, those goals are equal to the weighted aggregate of the two emission performance rates as applied to the EGUs in each state.
This approach rectifies what would have been an inefficient, unintended outcome of putting the greater reduction burden on lower-emitting sources and states while exempting higher-emitting sources and states. Expressing the BSER by means of these rates also augments the range of options for both states and EGUs for securing needed flexibility. Inclusion of state goals creates latitude for states as to how they will meet the guidelines. States also may meet the guideline requirements by adopting the CO2
emission performance rates as emission standards that apply to the affected EGUs in their jurisdiction. Such an approach would lend itself to the ready establishment of intra-state and interstate trading, with the uniform rate-based standards of performance established for each EGU as the basis for such trading. At the same time, as at proposal, each state also has the option of complying with these guidelines by adopting a plan that takes a different approach to setting standards of performance for its EGUs and/or by applying complementary or alternative
( printed page 64675)
measures to meet the state goal set by these guidelines—as either a rate or a mass total.
During the outreach process and through comments, a number of state officials and other stakeholders expressed concern that the EPA's approach at proposal necessitated or represented a significant intrusion into state-level energy policy-making, drawing the EPA well beyond the bounds of its CAA authority and expertise. In fact, these final guidelines are entirely respectful of the EPA's responsibility and authority to regulate sources of air pollution. Instead, by establishing and operating through uniform performance rates for the two subcategories of sources that can be applied by states at the individual source level and that can readily be implemented through emission standards that incorporate emissions trading, these final guidelines align with the approach Congress and the EPA have consistently taken to regulating emissions from this and other industrial sectors, namely setting source-level, source category-wide standards that individual sources can meet through a variety of technologies and measures.
We emphasize, at the same time, that while the final guidelines express the BSER by means of source-level CO2
emission performance rates, as well as state-level goals, as at proposal, each state will have a goal reflecting its particular mix of sources, and the final guidelines retain the flexibility inherent in the proposal's state-specific goals approach (and, as discussed in section VIII of this preamble, enhanced in various ways). Thus, in keeping with the proposal's flexibility, states may choose to adopt either the emission performance rates as emission standards for their sources, set different but, in the aggregate, equivalent rates, or fulfill their obligations by meeting their respective individual state goals.
(4)
State plan approaches.
Commenters expressed support for the objectives served by the “portfolio” option in the state plan approaches included at proposal, but many raised concerns about its legality, with respect, in particular, to the CAA's enforceability requirements. Some of these commenters identified a “state commitment approach” with backstop measures as a variation of the “portfolio” approach that would retain the benefits of the “portfolio” approach while resolving legal and enforceability concerns. In this final rule, in response to stakeholder comments on the portfolio approach and alternative approaches, the EPA is finalizing two approaches: A source-based “emission standards” approach, and a “state measures” approach. Through the latter, states may adopt a set of policies and programs, which would not be federally enforceable, except that any standards imposed on affected EGUs would be federally enforceable. In addition, states would be required to include federally enforceable backstop measures applicable to each affected EGU in the event that the measures included in the state plan failed to achieve the state plan's emissions reduction trajectory. Under these guidelines, states can implement the BSER through standards of performance incorporating the uniform performance rates or alternative but in the aggregate equivalent rates, or they can adopt plans that achieve in aggregate the equivalent of the subcategory-specific CO2
emission performance rates by relying on other measures undertaken by the state that complement source-specific requirements or, save for the contingent backstop requirement, supplant them entirely. This revision provides consistency in the treatment of sources while still providing maximum flexibility for states to design their plans around reduction approaches that best suit their policy objectives.
(5)
Emission trading programs.
Many state and utility commenters supported the use of mass-based and rate-based emission trading programs in state plans, including interstate emission trading programs, and either pointed out obstacles to establishing such programs or suggested approaches that would enhance states' and utilities' ability to create and participate in such programs.
Through a combination of features retained from the proposal and changes made to the proposal, these final guidelines provide states and utilities with a panoply of tools that greatly facilitate their putting in place and participating in emissions trading programs. These include: (1) Expressing BSER in uniform emission performance rates that states may rely on in setting emission standards for affected EGUs such that EGUs operating under such standards readily qualify to trade with affected EGUs in states that adopt the same approach, (2) promulgating state mass goals so that states can move quickly to establish mass-based programs such that their affected EGUs readily qualify to trade with affected EGUs in states that adopt the same approach, and (3) providing EPA resources and capacity to create a tracking system to support state emissions trading programs.
(6)
Extension of plan submittal date.
Stakeholders, particularly states, provided compelling information establishing that it could take longer than the agency initially anticipated for the states to develop and submit their required plans. While the approach at proposal reflected the EPA's conclusion that it was essential to the environmental and economic purposes of this rulemaking that utilities and states establish the path towards emissions reductions as early as possible, we recognize commenters' concerns. To strike the proper balance, the EPA has developed a revised state plan submittal schedule. For states that cannot submit a final plan by September 6, 2016, the EPA is requiring those states to make an initial submittal by that date to assure that states begin to address the urgent needs for reductions quickly, and is providing until September 6, 2018, for states to submit a final plan, if an extension until that date is justified, to address the concern that a submitting state needs more time to develop comprehensive plans that reflect the full range of the state's and its stakeholders' interests.
(7)
Provisions to encourage early action.
Many commenters supported providing incentives for states and utilities to deploy CO2
-reducing investments, such as RE and demand-side EE measures, as early as possible. We also received comments from stakeholders regarding the disproportionate burdens that some communities already bear, and stating that all communities should have equal access to the benefits of clean and affordable energy. The EPA recognizes the validity and importance of these perspectives, and as a result has determined to provide a program—called the CEIP—in which states may choose to participate.
The CEIP is designed to incentivize investment in certain RE and demand-side EE projects that commence construction, in the case of RE, or commence construction, in the case of demand-side EE, following the submission of a final state plan to the EPA, or after September 6, 2018, for states that choose not to submit a final state plan by that date, and that generate MWh (RE) or reduce end-use energy demand (EE) during 2020 and/or 2021. State participation in the program is optional.
Under the CEIP, a state may set aside allowances from the CO2
emission budget it establishes for the interim plan performance period or may generate early action ERCs (ERCs are discussed in more detail in section VIII.K.2), and allocate these allowances or ERCs to
( printed page 64676)
eligible projects for the MWh those projects generate or the end-use energy savings they achieve in 2020 and/or 2021. For each early action allowance or ERC a state allocates to such projects, the EPA will provide the state with an appropriate number of matching allowances or ERCs for the state to allocate to the project. The EPA will match state-issued early action ERCs and allowances up to an amount that represents the equivalent of 300 million short tons of CO2
emissions.
For a state to be eligible for a matching award of allowances or ERCs from the EPA, it must demonstrate that it will award allowances or ERCs only to “eligible” projects. These are projects that:
Are located in or benefit a state that has submitted a final state plan that includes requirements establishing its participation in the CEIP;
Are implemented following the submission of a final state plan to the EPA, or after September 6, 2018, for a state that chooses not to submit a complete state plan by that date;
For RE: Generate metered MWh from any type of wind or solar resources;
For EE: Result in quantified and verified electricity savings (MWh) through demand-side EE implemented in low-income communities; and
Generate or save MWh in 2020 and/or 2021.
The following provisions outline how a state may award early action ERCs and allowances to eligible projects, and how the EPA will provide matching ERCs or allowances to states.
For RE projects that generate metered MWh from any type of wind or solar resources: For every two MWh generated, the project will receive one early action ERC (or the equivalent number of allowances) from the state, and the EPA will provide one matching ERC (or the equivalent number of allowances) to the state to award to the project.
For EE projects implemented in low-income communities: For every two MWh in end-use demand savings achieved, the project will receive two early action ERCs (or the equivalent number of allowances) from the state, and the EPA will provide two matching ERCs (or the equivalent number of allowances) to the state to award to the project.
Early action allowances or ERCs awarded by the state, and matching allowances or ERCs awarded by the EPA pursuant to the CEIP, may be used for compliance by an affected EGU with its emission standards and are fully transferrable prior to such use.
The EPA discusses the CEIP in the proposed federal plan rule and will address design and implementation details of the CEIP in a subsequent action. Prior to doing so, the EPA will engage with states, utilities and other stakeholders to gather information regarding their interests and priorities with regard to implementation of the CEIP.
(8)
Provisions for electric system reliability.
A number of commenters stressed the importance of final guidelines that addressed the need to ensure that EGUs could meet their emission reduction requirements without being compelled to take actions that would undermine electric system reliability. As noted above, the EPA has consulted extensively with federal, regional and state energy agencies, utilities and many others about reliability concerns and ways to address them. The final guidelines support electric system reliability in a number of ways, some inherent in the improvements made in the program's design and some through specific provisions we have included in the final rule. Most important are the two key changes we made to the interim goal: Establishing 2022, instead of 2020, as the period for mandatory emission reductions begin and phasing in, over the 8-year period, emission performance rates such that the level of stringency of the emission performance rates in 2022-2024 is significantly less than that for the years 2028 and 2029. Since states and utilities need only to meet their interim goal “on average” over the 8-year period, these changes provide them with a great deal of latitude in determining for themselves their emission reduction trajectory—and they have additional time to do so. As a result, the final guidelines provide the ingredients that commenters, reliability entities and expert agencies told the EPA were essential to ensuring electric system reliability: Time and flexibility sufficient to allow for planning, implementation and the integration of actions needed to address reliability while achieving the required emissions reductions.
In addition, the final guidelines add a requirement, based on substantial input from experts in the energy field, for states to demonstrate that they have considered electric system reliability in developing their state plans. The final rule also offers additional opportunities that support electric system reliability, including opportunities for trading within and between states. The final guidelines also make clear that states can adjust their plans in the event that reliability challenges arise that need to be remedied by amending the state plan. In addition, the final rule includes a reliability safety valve to address situations where, because of an unanticipated catastrophic event, there is a conflict between the requirements imposed on an affected unit and the maintenance of reliability.
(9)
Approaches for addressing employment concerns.
Some commenters brought to our attention the concerns of workers, their families and communities, particularly in coal-producing regions and states, that the ongoing shift toward lower-carbon electricity generation that the final rule reflects will cause harm to communities that are dependent on coal. Others had concerns about whether new jobs created as a result of actions taken pursuant to the final rule will allow for overall economic development. In the final rule, the EPA encourages states, in designing their state plans, to consider the effects of their plans on employment and overall economic development to assure that the opportunities for economic growth and jobs that the plans offer are manifest. We also identify federal programs, including the multi-agency Partnerships for Opportunity and Workforce and Economic Revitalization (POWER) Initiative.[15]
The POWER Initiative is competitively awarding planning assistance and implementation grants with funding from the Department of Commerce, Department of Labor (DOL), Small Business Administration, and the Appalachian Regional Commission,[16]
whose mission is to assist communities affected by changes in the coal industry and the utility power sector.
(10)
Community and environmental justice considerations.
Many community leaders, environmental justice advocates, faith-based organizations and others commented that the benefits of this rule must be shared broadly across society and that undue burdens should not be imposed on low-income ratepayers. We agree. The federal government is taking significant steps to help low-income families and individuals gain access to RE and demand-side EE through new initiatives involving, for example, increasing solar energy systems in federally subsidized homes and supporting solar systems for others with low incomes. The final rule ensures that bill-lowering measures such as demand-side EE continue to be a major
( printed page 64677)
compliance option. The CEIP will encourage early investment in these types of projects as well. In addition to carbon reduction benefits, we expect significant near- and long-term public health benefits in communities as conventional air pollutants are reduced along with GHGs. However, some stakeholders expressed concerns about the possibility of localized increases in emissions from some power plants as the utility industry complies with state plans, in particular in communities already disproportionately affected by air pollution. This rule sets expectations for states to engage with vulnerable communities as they develop their plans, so that impacts on these communities are considered as plans are designed. The EPA also encourages states to engage with workers in the utility power and related sectors, as well as their worker representatives, so that impacts on their communities may be considered. The EPA commits, once implementation is under way, to assess the impacts of this rule. Likewise, we encourage states to evaluate the effects of their plans to ensure that there are no disproportionate adverse impacts on their communities.
5. Additional Context for This Final Rule
a.
Climate change impacts.
This final rule is an important step in an essential series of long-term actions that are achieving and must continue to achieve the GHG emission reductions needed to address the serious threat of climate change, and constitutes a major commitment—and international leadership-by-doing—on the part of the U.S., one of the world's largest GHG emitters. GHG pollution threatens the American public by leading to damaging and long-lasting changes in our climate that can have a range of severe negative effects on human health and the environment. CO2
is the primary GHG pollutant, accounting for nearly three-quarters of global GHG emissions[17]
and 82 percent of U.S. GHG emissions.[18]
The May 2014 report of the National Climate Assessment [19]
concluded that climate change impacts are already manifesting themselves and imposing losses and costs. The report documents increases in extreme weather and climate events in recent decades, with resulting damage and disruption to human well-being, infrastructure, ecosystems, and agriculture, and projects continued increases in impacts across a wide range of communities, sectors, and ecosystems. New scientific assessments since 2009, when the EPA determined that GHGs pose a threat to human health and the environment (the “Endangerment Finding”), highlight the urgency of addressing the rising concentration of CO2
in the atmosphere. Certain groups, including children, the elderly, and the poor, are most vulnerable to climate-related effects. Recent studies also find that certain communities, including low-income communities and some communities of color (more specifically, populations defined jointly by ethnic/racial characteristics and geographic location), are disproportionately affected by certain climate change related impacts—including heat waves, degraded air quality, and extreme weather events—which are associated with increased deaths, illnesses, and economic challenges. Studies also find that climate change poses particular threats to the health, well-being, and ways of life of indigenous peoples in the U.S.
b.
The utility power sector.
One of the strategies of the President's Climate Action Plan is to reduce CO2
emissions from power plants.[20]
This is because fossil fuel-fired EGUs are by far the largest emitters of GHGs, primarily in the form of CO2.
Among stationary sources in the U.S. and among fossil fuel-fired EGUs, coal-fired units are by far the largest emitters of GHGs. To accomplish the goal of reducing CO2
emissions from power plants, President Obama issued a Presidential Memorandum [21]
that recognized the importance of significant and prompt action. The Memorandum directed the EPA to complete carbon pollution standards, regulations or guidelines, as appropriate, for new, modified, reconstructed and existing power plants, and in doing so to build on state leadership in moving toward a cleaner power sector. In this action and the concurrent CAA section 111(b) rule, the EPA is finalizing regulations to reduce GHG emissions from fossil fuel-fired EGUs. This CAA section 111(d) action builds on actions states and utilities are already taking to move toward cleaner generation of electric power.
The utility power sector is unlike other industrial sectors. In other sectors, sources effectively operate independently and on a local-site scale, with control of their physical operations resting in the hands of their respective owners and operators. Pollution control standards, which focus on each source in a non-utility industrial source category, have reflected the standalone character of individual source investment decision-making and operations.
In stark contrast, the utility power sector comprises a unique system of electricity resources, including the EGUs affected under these guidelines, that operate in a complex and interconnected grid where electricity generally flows freely (
e.g.,
portions of the system cannot be easily isolated through the use of switches or valves as can be done in other networked systems like trains and pipeline systems). That grid is physically interconnected and operated on an integrated basis across large regions. In this interconnected system, system operators, whose decisions, protocols, and actions, to a significant extent, dictate the operations of individual EGUs and large ensembles of EGUs, must reliably balance supply and demand using available generation and demand-side resources, including EE, demand response and a wide range of low- and zero-emitting sources. These resources are managed to meet the system needs in a reliable and efficient manner. Each aspect of this interconnected system is highly regulated and coordinated, with supply and demand constantly being balanced to meet system needs. Each step of the process from the electric generator to the end user is highly regulated by multiple entities working in coordination and considering overall system reliability. For example, in an independent system operator (ISO) or regional transmission organization (RTO) with a centralized, organized capacity market, electric generators are paid to be available to run when needed, must bid into energy markets, must respond to dispatch instructions, and must have permission to schedule maintenance. The ISO/RTO dispatches resources in a way that maintains electric system reliability.
The approach we take in the final guidelines—both in the way we defined the BSER and established the resulting emission performance rates, and in the ranges of options we created for states
( printed page 64678)
and affected EGUs—is consistent with, and in some ways mirrors, the interconnected, interdependent and highly regulated nature of the utility power sector, the daily operation of affected EGUs within this framework, and the critical role of utilities in providing reliable, affordable electricity at all times and in all places within this complex, regulated system. Thus, not only do these guidelines put a premium on providing as much flexibility and latitude as possible for states and utilities, they also recognize that a given EGU's operations are determined by the availability and use of other generation resources to which it is physically connected and by the collective operating regime that integrates that individual EGU's activity with other resources across the grid.
In this integrated system, numerous entities have both the capability and the responsibility to maintain a reliable electric system. FERC, DOE, state public utility commissions, ISOs, RTOs, other planning authorities, and the North American Electric Reliability Corporation (NERC), all contribute to ensuring the reliability of the electric system in the U.S. Critical to this function are dispatch tools, applied primarily by RTOs, ISOs, and balancing authorities, that operate such that actions taken or costs incurred at one source directly affect or cause actions to occur at other sources. Generation, outages, and transmission changes in one part of the synchronous grid can affect the entire interconnected grid.[22]
The interconnection is such that “[i]f a generator is lost in New York City, its effect is felt in Georgia, Florida, Minneapolis, St. Louis, and New Orleans.” [23]
The U.S. Supreme Court has explicitly recognized the interconnected nature of the electricity grid.[24]
The uniqueness of the utility power sector inevitably affects the way in which environmental regulations are designed. When the EPA promulgates environmental regulations that affect the utility power sector, as we have done numerous times over the past four decades, we do so with the awareness of the importance of the efficient and continuous, uninterrupted operation of the interconnected electricity system in which EGUs participate. We also keep in mind the unique product that this interconnected system provides—electricity services—and the critical role of this sector to the U.S. economy and to the fundamental well-being of all Americans.
In the context of environmental regulation, Congress, the EPA and the states all have recognized—as we do in these final guidelines—that electricity production takes place, at least to some extent, interchangeably between and among multiple generation facilities and different types of generation. This is evidenced in the enactment or promulgation of pollution reduction programs, such as Title IV of the CAA, the NOX
state implementation plan (SIP) Call, the Cross-State Air Pollution Rule (CSAPR), and the Regional Greenhouse Gas Initiative (RGGI). As these actions show, both Congress and the EPA have consistently tailored legislation and regulations affecting the utility power sector to its unique characteristics. For example, in Title IV of the Clean Air Act Amendments of 1990, Congress established a pollution reduction program specifically for fossil fuel-fired EGUs and designed the SO2
portion of that program with express recognition of the sector's ability to shift generation among various EGUs, which enabled pollution reduction by increasing reliance on natural gas-fired units and RE. Similarly, in the NOX
SIP Call, the Clean Air Interstate Rule (CAIR), and CSAPR, the EPA established pollution reduction programs focused on fossil fuel-fired EGUs and designed those programs with express recognition of the sector's ability to shift generation among various EGUs. In this action, we continue that approach. Both the subcategory-specific emission performance rates, and the pathways offered to achieve them, reflect and are tailored to the unique characteristics of the utility power sector.
The way that power is produced, distributed and used in the U.S. is already changing as a result of advancements in innovative power sector technologies and in the availability and cost of low-carbon fuel, RE and demand-side EE technologies, as well as economic conditions. These changes are taking place at a time when the average age of the coal-fired generating fleet is approaching that at which utilities and states undertake significant new investments to address aging assets. In 2025, the average age of the coal-fired generating fleet is projected to be 49 years old, and 20 percent of those units would be more than 60 years old if they remain in operation at that time. Therefore, even in the absence of additional environmental regulation, states and utilities can be expected to be, and already are, making plans for and investing in the next generation of power production, simply because of the need to take account of the age of current assets and infrastructure. Historically, the industry has invested about $100 billion a year in capital improvements. These guidelines will help ensure that, as those necessary investments are being made, they are integrated with the need to address GHG pollution from the sector.
At the same time, owners/operators of affected EGUs are already pursuing the types of measures contemplated in this rule. Out of 404 entities identified as owners or operators of affected EGUs, representing ownership of 82 percent of the total capacity of the affected EGUs, 178 already own RE generating capacity in addition to fossil fuel-fired generating capacity. In fact, these entities already own aggregate amounts of RE generating capacity equal to 25 percent of the aggregate amounts of their affected EGU capacity.[25]
In addition, funding for utility EE programs has been growing rapidly, increasing from $1.6 billion in 2006 to $6.3 billion in 2013.
The final guidelines are based on, and reinforce, the actions already being taken by states and utilities to upgrade aging electricity infrastructure with 21st century technologies. The guidelines will ensure that these trends continue in ways that are consistent with the long-term planning and investment processes already used in the utility power sector. This final rule provides flexibility for states to build upon their progress, and the progress of cities and towns, in addressing GHGs, and minimizes
( printed page 64679)
additional requirements for existing programs where possible. It also allows states to pursue policies to reduce carbon pollution that: (1) Continue to rely on a diverse set of energy resources; (2) ensure electric system reliability; (3) provide affordable electricity; (4) recognize investments that states and power companies are already making; and (5) tailor plans to meet their respective energy, environmental and economic needs and goals, and those of their local communities. Thus, the final guidelines will achieve meaningful CO2
emission reductions while maintaining the reliability and affordability of electricity in the U.S.
6. Projected National-Level Emission Reductions
Under the final guidelines, the EPA projects annual CO2
reductions of 22 to 23 percent below 2005 levels in 2020, 28 to 29 percent below 2005 levels in 2025, and 32 percent below 2005 levels in 2030. These guidelines will also result in important reductions in emissions of criteria air pollutants, including SO2, NOX, and directly-emitted fine particulate matter (PM2.5). A thorough discussion of the EPA's analysis is presented in Section XI.A of this preamble and in Chapter 3 of the Regulatory Impact Analysis (RIA) included in the docket for this rulemaking.
7. Costs and Benefits
Actions taken to comply with the final guidelines will reduce emissions of CO2
and other air pollutants, including SO2, NOX, and directly emitted PM2.5
from the utility power sector. States will make the ultimate determination as to how the emission guidelines are implemented. Thus, all costs and benefits reported for this action are illustrative estimates. The illustrative costs and benefits are based upon compliance approaches that reflect a range of measures consisting of improved operations at EGUs, dispatching lower-emitting EGUs and zero-emitting energy sources, and increasing levels of end-use EE.
Because of the range of choices available to states and the lack of
a priori
knowledge about the specific choices states will make in response to the final goals, the RIA for this final action presents two scenarios designed to achieve these goals, which we term the “rate-based” illustrative plan approach and the “mass-based” illustrative plan approach.
In summary, we estimate the total combined climate benefits and health co-benefits for the rate-based approach to be $3.5 to $4.6 billion in 2020, $18 to $28 billion in 2025, and $34 to $54 billion in 2030 (3 percent discount rate, 2011$). Total combined climate benefits and health co-benefits for the mass-based approach are estimated to be $5.3 to $8.1 billion in 2020, $19 to $29 billion in 2025, and $32 to $48 billion in 2030 (3 percent discount rate, 2011$). A summary of the emission reductions and monetized benefits estimated for this rule at all discount rates is provided in Tables 15 through 22 of this preamble.
The annual compliance costs are estimated using the Integrated Planning Model (IPM) and include demand-side EE program and participant costs as well as monitoring, reporting and recordkeeping costs. In 2020, total compliance costs of the final guidelines are approximately $2.5 billion (2011$) under the rate-based approach and $1.4 billion (2011$) under the mass-based approach. In 2025, total compliance costs of the final guidelines are approximately $1.0 billion (2011$) under the rate-based approach and $3.0 billion (2011$) under the mass-based approach. In 2030, total compliance costs of the final guidelines are approximately $8.4 billion (2011$) under the rate-based approach and $5.1 billion (2011$) under the mass-based approach.
The quantified net benefits (the difference between monetized benefits and compliance costs) in 2020 are estimated to range from $1.0 billion to $2.1 billion (2011$) using a 3 percent discount rate (model average) under the rate-based approach and from $3.9 billion to $6.7 billion (2011$) using a 3 percent discount rate (model average) under the mass-based approach. In 2025, the quantified net benefits (the difference between monetized benefits and compliance costs) in 2025 are estimated to range from $17 billion to $27 billion (2011$) using a 3 percent discount rate (model average) under the rate-based approach and from $16 billion to $26 billion (2011$) using a 3 percent discount rate (model average) under the mass-based approach. In 2030, the quantified net benefits (the difference between monetized benefits and compliance costs) in 2030 are estimated to range from $26 billion to $45 billion (2011$) using a 3 percent discount rate (model average) under the rate-based approach and from $26 billion to $43 billion (2011$) using a 3 percent discount rate (model average) under the mass-based approach.
( printed page 64680)
Table 1—Summary of the Monetized Benefits, Compliance Costs, and Net Benefits for the Final Guidelines in 2020, 2025, and 2030
a
Under the Rate-Based Illustrative Plan Approach
[Billions of 2011$]
Rate-based approach, 2020
3% Discount rate
7% Discount rate
Climate benefits b
$2.8
Air pollution health co-benefits c
$0.70 to $1.8
$0.64 to $1.7.
Total Compliance Costs d
$2.5
$2.5.
Net Monetized Benefits e
$1.0 to $2.1
$1.0 to $2.0.
Non-monetized Benefits
Non-monetized climate benefits.
Reductions in exposure to ambient NO2
and SO2.
Reductions in mercury deposition.
Ecosystem benefits associated with reductions in emissions of NOX, SO2, PM, and mercury.
Visibility impairment.
Rate-based approach, 2025
Climate benefits b
$10
Air pollution health co-benefits c
$7.4 to $18
$6.7 to $16.
Total Compliance Costs d
$1.0
$1.0.
Net Monetized Benefits e
$17 to $27
$16 to $25.
Non-monetized Benefits
Non-monetized climate benefits.
Reductions in exposure to ambient NO2
and SO2.
Reductions in mercury deposition.
Ecosystem benefits associated with reductions in emissions of NOX, SO2, PM, and mercury.
Visibility impairment.
Rate-based approach, 2030
Climate benefits b
$20
Air pollution health co-benefits c
$14 to $34
$13 to $31.
Total Compliance Costs d
$8.4
$8.4.
Net Monetized Benefits e
$26 to $45
$25 to $43.
Non-monetized Benefits
Non-monetized climate benefits.
Reductions in exposure to ambient NO2
and SO2.
Reductions in mercury deposition.
Ecosystem benefits associated with reductions in emissions of NOX, SO2, PM, and mercury.
Visibility impairment.
a
All are rounded to two significant figures, so figures may not sum.
b
The climate benefit estimate in this summary table reflects global impacts from CO2
emission changes and does not account for changes in non-CO2
GHG emissions. Also, different discount rates are applied to SC-CO2
than to the other estimates because CO2
emissions are long-lived and subsequent damages occur over many years. The benefit estimates in this table are based on the average SCC estimated for a 3 percent discount rate, however we emphasize the importance and value of considering the full range of SC-CO2
values. As shown in the RIA, climate benefits are also estimated using the other three SC-CO2
estimates (model average at 2.5 percent discount rate, 3 percent, and 5 percent; 95th percentile at 3 percent). The SC-CO2
estimates are year-specific and increase over time.
c
The air pollution health co-benefits reflect reduced exposure to PM2.5
and ozone associated with emission reductions of directly emitted PM2.5, SO2
and NOX
. The range reflects the use of concentration-response functions from different epidemiology studies. The reduction in premature fatalities each year accounts for over 98 percent of total monetized co-benefits from PM2.5
and ozone. These models assume that all fine particles, regardless of their chemical composition, are equally potent in causing premature mortality because the scientific evidence is not yet sufficient to allow differentiation of effect estimates by particle type.
d
Total costs are approximated by the illustrative compliance costs estimated using the Integrated Planning Model for the final guidelines and a discount rate of approximately 5%. This estimate includes monitoring, recordkeeping, and reporting costs and demand-side EE program and participant costs.
e
The estimates of net benefits in this summary table are calculated using the global SC-CO2
at a 3 percent discount rate (model average). The RIA includes combined climate and health estimates based on additional discount rates.
( printed page 64681)
Table 2—Summary of the Monetized Benefits, Compliance Costs, and Net Benefits for the Final Guidelines in 2020, 2025 and 2030 a
Under the Mass-Based Illustrative Plan Approach
[Billions of 2011$]
Mass-based approach, 2020
3% Discount rate
7% Discount rate
Climate benefits b
$3.3
Air pollution health co-benefits c
$2.0 to $4.8
$1.8 to $4.4.
Total Compliance Costs d
$1.4
$1.4.
Net Monetized Benefits e
$3.9 to $6.7
$3.7 to $6.3.
Non-monetized Benefits
Non-monetized climate benefits.
Reductions in exposure to ambient NO2
and SO2.
Reductions in mercury deposition.
Ecosystem benefits associated with reductions in emissions of NOX, SO2, PM, and mercury.
Visibility impairment.
Mass-based approach, 2025
Climate benefits b
$12
Air pollution health co-benefits c
$7.1 to $17
$6.5 to $16.
Total Compliance Costs d
$3.0
$3.0.
Net Monetized Benefits e
$16 to $26
$15 to $24.
Non-monetized Benefits
Non-monetized climate benefits.
Reductions in exposure to ambient NO2
and SO2.
Reductions in mercury deposition.
Ecosystem benefits associated with reductions in emissions of NOX, SO2, PM, and mercury.
Visibility impairment.
Mass-based approach, 2030
Climate benefits b
$20
Air pollution health co-benefits c
$12 to $28
$11 to $26.
Total Compliance Costs d
$5.1
$5.1.
Net Monetized Benefits e
$26 to $43
$25 to $40.
Non-monetized Benefits
Non-monetized climate benefits.
Reductions in exposure to ambient NO2
and SO2.
Reductions in mercury deposition.
Ecosystem benefits associated with reductions in emissions of NOX, SO2, PM, and mercury.
Visibility impairment.
a
All are rounded to two significant figures, so figures may not sum.
b
The climate benefit estimate in this summary table reflects global impacts from CO2
emission changes and does not account for changes in non-CO2
GHG emissions. Also, different discount rates are applied to SC-CO2
than to the other estimates because CO2
emissions are long-lived and subsequent damages occur over many years. The benefit estimates in this table are based on the average SC-CO2
estimated for a 3 percent discount rate, however we emphasize the importance and value of considering the full range of SC-CO2
values. As shown in the RIA, climate benefits are also estimated using the other three SC-CO2
estimates (model average at 2.5 percent discount rate, 3 percent, and 5 percent; 95th percentile at 3 percent). The SC-CO2
estimates are year-specific and increase over time.
c
The air pollution health co-benefits reflect reduced exposure to PM2.5
and ozone associated with emission reductions of directly emitted PM2.5, SO2
and NOX
. The range reflects the use of concentration-response functions from different epidemiology studies. The reduction in premature fatalities each year accounts for over 98 percent of total monetized co-benefits from PM2.5
and ozone. These models assume that all fine particles, regardless of their chemical composition, are equally potent in causing premature mortality because the scientific evidence is not yet sufficient to allow differentiation of effect estimates by particle type.
d
Total costs are approximated by the illustrative compliance costs estimated using the Integrated Planning Model for the final guidelines and a discount rate of approximately 5 percent. This estimate includes monitoring, recordkeeping, and reporting costs and demand-side EE program and participant costs.
e
The estimates of net benefits in this summary table are calculated using the global SC-CO2
at a 3 percent discount rate (model average). The RIA includes combined climate and health estimates based on additional discount rates.
( printed page 64682)
There are additional important benefits that the EPA could not monetize. Due to current data and modeling limitations, our estimates of the benefits from reducing CO2
emissions do not include important impacts like ocean acidification or potential tipping points in natural or managed ecosystems. The unquantified benefits also include climate benefits from reducing emissions of non-CO2
GHGs (
e.g.,
nitrous oxide and methane) [26]
and co-benefits from reducing direct exposure to SO2, NOX, and HAP (
e.g.,
mercury and hydrogen chloride), as well as from reducing ecosystem effects and visibility impairment.
We project employment gains and losses relative to base case for different types of labor, including construction, plant operation and maintenance, coal and natural gas production, and demand-side EE. In 2030, we project a net decrease in job-years of about 31,000 under the rate-based approach and 34,000 under the mass-based approach [27]
for construction, plant operation and maintenance, and coal and natural gas and a gain of 52,000 to 83,000 jobs in the demand-side EE sector under either approach. Actual employment impacts will depend upon measures taken by states in their state plans and the specific actions sources take to comply.
Based upon the foregoing, it is clear that the monetized benefits of this rule are substantial and far outweigh the costs.
B. Organization and Approach for This Rule
This final rule establishes the EPA's emission guidelines for states to follow in developing plans to reduce CO2
emissions from the utility power sector. Section II of this preamble provides background information on climate change impacts from GHG emissions, GHG emissions from fossil fuel-fired EGUs, the utility power sector, the CAA section 111(d) requirements, EPA actions prior to this final action, outreach and consultations, and the number and extent of comments received. In section III of the preamble, we present a summary of the rule requirements and the legal basis for these. Section IV explains the EPA authority to regulate CO2
and EGUs, identifies affected EGUs, and describes the proposed treatment of source categories. Section V describes the agency's determination of the BSER using three building blocks and our key considerations in making the determination. Section VI provides the subcategory-specific emission performance rates, and section VII provides equivalent statewide rate-based and mass-based goals. Section VIII then describes state plan approaches and the requirements, and flexibilities, for state plans, followed by section IX, in which considerations for communities are described. Interactions between this final rule and other EPA programs and rules are discussed in section X. Impacts of the proposed action are then described in section XI, followed by a discussion of statutory and executive order reviews in section XII and the statutory authority for this action in section XIII.
We note that this rulemaking is being promulgated concurrently with two related actions in this issue of the
Federal Register
: The final NSPS for CO2
emissions from newly constructed, modified, and reconstructed EGUs, which is being promulgated under CAA section 111(b), and the proposed federal plan and model rules. These rulemakings have their own rulemaking dockets.
II. Background
In this section, we discuss climate change impacts from GHG emissions, both on public health and public welfare. We also present information about GHG emissions from fossil fuel-fired EGUs, the challenges associated with controlling carbon dioxide emissions, the uniqueness of the utility power sector, and recent and continuing trends and transitions in the utility power sector. In addition, we briefly describe CAA regulations for power plants, provide highlights of Congressional awareness of climate change and international agreements and actions, and summarize statutory and regulatory requirements relevant to this rulemaking. In addition, we provide background information on the EPA's June 18, 2014 Clean Power Plan proposal, the November 4, 2014 supplemental proposal, and other actions associated with this rulemaking,[28]
followed by information on stakeholder outreach and consultations and the comments that the EPA received prior to issuing this final rulemaking.
A. Climate Change Impacts From GHG Emissions
According to the National Research Council, “Emissions of CO2
from the burning of fossil fuels have ushered in a new epoch where human activities will largely determine the evolution of Earth's climate. Because CO2
in the atmosphere is long lived, it can effectively lock Earth and future generations into a range of impacts, some of which could become very severe. Therefore, emission reduction choices made today matter in determining impacts experienced not just over the next few decades, but in the coming centuries and millennia.” [29]
In 2009, based on a large body of robust and compelling scientific evidence, the EPA Administrator issued the Endangerment Finding under CAA section 202(a)(1).[30]
In the Endangerment Finding, the Administrator found that the current, elevated concentrations of GHGs in the atmosphere—already at levels unprecedented in human history—may reasonably be anticipated to endanger public health and welfare of current and future generations in the U.S. We summarize these adverse effects on public health and welfare briefly here.
1. Public Health Impacts Detailed in the 2009 Endangerment Finding
Climate change caused by human emissions of GHGs threatens the health of Americans in multiple ways. By raising average temperatures, climate change increases the likelihood of heat waves, which are associated with increased deaths and illnesses. While climate change also increases the likelihood of reductions in cold-related mortality, evidence indicates that the increases in heat mortality will be larger than the decreases in cold mortality in the U.S. Compared to a future without climate change, climate change is expected to increase ozone pollution over broad areas of the U.S., especially on the highest ozone days and in the largest metropolitan areas with the worst ozone problems, and thereby increase the risk of morbidity and mortality. Climate change is also
( printed page 64683)
expected to cause more intense hurricanes and more frequent and intense storms and heavy precipitation, with impacts on other areas of public health, such as the potential for increased deaths, injuries, infectious and waterborne diseases, and stress-related disorders. Children, the elderly, and the poor are among the most vulnerable to these climate-related health effects.
2. Public Welfare Impacts Detailed in the 2009 Endangerment Finding
Climate change impacts touch nearly every aspect of public welfare. Among the multiple threats caused by human emissions of GHGs, climate changes are expected to place large areas of the country at serious risk of reduced water supplies, increased water pollution, and increased occurrence of extreme events such as floods and droughts. Coastal areas are expected to face a multitude of increased risks, particularly from rising sea level and increases in the severity of storms. These communities face storm and flooding damage to property, or even loss of land due to inundation, erosion, wetland submergence and habitat loss.
Impacts of climate change on public welfare also include threats to social and ecosystem services. Climate change is expected to result in an increase in peak electricity demand. Extreme weather from climate change threatens energy, transportation, and water resource infrastructure. Climate change may also exacerbate ongoing environmental pressures in certain settlements, particularly in Alaskan indigenous communities, and is very likely to fundamentally rearrange U.S. ecosystems over the 21st century. Though some benefits may balance adverse effects on agriculture and forestry in the next few decades, the body of evidence points towards increasing risks of net adverse impacts on U.S. food production, agriculture and forest productivity as temperature continues to rise. These impacts are global and may exacerbate problems outside the U.S. that raise humanitarian, trade, and national security issues for the U.S.
3. New Scientific Assessments and Observations
Since the administrative record concerning the Endangerment Finding closed following the EPA's 2010 Reconsideration Denial, the climate has continued to change, with new records being set for a number of climate indicators such as global average surface temperatures, Arctic sea ice retreat, CO2
concentrations, and sea level rise. Additionally, a number of major scientific assessments have been released that improve understanding of the climate system and strengthen the case that GHGs endanger public health and welfare both for current and future generations. These assessments, from the Intergovernmental Panel on Climate Change (IPCC), the U.S. Global Change Research Program (USGCRP), and the National Research Council (NRC), include: IPCC's 2012
Special Report on Managing the Risks of Extreme Events and Disasters to Advance Climate Change Adaptation
(SREX) and the 2013-2014 Fifth Assessment Report (AR5), the USGCRP's 2014 National Climate Assessment,
Climate Change Impacts in the United States
(NCA3), and the NRC's 2010
Ocean Acidification: A National Strategy to Meet the Challenges of a Changing Ocean
(Ocean Acidification), 2011
Report on Climate Stabilization Targets: Emissions, Concentrations, and Impacts over Decades to Millennia
(Climate Stabilization Targets), 2011
National Security Implications for U.S. Naval Forces
(National Security Implications), 2011
Understanding Earth's Deep Past: Lessons for Our Climate Future
(Understanding Earth's Deep Past), 2012
Sea Level Rise for the Coasts of California, Oregon, and Washington: Past, Present, and Future,
2012
Climate and Social Stress: Implications for Security Analysis
(Climate and Social Stress), and 2013
Abrupt Impacts of Climate Change
(Abrupt Impacts) assessments.
The EPA has carefully reviewed these recent assessments in keeping with the same approach outlined in Section VIII.A of the 2009 Endangerment Finding, which was to rely primarily upon the major assessments by the USGCRP, the IPCC, and the NRC of the National Academies to provide the technical and scientific information to inform the Administrator's judgment regarding the question of whether GHGs endanger public health and welfare. These assessments addressed the scientific issues that the EPA was required to examine, were comprehensive in their coverage of the GHG and climate change issues, and underwent rigorous and exacting peer review by the expert community, as well as rigorous levels of U.S. government review.
The findings of the recent scientific assessments confirm and strengthen the conclusion that GHGs endanger public health, now and in the future. The NCA3 indicates that human health in the U.S. will be impacted by “increased extreme weather events, wildfire, decreased air quality, threats to mental health, and illnesses transmitted by food, water, and disease-carriers such as mosquitoes and ticks.” The most recent assessments now have greater confidence that climate change will influence production of pollen that exacerbates asthma and other allergic respiratory diseases such as allergic rhinitis, as well as effects on conjunctivitis and dermatitis. Both the NCA3 and the IPCC AR5 found that increasing temperature has lengthened the allergenic pollen season for ragweed, and that increased CO2
by itself can elevate production of plant-based allergens.
The NCA3 also finds that climate change, in addition to chronic stresses such as extreme poverty, is negatively affecting indigenous peoples' health in the U.S. through impacts such as reduced access to traditional foods, decreased water quality, and increasing exposure to health and safety hazards. The IPCC AR5 finds that climate change-induced warming in the Arctic and resultant changes in environment (
e.g.,
permafrost thaw, effects on traditional food sources) have significant impacts, observed now and projected, on the health and well-being of Arctic residents, especially indigenous peoples. Small, remote, predominantly-indigenous communities are especially vulnerable given their “strong dependence on the environment for food, culture, and way of life; their political and economic marginalization; existing social, health, and poverty disparities; as well as their frequent close proximity to exposed locations along ocean, lake, or river shorelines.” [31]
In addition, increasing temperatures and loss of Arctic sea ice increases the risk of drowning for those engaged in traditional hunting and fishing.
The NCA3 concludes that children's unique physiology and developing bodies contribute to making them particularly vulnerable to climate change. Impacts on children are expected from heat waves, air pollution, infectious and waterborne illnesses, and mental health effects resulting from extreme weather events. The IPCC AR5 indicates that children are among those especially susceptible to most allergic diseases, as well as health effects
( printed page 64684)
associated with heat waves, storms, and floods. The IPCC finds that additional health concerns may arise in low income households, especially those with children, if climate change reduces food availability and increases prices, leading to food insecurity within households.
Both the NCA3 and IPCC AR5 conclude that climate change will increase health risks facing the elderly. Older people are at much higher risk of mortality during extreme heat events. Pre-existing health conditions also make older adults susceptible to cardiac and respiratory impacts of air pollution and to more severe consequences from infectious and waterborne diseases. Limited mobility among older adults can also increase health risks associated with extreme weather and floods.
The new assessments also confirm and strengthen the conclusion that GHGs endanger public welfare, and emphasize the urgency of reducing GHG emissions due to their projections that show GHG concentrations climbing to ever-increasing levels in the absence of mitigation. The NRC assessment Understanding Earth's Deep Past projected that, without a reduction in emissions, CO2
concentrations by the end of the century would increase to levels that the Earth has not experienced for more than 30 million years.[32]
In fact, that assessment stated that “the magnitude and rate of the present GHG increase place the climate system in what could be one of the most severe increases in radiative forcing of the global climate system in Earth history.” [33]
Because of these unprecedented changes, several assessments state that we may be approaching critical, poorly understood thresholds. As stated in the assessment, “As Earth continues to warm, it may be approaching a critical climate threshold beyond which rapid and potentially permanent—at least on a human timescale—changes not anticipated by climate models tuned to modern conditions may occur.” The NRC Abrupt Impacts report analyzed abrupt climate change in the physical climate system and abrupt impacts of ongoing changes that, when thresholds are crossed, can cause abrupt impacts for society and ecosystems. The report considered destabilization of the West Antarctic Ice Sheet (which could cause 3-4 m of potential sea level rise) as an abrupt climate impact with unknown but probably low probability of occurring this century. The report categorized a decrease in ocean oxygen content (with attendant threats to aerobic marine life); increase in intensity, frequency, and duration of heat waves; and increase in frequency and intensity of extreme precipitation events (droughts, floods, hurricanes, and major storms) as climate impacts with moderate risk of an abrupt change within this century. The NRC
Abrupt Impacts
report also analyzed the threat of rapid state changes in ecosystems and species extinctions as examples of an irreversible impact that is expected to be exacerbated by climate change. Species at most risk include those whose migration potential is limited, whether because they live on mountaintops or fragmented habitats with barriers to movement, or because climatic conditions are changing more rapidly than the species can move or adapt. While the NRC determined that it is not presently possible to place exact probabilities on the added contribution of climate change to extinction, they did find that there was substantial risk that impacts from climate change could, within a few decades, drop the populations in many species below sustainable levels thereby committing the species to extinction. Species within tropical and subtropical rainforests such as the Amazon and species living in coral reef ecosystems were identified by the NRC as being particularly vulnerable to extinction over the next 30 to 80 years, as were species in high latitude and high elevation regions. Moreover, due to the time lags inherent in the Earth's climate, the NRC Climate Stabilization Targets assessment notes that the full warming from any given concentration of CO2
reached will not be fully realized for several centuries, underscoring that emission activities today carry with them climate commitments far into the future.
Future temperature changes will depend on what emission path the world follows. In its high emission scenario, the IPCC AR5 projects that global temperatures by the end of the century will likely be 2.6 °C to 4.8 °C (4.7 to 8.6 °F) warmer than today. Temperatures on land and in northern latitudes will likely warm even faster than the global average. However, according to the NCA3, significant reductions in emissions would lead to noticeably less future warming beyond mid-century, and therefore less impact to public health and welfare.
While rainfall may only see small globally and annually averaged changes, there are expected to be substantial shifts in where and when that precipitation falls. According to the NCA3, regions closer to the poles will see more precipitation, while the dry subtropics are expected to expand (colloquially, this has been summarized as wet areas getting wetter and dry regions getting drier). In particular, the NCA3 notes that the western U.S., and especially the Southwest, is expected to become drier. This projection is consistent with the recent observed drought trend in the West. At the time of publication of the NCA, even before the last 2 years of extreme drought in California, tree ring data was already indicating that the region might be experiencing its driest period in 800 years. Similarly, the NCA3 projects that heavy downpours are expected to increase in many regions, with precipitation events in general becoming less frequent but more intense. This trend has already been observed in regions such as the Midwest, Northeast, and upper Great Plains. Meanwhile, the NRC Climate Stabilization Targets assessment found that the area burned by wildfire is expected to grow by 2 to 4 times for 1 °C (1.8 °F) of warming. For 3 °C of warming, the assessment found that 9 out of 10 summers would be warmer than all but the 5 percent of warmest summers today, leading to increased frequency, duration, and intensity of heat waves. Extrapolations by the NCA also indicate that Arctic sea ice in summer may essentially disappear by mid-century. Retreating snow and ice, and emissions of carbon dioxide and methane released from thawing permafrost, will also amplify future warming.
Since the 2009 Endangerment Finding, the USGCRP NCA3, and multiple NRC assessments have projected future rates of sea level rise that are 40 percent larger to more than twice as large as the previous estimates from the 2007 IPCC 4th Assessment Report due in part to improved understanding of the future rate of melt of the Antarctic and Greenland Ice sheets. The NRC Sea Level Rise assessment projects a global sea level rise of 0.5 to 1.4 meters (1.6 to 4.6 feet) by 2100, the NRC National Security Implications assessment suggests that “the Department of the Navy should expect roughly 0.4 to 2 meters [1.3 to 6.6 feet] global average sea-level rise by 2100,” [34]
and the NRC Climate Stabilization Targets assessment states that an increase of 3 °C will lead to a sea level rise of 0.5 to 1 meter (1.6 to 3.3 feet) by 2100. These assessments continue to recognize that there is
( printed page 64685)
uncertainty inherent in accounting for ice sheet processes. Additionally, local sea level rise can differ from the global total depending on various factors: The east coast of the U.S. in particular is expected to see higher rates of sea level rise than the global average. For comparison, the NCA3 states that “five million Americans and hundreds of billions of dollars of property are located in areas that are less than four feet above the local high-tide level,” and the NCA3 finds that “[c]oastal infrastructure, including roads, rail lines, energy infrastructure, airports, port facilities, and military bases, are increasingly at risk from sea level rise and damaging storm surges.” [35]
Also, because of the inertia of the oceans, sea level rise will continue for centuries after GHG concentrations have stabilized (though more slowly than it would have otherwise). Additionally, there is a threshold temperature above which the Greenland ice sheet will be committed to inevitable melting: According to the NCA, some recent research has suggested that even present day CO2
levels could be sufficient to exceed that threshold.
In general, climate change impacts are expected to be unevenly distributed across different regions of the U.S. and have a greater impact on certain populations, such as indigenous peoples and the poor. The NCA3 finds climate change impacts such as the rapid pace of temperature rise, coastal erosion and inundation related to sea level rise and storms, ice and snow melt, and permafrost thaw are affecting indigenous people in the U.S. Particularly in Alaska, critical infrastructure and traditional livelihoods are threatened by climate change and, “[i]n parts of Alaska, Louisiana, the Pacific Islands, and other coastal locations, climate change impacts (through erosion and inundation) are so severe that some communities are already relocating from historical homelands to which their traditions and cultural identities are tied.” [36]
The IPCC AR5 notes, “Climate-related hazards exacerbate other stressors, often with negative outcomes for livelihoods, especially for people living in poverty (high confidence). Climate-related hazards affect poor people's lives directly through impacts on livelihoods, reductions in crop yields, or destruction of homes and indirectly through, for example, increased food prices and food insecurity.” [37]
Carbon dioxide in particular has unique impacts on ocean ecosystems. The NRC Climate Stabilization Targets assessment found that coral bleaching will increase due both to warming and ocean acidification. Ocean surface waters have already become 30 percent more acidic over the past 250 years due to absorption of CO2
from the atmosphere. According to the NCA3, this acidification will reduce the ability of organisms such as corals, krill, oysters, clams, and crabs to survive, grow, and reproduce. The NRC Understanding Earth's Deep Past assessment notes four of the five major coral reef crises of the past 500 million years were caused by acidification and warming that followed GHG increases of similar magnitude to the emissions increases expected over the next hundred years. The NRC Abrupt Impacts assessment specifically highlighted similarities between the projections for future acidification and warming and the extinction at the end of the Permian which resulted in the loss of an estimated 90 percent of known species. Similarly, the NRC Ocean Acidification assessment finds that “[t]he chemistry of the ocean is changing at an unprecedented rate and magnitude due to anthropogenic carbon dioxide emissions; the rate of change exceeds any known to have occurred for at least the past hundreds of thousands of years.” [38]
The assessment notes that the full range of consequences is still unknown, but the risks “threaten coral reefs, fisheries, protected species, and other natural resources of value to society.” [39]
Events outside the U.S., as also pointed out in the 2009 Endangerment Finding, will also have relevant consequences. The NRC Climate and Social Stress assessment concluded that it is prudent to expect that some climate events “will produce consequences that exceed the capacity of the affected societies or global systems to manage and that have global security implications serious enough to compel international response.” The NRC National Security Implications assessment recommends preparing for increased needs for humanitarian aid; responding to the effects of climate change in geopolitical hotspots, including possible mass migrations; and addressing changing security needs in the Arctic as sea ice retreats.
In addition to future impacts, the NCA3 emphasizes that climate change driven by human emissions of GHGs is already happening now and it is happening in the U.S. According to the IPCC AR5 and the NCA3, there are a number of climate-related changes that have been observed recently, and these changes are projected to accelerate in the future. The planet warmed about 0.85 °C (1.5 °F) from 1880 to 2012. It is extremely likely (>95 percent probability) that human influence was the dominant cause of the observed warming since the mid-20th century, and likely (>66 percent probability) that human influence has more than doubled the probability of occurrence of heat waves in some locations. In the Northern Hemisphere, the last 30 years were likely the warmest 30 year period of the last 1400 years. U.S. average temperatures have similarly increased by 1.3 to 1.9 degrees F since 1895, with most of that increase occurring since 1970. Global sea levels rose 0.19 m (7.5 inches) from 1901 to 2010. Contributing to this rise was the warming of the oceans and melting of land ice. It is likely that 275 gigatons per year of ice melted from land glaciers (not including ice sheets) since 1993, and that the rate of loss of ice from the Greenland and Antarctic ice sheets increased substantially in recent years, to 215 gigatons per year and 147 gigatons per year respectively since 2002. For context, 360 gigatons of ice melt is sufficient to cause global sea levels to rise 1 mm. Annual mean Arctic sea ice has been declining at 3.5 to 4.1 percent per decade, and Northern Hemisphere snow cover extent has decreased at about 1.6 percent per decade for March and 11.7 percent per decade for June. Permafrost temperatures have increased in most regions since the 1980s, by up to 3 °C (5.4 °F) in parts of Northern Alaska. Winter storm frequency and intensity have both increased in the Northern Hemisphere. The NCA3 states that the increases in the severity or frequency of some types of extreme weather and climate events in recent decades can affect energy production
( printed page 64686)
and delivery, causing supply disruptions, and compromise other essential infrastructure such as water and transportation systems.
In addition to the changes documented in the assessment literature, there have been other climate milestones of note. In 2009, the year of the Endangerment Finding, the average concentration of CO2
as measured on top of Mauna Loa was 387 parts per million, far above preindustrial concentrations of about 280 parts per million.[40]
The average concentration in 2013, the last full year before this rule was proposed, was 396 parts per million. The average concentration in 2014 was 399 parts per million. And the monthly concentration in April of 2014 was 401 parts per million, the first time a monthly average has exceeded 400 parts per million since record keeping began at Mauna Loa in 1958, and for at least the past 800,000 years.[41]
Arctic sea ice has continued to decline, with September of 2012 marking a new record low in terms of Arctic sea ice extent, 40 percent below the 1979-2000 median. Sea level has continued to rise at a rate of 3.2 mm per year (1.3 inches/decade) since satellite observations started in 1993, more than twice the average rate of rise in the 20th century prior to 1993.[42]
And 2014 was the warmest year globally in the modern global surface temperature record, going back to 1880; this now means 19 of the 20 warmest years have occurred in the past 20 years, and except for 1998, the ten warmest years on record have occurred since 2002.[43]
The first months of 2015 have also been some of the warmest on record.
These assessments and observed changes make it clear that reducing emissions of GHGs across the globe is necessary in order to avoid the worst impacts of climate change, and underscore the urgency of reducing emissions now. The NRC Committee on America's Climate Choices listed a number of reasons “why it is imprudent to delay actions that at least begin the process of substantially reducing emissions.” [44]
For example:
The faster emissions are reduced, the lower the risks posed by climate change. Delays in reducing emissions could commit the planet to a wide range of adverse impacts, especially if the sensitivity of the climate to GHGs is on the higher end of the estimated range.
Waiting for unacceptable impacts to occur before taking action is imprudent because the effects of GHG emissions do not fully manifest themselves for decades and, once manifest, many of these changes will persist for hundreds or even thousands of years.
In the committee's judgment, the risks associated with doing business as usual are a much greater concern than the risks associated with engaging in strong response efforts.
4. Observed and Projected U.S. Regional Changes
The NCA3 assessed the climate impacts in 8 regions of the U.S., noting that changes in physical climate parameters such as temperatures, precipitation, and sea ice retreat were already having impacts on forests, water supplies, ecosystems, flooding, heat waves, and air quality. Moreover, the NCA3 found that future warming is projected to be much larger than recent observed variations in temperature, with precipitation likely to increase in the northern states, decrease in the southern states, and with the heaviest precipitation events projected to increase everywhere.
In the Northeast, temperatures increased almost 2 °F from 1895 to 2011, precipitation increased by about 5 inches (10 percent), and sea level rise of about a foot has led to an increase in coastal flooding. The 70 percent increase in the amount of rainfall falling in the 1 percent of the most intense events is a larger increase in extreme precipitation than experienced in any other U.S. region.
In the future, if emissions continue increasing, the Northeast is expected to experience 4.5 to 10 °F of warming by the 2080s. This will lead to more heat waves, coastal and river flooding, and intense precipitation events. The southern portion of the region is projected to see 60 additional days per year above 90 °F by mid-century. Sea levels in the Northeast are expected to increase faster than the global average because of subsidence, and changing ocean currents may further increase the rate of sea level rise. Specific vulnerabilities highlighted by the NCA include large urban populations particularly vulnerable to climate-related heat waves and poor air quality episodes, prevalence of climate sensitive vector-borne diseases like Lyme and West Nile Virus, usage of combined sewer systems that may lead to untreated water being released into local water bodies after climate-related heavy precipitation events, and 1.6 million people living within the 100-year coastal flood zone who are expected to experience more frequent floods due to sea level rise and tropical-storm induced storm-surge. The NCA also highlighted infrastructure vulnerable to inundation in coastal metropolitan areas, potential agricultural impacts from increased rain in the spring delaying planting or damaging crops or increased heat in the summer leading to decreased yields and increased water demand, and shifts in ecosystems leading to declines in iconic species in some regions, such as cod and lobster south of Cape Cod.
In the Southeast, average annual temperature during the last century cycled between warm and cool periods. A warm peak occurred during the 1930s and 1940s followed by a cool period and temperatures then increased again from 1970 to the present by an average of 2 °F. There have been increasing numbers of days above 95 °F and nights above 75 °F, and decreasing numbers of extremely cold days since 1970. Daily and five-day rainfall intensities have also increased, and summers have been either increasingly dry or extremely wet. Louisiana has already lost 1,880 square miles of land in the last 80 years due to sea level rise and other contributing factors.
The Southeast is exceptionally vulnerable to sea level rise, extreme heat events, hurricanes, and decreased water availability. Major consequences of further warming include significant increases in the number of hot days (95 °F or above) and decreases in freezing events, as well as exacerbated ground-level ozone in urban areas. Although projected warming for some parts of the region by the year 2100 are generally smaller than for other regions of the U.S., projected warming for interior states of the region are larger than coastal regions by 1 °F to 2 °F. Projections further suggest that globally there will be fewer tropical storms, but that they will be more intense, with more Category 4 and 5 storms. The NCA identified New Orleans, Miami, Tampa, Charleston, and Virginia Beach as being specific cities that are at risk due to sea level rise, with homes and infrastructure increasingly prone to flooding. Additional impacts of sea level rise are expected for coastal highways, wetlands, fresh water supplies, and energy infrastructure.
In the Northwest, temperatures increased by about 1.3 °F between 1895 and 2011. A small average increase in precipitation was observed over this time period. However, warming temperatures have caused increased rainfall relative to snowfall, which has
( printed page 64687)
altered water availability from snowpack across parts of the region. Snowpack in the Northwest is an important freshwater source for the region. More precipitation falling as rain instead of snow has reduced the snowpack, and warmer springs have corresponded to earlier snowpack melting and reduced streamflows during summer months. Drier conditions have increased the extent of wildfires in the region.
Average annual temperatures are projected to increase by 3.3 °F to 9.7 °F by the end of the century (depending on future global GHG emissions), with the greatest warming expected during the summer. Continued increases in global GHG emissions are projected to result in up to a 30 percent decrease in summer precipitation. Earlier snowpack melt and lower summer stream flows are expected by the end of the century and will affect drinking water supplies, agriculture, ecosystems, and hydropower production. Warmer waters are expected to increase disease and mortality in important fish species, including Chinook and sockeye salmon. Ocean acidification also threatens species such as oysters, with the Northwest coastal waters already being some of the most acidified worldwide due to coastal upwelling and other local factors. Forest pests are expected to spread and wildfires burn larger areas. Other high-elevation ecosystems are projected to be lost because they can no longer survive the climatic conditions. Low lying coastal areas, including the cities of Seattle and Olympia, will experience heightened risks of sea level rise, erosion, seawater inundation and damage to infrastructure and coastal ecosystems.
In Alaska, temperatures have changed faster than anywhere else in the U.S. Annual temperatures increased by about 3 °F in the past 60 years. Warming in the winter has been even greater, rising by an average of 6 °F. Arctic sea ice is thinning and shrinking in area, with the summer minimum ice extent now covering only half the area it did when satellite records began in 1979. Glaciers in Alaska are melting at some of the fastest rates on Earth. Permafrost soils are also warming and beginning to thaw. Drier conditions have contributed to more large wildfires in the last 10 years than in any previous decade since the 1940s, when recordkeeping began. Climate change impacts are harming the health, safety and livelihoods of Native Alaskan communities.
By the end of this century, continued increases in GHG emissions are expected to increase temperatures by 10 to 12 °F in the northernmost parts of Alaska, by 8 to 10 °F in the interior, and by 6 to 8 °F across the rest of the state. These increases will exacerbate ongoing arctic sea ice loss, glacial melt, permafrost thaw and increased wildfire, and threaten humans, ecosystems, and infrastructure. Precipitation is expected to increase to varying degrees across the state, however warmer air temperatures and a longer growing season are expected to result in drier conditions. Native Alaskans are expected to experience declines in economically, nutritionally, and culturally important wildlife and plant species. Health threats will also increase, including loss of clean water, saltwater intrusion, sewage contamination from thawing permafrost, and northward extension of diseases. Wildfires will increasingly pose threats to human health as a result of smoke and direct contact. Areas underlain by ice-rich permafrost across the state are likely to experience ground subsidence and extensive damage to infrastructure as the permafrost thaws. Important ecosystems will continue to be affected. Surface waters and wetlands that are drying provide breeding habitat for millions of waterfowl and shorebirds that winter in the lower 48 states. Warmer ocean temperatures, acidification, and declining sea ice will contribute to changes in the location and availability of commercially and culturally important marine fish.
In the Southwest, temperatures are now about 2 °F higher than the past century, and are already the warmest that region has experienced in at least 600 years. The NCA notes that there is evidence that climate-change induced warming on top of recent drought has influenced tree mortality, wildfire frequency and area, and forest insect outbreaks. Sea levels have risen about 7 or 8 inches in this region, contributing to inundation of Highway 101 and backup of seawater into sewage systems in the San Francisco area.
Projections indicate that the Southwest will warm an additional 5.5 to 9.5 °F over the next century if emissions continue to increase. Winter snowpack in the Southwest is projected to decline (consistent with the record lows from this past winter), reducing the reliability of surface water supplies for cities, agriculture, cooling for power plants, and ecosystems. Sea level rise along the California coast will worsen coastal erosion, increase flooding risk for coastal highways, bridges, and low-lying airports, pose a threat to groundwater supplies in coastal cities such as Los Angeles, and increase vulnerability to floods for hundreds of thousands of residents in coastal areas. Climate change will also have impacts on the high-value specialty crops grown in the region as a drier climate will increase demands for irrigation, more frequent heat waves will reduce yields, and decreased winter chills may impair fruit and nut production for trees in California. Increased drought, higher temperatures, and bark beetle outbreaks are likely to contribute to continued increases in wildfires. The highly urbanized population of the Southwest is vulnerable to heat waves and water supply disruptions, which can be exacerbated in cases where high use of air conditioning triggers energy system failures.
The rate of warming in the Midwest has markedly accelerated over the past few decades. Temperatures rose by more than 1.5 °F from 1900 to 2010, but between 1980 and 2010 the rate of warming was three times faster than from 1900 through 2010.
Precipitation generally increased over the last century, with much of the increase driven by intensification of the heaviest rainfalls. Several types of extreme weather events in the Midwest (
e.g.,
heat waves and flooding) have already increased in frequency and/or intensity due to climate change.
In the future, if emissions continue increasing, the Midwest is expected to experience 5.6 to 8.5 °F of warming by the 2080s, leading to more heat waves. Though projections of changes in total precipitation vary across the regions, more precipitation is expected to fall in the form of heavy downpours across the entire region, leading to an increase in flooding. Specific vulnerabilities highlighted by the NCA include long-term decreases in agricultural productivity, changes in the composition of the region's forests, increased public health threats from heat waves and degraded air and water quality, negative impacts on transportation and other infrastructure associated with extreme rainfall events and flooding, and risks to the Great Lakes including shifts in invasive species, increases in harmful algal blooms, and declining beach health.
High temperatures (more than 100 °F in the Southern Plains and more than 95 °F in the Northern Plains) are projected to occur much more frequently by mid-century. Increases in extreme heat will increase heat stress for residents, energy demand for air conditioning, and water losses. North Dakota's increase in annual temperatures over the past 130 years is the fastest in the contiguous U.S., mainly driven by warming winters. Specific vulnerabilities highlighted by the NCA include increased demand for water and energy, changes to crop growth cycles and
( printed page 64688)
agricultural practices, and negative impacts on local plant and animal species from habitat fragmentation, wildfires, and changes in the timing of flowering or pest patterns. Communities that are already the most vulnerable to weather and climate extremes will be stressed even further by more frequent extreme events occurring within an already highly variable climate system.
In Hawaii, other Pacific islands, and the Caribbean, rising air and ocean temperatures, shifting rainfall patterns, changing frequencies and intensities of storms and drought, decreasing baseflow in streams, rising sea levels, and changing ocean chemistry will affect ecosystems on land and in the oceans, as well as local communities, livelihoods, and cultures. Low islands are particularly at risk.
Rising sea levels, coupled with high water levels caused by tropical and extra-tropical storms, will incrementally increase coastal flooding and erosion, damaging coastal ecosystems, infrastructure, and agriculture, and negatively affecting tourism. Ocean temperatures in the Pacific region exhibit strong year-to-year and decadal fluctuations, but since the 1950s, they have exhibited a warming trend, with temperatures from the surface to a depth of 660 feet rising by as much as 3.6 °F. As a result of current sea level rise, the coastline of Puerto Rico around Rincón is being eroded at a rate of 3.3 feet per year. Freshwater supplies are already constrained and will become more limited on many islands. Saltwater intrusion associated with sea level rise will reduce the quantity and quality of freshwater in coastal aquifers, especially on low islands. In areas where precipitation does not increase, freshwater supplies will be adversely affected as air temperature rises.
Warmer oceans are leading to increased coral bleaching events and disease outbreaks in coral reefs, as well as changed distribution patterns of tuna fisheries. Ocean acidification will reduce coral growth and health. Warming and acidification, combined with existing stresses, will strongly affect coral reef fish communities. For Hawaii and the Pacific islands, future sea surface temperatures are projected to increase 2.3 °F by 2055 and 4.7 °F by 2090 under a scenario that assumes continued increases in emissions. Ocean acidification is also taking place in the region, which adds to ecosystem stress from increasing temperatures. Ocean acidity has increased by about 30 percent since the pre-industrial era and is projected to further increase by 37 percent to 50 percent from present levels by 2100.
The NCA also discussed impacts that occur along the coasts and in the oceans adjacent to many regions, and noted that other impacts occur across regions and landscapes in ways that do not follow political boundaries.
Fossil fuel-fired electric utility generating units (EGUs) are by far the largest emitters of GHGs among stationary sources in the U.S., primarily in the form of CO2
, and among fossil fuel-fired EGUs, coal-fired units are by far the largest emitters. This section describes the amounts of these emissions and places these amounts in the context of the U.S. Inventory of Greenhouse Gas Emissions and Sinks [46]
(the U.S. GHG Inventory).
The EPA implements a separate program under 40 CFR part 98 called the Greenhouse Gas Reporting Program [47]
(GHGRP) that requires emitting facilities over threshold amounts of GHGs to report their emissions to the EPA annually. Using data from the GHGRP, this section also places emissions from fossil fuel-fired EGUs in the context of the total emissions reported to the GHGRP from facilities in the other largest-emitting industries.
The EPA prepares the official U.S. GHG Inventory to comply with commitments under the United Nations Framework Convention on Climate Change (UNFCCC). This inventory, which includes recent trends, is organized by industrial sectors. It provides the information in Table 3 below, which presents total U.S. anthropogenic
emissions and sinks [48]
of GHGs, including CO2
emissions, for the years 1990, 2005 and 2013.
Table 3—U.S. GHG Emissions and Sinks by Sector
[Million metric tons carbon dioxide equivalent (MMT CO2
Eq.)] 49
Sector
1990
2005
2013
Energy 50
5,290.5
6,273.6
5,636.6
Industrial Processes and Product Use
342.1
367.4
359.1
Agriculture
448.7
494.5
515.7
Land Use, Land-Use Change and Forestry
13.8
25.5
23.3
Waste
206.0
189.2
138.3
Total Emissions
6,301.1
7,350.2
6,673.0
Land Use, Land-Use Change and Forestry (Sinks)
(775.8)
(911.9)
(881.7)
Net Emissions (Sources and Sinks)
5,525.2
6,438.3
5,791.2
Total fossil energy-related CO2
emissions (including both stationary and mobile sources) are the largest contributor to total U.S. GHG emissions, representing 77.3 percent of total 2013 GHG emissions.[51]
In 2013, fossil fuel
( printed page 64689)
combustion by the utility power sector—entities that burn fossil fuel and whose primary business is the generation of electricity—accounted for 38.3 percent of all energy-related CO2
emissions.[52]
Table 4 below presents total CO2
emissions from fossil fuel-fired EGUs, for years 1990, 2005 and 2013.
Table 4—U.S. GHG Emissions From Generation of Electricity From Combustion of Fossil Fuels
[MMT CO2
] 53
GHG emissions
1990
2005
2013
Total CO2
from fossil fuel-fired EGUs
1,820.8
2,400.9
2,039.8
—from coal
1,547.6
1,983.8
1,575.0
—from natural gas
175.3
318.8
441.9
—from petroleum
97.5
97.9
22.4
In
addition to preparing the official U.S. GHG Inventory to present comprehensive total U.S. GHG emissions and comply with commitments under the UNFCCC, the EPA collects detailed GHG emissions data from the largest emitting facilities in the U.S. through its Greenhouse Gas Reporting Program (GHGRP). Data collected by the GHGRP from large stationary sources in the industrial sector show that the utility power sector emits far greater CO2
emissions than any other industrial sector. Table 5 below presents total GHG emissions in 2013 for the largest emitting industrial sectors as reported to the GHGRP. As shown in Table 4 and Table 5, respectively, CO2
emissions from fossil fuel-fired EGUs are nearly three times as large as the total reported GHG emissions from the next ten largest emitting industrial sectors in the GHGRP database combined.
Table 5—Direct GHG Emissions Reported to GHGRP by Largest Emitting Industrial Sectors
[MMT CO2e
] 54
Industrial sector
2013
Petroleum Refineries
176.7
Onshore Oil & Gas Production
94.8
Municipal Solid Waste Landfills
93.0
Iron & Steel Production
84.2
Cement Production
62.8
Natural Gas Processing Plants
59.0
Petrochemical Production
52.7
Hydrogen Production
41.9
Underground Coal Mines
39.8
Food Processing Facilities
30.8
C. Challenges in Controlling Carbon Dioxide Emissions
Carbon
dioxide is a unique air pollutant and controlling it presents unique challenges. CO2
is emitted in enormous quantities, and those quantities, coupled with the fact that CO2
is relatively unreactive, make it much more difficult to mitigate by measures or technologies that are typically utilized within an existing power plant. Measures that may be used to limit CO2
emissions would include efficiency improvements, which have thermodynamic limitations and carbon capture and sequestration (CCS), which is energy resource intensive.
Unlike other air pollutants which are results of trace impurities in the fuel, products of incomplete or inefficient combustion, or combustion byproducts, CO2
is an inherent product of clean, efficient combustion of fossil fuels, and therefore is an unavoidable product generated in enormous quantities, far greater than any other air pollutant.[55]
In fact, CO2
is emitted in far greater quantities than all other air pollutants
combined.
Total emissions of all non-GHG air pollutants in the U.S., from all sources, in 2013, were 121 million metric tons.[56 57]
As noted above, total emissions of CO2
from coal-fired power plants alone—the largest stationary source emitter—were 1.575 billion metric tons in that year,[58]
and total emissions of CO2
from all sources were 5.5 billion metric tons.[59 60]
Carbon makes up the majority of the mass of coal and other fossil fuels, and for every ton of carbon burned, more than 3 tons of CO2
is produced.[61]
In addition, unlike many of the other air pollutants that react with sunlight or chemicals in the atmosphere, or are rained out or deposited on surfaces, CO2
is relatively unreactive and difficult to remove directly from the atmosphere.[62 63]
CO2
's huge quantities and lack of reactivity make it challenging to remove from the smokestack. Retrofitted equipment is required to capture the CO2
before transporting it to a storage site. However, the scale of infrastructure required to directly mitigate CO2
emissions from existing EGUs through CCS can be quite large and difficult to integrate into the existing fossil fuel infrastructure. These CCS techniques are discussed in more depth elsewhere in the preamble for this rule and for the section 111(b) rule for new sources that accompanies this rule.
The properties of CO2
can be contrasted with those of a number of other pollutants which have more accessible mitigation options. For example, the NAAQS pollutants—which generally are emitted in the largest quantities of any of the other air pollutants, except for CO2
—each have more accessible mitigation options. Sulfur dioxide (SO2) is the result of a contaminant in the fuel, and, as a result, it can be reduced by using low-sulfur coal or by using flue-gas desulfurization (FGD) technologies. Emissions of NOX
can be mitigated relatively easily using combustion control techniques (
e.g.,
low-NOX
burners) and by using downstream controls such as selective catalytic reduction (SCR) and selective non-catalytic reduction (SNCR) technologies. PM can be effectively mitigated using fabric filters, PM scrubbers, or electrostatic precipitators. Lead is part of particulate matter emissions and is controlled through the same devices. Carbon monoxide and VOCs are the products of incomplete combustion and can therefore be abated by more efficient combustion conditions, and can also be destroyed in the smokestack by the use of oxidation catalysts which complete the combustion process. Many air toxics are VOCs, such as polyaromatic hydrocarbons, and therefore can be abated in the same ways just described. But in every case, these pollutants can be controlled at the source much more readily than CO2
primarily because of the comparatively lower quantities that are produced, and also due to other attributes such as relatively greater reactivity and solubility.
D. The Utility Power Sector
1. A Brief History
The modern American electricity system is one of the greatest engineering achievements of the past 100 years. Since the invention of the incandescent light bulb in the 1870s,[64]
electricity has become one of the major foundations for modern American life. Beginning with the first power station in New York City in 1882, each power station initially served a discrete set of consumers, resulting in small and localized electricity systems.[65]
During the early 1900s, smaller systems consolidated, allowing generation resources to be shared over larger areas. Interconnecting systems have reduced generation investment costs and improved reliability.[66]
Local and state governments initially regulated these growing electricity systems with federal regulation coming later in response to public concerns about rising electricity costs.[67]
Initially, states had broad authority to regulate public utilities, but gradually federal regulation increased. In 1920, Congress passed the Federal Water Power Act, creating the Federal Power Commission (FPC) and providing for the licensing of hydroelectric facilities on U.S. government lands and navigable waters of the U.S.[68]
During this time period, the U.S. Supreme Court found that state authority to regulate public utilities is limited, holding that the Commerce Clause does not allow state regulation to directly burden interstate commerce.[69]
For example, in
Public Utilities Commission of Rhode Island
v.
Attleboro Steam & Electric Company,
Rhode Island sought to regulate the electricity rates that a Rhode Island generator was charging to a company in Massachusetts that resold the electricity to Attleboro, Massachusetts.[70]
The Supreme Court found that Rhode Island's regulation was impermissible because it imposed a “direct burden upon interstate commerce.” [71]
The Supreme Court held that this kind of interstate transaction was not subject to state regulation. However, because Congress had not yet passed legislation to make these types of transactions subject to federal regulation, this became known as the “
Attleboro
gap” in regulation. In 1935, Congress passed the Federal Power Act (FPA), giving the FPC jurisdiction over “the transmission of electric energy in interstate commerce” and “the sale of electric energy at wholesale in interstate commerce.” [72]
Under FPA section 205, the FPC was tasked with ensuring that rates for jurisdictional services are just, reasonable, and not unduly discriminatory or preferential.[73]
FPA section 206 authorized the FPC to determine, after a hearing upon its own motion or in response to a complaint
( printed page 64691)
filed at the Commission, whether jurisdictional rates are just, reasonable, and not unduly discriminatory or preferential.[74]
In 1938, Congress passed the Natural Gas Act (NGA), giving the FPC jurisdiction over the transmission or sale of natural gas in interstate commerce.[75]
The NGA also gave the FPC the jurisdiction to “grant certificates allowing construction and operation of facilities used in interstate gas transmission and authorizing the provision of services.” [76]
In 1977, the FPC became FERC after Congress passed the Department of Energy Organization Act.
By the 1930s, regulated electric utilities that provided the major components of the electrical system—generation, transmission, and distribution—were common.[77]
These regulated monopolies are referred to as vertically-integrated utilities.
As utilities built larger and larger electric generation plants, the cost per unit to generate electricity decreased.[78]
However, these larger plants were extremely capital intensive for any one company to fund.[79]
Some neighboring utilities solved this issue by agreeing to share electricity reserves when needed.[80]
These utilities began building larger transmission lines to deliver power in times when large generators experienced outages.[81]
Eventually, some utilities that were in reserve sharing agreements formed electric power pools to balance electric load over a larger area. Participating utilities gave control over scheduling and dispatch of their electric generation units to a system operator.[82]
Some power pools evolved into today's RTOs and ISOs.
In the past, electric utilities generally operated as state regulated monopolies, supplying end-use customers with generation, distribution, and transmission service.[83]
However, the ability of electric utilities to operate as natural monopolies came with consumer protection safeguards.[84]
“In exchange for a franchised, monopoly service area, utilities accept an obligation to serve—meaning there must be adequate supply to meet customers' needs regardless of the cost.” [85]
Under this obligation to serve, the utility agreed to provide service to any customer located within its service jurisdiction.
On both a federal and state level, competition has entered the electricity sector to varying degrees in the last few decades.[86]
In the early 1990s, some states began to consider allowing competition to enter retail electric service.[87]
Federal and state efforts to allow competition in the electric utility industry have resulted in independent power producers (IPPs) [88]
producing approximately 37 percent of net generation in 2013.[89]
Electric utilities in some states remain vertically integrated without retail competition from IPPs. Today, there are over 3,000 public, private, and cooperative utilities in the U.S.[90]
These utilities include both investor-owned utilities [91]
and consumer-owned utilities.[92]
Over time, the grid slowly evolved into a complex, interconnected transmission system that allows electric generators to produce electricity that is then fed onto transmission lines at high voltages.[93]
These larger transmission lines are able to access generation that is located more remotely, with transmission lines crossing many miles, including state borders.[94]
Closer to end users, electricity is transformed into a lower voltage that is transported across
( printed page 64692)
localized transmission lines to homes and businesses.[95]
Localized transmission lines make up the distribution system. These three components of the electricity system—generation, transmission, and distribution—are closely related and must work in coordination to deliver electricity from the point of generation to the point of consumption. This interconnectedness is a fundamental aspect of the nation's electricity system, requiring a complicated integration of all components of the system to balance supply and demand and a federal, state, and local regulatory network to oversee the physically interconnected network. Facilities planned and constructed in one segment can impact facilities and operations in other segments and vice versa.
The North American electric grid has developed into a large, interconnected system.[96]
Electricity from a diverse set of generation resources such as natural gas, nuclear, coal, and renewables is distributed over high-voltage transmission lines divided across the continental U.S. into three synchronous interconnections—the Eastern Interconnection, Western Interconnection, and the Texas Interconnection.[97]
These three synchronous systems each act like a single machine.[98]
Diverse resources generate electricity that is transmitted and distributed through a complex system of interconnected components to industrial, business, and residential consumers. Unlike other industries where sources make operational decisions independently, the utility power sector is unique in that electricity system resources operate in a complex, interconnected grid system that is physically interconnected and operated on an integrated basis across large regions. Additionally, a federal, state, and local regulatory network oversees policies and practices that are applied to how the system is designed and operates. In this interconnected system, system operators must ensure that the amount of electricity available is precisely matched with the amount needed in real time. System operators have a number of resources potentially available to meet electricity demand, including electricity generated by electric generation units such as coal, nuclear, renewables, and natural gas, as well as demand-side resources,[99]
such as EE [100]
and demand response.[101]
Generation, outages, and transmission changes in one part of the synchronous grid can affect the entire interconnected grid.[102]
The interconnection is such that “[i]f a generator is lost in New York City, its affect is felt in Georgia, Florida, Minneapolis, St. Louis, and New Orleans.” [103]
The U.S. Supreme Court has similarly recognized the interconnected nature of the electricity grid.[104]
Today, federal, state, and local entities regulate electricity providers.[105]
Overlaid on the physical electricity network is a regulatory network that has developed over the last century or more. This regulatory network “plays a vital role in the functioning of all other networks, sometimes providing specific rules for functioning while at other times providing restraints within which their operation must be conducted.” [106]
This unique regulatory network results in an electricity grid that is both physically interconnected and connected through a network of regulation on the local, state, and federal levels. This regulation seeks to reconcile the fact that electricity is a public good with the fact that facilities providing that electricity are privately owned.[107]
While this regulation began on the state and local levels, federal regulation of the electricity system increased over time. With the passage of the EPAct 1992 and the EPAct 2005, the federal government's role in electricity regulation greatly increased.[108]
“The role of the regulator now includes support for the development of open
( printed page 64693)
and fair wholesale electric markets, ensuring equal access to the transmission system and more hands-on oversight and control of the planning and operating rules for the industry.” [109]
2. Electric System Dispatch
System operators typically dispatch the electric system through a process known as Security Constrained Economic Dispatch.[110]
Security Constrained Economic Dispatch has two components—economic generation of generation facilities and ensuring that the electric system remains reliable.[111]
Electricity demand varies across geography and time in response to numerous conditions, such that electric generators are constantly responding to changes in the most reliable and cost-effective manner possible. The cost of operating electric generation varies based on a number of factors, such as fuel and generator efficiency.
The decision to dispatch any particular electric generator depends upon the relative operating cost, or marginal cost, of generating electricity to meet the last increment of electric demand. Fuel is one common variable cost—especially for fossil-fueled generators. Coal plants will often have considerable variable costs associated with running pollution controls.[112]
Renewables, hydroelectric, and nuclear have little to no variable costs. If electricity demand decreases or additional generation becomes available on the system, this impacts how the system operator will dispatch the system. EGUs using technologies with relatively low variable costs, such as nuclear units and RE, are for economic reasons generally operated at their maximum output whenever they are available. When lower cost units are available to run, higher variable cost units, such as fossil-fuel generators, are generally the first to be displaced.
In states with cost-of-service regulation of vertically-integrated utilities, the utilities themselves form the balancing authorities who determine dispatch based upon the lowest marginal cost. These utilities sometimes arrange to buy and sell electricity with other balancing authorities. RTOs and ISOs coordinate, control, and monitor electricity transmission systems to ensure cost-effective and reliable delivery of power, and they are independent from market participants.
3. Reliability Considerations
The reliability of the electric system has long been a focus of the electric industry and regulators. Industry developed a voluntary organization in the early 1960s that assisted with bulk power system coordination in the U.S. and Canada.[113]
In 1965, the northeastern U.S. and southeastern Ontario, Canada experienced the largest power blackout to date, impacting 30 million people.[114]
In response to the 1965 blackout and a Federal Power Commission recommendation,[115]
industry developed the National Electric Reliability Council (NERC) and nine reliability councils. The organization later became known as the North American Electric Reliability Council to recognize Canada's participation.[116]
The North American Electric Reliability Council became the North American Electric Reliability Corporation in 2007.[117]
In August 2003, North America experienced its worst blackout to date creating an outage in the Midwest, Northeast, and Ontario, Canada.[118]
This blackout was massive in scale impacting an area with an estimated 50 million people and 61,800 megawatts of electric load.[119]
The U.S. and Canada formed a joint task force to investigate the causes of the blackout and made recommendations to avoid similar outages in the future. One of the task force's major recommendations was that the U.S. Congress should pass legislation making electric reliability standards mandatory and enforceable.[120]
Congress responded to this recommendation in EPAct 2005, adding a new section 215 to the Federal Power Act making reliability standards mandatory and enforceable and authorizing the creation of a new Electric Reliability Organization (ERO). Under this new system, FERC certifies an entity as the ERO. The ERO develops reliability standards, which are subject to FERC review and approval. Once FERC approves reliability standards the ERO may enforce those standards or FERC can do so independently.[121]
In 2006, the Federal Energy Regulatory Commission (FERC) certified NERC as the ERO.[122]
“NERC develops and enforces Reliability Standards; monitors the Bulk-Power System; assesses adequacy annually via a 10-year forecast and winter and summer forecasts; audits owners, operators and users for preparedness; and educates and trains industry personnel.” [123]
The U.S., Canada, and part of Mexico are divided up into eight reliability
( printed page 64694)
regional entities.[124]
These regional entities include Florida Reliability Coordinating Council (FRCC), Midwest Reliability Organization (MRO), Northeast Power Coordinating Council (NPCC), Reliability First Corporation (RFC), SERC Reliability Corporation (SERC), Southwest Power Pool, RE (SPP), Texas Reliability Entity (TRE), and Western Electricity Coordinating Council (WECC).[125]
Regional entity members come from all segments of the electric industry.[126]
NERC delegates authority, with FERC approval, to these regional entities to enforce reliability standards, both national and regional reliability standards, and engage in other standards-related duties delegated to them by NERC.[127]
NERC ensures that there is a consistency of application of delegated functions with appropriate regional flexibility.[128]
NERC divides the country into assessment areas and annually analyzes the reliability, adequacy, and associated risks that may affect the upcoming summer, winter, and long-term, 10-year period. Multiple other entities such as FERC, the Department of Energy, state public utility commissions, ISOs/RTOs,[129]
and other planning authorities also consider the reliability of the electric system. There are numerous remedies that can be utilized to solve a potential reliability problem, including long-term planning, transmission system upgrades, installation of new generating capacity, demand response, and other demand side actions.
4. Modern Electric System Trends
Today, the electricity sector is undergoing a period of intense change. Fossil fuels—such as coal, natural gas, and oil—have historically provided a large percentage of electricity in the U.S., along with nuclear power, with smaller amounts provided by other types of generation, including renewables such as wind, solar, and hydroelectric power. Coal provided the largest percentage of the fossil fuel generation.[130]
In recent years, the nation has seen a sizeable increase in renewable generation such as wind and solar, as well as a shift from coal to natural gas.[131]
In 2013, fossil fuels supplied 67 percent of U.S. electricity,[132]
but the amount of renewable generation capacity continued to grow.[133]
From 2007 to 2014, use of lower- and zero-carbon energy sources such as wind and solar grew, while other major energy sources such as coal and petroleum generally experienced declines.[134]
Renewable electricity generation, including from large hydro-electric projects, grew from 8 percent to 13 percent over that time period.[135]
Between 2000 and 2013, approximately 90 percent of new power generation capacity built in the U.S. came in the form of natural gas or RE facilities.[136]
In 2015, the U.S. Energy Information Administration (EIA) projected the need for 28.4 GW of additional base load or intermediate load generation capacity through 2020.[137]
The vast majority of this new electric capacity (20.4 GW) is already under development (under construction or in advanced planning), with approximately 0.7 GW of new coal-fired capacity, 5.5 GW of new nuclear capacity, and 14.2 GW of new NGCC capacity already in development.
While the change in the resource mix has accelerated in recent years, wind, solar, other renewables, and EEresources have been reliably participating in the electric sector for a number of years. This rapid development of non-fossil fuel resources is occurring as much of the existing power generation fleet in the U.S. is aging and in need of modernization and replacement. In 2025, the average age of the coal-fired generating fleet is projected to be 49 years old, and 20 percent of those units would be more than 60 years old if they remain in operation at that time. In its
2013 Report Card for America's Infrastructure,
the American Society for Civil Engineers noted that “America relies on an aging electrical grid and pipeline distribution systems, some of which originated in the 1880s.” [138]
While there has been an
( printed page 64695)
increased investment in electric transmission infrastructure since 2005, the report also found that “ongoing permitting issues, weather events, and limited maintenance have contributed to an increasing number of failures and power interruptions.” [139]
However, innovative technologies have increasingly entered the electric energy space, helping to provide new answers to how to meet the electricity needs of the nation. These new technologies can enable the nation to answer not just questions as to how to reliably meet electricity demand, but also how to meet electricity demand reliably and cost-effectively with the lowest possible emissions and the greatest efficiency.
Natural gas has a long history of meeting electricity demand in the U.S., with a rapidly growing role as domestic supplies of natural gas have dramatically increased. Natural gas net generation increased by approximately 32 percent between 2005 and 2014.[140]
In 2014, natural gas accounted for approximately 27 percent of net generation.[141]
EIA projects that this demand growth will continue with its
Annual Energy Outlook 2015
(AEO 2015) Reference case forecasting that natural gas will produce 31 percent of U.S. electric generation in 2040.[142]
Renewable sources of electric generation also have a history of meeting electricity demand in the U.S. and are expected to have an increasing role going forward. A series of energy crises provided the impetus for RE development in the early 1970s. The OPEC oil embargo in 1973 and oil crisis of 1979 caused oil price spikes, more frequent energy shortages, and significantly affected the national and global economy. In 1978, partly in response to fuel security concerns, Congress passed the Public Utilities Regulatory Policies Act (PURPA) which required local electric utilities to buy power from qualifying facilities (QFs).[143]
QFs were either cogeneration facilities [144]
or small generation resources that use renewables such as wind, solar, biomass, geothermal, or hydroelectric power as their primary fuels.[145]
Through PURPA, Congress supported the development of more RE generation in the U.S. States have also taken a significant lead in requiring the development of renewable resources. In particular, a number of states have adopted renewable portfolio standards (RPS). As of 2013, 29 states and the District of Columbia have enforceable RPS or similar laws.[146]
Use of RE continues to grow rapidly in the U.S. In 2013, electricity generated from renewable technologies, including conventional hydropower, represented 13 percent of total U.S. electricity, up from 9 percent in 2005.[147]
In 2013, U.S. non-hydro RE capacity for the total electric power industry exceeded 80,000 MW, reflecting a fivefold increase in just 15 years.[148]
In particular, there has been substantial growth in the wind and photovoltaic (PV) markets in the past decade. Since 2009, U.S. wind generation has tripled and solar generation has grown twenty-fold.[149]
The global market for RE is projected to grow to $460 billion per year by 2030.[150]
RE growth is further encouraged by the significant amount of existing natural resources that can support RE production in the U.S.[151]
In the Energy Information Administration's Annual Energy Outlook 2015, RE generation grows substantially from 2013 to 2040 in the reference case and all alternative cases.[152]
In the reference case, RE generation increases by more than 70 percent from 2013 to 2040 and accounts for over one-third of new generation capacity.[153]
Price pressures caused by oil embargoes in the 1970s also brought the issues of conservation and EE to the forefront of U.S. energy policy.[154]
This trend continued in the early 1990s. EE has been utilized to meet energy demand to varying levels since that time. As of April 2014, 25 states [155]
have “enacted long-term (3+ years), binding energy savings targets, or energy efficiency resource standards (EERS).” [156]
Funding for EE programs has grown rapidly in recent years, with budgets for electric efficiency programs totaling $5.9 billion in 2012.[157]
( printed page 64696)
Advancements and innovation in power sector technologies provide the opportunity to address CO2
emission levels at affected power plants while at the same time improving the overall power system in the U.S. by lowering the carbon intensity of power generation, and ensuring a reliable supply of power at a reasonable cost.
E. Clean Air Act Regulations for Power Plants
In this section, we provide a general description of major CAA regulations for power plants. We refer to these in later sections of this preamble.
1. Title IV Acid Rain Program
The EPA's Acid Rain Program, established in 1990 under Title IV of the CAA, addresses the presence of acidic compounds and their precursors (
i.e.,
SO2
and NOX), in the atmosphere by targeting “the principal sources” of these pollutants through an SO2
cap-and-trade program for fossil-fuel fired power plants and through a technology based NOX
emission limit for certain utility boilers. Altogether, Title IV was designed to achieve reductions of ten million tons of annual SO2
emissions, and, in combination with other provisions of the CAA, two million tons of annual NOX
emissions.[158]
The SO2
cap-and-trade program was implemented in two phases. The first phase, beginning in 1995, targeted one-hundred and ten named power plants, including specific generator units at each plant, requiring the plants to reduce their cumulative emissions to a specific level.[159]
Under certain conditions, the owner or operator of a named power plant could reassign an affected unit's reduction requirement to another unit and/or request an extension of two years for meeting the requirement.[160]
Congress also established an energy conservation and RE reserve from which up to 300,000 allowances could be allocated for qualified energy conservation measures or qualified RE.[161]
The second phase, beginning in 2000, expanded coverage to more than 2,000 generating units and set a national cap at 8.90 million tons.[162]
Generally, allowances were allocated at a rate of 1.2 lbs/mmBtu multiplied by the unit's baseline and divided by 2000.[163]
However, bonus allowances could be awarded to certain units.
Title IV also required the EPA to hold or sponsor annual auctions and sales of allowances for a small portion of the total allowances allocated each year. This ensured that some allowances would be directly available for new sources, including independent power production facilities.[164]
The provisions of the EPA's Acid Rain Program are implemented through permits issued under the EPA's Title V Operating Permit Program.[165]
In accordance with Title IV, moreover, each Title V permit application must include a compliance plan for the affected source that details how that source expects to meet the requirements of Title IV.[166]
2. Transport Rulemakings
CAA section 110(a)(2)(D)(i)(I), the “Good Neighbor Provision,” requires SIPs to prohibit emissions that “contribute significantly to nonattainment . . . or interfere with maintenance” of the NAAQS in any other state.[167]
If the EPA finds that a state has failed to submit an approvable SIP, the EPA must issue a federal implementation plan (FIP) to prohibit those emissions “at any time” within the next two years.[168]
In three major rulemakings—the NOX
SIP Call,[169]
the Clean Air Interstate Rule (CAIR),[170]
and the Cross State Air Pollution Rule (CSAPR) [171]
—the EPA has attempted to delineate the scope of the Good Neighbor Provision. These rulemakings have several features in common. Although the Good Neighbor Provision does not speak specifically about EGUs, in all three rulemakings, the EPA set state emission “budgets” for upwind states based in part on emissions reductions achievable by EGUs through application of cost-effective controls. Each rule also adopted a phased approach to reducing emissions with both interim and final goals.
a.
NOXSIP Call.
In 1998, the EPA promulgated the NOX
SIP Call, which required 23 upwind states to reduce emissions of NOX
that would impact downwind areas with ozone problems. The EPA determined emission reduction requirements based on reductions achievable through “highly cost-effective” controls—
i.e.,
controls that would cost on average no more than $2,000 per ton of emissions reduced.[172]
The EPA determined that a uniform emission rate on large EGUs coupled with a cap-and-trade program was one such set of highly cost-effective controls.[173]
Accordingly, the EPA established an interstate cap-and-trade program—the NOX
Budget Trading Program—as a mechanism for states to reduce emissions from EGUs and other sources in a highly cost-effective manner. The D.C. Circuit upheld the NOX
SIP Call in most significant respects, including its use of costs to apportion emission reduction responsibilities.[174]
b.
Clean Air Interstate Rule (CAIR).
In 2005, the EPA promulgated CAIR, which required 28 upwind states to reduce emissions of NOX
and SO2
that would impact downwind areas with projected nonattainment and maintenance problems for ozone and PM2.5
. The EPA determined emission reduction requirements based on “controls that are known to be highly cost effective for EGUs.” [175]
The EPA established cap-and-trade programs for sources of NOX
and SO2
in states that chose to participate in the trading programs via their SIPs and for states ultimately subject to a FIP.[176]
As relevant here, the D.C. Circuit remanded CAIR in
North Carolina
v.
EPA
due to in part the structure of its interstate trading provisions and the way in which EPA applied the cost-effective standard, but kept the rule in place while the EPA developed an acceptable substitute.[177]
c.
Cross-state Air Pollution Rule (CSAPR).
In 2011, the EPA promulgated CSAPR, which required 27 upwind states to reduce emissions of NOX
and SO2
that would impact downwind areas with projected nonattainment and
( printed page 64697)
maintenance problems for ozone and PM2.5
. The EPA determined emission reduction requirements based in part on the reductions achievable at certain cost thresholds by EGUs in each state, with certain provisions developed to account for the need to ensure reliability of the electric generating system.[178]
In the same action establishing these emission reduction requirements, the EPA promulgated FIPs that subjected states to trading programs developed to achieve the necessary reductions within each state.[179]
The U.S. Supreme Court upheld the EPA's use of cost to set emission reduction requirements, as well as its authority to issue the FIPs.[180]
3. Clean Air Mercury Rule
On March 15, 2005, the EPA issued a rule to control mercury (Hg) emissions from new and existing fossil fuel-fired power plants under CAA section 111(b) and (d). The rule, known as the Clean Air Mercury Rule (CAMR), established, in relevant part, a nationwide cap-and-trade program under CAA section 111(d), which was designed to complement the cap-and-trade program for SO2
and NOX
emissions under the Clean Air Interstate Rule (CAIR), discussed above.[181]
Though CAMR was later vacated by the D.C. Circuit on account of the EPA's flawed CAA section 112 delisting rule, the court declined to reach the merits of the EPA's interpretation of CAA section 111(d).[182]
Accordingly, CAMR continues to be an informative model for a cap-and-trade program under CAA section 111(d).
The cap-and-trade program in CAMR was designed to take effect in two phases: in 2010, the cap was set at 38 tons of mercury per year, and in 2018, the cap would be lowered to 15 tons per year. The Phase I cap was set at a level reflecting the co-benefits of CAIR as determined through economic and environmental modeling.[183]
For the more stringent Phase II cap, the EPA projected that sources would “install SCR [selective catalytic reduction] to meet their SO2
and NOX
requirements and take additional steps to address the remaining Hg reduction requirements under CAA section 111, including adding Hg-specific control technologies (model applies ACI [activated carbon injection]), additional scrubbers and SCR, dispatch changes, and coal switching.” [184]
Based on this analysis, EPA determined that the BSER “refers to the combination of the cap-and-trade mechanism and the technology needed to achieve the chosen cap level.” [185]
To accompany the nationwide emissions cap, the EPA also assigned a statewide emissions budget for mercury. Pursuant to CAA section 111(d), states would be required to submit plans to the EPA “detailing the controls that will be implemented to meet its specified budget for reductions from coal-fired Utility Units.” [186]
Of course, states were “not required to adopt and implement” the emission trading program, “but they [were] required to be in compliance with their statewide Hg emission budget.” [187]
4. Mercury Air Toxics Rule
On February 16, 2012, the EPA issued the MATS rule (77 FR 9304) to reduce emissions of toxic air pollutants from new and existing coal- and oil-fired EGUs. The MATS rule will reduce emissions of heavy metals, including mercury, arsenic, chromium, and nickel; and acid gases, including hydrochloric acid and hydrofluoric acid. These toxic air pollutants, also known as hazardous air pollutants or air toxics, are known to cause, or suspected of causing, nervous system damage, cancer, and other serious health effects. The MATS rule will also reduce SO2
and fine particle pollution, which will reduce particle concentrations in the air and prevent thousands of premature deaths and tens of thousands of heart attacks, bronchitis cases and asthma episodes.
New or reconstructed EGUs (
i.e.,
sources that commence construction or reconstruction after May 3, 2011) subject to the MATS rule are required to comply by April 16, 2012 or upon startup, whichever is later.
Existing sources subject to the MATS rule were required to begin meeting the rule's requirements on April 16, 2015. Controls that will achieve the MATS performance standards are being installed on many units. Certain units, especially those that operate infrequently, may be considered not worth investing in given today's electricity market, and are closing. The final MATS rule provided a foundation on which states and other permitting authorities could rely in granting an additional, fourth year for compliance provided for by the CAA. States report that these fourth year extensions are being granted. In addition, the EPA issued an enforcement policy that provides a clear pathway for reliability-critical units to receive an administrative order that includes a compliance schedule of up to an additional year, if it is needed to ensure electricity reliability.
Following promulgation of the MATS rule, industry, states and environmental organizations challenged many aspects of the EPA's threshold determination that regulation of EGUs is “appropriate and necessary” and the final standards regulating hazardous air pollutants from EGUs. The U.S. Court of Appeals for the D.C. Circuit upheld all aspects of the MATS rule.
White Stallion Energy Center
v.
EPA,
748 F.3d 1222 (D.C. Cir. 2014). In
Michigan
v.
EPA,
case no. 14-46, the U.S. Supreme Court reversed the portion of the D.C. Circuit decision finding the EPA was not required to consider cost when determining whether regulation of EGUs was “appropriate” pursuant to section 112(n)(1). The Supreme Court considered only the narrow question of whether the EPA erred in not considering cost when making this threshold determination. The Court's decision did not disturb any of the other holdings of the D.C. Circuit. The Court remanded the case to the D.C. Circuit for further proceedings, and the MATS rule remains in place at this time.
5. Regional Haze Rule
Under CAA section 169A, Congress “declare[d] as a national goal the prevention of any future, and the remedying of any existing, impairment of visibility” in national parks and wilderness areas that results from anthropogenic emissions.[188]
To achieve this goal, Congress directed the EPA to promulgate regulations directing states to submit SIPs that “contain such emission limits, schedules of compliance and other measures as may be necessary to make reasonable progress toward meeting the national goal. . . .” [189]
One such measure that Congress deemed necessary to make reasonable progress was a requirement that certain older stationary sources that cause or contribute to visibility impairment “procure, install, and operate, as expeditiously as practicable
( printed page 64698)
. . . the best available retrofit technology,” more commonly referred to as BART.[190]
When determining BART for large fossil-fuel fired utility power plants, Congress required states to adhere to guidelines to be promulgated by the EPA.[191]
As with other SIP-based programs, the EPA is required to issue a FIP within two years if a state fails to submit a regional haze SIP or if the EPA disapproves such SIP in whole or in part.[192]
In 1999, the EPA promulgated the Regional Haze Rule to satisfy Congress' mandate that EPA promulgate regulations directing states to address visibility impairment.[193]
Among other things, the Regional Haze Rule allows states to satisfy the Act's BART requirement either by adopting source-specific emission limitations or by adopting alternatives, such as emissions-trading programs, that achieve greater reasonable progress than would source-specific BART.[194]
The Ninth Circuit and D.C. Circuit have both upheld the EPA's interpretation that CAA section 169A(b)(2) allows for BART alternatives in lieu of source-specific BART.[195]
In 2005, the EPA promulgated BART Guidelines to assist states in determining which sources are subject to BART and what emission limitations to impose at those sources.[196]
The Regional Haze Rule set a goal of achieving natural visibility conditions by 2064 and requires states to revise their regional haze SIPs every ten years.[197]
The first planning period, which ends in 2018, focused heavily on the BART requirement. States (or the EPA in the case of FIPs) made numerous source-specific BART determinations, and developed several BART alternatives, for utility power plants. For the next planning period, states will need to determine whether additional controls are necessary at these plants (and others that were not subject to BART) in order to make reasonable progress towards the national visibility goal.[198]
F. Congressional Awareness of Climate Change in the Context of the Clean Air Act Amendments [199]
During its deliberations on the 1970 Clean Air Act Amendments, Congress learned that ongoing pollution, including from manmade carbon dioxide, could “threaten irreversible atmospheric and climatic changes.” [200]
At that time, Congress heard the views of scientists that carbon dioxide emissions tended to increase global temperatures, but that there was uncertainty as to the extent to which those increases would be offset by the decreases in temperatures brought about by emissions of particulates. President Nixon's Council on Environmental Quality (CEQ) reported that “the addition of particulates and carbon dioxide in the atmosphere could have dramatic and long-term effects on world climate.” [201]
The CEQ's First Annual Report, which was transmitted to Congress, devoted a chapter to “Man's Inadvertent Modification of Weather and Climate.” [202]
Moreover, Charles Johnson, Jr., Administrator of the Consumer Protection and Environmental Health Service, testified before the House Subcommittee on Public Health that “the carbon dioxide balance might result in the heating up of the atmosphere whereas the reduction of the radiant energy through particulate matter released to the atmosphere might cause reduction in radiation that reaches the earth.” [203]
Administrator Johnson explained that the Nixon Administration was “concerned . . . that neither of these things happen” and that they were “watching carefully the kind of prognosis, the kind of calculations that the scientists make to look at the continuous balance between heat and cooling of the total earth's atmosphere.” [204]
He concluded that “[w]hat we are trying to do, however, in terms of our air pollution effort should have a very salutary effect on either of these.” [205]
Scientific reports on climatic change continued to gain traction in Congress through the mid-1970s, including while Congress was considering the 1977 CAA Amendments. However, uncertainty continued as to whether the increased warming brought about by carbon dioxide emissions would be offset by cooling brought about by particulate emissions.[206]
Congress ordered, as part of the 1977 CAA Amendments, the National Oceanic and Atmospheric Administration to research and monitor the stratosphere “for the purpose of early detection of changes in the stratosphere and climatic effects of such changes.” [207]
Between the 1977 and 1990 Clean Air Act Amendments, scientific uncertainty yielded to the predominant view that global warming “was likely to dominate on time scales that would be significant to human societies.” [208]
In fact, as part of the 1990 Clean Air Act Amendments, Congress specifically required the EPA to collect data on carbon dioxide emissions—the most significant of the GHGs—from all sources subject to the
( printed page 64699)
newly enacted operating permit program under Title V.[209]
Although Congress did not require the EPA to take immediate action to address climate change, Congress did identify certain tools that were particularly helpful in addressing climate change in the utility power sector. The Senate report discussing the acid rain provisions of Title IV noted that some of the measures that would reduce coal-fired power plant emissions of the precursors to acid rain would also reduce those facilities' emissions of CO2. The report stated:
Energy efficiency is a crucial tool for controlling the emissions of carbon dioxide, the gas chiefly responsible for the intensification of the atmospheric `greenhouse effect.' In the last several years, the Committee has received extensive scientific testimony that increases in the human-caused emissions of carbon dioxide and other greenhouse gases will lead to catastrophic shocks in the global climate system. Accordingly, new title IV shapes an acid rain reduction policy that encourages energy efficiency and other policies aimed at controlling greenhouse gases.[210]
Similarly, Title IV provisions to encourage RE were justified because “renewables not only significantly curtail sulfur dioxide emissions, but they emit little or no nitrogen oxides and carbon dioxide”.[211]
G. International Agreements and Actions
In this final rule, the U.S. is taking action to limit GHGs from one of its largest emission sources. Climate change is a global problem, and the U.S. is not alone in taking action to address it. The UNFCCC [212]
is the international treaty under which countries (called “Parties”) cooperatively consider what can be done to limit anthropogenic climate change [213]
and adapt to climate change impacts. Currently, there are 195 Parties to the UNFCCC, including the U.S. The Conference of the Parties (COP) meets annually and is currently considering commitments countries can make to limit emissions after 2020. The 2015 COP will be in Paris and is expected to represent an historic step for climate change mitigation. The Parties to the UNFCC will meet to establish a climate agreement that applies to all countries and focuses on reducing GHG emissions. Such an outcome would send a beneficial signal to the markets and civil society about global action to address climate change.
Many countries have announced their intended post-2020 commitments already, and other countries are expected to do so before December. In April 2015, the U.S. announced its commitment to reduce GHG emissions 26-28 percent below 2005 levels by 2025.[214]
As Parties to both the UNFCCC and the Kyoto Protocol,[215]
the European Union (EU) and member countries have taken aggressive action to reduce GHG emissions.[216]
EU initiatives to reduce GHG emissions include the EU Emissions Trading System, legislation to increase the adoption of RE sources, strengthened EE targets, vehicle emission standards, and support for the development of CCS technology for use by the power sector and other industrial sources. In 2009, the EU announced its “20-20-20 targets,” including a 20 percent reduction in GHG emissions from 1990 levels by 2020, an increase of 20 percent in the share of energy consumption produced by renewable resources, and a 20 percent improvement in EE. In March 2015, the EU announced its commitment to reduce domestic GHG emissions by at least 40% from 1990 levels by 2030.
Recently, China has also agreed to take action to address climate change. In November 2014, in a joint announcement by President Obama and China's President Xi, China pledged to curtail GHG emissions, with emissions peaking in 2030 and then declining thereafter, and to increase the share of energy from non-carbon sources (solar, wind, hydropower, nuclear) to 20 percent by 2030.
Mexico is committed to reduce unconditionally 25 percent of its emissions of GHGs and short-lived climate pollutants (below business as usual) for the year 2030. This commitment implies a 22 percent reduction of GHG emissions and a 51 percent reduction of black carbon emissions.
Brazil has reduced its net CO2
emissions more than any other country through a historic effort to slow forest loss. The deforestation rate in Brazil in 2014 was roughly 75 percent below the average for 1996 to 2005.[217]
Together, countries that have already announced their intended post-2020 commitments, including the U.S., China, European Union, Mexico, Russian Federation and Brazil, make up a large majority of global emissions.
President Obama's Climate Action Plan contains a number of policies and programs that are intended to cut carbon pollution that causes climate change and affects public health. The Clean Power Plan is a key component of the plan, addressing the nation's largest source of emissions in a comprehensive manner. Collectively, these policies will help spark business innovation, result in cleaner forms of energy, create jobs, and cut dependence on foreign oil. They also demonstrate to the rest of the world that the U.S. is contributing its share of the global effort that is needed to address climate change.[218]
This demonstration encourages other major economies to take on similar contributions, which is critical given the global impact of GHG emissions. The State Department Special Envoy for Climate Change Todd Stern, the lead U.S. climate change negotiator, noted the connection between domestic and international action to address climate change in his speech at Yale University on October 14, 2014:
This mobilization of American effort matters. Enormously. It matters because the United States is the biggest economy and largest historic emitter of greenhouse gases. Because, here, as in so many areas, we feel a responsibility to lead. And because here, as in so many areas, we find that American commitment is indispensable to effective international action.
And make no mistake—other countries see what we are doing and are taking note. As I travel the world and meet with my
( printed page 64700)
counterparts, the palpable engagement of President Obama and his team has put us in a stronger, more credible position than ever before.
This final rule demonstrates to other countries that the U.S. is taking action to limit GHG emissions from its largest emission sources, in line with our international commitments. The impact of GHGs is global, and U.S. action to reduce GHG emissions complements and encourages ongoing programs and efforts in other countries.
H. Legislative and Regulatory Background for CAA Section 111
In the final days of December 1970, Congress enacted sweeping changes to the Air Quality Act of 1967 to confront an “environmental crisis.” [219]
The Air Quality Act—which expanded federal air pollution control efforts after the enactment of the Clean Air Act of 1963—prioritized the adoption of ambient air standards but failed to target stationary sources of air pollution. As a result, “[c]ities up and down the east coast were living under clouds of smoke and daily air pollution alerts.” [220]
In fact, “[o]ver 200 million tons of contaminants . . . spilled into the air” each year.[221]
The 1970 CAA Amendments were designed to face this crisis “with urgency and in candor.” [222]
For the most part, Congress gave EPA and the states flexible tools to implement the CAA. This is best exhibited by the newly enacted programs regulating stationary sources. For these sources, Congress crafted a three-legged regime upon which the regulation of stationary sources was intended to sit.
The first prong—CAA sections 107-110—addressed what are commonly referred to as criteria pollutants, “the presence of which in the ambient air results from numerous or diverse mobile or stationary sources” and are determined to have “an adverse effect on public health or welfare”.[223]
Under these provisions, states would have the primary responsibility for assuring air quality within their entire geographic area but would submit plans to the Administrator for “implementation, maintenance, and enforcement” of national ambient air quality standards. These plans would include “emission limitations, schedules, and timetables for compliance . . . and such other measures as may be necessary to insure attainment and maintenance” of the national ambient air quality standards.[224]
The second prong—CAA section 111—addressed pollutants on a source category-wide basis. Under CAA section 111(b), the EPA lists source categories which “contribute significantly to air pollution which causes or contributes to the endangerment of public health or welfare,” And then establishes “standards of performance” for the new sources in the listed category.[225]
For existing sources in a listed source category, CAA section 111(d) set out procedures for the establishment of federally enforceable “emission standards” of any pollutant not otherwise controlled under the CAA's SIP provisions or CAA section 112.
Lastly, the third prong—CAA section 112—addressed hazardous air pollutants through the establishment of national “emission standards” at a level which “provides an ample margin of safety to protect the public health”.[226]
All new or modified sources of any hazardous air pollutant would be required to meet these emission standards. Existing sources were required to meet the same standards or would be shut down unless they obtained a temporary EPA waiver or Presidential exemption.[227]
At its inception, CAA section 111 was intended to bear a significant weight under this three-legged regime. Indeed, by 1977, the EPA had promulgated six times as many performance standards under CAA section 111 than emission standards under CAA section 112.[228]
That said, states, including Texas and New Jersey, levied “substantial criticisms” against the EPA for not moving rapidly enough.[229]
Accordingly, the 1977 CAA Amendments were designed to “provide a greater role for the [s]tates in standards setting under the [CAA],” “protect [s]tates from `environmental blackmail' as they attempt to regulate mobile and competitive industries,” and lastly “provide a check on the Administrator's inaction or failure to control emissions adequately.” [230]
At bottom, CAA section 111 rests on the definition of a standard of performance under CAA section 111(a)(1), which reads nearly the same now as it did when it was first adopted in the 1970 CAA Amendments. In 1970, Congress defined standard of performance—a term which had not previously appeared in the CAA—as
a standard for emissions of air pollutants which reflects the degree of emission limitation achievable through the application of the best system of emission reduction which (taking into account the cost of achieving such reduction) the Administrator determines has been adequately demonstrated.[231]
Despite significant changes to this definition in 1977, Congress reversed course in 1990 and largely reinstated the original definition.[232]
As presently defined, the term applies to the regulation of new and existing sources under CAA sections 111(b) and (d).[233]
The level of control reflected in the definition is generally referred to as the “best system of emission reduction,” or the BSER. The BSER, however, is not further defined, and only appeared after conference between the House and Senate in late 1970, and was neither discussed in the conference report nor openly debated in either chamber. Nevertheless, the originating bills from both houses shed light on its construction.
The BSER grew out of proposed language in two bills, which, for the first time, targeted air pollution from stationary sources. The House bill sought to establish national emission standards to “prevent and control . . . emissions [of non-hazardous pollutants] to the fullest extent compatible with the available technology and economic feasibility.” [234]
The House also
( printed page 64701)
proposed to prohibit the construction or operation of new sources of “extremely hazardous” pollutants.[235]
The Senate bill, on the other hand, authorized “Federal standards of performance,” which would “reflect the greatest degree of emission control which the Secretary [later, the Administrator] determines to be achievable through application of the latest available control technology, processes, operating methods, or other alternatives.” [236]
The Senate also would have authorized “national emission standards” for hazardous air pollution and other “selected air pollution agents.” [237]
After conference, CAA section 111 emerged as one of the CAA's three programs for regulating stationary sources. In defining the newly formed “standards of performance,” Congress appeared to merge the various “means of preventing and controlling air pollution” under the Senate bill with the consideration of costs that was central to the House bill into the BSER. At the time, however, this definition only applied to new sources under CAA section 111(b).
To regulate existing sources, Congress collapsed section 114 of the Senate bill into CAA section 111(d).[238]
Section 114 of the Senate bill established emission standards for “selected air pollution agents,” and was intended to bridge the gap between criteria pollutants and hazardous air pollutants. As proposed, the Senate identified fourteen substances for regulation under section 114 and only four substances for regulation under Senate bill 4358, section 115, the predecessor of CAA section 112.[239]
As adopted, CAA section 111(d) requires states to submit plans to the Administrator establishing “emission standards” for certain existing sources of air pollutants that were not otherwise regulated as criteria pollutants or hazardous air pollutants. This ensured that there would be “no gaps in control activities pertaining to stationary source emissions that pose any significant danger to public health or welfare.” [240]
The term “emission standards,” however, was not expressly defined in the 1970 CAA Amendments (save for purposes of citizen suit enforcement) even though the term was also used under the CAA's SIP provisions and CAA section 112.[241]
That said, under the newly enacted “ambient air quality and emission standards” sections, Congress directed the EPA to provide states with information “on air pollution control techniques,” including data on “available technology and alternative methods of prevention and control of air pollution” and on “alternative fuels, processes, and operating methods which will result in elimination or significant reduction of emissions.” [242]
Similarly, the Administrator would “issue information on pollution control techniques for air pollutants” in conjunction with establishing emission standards under CAA section 112. However, analogous text is absent from CAA section 111(d).
After the enactment of the 1970 CAA Amendments, the EPA proposed standards of performance for an “initial list of five stationary source categories which contribute significantly to air pollution” in August 1971.[243]
The first category listed was for fossil-fuel fired steam generators, for which EPA proposed and promulgated standards for particulate matter, SO2, and NOX
.[244]
Several years later, the EPA proposed its implementing regulations for CAA section 111(d).[245]
These regulations were finalized in November 1975, and provided for the publication of emission guidelines.[246]
The first emission guidelines were proposed in May 1976 and finalized in March 1977.[247]
Despite these first steps taken under CAA sections 111(b) and (d), Congress revisited the CAA in 1977 to address growing concerns with the nation's response to the 1973 oil embargo (noted above), to respond to new environmental problems such as stratospheric ozone depletion, and to resolve other issues associated with implementing the 1970 CAA Amendments.[248]
Most notably, an increase in coal use as a result of the oil crisis meant that “vigorous and effective control” of air emissions was “even more urgent.” [249]
Thus, to curb the projected surge in air emissions, Congress enacted several new provisions to the CAA. These new provisions include the prevention of significant deterioration (PSD) program, visibility protections, and requirements for nonattainment areas.[250]
Congress also made significant changes to CAA section 111. For example, Congress amended the definition of a standard of performance (including by requiring the consideration of “nonair quality health and environmental impact and energy requirements”), authorized alternative (
e.g.,
work practice or design) standards in limited circumstances, provided states with authority to petition the Administrator for new or revised (and more stringent) standards, and imposed a strict regulatory schedule for establishing standards of performance for categories of major stationary sources that had not yet been listed.[251]
( printed page 64702)
The 1977 definition for a standard of performance required “all new sources to meet emission standards based on the reductions achievable through the use of the ‘best technological system of continuous emission reduction.’ ” [252]
For fossil-fuel fired stationary sources, Congress further required a percentage reduction in emissions from the use of fuels.[253]
Together, this was designed to “force new sources to burn high-sulfur fuel thus freeing low-sulfur fuel for use in existing sources where it is harder to control emissions and where low-sulfur fuel is needed for compliance.” [254]
Congress also clarified that with respect to CAA section 111(d), standards of performance (now applicable in lieu of emission standards) “would be based on the best available means (not necessarily technological)”.[255]
This was intended to distinguish existing source standards from new source standards, for which “the requirement for [the BSER] has been more narrowly redefined as best technological system of continuous emission reduction.” [256]
Additionally, Congress clarified that states could consider “the remaining useful life” of a source when applying a standard of performance to a particular existing source.[257]
In the twenty years since the 1970 CAA Amendments and in spite of the refinements of the 1977 CAA Amendments, “many of the Nation's most important air pollution problems [had] failed to improve or [had] grown more serious.” [258]
Indeed, in 1989, President George Bush said that “ ‘progress has not come quickly enough and much remains to be done.’ ” [259]
This time, with the 1990 CAA Amendments, Congress substantially overhauled the CAA. In particular, Congress again added to the NAAQS program, completely revised CAA section 112, added a new title to target existing fossil fuel-fired stationary sources and address growing concerns with acid rain, imported an operating permit modeled off the Clean Water Act, and established a phase out of certain ozone depleting substances.
All told, however, there was minimal debate on changes to CAA section 111. In fact, the only discussion centered on the repeal of the percentage reduction requirement, which became seen as unduly restrictive. Accordingly, Congress reverted the definition of “standard of performance” to the definition agreed to in the 1970 CAA Amendments, but retained the requirement to consider nonair quality environmental impacts and energy requirements added in 1977.[260]
However, the repeal would only apply so long as the SO2
cap under CAA section 403(e) of the newly established acid rain program remained in effect.[261]
Lastly, Congress instructed the EPA to revise its new source performance standards for SO2
emissions from fossil fuel-fired power plants but required that the revised emission rate be no less stringent than before.[262]
I. Statutory and Regulatory Requirements
Clean Air Act section 111, which Congress enacted as part of the 1970 Clean Air Act Amendments, establishes mechanisms for controlling emissions of air pollutants from stationary sources. This provision requires the EPA to promulgate a list of categories of stationary sources that the Administrator, in his or her judgment, finds “causes, or contributes significantly to, air pollution which may reasonably be anticipated to endanger public health or welfare.” [263]
The EPA has listed more than 60 stationary source categories under this provision.[264]
Once the EPA lists a source category, the EPA must, under CAA section 111(b)(1)(B), establish “standards of performance” for emissions of air pollutants from new sources in the source categories.[265]
These standards are known as new source performance standards (NSPS), and they are national requirements that apply directly to the sources subject to them.
When the EPA establishes NSPS for new sources in a particular source category, the EPA is also required, under CAA section 111(d)(1), to prescribe regulations for states to submit plans regulating existing sources in that source category for any air pollutant that, in general, is not regulated under the CAA section 109 requirements for the NAAQS or regulated under the CAA section 112 requirements for HAP. CAA section 111(d)'s mechanism for regulating existing sources differs from the one that CAA section 111(b) provides for new sources because CAA section 111(d) contemplates states submitting plans that establish “standards of performance” for the affected sources and that contain other measures to implement and enforce those standards.
“Standards of performance” are defined under CAA section 111(a)(1) as standards for emissions that reflect the emission limitation achievable from the “best system of emission reduction,” considering costs and other factors, that “the Administrator determines has been adequately demonstrated.” CAA section 111(d)(1) grants states the authority, in applying a standard of performance to a particular source, to take into account the source's remaining useful life or other factors.
Under CAA section 111(d), a state must submit its plan to the EPA for approval, and the EPA must approve the state plan if it is “satisfactory.” [266]
If a state does not submit a plan, or if the EPA does not approve a state's plan, then the EPA must establish a plan for that state.[267]
Once a state receives the EPA's approval of its plan, the provisions in the plan become federally enforceable against the entity responsible for noncompliance, in the same manner as the provisions of an approved SIP under the Act.
Section 302(d) of the CAA defines the term “state” to include the Commonwealth of Puerto Rico, the Virgin Islands, Guam, American Samoa and the Commonwealth of the Northern Mariana Islands. While 40 CFR part 60 contains a separate definition of “state” at section 60.2, this definition expands on, rather than narrows, the definition in section 302(d) of the CAA. The introductory language to 40 CFR 60.2 provides: “The terms in this part are defined in the Act or in this section as follows.” Section 60.2 defines “State” as
( printed page 64703)
“all non-Federal authorities, including local agencies, interstate associations, and State-wide programs that have been delegated authority to implement: (1) The provisions of this part and/or (2) the permit program established under part 70 of this chapter. The term State shall have its conventional meaning where clear from the context.” The EPA believes that the last sentence refers to the conventional meaning of “state” under the CAA. Thus, the EPA believes the term “state” as used in the emission guidelines is most reasonably interpreted as including the meaning ascribed to that term in section 302(d) of the CAA, which expressly includes U.S. territories.
Section 301(d)(A) of the CAA recognizes that the American Indian tribes are sovereign Nations and authorizes the EPA to “treat tribes as States under this Act”. The Tribal Authority Rule (63 FR 7254, February 12, 1998) identifies that EPA will treat tribes in a manner similar to states for all of the CAA provisions with the exception of, among other things, specific plan submittal and implementation deadlines under the CAA. As a result, though they operate as part of the interconnected system of electricity production and distribution, affected EGUs located in Indian country would not be encompassed within a state's CAA section 111(d) plan. Instead, an Indian tribe with one or more affected EGUs located in its area of Indian country [268]
will have the opportunity, but not the obligation, to apply for eligibility to develop and implement a CAA section 111(d) plan. The Indian tribe would need to be approved by the EPA as eligible to develop and implement a CAA section 111(d) plan following the procedure set forth in 40 CFR part 49. Once a tribe is approved as eligible for that purpose, it would be treated in the same manner as a state, and references in the emission guidelines to states would refer equally to the tribe. The EPA notes that, while tribes have the opportunity to apply for eligibility to administer CAA programs, they are not required to do so. Further, the EPA has established procedures in 40 CFR part 49 (see particularly 40 CFR 49.7(c)) that permit eligible tribes to request approval of reasonably severable partial program elements. Those procedures are applicable here.
In these final emission guidelines, the term “state” encompasses the 50 states and the District of Columbia, U.S. territories, and any Indian tribe that has been approved by the EPA pursuant to 40 CFR 49.9 as to develop and implement a CAA section 111(d) plan.
The EPA issued regulations implementing CAA section 111(d) in 1975,[269]
and has revised them in the years since.[270]
(We refer to the regulations generally as the implementing regulations.) These regulations provide that, in promulgating requirements for sources under CAA section 111(d), the EPA first develops regulations known as “emission guidelines,” which establish binding requirements that states must address when they develop their plans.[271]
The implementing regulations also establish timetables for state and EPA action: States must submit state plans within 9 months of the EPA's issuance of the guidelines,[272]
and the EPA must take final action on the state plans within 4 months of the due date for those plans,[273]
although the EPA has authority to extend those deadlines.[274]
In this rulemaking, the EPA is following the requirements of the implementing regulations, and is not re-opening them, except that the EPA is extending the timetables, as described below.
Over the last forty years, under CAA section 111(d), the agency has regulated four pollutants from five source categories (
i.e.,
sulfuric acid plants (acid mist), phosphate fertilizer plants (fluorides), primary aluminum plants (fluorides), Kraft pulp plants (total reduced sulfur), and municipal solid waste landfills (landfill gases)).[275]
In addition, the agency has regulated additional pollutants under CAA section 111(d) in conjunction with CAA section 129.[276]
The agency has not previously regulated CO2
or any other GHGs under CAA section 111(d).
The EPA's previous CAA section 111(d) actions were necessarily geared toward the pollutants and industries regulated. Similarly, in this rulemaking, in defining CAA section 111(d) emission guidelines for the states and determining the BSER, the EPA believes that taking into account the particular characteristics of carbon pollution, the interconnected nature of the power sector and the manner in which EGUs are currently operated is warranted. Specifically, the operators themselves treat increments of generation as interchangeable between and among sources in a way that creates options for relying on varying utilization levels, lowering carbon generation, and reducing demand as components of the overall method for reducing CO2
emissions. Doing so results in a broader, forward-thinking approach to the design of programs to yield critical CO2
reductions that improve the overall power system by lowering the carbon intensity of power generation, while offering continued reliability and cost-effectiveness. These opportunities exist in the utility power sector in ways that were not relevant or available for other industries for which the EPA has established CAA section 111(d) emission guidelines.[277]
In this action, the EPA is promulgating emission guidelines for states to follow in developing their CAA section 111(d) plans to reduce emissions of CO2
from the utility power sector.
J. Clean Power Plan Proposal and Supplemental Proposal
On June 18, 2014, the EPA proposed emission guidelines for states to follow in developing plans to address GHG emissions from existing fossil fuel-fired electric generating units (EGUs). Specifically, the EPA proposed rate-based goals for CO2
emissions for each
( printed page 64704)
state with existing fossil fuel-fired EGUs, as well as guidelines for plans to achieve those goals. On November 4, 2014, the EPA published a supplemental proposal that proposed emission rate-based goals for CO2
emissions for U.S. territories and areas of Indian country with existing fossil fuel-fired EGUs. In the supplemental proposal, the EPA also solicited comment on authorizing jurisdictions (including any states, territories and areas of Indian country) without existing fossil fuel-fired EGUs subject to the proposed emission guidelines to partner with jurisdictions (including any states) that do have existing fossil fuel-fired EGUs subject to the proposed emission guidelines in developing multi-jurisdictional plans. The EPA also solicited comment on the treatment of RE, demand-side EE and other new low- or zero-emitting electricity generation across international boundaries in a state plan.
The EPA also issued two documents after the June 18, 2014 proposal. On October 30, 2014, the EPA published a NODA in which the agency provided additional information on several topics raised by stakeholders and solicited comment on the information presented. This action covered three topic areas: 1) the emission reduction compliance trajectories created by the interim goal for 2020 to 2029, 2) certain aspects of the building block methodology, and 3) the way state-specific CO2
goals are calculated.
In a separate action, the EPA published a document regarding potential methods for determining the mass that is equivalent to an emission rate-based CO2
goal (79 FR 67406; November 13, 2014). With the action, the EPA also made available, in the docket for this rulemaking, a TSD that provided two examples of how a state, U.S. territory or tribe could translate a rate-based CO2
goal to total metric tons of CO2
(a mass-based equivalent).
K. Stakeholder Outreach and Consultations
Following the direction in the Presidential Memorandum to the Administrator (June 25, 2013),[278]
the EPA engaged in extensive and vigorous outreach to stakeholders and the general public at every stage of development of this rule. Our outreach has included direct engagement with the energy and environment officials in states, tribes, and a full range of stakeholders including leaders in the utility power sector, labor leaders, non-governmental organizations, other federal agencies, other experts, community groups and members of the public. The EPA participated in more than 300 meetings before the rule was proposed and more than 300 after the proposal.
Throughout the rulemaking process, the agency has encouraged, organized, and participated in hundreds of meetings about CAA section 111(d) and reducing carbon pollution from existing power plants. The agency's outreach prior to proposal, as well as during the public comment period, was designed to solicit policy ideas,[279]
concerns, and technical information. The agency received 4.3 million comments about all aspects of the proposed rule and thousands of people participated in the agency's public hearings, webinars, listening sessions,[280]
teleconferences and meetings held all across the country.
Our engagement has brought together a variety of states and stakeholders to discuss a wide range of issues related to the utility power sector and the development of emission guidelines under CAA section 111(d). The meetings were attended by the EPA Regional Administrators, other senior managers and staff who have been instrumental in the development of the rule and will play key roles in developing and implementing it.
This outreach process has produced a wealth of information which has informed this rule significantly. The pre-proposal outreach efforts far exceeded what is required of the agency in the normal course of a rulemaking process, and the EPA expects that the dialogue with states and stakeholders will continue after the rule is finalized. The EPA recognizes the importance of working with all stakeholders, and in particular with the states, to ensure a clear and common understanding of the role the states will play in addressing carbon pollution from power plants. We firmly believe that our outreach has resulted in a more workable rule that will achieve the statutory goals and has enhanced the likelihood of timely and successful achievement of the carbon reduction goals, given the critical importance and urgency of the concrete action.
The EPA has given stakeholder comments careful consideration and, as a result, this final rule includes features that are responsive to many stakeholder concerns.
1. Public Hearings
More than 2,700 people attended the public hearings sessions held in Atlanta, Denver, Pittsburgh, and Washington, DC. More than 1,300 people spoke at the public hearings. Additionally, about 100 people attended the public hearing held in Phoenix, Arizona, on the November 4, 2014 supplemental proposal. Speakers at the public hearings included Members of Congress, other public officials, industry representatives, faith-based organizations, unions, environmental groups, community groups, students, public health groups, energy groups, academia and concerned citizens.
Participants shared a range of perspectives. Many were concerned with the impacts of climate change on their health and on future generations, others were worried about the impact of regulations on the economy. Their support for the agency's efforts varied.
2. State Officials
Since fall 2013, the agency has provided multiple opportunities for the states to inform this rulemaking. Administrator McCarthy has engaged with governors from states with a variety of interests in the rulemaking. Other senior agency officials have engaged with every branch and major agency of state government—including state legislators, attorneys general, state energy, environment, and utility officials, and governors' staff.
On several occasions, state environmental commissioners met with senior agency officials to provide comments on the Clean Power Plan. The EPA organized, encouraged and attended meetings with states to discuss multi-state planning efforts. States have come together with several collaborative groups to discuss ways to work together to make the Clean Power Plan more affordable. The EPA has participated in and supported the states in these discussions. Because of the interconnectedness of the power sector, and the fact that electricity generated at power plants crosses state lines; states, utilities and ratepayers may benefit from states working together to implement the requirements of this rulemaking. The meetings provided state leaders, including governors, environmental commissioners, energy officers, public utility commissioners, and air directors, opportunities to engage with the EPA officials. In addition, the states
( printed page 64705)
submitted public comments from several agencies within each state. The wealth of comments and input from states was important in developing the final rulemaking.
Agency officials listened to ideas, concerns and details from states, including from states with a wide range of experience in reducing carbon pollution from power plants. The EPA reached out to all 50 states to engage with both environmental and energy departments at all levels of government. As an example, a three-part webinar series in June/July 2014 for the states and tribes offered an interactive format for technical staff at the EPA and in the states/tribes to exchange ideas and ask clarifying question. The webinars were then posted online so other stakeholders could view them. A few weeks after the postings, the EPA organized follow-up conference calls with stakeholder groups. Also, the EPA hosted scores of technical meetings between states and the EPA in the weeks and months after the rule was proposed.
Additionally, the EPA organized “hub” calls; these teleconferences brought all of the states in a given EPA region together to discuss technical and interstate aspects of the proposal. These exchanges helped provide the stakeholders with the information they needed to comment on the proposal effectively. The EPA also held a series of webinars with state environmental associations and their members on a series of technical issues.
The agency has collected policy papers and comment letters from states with overarching energy goals and technical details on the states' utility power sector. EPA leadership and staff also participated in webinars and meetings with state and tribal officials hosted by collaborative groups and trade associations. After the comment period closed, and based on our meetings over the last year, as well as written comments on the proposal and NODA, the EPA analyzed information about data errors that needed to be addressed for the final rule. In February and March 2015, we reached out to particular states to clarify ambiguous or unclear information that was submitted to the EPA related to NEEDS and eGRID data. The EPA contacted particular states to clarify the technical comments or concerns to ensure that any changes we make are accurate and appropriate.
To help prepare for implementation of this rule, the agency initiated several outreach activities to assist with state planning efforts. The agency participated in meetings organized by the National Association of State Energy Officials (NASEO), the National Association of Regulatory Utility Commissioners (NARUC), and the National Association of Clean Air Agencies (NACAA) (the “3N” groups). Meeting participants discussed issues related to EE and RE.
To help state officials prepare for the planning process that will take place in the states, the EPA presented a webinar on February 24, 2015. This webinar provided an update on training plans and further connection with states in the implementation process. Forty-nine states, the District of Columbia, and 14 tribes were represented at this webinar. The EPA is developing a state plan electronic collection system to receive, track, and store state submittals of plans and reports. The EPA plans to use an integrated project team to solicit stakeholder input on the system during development. The team membership, including state representatives, will bring together the business and technology skills required to construct a successful product and promote transparency in the EPA's implementation of the rule.
To help identify training needs for the final Clean Power Plan, the agency reached out to a number of state and local organizations such as the Central State Air Resources Agencies and other such regional air agencies. The EPA's outreach on training has included sharing the plans with the states and incorporating changes to the training topics based on the states' needs. The EPA training plan includes a wide variety of topics such as basic training on the electric power sector as well as specific pollution control strategies to reduce carbon emissions from power plants. In particular, the states requested training on how to use programs such as combined heat and power, EE and RE to reduce carbon emissions. The EPA will continue to work with states to tailor training activities to their needs.
The agency has engaged, and will continue to engage with states, territories, Washington, DC, and tribes after the rulemaking process and throughout implementation.
3. Tribal Officials
The EPA conducted significant outreach to and consultation with tribes. Tribes are not required to, but may, develop or adopt Clean Air Act programs. The EPA is aware of four facilities with affected EGUs located in Indian country: the South Point Energy Center, in Fort Mojave Indian country, geographically located within Arizona; the Navajo Generating Station, in Navajo Indian country, geographically located within Arizona; the Four Corners Power Plant, in Navajo Indian country, geographically located within New Mexico; and the Bonanza Power Plant, in Ute Indian country, geographically located within Utah. The EPA offered consultation to the leaders of the tribes on whose lands these facilities are located as well as all of the federally recognized tribes to ensure that they had the opportunity to have meaningful and timely input into this rule. Section III (“Stakeholder Outreach and Conclusions”) of the June 18, 2014 proposal documents the EPA's extensive outreach efforts to tribal officials prior to that proposal, including an informational webinar, outreach meeting, teleconferences with tribal officials and the National Tribal Air Association (NTAA), and letters offering consultation. Additional outreach to tribal officials conducted by the EPA prior to the November 4, 2014 supplemental proposal is discussed in Section II.D (“Additional Outreach and Consultation”) of the supplemental proposal. The additional outreach for the supplemental proposal included consultations with all three tribes that have affected EGUs on their lands, as well as several other tribes that requested consultation, and also additional teleconferences with the NTAA.
After issuing the supplemental proposal, the EPA offered an additional consultation to the leaders of all federally recognized tribes. The EPA held an informational meeting open to all tribes and also held consultations with the Navajo Nation, Fort McDowell Yavapai Nation, Fort Mojave Tribe, Ak-Chin Indian Community, and Hope Tribe on November 18, 2014. The EPA held a consultation with the Ute Tribe of the Uintah and Ouray Reservation on December 16, 2014, and a consultation with the Gila River Indian Community on January 15, 2015. The EPA held a public hearing on the supplemental proposal on November 19, 2014, in Phoenix, Arizona. On April 28, 2015, the EPA held an additional consultation with the Navajo Nation.
Tribes were interested in the impact of this rule on other ongoing regulatory actions at the affected EGUs, such as permitting or requirements for the best available retrofit technology (BART). Tribes also noted that it was important to allow RE projects on tribal lands to contribute toward meeting state goals. Some tribes indicated an interest in being involved in the development of implementation plans for areas of Indian country. Additional detail regarding the EPA's outreach to tribes and comments and recommendations from tribes can be found in Section X.F of this preamble.
( printed page 64706)
4. U.S. Territories
The EPA has met with individual U.S. territories and affected EGUs in U.S. territories during the rulemaking process. On July 22, 2014, the EPA met with representatives from the Puerto Rico Environmental Quality Board, the Puerto Rico Electric Power Authority, the Governor's Office, and the Office of Energy, Puerto Rico. On September 8, 2014, the EPA held a meeting with representatives from the Guam Environmental Protection Agency (GEPA) and the Guam Power Authority and, on February 18, 2015, the EPA met again with representatives from GEPA.
5. Industry Representatives
Agency officials have engaged with industry leaders and representatives from trade associations in many one-on-one and national meetings. Many meetings occurred at the EPA headquarters and in the EPA's Regional Offices and some were sponsored by stakeholder groups. Because the focus of the rule is on the utility power sector, many of the meetings with industry have been with utilities and industry representatives directly related to the utility power sector. The agency has also met with energy industries such as coal and natural gas interests, as well as companies that offer new technology to prevent or reduce carbon pollution, including companies that have expertise in RE and EE. Other meetings have been held with representatives of energy intensive industries, such as the iron and steel and aluminum industries, to help understand the issues related to large industrial users of electricity.
6. Electric Utility Representatives
Agency officials participated in many meetings with utilities and their associations to discuss all aspects of the proposed guidelines. We have met with all types of companies that produce electricity, including private utilities or investor owned utilities. Public utilities and cooperative utilities were also part of in-depth conversations about CAA section 111(d) with EPA officials.
The conversations included meetings with the EPA headquarters and regional offices. State officials were included in many of the meetings. Meetings with utility associations and groups of utilities were held with key EPA officials. The meetings covered technical, policy and legal topics of interest and utilities expressed a wide variety of support and concerns about CAA section 111(d).
7. Electricity Grid Operators
The EPA had a number of conversations with the ISOs and RTOs to discuss the rule and issues related to grid operations and reliability. EPA staff met with the ISO/RTO Council on several occasions to collect their ideas. The EPA regional offices also met with the ISOs and RTOs in their regions. System operators have offered suggestions in using regional approaches to implement CAA section 111(d) while maintaining reliable, affordable electricity.
8. Representatives from Community and Non-governmental Organizations
Agency officials engaged with community groups representing vulnerable communities, and faith-based groups, among others, during the outreach effort. In response to a request from communities, the EPA held a day-long training on the Clean Power Plan on October 30, 2014, in Washington DC At this meeting, the EPA met with a number of environmental groups to provide information on how the agency plans on reducing carbon pollution from existing power plants using CAA section 111(d).
Many environmental organizations discussed the need for reducing carbon pollution. Meetings were technical, policy and legal in nature and many groups discussed specific state policies that are already in place to reduce carbon pollution in the states.
A number of organizations representing religious groups have reached out to the EPA on several occasions to discuss their concerns and ideas regarding this rule. Many members of faith communities attended the four public hearings.
Public health groups discussed the need for protection of children's health from harmful air pollution. Doctors and health care providers discussed the link between reducing carbon pollution and air pollution and public health. Consumer groups representing advocates for low income electricity customers discussed the need for affordable electricity. They talked about reducing electricity prices for consumers through EE and low-cost carbon reductions.
In winter/spring 2015, EPA continued to offer webinars and teleconferences for community groups on the rulemaking.
9. Environmental Justice Organizations
Agency officials engaged with environmental justice groups representing communities of color, low-income communities and others during the outreach effort. Agency officials also engaged with the EPA's National Environmental Justice Advisory Council (NEJAC) members in September 2013. The NEJAC is composed of stakeholders, including environmental justice leaders and other leaders from state and local government and the private sector. Additionally, the agency conducted a community call on February 26, 2015, and on February 27, 2015, the EPA conducted a follow up webinar for participants in an October 30, 2014 training session. The EPA also held a webinar for communities on the Clean Air Act (CAA) and section 111(d) of the CAA on April 2, 2015. The agency, in partnership with FERC and DOE, held two additional webinars for communities on the electricity grid and on energy markets on June 11, 2015, and July 9, 2015.
During the EPA's extensive outreach conducted before and after proposal, the EPA has heard a variety of issues raised by environmental justice communities. Communities expressed the desire for the agency to conduct an environmental justice (EJ) analysis and to require that states in the development of their state plans conduct one as well. Additionally, they asked that the agency require that states engage with communities in the development of their state plans and that the agency conduct meaningful involvement with communities, throughout the whole rulemaking process, including the implementation phase. Furthermore, communities stressed the importance of low-income and communities of color receiving the benefits of this rulemaking and being protected from being adversely impacted by this rulemaking.
The purpose of this rule is to substantially reduce emissions of CO2, a key contributor to climate change, which adversely and disproportionately affects vulnerable and disadvantaged communities in the U.S. and around the world. In addition, the rule will result in substantial reductions of conventional air pollutants, providing immediate public health benefits to the communities where the facilities are located and for many miles around. The EPA is committed to ensuring that all Americans benefit from the public health and other benefits that this rule will bring. Further discussion of the impacts of this rule on vulnerable communities and actions that the EPA is taking to address concerns cited by communities is available in Sections IX and XII.J of this preamble.
10. Labor
Senior agency officials met with a number of labor union representatives about reducing carbon pollution using CAA section 111(d). Those unions included: The United Mine Workers of America; the Sheet Metal, Air, Rail and Transportation Union (SMART); the
( printed page 64707)
International Brotherhood of Boilermakers, Iron Ship Builders, Blacksmiths, Forgers and Helpers (IBB); United Association of Journeymen and Apprentices of the Plumbing and Pipe Fitting Industry of the United States and Canada; the International Brotherhood of Electrical Workers (IBEW); and the Utility Workers Union of America. In addition, agency leaders met with the Presidents of several unions and the President of the American Federation of Labor-Congress of Industrial Organizations (AFL-CIO) at the AFL-CIO headquarters.
EPA officials attended meetings sponsored by labor unions to give presentations and engage in discussions about reducing carbon pollution using CAA section 111(d). These included meetings sponsored by the IBB and the IBEW.
11. Other Federal Agencies and Independent Agencies
Throughout the development of the rulemaking, the EPA consulted with other federal agencies with relevant expertise. For example, the EPA met with managers from the U.S. Department of Agriculture's (USDA's) Rural Utility Service to discuss the rule and potential effects on affected EGUs in rural areas and how USDA programs could interact with affected EGUs during rule implementation.
The U.S. Department of Energy (DOE) was a frequent source of expertise on the proposed and final rule. EPA management and staff had numerous meetings with management and staff at DOE on a range of topics, including the effectiveness and costs of energy generation technologies, and EE.
DOE provided technical assistance relating to RE and demand-side EE, including RE and demand-side EE cost and performance data and, for RE, information on the feasibility of deploying and reliably integrating increased RE generation. Further, EPA and DOE staff discussed emission measurement and verification (EM&V) strategies.
The EPA also consulted with DOE on electric reliability issues. EPA staff and managers met and spoke with DOE staff and managers throughout the development of the proposed and final rules on topic related to electric system reliability.
EPA officials worked closely with DOE and Federal Energy Regulatory Commission (FERC) officials to ensure, to the greatest extent possible, that actions taken by states and affected EGUs to comply with the final rule mitigate potential electric system reliability issues. Senior EPA officials met with each of the FERC Commissioners and EPA staff had frequent contact with FERC staff throughout the development the rule. FERC held four technical conferences to discuss implications of compliance approaches to the rule for electric reliability. EPA staff attended the four conferences and EPA leadership spoke at all of them. The EPA, DOE, and FERC will continue to work together to ensure electric grid reliability in the development and implementation of state plans.
L. Comments on the Proposal
The Administrator signed the proposed emission guidelines on June 2, 2014, and, on the same day, the EPA made this version available to the public at
https://www.epa.gov/cleanpowerplan/. The 120-day public comment period on the proposal began on June 18, 2014, the day of publication of the proposal in the
Federal Register
. On September 18, 2014, in response to requests from stakeholders, the EPA extended the comment period by 45 days, to December 1, 2014, giving stakeholders over 165 days to review and comment upon the proposal. Stakeholders also had the opportunity to comment on the NODA, as well as the
Federal Register
document and TSD regarding potential methods for determining the mass that is equivalent to an emission rate-based CO2
goal, through December 1, 2014. The EPA offered a separate 45-day comment period for the November 4, 2014 supplemental proposal, and that comment period closed on December 19, 2014.
The EPA received more than 4.2 million comments on the proposed carbon pollution emission guidelines from a range of stakeholders that included, including state environmental and energy officials, local government officials, tribal officials, public utility commissioners, system operators, utilities, public interest advocates, and members of the public. The agency received comments on many aspects of the proposal and many suggestions for changes that would address issues of concern.
III. Rule Requirements and Legal Basis
A. Summary of Rule Requirements
The EPA is establishing emission guidelines for states to use in developing plans to address GHG emissions from existing fossil fuel-fired electric generating units. The emission guidelines are based on the EPA's determination of the “best system of emission reduction . . . adequately demonstrated” (BSER) and include source category-specific CO2
emission performance rates, state-specific goals, requirements for state plan components, and requirements for the process and timing for state plan submittal and compliance.
Under CAA section 111(d), the states must establish standards of performance that reflect the degree of emission limitation achievable through the application of the “best system of emission reduction” that, taking into account the cost of achieving such reduction and any non-air quality health and environmental impact and energy requirements, the Administrator determines has been adequately demonstrated.
The EPA has determined that the BSER is the combination of emission rate improvements and limitations on overall emissions at affected EGUs that can be accomplished through the following three sets of measures or building blocks:
1. Improving heat rate at affected coal-fired steam EGUs.
2. Substituting increased generation from lower-emitting existing natural gas combined cycle units for generation from higher-emitting affected steam generating units.
3. Substituting increased generation from new zero-emitting RE generating capacity for generation from affected fossil fuel-fired generating units.
Consistent with CAA section 111(d) and other rules promulgated under this section, the EPA is taking a traditional, performance-based approach to establishing emission guidelines for affected sources and applying the BSER to two source subcategories of existing fossil fuel-fired EGUs—fossil fuel-fired electric utility steam generating units and stationary combustion turbines. The EPA is finalizing source subcategory-specific emission performance rates that reflect the EPA's application of the BSER. For fossil fuel-fired steam generating units, we are finalizing a performance rate of 1,305 lb CO2
/MWh. For stationary combustion turbines, we are finalizing a performance rate of 771 lb CO2
/MWh. The EPA has also translated the source subcategory-specific CO2
emission performance rates into equivalent statewide rate-based and mass-based CO2
goals and is providing those as an option for states to use.
Under CAA section 111(d), each state must develop, adopt, and then submit its plan to the EPA. For its CAA section 111(d) plan, a state will determine whether to apply these emission performance rates to each affected EGU, individually or together, or to take an alternative approach and meet either an equivalent statewide rate-based goal or an equivalent statewide mass-based
( printed page 64708)
goal, as provided by the EPA in this rulemaking.
States with one or more affected EGUs will be required to develop and implement plans that set emission standards for affected EGUs. The CAA section 111(d) emission guidelines that the EPA is promulgating in this action apply to only the 48 contiguous states and any Indian tribe that has been approved by the EPA pursuant to 40 CFR 49.9 as eligible to develop and implement a CAA section 111(d) plan.[281]
Because Vermont and the District of Columbia do not have affected EGUs, they will not be required to submit a state plan. Because the EPA does not possess all of the information or analytical tools needed to quantify the BSER for the two non-contiguous states with otherwise affected EGUs (Alaska and Hawaii) and the two U.S. territories with otherwise affected EGUs (Guam and Puerto Rico), these emission guidelines do not apply to those areas, and those areas will not be required to submit state plans on the schedule required by this final action.
In developing its CAA section 111(d) plan, a state will have the option of choosing from two different approaches: (1) An “emission standards” approach, or (2) a “state measures” approach. With an emission standards approach, a state will apply all requirements for achieving the subcategory-specific CO2
emission performance rates or the state-specific CO2
emission goal to affected EGUs in the form of federally enforceable emission standards. With a state measures approach, a state plan would be comprised, at least in part, of measures implemented by the state that are not included as federally enforceable components of the plan, along with a backstop of federally enforceable emission standards for affected EGUs that would apply in the event the plan does not achieve its anticipated level of CO2
emission performance.
The EPA is requiring states to make their final plan submittals by September 6, 2016, or to make an initial submittal by this date in order to obtain an extension for making their final plan submittals no later than September 6, 2018, which is 3 years from the signature date of the rule. In order to receive an extension, states, in the initial submittal, must address three required components sufficiently to demonstrate that a state is able to undertake steps and processes necessary to timely submit a final plan by the extended date of September 6, 2018. The first required component is identification of final plan approach or approaches under consideration, including a description of progress made to date. The second required component is an appropriate explanation for why the state requires additional time to submit a final plan beyond September 6, 2016. The third required component for states to address in the initial submittal is a demonstration of how they have been engaging with the public, including vulnerable communities, and a description of how they intend to meaningfully engage with community stakeholders during the additional time (if an extension is granted) for development of the final plan.
Affected EGUs must achieve the final emission performance rates or equivalent state goals by 2030 and maintain that level thereafter. The EPA is establishing an 8-year interim period over which states must achieve the full required reductions to meet the CO2
performance rates, and this begins in 2022. This 8-year interim period from 2022 through 2029, is separated into three steps, 2022-2024, 2025-2027, and 2028-2029, each associated with its own interim CO2
emission performance rates that states must meet, as explained in Section VI of this preamble.
For the final emission guidelines, the EPA is revising the list of components required in a final state plan submittal to reflect: (1) Components required for all state plan submittals; (2) components required for the emission standards approach; and (3) components required for the state measures approach. The revised list of components also reflects the approvability criteria, which are no longer separate from the state plan submittal components.
All state plans must include the following components:
Description of the plan approach and geographic scope
Identification of the state's CO2
interim period goal (for 2022-2029), interim steps (interim step goal 1 for 2022-2024; interim step goal 2 for 2025-2027; interim step goal 3 for 2028-2029) and final CO2
emission goal of 2030 and beyond
Demonstration that the plan submittal is projected to achieve the state's CO2
emission goal [282]
State recordkeeping and reporting requirements
Certification of hearing on state plan
Supporting documentation
Also, in all state plans, as part of the supporting documentation, a state must include a description of how they considered reliability in developing its state plan.
State plan submittals using the emission standards approach must also include:
Identification of each affected EGU; identification of federally enforceable emission standards for the affected EGUs; and monitoring, recordkeeping and reporting requirements.
Demonstrations that each emission standard will result in reductions that are quantifiable, non-duplicative, permanent, verifiable, and enforceable.
State plan submittals using the state measures approach must also include:
Identification of each affected EGU; identification of federally enforceable emission standards for affected EGUs (if applicable); identification of backstop of federally enforceable emission standards; and monitoring, recordkeeping and reporting requirements.
Identification of each state measure and demonstration that each state measure will result in reductions that are quantifiable, non-duplicative, permanent, verifiable, and enforceable.
In addition to these requirements, each state plan must follow the EPA implementing regulations at 40 CFR 60.23.
If a state with affected EGUs does not submit a plan or if the EPA does not approve a state's plan, then under CAA section 111(d)(2)(A), the EPA must establish a plan for that state. A state that has no affected EGUs must document this in a formal negative declaration submitted to the EPA by September 6, 2016. In the case of a tribe that has one or more affected EGUs in its area of Indian country,[283]
the tribe has the opportunity, but not the obligation, to establish a CAA section 111(d) plan for its area of Indian country. If a tribe with one or more affected EGUs located in its area of
( printed page 64709)
Indian country does not submit a plan or does not receive EPA approval of a submitted plan, the EPA has the responsibility to establish a CAA section 111(d) plan for that area if it determines that such a plan is necessary or appropriate.
During implementation of its approved state plan, each state must demonstrate to the EPA that its affected EGUs are meeting the interim and final performance requirements included in this final rule through monitoring and reporting requirements. State plan requirements and flexibilities are described more fully in Section VIII of this preamble.
B. Brief Summary of Legal Basis
This rule is consistent with the requirements of CAA section 111(d) and the implementing regulations.[284]
As an initial matter, the EPA reasonably interprets the provisions identifying which air pollutants are covered under CAA section 111(d) to authorize the EPA to regulate CO2
from fossil fuel-fired EGUs. In addition, the EPA recognizes that CAA section 111(d) applies to sources that, if they were new sources, would be covered under a CAA section 111(b) rule. Concurrently with this rule, the EPA is finalizing a CAA section 111(b) rulemaking establishing standards of performance for CO2
emissions from new fossil fuel-fired EGUs, from modified fossil fuel-fired EGUs, and from reconstructed fossil fuel-fired EGUs, and any of those sets of section 111(b) standards of performance provides the requisite predicate for this rulemaking.
A key step in promulgating requirements under CAA section 111(d)(1) is determining the “best system of emission reduction which . . . the Administrator determines has been adequately demonstrated” (BSER) under CAA section 111(a)(1). It is clear by the terms of section 111(a)(1) and the implementing regulations for section 111(d) that the EPA is authorized to determine the BSER; [285]
accordingly, in this rulemaking, the EPA is determining the BSER.
The EPA is finalizing the BSER for fossil fuel-fired EGUs based on building blocks 1, 2, and 3. Building block 1 includes operational improvements and equipment upgrades that the coal-fired steam-generating EGUs in the state may undertake to improve their heat rate. It qualifies as part of the BSER because it improves the carbon intensity of the affected EGUs in generating electricity through actions the affected sources may undertake that are adequately demonstrated and whose cost is “reasonable.” Building blocks 2 and 3 include increases in low- or zero-emitting generation which substitute for generation from the affected EGUs and thereby reduce CO2
emissions from those sources. All of these measures are components of a “system of emission reduction” for the affected EGUs because they entail actions that the affected EGUs may themselves undertake that have the effect of reducing their emissions. Further, these measures meet the criteria in CAA section 111(a)(1) and the case law for the “best” system of emission reduction that is “adequately demonstrated” because they achieve the appropriate level of reductions, their cost is “reasonable,” they do not have adverse non-air quality health and environmental impacts or impose adverse energy requirements, and they are each well-established among affected EGUs. It should be emphasized that these measures are consistent with current trends in the electricity sector.
Building blocks 2 and 3 may be implemented through a set of measures, including reduced generation from the fossil fuel-fired EGUs. These measures do not, however, reduce the amount of electricity that can be sold or that is available to end users. In addition, states should be expected to allow their affected EGUs to trade rate-based emission credits or mass-based emission allowances (trading) because trading is well-established for this industry and has the effect of focusing costs on the affected EGUs for which reducing emissions is most cost-effective. Because trading facilitates implementation of the building blocks and may help to optimize cost-effectiveness, trading is a method of implementing the BSER as well.
As a result, an affected EGU has a set of choices for achieving its emission standards. For example, an affected coal-fired steam generating unit can achieve a rate-based standard through a set of actions that implement the building block 1 measures and that implement the building block 2 and 3 measures through a set of actions that range from purchasing full or partial interest in existing NGCC or new RE assets to purchasing ERCs that represent the environmental attributes of increased NGCC generation or new renewable generation. In addition, the affected EGU may reduce its generation and thereby reduce the extent that it needs to implement the building blocks. The affected EGU may also purchase rate-based emission credits from other affected EGUs. If the state chooses to impose a mass-based emission standard, the coal-fired steam generating unit may implement building block 1 measures, purchase mass-based emission allowances from other affected EGUs, or reduce its generation. In light of the available sources of lower- and zero-emitting replacement generation, this approach would achieve an appropriate level of emission reductions and maintain the reliability of the electricity system.
With the promulgation of the emission guidelines, each state must develop and submit a plan to achieve the CO2
emission performance rates established by the EPA or the equivalent statewide rate-based or mass-based goal provided by the EPA in this rule. The EPA interprets CAA section 111(d) to allow states to establish standards of performance and provide for their implementation and enforcement through either the “emission standards” or the “state measures” plan type. In the case of the “emission standards” plan type, the emission standards establish standards of performance, and the other components of the plan provide for their implementation and enforcement. In the case of the “state measures” plan type, -the state submits a plan that relies upon measures that are only enforceable as a matter of state law that will, in conjunction with any emission standards on affected EGUs, result in the achievement of the applicable performance rates or state goals by the affected EGUs. Under the state measures plan type, states must also submit a federally enforceable backstop and a mechanism that would trigger implementation of the backstop; therefore, in a state measures plan, the standards of performance take the form of the backstop, the trigger mechanism provides for the implementation of such backstop, and the other required components of the plan provide for
( printed page 64710)
implementation and enforcement of the standards of performance.
These two types of state plans and their respective approaches, which could be implemented on a single-state or multi-state basis, allow states to meet the statutory requirements of section 111(d) while accommodating the wide range of regulatory requirements and other programs that states have deployed or will deploy in the electricity sector that reduce CO2
emissions from affected EGUs. It should be noted that both state plan types allow the state flexibility in assigning the emission performance obligations to its affected EGUs in the form of standards of performance as long as the required emission performance level is met. Both plan types harness the efficiencies of emission reduction opportunities in the interconnected electricity system and are fully consistent with the principles of cooperative federalism that underlie the Clean Air Act generally and CAA section 111(d) particularly. That is, both plan types achieve the emission performance requirements through the vehicle of a state plan, and provide each state significant flexibility to take local circumstances and state policy goals into account in determining how to reduce emissions from its affected sources, as long as the plan meets minimum federal requirements.
Both state plan types, and the standards of performance for the affected EGUs that the states will establish through the state plan process, are consistent with the applicable CAA section 111 provisions. A state has discretion in determining the appropriate measures to rely upon for its plan. The state may adopt measures that assure the achievement of the requisite CO2
emission performance rate or state goal by the affected EGUs, and is not limited to the measures that the EPA identifies as part of the BSER.
In this rulemaking, the EPA establishes reasonable deadlines for state plan submission. Under CAA section 111(d)(1), state plans must “provide for implementation and enforcement” of the standards of performance, and under CAA section 111(d)(2), the state plans must be “satisfactory” for the EPA to approve them. In this rulemaking, the EPA is finalizing the criteria that the state plans must meet under these requirements.
The EPA discusses its legal interpretation in more detail in other parts of this preamble and provides additional information about certain issues in the Legal Memorandum included in the docket for this rulemaking.
IV. Authority for This Rulemaking, Definition of Affected Sources, and Treatment of Source Categories
A. EPA's Authority Under CAA Section 111(d)
EPA's authority for this rule is CAA section 111(d). CAA section 111(d) provides that the EPA will promulgate regulations under which each state will establish standards of performance for existing sources for any air pollutant that meets two criteria. First, CAA section 111(d) applies to air pollutants that are not regulated as a criteria pollutant under section 108 or as a hazardous air pollutant (HAP) under CAA section 112. 42 U.S.C. 7411(d)(1)(A)(i).[286]
Second, section 111(d) applies only to air pollutants for which the existing source would be regulated under section 111 if it were a new source. 42 U.S.C. 7411(d)(1)(A)(ii). Here, carbon dioxide (CO2) meets both criteria: (1) It is not a criteria pollutant regulated under section 108 nor a HAP regulated under CAA section 112, and (2) CO2
emissions from new power plants (including newly constructed, modified and reconstructed power plants) are regulated under the CAA section 111(b) rule that is being finalized along with this rule.
B. CAA Section 112 Exclusion to CAA Section 111(d) Authority
CAA section 111(d) contains an exclusion that limits the regulation under CAA section 111(d) of air pollutants that are regulated under CAA section 112. 42 U.S.C. 7411(d)(1)(A)(i). This “Section 112 Exclusion” in CAA section 111(d) was the subject of a significant number of comments based on two differing amendments to this exclusion enacted in the 1990 CAA Amendments. As discussed in more detail below, the House and the Senate each initially passed different amendments to the Section 112 Exclusion and both amendments were ultimately passed by both houses and signed into law. In 2005, in connection with the Clean Air Mercury Rule (CAMR), the EPA discussed the agency's interpretation of the Section 112 Exclusion in light of these two differing amendments and concluded that the two amendments were in conflict and that the provision should be read as follows to give both amendments meaning: where a source category has been regulated under CAA section 112, a CAA section 111(d) standard of performance cannot be established to address any HAP listed under CAA section 112(b) that may be emitted from that particular source category. See 70 FR 15994, 16029-32 (March 29, 2005).
In June 2014, the EPA presented this previous interpretation as part of the proposal and requested comment on it. The EPA received numerous comments on its previous interpretation, including comments on the proper interpretation and effect of each of the two differing amendments, and whether the Section 112 Exclusion should be read to mean that the EPA's regulation of HAP from power plants under CAA section 112 bars the EPA from establishing CAA section 111(d) regulations covering CO2
emissions from power plants. In particular, many comments focused on two specific issues. First, some commenters—including some industry and state commenters that had previously endorsed the EPA's interpretation of the Section 112 Exclusion in other contexts [287]
—argued that the EPA's 2005 interpretation was in error because it allowed the regulation of certain pollutants from source categories under CAA section 111(d) when those source categories were also regulated for different pollutants under CAA section 112. Second, some commenters argued that the EPA's previous interpretation of the House amendment (as originally represented in 2005 at 70 FR at 16029-30) was in error because it improperly read that amendment as focusing on whether a source category was regulated under CAA section 112 rather than on whether the air pollutant was regulated under CAA section 112, and that improper reading lead to an interpretation that was inconsistent with the structure and purpose of the CAA.
In light of the comments, the EPA has reconsidered its previous interpretation of the Section 112 Exclusion and, in particular, considered whether the exclusion precludes the regulation under CAA section 111(d) of CO2
from power plants given that power plants are regulated for certain HAP under CAA section 112. On this issue, the EPA
( printed page 64711)
has concluded that the two differing amendments are not properly read as conflicting. Instead, the House amendment and the Senate Amendment should each be read to mean the same in the context presented by this rule: that the Section 112 Exclusion does not bar the regulation under CAA section 111(d) of non-HAP from a source category, regardless of whether that source category is subject to standards for HAP under CAA section 112. In reaching this conclusion, the EPA has revised its previous interpretation of the House amendment, as discussed below.
1. Structure of the CAA and Pre-1990 Section 112 Exclusion
The Clean Air Act sets out a comprehensive scheme for air pollution control, addressing three general categories of pollutants emitted from stationary sources: (1) Criteria pollutants (which are addressed in sections 108-110); (2) hazardous pollutants (which are addressed under section 112); and (3) “pollutants that are (or may be) harmful to public health or welfare but are not or cannot be controlled under sections 108-110 or 112.” 40 FR 53340 (Nov. 17, 1975).
Six “criteria” pollutants are regulated under sections 108-110. These are pollutants that the Administrator has concluded “cause or contribute to air pollution which may reasonably be anticipated to endanger public health or welfare;” “the presence of which in the ambient air results from numerous and diverse mobile or stationary sources;” and for which the Administrator has issued, or plans to issue, “air quality criteria. 42 U.S.C. 7408(a)(1). Once the EPA issues air quality criteria for such pollutants, the Administrator must propose primary National Ambient Air Quality Standards (NAAQS) for them, set at levels “requisite to protect the public health” with an “adequate margin of safety.” 42 U.S.C. 7409(a)-(b). States must then adopt plans for implementing NAAQS. 42 U.S.C. 7410.
HAP are regulated under CAA section 112 and include the pollutants listed by Congress in section 112(b)(1) and other pollutants that the EPA lists under sections 112(b)(2) and (b)(3). CAA section 112 further provides that the EPA will publish and revise a list of “major” and “area” source categories of HAP, and then establish emissions standards for HAP emitted by sources within each listed category. 42 U.S.C. 7412(c)(1) & (2).
CAA section 111, 42 U.S.C. 7411, is the third part of the CAA's structure for regulating stationary sources. Section 111 has two main components. First, section 111(b) requires the EPA to promulgate federal “standards of performance” addressing
new
stationary sources that cause or contribute significantly to “air pollution which may reasonably be anticipated to endanger public health or welfare.” 42 U.S.C. 7411(b)(1)(A). Once the EPA has set
new
source standards addressing emissions of a particular pollutant under CAA section 111(b), CAA section 111(d) provides that the EPA will promulgate regulations requiring states to establish standards of performance for
existing
stationary sources of the same pollutant. 42 U.S.C. 7411(d)(1).
Together, the criteria pollutant/NAAQS provisions in sections 108-110, the hazardous air pollutant provisions in section 112, and performance standard provisions in section 111 constitute a comprehensive scheme to regulate air pollutants with “no gaps in control activities pertaining to stationary source emissions that pose any significant danger to public health or welfare.” S. Rep. No. 91-1196, at 20 (1970).[288]
The specific role of CAA section 111(d) in this structure can be seen in CAA subsection 111(d)(1)(A)(i), which provides that regulation under CAA section 111(d) is intended to cover pollutants that are not regulated under either the criteria pollutant/NAAQS provisions or section 112. Prior to 1990, this limitation was laid out in plain language, which stated that CAA section 111(d) regulation applied to “any air pollutant . . . for which air quality criteria have not been issued or which is not included on a list published under section [108(a)] or [112(b)(1)(A)].” This plain language demonstrated that section 111(d) is designed to regulate pollutants from existing sources that fall in the gap not covered by the criteria pollutant provisions or the hazardous air pollutant provisions.
This gap-filling purpose can be seen in the early legislative history of the CAA. As originally enacted in the 1970 CAA, the precursor to CAA section 111 (which was originally section 114) was described as covering pollutants that would not be controlled by the criteria pollutant provisions or the hazardous air pollutant provisions. See S. Committee Rep. to accompany S. 4358 (Sept. 17, 1970), 1970 CAA Legis. Hist. at 420 (“It should be noted that the emission standards for pollutants which cannot be considered hazardous (as defined in section 115 [which later became section 112]) could be established under section 114 [later, section 111]. Thus, there should be no gaps in control activities pertaining to stationary source emissions that pose any significant danger to public health or welfare.”); Statement by S. Muskie, S. Debate on S. 4358 (Sept. 21, 1970), 1970 CAA Legis. Hist. at 227 (“[T]he bill [in section 114] provides the Secretary with the authority to set emission standards for selected pollutants which cannot be controlled through the ambient air quality standards and which are not hazardous substances.”).
2. The 1990 Amendments to the Section 112 Exclusion
The Act was amended extensively in 1990. Among other things, Congress sought to accelerate the EPA's regulation of hazardous pollutants under section 112. To that end, Congress established a lengthy list of HAP; set criteria for listing “source categories” of such pollutants; and required the EPA to establish standards for each listed source category's hazardous pollutant emissions. 42 U.S.C. 7412(b), (c) and (d). In the course of overhauling the regulation of HAP under section 112, Congress needed to edit section 111(d)'s reference to section 112(b)(1)(A), which was to be eliminated as part of the revisions to section 112.
To address the obsolete cross-reference to section 7412(b)(1)(A), Congress passed two differing amendments—one from the Senate and one from the House—that were never reconciled in conference. The Senate amendment replaced the cross reference to old section 112(b)(1)(A) with a cross-reference to new section 112. Pub. L. 101-549, § 302(a), 104 Stat. 2399, 2574 (1990). The House amendment replaced the cross-reference with the phrase “emitted from a source category which is regulated under section [112].” Pub. L. 101-549, § 108(g), 104 Stat. 2399, 2467 (1990).[289]
Both amendments were
( printed page 64712)
enacted into law, and thus both are part of the current CAA. To determine how this provision is properly applied in light of the two differing amendments, we first look at the Senate amendment, then at the House amendment, then discuss how the two amendments are properly read together.
3. The Senate Amendment is Clear and Unambiguous
Unlike the ambiguous amendment to CAA section 111(d) in the House amendment (discussed below), the Senate amendment is straightforward and unambiguous. It maintained the pre-1990 meaning of the Section 112 Exclusion by simply substituting “section 112(b)” for the prior cross-reference to “section 112(b)(1)(A).” Pub. L. 101-549, § 302(a), 104 Stat. 2399, 2574 (1990). So amended, CAA section 111(d) mandates that the EPA require states to submit plans establishing standards for “any air pollutant . . . which is not included on a list published under section [108(a)] or section [112(b)].” Thus, the Section 112 Exclusion resulting from the Senate amendment would preclude CAA section 111(d) regulation of HAP emission but would not preclude CAA section 111(d) regulation of CO2
emissions from power plants notwithstanding that power plants are also regulated for HAP under CAA section 112.
Some commenters have argued that the Senate amendment should be given no effect, because only the House amendment is shown in the U.S. Code, and because the Senate amendment appeared under the heading “conforming amendments,” and for various other reasons. The EPA disagrees. The Senate amendment, like the House amendment, was enacted into law as part of the 1990 CAA amendments, and must be given effect.
First, that the U.S. Code only reflects the House amendment does not change the fact that both amendments were signed into law as part of the 1990 Amendments, as shown in the Statutes at Large. Pub. L. 101-549, §§ 108(g) and 302(a), 104 Stat. 2399, 2467, 2574 (1990). Where there is a conflict between the U.S. Code and the Statutes at Large, the latter controls. See 1 U.S.C. 112 & 204(a);
Stephan
v.
United States,
319 U.S. 423, 426 (1943) (“the Code cannot prevail over the Statutes at Large when the two are inconsistent”);
Five Flags Pipe Line Co.
v.
Dep't of Transp.,
854 F.2d 1438, 1440 (D.C. Cir. 1988) (“[W]here the language of the Statutes at Large conflicts with the language in the United States Code that has not been enacted into positive law, the language of the Statutes at Large controls.”).
Second, the “conforming” label is irrelevant. A “conforming” amendment may be either substantive or non-substantive.
Burgess
v.
United States,
553 U.S. 124, 135 (2008). And while the House Amendment contains more words, it also qualifies as a “conforming amendment” under the definition in the Senate Legislative Drafting Manual, Section 126(b)(2) (defining “conforming amendments” as those “necessitated by the substantive amendments of provisions of the bill”). Here, both the House and Senate amendments were “necessitated by” Congress' revisions to section 112 in the 1990 CAA Amendment, which included the deletion of old section 112(b)(1)(A). Thus, the House's amendment is no less “conforming” than the Senate's, and the heading under which it was enacted (“Miscellaneous Guidance”) does not suggest any more importance than “Conforming Amendments.” In any event, courts gives full effect to conforming amendments,
see Washington Hosp. Ctr.
v.
Bowen,
795 F.2d 139, 149 (D.C. Cir. 1986), and so neither the Senate Amendment nor the House amendment can be ignored.
Third, the legislative history of the Senate amendment supports the conclusion that the substitution of the updated cross-reference was not a mindless, ministerial decision, but reflected a decision to choose an update of the cross reference instead of the text that was inserted into the Section 112 Exclusion by the House amendment. In mid-1989, the House and Senate introduced identical bills (H.R. 3030 and S. 1490, respectively) to provide for “miscellaneous” changes to the CAA. In both the Senate and House bills as they were introduced in mid-1989, the Section 112 Exclusion was to be amended by taking out “or 112(b)(1)(A)” and inserting “or emitted from a source category which is regulated under section 112.” H.R. 3030, as introduced, 101st Cong. § 108 (Jul. 27, 1989); S. 1490, as introduced, 101st Cong. § 108 (Aug. 3, 1989). See 1990 CAA Legis. Hist. at 3857 (noting that H.R. 3030 and S.1490, as introduced, were the same). Although S. 1490 was identical to H.R. 3030 when they were introduced, the Senate reported a vastly different bill (S.1630) at the end of 1989. See
S. 1630, as reported (Dec. 20, 1989), 1990 CAA Legis. Hist. at 7906. As reported and eventually passed, S. 1630 did not contain the text in the House amendment (“or emitted from a source category which is regulated under section 112”) and instead contained the substitution of cross references (changing “section 112(b)(1)(A)” to “section 112(b)”).
See
S. 1630, as reported, 101st Cong. § 305, 1990 CAA Legis. Hist. at 8153; S. 1630, as passed, § 305 (Apr. 3, 1990), 1990 CAA Legis. Hist. at 4534. Though the EPA is not aware of any statements in the legislative history that expressly explain the Senate's intent in making these changes to the Senate bill, the sequence itself supports the conclusion that the Senate's substitution reflects a decision to retain the pre-1990 approach of using a cross-reference to 112(b) to define the scope of the Section 112 Exclusion. Whether the difference in approach between the final Senate amendment in S.1630 and the House amendment in H.R. 3030 creates a substantive difference or are simply two different means of achieving the same end depends on what interpretation one gives to the text in the House amendment, which we turn to next.
4. The House Amendment
a.
The House amendment is ambiguous.
Before looking at the specific text of the House amendment, it is helpful to review some principles of statutory interpretation. First, statutory interpretation begins with the text, but does not end there. As the D.C. Circuit Court has explained, “[t]he literal language of a provision taken out of context cannot provide conclusive proof of congressional intent.”
Bell Atlantic Telephone Cos.
v.
F.C.C.,
131 F.3d 1044, 1047 (D.C. Cir. 1977). See
King
v.
Burwell, 2015 U.S. LEXIS 4248, *19(“[O]ftentimes the `meaning—or ambiguity—of certain words or phrases may only become evident when placed in context.'
Brown & Williamson,
529 U. S., at 132, 120 S. Ct. 1291, 146 L. Ed. 2d 121. So when deciding whether the language is plain, we must read the words `in their context and with a view to their place in the overall statutory scheme.' Id., at 133, 120 S. Ct. 1291, 146 L. Ed. 2d 121 (internal quotation marks omitted). Our duty, after all, is `to construe statutes, not isolated provisions.'
Graham County Soil and
( printed page 64713)
Water Conservation Dist.
v.
United States ex rel. Wilson,
559 U. S. 280, 290, 130 S. Ct. 1396, 176 L. Ed. 2d 225 (2010) (internal quotation marks omitted).”). In addition, statutes should not be given a “hyperliteral” reading that is contrary to established canons of statutory construction and common sense.
See RadLAX Gateway Hotel
v.
Amalgamated Bank,
132 S.Ct. 2065, 2070-71 (2012).
Further, a proper reading of statutory text “must employ all the tools of statutory interpretation, including text, structure, purpose, and legislative history.”
Loving
v.
I.R.S.,
742 F.3d 1013, 1016 (D.C. Cir. 2014) (internal quotation omitted). See, also,
Robinson
v.
Shell Oil Co.,
519 U.S. 337, 341 (1997) (statutory interpretation involves consideration of “the language itself, the specific context in which that language is used, and the broader context of the statute as a whole.”). Moreover, one principle of statutory construction that has particular application here is that provisions in a statute should be read to be consistent, rather than conflicting, if possible. This principle was discussed in the recent case of
Scialabba
v.
Cuellar De Osorio,
134 S. Ct. 2191, 2214 (concurring opinion by Chief Justice Roberts and Justice Scalia), 2219-2220 (dissent by Justices Sotomayor, Breyer and Thomas)(2014). As Justice Sotomayor wrote (at 134 S. Ct. at 2220):
“We do not lightly presume that Congress has legislated in self-contradicting terms. See A. Scalia & B. Garner, Reading Law: The Interpretation of Legal Texts 180 (2012) (“The provisions of a text should be interpreted in a way that renders them compatible, not contradictory. . . . [T]here can be no justification for needlessly rendering provisions in conflict if they can be interpreted harmoniously”). . . . Thus, time and again we have stressed our duty to “fit, if possible, all parts [of a statute] into [a] harmonious whole.”
FTC
v.
Mandel Brothers, Inc., 359 U.S. 385, 389, 79 S. Ct. 818, 3 L. Ed. 2d 893 (1959); see also
Morton
v.
Mancari, 417 U.S. 535, 551, 94 S. Ct. 2474, 41 L. Ed. 2d 290 (1974) (when two provisions “are capable of co-existence, it is the duty of the courts . . . to regard each as effective”). In reviewing an agency's construction of a statute, courts “must,” we have emphasized, “interpret the statute `as a . . . coherent regulatory scheme' ” rather than an internally inconsistent muddle, at war with itself and defective from the day it was written. Brown & Williamson, 529 U.S., at 133, 120 S. Ct. 1291, 146 L. Ed. 2d 121.
As amended by the House, CAA section 111(d)(1)(A)(i) limits CAA section 111(d) to any air pollutant “for which air quality criteria have not been issued or which is not included on a list published under section 7408(a) of this title or emitted from a source category which is regulated under section 7412 of this title . . .” This statutory text is ambiguous and subject to numerous possible readings.
First, the text of the House-amended version of CAA section 111(d) could be read literally as authorizing the regulation of any pollutant that is not a criteria pollutant. This reading arises if one focuses on the use of “or” to join the three clauses:
The Administrator shall prescribe regulations . . . under which each State shall submit to the Administrator a plan which establishes standards of performance for any existing source for any air pollutant [1] for which air quality criteria have not been issued or [2] which is not included on a list published under section 7408(a) of this title or [3] emitted from a source category which is regulated under section 7412 of this title. . . .
42 U.S.C. 7411(d)(1) (emphasis and internal numbering added). Because the text contains the conjunction “or” rather than “and” between the three clauses, a literal reading could read the three clauses as alternatives, rather than requirements to be imposed simultaneously. In other words, a literal reading of the language of section 111(d) provides that the Administrator may require states to establish standards for an air pollutant so long as
either
air quality criteria have not been established for that pollutant,
or
one of the remaining criteria is met. If this reading were applied to determine whether the EPA may promulgate CAA section 111(d) regulations for CO2
from power plants, the result would be that CO2
from power plants could be regulated under CAA section 111(b) because air quality criteria have not been issued for CO2
and therefore whether CO2
or power plants are regulated under CAA section 112 would be irrelevant. This reading, however, is not a reasonable reading of the statute because, among other reasons, it gives little or no meaning to the limitation covering HAP that are regulated under CAA section 112 and thus is contrary to both the CAA's comprehensive scheme created by the three sets of provisions (under which CAA section 111 is not intended to duplicate the regulation of pollutants regulated under section 112) and the principle of statutory construction that text should not be construed such that a provision does not have effect.
A second reading of CAA section 111(d) as revised by the House amendment focuses on the lack of a negative before the third clause. That is, unlike the first and second clauses that each contain negative phrases (either “has not been issued” or “which is not included”), the third clause does not. One could presume that the negative from the second clause was intended to carry over, implicitly inserting another “which is not” before “emitted from a source category which is regulated under section [112].” But that is a presumption, and not the plain language of the statute. The text as amended by the House says that the EPA “shall” prescribe regulations for “any air pollutant . . . emitted from a source category which is regulated under section [112].” 42 U.S.C. 7411(d)(1). Thus, CAA section 111(d)(1)(A)(i) could be read as providing for the regulation of emissions of pollutants if they are emitted from a source category that is regulated under CAA section 112. Like the first reading discussed above, this reading would authorize the regulation of CO2
emissions from existing power plants under CAA section 111(d). But, this second reading is not reasonable because it would provide for the regulation of a source's HAP emissions under CAA section 111(d) when those same emissions were also subject to standards under CAA section 112. Thus, this reading would be contrary to Congress's intent that CAA section 111(d) regulation fill the gap between the other programs by covering pollutants that the other programs do not, but not duplicate the regulation of pollutants that the other programs cover.
If one does presume that the “which is not” phrase is intended to carry over to the third clause, then CAA section 111(d) regulation under the House amendment would be limited to “any air pollutant . . . which is not . . . emitted from a source category which is regulated under section [112].” Even with this presumption, however, the House amendment contains further ambiguities with respect to the phrases “a source category” and “regulated under section 112,” and how those phrases are used within the structure of the provision limiting what air pollutants may be regulated under CAA section 111(d).
The phrase “regulated under section 112” is ambiguous. As the Supreme Court has explained in the context of other statutes using a variation of the word “regulate,” an agency must consider what is being regulated. See
Rush Prudential HMO, Inc.
v.
Moran,
536 U.S. 355, 366 (2002) (It is necessary to “pars[e] . . . the `what' ” of the term “regulates.”);
UNUM Life Ins. Co. of Am.
v.
Ward,
526 U.S. 358, 363 (1999) (the term “ `regulates insurance' . . . requires interpretation, for [its] meaning is not plain.”). Here, one possible reading is that the phase modifies the words “a source category” without
( printed page 64714)
regard to what pollutants are regulated under section 112, which then presents the issue of what meaning to give to the phrase “a source category.”
Under this reading, and assuming the phrase “a source category” is read to mean the particular source category, the House amendment would preclude the regulation under CAA section 111(d) of a specific source category for any pollutant if that source category has been regulated for any HAP under CAA section 112.[290]
The effect of this reading would be to preclude the regulation of CO2
from power plants under CAA section 111(d) because power plants have been regulated for HAP under CAA section 112. This is the interpretation that the EPA applied to the House amendment in connection with the CAMR rule in 2005, when looking at the question of whether HAP can be regulated under CAA section 111(d) for a source category that is not regulated for HAP under section 112, and some commenters have advocated for this interpretation here. But, after considering all of the comments and reconsidering this interpretation, the EPA has concluded that this interpretation of the House amendment is not a reasonable reading because it would disrupt the comprehensive scheme for regulating existing sources created by the three sets of provisions covering criteria pollutants, HAP and the other pollutants that fall outside of those two programs and frustrate the role that section 111 is intended to play.[291]
Specifically, under this interpretation, the EPA could not regulate a source category's emissions of
HAP
under CAA section 112, and then promulgate regulations for
other
pollutants from that source category under CAA section 111(d).[292]
There is no reason to conclude that the House amendment was intended to abandon the existing structure and relationship between the three programs in this way. Indeed, Congress expressly provided that regulation under CAA section 112 was
not
to “diminish or replace the requirements of” the EPA's regulation of non-hazardous pollutants under section 7411. See 42 U.S.C. 7412(d)(7). Further, consistent with CAA section 112's direction that EPA list “all categories and subcategories of major sources and area [aka, non-major] sources” of HAP and then establish CAA section 112 standards for those categories and subcategories, 42 U.S.C. 7412(c)(1) and (c)(2), the EPA has listed and regulated over 140 categories of sources under CAA section 112. Thus, this reading would eviscerate the EPA's authority under section 111(d) and prevent it from serving as the gap-filling provision within the comprehensive scheme of the CAA as Congress intended.[293]
In short, it is not reasonable to interpret the Section 112 Exclusion in section 111(d) to mean that the existence of CAA section 112 standards covering hazardous pollutants from a source category would entirely eliminate regulation of non-hazardous emissions from that source category under section 111(d).[294]
b.
The EPA's Interpretation of the House Amendment.
Having concluded that the interpretations discussed above are not reasonable, the EPA now turns to what it has concluded is the best, and sole reasonable, interpretation of the House amendment as it applies to the issue here.
The EPA's interpretation of the House amendment as applied to the issue presented in this rule is that the Section 112 Exclusion excludes the regulation of HAP under CAA section 112 if the source category at issue is regulated under CAA section 112, but does not exclude the regulation of other pollutants, regardless of whether that source category is subject to CAA section 112 standards. This interpretation reads the phrase “regulated under section 112” as modifying the words “source category” (as does the interpretation discussed above) but also recognizes that the phrase “regulated under section 112” refers only to the regulation of HAP emissions. In other words, the EPA's interpretation recognizes that source categories “regulated under section 112” are not regulated by CAA section 112 with respect to all pollutants, but only with respect to HAP. Thus, it is reasonable to interpret the House amendment of the Section 112 Exclusion as only excluding the regulation of HAP emissions under CAA section 111(d) and only when that source category is regulated under CAA section 112. We note that this interpretation of the House amendment alone is the same as the 2005 CAMR interpretation of the two amendments combined: Where a source category has been regulated under CAA section 112, a CAA section 111(d) standard of performance cannot be established to address any HAP listed under CAA section 112(b) that may be emitted from that particular source category. See 70 FR 15994, 16029-30 (March 29, 2005).
( printed page 64715)
There are a number of reasons why the EPA's interpretation is reasonable and avoids the issues discussed above.
First, the EPA's interpretation reads the House amendment to the Section 112 Exclusion as determining the scope of what air pollutants are to be regulated under CAA section 111(d), as opposed to creating a wholesale exclusion for source categories. The other text in subsections 111(d)(1)(A)(i) and (ii) modify the phrase “any air pollutant.” Thus, reading the Section 112 Exclusion to also address the question of what air pollutants may be regulated under CAA section 111(d) is consistent with the overall structure and focus of CAA section 111(d)(1)(A).
Second, the EPA's interpretation furthers—rather than undermines—the purpose of CAA section 111(d) within the long-standing structure of the CAA. That is, this interpretation supports the comprehensive structure for regulating various pollutants from existing sources under the criteria pollutant/NAAQS program under sections 108-110, the HAP program under section 112, and other pollutants under section 111(d), and avoids creating a gap in that structure. See
King
v.
Burwell, 2015 U.S. LEXIS 4248, *28 (2015)(“A provision that may seem ambiguous in isolation is often clarified by the remainder of the statutory scheme . . . because only one of the permissible meanings produces a substantive effect that is compatible with the rest of the law.”) (quoting
United Sav. Assn. of Tex.
v.
Timbers of Inwood Forest Associates,
Ltd., 484 U. S. 365, 371, 108 S. Ct. 626, 98 L. Ed. 2d 740 (1988)”)
Third, by avoiding the creation of gaps in the statutory structure, the EPA's interpretation is consistent with the legislative history demonstrating that Congress's intent in the 1990 CAA Amendments was to expand the EPA's regulatory authority across the board, compelling the agency to regulate more pollutants, under more programs, more quickly.[295]
Conversely, the EPA is aware of no statement in the legislative history indicating that Congress simultaneously sought to restrict the EPA's authority under CAA section 111(d) or to create gaps in the comprehensive structure of the statute. If Congress had intended this amendment to make such a change, one would expect to see some indication of that in the legislative history.
Fourth, when applied in the context of this rule, the EPA's interpretation of the House amendment is consistent with the Senate amendment. Thus, this interpretation avoids creating a conflict within the statute. See discussion above of
Scialabba
v.
Cuellar De Osorio,
134 S. Ct. 2191 at 2220 (citing and quoting, among other authorities, A. Scalia & B. Garner, Reading Law: The Interpretation of Legal Texts 180 (2012) (“The provisions of a text should be interpreted in a way that renders them compatible, not contradictory. . . . [T]here can be no justification for needlessly rendering provisions in conflict if they can be interpreted harmoniously”)).
In sum, when this interpretation of the House amendment is applied in the context of this rule, the result is that the EPA may promulgate CAA section 111(d) regulations covering carbon dioxide emissions from existing power plants notwithstanding that power plants are regulated for their HAP emissions under CAA section 112.
5. The Two Amendments Are Easily Reconciled and Can Be Given Full Effect
Given that both the House and Senate amendments should be read individually as having the same meaning in the context presented in this rule, giving each amendment full effect is straight-forward: The Section 112 Exclusion in section 111(d) does not foreclose the regulation of non-HAP from a source category regardless of whether that source category is also regulated under CAA section 112. As applied here, the EPA has the authority to promulgate CAA section 111(d) regulations for CO2
from power plants notwithstanding that power plants are regulated for HAP under CAA section 112.
C. Authority To Regulate EGUs
In a separate, concurrent action, the EPA is also finalizing a CAA section 111(b) rulemaking that regulates CO2
emissions from new, modified, and reconstructed EGUs. The promulgation of these standards provides the requisite predicate for applicability of CAA section 111(d).
CAA section 111(d)(1) requires the EPA to promulgate regulations under which states must submit state plans regulating “any existing source” of certain pollutants “to which a standard of performance would apply if such existing source were a new source.” A “new source” is “any stationary source, the construction or modification of which is commenced after the publication of regulations (or, if earlier, proposed regulations) prescribing a standard of performance under [CAA section 111] which will be applicable to such source.” It should be noted that these provisions make clear that a “new source” includes one that undertakes either new construction or a modification. It should also be noted that the EPA's implementing regulations define “construction” to include “reconstruction,” which the implementing regulations go on to define as the replacement of components of an existing facility to an extent that (i) the fixed capital cost of the new components exceeds 50 percent of the fixed capital cost that would be required to construct a comparable entirely new facility, and (ii) it is technologically and economically feasible to meet the applicable standards.
Under CAA section 111(d)(1), in order for existing sources to become subject to that provision, the EPA must promulgate standards of performance under CAA section 111(b) to which, if the existing sources were new sources, they would be subject. Those standards of performance may include standards for sources that undertake new construction, modifications, or reconstructions.
The EPA is finalizing a rulemaking under CAA section 111(b) for CO2
emissions from affected EGUs concurrently with this CAA section 111(d) rulemaking, which will provide the requisite predicate for applicability of CAA section 111(d).[296]
D. Definition of Affected Sources
For the emission guidelines, an affected EGU is any fossil fuel-fired electric utility steam generating unit (
i.e.,
utility boiler or integrated gasification combined cycle (IGCC) unit) or stationary combustion turbine that was in operation or had commenced
( printed page 64716)
construction as of January 8, 2014,[297]
and that meets the following criteria, which differ depending on the type of unit. To be an affected EGU, such a unit, if it is a fossil fuel-fired electric utility steam generating unit (
i.e.,
a utility boiler or IGCC unit), must serve a generator capable of selling greater than 25 MW to a utility power distribution system and have a base load rating greater than 260 GJ/h (250 MMBtu/h) heat input of fossil fuel (either alone or in combination with any other fuel). If such a unit is a stationary combustion turbine, the unit must meet the definition of a combined cycle or combined heat and power combustion turbine, serve a generator capable of selling greater than 25 MW to a utility power distribution system, and have a base load rating of greater than 260 GJ/h (250 MMBtu/h).
When considering and understanding applicability, the following definitions may be helpful. Simple cycle combustion turbine means any stationary combustion turbine which does not recover heat from the combustion turbine engine exhaust gases for purposes other than enhancing the performance of the stationary combustion turbine itself. Combined cycle combustion turbine means any stationary combustion turbine which recovers heat from the combustion turbine engine exhaust gases to generate steam that is used to create additional electric power output in a steam turbine. Combined heat and power (CHP) combustion turbine means any stationary combustion turbine which recovers heat from the combustion turbine engine exhaust gases to heat water or another medium, generate steam for useful purposes other than exclusively for additional electric generation, or directly uses the heat in the exhaust gases for a useful purpose.
We note that certain affected EGUs are exempt from inclusion in a state plan. Affected EGUs that may be excluded from a state's plan are (1) those units that are subject to subpart TTTT as a result of commencing modification or reconstruction; (2) steam generating units or IGCC units that are currently and always have been subject to a federally enforceable permit limiting net-electric sales to one-third or less of its potential electric output or 219,000 MWh or less on an annual basis; (3) non-fossil units (
i.e.,
units that are capable of combusting 50 percent or more non-fossil fuel) that have historically limited the use of fossil fuels to 10 percent or less of the annual capacity factor or are subject to a federally enforceable permit limiting fossil fuel use to 10 percent or less of the annual capacity factor; (4) stationary combustion turbines that are not capable of combusting natural gas (
i.e.,
not connected to a natural gas pipeline); (5) combined heat and power units that are subject to a federally enforceable permit limiting, or have historically limited, annual net electric sales to a utility power distribution system to the product of the design efficiency and the potential electric output or 219,000 MWh (whichever is greater) or less; (6) units that serve a generator along with other steam generating unit(s), IGCC(s), or stationary combustion turbine(s) where the effective generation capacity (determined based on a prorated output of the base load rating of each steam generating unit, IGCC, or stationary combustion turbine) is 25 MW or less; (7) municipal waste combustor unit subject to subpart Eb of Part 60; or (8) commercial or industrial solid waste incineration units that are subject to subpart CCCC of Part 60.
The rationale for applicability of this final rule is multi-fold. We had proposed that affected EGUs were those existing fossil fuel-fired EGUs that met the applicability criteria for coverage under the final GHG standards for new fossil fuel-fired EGUs being promulgated under section 111(b). However, we are finalizing that States need not include certain units that would otherwise meet the CAA section 111(b) applicability in this CAA section 111(d) emission guidelines. These include simple cycle turbines, certain non-fossil units, and certain combined heat and power units. The final 111(b) standards include applicability criteria for simple cycle combustion turbines, for reasons relating to implementation and minimizing emissions from all future combustion turbines. However, for the following reasons none of the building blocks would result in emission reductions from simple cycle turbines so we are not requiring that States including them in their CAA section 111(d) plans.
First, even more than combined cycle units, simple cycle units have limited opportunities, compared to steam generating units, to reduce their heat rate. Most combustion turbines likely already follow the manufacturer's recommended regular preventive/restorative maintenance for both reliable and efficiency reasons. These regularly scheduled maintenance practices are highly effective methods to maintain heat rates, and additional fleet-wide reductions from simple cycle combustion turbines are likely less than 2 percent. In addition, while approximately one-fifth of overall fossil fuel-fired capacity (GW) consists of simple cycle turbines, these units historically have operated at capacity factors of less than 5 percent and only provide about 1 percent of the fossil fuel-fired generation (GWh). Combustion turbine capacity can therefore only contribute CO2
emissions amounting to approximately 2 percent of total coal-steam CO2
emissions. Any single-digit percentage reduction in combustion turbine heat rates would therefore provide less than 1 percent reduction in total fossil-fired CO2
emissions.
Further, we are not aware of an approach to estimate any limited opportunities that existing simple cycle turbines may have to reduce their heat rate. Similar to coal-steam EGUs, we do not have the unit-specific detailed design information on existing individual simple cycle combustion turbines that is necessary for a detailed assessment of the heat rate improvement potential via best practices and upgrades for each unit. While the EPA could conduct a “variability analysis” of simple cycle historical hourly heat rate data (as was done for coal-steam EGUs), the various simple cycle models in use and the historically lower capacity factors of the simple cycle fleet (less run time per start, and more part load operation) would require a simple cycle analysis that includes more complexity and likely more uncertainty than in the coal-steam analysis. Therefore, we do not consider it feasible to estimate potential reductions due to heat rate improvements from simple cycle turbines, and even if it were, we have concluded those reductions would be negligible compared to the reductions from steam generating units. Hence, we do not consider building block 1 as practically applicable to simple cycle units.
Second, the vast majority of simple cycle turbines serve a specific need—providing power during periods of peak electric demand (
i.e.,
peaking units). The existing block of simple cycle turbines are the only units that are able to start fast enough and ramp to full load quickly enough to serve as peaking units. If these units were to be used under building block 2 to displace higher emitting coal-fired units, they would no longer be available to serve as peaking units. Therefore, building block 2 could not be applied to simple cycle
( printed page 64717)
combustion turbines without jeopardizing grid reliability.
Third, many commenters on the CAA section 111(b) proposal stated that simple cycle turbines will be used to provide backup power to intermittent renewable sources of power such as wind and solar. Consequently, adding additional generation from intermittent renewable sources has the potential to actually increase emissions from simple cycle turbines. Therefore, applying building block 3 based on the capacity of simple cycle turbines would not result in emission reductions from simple cycle combustion turbines. Finally, the EPA expects existing simple cycle turbines to continue to operate as they historically have operated, as peaking units. Including simple cycle turbines in CAA section 111(d) applicability would impact the numerical value of state goals, but it would not impact the stringency of the plans. Such inclusion would increase burden but result in no environmental benefit.
Additionally, under CAA section 111(b) final applicability criteria, new dedicated non-fossil and industrial CHP units are not affected sources if they include permit restrictions on the amount of fossil fuel they burn and the amount of electricity they sell. Such units historically have had no regulatory mandate to include permit requirements limiting the use of fossil fuel or electric sales. We are exempting them from inclusion in CAA section 111(d) state plans in the interest of consistency with CAA section 111(b) and based on their historical fuel use and electric sales.
We discuss changes in applicability of units in relation to state plans in Section VIII of this preamble.
E. Combined Categories and Codification in the Code of Federal Regulations
In this rulemaking, the EPA is combining the listing of sources from the two existing source categories for the affected EGUs, as listed in 40 CFR subpart Da and 40 CFR subpart KKKK, into a single location, 40 CFR subpart UUUU, for purposes of addressing the CO2
emissions from existing affected EGUs. The EPA is also codifying all of the requirements for the affected EGUs in a new subpart UUUU of 40 CFR part 60 and including all GHG emission guidelines for the affected sources—fossil fuel-fired electric utility steam generating units, as well as stationary combustion turbines—in that newly created subpart.[298]
We believe that combining the emission guidelines for affected sources into a new subpart UUUU is appropriate because the emission guidelines the EPA is establishing do not vary by type of source. Combining the listing of sources into one location, subpart UUUU, will facilitate implementation of CO2
mitigation measures, such as shifting generation from higher to lower-carbon intensity generation among existing sources (
e.g.,
shifting from utility boilers to NGCC units), and emission trading among sources in the source category.
As discussed in the January 8, 2014 proposal for the CAA section 111(b) standards for GHG emissions from EGUs (79 FR 1430), in 1971 the EPA listed fossil fuel-fired steam generating boilers as a new category subject to section 111 rulemaking, and in 1979 the EPA listed fossil fuel-fired combustion turbines as a new category subject to the CAA section 111 rulemaking. In the ensuing years, the EPA has promulgated standards of performance for the two categories and codified those standards, at various times, in 40 CFR part 60 subparts D, Da, GG, and KKKK.
In the January 8, 2014 proposal, the EPA proposed separate standards of performance for new sources in the two categories and proposed codifying the standards in the same Da and KKKK subparts that currently contain the standards of performance for conventional pollutants from those sources. In addition, the EPA co-proposed combining the two categories into a single category solely for purposes of the CO2
emissions from new construction of affected EGUs, and codifying the proposed requirements in a new 40 CFR part 60 subpart TTTT. For the final standards of performance for new construction of affected EGUs, the EPA is codifying the final requirements in a new 40 CFR part 60 subpart TTTT.
In this rulemaking, the EPA is combining the two listed source categories into a single source category for purposes of the emission guidelines for the CO2
emissions from existing affected EGUs. Because the two source categories are pre-existing and the EPA would not be subjecting any additional sources to regulation, the combined source category is not considered a new source category that the EPA must list under CAA section 111(b)(1)(A). As a result, this final rule does not list a new source category under section 111(a)(1)(A), nor does this final rule revise either of the two source categories—fossil fuel—fired electric utility steam generating units and stationary combustion turbines—that the EPA has already listed under that provision. Thus, the EPA is not required to make a finding that the combined source category causes or contributes significantly to air pollution which may reasonably be anticipated to endanger public health or welfare.
V. The Best System of Emission Reduction and Associated Building Blocks
In the June 2014 proposal, the EPA proposed to determine that the best system of emission reduction adequately demonstrated (BSER) for reducing CO2
emissions from existing EGUs was a combination of measures—(1) increasing the operational efficiency of existing coal-fired steam EGUs, (2) substituting increased generation at existing NGCC units for generation at existing steam EGUs, (3) substituting generation from low- and zero-carbon generating capacity for generation at existing fossil fuel-fired EGUs, and (4) increasing demand-side EE to reduce the amount of fossil fuel-fired generation—which we categorized as four “building blocks.” As an alternative to the proposed building blocks 2, 3, and 4, the EPA also identified reduced generation in the amount of those building blocks as part of the BSER. These measures are not the only approaches EGUs can take to reduce CO2, but are those that the EPA felt best met the statutory criteria. We solicited comment on all aspects of our BSER determination, including a broad array of other approaches. We have considered thoroughly the extensive comments submitted on a variety of topics related to the BSER and the individual building blocks, along with our own continued analysis, and we are finalizing the BSER based on the first three building blocks, with certain refinements.
Consistent with the approach taken in the proposed rule, in determining the BSER we have taken account of the unique characteristics of CO2
pollution, particularly its global nature, huge quantities, and the limited means for controlling it; and the unique characteristics of the source category, particularly the exceptional degree of interconnectedness among individual affected EGUs and the longstanding practice of coordinating planning and operations across multiple sources, reflecting the fact that each EGU's function is interdependent with the function of other EGUs. Each building
( printed page 64718)
block is a proven approach for reducing emissions from the affected source category that is appropriate in this pollutant- and industry-specific context. The BSER also encompasses a variety of measures or actions that individual affected EGUs could take to implement the building blocks, including (i) direct investment in efficiency improvements and in lower- and zero-carbon generation, (ii) cross-investment in these activities through mechanisms such as emissions trading approaches, where the state-established standards of performance to which sources are subject incorporate such approaches, and (iii) reduction of higher-carbon generation.
With attention to emission reduction costs, electricity rates, and the importance of ensuring continued reliability of electricity supplies, the individual building blocks and the overall BSER have been defined not at the maximum possible degree of stringency but at a reasonable degree of stringency designed to appropriately balance consideration of the various BSER factors. Additional, non-building block-specific aspects of the BSER quantification methodology discussed below are similarly mindful of these considerations. This approach to determination of the BSER provides compliance headroom that ensures that the emission limitations reflecting the BSER are achievable by the source category, but nevertheless, as required by the CAA, will result in meaningful reductions in CO2
emissions from this sector. The wide range of actions encompassed in the building blocks, and a further wide range of possible emissions-reducing actions not included in the BSER but nevertheless available to help with compliance, ensure that those emission limitations are achievable by individual affected EGUs as well.
The final BSER incorporates certain changes from the proposed rule, reflecting the EPA's consideration of comments responding to the approaches outlined in the proposal and our own further analysis. The principal changes are the exclusion from the BSER of emission reductions achievable through demand-side EE and through nuclear generation; a revised approach to determination of emission reductions achievable through increased RE generation; a consistent approach to determination of emission reductions achievable through all the building blocks that better reflects the regional nature of the electricity system and entails separate analyses for the Eastern, Western, and Texas Interconnections; and a revised interim goal period of 2022 to 2029 (instead of the proposed interim period of 2020 to 2029). These changes to the BSER and the building blocks are discussed in more detail later in this section of the preamble.
Also, to address concerns identified in the proposal and the October 30, 2014 NODA and in response to associated comments, in the final rule we have represented the emission limitations achievable through the BSER in the form of uniform CO2
emission performance rates for each of two affected source subcategories: Steam generating units and stationary combustion turbines. However, like the proposed rule, the final rule also provides weighted-average state-specific goals that a state may choose as an alternative method for complying with its obligation to set standards of performance for its affected EGUs—an alternative, that is, to adopting the nationwide subcategory-based CO2
emission performance rates as the standard of performance for its affected EGUs. The reformulation of the emission limitations as uniform CO2
emission performance rates is discussed in this section and in section VI of the preamble, and the relation of the performance rates to the state-specific goals and states' section 111(d) plan options is discussed in sections VII and VIII of the preamble.
Section V.A. describes our determination of the final BSER, including a discussion of the associated emissions performance level, and provides the rationale for our determination. In section V.B. we address certain legal issues in greater detail, including key issues raised in comments. Sections V.C. through V.E. contain more detailed discussions of the three individual building blocks included in the final BSER. Further information can be found in the GHG Mitigation Measures TSD for the CPP Final Rule, the CO2
Emission Performance Rate and Goal Computation TSD for the CPP Final Rule, the Response to Comments document, and, about certain topics, the Legal Memorandum for the Clean Power Plan Final Rule, all of which are available in the docket.
A. The Best System of Emission Reduction
This section sets forth our determination of the BSER for reducing CO2
emissions from existing EGUs, including a discussion of the associated emissions performance level, and the rationale for that determination. In section V.A.1., we describe the legal framework for determination of the BSER in general. Section V.A.2. summarizes the determination of the BSER for this rule. In section V.A.3., we discuss changes from the proposal. Section V.A.4. provides more detail on our determination of the BSER, including our determinations regarding the individual elements of the BSER, as applied to the two subcategories of fossil steam units and combustion turbines. In section V.A.5., we explain the specific actions that individual affected EGUs in the two subcategories may take to implement the building blocks and thereby achieve the EPA-identified source subcategory-specific emission performance rates that, in turn, form the basis for the standards of performance that states must set. Because these actions implement the building blocks, they may be understood as part of the BSER. In this discussion, we recognize that states can choose to set sources' standards of performance in different forms and that the form of the standard affects how various types of actions can be used to comply with the standard. In section V.A.6., we discuss the substantial compliance flexibility provided by additional measures, not included in the BSER, that individual affected EGUs can use to achieve their standards of performance. Finally, section V.A.7. addresses the severability of the building blocks.
1. Legal Requirements for BSER in the Emission Guidelines
a.
Introduction.
In the June 2014 proposal for this rule, we described the principal legal requirements for standards of performance under CAA section 111(d)(1) and (a)(1). We based our description in part on our discussion of the legal requirements for standards of performance under CAA section 111(b) and (a)(1), which we included in the January 2014 proposal for standards of performance for CO2
emissions from new fossil fuel-fired EGUs. In the latter proposal, we noted that the D.C. Circuit has handed down numerous decisions that interpret CAA section 111(a)(1), including its component elements, and we reviewed that case law in detail.[299]
We received comments on our proposed interpretation, and in light of those comments, in this final rule, we are clarifying our interpretation in certain respects. We discuss our interpretation below.[300]
( printed page 64719)
b.
CAA requirements and court interpretation.[301]
Section 111(d)(1) directs the EPA to promulgate regulations establishing a section 110-like procedure under which states submit state plans that establish “standards of performance” for emissions of certain air pollutants from sources which, if they were new sources, would be regulated under section 111(b), and that implement and enforce those standards of performance.
The term “standard of performance” is defined to mean—
a standard for emissions of air pollutants which reflects the degree of emission limitation achievable through the application of the best system of emission reduction which (taking into account the cost of achieving such reduction and any nonair quality health and environmental impact and energy requirements) the Administrator determines has been adequately demonstrated.
Section 111(a)(1).
These provisions authorize the EPA to determine the BSER for the affected sources and, based on the BSER, to establish emission guidelines that identify the minimum amount of emission limitation that a state, in its state plan, must impose on its sources through standards of performance. Consistent with these CAA requirements, the EPA's regulations require that the EPA's guidelines reflect—
the degree of emission reduction achievable through the application of the best system of emission reduction which (taking into account the cost of such reduction) the Administrator has determined has been adequately demonstrated.[302]
The EPA's approach in this rulemaking is to determine the BSER on a source subcategory-wide basis, to determine the emission limitation that results from applying the BSER to the sources in the subcategory, and then to establish emission guidelines for the states that incorporate those emission limitations. The EPA expresses these emission limitations in the form of emission performance rates, and they must be achievable by the source subcategory through the application of the BSER.
Following the EPA's promulgation of emission guidelines, each state must determine the standards of performance for its sources, which the EPA's regulations call “designated facilities.” [303]
A state has broad discretion in doing so. CAA section 111(d)(1) requires the EPA's regulations to “permit the State in applying a standard of performance to any particular source . . . to take into consideration, among other factors, the remaining useful life of the . . . source. . .” [304]
In addition, under CAA section 116, the state is authorized to set a standard of performance for any particular source that is more stringent than the emission limit contained in the EPA's emission guidelines.[305]
Thus, for any particular source, a state may apply a standard of performance that is either more stringent or less stringent than the performance level in the emission guidelines, as long as, in total, the state's sources achieve at least the same degree of emission limitation as included in the EPA's emission guidelines. The states must include the standards of performance in their state plans and submit the plans to the EPA for review.[306]
Under CAA section 111(d)(2)(A), the EPA approves state plans as long as they are “satisfactory.”
As noted in the January 2014 proposal and discussed in more detail above under section II.G, Congress first included the definition of “standard of performance” when enacting CAA section 111 in the 1970 Clean Air Act Amendments (CAAA), amended it in the 1977 CAAA, and then amended it again in the 1990 CAAA to largely restore the definition as it read in the 1970 CAAA. It is in the legislative history for the 1970 and 1977 CAAA that Congress primarily addressed the definition as it read at those times and that legislative history provides guidance in interpreting this provision.[307]
In addition, although the D.C. Circuit has never reviewed a section 111(d) rulemaking, the Court has reviewed section 111(b) rulemakings on numerous occasions during the past 40 years, handing down decisions dated from 1973 to 2011,[308]
through which the Court has developed a body of case law that interprets the term “standard of performance.”
c.
Key elements of interpretation.
The emission guidelines promulgated by the Administrator must include emission limitations that are “achievable” by the source category by application of a “system of emission reduction” that is “adequately demonstrated” and that the EPA determines to be the “best,”
( printed page 64720)
“taking into account” the factors of “cost . . . nonair quality health and environmental impact and energy requirements.” The D.C. Circuit has stated that in determining the “best” system, the EPA must also take into account “the amount of air pollution” [309]
reduced and the role of “technological innovation.” [310]
The Court has emphasized that the EPA has discretion in weighing those various factors.311[312]
Our overall approach to determining the BSER and emission guidelines, which incorporates the various elements, is as follows: In developing an emission guideline, we generally engage in an analytical approach that is similar to what we conduct under CAA section 111(b) for new sources. First, we identify “system[s] of emission reduction” that have been “adequately demonstrated” for a particular source category. Second, we determine the “best” of these systems after evaluating the amount of reductions, costs, any nonair health and environmental impacts, energy requirements, and, in the alternative, the advancement of technology (that is, we apply a formulation of the BSER with the above noted factors, and then, in the alternative, we apply a formulation of the BSER with those same factors plus the advancement of technology). And third, we select an achievable emission limit—here, the emission performance rates—based on the BSER.[313]
In contrast to subsection (b), however, subsection (d)(1) assigns to the states, not the EPA, the obligation of setting standards of performance for the affected sources. As discussed below in the following subsection, in examining the range of reasonable options for states to consider in setting standards of performance under these guidelines, we identified a number of considerations, including the interconnected operations of the affected sources and the characteristics of the CO2
pollutant.
The remainder of this subsection discusses the various elements in our general analytical approach.
(1) System of Emission Reduction
As we discuss below, the CAA does not define the phrase “system of emission reduction.” The ordinary, everyday meaning of “system” is a set of things or parts forming a complex whole; a set of principles or procedures according to which something is done; an organized scheme or method; and a group of interacting, interrelated, or interdependent elements.[314]
With this definition, the phrase “system of emission reduction” takes a broad meaning: a set of measures that work together to reduce emissions. The EPA interprets this phrase to carry an important limitation: Because the emission guidelines for the existing sources must reflect “the degree of emission limitation achievable
through the application of
the best system of emission reduction . . . adequately demonstrated,” the system must be limited to measures that can be implemented—“appl[ied]”—by the sources themselves, that is, as a practical matter, by actions taken by the owners or operators of the sources. As we discuss below, this definition is sufficiently broad to include the building blocks.
(2) “Adequately Demonstrated”
Under section 111(a)(1), in order for a “system of emission reduction” to serve as the basis for an “achievable” emission limitation, the Administrator must determine that the system is “adequately demonstrated.” This means, according to the D.C. Circuit, that the system is “one which has been shown to be reasonably reliable, reasonably efficient, and which can reasonably be expected to serve the interests of pollution control without becoming exorbitantly costly in an economic or environmental way.” [315]
It does not mean that the system “must be in actual routine use somewhere.” [316]
Rather, the Court has said, “[t]he Administrator may make a projection based on existing technology, though that projection is subject to the restraints of reasonableness and cannot be based on `crystal ball' inquiry.” [317]
Similarly, the EPA may “hold the industry to a standard of improved design and operational advances, so long as there is substantial evidence that such improvements are feasible.” [318]
Ultimately, the analysis “is partially dependent on `lead time,'” that is, “the time in which the technology will have to be available.” [319]
Unlike for CAA section 111(b) standards that are applicable immediately after the effective date of their promulgation, under CAA section 111(e), compliance with CAA section 111(d) standards may be set sometime in the future. This is due, in part, to the period of time for states to submit state plans and for the EPA to act on them.
(3) “Best”
In determining which adequately demonstrated system of emission reduction is the “best,” the EPA considers the following factors:
(a) Costs
Under CAA section 111(a)(1), the EPA is required to take into account “the cost of achieving” the required emission reductions. As described in the January 2014 proposal,[320]
in several cases the D.C. Circuit has elaborated on this cost factor and formulated the cost standard in various ways, stating that the EPA may not adopt a standard the cost of which would be “exorbitant,” [321]
“greater than the industry could bear and survive,” [322]
“excessive,” [323]
or “unreasonable.” [324]
These formulations appear to be synonymous, and for convenience, in this rulemaking, we will use reasonableness as the standard,
( printed page 64721)
so that a control technology may be considered the “best system of emission reduction . . . adequately demonstrated” if its costs are reasonable, but cannot be considered the best system if its costs are unreasonable.[325 326]
The D.C. Circuit has repeatedly upheld the EPA's consideration of cost in reviewing standards of performance. In several cases, the Court upheld standards that entailed significant costs, consistent with Congress's view that “the costs of applying best practicable control technology be considered by the owner of a large new source of pollution as a normal and proper expense of doing business.” [327] See Essex Chemical Corp.
v.
Ruckelshaus,
486 F.2d 427, 440 (D.C. Cir. 1973); [328] Portland Cement Association
v.
Ruckelshaus,
486 F.2d 375, 387-88 (D.C. Cir. 1973);
Sierra Club
v.
Costle,
657 F.2d 298, 313 (D.C. Cir. 1981) (upholding standard imposing controls on SO2
emissions from coal-fired power plants when the “cost of the new controls . . . is substantial”).[329]
As discussed below, the EPA may consider costs on both a source-specific basis and a sector-wide, regional, or nationwide basis.
(b) Non-Air Health and Environmental Impacts
Under CAA section 111(a)(1), the EPA is required to take into account “any nonair quality health and environmental impact” in determining the BSER. As the D.C. Circuit has explained, this requirement makes explicit that a system cannot be “best” if it does more harm than good due to cross-media environmental impacts.[330]
(c) Energy Considerations
Under CAA section 111(a)(1), the EPA is required to take into account “energy requirements.” As discussed below, the EPA may consider energy requirements on both a source-specific basis and a sector-wide, region-wide, or nationwide basis. Considered on a source-specific basis, “energy requirements” entails, for example, the impact, if any, of the system of emission reduction on the source's own energy needs.
(d) Amount of Emissions Reductions
In the proposed rulemakings for this rule and the associated section 111(b) rule, we noted that although the definition of “standard of performance” does not by its terms identify the amount of emissions from the category of sources or the amount of emission reductions achieved as factors the EPA must consider in determining the “best system of emission reduction,” the D.C. Circuit has stated that the EPA must do so.
See Sierra Club
v.
Costle,
657 F.2d 298, 326 (D.C. Cir. 1981) (“we can think of no sensible interpretation of the statutory words “best . . . system” which would not incorporate the amount of air pollution as a relevant factor to be weighed when determining the optimal standard for controlling . . . emissions”).[331]
The fact that the purpose of a “system of emission reduction” is to reduce emissions, and that the term itself explicitly incorporates the concept of reducing emissions, supports the Court's view that in determining whether a “system of emission reduction” is the “best,” the EPA must consider the amount of emission reductions that the system would yield. Even if the EPA were not required to consider the amount of emission reductions, the EPA has the discretion to do so, on grounds that either the term “system of emission reduction” or the term “best” may reasonably be read to allow that discretion.
(e) Sector- or Nationwide Component of Factors in Determining the BSER
As discussed in the January 2014 proposal for the section 111(b) rulemaking and the proposal for this rulemaking, another component of the D.C. Circuit's interpretations of CAA section 111 is that the EPA may consider the various factors it is required to consider on a national or regional level and over time, and not only on a plant-specific level at the time of the rulemaking.[332]
The D.C. Circuit based this interpretation—which it made in the 1981
Sierra Club
v.
Costle
case, which concerned the NSPS for new power plants—on a review of the legislative history, stating,
[T]he Reports from both Houses on the Senate and House bills illustrate very clearly that Congress itself was using a long-term lens with a broad focus on future costs, environmental and energy effects of different technological systems when it discussed section 111.[333]
The Court has upheld EPA rules that the EPA “justified . . . in terms of the policies of the Act,” including balancing long-term national and regional impacts:
The standard reflects a balance in environmental, economic, and energy consideration by being sufficiently stringent to bring about substantial reductions in SO2
emissions (3 million tons in 1995) yet does so at reasonable costs without significant energy penalties . . . . By achieving a balanced coal demand within the utility sector and by promoting the development of less expensive SO2
control technology, the final standard will expand environmentally acceptable energy supplies to existing power plants and industrial sources.
By substantially reducing SO2
emissions, the standard will enhance the potential for long term economic growth at both the national and regional levels.[334]
In this rule, the EPA is considering costs and energy implications on the
( printed page 64722)
basis of (i) their source-specific impacts and (ii) a sector-wide, regional, or national basis, both separately and in combination with each other.
(4) Achievability of the Emission Limitation in the Emission Guidelines
Before discussing the requirement under section 111(d) that the emission limitation in the emission guidelines must be “achievable,” it is useful to discuss the comparable requirement under section 111(b) for new sources. For new sources, CAA section 111(b)(1)(B) and (a)(1) provides that the EPA must establish “standards of performance,” which are standards for emissions that reflect the degree of emission limitation that is “achievable” through the application of the BSER. According to the D.C. Circuit, a standard of performance is “achievable” if a technology can reasonably be projected to be available to an individual source at the time it is constructed that will allow it to meet the standard.[335]
Moreover, according to the Court, “[a]n achievable standard is one which is within the realm of the adequately demonstrated system's efficiency and which, while not at a level that is purely theoretical or experimental, need not necessarily be routinely achieved within the industry prior to its adoption.” [336]
To be achievable, a standard “must be capable of being met under most adverse conditions which can reasonably be expected to recur and which are not or cannot be taken into account in determining the `costs' of compliance.” [337]
To show a standard is achievable, the EPA must “(1) identify variable conditions that might contribute to the amount of expected emissions, and (2) establish that the test data relied on by the agency are representative of potential industry-wide performance, given the range of variables that affect the achievability of the standard.” [338]
The D.C. Circuit established these standards for achievability in cases concerning CAA section 111(b) new source standards of performance. There is no case law under CAA section 111(d). Assuming that those standards for achievability apply under section 111(d), in this rulemaking, we are taking a similar approach for the emission limitation that the EPA identifies in the emission guidelines. For existing sources, section 111(d)(1) requires the EPA to establish requirements for state plans that, in turn, must include “standards of performance.” Through long-standing regulations [339]
and consistent practice, the EPA has interpreted this provision to require the EPA to promulgate emission guidelines that determine the BSER for a source category and that identify the amount of emission limitation achievable by application of the BSER.
The EPA has promulgated these emission guidelines on the basis that the existing sources can achieve the limitation, even though the state retains discretion to apply standards of performance to individual sources that are more or less stringent.
As indicated in the proposed rulemakings for this rule and the associated section 111(b) rule, the requirement that the emission limitation in the emission guidelines be “achievable” based on the “best system of emission reduction . . . adequately demonstrated” indicates that the technology or other measures that the EPA identifies as the BSER must be technically feasible.
See79 FR 1430, 1463 (January 8, 2014). At least in some cases, in determining whether the emission limitation is achievable, it is useful to analyze the technical feasibility of the system of emission reduction, and we do so in this rulemaking.
(5) Expanded Use and Development of Technology
The D.C. Circuit has long held that Congress intended for CAA section 111 to create incentives for new technology and therefore that the EPA is required to consider technological innovation as one of the factors in determining the “best system of emission reduction.”
See Sierra Club
v.
Costle,
657 F.2d at 346-47. The Court has grounded its reading in the statutory text.[340]
In addition, the Court's interpretation finds firm support in the legislative history.[341]
The legislative history identifies three different ways that Congress designed CAA section 111 to authorize standards of performance that promote technological improvement: (i) The development of technology that may be treated as the “best system of emission reduction . . . adequately demonstrated;” under section 111(a)(1); [342]
(ii) the expanded use of the best demonstrated technology; [343]
and (iii) the development of emerging technology.[344]
Even if the EPA were not required to consider technological innovation as part of its determination of the BSER, it would be reasonable for the EPA to consider it, either because technological innovation may be considered an element of the term “best,” or because the term “best system of emission reduction” is ambiguous as to whether technological innovation may be considered, and it is reasonable for the EPA to interpret it to authorize consideration of technological innovation in light of Congress's emphasis on technological innovation.
In any event, as discussed below, the EPA may justify the control measures identified in this rule as the BSER even without considering the factor of incentivizing technological innovation or development.
(6) EPA Discretion
The D.C. Circuit has made clear that the EPA has broad discretion in determining the appropriate standard of performance under the definition in CAA section 111(a)(1), quoted above. Specifically, in
Sierra Club
v.
Costle,
657 F.2d 298 (D.C. Cir. 1981), the Court explained that “section 111(a) explicitly instructs the EPA to balance multiple concerns when promulgating a
( printed page 64723)
NSPS,” [345]
and emphasized that “[t]he text gives the EPA broad discretion to weigh different factors in setting the standard.” [346]
In
Lignite Energy Council
v.
EPA,
198 F.3d 930 (D.C. Cir. 1999), the Court reiterated:
Because section 111 does not set forth the weight that should be assigned to each of these factors, we have granted the agency a great degree of discretion in balancing them. . . . EPA's choice [of the `best system'] will be sustained unless the environmental or economic costs of using the technology are exorbitant. . . . EPA [has] considerable discretion under section 111.[347]
d.
Approach to the source category and subcategorizing.
Section 111 requires the EPA first to list source categories that may reasonably be expected to endanger public health or welfare and then to regulate new sources within each such source category. Section 111(b)(2) grants the EPA discretion whether to “distinguish among classes, types, and sizes within categories of new sources for the purpose of establishing [new source] standards,” which we refer to as “subcategorizing.” Section 111(d)(1), in conjunction with section 111(a)(1), simply requires the EPA to determine the BSER, does not prescribe the method for doing so, and is silent as to whether the EPA may subcategorize. The EPA interprets this provision to authorize the EPA to exercise discretion as to whether and, if so, how to subcategorize. In addition, the regulations under CAA section 111(d) provide that the Administrator will specify different emission guidelines or compliance times or both “for different sizes, types, and classes of designated facilities when costs of the control, physical limitations, geographical location, or similar factors make subcategorization appropriate.”[348]
As with any of its own regulations, the EPA has authority to interpret or revise these regulations.
Of course, regardless of whether the EPA subcategorizes within a source category for purposes of determining the BSER and the emissions performance level for the emission guideline, as part of its CAA section 111(d) plan, a state retains great flexibility in assigning standards of performance to its affected EGUs. Thus, the state may, if it wishes, impose different emission reduction obligations on different sources, as long as the overall level of emission limitation is at least as stringent as the emission guidelines.
2. The BSER for This Rule—Overview
a.
Summary.
This section describes the EPA's overall approach to establishing the BSER. This rule, promulgated under CAA section 111(d), establishes emission guidelines for states to use in establishing standards of performance for affected EGUs, and the BSER is the central determination that the EPA must make in formulating the guidelines. In order to establish the BSER we have considered the subcategory of the steam affected EGUs as a whole, and the subcategory of the combustion turbine affected EGUs as a whole, and have identified the BSER for each subcategory as the measures that the sources, viewed together and operating under the standards of performance established for them by the states, can implement to reduce their emissions to an appropriate amount, and that meet the other requirements for the BSER including, for example, cost reasonableness.[349]
After identifying the BSER in this manner, the EPA determines the performance levels—in this case, the CO2
emission performance rates—for the steam generators and for the combustion turbines.
In establishing the BSER the EPA also considered the set of actions that an EGU, operating under a standard of performance established by its state, may take to achieve the applicable performance rate, if the state adopts that rate as the standard of performance and applies it to the EGUs in its jurisdiction, or to achieve the equivalent mass-based limit, and that meet the other requirements for the BSER. These actions implement the BSER and may therefore be understood as part of the BSER.
An example illustrating the relationship between the measures determined to constitute the BSER for the source category and the actions that may be undertaken by individual sources that are therefore also part of the BSER is the substitution of zero-emitting generation for CO2
-emitting generation. This measure involves two distinct actions: Increasing the amount of zero-emitting generation and reducing the amount of CO2
-emitting generation. From the perspective of the source category, the two actions are halves of a single balanced endeavor, but from the perspective of any individual affected EGU, the two actions are separable, and a particular affected EGU may decide to implement either or both of the actions. Further, an individual source may choose to invest directly in actions at its own facility or an affiliated facility or to cross-invest in actions at other facilities on the interconnected electricity system.
To reiterate the overall context for the BSER: In this rule, the EPA determined the BSER, and applied it to the category of affected EGUs to determine the performance levels—that is, the CO2
emission performance rates—for steam generators and for combustion turbines. States must impose standards of performance on their sources that implement the CO2
emission performance rates, or, as an alternative method of compliance, in total, achieve the equivalent emissions performance level that the CO2
emission performance rates would achieve if applied directly to each source as the standard or emissions limitation it must meet.[350]
Each state has flexibility in how it assigns the emission limitations to its affected EGUs—and in fact, the state can be more stringent than the guidelines require—but one of the state's choices is to convert the CO2
emission performance rates into standards of performance—which may incorporate emissions trading—for each of its affected EGUs. If a state does so, then the affected EGUs may achieve their emission limits by taking the actions that qualify as the BSER. Since the BSER and, in this case its constituent elements, reflect the criteria of reasonable cost and other BSER criteria, the BSER assures that there is at least one pathway—the CO2
emission performance rates—for the state and its affected EGUs to take that achieves the requisite level of emission reductions, while, again, assuring that the affected EGUs can achieve those emission limits
( printed page 64724)
at reasonable cost and consistent with the other factors for the BSER.
This section describes the EPA's process and basis for determining the BSER for the purpose of determining the CO2
emission performance rates.[351]
The EPA is identifying the BSER as a well-established set of measures that have been used by EGUs for many years to achieve various business and policy purposes, and have been used in recent years for the specific purpose of reducing EGUs' CO2
emissions, and that are appropriate for carbon pollution (given its global nature and large quantities, and the limited means to control it) and afforded by the highly integrated nature of the utility power sector. We evaluated these measures with a view to the states' obligation to establish standards of performance and included in our BSER determination consideration of the range of options available for states to employ in establishing those standards of performance. These measures include: (i) Improving heat rate at existing coal-fired steam EGUs on average by a specified percentage (building block 1); (ii) substituting increased generation from existing NGCC units for reduced generation at existing steam EGUs in specified amounts (building block 2); and (iii) substituting increased generation from new zero-emitting RE generating capacity for reduced generation at existing fossil fuel-fired EGUs in specified amounts (building block 3). It should be noted that building block 2 incorporates reduced generation from steam EGUs and building block 3 incorporates reduced generation from all fossil fuel-fired EGUs.[352]
Further, as discussed below, given the global nature of carbon pollution and the highly integrated utility power sector, each of the building blocks incorporates various mechanisms for facilitating cross-investment by individual affected EGUs in emission rate improvements or emission reduction activities at other locations on the interconnected electricity system. The range of mechanisms includes bilateral investment of various kinds; the issuance and acquisition of ERCs representing the emissions-reducing effects of specific activities, where available under state plans; and more general emissions trading using rate-based credits or mass-based allowances (as discussed in section V.A.2.f. below), where the affected EGUs are operating under standards of performance that incorporate emissions trading.[353]
The set of measures identified as the BSER for the source category encompasses a menu of actions that are part of the BSER and that individual affected EGUs may implement in different amounts and combinations in order to achieve their emission limits at reasonable cost. This menu includes actions that: (i) Affected steam EGUs can implement to improve their heat rates; (ii) affected steam EGUs can implement to increase generation from lower-emitting existing NGCC units in specified amounts; (iii) all affected EGUs can implement to increase generation from new low- or zero-carbon generation sources in specified amounts; (iv) all affected EGUs can implement to reduce their generation in specified amounts; and (v) all affected EGUs operating under a standard of performance that incorporates emissions trading can implement by means of purchasing rate-based emission credits or mass-based emission allowances from other affected EGUs, since the effect of the purchase would be the same as achieving the other listed actions through direct means.[354]
Importantly, affected EGUs also have available numerous other measures that are not included in the BSER but that could materially help the EGUs achieve their emission limits and thereby provide compliance flexibility. Examples include, among numerous other approaches, investment in demand-side EE, co-firing with natural gas (for coal-fired steam EGUs), and investment in new generating units using low- or zero-carbon generating technologies other than those that are part of building block 3.
b.
The EPA's review of measures for determining the BSER.
The EPA described in the proposal for this rule the analytical process by which the EPA determined the BSER for this source category. The EPA is finalizing large parts of that analysis, but the EPA is also refining that analysis as informed by the information and data discussed by commenters and our further evaluation. What follows is the EPA's final determination.
As described in the proposal, to determine the BSER, the EPA began by considering the characteristics of CO2
pollution and the utility power sector. Not surprisingly, whenever the EPA begins the regulatory process under section 111, it initially undertakes these same inquiries and then proceeds to fashion the rule to fit the industry. For example, in 1979, the EPA finalized new standards of performance to limit emissions of SO2
from new, modified, and reconstructed EGUs.[355]
In assessing the final SO2
standard, the EPA carried out extensive analyses of a range of alternative SO2
standards “to identify environmental, economic, and energy impacts associated with each of the alternatives considered at the national and regional levels.” [356]
In identifying the best system underlying the final standard, the EPA evaluated “coal cleaning and the relative economics of FGD [flue gas desulfurization] and coal cleaning” together as the “best demonstrated system for SO2
emission reduction.” [357]
The EPA also took into account the unique features of power transmission along the interconnected grid and the unique commercial relationships that rely on those features.[358]
Similarly, in 1996, the EPA finalized section 111(b) standards and 111(d) emission guidelines to ensure that certain municipal solid waste (MSW) landfills controlled landfill gases to the level achievable through application of the BSER.[359]
EPA's identification of this BSER was critically influenced by the “unique emission pattern of
( printed page 64725)
landfills.” [360]
Unlike “typical stationary source[s],” which only generate emissions while in operation, MSW landfills can “continue to generate and emit a significant quantity of emissions” long after the facility has closed or otherwise stopped accepting waste.[361]
In recognition of this salient and unique characteristic of landfills, the EPA set the BSER based on an emission-reducing system of gas collection and control that remained in place as long as emissions remained above a certain threshold—even after the regulated landfill had permanently closed.[362]
The EPA acknowledged that for some landfills, it could take 50 to 100 years for emissions to drop below the cutoff.[363]
For this rule, we discuss at length in the proposed rule and in section II above the unique characteristics of CO2
pollution. The salient facts include the global nature of CO2, which makes the specific location of emission reductions unimportant; the enormous quantities of CO2
emitted by the utility power sector, coupled with the fact that CO2
is relatively unreactive, which make CO2
much more difficult to mitigate by measures or technologies that are typically utilized within an existing power plant; the need to make large reductions of CO2
in order to protect human health and the environment; and the fact that the utility power sector is the single largest source category by a considerable margin.
We also discuss at length in the proposal and in section II above the unique characteristics of the utility power sector. Topics of that discussion include the physical properties of electricity and the integrated nature of the electricity system. Here, we reiterate and emphasize that the utility power sector is unique in the extent to which it must balance supply and demand on a real-time basis, with limited electricity storage capacity to act as a buffer. In turn, the need for real-time synchronization across each interconnection has led to a uniquely high degree of coordination and interdependence in both planning and real-time system operation among the owners and operators of the facilities comprised within each of the three large electrical interconnections covering the contiguous 48 states. Given these unique characteristics, it is not surprising that the North American power system has been characterized as a “complex machine.” [364]
The core function of providing reliable electricity service is carried out not by individual electricity generating units but by the complex machine as a whole. Important subsidiary functions such as management of costs and management of environmental impacts are also carried out to a great extent on a multi-unit basis rather than an individual-unit basis. Generation from one generating unit can be and routinely is substituted for generation from another generating unit in order to keep the complex machine operating while observing the machine's technical, environmental, and other constraints and managing its costs.
The EPA also reviewed broad trends within the utility power sector.[365]
It is evident that, in the recent past, coal-fired electricity generation has been reduced, and projected future trends are for continued reduction. By the same token, lower-emitting NGCC generation and renewable generation have increased, and projected future trends are for continued increases.[366]
A survey of integrated resource plans (IRPs), included in the docket, shows that fossil fuel-fired EGUs are taking actions to reduce emissions of both non-GHG air pollutants and GHGs.[367]
Some fossil fuel-fired EGUs are investing in lower- or zero-emitting generation. In fact, our review indicates that the great majority of fossil fuel-fired generators surveyed are including new RE resources in their planning. In addition, some fossil fuel-fired EGUs are using those measures to replace their higher-emitting generation. Some fossil fuel-fired generators appear to be reducing their higher-emitting generation without fully replacing it themselves. These measures in aggregate result in the replacement of higher-emitting generation with lower- or zero-emitting generation, reflecting the integrated nature of the electricity system.
The EPA examined state and company programs intended at least in part to reduce CO2
from fossil fuel-fired power plants. These programs include GHG performance standards established by states including California, New York, Oregon, and Washington; utility planning approaches carried out by companies in Colorado and Minnesota; and renewable portfolio standards (RPS) established in more than 25 states.[368]
They also include market-based initiatives, such as RGGI and the GHG emissions trading program established by the California Global Warming Solutions Act, and conservation and demand reduction programs.
We also examined federal legislative and regulatory programs, as well as state programs currently in operation, that address pollutants other than CO2
emitted by the power sector. These programs include, among others, the CAA Title IV program to reduce SO2
and NOX, the MATS program to reduce mercury and air toxic emissions, and the CSAPR program to reduce SO2
and NOX
.[369]
This analysis demonstrated that, among other measures, the application of control technology, fuel-switching, and improvements in the operational efficiency of EGUs all resulted in reductions in a range of pollutants. These programs also demonstrate that replacement of higher-emitting generation with lower-emitting generation—including generation shifts between coal-fired EGUs and natural gas-fired EGUs and generation shifts between fossil fuel-fired EGUs and RE generation—also reduces emissions. Some of these programs also include emissions trading among the power plants.
In this rule, when evaluating the types and amounts of measures that the source category can take to reduce CO2
emissions, we have appropriately taken into account the global nature of the pollutant and the high degree to which each individual affected EGU is integrated into a “complex machine” that makes it possible for generation from one generating unit to be replaced with generation from another generating unit for the purpose of reducing generation from CO2
-emitting generating units. We have also taken into account the trends away from higher-carbon generation toward lower- and zero-carbon generation. These factors strongly support consideration of emission reduction approaches that
( printed page 64726)
focus on the machine as a whole—that is, the overall source category—by shifting generation from dirtier to cleaner sources in addition to emission reduction approaches that focus on improving the emission rates of individual sources.
The factors just discussed that support consideration of emission reduction measures at the source-category level likewise strongly support consideration of mechanisms such as emissions trading approaches, especially since, as discussed in section VIII, the states will have every opportunity to design their section 111(d) plans to allow the affected EGUs in their respective jurisdictions to employ emissions trading approaches to achieve the standards of performance established in those plans. In short, as discussed in more detail in section V.A.2.f. below, it is entirely feasible for states to establish standards of performance that incorporate emissions trading, and it is reasonable to expect that states will do so. These approaches lower overall costs, add flexibility, and make it easier for individual sources to address pollution control objectives. To the extent that the purchase of an emissions credit or allowance represents the purchase of surplus emission reductions by an emitting source, emissions trading represents, in effect, the investment in pollution control by the purchasing source, notwithstanding that the control activity may be occurring at another source. As noted above, the utility power sector has a long history of using the “complex machine” to address objectives and constraints of various kinds. When afforded the opportunity to address environmental objectives on a multi-unit basis, the industry has done so. Congress and the EPA have selected emissions trading approaches when addressing regional pollution from the utility power sector contributing to problems such as acid precipitation and interstate transport of ozone and particulate matter. Similarly, states have selected market-based approaches for their own programs to address regional and global pollutants. The industry has readily adapted to that form of regulation, taking advantage of the flexibility and incorporating those programs into the planning and operation of the “machine.” Further reinforcing our conclusion that reliance on trading is appropriate is the extensive interest in using such mechanisms that states and utilities demonstrated through their formal comments and in discussions during the outreach process. The role of emissions trading is discussed further in section V.A.2.f. below.
This entire review has made clear that there are numerous measures that, alone or in various combinations, merit analysis for inclusion in the BSER. The review has also made clear that the unique characteristics of CO2
pollution and the unique, interconnected and interdependent manner in which affected EGUs and other generating sources operate within the electricity sector make certain types of measures and mechanisms available and appropriate for consideration as the BSER for this rule that would not be appropriate for other pollutants and other industrial sectors. For purposes of this discussion, the measures can be categorized in terms of the essential characteristics of the four building blocks described in the proposal: measures that (i) reduce the CO2
emission rate at the unit; (ii) substitute generation from existing lower-emitting fossil fuel-fired units for generation from higher-emitting fossil fuel-fired units; (iii) substitute generation from new low- or zero-emitting generating capacity, especially RE, for generation from fossil fuel-fired units; and (iv) increase demand-side EE to avoid generation from fossil fuel-fired units. In the proposal, we described our evaluations of various measures in each of these categories. In this rule, with the benefit of comments, we have refined our evaluation of which specific measures should comprise the first three building blocks, and, for reasons discussed below, we have determined that the fourth building block, demand-side EE, should not be included in the BSER in these guidelines.
The measures are discussed more fully below, but it should be noted here that because of the integrated nature of the utility power sector—in which individual EGUs' operations intrinsically depend on the operations of other generators—coupled with the sector's high degree of planning and reliability safeguards, the measures in the second and third categories (which involve generation shifts to lower- and zero-emitting sources) may occur through several different actions from the perspective of an individual source, all of which are equivalent from the perspective of the source category as a whole. First, a higher-emitting fossil unit may invest in cleaner generation without reducing its own generation, which, in the presence of requirements for the source category as a whole to reduce CO2
emissions, would result in less demand for, and therefore reductions in generation by, other higher-emitting units. Second, a higher-emitting fossil unit may reduce its generation, which, in the presence of requirements for the source category as a whole to reduce CO2
emissions, would result in increased demand for, and therefore increased amounts of, cleaner generation. Third, a higher-emitting fossil unit may do both of these things, directly replacing part of its generation with investments in lower- or zero-emitting generation. In addition, for measures in all of the categories, multiple mechanisms exist by which an individual affected EGU may make these investments, ranging from bilateral investments, to purchase of credits representing the emissions-reducing benefits of specific activities, to purchase of general rate-based emissions credits or mass-based emission allowances. As discussed below, mechanisms involving tradable credits or allowances are well within the realm of consideration for the standards of performance states can choose to apply to their EGUs and hence, are entirely appropriate for EPA to consider in evaluating these measures in the course of making its BSER determination.
c. State establishment of standards of performance and source compliance.
Before identifying in detail the measures that the BSER comprises, it is useful to describe the process by which the states establish the standards of performance with which the affected EGUs must comply, and the implications for the sources that will be operating subject to those standards of performance. As part of the EPA's emission guidelines in this rule, and based on the BSER, the EPA is identifying CO2
emission performance rates that reflect the BSER and, pursuant to subsection 111(d)(1), requiring states to establish standards of performance for affected EGUs in order to implement those rates. States, of course, could simply impose those rates on each affected EGU in their respective jurisdictions, but we are also offering states alternative approaches to carrying out their obligations. For purposes of defining these alternatives and facilitating states' efforts to formulate compliance plans encompassing maximum flexibilities, we are aggregating the performance rates into goals for each state. The state, in turn, has the option of setting specific standards of performance for its EGUs such that the emission limitations from the EGUs operating under those standards of performance together meet the performance rates or the state goal. To do this, the state must adopt a plan that establishes the EGUs' standards of
( printed page 64727)
performance and that implements and enforces those standards.
Each state has significant flexibility in several respects. For example, as mentioned, a state may impose standards of performance on its steam EGU sources and on its combustion turbine sources that simply reflect the respective CO2
emission performance rates for those subcategories set in the emission guidelines. Alternatively, a state may impose standards with differing degrees of stringency on various sources, and, in fact, may be more stringent overall than its state goal requires. In addition—and most importantly for purposes of describing the BSER—a state may set standards of performance as mass limits (
e.g.,
tons of CO2
per year) rather than as emission rates (
e.g.,
lbs of CO2
per MWh). Moreover, a state may make the limits tradable (subject to conditions described in section VIII below), whether the limits are rate-based or mass-based. The form of the emission limits, whether emission rate limits or mass limits, has implications for what specific actions that are part of the BSER the individual affected EGUs may take to achieve those limits as well as what specific non-BSER measures are available to the individual affected EGUs for compliance flexibility. For example, if an individual source chooses to adopt building block 3 by both investing in lower- or zero-emitting generation and reducing its own generation, both those actions will be accounted for in its emission rate and both will therefore help the source meet its rate-based limit. If the same individual source takes the same actions but is subject to a mass-based limit, the action of reducing its generation will directly count in helping the source meet its own mass-based limit but the action of investing in cleaner generation will not. However, the investment in lower-or zero-emitting generation by that source and other sources collectively will help the overall source category achieve the emission limits consistent with the BSER and in doing so will make it easier for that source and other sources collectively to meet their mass-based limits.
In instances where a state establishes standards of performance that incorporate emissions trading, the tradable credits or allowances can serve as a medium through which affected EGUs can invest in any emission reduction measure.
d.
Identification of the BSER measures.
We now discuss the evaluation of potential measures for inclusion in the BSER for the source category as a whole.
(1)
Measures that reduce individual affected EGUs' CO2emission rates.
As described in the proposal, the measures that the affected EGUs could implement to improve their CO2
emission rates include a set of measures that the EPA determined would result in improvements in heat rate at coal-fired steam EGUs in the amount of 6 percent on average, and the EPA proposed that this set of measures qualifies as a component of the BSER. In this final rule, the EPA concludes that those measures do qualify as a component of the BSER. However, as described in section V.C. below, based on responsive comments and further evaluation, the EPA has refined its approach to quantifying the emission reductions achievable through heat rate improvements and no longer includes a separate increment of emission reductions attributable to equipment upgrades. Also, rather than evaluating the emission reductions available from these measures on a nationwide basis as in the proposal, the EPA has quantified the emission reductions achievable through building block 1 on a regional basis, consistent with the EPA's proposals to better reflect the regional nature of the interconnected electrical system and the treatment of the other building blocks in this final rule. As a result of these refinements, the EPA is identifying the heat rate improvements achievable by coal-fired steam EGUs as 4.3 percent for the Eastern Interconnection, 2.1 percent for the Western Interconnection, and 2.3 percent for the Texas Interconnection. The refinements are based, in significant part, on the numerous comments we received on our proposed approaches, especially those from states and utilities.
These heat rate improvement measures include best practices such as improved staff training, boiler chemical cleaning, cleaning air preheater coils, and use of various kinds of software, as well as equipment upgrades such as turbine overhauls. These are measures that the owner/operator of an affected coal-fired steam EGU may take that would have the effect of reducing the amount of CO2
the source emits per MWh. As a result, these measures would help the source achieve an emission limit expressed as either an emission rate limit or as a mass limit. We note again that in the context both of the integrated electricity system and of available and anticipated state approaches to setting standards of performance, emissions trading approaches could be used as mechanisms through which one affected EGU could invest in heat rate improvements at another EGU. We note this aspect below in describing the actions an individual affected EGU can take to implement the BSER and discuss it in more detail in section V.A.2.f.
These heat rate improvements are a low-cost option that fit the criteria for the BSER, except that they lead to only small emission reductions for the source category.[370]
Given the magnitude of the environmental problem and projections by climate scientists that much larger emission reductions are needed from fossil fuel-fired EGUs to address climate change, the EPA looked at additional measures to reduce emission rates. This reflects our conclusion that, given the availability of other measures capable of much greater emission reductions, the emission reductions limited to this set of heat rate improvement measures would not meet one of the considerations critical to the BSER determination—the quantity of emissions reductions resulting from the application of these measures is too small for these measures to be the BSER by themselves for this source category.
Specifically, as described in the proposal, the EPA also considered co-firing (including 100 percent conversion) with natural gas, a measure that presented itself in part because of the recent increase in availability and reduction in price of natural gas, and the industry's consequent increase in reliance on natural gas.[371]
The EPA also considered implementation of carbon capture and storage (CCS).[372]
The EPA found that some of these co-firing and CCS measures are technically feasible and within price ranges that the EPA has found to be cost effective in the context of other GHG rules, that a segment of the source category may implement these measures, and that the resulting emission reductions could be potentially significant.
However, these co-firing and CCS measures are more expensive than other available measures for existing sources. This is because the integrated nature of the electricity system affords significantly lower cost options, ones that fossil fuel-fired power plants
( printed page 64728)
throughout the U.S. and in foreign nations are already using to reduce their CO2
emissions.
The less expensive options include shifting generation to existing NGCC units—an option that has become particularly attractive in light of the increased availability and lower prices of natural gas—as well as shifting generation to new RE generating units. A comparison of the costs of converting an existing coal-fired boiler to burn 100 percent natural gas compared to the cost of shifting generation to an existing NGCC unit illustrates this point. Because an NGCC unit burns natural gas significantly more efficiently than an affected steam EGU does, the cost of shifting generation from the steam EGU to an existing NGCC unit is significantly cheaper in most cases than more aggressive emission rate reduction measures at the steam EGU. As a result, as a practical matter, were the EPA to include co-firing and CCS in the BSER and promulgate performance standards accordingly, few EGUs would likely comply with their emission standards through co-firing and CCS; rather, the EGUs would rely on the lower cost options of substituting lower- or zero-emitting generation or, as a related matter, reducing generation.[373]
The EPA also considered heat rate improvement opportunities at oil- and gas-fired steam EGUs and NGCC units and found that the available emission reductions would likely be more expensive or too small to merit consideration as a material component of the BSER.
Thus, in reviewing the entire range of control options, it became clear that controlling CO2
from affected EGUs at levels that are commensurate with the sector's contribution to GHG emissions and thus necessary to mitigate the dangers presented by climate change, could depend in part, but not primarily, on measures that improve efficiency at the power plants. Rather, most of the CO2
controls need to come in the form of those other measures that are available to the utility power sector thanks specifically to the integrated nature of the electricity system, and that involve, in one form or another, replacement of higher emitting generation with lower- or zero-emitting generation.
Although the presence of lower-cost options that achieve the emission reduction goals means that the EPA is not identifying either natural gas co-firing or CCS at coal-fired steam EGUs, or heat rate improvements at other types of EGUs, as part of the BSER, those controls remain measures that some affected EGUs may be expected to implement and that as a result, will provide reductions that those affected EGUs may rely on to achieve their emission limits or may sell, through emissions trading, to other affected EGUs to achieve emission limits (to the extent permitted under the relevant section 111(d) plans). Another example of a non-BSER measure that an affected EGU in certain circumstances could choose to implement is the conversion of waste heat from electricity generation into useful thermal energy. The EPA further discusses the potential use of these non-BSER measures for compliance flexibility below.
The EPA's quantification of the CO2
emission reductions achievable through heat rate improvements as a component of the BSER (building block 1) is discussed in section V.C. of this preamble and in the GHG Mitigation Measures TSD for the CPP Final Rule.
(2)
Measures available because of the integrated electricity system.
To determine the BSER that meets the expectations and requirements of the CAA, including the achievement of meaningful reductions of CO2, the EPA turned next to the set of measures that presented themselves as a result of the fact that the operations of individual affected EGUs are interdependent on and integrated with one another and with the overall electricity system. Those are the measures in the categories represented in the proposal by building blocks 2, 3, and 4. This section discusses the components of the BSER that relate to building blocks 2 and 3, which the EPA is finalizing as components of the BSER. This section also discusses the measures comprising the proposed building block 4, which the EPA is not including in the BSER in this final rule.
It bears reiterating that the extent to which the operations of individual affected EGUs are integrated with one another and with the overall electricity system is a highly salient and unique attribute of this source category. Because of this integration, the individual sources in the source category operate through a network that physically connects them to each other and to their customers, an interconnectedness that is essential to their operation under the status quo and by all indications is projected to be augmented further on a continual basis in the future to address fundamental objectives of reliability assurance and cost reduction. This physical interconnectedness exists to serve a set of interlocking regimes that, to a substantial extent, determine, if not dictate, any given EGU's operations on a nearly moment-to-moment basis. In analyzing BSER from the perspective of the overall source category, because the affected EGUs are connected to each other operationally, a combination of dispatching and investment in lower- and zero-emitting generation allows the replacement of higher-emitting generation with lower-emitting and zero-emitting generation (measures in building blocks 2 and 3), and thereby reduces emissions while continuing to serve load.
As noted above, substitution of higher-emitting generation for lower- or zero-emitting generation may include reduced generation, depending on the specific action taken by the individual EGU. Likewise, when incorporated into standards of performance, emissions trading mechanisms may be readily used for implementing these building blocks. We discuss these aspects below in describing the actions that individual sources may take to implement the building blocks.
(a)
Substituting generation from lower-emitting affected EGUs for generation from higher-emitting affected EGUs.
In the proposal, the EPA observed that substantial CO2
emission reductions could be achieved at reasonable cost by increasing generation from existing NGCC units and commensurately reducing generation from steam EGUs. Because NGCC units produce much less CO2
per MWh of generation than steam EGUs—typically less than half as much CO2
as coal-fired steam EGUs, which account for most generation from steam EGUs—this generation shift reduces CO2
emissions. We also noted that because NGCC units can generate as much as 46 percent more electricity from a given quantity of natural gas than a steam unit can, generation shifting from coal-fired steam EGUs to existing NGCC units is a more cost-effective strategy for reducing CO2
emissions from the source category than converting coal-fired steam EGUs to combust natural gas or co-firing coal and natural gas in steam EGUs. We proposed to find that shifting generation consistent with a 70 percent target utilization rate (based on nameplate capacity) for NGCC units was feasible and should be a component of the BSER.
As described in section V.D. below, analysis reflecting consideration of the many comments we received on the EPA's proposal with respect to this issue supports the inclusion of generation shifting from higher-emitting to lower-emitting EGUs as a component of the BSER. Shifting of generation
( printed page 64729)
among EGUs is an everyday occurrence within the integrated operations of the utility power sector that is used to ensure that electricity is provided to meet customer demands in the most economic manner consistent with system constraints. Generation shifting to lower-emitting units has been recognized as an approach for reducing emissions in other EPA rules such as CSAPR.
The EPA's analysis continues to show that the magnitude of emission reductions included in the proposed rule from generation shifting is achievable. In response to our request for comment on the proposed target utilization rates, some commenters stated that summer capacity ratings are a more appropriate basis upon which to compute a target utilization than nameplate capacity ratings used at proposal. We agree, and accordingly, using the same data on historical generation as at proposal, we have reanalyzed feasible NGCC utilization levels expressed in terms of summer capacity ratings and have found that a 75 target utilization rate based on summer capacity ratings is feasible.
The EPA is finalizing a determination that generation shift from higher-emitting affected EGUs to lower-emitting affected EGUs is a component of the BSER (building block 2). Our quantification of the associated emission reductions is discussed in section V.D. of this preamble and in the GHG Mitigation Measures TSD for the CPP Final Rule.
(b)
Substituting increased generation from new low- or zero-carbon generating capacity for generation from affected EGUs.
Reducing generation from fossil fuel-fired EGUs and replacing it with generation from lower- or zero-emitting EGUs is another method for reducing CO2
emissions from the utility power sector. In the proposal, the EPA identified RE generating capacity and nuclear generating capacity as potential sources of lower- or zero-CO2
generation that could replace higher-CO2
generation from affected EGUs.
(i)
Increased generation from new RE generating capacity.
The EPA's survey of trends and actions already being taken in the utility power sector indicated that RE generating capacity and generation have grown rapidly in recent years, in part because of the environmental benefits of shifting away from fossil fuel-fired generation and in part because of improved economics of RE generation relative to fossil fuel-fired generation. It is clear that increasing the amount of new RE generating capacity and allowing the increased RE generation to replace generation from fossil fuel-fired EGUs can reduce CO2
emissions from the affected source category. Accordingly, we proposed to include replacement of defined quantities of fossil generation by RE generation in the BSER.
The EPA is finalizing the determination that substitution of RE generation from new RE generating capacity is a component of the BSER but, with the benefit of comments responding to the EPA's proposals on regionalization and techno-economic analytic approaches, the EPA has adjusted the approach for determining the quantities of RE generation. As part of the adjustment in approach, we have also refocused the quantification solely on generation from new RE generating capacity rather than total (new and existing) RE generating capacity as in the proposal. Our quantification of the RE generation component of the BSER is discussed in section V.E. of the preamble and in the GHG Mitigation Measures TSD for the CPP Final Rule.
(ii)
Increased and preserved generation from nuclear generating capacity.
In the June 2014 proposal, the EPA also identified the replacement of generation from fossil fuel-fired EGUs with generation from nuclear units as a potential approach for reducing CO2
emissions from the affected source category. We proposed to include two elements of nuclear generation in the BSER: An element representing projected generation from nuclear units under construction; and an element representing preserved generation from existing nuclear generating capacity at risk of retirement, and we took comment on all aspects of these proposals.
Like generation from new RE generating capacity, generation from new nuclear generating capacity can clearly replace fossil fuel-fired generation and thereby reduce CO2
emissions. However, there are also important differences between these types of low- or zero-CO2
generation. Investments in new nuclear capacity are very large capital-intensive investments that require substantial lead times. By comparison, investments in new RE generating capacity are individually smaller and require shorter lead times. Also, important recent trends evidenced in RE development, such as rapidly growing investment and rapidly decreasing costs, are not as clearly evidenced in nuclear generation. We view these factors as distinguishing the under-construction nuclear units from RE generating capacity, indicating that the new nuclear capacity is likely of higher cost and therefore less appropriate for inclusion in the BSER. Accordingly, as described in section V.A.3., the EPA is not finalizing increased generation from under-construction nuclear capacity as a component of the BSER.
The EPA is likewise not finalizing the proposal to include a component representing preserved existing nuclear generation in the BSER. On further consideration, we believe it is inappropriate to base the BSER on elements that will not reduce CO2
emissions from affected EGUs below current levels. Existing nuclear generation helps make existing CO2
emissions lower than they would otherwise be, but will not further lower CO2
emissions below current levels. Accordingly, as described in section V.A.3., the EPA is not finalizing preservation of generation from existing nuclear capacity as a component of the BSER.
(iii)
Generation from new NGCC units.
New NGCC units—that is, units that had not commenced construction as of January 8, 2014, the date of publication of the proposed CO2
standards of performance for new EGUs under section 111(b)—are not subject to the standards of performance that will be established for existing sources under section 111(d) plans based on the BSER determined in this final rule. In the June 2014 proposed emission guidelines for existing EGUs, the EPA solicited comment on whether to include this measure in the BSER. Commenters raised numerous concerns, and after consideration of the comments, we are not including replacement of generation from affected EGUs through the construction of new NGCC capacity in the BSER. In this section, we discuss the reasons for our approach.
The EPA did not include reduced generation from affected EGUs achieved through construction and operation of new NGCC capacity in the proposed BSER because we expected that the CO2
emission reductions achieved through such actions would, on average, be more costly than CO2
emission reductions achieved through the proposed BSER measures. However, our determination not to include new construction and operation of new NGCC capacity in the BSER in this final rule rests primarily on the achievable magnitude of emission reductions rather than costs.
Unlike emission reductions achieved through the use of any of the building blocks, emission reductions achieved through the use of new NGCC capacity require the construction of additional CO2
-emitting generating capacity, a consequence that is inconsistent with
( printed page 64730)
the long-term need to continue reducing CO2
emissions beyond the reductions that will be achieved through this rule. New generating assets are planned and built for long lifetimes—frequently 40 years or more—that are likely longer than the expected remaining lifetimes of the steam EGUs whose CO2
emissions would initially be displaced be the generation from the new NGCC units. The new capacity is likely to continue to emit CO2
throughout these longer lifetimes, absent decisions to retire the units before the end of their planned lifetimes or to install CCS technology in the future at substantial additional cost. Because of the likelihood of CO2
emissions for decades, the overall net emission reductions achievable through the construction and operation of new NGCC are less than for the measures including in the BSER, such as increased generation at existing NGCC capacity, which would be expected to reach the end of its useful life sooner than new NGCC capacity, or construction and operation of zero-emitting RE generating capacity. We view the production of long-term CO2
emissions that otherwise would not be created as inconsistent with the BSER requirement that we consider the magnitude of emissions reductions that can be achieved. For this reason, we are not including replacement of generation from affected EGUs through the construction and operation of new NGCC capacity in the final BSER.
Commenters also raised a concern with the interrelation of section 111(b) and section 111(d). New NGCC capacity is distinguished from the other non-BSER measures discussed above by the fact that its CO2
emissions would be subject to the CO2
standards for new EGUs being established under section 111(b). Section 111 creates an express distinction between the sources subject to section 111(b) and the sources subject to section 111(d), and commenters expressed concern that to allow section 111(b) sources to play a direct role in setting the BSER under section 111(d) would be inconsistent with congressional intent to treat the two sets of sources separately. Section VIII of this preamble includes a discussion of ways to address new NGCC capacity in the context of different types of section 111(d) plans.
(c)
Increasing demand-side EE to avoid generation and emissions from fossil fuel-fired EGUs.
The final category of approaches for reducing generation and CO2
emissions from affected EGUs that the EPA considered in the proposal involves increasing demand-side EE. When demand-side EE is increased, energy consumers need less electricity in order to provide the same level of electricity-dependent services—
e.g.,
heating, cooling, lighting, and use of motors and electronic devices. Through the integrated electricity system, including the connection of customers to affected EGUs through the electricity grid, reduced demand for electricity, in turn, leads to reduced generation and reduced CO2
emissions. Our examination of actions and trends underway in the utility power sector confirmed that investments in demand-side EE programs are increasing. We proposed to include avoidance of defined quantities of fossil fuel-fired generation through increased demand-side EE as a component of the BSER (proposed building block 4). However, we also took comment on which building blocks should comprise the BSER and on our determination as to whether each building block met the various statutory factors.
Commenters expressed a wide range of views on the proposed reliance on demand-side EE in the BSER. Some commenters strongly supported the proposal, with suggestions for improvements, while some commenters strongly opposed the proposal and took the position that it exceeded the EPA's legal authority. We do not address the merits of these comments here because, for the reasons discussed in section V.B.3.c.(8) below, we are not finalizing the proposal to include avoided generation achieved through demand-side EE as a component of the BSER. However, we note that most commenters also supported the use of demand-side EE for compliance whether or not it is used in determining the BSER, and we are allowing demand-side EE to be used for that purpose. (We also emphasize that the emission limitations reflective of the BSER are achievable even if aggregate generation is not reduced through demand-side EE.)
(3)
Further analysis to quantify the BSER.
While the discussion above summarizes how and why the components of the BSER were determined in terms of qualitative characteristics, it still leaves a wide range of potential stringencies for the BSER. As explained in sections V.C., V.D., and V.E. below, discussing building blocks 1, 2, and 3 respectively, the EPA has determined a reasonable level of stringency for each of the building blocks rather than the maximum possible level of stringency. We have taken this approach in part to ensure that there is “headroom” within the BSER measures that provides greater assurance of the achievability of the BSER for the source category and for individual sources. We believe this approach is permissible under the CAA. Another aspect of our methodology for computing the CO2
emission performance rates, further described in section V.A.3.f. and section VI, is that the CO2
emission performance rate applicable to a given source subcategory in all three interconnections reflects the emission rate achievable by that source subcategory through application of the building blocks in the interconnection where that achievable emission rate is the highest (
i.e.,
least stringent).[374]
This aspect of our methodology not only ensures that the nationwide CO2
emission performance rates are achievable by affected EGUs in all three interconnections but also provides additional headroom within the BSER for affected EGUs in the two interconnections that did not set the CO2
emission performance rates ultimately used. Additional headroom within the BSER is available through the use of emissions trading approaches, because the final rule does not limit the use of these mechanisms to sources within the same interconnections. In fact, in response to proposals that emerged from the comment record and direct engagement with states and stakeholders reflecting their strong interest in pursuing multi-state approaches, the guidelines include mechanisms for implementing standards of performance that incorporate interstate trading, as discussed in section VIII. (In addition, as further discussed below, the rule also permits section 111(d) plans to allow the use of non-BSER measures for compliance in certain circumstances, increasing both compliance flexibility and the assurance that the emission limitations reflecting application of the BSER are achievable.)
Further, the sets of measures in each of these individual building blocks, in the stringency assigned in this rule, meet the criteria for the BSER. That is, they each achieve the appropriate level of reductions, are of reasonable cost, do not impose energy penalties on the
( printed page 64731)
affected EGUs and do not result in non-air quality pollutants, and have acceptable cost and energy implications on a source-by-source basis and for the energy sector as a whole. In addition, as explained below, each is adequately demonstrated. Importantly, past industry practice and current trends strongly support each of the building blocks, as do federal and state pollution control programs that require or result in similar measures.
For example, all of the measures in building blocks 2 and 3 have been implemented for decades, initially for reasons unrelated to pollution control, then in recent years in order to control non-GHG air pollutants, and more recently, for purposes of CO2
-emission control by states and companies. Moreover, Congress itself recognized in enacting the acid rain provisions of CAA Title IV that RE measures reduce CO2
from affected EGUs. In addition, the EPA has relied on the measures in building blocks 2 and 3 in other rules.
It should also be noted that building blocks 2 and 3 also meet the criteria for the BSER in combination with one another and with building block 1, as described below.
e.
Actions that individual affected EGUs could take to apply or implement the building blocks.
We now turn to a summary of measures or actions that individual EGUs could take to apply or implement the building blocks and that are therefore, in that sense, part of the BSER.
(1)
Improvement in CO2emission rate at the unit.
An affected EGU may take steps to improve its CO2
emission rate as discussed above for the source category as a whole. As discussed in section V.C., the record makes clear that coal-fired steam EGUs can make, and have made, heat rate improvements to a greater or lesser degree, resulting in reductions in CO2
emissions. The resulting improvement in an EGU's CO2
emission rate would help the EGU achieve an emission limit imposed in the form of an emission rate. If the EGU's emission limit is imposed in the form of a mass standard, the heat rate improvement would also lower the EGU's mass emissions provided that the EGU held the amount of its generation constant or increased its generation by a smaller percentage than the efficiency improvement. Under a mass-based standard that incorporates emission trading, an EGU that improves its heat rate would need fewer emission allowances for each MWh of generation whatever level of generation it chose to produce.
(2)
Actions to implement measures in building blocks 2 and 3.
Viewing the BSER from the perspective of an individual EGU, there are several ways that affected EGUs can access the measures in building blocks 2 and 3, thanks to the integrated nature of the electricity system, coupled with the system's high degree of planning and reliability mechanisms. The affected EGUs can: (a) Invest in lower- or zero-emitting generation, which will lead to reductions in higher-emitting generation at other units in the integrated system; (b) reduce their generation, which in the presence of emission reduction requirements applicable to the source category as a whole will have the effect of increasing demand for, and thereby incentivize investment in, the measures in the building blocks elsewhere in the integrated system; or (c) both invest in the measures in the building blocks and reduce their own generation, effectively replacing their generation with cleaner generation. The availability of these options is further enhanced where the individual EGU is operating under a standard of performance that incorporates emissions trading.
(a)
Investment in measures in building blocks 2 and 3.
An affected EGU may take the following actions to invest in the measures in building blocks 2 and 3. For building block 2, the owner/operator of a steam EGU may increase generation at an existing NGCC unit it already owns, or one that it purchases or invests in. In addition, the owner/operator may, through a bilateral transaction with an existing NGCC unit, pay the unit to increase generation, and acquire the CO2
-reducing effects of that increased generation in the form of a credit, as discussed below.
Similarly, for building block 3, an owner/operator of an affected EGU may build, or purchase an ownership interest in, new RE generating capacity and acquire the CO2
-reducing effects of that increased generation. Alternatively, an owner/operator may, through bilateral transactions, purchase the CO2
-reducing effects of that increased generation from renewable generation providers, again, in the form of a credit.
In case of an investment in either building block 2 or building block 3 by a unit subject to a rate-based form of CO2
performance standard, it would be reasonable for state plans to authorize affected EGUs to use an approved and validated instrument such as an “emission rate credit” (ERC) representing the emissions-reducing benefit of the investment.[375]
When combined with reduced generation, either at the affected EGU or elsewhere in the interconnected system, the types of actions listed above would be fully equivalent to building blocks 2 and 3 when viewed from the perspective of the overall source category. Thus, a source could achieve a standard of performance identical to the applicable CO2
emission performance rate in the EPA emission guidelines, through implementation of the actions described above for building blocks 2 and 3, along with the actions described further above for building block 1.
The EPA anticipates that in instances where section 111(d) plans provide for the use of instruments such as ERCs as a mechanism to facilitate use of these measures, organized markets will develop so that owner/operators of affected EGUs that have invested in measures eligible for the issuance of ERCs will be able to sell those credits and other affected EGUs will be able to purchase them. Such markets have developed for other instruments used for emissions trading purposes. For example, liquid markets for SO2
allowances developed rapidly following the implementation of Title IV of the 1990 Clean Air Act Amendments establishing the Acid Rain Program. Members of Congress and industry had expressed concern during the legislative debate that the lack of a liquid SO2
allowance market would create challenges for affected sources that needed to acquire allowances to meet their compliance obligations. Congress added statutory provisions to ensure that, should a market not develop, sources could purchase needed allowances directly from the EPA. In fact, these provisions went unused because a liquid market for allowances did develop very quickly. Sources engaged in allowance transactions directly with other sources as they sought to lower compliance costs. Market intermediaries offered services to sources to match allowance buyers and sellers and helped sources understand their compliance options. Trade associations worked with members to develop standardized contracts and other tools to facilitate allowance transactions, thereby reducing transaction costs. Similar developments have occurred in state-
( printed page 64732)
level renewable portfolio standard programs.[376]
If states choose to allow through their section 111(d) plans mechanisms or standards of performance involving instruments such as ERCs, the EPA believes that there would be an ample supply of such credits, for several reasons. First, as discussed in sections V.D. and V.E., the EPA has established the stringencies for building blocks 2 and 3 at levels that are reasonable and not at the maximum achievable levels, providing headroom for investment in the measures in these building blocks beyond the amounts reflected in the CO2
emission performance rates reflecting application of the BSER. In addition, if emission limits are set at the CO2
emission performance rates, affected EGUs in two of the three interconnections on average do not need to implement the building blocks to their full available extent in order to achieve their emission limits (because the performance rates for each source category are the emission rates achievable by that source subcategory through application of the building blocks in the interconnection where that achievable emission rate is the highest), providing further opportunities in those interconnections to generate surplus emission reductions that could be used as the basis for issuance of ERCs. Further, to the extent that section 111(d) plans take advantage of the latitude the final guidelines provide for states to set standards of performance incorporating emissions trading on an interstate basis among affected EGUs in different interconnections, all sources can take advantage of the headroom available in other interconnections. As a result, significant amounts of existing NGCC capacity and potential for RE remain available to serve as the basis for issuance of ERCs for all affected EGUs in both source subcategories to rely on to achieve their emission limits. Because we recognize the ready availability to states of standards of performance that incorporate emissions trading—and because such standards can easily encompass interstate trading—this rule includes by express design a variety of options that states and utilities can select to pursue interstate compliance regimes that mirror the interconnected operation of the electricity system. As a result, the EPA believes that it is reasonable to anticipate that a virtually nationwide emissions trading market for compliance will emerge, and that ERCs will be effectively available to any affected EGU wherever located, as long as its state plan authorizes emissions trading among affected EGUs.[377]
It should also be noted that although in a state that sets emission limits in a rate-based form the measures in building blocks 2 and 3 can be taken into account directly in computations to determine whether an individual affected EGU has achieved its emission limit, in a state that sets emission limits in a mass-based form these measures are not taken into account directly in computations to determine whether an individual affected EGU has achieved its emission limit. However, by reducing generation and therefore CO2
emissions from the group of affected EGUs within a region, in a state with mass-based limits implementation of these measures facilitates the ability of the individual EGUs within the region to achieve their limits by choosing to reduce their own generation and emissions.
(b)
Reduced generation.
In addition, the owner/operator of an affected EGU may help itself meet its emission limit by reducing its generation. If the owner/operator reduces generation and therefore the amount of its CO2
emissions, then, if the affected EGU is subject to an emission rate limit, the owner/operator will need to implement fewer of the building block measures,
e.g.,
buy fewer ERCs, to achieve its emission rate; and if the affected EGU is subject to a mass emission limit, the owner/operator will need fewer mass allowances. As discussed below, at the levels that the EPA has selected for the BSER, reduced generation at higher-emitting EGUs does not decrease the amount of electricity available to the system and end users because lower-emitting (or zero-emitting) generation will be available from other sources.
An owner/operator may take actions to ensure that it reduces its generation. For example, it may accept a permit restriction on the amount of hours that it generates. In addition or alternatively, it may represent the cost of additional emission credits or allowances that would be required due to incremental generation as an additional variable cost that increases the total variable cost considered when dispatch decisions are made for the unit.
Because of the integrated nature of the electricity system, combined with the system's high degree of planning and reliability safeguards, as well as the long planning horizon afforded by this rule, individual affected EGUs can implement the building blocks by reducing generation to achieve their emission performance standards.[378]
Individual affected steam EGUs can reduce their generation in the amounts of building blocks 2 and 3, while individual affected NGCC units can reduce their generation in the amount of building block 3. With emission limits for the source category as a whole in place, the resulting reduction in supply of higher-emitting generation will incentivize additional utilization of existing NGCC capacity, the resulting reduction in overall fossil fuel-fired
( printed page 64733)
generation will incentivize investment in additional RE generating capacity, and the integrated system's response to these incentives will ensure that there will be sufficient electricity generated to continue to meet the demand for electricity services.
(c)
Emissions trading.
As described above, viewed from the perspective of the source category as a whole, it is reasonable for our analysis of the BSER to include an element of source-category-wide multi-unit compliance which could be implemented via a state-set standard of performance incorporating emissions trading, under which EGUs could engage in trading of rate-based emission credits or mass-based emission allowances. By the same token, viewed from the perspective of an individual EGU, consideration of the ready availability to states of the opportunity to establish standards of performance that incorporate emissions trading is integral to our analysis. Accordingly, our assessment of the actions available to individual EGUs for achieving standards of performance reflecting the BSER includes the purchase of rate-based emission credits or mass-based emission allowances, because one of the things an affected EGU can do to achieve its emission limit is to buy a credit or an allowance from another affected EGU that has over-complied. The use of purchased credits or allowances would have to be authorized, of course, in the purchasing EGUs' states' section 111(d) plans and would have to meet conditions set out for such approaches in section VIII below. The role of emissions trading in the BSER analysis is discussed further in section V.A.2.f. below.
f.
The role of emissions trading.
In making its BSER determination here, the EPA examined a number of technologies and emission reduction measures that result in lower levels of CO2
emissions and evaluated each one on the basis of the several criteria on which the EPA relies in determining the BSER. In contrast to section 111(b), however, section 111(d)(1) obliges the states, not the EPA, to set standards of performance for the affected EGUs in order to implement the BSER. Accordingly, with respect to each measure or control strategy under consideration, the EPA also evaluated whether or not the states could establish standards of performance for affected EGUs that would allow those sources to adopt the measure in question. In this case, the EPA identified a host of factors that persuaded us that states could— and, in fact, may be expected to—establish standards of performance that incorporate emissions trading.[379]
These wide-ranging factors include (i) the global nature of the air pollutant in question—
i.e.,
CO2
; (ii) the transactional nature of the industry; (iii) the interconnected functioning of the industry and the coordination of generation resources at the level of the regional grid; (iv) the extensive experience that states—and EGUs—already have with emissions trading; and (v) material in the record demonstrating strong interest on the part of many states and affected EGUs in using emissions trading to help meet their obligations.[380]
The states' and EGUs' interest in emissions trading is rooted in the well-recognized benefits that trading provides. The experience of multiple trading programs over many years has shown that some units can achieve emission reductions at lower cost than others, and a system that allows for those lower-cost reductions to be maximized is more cost-effective overall to the industry and to society. Trading provides an affected EGU other options besides direct implementation of emission reduction measures in its own facility or an affiliated facility when lower-cost emission reduction opportunities exist elsewhere. Specifically, the affected EGU can cross-invest, that is, invest in actions at facilities owned by others, in exchange for rate-based emission credits or mass-based emission allowances. Through cross-investment, trading allows each affected EGU to access the control measures that other affected EGUs decide to implement, which in this case include all the building blocks as well as other measures.
Accordingly, our analysis of the measures under consideration in our BSER determination reflected the well-
( printed page 64734)
founded conclusion that it is reasonable for states to incorporate emissions trading in the standards of performance they establish for affected EGUs and that many, if not all, would do so.[381]
Whether viewed from the perspective of an individual EGU or the source category as a whole, emissions trading is thus an integral part of our BSER analysis. Again, we concluded that this is reasonable given the global nature of the pollutant, the transactional and interconnected nature of this industry, and the long history and numerous examples demonstrating that, in this sector, trading is integral to how regulators have established, and sources have complied with, environmental and similar obligations (such as RE standards) when it was appropriate to do so given the program objective. The reasonableness is further demonstrated by the numerous comments (some of which are noted above) from industry, states, and other stakeholders in this rulemaking that supported allowing states to adopt trading programs to comply with section 111(d) and encouraged EPA to facilitate trading across state lines through the use of trading-ready state plans. The EPA's reliance on trading in its BSER determination does not mean, however, that states are required to establish trading programs (just as states are not required to implement the building blocks that comprise BSER). Nor does it mean that trading is the only transactional approach that we could have considered in setting the BSER or that states could use to effectuate the building blocks were they to decide that they did not want to take on the responsibility of running a trading program. Rather, it is simply a recognition of the nature of this industry and the long history of trading as an important regulatory tool in establishing regulatory regimes for this industry and its reasonable availability to states in establishing standards of performance.
As an initial matter, trading is permissible for these emission guidelines because CO2
is a global pollutant; the location of its emission does not affect the location of the environmental harm it causes. For CO2, it is the total amount of emissions from the source category that matters, not the specific emissions from any one EGU. The fact that trading allows sources to shift emissions from one location to another does not impede achievement of the environmental goal of reducing CO2
pollution. In its character as a pollutant whose impacts extend beyond local areas, CO2
pollution resembles to some extent the regional SO2
pollution that Congress chose to address with the emissions trading program enacted in Title IV of the 1990 CAA Amendments. The argument in support of trading approaches is even stronger for CO2
pollution, whose adverse effects are global rather than merely regional like the SO2
emissions contributing to acid precipitation.
Further, as discussed elsewhere in the preamble, the utility power sector—and the affected EGUs and other generation assets that it encompasses—has a long history of working on a coordinated basis to meet operating and environmental objectives, necessitated and facilitated by the unique interconnectedness and interdependence of the sector. That history includes joint dispatch for economic and reliability purposes, both within large utility systems and in multi-utility power pools that have evolved into RTOs; joint power plant ownership arrangements; and long-term and short-term bilateral power purchase arrangements. More recently, the sector's history also includes emissions trading programs designed by Congress, the EPA, and the states to address regional environmental problems and, most recently, climate change. Examples of such programs are noted below.
Essentially, trading does nothing more than commoditize compliance, with the following two important results emerging from that: It reduces the overall costs of controls and spreads those costs among the entire category of regulated entities while providing a greater range of options for sources that may not want to make on-site investments for controlling their emissions and may prefer to make the same investment, via the purchase of the tradable compliance instrument, at another generating source. Building blocks 2 and 3 entail affected EGUs investing in increased generation from existing NGCC units and RE. The affected EGUs could do so in any number of ways, including acquiring ownership interests in existing NGCC or RE facilities or entering into bilateral transactions with the owners of existing NGCC facilities or RE sources. As discussed elsewhere, it is reasonable to expect that these actions can develop into discrete, tradable commodities (
e.g.,
an ERC) and that liquid markets will develop, which would reduce transaction costs and allow an affected EGU to comply with its emission limits by purchasing discrete units in amounts tailored closely to its compliance needs. The existence of such tradable commodities also incentivizes over-compliance by affected EGUs, which can then sell their over-compliance in the form of ERCs or allowances to other affected EGUs. Moreover, as noted elsewhere, the opportunity to trade is consistent with the EPA's regional approach for the building blocks.
By the same token, the opportunity to trade incentivizes affected EGUs to over-comply with building block 1. Thus, the opportunity to trade supports the EPA's assumptions about what an average affected EGU can achieve with regards to heat rate improvement even if each and every affected EGU cannot achieve that level of improvement. In addition, trading incentivizes affected EGUs to consider low-cost, non-BSER methods to reduce emissions as well, and, as discussed below, there are numerous non-BSER methods, ranging from implementation of demand-side EE programs to natural gas co-firing.
Trading has become an important mechanism for achieving environmental goals in the electricity sector in part because trading allows environmental regulators to set an environmental goal while preserving the ability of the operators of the affected EGUs to decide the best way to meet it taking account of the full range of considerations that govern their overall operations. For example, commenters were concerned that because of building block 2, the emission guidelines would require state environmental regulators to make dispatch decisions for the electricity markets, a role that state environmental regulators do not currently play. Although building block 2 entails substituting existing NGCC generation for steam generation, implementing the emission limits that are based in part on building block 2 through a trading program provides the individual affected EGUs with a great deal of control over their own generation while the industry as a whole achieves the environmental goals. For example, individual steam generators have the option of maintaining their generation as long as they acquire additional ERCs. Moreover, trading provides a way for states to set standards of performance that realize the required emissions reduction without requiring any form of “environmental dispatch” because, as many existing trading programs have shown, monetization of the environmental constraint is consistent with a least-cost dispatch system. Trading also supports the EPA's approach to the “remaining useful life” provision in section 111(d)(1) because with trading, an affected EGU with a
( printed page 64735)
limited remaining useful life can avoid the need to implement long-term emission reduction measures and can instead purchase ERCs or other tradable instruments, such as mass-based allowances, thereby allowing the state to meet the requirements of this rule.
The EPA's job in issuing these emission guidelines is to determine the BSER that has been adequately demonstrated and to set emission limitations that are achievable through the application of the BSER and implementable through standards of performance established by the states. The three building blocks are the EPA's determination of what technology is adequately demonstrated. We also consider trading an integral part of the BSER analysis because, in addition to being available to states for incorporation in the standards of performance they set for affected EGUs, trading has been adequately demonstrated for this industry in circumstances where systemic rather than unit-level reductions are central. Congress, the EPA, and state regulators have established successful environmental programs for this industry that allow trading of environmental (or similar) attributes, and trading has been widely used by the industry to comply with these programs. Examples include the CAA Title IV Acid Rain Program, the NOX
SIP Call (currently referred to as the NOX
Budget Trading Program), the Clean Air Interstate Rule (CAIR), the Cross-State Air Pollution Rule (CSAPR),[382]
the Regional Haze trading programs, the Clean Air Mercury Rule,[383]
RGGI, the trading program established by California AB32, and the South Coast Air Quality Management District RECLAIM program. We describe these programs in section II.E. of this preamble. In addition, we note in the Legal Memorandum accompanying this preamble that Congress, in enacting the Title IV acid rain trading program, and the EPA, in promulgating the regulatory trading programs listed, recognized both the suitability of trading for the EGU industry and the benefits of trading in reducing costs, spreading costs to affected EGUs throughout the sector, and facilitating the ability of affected EGUs to comply with their emission limits. In addition, as we discuss in section V.E. of this preamble, many states have adopted RE standards that promote RE through the trading of renewable energy certificates (RECs).
Based on this history, it is reasonable for the EPA to determine that states can establish standards of performance that incorporate trading and, as a result, for the purpose of making a BSER determination here to evaluate prospective emission control measures in light of the availability of trading. Trading is a regulatory mechanism that works well for this industry. The environmental attributes in the preceding programs (representing emissions of air pollutants) are identical to or similar in nature to the environmental attribute here (CO2
emissions). The markets for RECs show that robust markets for RE, in particular, already exist.
Given the benefits of trading and the background of multi-unit coordination grounded in the nature of the utility power sector, it is natural for sources and states to look for opportunities to apply similar coordination to a regional problem such as reduction of CO2
emissions from the sector. As noted earlier, the EPA heard this interest expressed during the outreach process for this rulemaking and saw it reflected in comments on the proposal. Emissions trading was prominent in these expressions of interest; while the proposal allowed trading and encouraged the development of multi-state plans which would allow the benefits of trading to extend over larger regions, we heard that interest was even greater in “trading-ready” plans that would use trading mechanisms and market-based coordination, rather than state-to-state coordination, as the primary means of facilitating multi-unit approaches to compliance. The general industry and state preference for multi-unit compliance approaches makes great sense in the context of the industry and this pollutant, as does the specific preference for trading-ready section 111(d) plans, and we have made efforts in the final rule to accommodate trading-ready plans as described in section VIII.
g.
Measures that reduce CO2emissions or CO2emission rates but are not included in the BSER.
There are numerous other measures that are available to at least some affected EGUs to help assure that they can achieve their emission limits, even though the EPA is not identifying these measures as part of the BSER. These measures include demand-side EE implementable by affected EGUs; new or uprated nuclear generation; renewable measures other than those that are part of building block 3, including distributed generation solar power and off-shore wind; combined heat and power and waste heat power; and transmission and distribution improvements. In addition, a state may implement measures that yield emission reductions for use in reducing the obligations on affected EGUs, such as demand-side EE measures not implementable by affected EGUs, including appliance standards, building codes, and drinking water or wastewater system efficiency measures. The availability of these measures further assures that the appropriate level of emission reductions can be achieved and that affected EGUs will be able to achieve their emission limits.
h.
Ability of EGUs to implement the BSER.
The EPA's analysis, based in part on observed decades-long behavior of EGUs, shows that all types and sizes of affected EGUs in all locations are able to undertake the actions described as the BSER, including investor-owned utilities, merchant generators, rural cooperatives, municipally-owned utilities, and federal utilities. Some may need to focus more on certain measures; for example, an owner of a small generation portfolio consisting of a single coal-fired steam EGU may need to rely more on cross-investment approaches, possibly including the purchase of emission credits or allowances, because of a lack of sufficient scale to diversify its own portfolio to include NGCC capacity and RE generating capacity in addition to coal-fired capacity. As a legal matter, it is not necessary that each affected EGU be able to implement the BSER, but in any event, in this rule, all affected EGUs can do so. Since states can reasonably be expected to establish standards of performance incorporating emissions trading, affected EGUs may rely on emissions trading approaches authorized under their states' section 111(d) plans to, in effect, invest in building block measures that are physically implemented at other locations. As discussed above, the EPA's quantification of the CO2
emission performance rates in a manner that provides headroom within the BSER also contributes to the ability of all
( printed page 64736)
affected EGUs to implement the BSER and achieve emissions limitations consistent with those performance rates.
i.
Subcategorization.
As noted above, in this rule, we are treating all fossil fuel-fired EGUs as a single category, and, in the emission guidelines that we are promulgating with this rule, we are treating steam EGUs and combustion turbines as separate subcategories. We are determining the BSER for steam EGUs and the BSER for combustion turbines, and applying the BSER to each subcategory to determine a performance rate for that subcategory. We are not further subcategorizing among different types of steam EGUs or combustion turbines. As we discuss below, this approach is fully consistent with the provisions of section 111(d), which simply require the EPA to determine the BSER, do not prescribe the method for doing so, and are silent as to subcategorization. This approach is also fully consistent with other provisions in section 111, which require the EPA first to list source categories that may reasonably be expected to endanger public health or welfare and then to regulate new sources within each such source category, and which grant the EPA discretion whether to subcategorize the sources for purposes of determining the BSER.
As discussed below, each affected EGU can achieve the performance rate by implementing the BSER, specifically, by taking a range of actions—some of which depend on features of the section 111(d) plan chosen by the state, such as the choice of rate-based or mass-based standards of performance and the choice of whether and how to permit emissions trading—including investment in the building blocks, replaced or reduced generation, and purchase of emission credits or allowances. Further, in the case of a rate-based state plan, several other compliance options not included in the BSER for this rule are also available to all affected EGUs, including investment in demand-side EE measures. Such compliance options may also indirectly help affected EGUs achieve compliance under a mass-based plan.
Our approach of subcategorizing between steam EGUs and combustion turbines is reasonable because building blocks 1 and 2 apply only to steam EGUs. Moreover, our approach of not further subcategorizing as between different types of steam EGUs or combustion turbines reflects the reasonable policy that affected EGUs with higher emission rates should reduce their emissions by a greater percentage than affected EGUs with lower emission rates and can do so at a reasonable cost using the approaches we have identified as the BSER as well as other available measures.
Of course, a state retains great flexibility in assigning standards of performance to its affected EGUs and can impose different emission reduction obligations on its sources, as long as the overall level of emission limitation is at least as stringent as the emission guidelines, as discussed below.
3. Changes From Proposal
For the BSER determined in this final rule, based on consideration of comments responding to a broad array of topics considered in the proposal, the EPA has adopted certain modifications to the proposed BSER. In this subsection we describe the most important modifications, including some that relate to individual building blocks and some that are more general. Additional modifications that relate to individual building blocks are discussed in the respective sections for those building blocks below (sections V.C. through V.E.).
We note that taken together, the modifications yield emission reductions requirements that commence more gradually than the proposed goals but are projected to produce greater overall annual emission reductions by 2030.[384]
We also note that the modifications lead to requirements that are more uniform across states than the proposed state goals (consistent with the direction of certain alternatives on which we sought comment in the proposal), with the final requirements generally becoming more stringent (compared to the proposal) in states with the highest 2012 CO2
emission rates and less stringent in states with lower 2012 CO2
emission rates.
a.
Interpretations of CAA section 111.
In the June 2014 proposal, the EPA proposed interpretations of section 111(a)(1) and (d), and applied these interpretations to existing fossil fuel-fired EGUs.[385]
Informed by comments, the EPA has clarified some of these interpretations, and has developed a more refined understanding of how some of these interpretations should be applied. The clarified and more refined interpretations replace the proposed interpretations.
Two of these points merit mention here. First, the EPA is clarifying in this rule that the interpretation of “system of emission reduction” does not include emission reduction measures that the states have authority to mandate without the affected EGUs being able to implement the measures themselves (
e.g.,
appliance standards or building codes). In the final rule, we have clarified that the components of the BSER must be implementable by the affected EGUs, not just by the states, and we show that all the components of the BSER have been demonstrated to be achievable on that basis without reliance on actions that can be accomplished only through government mandates. Further discussion of these points can be found throughout this section on the BSER and the following sections on the individual building blocks.
Second, the EPA has adopted a combined interpretation of sections 111(a)(1) and 111(d) that, compared to the proposal, better reflects the historical interpretations of section 111(a)(1), which have generally supported emissions standards that are nationally uniform for sources incorporating a given technology, and gives less weight to the state-focused character of section 111(d), which calls for emissions standards to be implemented through the development of individual state plans. The proposed state goals were heavily (although not entirely) dependent on the emission reduction opportunities available to the EGUs in each individual state, and because the relative magnitudes of these opportunities varied by state, states with similar EGU fleet compositions could have faced state goals of different stringencies, potentially making it difficult for multiple states to set the same standards of performance for affected EGUs using the same technologies (assuming the states were interested in setting standards of performance for their various affected EGUs in such a manner). Some commenters viewed this potential result as inconsistent with section 111(a)(1), inequitable, or both. In response, we took further comment on these potential disparities in the October 30, 2014 NODA. In this final rule, we are obviating those concerns by assessing the emission reduction opportunities at an appropriate regional scale, consistent with alternatives on which we sought comment, and using this regional information to reformulate the proposed emissions standards as nationally
( printed page 64737)
uniform emissions standards for the emission guidelines.[386]
National uniformity is consistent with prior section 111 rulemaking and advances a number of other goals central to this rulemaking. The methodological refinements related to regional assessment of emission reduction opportunities and the use of uniform emissions standards by technology subcategory are further discussed below.
b.
Approach to quantification of emission reductions from increased RE generation.
In the June 2014 proposal, the EPA described two possible approaches for quantifying the amount of emission reductions achievable from affected EGUs through the use of RE generation. The proposed approach used information on state RPS aggregated at a regional level along with historical RE generation data to project the amount of RE generation used in quantifying the emission reductions achievable through the BSER. The alternative approach used information on the technical and market potential for development of renewable resources in each state to project the RE-related emission reductions. In the October 30, 2014 NODA, we sought comment on an additional approach of aggregating the state-level information to a regional level, as suggested by some commenters. In this final rule we are adopting a combination of these approaches that uses historical RE generating capacity deployment data aggregated to a regional level, supported and confirmed by projections of market potential developed through a techno-economic approach.
In the June 2014 proposal, RE generation was also quantified as generation from total—that is, existing and new—RE generating capacity, a formulation that was consistent with the formulation of most RPS, which are typically framed in terms of total rather than incremental generation. In response to the EPA's request for comment on this approach, commenters observed that the approach was inconsistent with the approach taken for other building blocks, and that generation from RE generating capacity that already existed as of 2012 should not be treated as reducing emissions of affected EGUs from 2012 levels. As just noted, we are not using the RPS-based methodology in the final rule, and we agree with comments that quantification of RE generation on an incremental basis is both more consistent with the treatment of other building blocks and more consistent with the general principle that the BSER should comprise incremental measures that will reduce emissions below existing levels, not measures that are already in place, even if those in-place measures help current emission levels be lower than would be the case without the measures. The final rule therefore defines the RE component of the BSER in terms of incremental rather than total RE generation.[387]
Further details regarding the final rule's quantification of RE generation are provided in section V.E. below.
c.
Exclusion from the BSER of emission reductions from use of under-construction or preserved nuclear capacity.
In the June 2014 proposal, the EPA included in building block 3 provisions reflecting the ability for nuclear generation to replace fossil generation and thereby reduce CO2
emissions at affected EGUs. We proposed to include in building block 3 the potential generation from five under-construction nuclear generating units whose construction had commenced prior to the issuance of the proposal. In addition, to address the potential that some currently operating nuclear facilities may shut down prior to 2030, the proposal incorporated into the BSER for each state with nuclear capacity a projected 5.8 percent reduction in nuclear generation, based on an estimate of potential nationwide loss of nuclear generation from existing units. We sought comment on all aspects of these proposed approaches. While we recognize the important role nuclear power plants have to play in providing carbon-free generation in an all-of-the-above energy system, for this final rule, the BSER does not include either of the components related to nuclear generation.
The EPA received numerous comments on the proposed BSER components related to nuclear power. With respect to generation from under-construction nuclear units, some commenters expressed strong opposition to the inclusion of this generation in the BSER and the setting of state goals, stating that inclusion would result in very stringent state goals for the states where the units are being built and that the inclusion of the generation in the goals is premature because the units' actual completion dates could be delayed. Commenters also stated that inclusion of the under-construction nuclear generation in the BSER would be inequitable because states where the same heavy investment in zero-CO2
generation was not being made would have relatively less stringent goals.
With respect to generation from existing nuclear units, some commenters stated that our method of accounting for potential unit shutdowns was flawed, observing that even if the prediction of a 5.8 percent nationwide loss of nuclear generation were accurate, the actual shutdowns would occur in a handful of states, resulting in much larger losses of generation in those particular states.
Upon consideration of comments and the accompanying data, the EPA has determined that the BSER should not include either of the components related to nuclear generation from the proposal. With respect to nuclear units under construction, although we believe that other refinements to this final rule would address commenters' concerns that goals for the particular states where the units are located would be overly stringent either in absolute terms or relative to other states, we also acknowledge that, in comparison to RE generating technology, investments in new nuclear units tend to be individually much larger and to require longer lead times. Also, important recent trends evidenced in RE development, such as rapidly growing investment and rapidly decreasing costs, are not as clearly evidenced in nuclear generation. We view these factors as distinguishing the under-construction nuclear units from RE generating capacity, indicating that the new nuclear capacity is likely of higher cost and therefore less appropriate for inclusion in the BSER. Excluding the under-construction nuclear units from the BSER, but allowing emission reductions attributable to generation from the units to be used for compliance as discussed below and in section VIII, will recognize the CO2
emission reduction benefits achievable through the significant ongoing commitment required to complete these major investments.
With respect to existing nuclear units, although again we believe that other refinements in the final rule would address the concern about disparate impacts on particular states, we acknowledge that we lack information on shutdown risk that would enable us to improve the estimated 5.8 percent factor for nuclear capacity at risk of
( printed page 64738)
retirement. Further, based in part on comments received on another aspect of the proposal—specifically, the proposed inclusion of existing RE generation in the goal-setting computations—we believe that it is inappropriate to base the BSER in part on the premise that the preservation of existing low- or zero-carbon generation, as opposed to the production of incremental, low- or zero-carbon generation, could reduce CO2
emissions from current levels. Accordingly, we have determined not to reflect either of the nuclear elements in the final BSER.
Generation from under-construction or other new nuclear units and capacity uprates at existing nuclear units would still be able to help sources meet emission rate-based standards of performance through the creation and use of credits, as noted in section V.A.6.b. and section VIII.K.1.a.(8), and would help sources meet mass-based standards of performance through reduced utilization of fossil generating capacity leading to reduced CO2
emissions at affected EGUs. However, consistent with the reasons just discussed for not reflecting preservation of existing nuclear capacity in the BSER—namely, that such preservation does not actually reduce existing levels of emissions from affected EGUs—the rule does not allow preservation of generation from existing or relicensed nuclear capacity to serve as the basis for creation of credits that individual affected EGUs could use for compliance, as further discussed in section VIII.K.1.a.(8).[388]
d.
Exclusion from the BSER of emission reductions from demand-side EE.
The June 2014 proposal included demand-side EE measures in building block 4 as part of the BSER. The EPA took comment on the attributes of each of the proposed building blocks, and building block 4 was a topic of considerable controversy among commenters. While many commenters recognized demand-side EE as an integral part of the electricity system, emphasized its cost-effectiveness as a means of reducing CO2
emissions from the utility power sector, and strongly supported its inclusion in the BSER, other commenters expressed significant concerns.
As explained in section V.B.3.c.(8) below, our traditional interpretation and implementation of CAA section 111 has allowed regulated entities to produce as much of a particular good as they desire provided that they do so through an appropriately clean (or low-emitting) process. While building blocks 1, 2, and 3 fall squarely within this paradigm, the proposed building block 4 does not. In view of this, since the BSER must serve as the foundation of the emission guidelines, the EPA has not included demand-side EE as part of the final BSER determination.
It should be noted that commenters also took the position that the EPA should allow demand-side EE as a means of compliance with the requirements of this rule, and, as discussed in section V.A.6.b. and section VIII below, we agree.
e.
Consistent regionalized approach to quantification of emission reductions from all building blocks.
In the June 2014 proposal, the EPA treated each of the building blocks differently with respect to the regional scale on which the building block was applied for purposes of assessing the emission reductions achievable through use of that building block. Building block 1 was quantified at a national scale, identifying a single heat rate improvement opportunity applicable on average to all coal-fired steam EGUs. Building block 2 was quantified at the scale of each individual state, considering the amount of generation that could be shifted from steam EGUs to NGCC units within the state, although we solicited comment on considering generation shifts at a broader regional scale. The RE component of building block 3 was quantified at a regional scale using RPS information as a proxy for RE development potential, and the regional results were then applied to each state in the region using the state's baseline data; an alternative methodology on which we requested comment quantified the RE component using a techno-economic approach on a state-specific basis. In the October 2014 NODA, we requested comment on using a techno-economic approach to quantify RE generation potential at a regional scale and took broad comment on strategies for better aligning the BSER with the regionally interconnected electrical grid.[389]
We also solicited comment on the appropriate regional boundaries or regional structure to facilitate this approach.
For the final rule, with the benefit of comments received in response to these proposals and alternatives, we have adopted a consistent regionalized approach to quantification of emission reductions achievable through all the building blocks. Under this approach, each of the building blocks is quantified and applied at the regional level, resulting in the computation for each region of a performance rate for steam EGUs and a performance rate for NGCC units. For each of the technology subcategories, we identify the most conservative—that is, the least stringent —of the three regional performance rates. We then apply these least stringent subcategory-specific performance rates to the baseline data for the EGU fleet in each state to establish state goals of consistent stringency across the country. (Note that the actual state goals vary among states to reflect the differences in generation mix among states in the baseline year.) Further description of the steps in this overall process is contained in the preamble sections addressing the individual building blocks (sections V.C., V.D., and V.E.), CO2
emission performance rate computation (section VI), and state goal computation (section VII), as well as the GHG Mitigation Measures TSD for the CPP Final Rule and the CO2
Emission Performance Rate and Goal Computation TSD for the CPP Final Rule available in the docket.
Compared to the more state-focused quantification approach selected in the proposal, and as recognized in the NODA, a regionalized approach better reflects the interconnected system within which interdependent affected EGUs actually carry out planning and operations in order to meet electricity demand. We have already discussed the relevance of the interconnected system and the interdependent operations of EGUs as factors supporting consideration of building blocks 2 and 3 as elements of the BSER for this pollutant and this industry, and these same factors support quantifying the emission reductions achievable through building blocks 2 and 3 on a regionalized basis. Because it better reflects how the industry works, a regionalized approach also better represents the full scope of emission reduction opportunities available to individual affected EGUs through the normal transactional processes of the industry, which do not stop at state borders but rather extend throughout these interconnected regions. With respect to building block 1, which comprises types of emission reduction measures that in other rulemakings under CAA section 111 would typically be evaluated on a nationwide basis, for this rule, as discussed in section V.C. below, we are quantifying the emission reductions achievable through building
( printed page 64739)
block 1 on a regional basis in order to treat the building blocks consistently and to ensure that for each region the quantification of the BSER represents only as much potential emission reduction from building block 1 as our analysis of historical data indicates can be achieved on average by the affected EGUs in that region.
Characterizing and quantifying the measures included in the BSER on a regional basis rather than a state-limited basis is also appropriate because states can establish standards of performance that incorporate emissions trading, including trading between and among EGUs operating in different states, and thus provide EGUs the opportunity to trade. Emissions trading provides at least one mechanism by which owners of affected EGUs can access any of the building blocks at other locations. With emissions trading, an affected EGU whose access to heat rate improvement opportunities, incremental generation from existing NGCC units, or generation from new RE generating capacity is relatively favorable can overcomply with its own standard of performance and sell rate-based emission credits or mass-based emission allowances to other affected EGUs. Purchase of the credits or allowances by the other EGUs represents cross-investment in the emission reduction opportunities, and such cross-investment can be carried out on as wide a geographic scale as trading rules allow.
The regions we have determined to be appropriate for the regionalized approach in the final rule are the Eastern, Western, and Texas Interconnections.[390]
In determining that the appropriate regional level for quantification of the BSER was the level of the interconnection, the EPA considered several factors. First, consistent with our goal of aligning regulation with the reality of the interconnected electricity system, we considered the regional scale on which electricity is actually produced, physically coordinated, and consumed in real time—specifically the Eastern, Western, and Texas Interconnections. The Bulk Power System (BPS) in the contiguous U.S. (including adjacent portions of Canada and Mexico) consists of these three interconnections, which are alternating current (AC) power grids where power flows freely from generating sources to consuming loads. These interconnections are separately planned and operated; they are connected to each other only through low-capacity direct current (DC) tie lines. Each interconnection is managed to maintain a single frequency and to maintain stable voltage levels throughout the interconnection. Physically, each interconnection functions as a large pool, where all electricity delivered to the electric grid flows by displacement over all transmission lines in the interconnection and must be continually balanced with load to ensure reliable electricity service to customers throughout each interconnection. “Since power flows on all transmission paths, it is not uncommon to find circumstances in which part of a power delivery within one balancing area flows on transmission lines in adjoining areas, or part of a power delivery between two balancing areas flows over the transmission facilities of a third area.” [391]
The interconnections are the “complex machines” within which EGUs plan, coordinate, and operate, manifesting a degree of both long-term and real-time interdependence that is unique to this industry. We concluded that, absent a compelling reason to adopt a smaller regional scale for evaluation of CO2
emission reduction opportunities for the electric power sector—which we have not found, as discussed below—the interconnections should be the regions used for evaluation of the BSER for CO2
emission reductions from the electric power sector because of the fundamental characteristics of electricity, the industry's basic interconnected physical infrastructure, and the interdependence of the affected EGUs within each interconnection.
Second, we considered whether the interconnection subregions for which various planning and operational functions are carried out by separate institutional actors would represent more appropriate regions than the entire interconnnections, and concluded that they would not. Interconnection planning and management follows the NERC functional model, which defines subregional areas and regional entities within each interconnection for the purposes of balancing generation with load and ensuring that reliability is maintained. While a variety of organizations plan and operate these subregions, those activities always occur in the context of the interconnections, and the subregions cannot be operated autonomously. The need to maintain common frequency and stable voltage levels throughout the interconnections requires constantly changing flows of electricity between the planning and operating subregions within each interconnection.
Because each interconnection is a freely flowing AC grid, any power generated or consumed flows through the entire interconnection in real time; as a result of this highly interconnected nature of the power system, the management of generation and load on the grid must be carefully maintained. This management is carried out principally by subregional entities responsible for the operation of the grid, but this operation must be coordinated in real time to ensure the reliability of the system. Regional operators must coordinate the dispatch of power, not only in their own areas, but also with the other subregions within the interconnection. Although this coordination has always been important, grid planning and management has evolved to be increasingly interconnection-wide, through the development of larger regional entities, such as RTO/ISOs, or large-utility dispatch across multiple balancing areas. As a result, the fact that much of the necessary coordination for the interconnections is performed regionally on a partially decentralized basis (at least in the case of the Eastern and Western Interconnections) or occurs through the operation of automated equipment and the physics of the grid does not render the subregions more relevant than the interconnections as the ultimate regions within which electricity supply and demand must balance.
Moreover, some planning and standard setting activities are undertaken explicitly at the interconnection level. For example, interconnections also have interconnection reliability operating limits (IROLs).[392]
A joint FERC-NERC report on the September 8, 2011 Arizona-Southern California outages outlined the importance of IROLs.
[393]
( printed page 64740)
The report noted that to ensure the reliable operation of the bulk power system, entities must identify a plan for IROLs to avoid cascading outages. “In order to ensure the reliable operation of the BPS, entities are required to identify and plan for IROLs, which are SOLs that, if violated, can cause instability, uncontrolled separation, and cascading outages. Once an IROL is identified, system operators are then required to create plans to mitigate the impact of exceeding such a limit to maintain system reliability.” [394]
Congress recognized the significance of the three interconnections in the American Recovery and Reinvestment Act of 2009 (Recovery Act) when it provided $80 million in funding for interconnection-based transmission planning.[395]
In order to fulfill this Congressional mandate, DOE and FERC signed a memorandum of understanding to enumerate their roles “for activities related to the Resource Assessment and Interconnection Planning project funded by the American Recovery and Reinvestment Act of 2009 (Recovery Act). Among the objectives of the project is to facilitate the development or strengthening of capabilities in each of the three interconnections serving the contiguous lower forty-eight States, to prepare analyses of transmission requirements under a broad range of alternative futures and develop long-term interconnection-wide transmission plans.” [396]
DOE issued awards to five organizations that performed work in the Western, Eastern, and Texas Interconnections to develop long-term interconnection-wide transmission expansion plans.[397]
In Order No. 1000, FERC also took a broader regional view of transmission planning.[398]
FERC required each public utility transmission provider to participate in a regional transmission planning process that produces a regional transmission plan. FERC also required neighboring transmission planning regions to coordinate with each other. This interregional coordination includes identifying methods for evaluating interregional transmission facilities as well as establishing a common method or methods of cost allocation for interregional transmission facilities.
In addition to Congressional, DOE, and FERC recognition of the importance of the three interconnections, NERC also considers them to be significant. NERC Organizational Standards “are based upon certain Reliability Principles that define the foundation of reliability for North American bulk electric systems.” [399]
These principles take a broad view of electric system reliability, considering the reliability of interconnected bulk electric systems. For example, Reliability Principle 1 states, “Interconnected bulk electric systems shall be planned and operated in a coordinated manner to perform reliably under normal and abnormal conditions as defined in the NERC standards.” [400]
NERC took a similarly broad view of system reliability when it delegated its authority to monitor and enforce mandatory reliability standards to a single Regional Entity in both the Western and Texas Interconnections (WECC in the West and the Texas Reliability Entity in the ERCOT region of Texas).[401]
Moreover, both WECC and ERCOT have interconnection-wide reliability standards.[402]
The Eastern Interconnection has multiple reliability regions with some differences in standards, but power flows and reliability are managed through a single Reliability Coordinator Information System that tracks power flows for all transmission transactions.[403]
The importance that Congress, DOE, FERC, and NERC each place upon the interconnections for electric reliability and operational issues is another factor supporting our decision to set the interconnections as the regional boundaries for the establishment of BSER. The utilization of the three interconnections for both planning and reliability purposes is a clear indication of the importance that electricity system regulators, operators, and industry place upon the interconnections. Those responsible for the electricity system recognize the need to ensure that there is a free flow of electricity throughout each interconnection such that transmission planning and reliability analysis are occurring at the interconnection level. Further, this vigilance with respect to considering reliability from an interconnection-wide basis recognizes that each of the interconnections behaves as a single machine where “outages, generation, transmission changes, and problems in any one area in the synchronous network can affect the entire network.” [404]
By setting the three interconnections as the regions for purposes of BSER, we are acting consistent with the way in which planning, reliability, and industry experts view the electricity system.
An additional factor weighing against the use of planning or operational subregions of the interconnections as the regions for our BSER analysis for this rule is that the borders of those subregions occasionally change as planning and management functions evolve or as owners of various portions of the grid change affiliations. This is not a merely theoretical consideration; numerous ISO/RTO and other regional boundaries have substantially changed in recent years. For example, in 2012, Duke Energy Ohio and Duke Energy Kentucky integrated into PJM.[405]
The following year, in December 2013, Entergy and its six utility operating companies joined MISO, creating the MISO South Region.[406]
The integration
( printed page 64741)
of MISO South correspondingly led to changes in NERC's regional assessment areas.[407]
FERC also recently approved the integration of the Western Areas Power Administration—Upper Great Plains, Basin Electric Power Cooperative, and Heartland Consumers Power District into SPP.[408]
Additionally, PacifiCorp and the CAISO recently began operating the western Energy Imbalance Market (EIM).[409]
Other entities such as NV Energy, Arizona Public Service Co., and Puget Sound Energy are planning to participate in the EIM in the future.[410]
The EIM “creates significant reliability and renewable integration benefits for consumers by sharing and economically dispatching a broad array of resources.” [411]
This history of changing regional boundaries leads us to the conclusion that selecting smaller regional boundaries for purposes of setting the BSER would merely represent a snapshot of current, changeable regional boundaries. As we have seen with recent, large-scale changes regarding ISO/RTO boundaries and NERC reliability assessment areas, such regions would likely not stand the test of the time, nor would smaller regional boundaries accurately reflect electricity flows on the grid. The EPA believes that the interconnections are the most stable and reasonable regional boundaries for setting BSER.
Third, we considered whether transmission constraints, and the fact that the specific locations of generation resources and loads within each interconnection clearly matter to grid planning and operations, necessitate evaluation of the emission reductions available from the building blocks at scales smaller than the interconnections. We concluded that no reduction in scale was needed due to such constraints. The same industry trends that are reflected in the BSER—the changing efficiencies and mix of existing fossil EGUs and the development of RE throughout each interconnection—as well as the management of the interconnected grid as loads are reduced through EE, which is not reflected in the final BSER, are already driving power system development and are being managed through interconnection-wide planning, coordination and operations, and will continue to be managed in that manner in the future with or without this rule. While electricity supply and demand must be balanced in real time in a manner that observes all security constraints at that point in time, and key aspects of that management are carried out at a subregional scale, the emissions standards established in this rule can be met over longer timeframes through processes managed at larger geographic scales, just as they are today. We believe this rule will reinforce these developments and help provide a secure basis for moving forward. If a local transmission constraint requires that for reliability reasons a higher-emitting resource must operate during a certain period of time in preference to a lower-emitting resource that would otherwise be the more economic choice when all costs are considered, nothing in this rule prevents the higher-emitting source from being operated. If the same transmission constraint causes the same conditions to occur frequently, the extra cost associated with finding alternative ways to reduce emissions will provide an economic incentive for concerned parties to explore ways to relieve the transmission constraint. If relieving the constraint would be more costly than employing alternative measures to reduce emissions, the rule allows parties to pursue those alternative emission reduction measures. Accommodation of intermittent constraints and evaluation of alternatives for relieving or working around them have been routine operating and planning practices within the utility power sector for many years; the rule will not change these basic economic practices that occur today. The 2022-29 schedule for the rule's interim goals and the 2030 schedule for the rule's final goals allow time for planning and investment comparable to the sector's typical planning horizons.
Finally, the EPA also considered whether the smaller geographic scales on which affected EGUs may typically engage in energy and capacity transactions necessitate evaluating the emission reductions available from the building blocks at scales smaller than the interconnections, and again concluded that a smaller scale was not necessary or justified. We first note that electricity trading occurs today throughout the interconnection through RTO/ISO markets and active spot markets, often over large areas such as RTO/ISOs, or managed over large dispatch areas outside RTOs. These trades result in interconnection-wide changes in flow that are managed in real time. Moreover, the exchange of power is not limited to these areas. For example, RTOs regularly manage flows between RTOs, and EGUs near the boundaries of RTOs impact multiple subregions across the interconnections, so that any subregional boundaries that might be evaluated for potential relevance as trading region boundaries will change as conditions and EGU choices change, while interconnection boundaries will remain stable.
In addition, the final rule permits trading of rate-based emission credits or mass-based emission allowances. Emission allowances and other commodities associated with electricity generation activities, such as RECs, which, again, represent investments in pollution control measures, are already traded separately from the underlying electric energy and capacity. There is no reason that whatever geographic limits may exist for electricity and capacity transactions by an affected EGU should also limit the EGU's transactions for validly issued rate-based emission credits or mass-based emission allowances. In fact, as discussed below, the final rule not only allows national trading without regard to the interconnection boundaries, but also includes a number of options that readily facilitate states' and utilities' very extensive reliance on emissions trading. It is appropriate for the rule to take this approach, in part, because the non-local nature of the impacts of CO2
pollution do not necessitate geographic constraints, and in the absence of a policy reason to constrain the geographic scope of trading, the largest possible scope is the most efficient scope.
f.
Uniform CO2emission performance rates by technology subcategory.
In conjunction with the refinements to the interpretations of section 111 reflected in the final rule, the EPA has refined the methodology for applying the BSER to the affected EGUs so as to incorporate performance rates that are uniform across technology subcategories.
( printed page 64742)
Specifically, the final rule establishes a performance rate of 1305 lbs. per net MWh for all affected steam EGUs nationwide and a performance rate of 771 lbs. per net MWh for all affected stationary combustion turbines nationwide. The computations of these performance rates and the determinations of state goals reflecting the performance rates are described in sections VI and VII of the preamble, respectively. As described above, in its proposed rule and NODA, the EPA solicited comment on a number of proposals to reflect the regional nature of the electricity system in the methodology for quantifying the emission limitations reflective of the BSER. At the same time, the EPA also consistently emphasized the need for strategies to ensure the achievability and flexibility of the established emission limitations and to increase opportunities for interstate and industry-wide coordination. This modification is consistent with a number of comments we received in response to those proposals. The commenters took the position that the proposed state goals varied too much among states and unavoidably implied, or would inevitably result in, states establishing inconsistent standards of performance for sources of the same technology type in their respective states, which in the commenters' view was not appropriate under section 111.
Having determined to adopt regional alternatives for computing the emission reductions achievable under each building block, the EPA has further determined to exercise discretion not to subcategorize based on the regions, and instead to apply a nationally uniform CO2
emission performance rate for each source subcategory. Evaluating the emission reduction opportunities achievable through application of the BSER on a broad regionalized basis, which is appropriate for the reasons discussed above, makes it possible to express the degree of emission limitation reflecting the BSER as CO2
emission performance rates that are uniform for all affected EGUs in a technology subcategory within each region. However, the goals and strategies embodied in the EPA's proposed rule are best effected by setting uniform emission performance rates nationally and not just regionally, as recognized by commenters favoring the use of nationally uniform performance rates by technology subcategory. Nationally uniform emission performance rates create greater parity among the emission reduction goals established for states across the contiguous U.S. and increase the ability of states and affected EGUs to coordinate emission reduction strategies, including through the use of emission trading mechanisms if states choose to allow such mechanisms, which we consider likely.
Having determined that the performance rates computed on a regional basis merit consideration as nationally applicable performance rates, we are also determining that the objectives of achievability and flexibility would best be met by using the least stringent of the regional performance rates for the three interconnections for each technology subcategory as the basis for nationally uniform performance rates for that technology subcategory rather than by using the most stringent of the regional performance rates.[412]
Under this approach, the CO2
emission performance rate reflecting the BSER for all steam EGUs is uniform across the contiguous U.S., regardless of the state or interconnection where the steam EGUs are located. While it is true that steam EGUs in the Western and Texas Interconnections have opportunities to implement the measures in the building blocks to a greater extent than the steam EGUs in the Eastern Interconnection—for example, under building block 2, they have relatively greater amounts of incremental NGCC generation available to replace their generation in all years for which performance rates were computed—we do not conclude that this means that the EGUs in all three interconnections should be assigned the most stringent CO2
emission performance rate computed for any of the three regions. Applying nationally the performance rate computed for the interconnection with the lease stringent rate ensures that the emission limitations are achievable by the affected EGUs in all three interconnections. The use of a common CO2
emission performance rate across all of the steam EGUs in all three regions also allocates the burdens of the BSER equally across the steam EGU source subcategory. The same is true for the combustion turbine source subcategory, even though, in any year for which emission performance rates are computed, the combustion turbines in two of the interconnections have relatively greater opportunities to replace their generation with generation from new RE generating capacity than combustion turbines in the third interconnection.[413]
In addition, using the least stringent rate provides greater “headroom”—that is, emission reduction opportunities beyond those reflected in the performance rates—to affected EGUs in the interconnections that do not set the nationwide level. This greater “headroom” provides greater nationwide compliance flexibility and assurance that the standards set by the states based on the emission guidelines will be achievable at reasonable cost and without adverse impacts on reliability. This is because affected EGUs in the interconnections that do not set the nationwide level have more opportunities to directly invest in each of the building blocks in their respective regions, and affected EGUs in the interconnection that does set the nationwide level may in effect invest in the opportunities in the other interconnections through trading. At the same time, our approach still represents the degree of emission limitation achievable through use of an appropriately large and diverse set of emission reduction opportunities and can therefore reasonably be considered the “best” system of emission reduction for each technology subcategory.
Our approach in this rulemaking thus not only addresses the comments we received regarding potentially disparate impacts of the approach presented in the proposal, it is also generally consistent with the approach we have taken in other NSPS rulemakings, where standards of performance or emission guidelines have typically been established at uniform stringencies for all units in a given source subcategory, and where once the best system of emission reduction has been identified, stringencies are generally set based on what is reasonably achievable using that system.
( printed page 64743)
Providing each state with a state-specific weighted average rate-based goal allows the state to determine how the emission reduction requirements should be allocated among the state's affected EGUs. We continue to believe that, as in the proposal, this is an important source of flexibility for states in developing their section 111(d) plans. Accordingly, in this final rule we are providing uniform CO2
emission performance rates for each source subcategory and also translating those rates to state-specific weighted average rate-based goals. For additional flexibility, we are also translating the state-specific rate-based goals into state-specific mass-based goals. Our determinations of the emission performance rates are described in section VI below, and our determinations of the rate-based and mass-based state goals are described in section VII below.
We note here that the weighted-average state goals reflect the application of the uniform CO2
emission performance rates for affected steam EGUs and affected NGCC units to the respective units in each subcategory in each state. Each state goal therefore reflects uniform stringency of emission reduction requirements with respect to affected units in each source subcategory, but also reflects the EGU fleet composition and historical generation specific to that particular state. Compared to the computation approach reflected in the proposed state goals, the revised approach to quantify the BSER on a regional basis and to translate the results into nationally uniform emission performance rates by source subcategory results in more stringent goals (compared to the proposal) for states whose generation has historically been most heavily concentrated at coal-fired steam EGUs. This shift is an expected consequence of the use of uniform performance rates by source subcategory. At proposal, these states' goals reflected artificial assumptions in the selected goal quantification methodology that to a considerable extent limited their emission reduction opportunities based on their states' borders, and the proposed goals therefore were less stringent in states which had substantial coal generation and little local NGCC capacity. The final rule more realistically recognizes that emission reduction opportunities, like other aspects of the interconnected electricity system, are regional and are not constrained by state borders. The final rule also reflects the EPA's emphasis in the proposal on ensuring the achievability and flexibility of the emission guidelines and increasing opportunities for interstate and industry-wide coordination. We consequently apply the same emission performance rates to coal-fired units in states with heavy reliance on coal-fueled generation as we do to coal-fired units in other states, which produces more stringent state goals than at proposal for the states with the highest concentrations of coal-fired generation. At the same time, the final goals for some states are less stringent than their proposed goals. For example, a goal based on the least stringent regional rates is less stringent for some states than a goal based on state-specific emission reduction opportunities would be. Accordingly, the differences among the final state goals are generally smaller than the differences among the proposed state goals. All of the final rate-based state goals are necessarily in the range bounded by the CO2
emission performance rate for NGCC units and the CO2
emission performance rate for steam EGUs because all of the state goals are computed as a weighted average of those two performance rates, and this range is narrower than the range of state goals in the proposal.
The computations of the uniform CO2
emission performance rates are shown in the CO2
Emission Performance Rate and Goal Computation TSD for the CPP Final Rule. These uniform emission performance rates are applicable to the states and areas of Indian country [414]
located in the contiguous U.S. that have affected EGUs.[415]
We have not in this rule applied the uniform emission performance rates to Alaska, Hawaii, Puerto Rico, or Guam—states and territories that have otherwise affected EGUs but are isolated from the three major interconnections—and will determine how to address the requirements of section 111(d) with respect to these jurisdictions at a later time. Further discussion regarding the isolated jurisdictions can be found in section VII.F. of the preamble.
g.
Establishment of a 2022-2029 interim compliance period.
The June 2014 proposal separately quantified emission limitations applicable to an interim 2020-29 period and to the period beginning in 2030. The EPA took broad comment on this proposed timing. Although the proposal provided flexibility in the timing with which emission reductions could be made over the course of the 2020-2029 period in order to achieve compliance with the emission limitations applicable to that interim period, many commenters perceived the start of the period as too soon and stated that it provided insufficient time for planning and investments necessary for sources to begin implementation activities while maintaining reliable electricity supplies.
The EPA has considered these comments and in the final rule has established an interim compliance period of 2022-2029, providing two additional years for planning and investment before the start of compliance. We are persuaded by comments and by our own further analysis that this timeframe is appropriate and will, in combination with the glide path of emission reductions reflected in the final building blocks and the states' flexibility to define their own paths of emission reductions over the interim period (as discussed in section VIII), provide adequate time for necessary planning and investment activities. This will enable the final rule's requirements to be implemented in an orderly manner while reliability of electricity supplies is maintained. Further discussion is provided in the sections of the preamble addressing the individual building blocks (sections V.C., V.D., and V.E.) and on electricity system reliability (section VIII.G.2.).
The initial compliance date of 2022, coupled with the fact that the 2030 standard is phased in over the subsequent eight years, affords affected EGUs the benefit of having an extended planning period before they need to incur any significant obligations. Where needed, states may take the period through September 2018 to develop their final plans, and affected EGUs will be able to work with the states during that period to develop compliance approaches. States will also have the flexibility to select their own emissions trajectories in such a way that certain emission reduction measures could be implemented later in the interim period (again, provided that their affected EGUs still meet the interim performance rates or interim goal over the interim period as a whole). As a result, if the affected EGUs in those states need to incur any expenses before the adoption of the final state plans, those expenses need not be more than minimal. It is worth noting that an earlier state plan submission date provides regulated sources with more certainty and time to
( printed page 64744)
plan for compliance, but has no effect on the time when compliance must be achieved, as the mandatory compliance period begins in 2022 for all states. Some states that already have established programs for limiting CO2
emissions from power plants may adopt and submit to the EPA state plans by September 6, 2016. In those states, sources will already have developed compliance approaches to meet state law requirements. Other states that submit plans by September 6, 2016, may be expected to work with their affected EGUs to determine a reasonable compliance approach, in light of the fact that compliance is not required to begin until 2022. It is also possible that some states will submit neither final state plans nor initial submittals by September 6, 2016, and that the EPA will promulgate federal plans. Sources in those states will have more than five years to meet their 2022 compliance obligations, a lengthy period that will afford them the opportunity to plan before incurring significant expenditures.
These periods of time are consistent with current industry practice in changing generation or adding new generation. For example, in June 2015, Alabama Power Company announced plans to acquire 500 MW of RE generation over the next six years. This amount would make up between four and five percent of Alabama Power's generation mix.[416]
In addition, the study of utility IRPs placed in the docket for this rulemaking [417]
shows that sources are able to replace coal-fired generation with natural-gas fired generation and add incremental amounts of RE (as well as take other actions, such as implement demand-side EE programs), on a gradual basis, after a several-year lead time, over an extended period, as provided for under the final rule.
h.
Refinements to stringency for individual building blocks.
For each individual building block, the EPA has reexamined the data and assumptions used at proposal in light of comments solicited and has made a number of refinements in the final rule based on that information. The refinements are discussed in the preamble sections for each building block (sections V.C., V.D., and V.E.) and emission performance rate computation (section VI) and in the GHG Mitigation Measures TSD for the CPP Final Rule and the CO2
Emission Performance Rate and Goal Computation TSD for the CPP Final Rule. As previously noted, viewed in terms of projected nationwide emission reductions (but not necessarily with respect to each individual state), these refinements generally tend to make the interim goals somewhat less stringent than at proposal and the 2030 goals somewhat more stringent than at proposal. In addition to the changes described above, the refinements include the following:
Use of regional rates ranging from 2.1 percent to 4.3 percent (rather than 6 percent) as the average heat rate improvement opportunity achievable by steam units under building block 1.
Use of 75 percent of summer capacity (rather than 70 percent of nameplate capacity) as the target capacity factor for existing NGCC units under building block 2.
Use of updated information from the National Renewable Energy Laboratory (NREL) on RE costs and potential, and revision of the list of quantified RE technologies to exclude landfill gas under building block 3.
4. Determination of the BSER
In this rule, the EPA is finalizing as the BSER a combination of building blocks 1, 2, and 3, with refinements as discussed below. The building blocks constitute the BSER from the perspective of the source category as a whole. Each building block can be implemented through standards of performance set by the states and includes a set of actions that individual sources can use to achieve the emission limitations reflecting the BSER. These actions and mechanisms, which include reduced generation and emissions trading approaches where the state-set standards of performance incorporate trading and which may be understood as part of the BSER, will be discussed below in section V.A.5. Each of the building blocks consists of measures that the source category and individual affected EGUs have already demonstrated the ability to implement. In quantifying the application of each building block, the EPA has identified reasonable levels of stringency rather than the maximum possible levels.
As discussed above, one of the modifications being made in this rule is the establishment of uniform performance rates by technology subcategory, which enhances the rule's achievability and flexibility and facilitates coordination among the states and across the industry. However, in the first instance, the emission reductions achievable through use of the building blocks are being evaluated on a regional basis that reflects the regional nature of the interconnected electricity system and the region-wide scope of opportunities available for affected EGUs to access emission reduction measures. The EPA recognizes that the emission reduction opportunities under these building blocks vary by region because of regional differences in the existing mix of types of fossil fuel-fired EGUs and the available opportunities to increase low- and zero-carbon generation. Consequently, in order to achieve uniform performance rates by technology subcategory, while respecting these regional differences in emission reduction opportunities, we have determined that it is reasonable not to establish the stringency of the BSER separately by region based on the maximum emission reduction that would be achievable in that region, but instead to establish uniform stringency across all regions at a level that is achievable at reasonable cost in any region. Thus, for each technology subcategory, the BSER is the combination of the elements described above at the combined stringency that is reasonably achievable in the region where the CO2
emission performance rates determined to be achievable at reasonable cost by the EGUs in that subcategory through application of the building blocks were least stringent.[418]
This approach is consistent with the EPA's efforts to enhance the achievability and flexibility of the rule and to promote interstate and industry coordination and reflects the regional strategies emphasized in the proposal and the NODA. It is also consistent with the approach we have taken in other NSPS rulemakings, where the degree of emission limitation achievable through
( printed page 64745)
the application of the BSER for each subcategory of affected sources generally has been determined not on the basis of what is achievable by the sources that can reduce emissions most easily, but instead on the basis of what is reasonably achievable through the application of the BSER across a range of sources. This approach also provides compliance headroom—in addition to the headroom provided by our approach to setting the stringency for each individual building block—for affected EGUs in regions where additional emission reductions can be achieved at reasonable cost, thereby promoting nationwide compliance flexibility. Further, because we are authorizing states to establish standards of performance that incorporate trading without geographic restrictions, the opportunity of affected EGUs to engage in emissions trading, to the extent allowed under the relevant section 111(d) plans, ensures the availability of additional, lower-cost emission reduction opportunities in other regions that will also promote compliance flexibility and reduce compliance costs.
As discussed in section XI of the preamble and the Regulatory Impact Analysis, application of the BSER determined as summarized above is projected to result in substantial and meaningful reductions of CO2
emissions.
Briefly, the elements of the BSER are:
Building block 1:
Improving heat rate at affected coal-fired steam EGUs in specified percentages.
Building block 2:
Substituting increased generation from existing affected NGCC units for generation from affected steam EGUs in specified quantities.
Building block 3:
Substituting generation from new zero-emitting RE generating capacity for generation from affected EGUs in specified quantities.
a.
Building block 1.
Building block 1—improving heat rate at affected coal-fired steam EGUs—is a component of the BSER with respect to coal-fired steam EGUs [419]
because the measures the affected EGUs may undertake to achieve heat rate improvements are technically feasible and of reasonable cost, and perform well with respect to other factors relevant to a determination of the “best system of emission reduction . . . adequately demonstrated.” Building block 1 is a “system of emission reduction” for steam EGUs because owners of these EGUs can take actions that will improve their heat rates and thereby reduce their rates of CO2
emissions with respect to generation.
The EPA has analyzed the technical feasibility, costs, and magnitude of CO2
emission reductions achievable through heat rate improvements at coal-fired steam EGUs based on engineering studies and on these EGUs' reported operating and emissions data. We conclude that taking action to improve heat rates is a common and well-established practice within the industry that is capable of achieving meaningful reductions in CO2
emissions at reasonable cost, although, as discussed earlier, we also conclude that the quantity of emission reductions achievable through heat rate improvement measures is insufficient for these measures alone to constitute the BSER. Specifically, we have determined that an average heat rate improvement ranging from 2.1 to 4.3 percent by all affected coal-fired EGUs, depending on the region, is an element of the BSER, based on the inclusion of those amounts of improvement in the three regions, determined through our regional analysis. Our analysis and conclusions are discussed in Section V.C. below and in the GHG Mitigation Measures TSD for the CPP Final Rule. Additional analysis and conclusions with respect to cost reasonableness are discussed in section V.A.4.d. below.
Consideration of other BSER factors also favors a conclusion that building block 1 is a component of the BSER. For example, with respect to non-air health and environmental impacts, heat rate improvements cause fuel to be used more efficiently, reducing the volumes of, and therefore the adverse impacts associated with, disposal of coal combustion solid waste products. By definition, heat rate improvements do not cause increases in net energy usage. Although we are justifying building block 1 as part of the BSER without reference to technological innovation, we also consider technological innovation in the alternative, and we note that building block 1 encourages the spread of more advanced technology to EGUs currently using components with older designs.
As noted in the June 2014 proposal, the EPA is concerned about the potential “rebound effect” associated with building block 1 if applied in isolation. More specifically, we noted that in the context of the integrated electricity system, absent other incentives to reduce generation and CO2
emissions from coal-fired EGUs, heat rate improvements and consequent variable cost reductions at those EGUs would cause them to become more competitive compared to other EGUs and increase their generation, leading to smaller overall reductions in CO2
emissions (depending on the CO2
emission rates of the displaced generating capacity). Unless mitigated, the occurrence of a rebound effect would reduce the emission reductions achieved by building block 1, exacerbating the inadequacy of emission reductions that is the basis for our conclusion that building block 1 alone would not represent the BSER for this industry. However, we believe that our concern about the potential rebound effect can be readily addressed by ensuring that the BSER also reflects other CO2
reduction strategies that encourage increases in generation from lower- or zero-carbon EGUs, thereby allowing building block 1 to be considered an appropriate part of the BSER for CO2
emissions at affected EGUs as long as the building block is applied in combination with other building blocks.
b.
Building block 2.
Building block 2—substituting generation from less carbon-intensive affected EGUs (specifically “existing” NGCC units, meaning units that were operating or had commenced construction as of January 8, 2014) for generation from the most carbon-intensive affected EGUs—is a component of the BSER for steam EGUs because generation shifts that will reduce the amount of CO2
emissions at higher-emitting EGUs and from the source category as a whole are technically feasible, are of reasonable cost, and perform well with respect to other factors relevant to a determination of the “best system of emission reduction . . . adequately demonstrated.” Building block 2 is a “system of emission reduction” for steam EGUs because incremental generation from existing NGCC units will result in reduced generation and emissions from steam EGUs, and owners of steam EGUs can, and many do, invest in incremental generation from NGCC units through a variety of possible mechanisms. A steam EGU investing in incremental generation from NGCC units may choose to reduce its own generation or may maintain its generation level and choose to allow the reduction in generation to occur at other steam EGUs through the coordinated planning and operation of the interconnected electricity system. An
( printed page 64746)
affected EGU may also invest in emission reductions from building block 2 through the mechanism of engaging in emissions trading where the EGU is operating under a standard of performance that incorporates trading.
The EPA's analysis and conclusions regarding the technical feasibility, costs, and magnitude of CO2
emission reductions achievable at high-emitting EGUs through generation shifts to lower-emitting affected EGUs are discussed in Section V.D. below. Additional analysis and conclusions with respect to cost reasonableness are discussed in section V.A.4.d. below. We consider generation shifts among the large number of diverse EGUs that are linked to one another and to customers by extensive regional transmission grids to be a routine and well-established operating practice within the industry that is used to facilitate the achievement of a wide variety of objectives, including environmental objectives, while meeting the demand for electricity services. In the interconnected and integrated electricity industry, fossil fuel-fired steam EGUs are able to reduce their generation and NGCC units are able to increase their generation in a coordinated manner through mechanisms—in some cases centralized and in others not—that regularly deal with such changes on both a short-term and a longer-term basis. Our analysis demonstrates that the emission reductions that can be achieved or supported by such generation shifts are substantial and of reasonable cost. Further, both the achievability of this building block and the reasonableness of its costs are supported by the fact that there has been a long-term trend in the industry away from coal-fired generation and toward NGCC generation for a variety of reasons.
Building block 2 is adequately demonstrated as a “system of emission reduction” for affected steam EGUs. As discussed in section V.B., since the time of the 1970 CAA Amendments, the utility power sector has recognized that generation shifts are a means of controlling air pollutants; in the 1990 CAA Amendments, Congress recognized that generation shifts among EGUs are a means of reducing emissions from this sector; and generation shifts similarly have been recognized as a means of reducing emissions under trading programs established by the EPA to implement the Act's provisions. It is common practice in the industry to account for the cost of emission allowances as a variable cost when making security-constrained, cost-based dispatch decisions; doing so integrates generation shifts into the operating practices used to achieve compliance with environmental requirements in an economical manner. These industry trends are further discussed in section V.D. Thus, legislative history, regulatory precedent, and industry practice support interpreting the broad term “system of emission reduction” as including substituting lower-emitting generation for higher-emitting generation through generation shifts among affected EGUs.
An important additional consideration supporting the determination that building block 2 is adequately demonstrated as a “system of emission reduction” is that owners of affected steam EGUs have the ability to invest in generation shifts as a way of reducing emissions. The owner of an affected EGU could invest in such generation shifts in several ways, including by increasing operation of an NGCC unit that it already owns or by purchasing an existing NGCC unit and increasing operation of that unit. Increases in generation by NGCC units over baseline levels can also serve as the basis for creation of CO2
ERCs—that is, instruments representing the ability of incremental electricity generated by NGCC units to cause emission reductions at affected steam EGUs, as distinct from the incremental electricity itself. Again, it is important to note that the acquisition of such ERCs represents an investment in the actions of the facility or facilities whose alteration of utilization levels generated the emissions rate improvement or reduction. In the context of the BSER, purchase of instruments representing the emissions-reducing benefit of an action is simply a medium of investment in the underlying emissions reduction action. These mechanisms are discussed further in section V.A.5. In this rule, the EPA is establishing minimum criteria for the creation of valid ERCs by NGCC units and for the use of such ERCs by affected steam EGUs for demonstrating compliance with emission rate-based standards of performance established under state plans. The existence of minimum criteria will ensure that crediting mechanisms are feasible and will facilitate the development of organized markets to simplify the process of buying and selling ERCs. The minimum criteria are discussed in section VIII of this preamble.
We note that an affected EGU investing in building block 2 to reduce emissions may, but need not, also choose to reduce its own generation as part of its approach for meeting the standard of performance assigned to it by its state. Through the coordinated operation of the integrated electricity system, subject to the collective emission reduction requirements that will be imposed on affected EGUs in order to meet the emissions standards representing the BSER, an increase in NGCC generation will be offset elsewhere in the interconnection by a decrease in other generation. Because of the need to meet the collective emission reduction requirements, the decrease in generation resulting from that coordinated operation is most likely to be generation from an affected steam EGU. Measures taken by affected EGUs that result in emission reductions from other EGUs in the source category may appropriately be deemed measures to implement or apply the “system of emission reduction” of substituting lower-emitting generation for higher-emitting generation.
Consideration of other BSER factors also supports a determination to include building block 2 as a component of the BSER. For example, we expect that building block 2 would have positive non-air health and environmental impacts. Coal combustion for electricity generation produces large volumes of solid wastes that require disposal, with some potential for adverse environmental impacts; these wastes are not produced by natural gas combustion. The intake and discharge of water for cooling at many EGUs also carries some potential for adverse environmental impacts; NGCC units generally require less cooling water than steam EGUs.[420]
With respect to energy impacts, building block 2 represents replacement of electrical energy from one generator with electrical energy from another generator that consumes less fuel, so the overall energy impact should be a reduction in fuel consumption by the overall source category as well as by individual affected coal-fired steam EGUs. Although for purposes of this rule we consider the incentive for technological innovation only in the alternative, we note that building block 2 promotes greater use of the NGCC technology installed in the existing fleet of NGCC units, which is newer and more advanced than the technology installed in much of the older existing fleet of steam EGUs. For all these reasons, the
( printed page 64747)
measures in building block 2 qualify as a component of the “best system of emission reduction . . . adequately demonstrated.”
It should be observed that, by definition of the elements of this building block, the shifts in generation taking place under building block 2 occur entirely among existing EGUs subject to this rulemaking.[421]
Through application of this building block considered in isolation, some affected EGUs—mostly coal-fired steam EGUs—would reduce their generation and CO2
emissions, while other affected EGUs—NGCC units—would increase their generation and CO2
emissions. However, because for each MWh of generation, NGCC units produce fewer CO2
emissions than coal-fired steam EGUs, the total quantity of CO2
emissions from all affected EGUs in aggregate would decrease without a reduction in total electricity generation. In the context of the integrated electricity system, where the operation of affected EGUs of multiple types is routinely coordinated to provide a highly substitutable service, and in the context of CO2
emissions, where location is not a consideration (in contrast with other pollutants), a measure that takes advantage of that integration to reduce CO2
emissions from the overall set of affected EGUs is readily understood as a means to implement a “system of emission reduction” for CO2
emissions at affected EGUs even if the measure would increase CO2
emissions from a subset of those affected EGUs. Indeed, some industry participants are already moving in this direction for this purpose (while other participants are moving in the same direction for other purposes). Standards of performance that incorporate emissions trading can facilitate the implementation of such a “system” and such approaches have already been used in the electricity industry to address CO2
as well as other pollutants, as discussed above.
c.
Building block 3.
Building block 3—substituting generation from expanded RE generating capacity for generation from affected EGUs—is a component of the BSER because the expansion and use of renewable generating capacity to reduce emissions from affected EGUs is technically feasible, is of reasonable cost, and performs well with respect to other factors relevant to a determination of the “best system of emission reduction . . . adequately demonstrated.” Building block 3 is a “system of emission reduction” for all affected EGUs because incremental RE generation will result in reduced generation and emissions from affected EGUs, and owners or operators of affected EGUs can apply or implement building block 3 through a number of actions. For example, they can invest in incremental RE generation either directly or through the purchase of ERCs. An affected EGU investing in incremental RE generation may choose to reduce its own generation by a corresponding amount or may choose to allow the reduction in generation to occur at other affected EGUs through the coordinated planning and operation of the interconnected electricity system. An affected EGU can also invest in RE generation by means of engaging in emissions trading where the EGU is operating under a standard of performance that incorporates trading.
The EPA's analysis and conclusions regarding the technical feasibility, costs, and magnitude of the measures in building block 3 are discussed in Section V.E. below. Additional analysis and conclusions with respect to cost reasonableness are discussed in section V.A.4.d. below. We consider construction and operation of expanded RE generating capacity to be proven, well-established practices within the industry consistent with recent industry trends. States are already pursuing policies that encourage production of greater amounts of RE, such as the establishment of targets for procurement of renewable generating capacity. Moreover, as discussed earlier, markets are likely to develop for ERCs that would facilitate investment in increased RE generation as a means of helping sources comply with their standards of performance; indeed, markets for RECs, which similarly facilitate investment in RE for other purposes, are already well-established. As noted in Section V.A.5. below, an allowance system or tradable emission rate system would provide incentives for affected EGUs to reduce their emissions as much as possible where such reductions could be achieved economically (taking into account the value of the emission credits or allowances), including by substituting generation from new RE generating capacity for their own generation, or could provide a mechanism, as stated above, for such sources to invest in or acquire such generation.
Building block 3 is adequately demonstrated as a “system of emission reduction” for all affected EGUs. As discussed in section II, RE generation has been relied on since the 1970s to provide energy security by replacing some fossil fuel-fired generation. Both Congress and the EPA have previously established frameworks under which RE generation could be used as a means of achieving emission reductions from the utility power sector, as discussed in section V.B. Investment in RE generation has grown rapidly, such that in recent years the amount of new RE generating capacity brought into service has been comparable to the amount of new fossil fuel-fired capacity. Rapid growth in RE generation is projected to continue as costs of RE generation fall relative to the costs of other generation technologies. These trends are further discussed in section V.E. Interpretation of a “system of emission reduction” as including RE generation for purposes of this rule is thus supported by legislative history, regulatory precedent, and industry practice.
Also supporting the determination that building block 3 is adequately demonstrated as a “system of emission reduction” is the fact that owners of affected EGUs have the ability to invest in RE generation as a way of reducing emissions. As with building block 2, this can be accomplished in several ways. For example, the owner of an affected EGU could invest in new RE generating capacity and operate that capacity in order to obtain ERCs. Alternatively, the affected EGU could purchase ERCs created based on the operation of an unaffiliated RE generating facility, effectively investing in the actions at another site that allow CO2
emission reductions to occur. These mechanisms are discussed further in section V.A.5. As with building block 2, in this rule the EPA is establishing minimum criteria for the creation of valid ERCs by new RE generators and for the use of such ERCs by affected EGUs for demonstrating compliance with emission rate-based standards of performance established under state plans. The existence of minimum criteria will ensure that crediting mechanisms are feasible and will facilitate the development of organized markets to simplify the process of buying and selling credits. The minimum criteria are discussed in section VIII of the preamble.
As with building block 2, an affected EGU investing in building block 3 to reduce emissions may, but need not, also choose to reduce its own generation as part of its approach for meeting the standard of performance assigned to it by its state. Through the coordinated operation of the integrated electricity system, subject to the collective requirements that will be imposed on affected EGUs in order to meet the
( printed page 64748)
emissions standards representing the BSER, an increase in RE generation will be offset elsewhere in the interconnection by a decrease in other generation. Because of the need to meet the collective requirements, the decrease in generation resulting from that coordinated operation is most likely to be generation from an affected EGU. Measures taken by affected EGUs that result in emission reductions from other sources in the source category may appropriately be deemed methods to implement the “system of emission reduction.”
The renewable capacity measures in building block 3 generally perform well against other BSER criteria. Generation from wind turbines and solar voltaic installations, two common renewable technologies, does not produce solid waste or require cooling water, a better environmental outcome than if that amount of generation had instead been produced at a typical range of fossil fuel-fired EGUs. With respect to energy impacts, fossil fuel consumption will decrease both for the source category as a whole and for individual affected EGUs. Although the variable nature of generation from renewable resources such as wind and solar units requires special consideration from grid operators to address possible changes in operating reserve requirements, renewable generation has grown quickly in recent years, as discussed above, and grid planners and operators have proven capable of addressing any consequent changes in requirements through ordinary processes. The EPA believes that planners and operators will be similarly capable of addressing any changes in requirements due to future growth in renewable generation through ordinary processes, but notes that in addition, the reliability safety valve in this rule, discussed in section VIII.G.2, will ensure the absence of adverse energy impacts. With respect to technological innovation, which we consider for the BSER only in the alternative, incentives for expansion of renewable capacity encourage technological innovation in improved renewable technologies as well as more extensive deployment of current advanced technologies. For all these reasons, the measures in building block 3 qualify as a component of the “best system of emission reduction . . . adequately demonstrated.”
d.
Combination of all three building blocks.
The final BSER includes a combination of all three building blocks. For the reasons described below, and similar to each of the building blocks, the combination must be considered a “system of emission reduction.” Moreover, as also discussed below, the combination qualifies as the “best” system that is “adequately demonstrated.” The combination is technically feasible; it is capable of achieving meaningful reductions in CO2
emissions from affected EGUs at a reasonable cost; it also performs well against the other BSER factors; and its components are well-established. The combination of the three building blocks will achieve greater CO2
emission reductions at reasonable costs than possible combinations with fewer building blocks and will also perform better against other BSER factors. We therefore find the combination of all three building blocks to be the “best system of emission reduction . . . adequately demonstrated” for reducing CO2
emissions at affected EGUs.
As already discussed, each of the individual building blocks generally performs well with respect to the BSER factors identified by the statute and the D.C. Circuit. (The exception, which we have pointed out above, is that building block 1, if implemented in isolation, would achieve an insufficient magnitude of emission reductions to be considered the BSER.) The EPA expects that combinations of the building blocks would perform better than the individual building blocks. Beginning with the most obvious and important advantage, combinations of the building blocks will achieve greater emission reductions than the individual building blocks would in isolation, assuming that the building blocks are applied with the same stringency. Because fossil fuel-fired EGUs generally have higher variable costs than other EGUs, it will generally be fossil fuel-fired generation that is replaced when low-variable cost RE generation is increased. At the levels of stringency determined to be reasonable in this rule, opportunities to deploy building block 2 to replace higher-emitting generation and to deploy building block 3 to replace any emitting generation are not exhausted. Thus, as the system of emission reduction is expanded to include each of these building blocks, the emission reductions that will be achieved increase.
Because the stringency and timing of emission reductions achievable through use of each individual building block have been set based on what is achievable at reasonable cost rather than the maximum achievable amount, the stringency of the combination of building blocks is also reasonable, and the combination provides headroom and additional flexibility for states in setting standards of performance and for sources in complying with those standards to choose among multiple means of reducing emissions.
With respect to the quantity of emission reductions expected to be achieved from building block 1 in particular, the BSER encompassing all three building blocks is a substantial improvement over building block 1 in isolation. As noted earlier, the EPA is concerned that implementation of building block 1 in isolation not only would achieve insufficient emission reductions assuming generation levels from affected steam EGUs were held constant, but also has the potential to result in a “rebound effect.” The nature of the potential rebound effect is that by causing affected steam EGUs to improve their heat rates and thereby lower their variable operating costs, building block 1 if implemented in isolation would make those EGUs more competitive relative to other, lower-emitting fossil fuel-fired EGUs, possibly resulting in increased generation and higher emissions from the affected steam EGUs in spite of their lower emission rates. Combining building block 1 with the other building blocks addresses this concern by ensuring that owner/operators of affected steam EGUs as a group would have appropriate incentives not only to improve the steam EGUs' efficiency but also to reduce generation from those EGUs consistent with replacement of generation by low- or zero-emitting EGUs. While combining building block 1 with either building block 2 or 3 should address this concern, the combination of all three building blocks addresses it more effectively by strengthening the incentives to reduce generation from affected steam EGUs.
The combination of all three building blocks is also of reasonable cost, for a number of independent reasons described below. The emission reductions associated with the BSER determined in this rule are significant, necessary, and achievable. As discussed in section V.A.1. above, the Administrator must take cost into account when determining that the measures constituting the BSER are adequately demonstrated, and the Administrator has done so here. Below, we summarize information on the cost of the building block measures and discuss the several independent reasons for the Administrator's determination that the costs of the building block 1, 2, and 3 measures, alone or in combination, are reasonable. In considering whether these costs are reasonable, the EPA considered the costs in light of both the observed and projected effects of GHGs in the atmosphere, their effect on climate, and
( printed page 64749)
the public health and welfare risks and impacts associated with such climate change, as described in Section II.A. The EPA focused on public health and welfare impacts within the U.S., but the impacts in other world regions strengthen the case for action because impacts in other world regions can in turn adversely affect the U.S. or its citizens. In looking at whether costs were reasonable, the EPA also considered that EGUs are by far the largest emitters of GHGs among stationary sources in the U.S., as more fully set forth in section II.B.
As described in sections V.C. through V.E. and the GHG Mitigation Measures TSD, the EPA has determined that the cost of each of the three building blocks is reasonable. In summary, these cost estimates are $23 per ton of CO2
reductions for building block 1, $24 per ton for building block 2, and $37 per ton for building block 3. The EPA estimates that, together, the three building blocks are able to achieve CO2
reductions at an average cost of $30 per ton, which the EPA likewise has determined is reasonable. The $30 per ton estimate is an average of the estimates for each building block, weighted by the total estimated cumulative CO2
reductions for each of these building blocks over the 2022-2030 period. While it is possible to weight each building block by other amounts, the EPA believes that weighting by cumulative CO2
reductions best reflects the average cost of total reduction potential across the three building blocks. The EPA considers each of these cost levels reasonable for purposes of the BSER established for this rule.
The EPA views the weighted average cost estimate as a conservatively high estimate of the cost of deploying all three building blocks simultaneously. The simultaneous application of all three building blocks produces interactive dynamics, some of which could increase the cost and some of which could decrease the cost represented in the individual building blocks. For example, one dynamic that would tend to raise costs (and whose omission would therefore make the weighted average understate costs) is that the emission reduction measures associated with building blocks 2 and 3 both prioritize the replacement of higher-cost generation (from affected steam EGUs in the case of building block 2 and from all affected EGUs in the case of building block 3). The EPA recognizes that the increased magnitude of generation replacement when building blocks 2 and 3 are implemented together necessitates that some of the generation replacement will occur at more efficient affected EGUs, at a relatively higher cost; however, this is a consequence of the greater emission reductions that can be achieved by combining building blocks, not an indication that any individual building block has become more expensive because of the combined deployment.
Also, the EPA recognizes that when building block 1 is combined with the other building blocks, the combination has the potential to raise the cost of the portion of the overall emission reductions achievable through heat rate improvements relative to the cost of those same reductions if building block 1 were implemented in isolation (assuming for purposes of this discussion that the rebound effect is not an issue and that the affected steam EGUs would in fact reduce their emissions if building block 1 were implemented in isolation).[422]
However, we believe that the cost of emission reductions achieved through heat rate improvements in the context of a three-building block BSER will remain reasonable for two reasons. First, as discussed in section V.C. below, even when conservatively high investment costs are assumed, the cost of CO2
emission reductions achievable through heat rate improvements is low enough that the cost per ton of CO2
emission reductions will remain reasonable even if that cost is substantially increased. Second, although under a BSER encompassing all three building blocks the volume of coal-fired generation will decrease, that decrease is unlikely to be spread uniformly among all coal-fired EGUs. It is more likely that some coal-fired EGUs will decrease their generation slightly or not at all while others will decrease their generation by larger percentages or cease operations altogether. We would expect EGU owners to take these changes in EGU operating patterns into account when considering where to invest in heat rate improvements, with the result that there will be a tendency for such investments to be concentrated in EGUs whose generation output is expected to decrease the least. This enlightened bias in spending on heat rate improvements—that is, focusing investments on EGUs where such improvements will have the largest impacts and produce the highest returns, given consideration of projected changes in dispatch patterns—will tend to mitigate any deterioration in the cost of CO2
emission reductions achievable through heat rate improvements.
In contrast with those prior examples, combining the building blocks also produces interactive dynamics that significantly reduce the cost for CO2
reductions represented in the individual building blocks (and whose omission would therefore make the weighted average overstate costs). Foremost among these dynamics is the stabilization of wholesale power prices. When assessed individually, building blocks 2 and 3 have opposite impacts on wholesale power prices, although in each case, the direction of the wholesale power price impact corresponds to an increasing cost of that building block in isolation. For example, building block 2 promotes more utilization of existing NGCC capacity, which (assessed on its own) would increase natural gas consumption and therefore price, in turn raising wholesale power prices (which are often determined by gas-fired generators as the power supplier on the margin); this dynamic puts upward pressure on the cost of achieving CO2
reductions through shifting generation from steam EGUs to NGCC units.[423]
Meanwhile, building block 3 increases RE deployment; because RE generators have very little variable cost, an increase in RE generation replaces other supply with higher variable cost, which would yield lower wholesale power prices. Lower wholesale power prices would make further RE deployment less competitive against generation from existing emitting sources; while this dynamic would generally reduce electricity prices to consumers, it also puts upward pressure on the cost of achieving CO2
reductions through increased RE deployment.[424]
Applying building blocks 2 and 3 together produces significantly more CO2
reductions at a relatively lower cost because the countervailing nature of these wholesale power price dynamics mitigates the primary cost drivers for each building block.[425]
( printed page 64750)
The EPA believes the dynamics tending to cause the weighted average above to overstate costs of the combination of building blocks are greater than the dynamics tending to cause costs to be understated, and that the weighted average costs are therefore conservatively high. Analysis performed by the EPA at an earlier stage of the rulemaking supports this conclusion. At proposal, the EPA evaluated the cost of increasing NGCC utilization (building block 2) and deploying incremental RE generation (building block 3) independently, as well as the cost of simultaneously increasing NGCC utilization and incremental RE generation. The average cost (in dollars per ton of CO2
reduced) was less for the combined building block scenario, showing that the net outcome of the interactivity effects described above is a reduction in cost per ton when compared to cost estimates that do not incorporate this interactivity.[426]
A final reason why the EPA considers the weighted-average cost above conservatively high is that simply combining the building blocks at their full individual stringencies overstates the stringency of the BSER. As discussed in section V.A.3.f and section VI, the BSER reflects the combined degree of emission limitation achieved through application of the building blocks in the least stringent region. By definition, in the other two regions, the BSER is less stringent than the simple combination of the three building blocks whose stringency is represented in the weighted-average cost above.
The cost estimates for each of the three building blocks cited above—$23, $24, and $37 per ton of CO2
reductions from building blocks 1, 2, and 3, respectively—are each conservatively high for the reasons discussed in section V.C., V.D., and V.E. below. Likewise, the $30 per ton weighted-average cost of all three building blocks is a conservatively high estimate of the cost of the combination of the three individual building block costs, as described above. While conservatively high, and especially so in the case of the $30 per ton weighted-average cost, these estimates fall well within the range of costs that are reasonable for the BSER for this rule.
In assessing cost reasonableness for the BSER determination for this rule, the EPA has compared the estimated costs discussed above to two types of cost benchmark. The first type of benchmark comprises costs that affected EGUs incur to reduce other air pollutants, such as SO2
and NOX
. In order to address various environmental requirements, many coal-fired EGUs have been required to decide between either shutting down or installing and operating flue gas desulfurization (FGD) equipment—that is, wet or dry scrubbers—to reduce their SO2
emissions. The fact that many of these EGUs have chosen scrubbers in preference to shutting down is evidence that scrubber costs are reasonable, and we believe that the cost of these controls can reasonably serve as a cost benchmark for comparison to the costs of this rule. We estimate that for a 300-700 MW coal-fired steam EGU with a heat rate of 10,000 Btu per kWh and operating at a 70 percent utilization rate, the annualized costs of installing and operating a wet scrubber are approximately $14 to $18 per MWh and the annualized costs of installing and operating a dry scrubber are approximately $13 to $16 per MWh.[427]
In comparison, we estimate that for a coal-fired steam EGU with a heat rate of 10,000 Btu per kWh, assuming the conservatively high cost of $30 per ton of CO2
removed through the combination of all three building blocks, the cost of reducing CO2
emissions by the amount required to achieve the uniform CO2
emission performance rate for steam EGUs of 1,305 lbs. CO2
per MWh would be equivalent to approximately $11 per MWh. The comparable costs for achieving the required emission performance rate for steam EGUs through use of the individual building blocks range from $8 to $14 per MWh. For an NGCC unit with a heat rate of 7,800 Btu per kWh, assuming a conservatively high cost of $37 per ton of CO2
removed through the use of building block 3,[428]
the cost of reducing CO2
emissions by the amount required to achieve the uniform CO2
emission performance rate for NGCC units of 771 lbs. CO2
per MWh would be equivalent to approximately $3 per MWh.[429]
These estimated CO2
reduction costs of $3 to $14 per MWh to achieve the CO2
emission performance rates are either less than the ranges of $14 to $18 and $13 to $16 per MWh to install and operate a wet or dry scrubber, or in the case of CO2
emission reductions at a steam unit achieved through building block 3, near the low end of the ranges of scrubber costs. This comparison demonstrates that the costs associated with the BSER in this rule are reasonable compared to the costs that affected EGUs commonly face to comply with other environmental requirements.
The second type of benchmark comprises CO2
prices that owners of affected EGUs use for planning purposes in their IRPs. Utilities subject to requirements to prepare IRPs commonly include assumptions regarding future environmental regulations that may become effective during the time horizon covered by the IRP, and assumptions regarding CO2
regulations are often represented in the form of assumed prices per ton of CO2
emitted or reduced. A survey of the CO2
price assumptions from 46 recent IRPs shows a range of CO2
prices in the IRPs' reference cases of $0 to $30 per ton, and a range of CO2
prices in the IRPs' high cases from $0 to $110 per ton.[430]
In comparison, the conservatively high, weighted-average cost of $30 per ton removed described above is at the high end of the range of reference case assumptions but at the low end of the range of the high case assumptions. The costs of the individual building blocks are likewise well within the range of the high case assumptions, and either at or slightly above the high end of the reference case assumptions. This comparison demonstrates that the costs associated with the BSER in this rule are reasonable compared to the expectations of the industry for the potential costs of CO2
regulation.
In addition to comparison to these benchmarks, there is a third independent way in which EPA has considered cost. In light of the severity of the observed and projected climate change effects on the U.S., U.S. interests, and U.S. citizens, combined with EGUs' large contribution to U.S. GHG emissions, the costs of the BSER measures are reasonable when compared to other potential control measures for this sector available under
( printed page 64751)
section 111. Given EGUs' large contribution to U.S. GHG emissions, any attempt to address the serious public health and environmental threat of climate change must necessarily include significant emission reductions from this sector. The agency would therefore consider even relatively high costs—which these are not—to be reasonable. Imposing only the lower cost reduction measures in building block 1 would not achieve sufficient reductions given the scope of the problem and EGUs' contribution to it. While the EPA also considered measures such as CCS retrofits for all fossil-fired EGUs or co-firing at all steam units, the EPA determined that these costs were too high when considered on a sector-wide basis. Furthermore, the EPA has not identified other measures available under section 111 that are less costly and would achieve emission reductions that are commensurate with the scope of the problem and EGUs' contribution to it. Thus, the EPA determined that the costs of the measures in building blocks 1, 2 and 3, individually or in combination, are reasonable because they achieve an appropriate balance between cost and amount of reductions given the other potential control measures under section 111.
As required under Executive Order 12866, the EPA conducts benefit-cost analyses for major Clean Air Act rules.[431]
While benefit-cost analysis can help to inform policy decisions, as permissible and appropriate under governing statutory provisions, the EPA does not use a benefit-cost test (
i.e.,
a determination of whether monetized benefits exceed costs) as the sole or primary decision tool when required to consider costs or to determine whether to issue regulations under the Clean Air Act, and is not using such a test here.[432]
Nonetheless, the EPA observes that the costs of the building block 1, 2 and 3 measures, both individually and combined as discussed in this section above, are less than the central estimates of the social cost of carbon. Developed by an interagency workgroup, the social cost of carbon (SC-CO2) is an estimate of the monetary value of impacts associated with marginal changes in CO2
emissions in a given year.[433]
It is typically used to assess the avoided damages as a result of regulatory actions (
i.e.,
benefits of rulemakings that lead to an incremental reduction in cumulative global CO2
emissions).[434]
The central values for the SC-CO2
range from $40 per short ton in 2020 to $48 per short ton in 2030.[435]
The weighted-average cost estimate of $30 per ton is well below this range.
Finally, the EPA notes that the combination of all three building blocks would perform consistently with the individual building blocks with respect to non-air energy and environmental impacts. There is no reason to expect an adverse non-air environmental or energy impact from deployment of the combination of the three building blocks, whether considered on a source-by-source basis, on a sector-wide or national basis, or both. In fact, the combination of the building blocks, like the building blocks individually, as discussed above, would be expected to produce non-air environmental co-benefits in the form of reduced water usage and solid waste production (and, in addition to these non-air environmental co-benefits, would also be expected to reduce emissions of non-CO2
air pollutants such as SO2, NOX, and mercury). Likewise, with respect to technological innovation, which we consider only in the alternative, the building blocks in combination would have the same positive effects that they would have if implemented independently.
e.
Other combinations of the building blocks.
The EPA has considered whether other combinations of the building blocks, such as a combination of building blocks 1 and 2 or a combination of building blocks 1 and 3, could be the BSER. We believe that any such combination is technically feasible and would be a “system of emission reduction” capable of achieving meaningful reductions in CO2
emissions from affected EGUs at a reasonable cost. As with the combination of three building blocks discussed above, any combination of building blocks would achieve greater emission reductions than the individual building blocks encompassed in that combination would achieve if implemented in isolation. Further, the cost of any combination would be driven principally by the combined stringency and would remain reasonable in aggregate, such that the conclusions on cost reasonableness discussed in section V.A.4.d. would continue to apply. We have already noted our determination that building block 1 in isolation is not the BSER because it would not produce a sufficient quantity of emission reductions. A combination of building block 1 with one of the other building blocks would produce greater emission reductions and would not be subject to this concern. Any combination of building blocks including building block 1 and at least one other building block would also address the concern about potential “rebound effect,” discussed above, that could occur if building block 1 were implemented in isolation. Finally, there is no reason to expect any combination of the building blocks to have adverse non-air energy or environmental impacts, and the implications for technological innovation, which we consider only in the alternative, would likewise be positive for any combination of the building blocks because those implications are positive for the individual building blocks and there is no reason to expect negative interaction from a combination of building blocks.
For these reasons, any combination of the building blocks (but not a BSER comprising building block 1 in isolation) could be the BSER if it were not for the fact that a BSER comprising all three of the building blocks will achieve greater emission reductions at a reasonable cost and is therefore “better.” As discussed below in section V.A.7., we intend for the individual building blocks to be severable, such that if a court were to deem building block 2 or 3 defective, but not both, the BSER would comprise the remaining building blocks.
f.
Achievability of emission limits.
As noted, based on the BSER, the EPA has
( printed page 64752)
established a source subcategory-specific emission performance rate for fossil steam units and one for NGCC units. As discussed in section V.A.1.c., for new sources, standards of performance must be “achievable” under CAA section 111(a)(1), and the D.C. Circuit has identified criteria for achievability.[436]
In this rule, the EPA is taking the approach that while the states are not required to adopt those source subcategory-specific emission performance rates as the standards of performance for their affected EGUs, those rates must be achievable by the steam generator and NGCC subcategories, respectively. In addition, the EPA is assuming that the achievability criteria in the case law for new sources apply to existing sources under section 111(d). For the reasons discussed next, for this rule, the source subcategory-specific emission performance rates are achievable in accordance with those criteria in the case law.
As noted, the building blocks include several features that assure that affected EGUs may implement them. The building blocks may be implemented through a range of methods, including through the purchase of ERCs and emission trading. In addition, the building blocks incorporate “headroom.” Moreover, the source subcategory-specific emission performance rates apply on an annual or longer basis, so that short-term issues need not jeopardize compliance. In addition, we quantify the emission performance rates based on the degree of emission limitation achievable by affected EGUs in the region where application of the combined building blocks results in the least stringent emission rate. Because the means to implement the building blocks are widely available and because of the just-noted flexibilities and approaches to the emission performance rates, all types of affected steam generating units, operating throughout the lower-48 states and under all types of regulatory regimes, are able to implement building blocks 1, 2 and 3 and thereby achieve the emission performance rate for fossil steam units, and all types of NGCC units operating in all states under all types of regulatory requirements are able to implement building block 3 and thereby achieve the emission performance rate for NGCC units.[437]
Commenters have raised questions about whether particular circumstances could arise, such as the sudden loss of certain generation assets, that would cause the implementation of the building blocks to cause reliability problems, and have cautioned that these circumstances could preclude implementation of the building blocks and thus achievement of the emission performance rates. Commenters have also raised concerns about whether affected EGUs with limited remaining useful lives can implement the building blocks and achieve the emission performance rates. We address those concerns in section VIII, where we authorize state plans to include a reliability mechanism and discuss affected EGUs with limited remaining useful lives. Accordingly, we conclude that the source subcategory-specific emission performance standards are achievable in accordance with the case law.
5. Actions Under the BSER That Sources Can Take To Achieve Standards of Performance
Based on the determination of the BSER described above, the EPA has identified a performance rate of 1305 lbs. per net MWh for affected steam EGUs and a performance rate of 771 lbs. per net MWh for affected stationary combustion turbines. The computations of these performance rates and the determinations of state goals reflecting these rates are described in sections VI and VII of the preamble, respectively.
Under section 111(d), states determine the standards of performance for individual sources. The EPA is authorizing states to express the standards of performance applicable to affected EGUs as either emission rate-based limits or mass-based limits. As described above, the sets of actions that sources can take to comply with these standards implement or apply the BSER and, in that sense, may be understood as part of the BSER.
A source to which a state applies an emission rate-based limit can achieve the limit through a combination of the following set of measures (to the extent allowed by the state plan), all of which are components of the BSER, again, in the sense that they implement or apply it:
Reducing its heat rate (building block 1).
Directly investing in, or purchasing ERCs created as a result of, incremental generation from existing NGCC units (building block 2).
Directly investing in, or purchasing ERCs created as a result of, generation from new or uprated RE generators (building block 3).
Reducing its utilization, coupled with direct investment in or purchase of ERCs representing building blocks 2 and 3 as indicated above.
Investing in surplus emission rate reductions at other affected EGUs through the purchase or other acquisition of rate-based emission credits.
A source to which a state applies a mass-based limit can achieve the limit through a combination of the following set of measures (to the extent allowed by the state plan), all of which are likewise components of the BSER:
Reducing its heat rate (building block 1).
Reducing its utilization and allowing its generation to be replaced or avoided through the routine operation of industry reliability planning mechanisms and market incentives.
Investing in surplus emission reductions at other affected EGUs through the purchase or other acquisition of mass-based emission allowances.
The EPA has determined appropriate CO2
emission performance rates for each of the two source subcategories as a whole achievable through application of the building blocks. The wide ranges of measures included in the BSER and available to individual sources as indicated above provide assurance that the source category as a whole can achieve standards of performance consistent with those emissions standards using components of the BSER, whether states choose to establish emission rate-based limits or mass-based limits. The wide ranges of measures included in the BSER also provide assurance that each individual affected EGU could achieve the standard of performance its state establishes for it using components of the BSER. Of course, sources may also employ measures not included in the BSER, to the extent allowed under the applicable state plan.
In the remainder of this subsection, we discuss further how affected EGUs can use each of the measures listed above to achieve emission rate-based forms of performance standards and mass-based forms of performance standards, indicating that all types of owner/operators of affected EGUs—
i.e.,
vertically integrated utilities and merchant generators; investor-owned, government-owned, and customer-owned (cooperative) utilities; and owner/operators of large, small, and single-unit fleets of generating units—have the ability to implement each of the building blocks in some way. In the following subsection we discuss the use
( printed page 64753)
of measures not in the BSER that can help sources achieve the standards of performance.
a.
Use of BSER measures to achieve an emission rate-based standard.
Under an emission-rate based form of performance standards, compliance is nominally determined through a comparison of the affected EGU's emission rate to the emission rate standard. The emissions-reducing impact of BSER measures that reduce CO2
emissions through reductions in the quantity of generation rather than through reductions in the amount of CO2
emitted per unit of generation would not be reflected in an affected EGU's emission rate computed solely based on measured stack emissions and measured electricity generation but can readily be reflected in an emission rate computation by averaging ERCs acquired by the affected EGU into the rate computation.
In section VIII.K, we discuss the processes for issuance and use of ERCs that can be included in the emission rate computations that affected EGUs perform to demonstrate compliance with an emission rate standard. This ERC mechanism is analogous to the approach the EPA has used to reflect building blocks 2 and 3 in the uniform emission rates representing the BSER, as discussed in section VI below. As summarized below and as discussed in greater detail in section VIII.K, the existence of a clearly feasible path for usage of ERCs ensures that emission reductions achievable through implementation of the measures in building blocks 2 and 3 are available to assist all affected EGUs in achieving compliance with standards of performance based on the BSER.
(1)
Building block 1.
The owner/operator of an affected steam EGU can take steps to reduce the unit's heat rate, thereby lowering the unit's CO2
emission rate. Examples of actions in this category are included in section V.C. below and in the GHG Mitigation Measures TSD for the CPP Final Rule. Any type of owner/operator can take advantage of this measure.
(2)
Building block 2.
The owner/operator of an affected EGU can average the EGU's emission rate with ERCs issued on the basis of incremental generation from an existing NGCC unit. As permitted under the EGU's state's section 111(d) plan, the owner/operator of the affected EGU could accomplish this through either common ownership of the NGCC unit, a bilateral transaction with the owner/operator of the NGCC unit, or a transaction for ERCs through an intermediary, which could but need not involve an organized market.[438]
As discussed earlier, based on observation of market behavior both inside and outside the electricity industry, we expect that intermediaries will seek opportunities to participate in such transactions and that organized markets are likely to develop as well if section 111(d) plans authorize the use of ERCs. While the opportunity to acquire ERCs through common ownership of NGCC facilities might not extend to owner/operators of single EGUs or small fleets, all owner/operators would have the ability to engage in bilateral or intermediated purchase transactions for ERCs just as they can engage in transactions for other kinds of goods and services.
In section VIII.K below, the EPA sets out the minimum criteria that must be satisfied for generation and issuance of a valid ERC based upon incremental electricity generation by an existing NGCC unit. Those criteria generally concern ensuring that the physical basis for the ERC—
i.e.,
qualifying generation by an existing NGCC unit and the NGCC unit CO2
emissions associated with that qualifying generation—is adequately monitored and that there is an adequate administrative process for tracking credits to avoid double-counting. In the case of ERCs related to building block 2, the monitoring criteria would generally be satisfied by standard 40 CFR part 75 monitoring.
The owner/operator of an affected steam EGU would use the ERCs it has acquired for compliance—whether acquired through ownership of NGCC capacity, a bilateral transaction, or an intermediated transaction—by adding the ERCs to its measured net generation when computing its CO2
emission rate for purposes of demonstrating compliance with its emission rate-based standard of performance.
(3)
Building block 3.
The owner/operator of an affected EGU can average the EGU's emission rate with ERCs issued on the basis of generation from new (
i.e.,
post-2012) RE generating capacity, including both newly constructed capacity and new uprates to existing RE generating capacity. As permitted under the EGU's state's section 111(d) plan, the owner/operator of the affected EGU could accomplish this through either common ownership of the RE generating capacity, a bilateral transaction with the owner/operator of the RE generating capacity, or a transaction for ERCs through an intermediary, which could, but need not, involve an organized market.[439]
As discussed earlier, based on observation of market behavior both inside and outside the electricity industry, we expect that intermediaries will seek opportunities to participate in such transactions and that organized markets are likely to develop as well if section 111(d) plans authorize the use of ERCs. While the opportunity to acquire ERCs through common ownership of RE generating facilities might not extend to owner/operators of single EGUs or small fleets, all owner/operators would have the ability to engage in bilateral or intermediated purchase transactions for ERCs just as they can engage in transactions for other kinds of goods and services.
In section VIII.K below, the EPA sets out the minimum criteria that must be satisfied for generation and issuance of a valid ERC based upon generation from new RE generating capacity. Those criteria generally concern assuring that the physical basis for the ERC—
i.e.,
generation by qualifying new RE capacity—is adequately monitored and that there is an adequate administrative process for tracking credits to avoid double-counting.[440]
As with building block 2, the owner/operator of an affected EGU would use the ERCs it has acquired for compliance—whether acquired through ownership of qualifying RE generating capacity, a bilateral transaction, or an intermediated transaction—by adding the ERCs to its measured net generation when computing its CO2
emission rate for purposes of demonstrating compliance with its emission rate-based standard of performance.
(4)
Reduced generation.
The owner/operator of an affected EGU can reduce the unit's generation and reflect that reduction in the form of a lower emission rate provided that the owner/operator also acquires some amount of ERCs to use in computing the unit's emission rate for purposes of demonstrating compliance. As
( printed page 64754)
permitted under the EGU's state's section 111(d) plan, the ERCs could be acquired through investment in incremental generation from existing NGCC capacity, generation from new RE generating capacity, or purchase from an entity with surplus ERCs. If the owner/operator does not average any ERCs into the unit's emission rate, reducing the unit's own generation will proportionately reduce both the numerator and denominator of the fraction and therefore will not affect the computed emission rate (unless the unit retires, reducing its emission rate to zero). However, if the owner/operator does average ERCs into the unit's emission rate, then a proportional reduction in both the numerator and the portion of the denominator representing the unit's measured generation will amplify the effect of the acquired ERCs in the computation, with the result that the more the unit reduces its generation, the fewer ERCs will be needed to reach a given emission rate-based standard of performance. All owner/operators have the ability to reduce generation, and as discussed above all also would be capable of acquiring ERCs, so all would be capable of reflecting reduced utilization in their emission rates for purposes of demonstrating compliance.
(5)
Emissions trading approaches.
To the extent allowed under standards of performance that incorporate emissions trading or otherwise through the relevant section 111(d) plans, the owner/operator of an affected EGU can acquire tradable rate-based emission credits representing an investment in surplus emission rate reductions not needed by another affected EGU and can average those credits into its own emission rate for purposes of demonstrating compliance with its rate-based standard of performance. The approach would have to be authorized in the appropriate section 111(d) plan and would have to conform to the minimum conditions for such approaches described in section VIII below. As we have repeatedly noted, based on our reading of the comment record and the discussions that occurred during the outreach process, it is reasonable to presume that such authorization will be forthcoming from states that submit plans establishing rate-based standards of performance for their affected EGUs.
Under a rate-based emissions trading approach, credits are initially created and issued according to processes defined in the state plan. After credits are initially issued, the owner/operator of an affected EGU needing additional credits can acquire credits through common ownership of another affected EGU or through a bilateral transaction with the other affected EGU, or the owner/operator of the affected EGU can acquire credits in a transaction through an intermediary, which could, but need not, involve an organized market. As discussed earlier, based on observation of market behavior both inside and outside the electricity industry, we expect that intermediaries will seek opportunities to participate in such transactions and that organized markets are likely to develop as well if section 111(d) plans and/or standards of performance established thereunder authorize emissions trading. While the opportunity to acquire credits through common ownership might not extend to owner/operators of single EGUs or small fleets, all owner/operators would have the ability to engage in bilateral or intermediated purchase transactions for credits just as they can engage in transactions for other kinds of goods and services.
Further details regarding the possible use of rate-based emission credits in a state plan (using ERCs issued on the basis of investments in building blocks 2 and 3 and potentially other measures as the credits) are provided in section VIII.K.
b.
Use of BSER measures to achieve a mass-based standard.
Under a mass-based form of the standard, compliance is determined through a comparison of the affected EGU's monitored mass emissions to a mass-based emission limit. Although a state could choose to impose specific mass-based limits that each EGU would be required to meet on a physical basis, in past instances where mass-based limits have been established for large numbers of sources it has been typical for the limit on each affected EGU to be structured as a requirement to periodically surrender a quantity of emission allowances equal to the source's monitored mass emissions. The EPA believes that section 111(d) encompasses the flexibility for plans to impose mass-based standards in the typical manner where the standard of performance for each affected EGU consists of a requirement to surrender emission allowances rather than a requirement to physically comply with a unit-specific emissions cap.
Measurements of mass emissions at a given affected EGU capture reductions in the EGU's emissions arising from both reductions in generation and reductions in the emission rate per MWh. Accordingly, under a mass-based standard there is no need to provide a mechanism such as the ERC mechanism described above in order to properly account for emission reductions attributable to particular types of BSER measures. The relative simplicity of the mechanics of monitoring and determining compliance are significant advantages inherent in the use of mass-based standards rather than emission rate-based standards.
(1)
Building block 1.
The owner/operator of an affected steam EGU can take steps to reduce the unit's heat rate, thereby lowering the unit's CO2
mass emissions. Examples of actions in this category are included in section V.C. below and in the GHG Mitigation Measures TSD for the CPP Final Rule. Any type of owner/operator can take advantage of this measure.
(2)
Reduced generation.
The owner/operator of an affected EGU can reduce its generation, thereby lowering the unit's CO2
mass emissions. Any type of owner/operator can take advantage of this measure. Although some action or combination of actions to increase lower-carbon generation or reduce electricity demand somewhere in the interconnected electricity system of which the affected EGU is a part will be required to enable electricity supply and demand to remain in balance, the affected EGU does not need to monitor or track those actions in order to use its reduction in generation to help achieve compliance with the mass-based standard. Instead, multiple participants in the interconnected electricity system will act to ensure that supply and demand remain in balance, subject to the complex and constantly changing set of constraints on operation of the system, just as those participants have routinely done for years.
Of course, if the owner/operator of the affected EGU wishes to play a direct role in driving the increase in lower-carbon generation or demand-side EE required to offset a reduction in the affected EGU's generation, the owner/operator may do so as part of whatever role it happens to play as a participant in the interconnected electricity system. However, the owner/operator will achieve the benefit that reduction in generation brings toward compliance with the mass-based standard whether it takes those additional actions itself or instead allows other participants in the interconnected electricity system to play that role.
(3)
Emissions trading approaches.
To the extent allowed under the relevant section 111(d) plans—as the record indicates that it is reasonable to expect it will be—the owner/operator of an affected EGU can acquire tradable mass-based emission allowances representing investment in surplus emission reductions not needed by another affected EGU and can aggregate those allowances with any other
( printed page 64755)
allowances it already holds for purposes of demonstrating compliance with its mass-based standard of performance. The approach would have to be authorized in the appropriate section 111(d) plan and would have to conform to the minimum conditions for such approaches described in section VIII below.
Under a mass-based emissions trading approach, the total number of allowances to be issued is defined in the state plan, and affected EGUs may obtain an initial quantity of allowances through an allocation or auction process. After that initial process, the owner/operator of an affected EGU needing additional allowances can acquire allowances through common ownership of another affected EGU or through a bilateral transaction with the other affected EGU, or the owner/operator of the affected EGU can acquire allowances in a transaction through an intermediary, which could but need not involve an organized market. As discussed earlier, based on observation of market behavior both inside and outside the electricity industry, we expect that intermediaries will seek opportunities to participate in such transactions and that organized markets are likely to develop as well if section 111(d) plans authorize the use of emissions trading. While the opportunity to acquire allowances through common ownership might not extend to owner/operators of single EGUs or small fleets, all owner/operators would have the ability to engage in bilateral or intermediated purchase transactions for allowances just as they can engage in transactions for other kinds of goods and services.
Further details regarding the possible use of mass-based emission allowances in a state plan are provided in section VIII.J.
6. Use of Non-BSER Measures To Achieve Standards of Performance
In addition to the BSER-related measures that affected EGUs can use to achieve the standards of performance set in section 111(d) plans, there are a variety of non-BSER measures that could also be employed (to the extent permitted under a given plan). This final rule does not limit the measures that affected EGUs may use for achieving standards of performance to measures that are included in the BSER; thus, the existence of these non-BSER measures provides flexibility allowing the individual affected EGUs and the source category to achieve emission reductions consistent with application of the BSER at the levels of stringency reflected in this final rule even if one or more of the building blocks is not implemented to the degree that the EPA has determined to be reasonable for purposes of quantifying the BSER. In this way, non-BSER measures provide additional flexibility to states in establishing standards of performance for affected EGUs through section 111(d) plans and to individual affected EGUs for achieving those standards.
Any of the non-BSER measures described below would help the affected source category as a whole achieve emission limits consistent with the BSER. The non-BSER measures either reduce the amount of CO2
emitted per MWh of generation from the set of affected EGUs or reduce the amount of generation, and therefore associated CO2
emissions, from the set of affected EGUs. However, the manner in which the various non-BSER measures would help individual affected EGUs meet their individual standards of performance varies according to the type of measure and the type of standard of performance—
i.e.,
whether the standard is emission rate-based or mass-based.
In general, a non-BSER measure that reduces the amount of CO2
emitted per MWh of generation at an affected EGU will reduce the amount of CO2
emissions monitored at the EGU's stack (assuming the quantity of generation is held constant). Measures of this type can help the EGU meet either an emission rate-based or mass-based standard of performance.
Other non-BSER measures do not reduce an affected EGU's CO2
emission rate but rather facilitate reductions in CO2
emissions by reducing the amount of generation from affected EGUs. Under a mass-based standard, the collective reduction in emissions from the set of affected EGUs is reflected in the collective monitored emissions from the set of affected EGUs. An individual EGU that reduces its generation and emissions will be able to use the measure to help achieve its mass-based limit. Individual EGUs that do not reduce their generation and emissions will be able to use the measure, if the relevant section 111(d) plans provide for allowance trading, by purchasing emission allowances no longer needed by EGUs that have reduced their emissions.
Under an emission rate-based standard, non-BSER measures that reduce generation from affected EGUs but do not reduce an affected EGU's emission rate generally can facilitate compliance by serving as the basis for ERCs that affected EGUs can average into their emission rates for purposes of demonstrating compliance. Section VIII.K. includes a discussion of the issuance of ERCs based on various non-BSER measures. Affected EGUs could use such ERCs to the extent permitted by the relevant section 111(d) plans.
The remainder of this section discusses some specific types of non-BSER measures. The first set discussed includes measures that can reduce the amount of CO2
emitted per MWh of generation, and the second set discussed includes measures that can reduce CO2
emissions by reducing the amount of generation from affected EGUs. In some cases, considerations related to use of these measures for compliance are discussed below in section VIII on state plans. The EPA notes that this is not an exhaustive list of non-BSER measures that could be employed to reduce CO2
emissions from affected EGUs, but merely a set of examples that illustrate the extent of the additional flexibility such measures provide to states and affected EGUs under the final rule.
a.
Non-BSER measures that reduce CO2emissions per MWh generated.
In the June 2014 proposal, the EPA discussed several potential measures that could reduce CO2
emissions per MWh generated at affected EGUs but that were not proposed to be part of the BSER. The measures discussed included heat rate improvements at affected EGUs other than coal-fired steam EGUs; fuel switching from coal to natural gas at affected EGUs, either completely (conversion) or partially (co-firing); and carbon capture and storage by affected EGUs. One reason for not proposing to consider these measures to be part of the BSER was that they were more costly than the BSER measures. Another reason was that the emission reduction potential was limited compared to the potential available from the measures that were proposed to be included in the BSER. However, we also noted that circumstances could exist where these measures could be sufficiently attractive to deploy, and that the measures could be used to help affected EGUs achieve emission limits consistent with the BSER.
In the final rule, the EPA has reached determinations consistent with the proposal with respect to these measures: namely, that they do not merit inclusion in the BSER, but that they are capable of helping affected EGUs achieve compliance with standards of performance and are likely to be used for that purpose by some units. To the extent that they are selectively employed, they provide flexibility for the source category as a whole and for individual affected EGUs to achieve emission limits reflective of the BSER, as discussed above.
( printed page 64756)
(1)
Heat rate improvement at affected EGUs other than coal-fired steam EGUs.
Building block 1 reflects the opportunity to improve heat rate at coal-fired steam EGUs but not at other affected EGUs. As the EPA stated at proposal, the potential CO2
reductions available from heat rate improvements at coal-fired steam EGUs are much larger than the potential CO2
reductions available from heat rate improvements at other types of EGUs, and comments offered no persuasive basis for reaching a different conclusion. Nevertheless, we recognize that there may be instances where an owner/operator finds heat rate improvement to be an attractive option at a particular non-coal-fired affected EGU, and nothing in the rule prevents the owner/operator from implementing such a measure and using it to help achieve a standard of performance.
(2)
Carbon capture and storage at affected EGUs.
Another approach for reducing CO2
emissions per MWh of generation from affected EGUs is the application of carbon capture and storage (CCS) technology. Consistent with the June 2014 proposal, we are determining that use of full or partial CCS technology should not be part of the BSER for existing EGUs because it would be more expensive than the measures determined to be part of the BSER, particularly if applied broadly to the overall source category. At the same time, we note that retrofit of CCS technology may be a viable option at some individual facilities, particularly where the captured CO2
can be used for enhanced oil recovery (EOR). For example, construction of one CCS retrofit application with EOR has already been completed at a unit at the Boundary Dam plant in Canada, and construction of another CCS retrofit application with EOR is underway at the W.A. Parish plant in Texas. We expect the costs of CCS to decline as implementation experience increases. CO2
emission rate reductions achieved through retrofit of CCS technology would be available to help affected EGUs achieve emission limits consistent with the BSER. State plan considerations related to CCS are discussed in section VIII.I.2.a.
(3)
Fuel switching to natural gas at affected EGUs.
In the proposal we discussed the opportunity to reduce CO2
emissions at an individual affected EGU by switching fuels at the EGU, particularly by switching from coal to natural gas. Most coal-fired EGUs could be modified to burn natural gas instead, and the potential CO2
emission reductions from this measure are large—approximately 40 percent in the case of conversion from 100 percent coal to 100 percent natural gas, and proportionately smaller for partial co-firing of coal with natural gas. The primary reason for not considering this measure part of the BSER, both at proposal and in this final rule, is that it is more expensive than the BSER measures. In particular, combusting natural gas in a steam EGU is less efficient and generally more costly than combusting natural gas in an NGCC unit. For the category as a whole, CO2
emissions can be achieved far more cheaply by combusting additional natural gas in currently underutilized NGCC capacity and reducing generation from coal-fired steam EGUs (building block 2) than by combusting natural gas instead of coal in steam EGUs.
Some owner/operators are already converting some affected EGUs from coal to natural gas, and it is apparent that the measure can be attractive compared to alternatives in certain circumstances, such as when a unit must meet tighter unit-specific limits on emissions of non-GHG pollutants, the options for meeting those emission limits are costly, and retirement of the unit would necessitate transmission upgrades that are costly or cannot be completed quickly. CO2
emission reductions achieved in these situations are available to help achieve emission limits consistent with the BSER.
(4)
Fuel switching to biomass at affected EGUs.
Some affected EGUs may seek to co-fire qualified biomass with fossil fuels. The EPA recognizes that the use of some biomass-derived fuels can play an important role in controlling increases of CO2
levels in the atmosphere. As with the other non-BSER measures discussed in this section, the EPA expects that use of biomass may be economically attractive for certain individual sources even though on a broader scale it would likely be more expensive or less achievable than the measures determined to be part of the BSER. Section VIII.I.2.c describes the process and considerations for states proposing to use different kinds of biomass in state plans.
(5)
Waste heat-to-energy conversion at affected EGUs.
Certain affected EGUs in urban areas or located near industrial or commercial facilities with needs for thermal energy may be able add new equipment to capture some of the waste heat from their electricity generation processes and use it to create useful thermal output, thereby engaging in combined heat and power (CHP) production. While the set of affected EGUs in locations making this measure feasible may be limited, where feasible the potential CO2
emission rate improvements can be substantial: Depending on the process used, the efficiency with which fuel is converted to useful energy can be increased by 25 percent or more. The final rule allows an owner/operator applying CHP technology to an affected EGU to account for the increased efficiency by counting the useful thermal output as additional MWh of generation, thereby lowering the unit's computed emission rate and assisting with achievement of an emission rate-based standard of performance. (The EPA notes that unless the unit also reduced its fuel usage, the addition of the capability to capture waste heat and produce useful thermal output would not reduce the unit's mass emissions and therefore would not directly help the unit achieve a mass-based standard of performance.[441]
)
b.
Non-BSER measures that reduce CO2emissions by reducing fossil fuel-fired generation.
A second group of non-BSER measures has the potential to reduce CO2
emissions from affected EGUs by reducing the amount of generation from those EGUs. As discussed above, under a section 111(d) plan with mass-based standards of performance, no special action is required to enable measures of this nature to help the source category as a whole and individual affected EGUs achieve their emission limits, because the CO2
-reducing effects are captured in monitored stack emissions. However, under a section 111(d) plan with rate-based standards of performance, affected EGUs would need to acquire ERCs based on the non-BSER activities that could be averaged into their emission rate computations for purposes of determining compliance with their standards of performance.
(1)
Demand-side EE.
One of the major approaches available for achieving CO2
emission reductions from the utility power sector is demand-side EE. In the June 2014 proposal, the EPA identified demand-side EE as one of the four proposed building blocks for the BSER. We continue to believe that significant emission reductions can be achieved by the source category through use of such measures at reasonable costs. In fact, we believe that the potential emission reductions from demand-side EE rival those from building blocks 2 and 3 in magnitude, and that demand-side EE is likely to
( printed page 64757)
represent an important component of some state plans, particularly in instances where a state prefers to develop a plan reflecting the state measures approach discussed in section VIII below. We also expect that many sources would be interested in including demand-side EE in their compliance strategies to the extent permitted, and we received comment that it should be permitted.
For the reasons discussed in section V.B.3.c.(8) below, the EPA has determined not to include demand-side EE in the BSER in this final rule. However, the final rule authorizes generation avoided through investments in demand-side EE to serve as the basis for issuance of ERCs when appropriate conditions are met. In section VIII.K below, the EPA sets out the minimum criteria that must be satisfied for generation and issuance of a valid ERC based upon implementation of new demand-side EE programs. Those criteria generally concern ensuring that the physical basis for the ERC—in this case, generation avoided through implementation of demand-side EE measures—is adequately evaluated, measured, and verified and that there is an adequate administrative process for tracking credits.
Through their authority over legal requirements such as building codes, states have the ability to drive certain types of demand-side EE measures that are beyond the reach of private-sector entities. The EPA recognizes that, by definition, this type of measure is beyond the ability of affected EGUs to invest in either directly or through bilateral arrangements. However, the final rule also authorizes generation avoided through such state policies to serve as the basis for issuance of ERCs that in turn can be used by affected EGUs. The section 111(d) plan would need to include appropriate provisions for evaluating, measuring, and verifying the avoided MWh associated with the state policies, consistent with the criteria discussed in section VIII.K below.
(2)
New or uprated nuclear generating capacity.
In the June 2014 proposal, the EPA included generation from the five nuclear units currently under construction as part of the proposed BSER. As discussed above in section V.A.3.c., upon consideration of comments, we have determined that generation from these units should not be part of the BSER. However, we continue to observe that the zero-emitting generation from these units would be expected to replace generation from affected EGUs and thereby reduce CO2
emissions, and the continued commitment of the owner/operators to completion of the units is essential in order to realize that result. Accordingly, a section 111(d) plan may rely on ERCs issued on the basis of generation from these units and other new nuclear units. For the same reason, a plan may rely on ERCs issued on the basis of generation from uprates to the capacity of existing nuclear units. Requirements for state plan provisions intended to serve this purpose are discussed in section VIII.K.
(3)
Zero-emitting RE generating technologies not reflected in the BSER.
The range of available zero-emitting RE generating technologies is broader than the range of RE technologies determined to be suitable for use in quantification of building block 3 as an element of the BSER. Examples of additional zero-emitting RE technologies not included in the BSER that could be used to achieve emission limits consistent with the BSER include offshore wind, distributed solar, and fuel cells. These technologies were not included in the range of RE technologies quantified for the BSER because they are generally more expensive than the measures that were included and the other measures in the BSER. However, these technologies are equally capable of replacing generation from affected EGUs and thereby reducing CO2
emissions. Further, as with any technology, there are likely to be certain circumstances where the costs of these technologies are more attractive relative to alternatives, making the technologies likely to be deployed to some extent. Indeed, distributed solar is already being widely deployed in much of the U.S. and offshore wind, while still unusual in this country, has been extensively deployed in some other parts of the world. We expect innovation in RE generating technologies to continue, making such technologies even more attractive over time. A section 111(d) plan may rely on ERCs issued on the basis of generation from new and uprated installations of these technologies. The necessary state plan provisions are discussed in section VIII.K.
(4)
Non-zero-emitting RE generating technologies.
Generation from new or expanded facilities that combust qualified biomass or biogenic portions of municipal solid waste (MSW) to produce electricity can also replace generation from affected EGUs and thereby control CO2
levels in the atmosphere.[442]
While the EPA believes it is reasonable to consider generation from these fuels and technologies to be forms of RE generation, the fact that they can produce stack emissions containing CO2
means that a section 111(d) plan seeking to permit use of such generation to serve as the basis for issuance of ERCs must include appropriate consideration of feedstock characteristics and climate benefits. Specifically, the use of some kinds of biomass has the potential to offer a wide range of environmental benefits, including carbon benefits. However these benefits can only be realized if biomass feedstocks are sourced responsibly and attributes of the carbon cycle related to the biomass feedstock are taken into account. Section VIII.I.2.c describes the process and considerations for states proposing to use biomass in state plans. Section VIII.K describes additional provisions related to ERCs.
(5)
Waste heat-to-electricity conversion at non-affected facilities.
Industrial facilities that install new equipment to capture waste heat from an existing combustion process and then use the waste heat to generate electricity—a form of combined heat and power (CHP) production—can produce generation that replaces generation from affected EGUs and thereby reduces CO2
emissions. A section 111(d) plan may rely on ERCs issued on the basis of generation of this nature provided that the facility does not generate and sell sufficient electricity to qualify as a new EGU for purposes of section 111(b) and is not covered under section 111(d) for another source category. More information is provided in section VIII.K.
(6)
Reduction in transmission and distribution line losses.
Reductions of electricity line losses incurred from the transmission and distribution system between the points of generation and the points of consumption by end-users allow the same overall demand for electricity services to be met with a smaller overall quantity of electricity generation. Such reductions in generation quantities would tend to reduce generation by affected EGUs, thereby reducing CO2
emissions. The opportunity for improvement is large because, on average, line losses account for approximately seven percent of all electricity generation. The EPA recognizes that, in general, only the
( printed page 64758)
owner/operators of the transmission and distribution facilities have the ability to undertake line loss reduction investments, and that merchant generators may have little opportunity to engage a contractor to pursue such opportunities on a bilateral basis. Nevertheless, for entities that do have the opportunity to make such investments, generation avoided through investment that reduces transmission and distribution line losses may serve as the basis for issuance of ERCs that in turn can be used by affected EGUs. Further information is provided in section VIII.K.
7. Severability
The EPA intends that the components of the BSER summarized above be severable. It is reasonable to consider the building blocks severable because the building blocks do not depend on one another. Building blocks 2 and 3 are feasible and demonstrated means of reducing CO2
emissions from the utility power sector that can be implemented independently of the other building blocks. If implemented in combination with at least one of the other building blocks, building block 1 is also a feasible and demonstrated means of reducing CO2
emission from the utility power sector.[443]
As discussed in sections V.C. through V.E. below, we have determined that each building block is independently of reasonable cost whether or not the other building blocks are applied, and that alternative combinations of the building blocks are likewise of reasonable cost, and we have determined reasonable schedules and stringencies for implementation of each building block independently, based on factors that generally do not vary depending on the implementation of other building blocks.
Further, building block 2, building block 3, and all combinations of the building blocks (implemented on the schedules and at the stringencies determined to be reasonable in this rule) would achieve meaningful degrees of emission reductions,[444]
although less than the combination of all three building blocks. No combination of the building blocks would lead to adverse non-air environmental or energy impacts or impose a risk to the reliability of electricity supplies.
In the event that a court should deem building block 2 or 3 defective, but not both, the standards and state goals can be recomputed on the basis of the remaining building blocks. All of the data and procedures necessary to determine recomputed state goals using any combination of the building blocks are set forth in the CO2
Emission Performance Rate and Goal Computation TSD for the CPP Final Rule available in the docket.
B. Legal Discussion of Certain Aspects of the BSER
This section includes a legal analysis of various aspects of EPA's determination of the BSER, including responses to some of the major adverse comments. These aspects include (1) the EPA's authority to determine the BSER; (2) the approach to subcategorization; (3) the EPA's basis for determining that building blocks 2 and 3 qualify as part of the BSER under CAA sections 111(d)(1) and (a)(1), notwithstanding commenters' arguments that these building blocks cannot be considered part of the BSER because they are not based on measures integrated into the design or operation of the affected source's own production processes or methods or because they are dependent on actions by entities other than the affected source; (4) the relationship between an affected EGU's implementation of building blocks 2 and 3 and CO2
emissions reductions; (5) how reduced generation relates to the BSER; (6) reasons why, contrary to assertions by commenters, this rule is within the EPA's statutory authority, is not inconsistent with the Federal Power Act or state laws governing public utility commissions, and does not result in what the U.S. Supreme Court described as “an enormous and transformative expansion in [the] EPA's regulatory authority”; [445]
and (7) reasons that, contrary to assertions by commenters, the stringency of the BSER for this rule for CO2
emissions from existing affected EGUs is not inconsistent with the stringency of the BSER for the rules the EPA is promulgating at the same time for CO2
emissions from new or modified affected EGUs.
1. The EPA's Authority To Determine the BSER
In this section, we explain why the EPA, and not the states, has the authority to determine the BSER and, therefore, the level of emission limitation required from the existing sources in the source category in section 111(d) rulemaking and the associated state plans.
CAA section 111(d)(1) requires the EPA to establish a section 110-like procedure under which each state submits a plan that “establishes standards of performance for any existing source of air pollutant” and “provides for the implementation and enforcement of such standards of performance.” As CAA section 111(d) was originally adopted in the 1970 CAA Amendments, however, state plans were required to establish “emission standards”—an undefined term—rather than “standards of performance,” a term that was limited to CAA section 111(b).[446]
The 1970 provision was in effect when the EPA issued the 1975 implementing regulations for CAA section 111(d),[447]
which remain in effect to this day.
These regulations establish a cooperative framework that is similar to that under CAA section 110. First, the EPA develops “emission guidelines” for source categories, which are defined as a final guideline document reflecting “the degree of emission reduction achievable through the application of the best system of emission reduction . . . which the Administrator has determined has been adequately demonstrated.” Then, the states submit implementation plans to regulate any existing sources.[448]
The preamble to these regulations carefully considered the allocation of responsibilities as between the EPA and the states for purposes of CAA section 111(d), and concluded that the EPA is responsible for determining the level of emission limitation from the source category, while the states have the responsibility of assigning emission requirements to their sources that assured their achievement of that level of emission limitation.[449]
The EPA
( printed page 64759)
explained “that some substantive criterion was intended to govern not only the Administrator's promulgation of standards but also [her] review of state plans.” [450]
The EPA added, “it would make no sense to interpret [CAA] section 111(d) as requiring the Administrator to base approval or disapproval of state plans solely on procedural criteria. Under that interpretation, states could set extremely lenient standards—even standards permitting greatly increased emissions—so long as [the] EPA's procedural requirements were met.” [451]
The EPA concluded that “emission guidelines, each of which will be subjected to public comment before final adoption, will serve [the] function” of providing substantive criteria “in advance to the states, to industry, and to the general public” to aid states in “developing and enforcing control plans under [CAA] section 111(d).” [452]
Thus, the implementing regulations make clear that the EPA is responsible for determining the level of emission limitation that the state plans must achieve.
In 1977, Congress revised CAA section 111(d) to require that the states adopt “standards of performance,” as defined under CAA section 111(a)(1). As noted above, a standard of performance is defined as “a standard for emissions of air pollutants which reflects the degree of emission limitation achievable through the application of the best system of emission reduction which . . .
the Administrator determines
has been adequately demonstrated.” (Emphasis added.) By its terms, this provision provides that the EPA has the responsibility of determining whether the “best system of emission reduction” is “adequately demonstrated.” By giving the EPA this responsibility, this provision is clear that Congress assigned the role of determining the “best system of emission reduction” to the EPA. Even if the provision may be considered to be silent or ambiguous on that question, the EPA reasonably interprets the provision to assign the responsibility of identifying the “best system of emission reduction” to the Administrator for the same reasons discussed in the preamble to the 1975 implementing regulations.
In addition, in the legislative history of the 1977 CAA Amendments, when Congress replaced the term “emission standards” under CAA section 111(d)(1) with the term “standards of performance,” Congress endorsed the overall approach of the implementing regulations, which lends further credence to the proposition that the EPA has the responsibility for determining the “best system of emission reduction” and the amount of emission limitation from the existing sources. Specifically, in the House report that introduced the substantive changes to CAA section 111, the Committee explained that “[t]he Administrator would establish
guidelines as to what the best system
for each category of existing sources
is.”[453]
States, on the other hand, “would be responsible for determining the applicability of such
guidelines
to any particular source or sources.” [454]
The use of the term “guidelines,” which does not appear in CAA section 111(d), indicates Congress was aware of and approved of the approach taken in the EPA's implementing regulations for establishing guidelines, which determine the BSER. At a minimum, if Congress disapproved of the EPA's implementing regulations, we would not expect the House report to adopt the EPA's terminology to clarify CAA section 111(d).
In addition, Congress expressly referred to our “guidelines” in CAA section 129, added as part of the 1990 CAA Amendments. Congress added CAA section 129 to address solid waste combustion and specifically directed the Administrator to establish “
guidelines
(under section 111(d) and this section) and other requirements applicable to existing units.” [455]
This reference also indicates that Congress was aware of and approved the EPA's regulations under section 111(d).
The EPA has followed the same approach described in the implementation regulations in all its rulemakings under section 111(d). Thus, in all cases, the EPA has identified the type of emission controls for the source category and the level of emission limitation based on those controls.[456]
The EPA's longstanding and consistent interpretation of CAA section 111(d) is also “evidence showing that the statute is in fact not ambiguous,” and that the EPA's interpretation should be adopted.[457]
Lastly, this interpretation is consistent with the Supreme Court's reading of CAA section 111(d) in
American Electric Power Co.
There, the Court explained that “EPA issues emissions guidelines, see 40 CFR 60.22, .23 (2009); in compliance with those guidelines and subject to federal oversight, the States then issue performance standards for stationary sources within their jurisdiction, § 7411(d)(1).” [458]
As noted in the response to comment document, some commenters agreed with our interpretation, just discussed, while others argued that the states should be given the authority to determine the best system of emission reduction and, therefore, the level of emission limitation from their sources. For the reasons just discussed, this latter interpretation is an incorrect interpretation of CAA section 111(d)(1) and (a)(1), and we are not compelled to abandon our longstanding practice.
2. Approach to Subcategorization
As noted above, in this rule, we are treating all fossil fuel-fired EGUs as a single category, and, in the emission
( printed page 64760)
guidelines that we are promulgating with this rule, we are treating steam EGUs and combustion turbines as separate subcategories. We are determining the BSER for steam EGUs and the BSER for combustion turbines, and applying the BSER to each subcategory to determine a performance rate for that subcategory. We are not further subcategorizing among different types of steam EGUs or combustion turbines.
This approach is fully consistent with the provisions of section 111(d), which simply require the EPA to determine the BSER, do not prescribe the method for doing so, and are silent as to subcategorization. This approach is also fully consistent with other provisions in CAA section 111, which require the EPA first to list source categories that may reasonably be expected to endanger public health or welfare [459]
and then to regulate new sources within each such source category,[460]
and which grant the EPA discretion whether to subcategorize new sources for purposes of determining the BSER.[461]
For this rule, our approach of subcategorizing between steam EGUs and combustion turbines is reasonable because building blocks 1 and 2 apply only to steam EGUs. No further subcategorization is appropriate because each affected EGU can achieve the performance rate by implementing the BSER. Specifically, as noted, each affected EGU may take a range of actions including investment in the building blocks, replacing or reducing generation, and emissions trading, as enabled or facilitated by the implementation programs the states adopt. Further, in the case of a rate-based state plan, several other compliance options not included in the BSER for this rule are also available to all affected sources, including investment in demand-side EE measures. Such compliance options help affected sources achieve compliance under a mass-based plan, even if indirectly. Our approach to subcategorization in this rule is consistent with our approach to subcategorization in previous section 111 rules for this industry, in which we determined whether or not to subcategorize on the basis of the ability of affected EGUs with different characteristics (
e.g.,
size or type of fuel used) to implement the BSER and achieve the emission limits).[462]
In addition, there are numerous possible criteria to use in subcategorizing, including, among others, subcategorizing on the basis of age; size; steam conditions (
i.e.,
subcritical or supercritical); type of fuel, including type of coal (
i.e.,
lignite, bituminous, and sub-bituminous), and coal refuse; and method of combustion (
i.e.,
fluidized bed combustion, pulverized coal combustion, and gasification). In addition, there are different possible combinations of those categories. At least some of those criteria do not have logical cut-points. Furthermore, we have not been presented with, nor can we discern, a method of subcategorizing based on these or other criteria that is appropriate in light of the BSER for the affected EGUs and their ability to meet the emission limits. Moreover, our approach of not further subcategorizing as between different types of steam EGUs or combustion turbines reflects the reasonable policy that affected EGUs with higher emission rates should reduce their emissions by a greater percentage than affected EGUs with lower emission rates, and can do so by implementing the BSER we are identifying.
In addition, a section 111(d) rule presents less of a need to subcategorize because the states retain great flexibility in assigning standards of performance to their affected EGUs. Thus, a state can, if it wishes, impose different emission reduction obligations on its sources, as long as the overall level of emission limitation is at least as stringent as the emission guidelines, as discussed below. This means that if a state is concerned that its different sources have different capabilities for compliance, it can adjust the standards of performance in imposes on its sources accordingly.
3. Building Blocks 2 and 3 as a “System of Emission Reduction”
a.
Overview.
As we explain above, the emission performance rates that we include in this rule's emission guidelines are achievable by the affected EGUs through the application of the BSER, which includes the three building blocks. Commenters object that building blocks 2 (generation shift) and 3 (RE) cannot, as a legal matter, be considered part of the BSER under CAA section 111(d)(1) and (a)(1). These commenters explain that in their view, under CAA section 111, the emission performance rates must be based on, and therefore the BSER must be limited to, methods for emission control that the owner/operator of the affected source can integrate into the design or operation of the source itself, and cannot be based on actions taken beyond the source or actions involving third-party entities.[463]
For these reasons, these commenters argue that the phrase “system of emission reduction” cannot be
( printed page 64761)
interpreted to include building blocks 2 and 3.
We disagree with these comments, and note that other commenters were supportive of our determination to include building blocks 2 and 3. Under CAA section 111(d)(1) and (a)(1), the EPA's emission guidelines must establish achievable emission limits based on the “best system of emission reduction . . . adequately demonstrated.” While some commenters assert that emission guidelines must be limited in the manner summarized above, the phrase “system of emission reduction,” by its terms and when read in context, contains no such limits. To the contrary, its plain meaning is deliberately broad and is capacious enough to include actions taken by the owner/operator of a stationary source designed to reduce emissions from that affected source, including actions that may occur off-site and actions that a third party takes pursuant to a commercial relationship with the owner/operator, so long as those actions enable the affected source to achieve its emission limitation. Such actions include the measures in building blocks 2 and 3, which, when implemented by an affected source, enable the source to achieve their emission limits because of the unique characteristics of the utility power sector. For purposes of this rule, we consider a “system of emission reduction”—as defined under CAA section 111(a)(1) and applied under CAA section 111(d)(1)—to encompass a broad range of pollution-reduction actions, which includes the measures in building blocks 2 and 3. Furthermore, the measures in building blocks 2 and 3 fall squarely within EPA's historical interpretation of section 111, pursuant to which the focus for the BSER has been on how to most cleanly produce a good, not on how much of the good should be produced.
Our interpretation that a “system of emission reduction” is broad enough to include the measures in building blocks 2 and 3 is supported by the following: Our interpretation of the phrase “system of emission reduction” is consistent with its plain meaning and statutory context; our interpretation accommodates the very design of CAA section 111(d)(1), which covers a range of source categories and air pollutants; [464]
our interpretation is supported by the legislative history of CAA section 111(d)(1) and (a)(1), which indicates Congress's intent to give the EPA broad discretion in determining the basis for CAA section 111 control requirements, particularly for existing sources, and Congress's intent to authorize the EPA to consider measures that could be carried out by parties other than the affected sources; and our interpretation is reasonable in light of comparisons to CAA provisions that give the EPA similar authority to consider such measures and to CAA provisions that would preclude the EPA from considering such measures.
In addition to the reasons stated above, the EPA's interpretation is also reasonable for the following reasons: (i) Building blocks 2 and 3 fit well within the structure and economics of the utility power sector. (ii) Fossil fuel-fired EGUs are already implementing the measures in these building blocks for various reasons, including for purposes of reducing CO2
emissions. (iii) Interpreting the phrase “system of emission reduction” to incorporate building blocks 2 and 3 is consistent with (a) other provisions in the CAA, including the acid rain provisions in Title IV and the SIP provisions in CAA section 110, along with the EPA's regulations implementing the CAA SIP requirements concerning interstate transport and regional haze, each of which is based on at least some of the same measures included in building blocks 2 and 3; (b) prior EPA action under CAA section 111(d), including the 2005 Clean Air Mercury Rule,[465]
which is based on some of the same measures in building blocks 2 and 3; (c) the various provisions of the CAA that authorize emissions trading, because emissions trading entails a source meeting its emission limitation based on the actions of another entity; and (d) the pollution prevention provisions of the CAA, which make clear that a primary goal of the CAA is to encourage federal and state actions that reduce or eliminate, through any measures, the amount of pollution produced at the source.[466]
(iv) Lastly, interpreting the phrase “system of emission reduction” to authorize the EPA, in formulating its BSER determination, to weigh a broad range of emission-reducing measures that includes building blocks 2 and 3 is consistent with Congress's intent to address urgent environmental problems and to protect public health and welfare against risks, as well as Congress's expectation that American industry would be able to develop the innovative solutions necessary to protect public health and welfare.
Congress passed the CAA, including its several amendments, to protect public health and welfare from “mounting dangers,” including “injury to agricultural crops and livestock, damage to and the deterioration of property, and hazards to air and ground transportation.” [467]
In doing so, Congress established numerous programs to address air pollution problems and provided the EPA with guidance and flexibility in carrying out many of those programs. Even if we were to accept commenters' view that the system of emission reduction identified as best here is not integrated into the design or operation of the regulated sources, in the context of this industry and this pollutant it is reasonable to reject the narrow interpretation urged by some commenters that the “system of emission reduction” applicable to the affected EGUs must be limited to only those measures that can be integrated into the design or operation of the source itself. The plain language of the statute does not support such an interpretation, and to adopt it would limit the “system of emission reduction” to measures that are either substantially more expensive or substantially less effective at reducing emissions than the measures in building blocks 2 and 3, notwithstanding the absence of any statutory language imposing such a limit. Such a result would be contrary to the goals of the CAA and would ignore the facts that sources in the electric generation industry routinely address planning and operating objectives on a broad, multi-source basis using the measures in building blocks 2 and 3 and would seek to use building blocks 2 and 3 (as well as non-BSER measures) to comply with whatever emission standards are set as a result of this rule. Indeed, as already observed, building blocks 2 and 3 are already being used to reduce emissions, and to do so specifically by operation of the industry's inherent multi-source functions.
Although the BSER provisions are sufficiently broad to include, for affected EGUs, the measures in building blocks 2 and 3, they also incorporate significant constraints on the types of
( printed page 64762)
measures that may be included in the BSER. We discuss those constraints at the end of this section. They include the section 111(d)(1) and (a)(1) requirements that emission reductions occur from the affected sources; that the emission performance standards for which the BSER forms the basis be achievable; that the system of emission reduction be adequately demonstrated; and that the EPA account for cost, non-air quality impacts, and energy requirements in determining the “best” system of emission reduction that is adequately demonstrated. The constraints included in these statutory requirements do not preclude building blocks 2 and 3 from the BSER. In interpreting these statutory requirements for determining the BSER, the EPA is consistent with past practice and current policy for both section 111 regulatory actions as well as regulatory actions under other CAA provisions for the electric power sector, under which the EPA has generally taken the approach of basing regulatory requirements on controls and measures designed to reduce air pollutants from the production process without limiting the aggregate amount of production. This approach has been inherent in our past interpretation and application of section 111 and we maintain this interpretation in this rulemaking.[468]
While inclusion of building blocks 2 and 3 is consistent with our interpretation of the statutory requirements, inclusion of building block 4 is not, and for that reason, we are declining to include building block in the BSER. Finally, we briefly note additional constraints that focus the BSER identified for new sources under section 111(b) on controls that assure that sources are well-controlled at the time of construction.
b.
System of emission reduction as a broad range of measures.
(1)
Plain meaning and context of “system of emission reduction.”
The phrase “system of emission reduction” appears in the definition of a “standard of performance” under CAA section 111(a)(1). That definition reads:
a standard for emissions of air pollutants which reflects the degree of emission limitation achievable through the application of the best system of emission reduction which (taking into account the cost of achieving such reduction and any nonair quality health and environmental impact and energy requirements) the Administrator determines has been adequately demonstrated.
Pursuant to this definition, it is clear that a “system of emission reduction” serves as the basis for emission limits embodied by CAA section 111 standards. For this reason, emission limits must be “achievable” through the “application” of the “best” “system of emission reduction” “adequately demonstrated.” Under CAA section 111(d)(1), such a limit is established for “any existing source,” which is defined as any existing “building, structure, facility, or installation which emits or may emit any air pollutant.” [469]
Although a “system of emission reduction” lays the groundwork for CAA section 111 standards, the term “system” is not defined in the CAA. As a result, we look first to its ordinary meaning.
Abstractly, the term “system” means a set of things or parts forming a complex whole; a set of principles or procedures according to which something is done; an organized scheme or method; and a group of interacting, interrelated, or interdependent elements.[470]
As a phrase, “system of emission reduction” takes a broad meaning to serve a singular purpose: It is a set of measures that work together to reduce emissions.
When read in context, the phrase “system of emission reduction” carries important limitations: because the “degree of emission limitation” must be “
achievable
through the
application
of the best system of emission reduction,” (emphasis added), the “system of emission reduction” must be limited to a set of measures that work together to reduce emissions and that are implementable by the sources themselves.
As a practical matter, the “source” includes the “owner or operator” of any building, structure, facility, or installation for which a standard of performance is applicable. For instance, under CAA section 111(e), it is the “owner or operator” of a source who is prohibited from operating “in violation of any standard of performance applicable to such source.” [471]
Thus, a “system of emission reduction” for purposes of CAA section 111(d) means a set of measures that source owners or operators can implement to achieve an emission limitation applicable to their existing source.[472]
In contrast, a “system of emission reduction” does not include actions that only a state or other governmental entity could take that would have the effect of reducing emissions from the source category, and that are beyond the ability of the affected sources' owners/operators to take or control. Additionally, actions that a source owner or operator could take that would not have the effect of reducing emissions from the source category, such as purchasing offsets, would also not qualify as a “system of emission reduction.”
Building blocks 2 and 3 each fall within the meaning of a “system of emission reduction” because they consist of measures that the owners/operators of the affected EGUs can implement to achieve their emission limits. In doing so, the affected EGUs will achieve the overall emission reductions the EPA identifies in this rule. We describe these building block 2 and 3 measures in detail elsewhere in this rule, including the specific actions that owners/operators of affected EGUs can take to implement the measures.
It should be noted that defining the scope of a “system of emission reduction” is not the end of our inquiry under CAA section 111(a)(1); rather, as noted above, a standard of performance must reflect the application of the “
best
system of emission reduction . . .
adequately demonstrated.”
(Emphasis
( printed page 64763)
added.) Thus, in determining the BSER, the Administrator must first determine whether the available systems of emission reduction are “adequately demonstrated,” based on the criteria, described above, set out by Congress in the legislative history and the D.C. Circuit in case law. After identifying the “adequately demonstrated” systems of emission reduction, the Administrator then selects the “best” of these, based on several factors, including amount of emission reduction, cost, non-air quality health and environmental impact and energy requirements. Only after the Administrator weighs all of these considerations can she determine the BSER and, based on that, establish a standard of performance under CAA section 111(b) or an emission guideline under CAA section 111(d).
For purposes of this final rule, it is not necessary to enumerate all of the types of measures that do or do not constitute a “system of emission reduction.” What is relevant is that building blocks 2 and 3 each qualify as part of the “system of emission reduction.” As noted, they focus on supply-side activities and they each constitute measures that the affected EGUs can implement that will allow those EGUs to achieve the degree of emission limitation that the EPA has identified based on those building blocks. Further, these building blocks also satisfy the other statutory criteria enumerated in CAA section 111(a)(1).
(2)
Other indications that the BSER provisions encompass a broad range of measures.
The EPA's plain meaning interpretation that the BSER provisions in CAA section 111(d)(1) and (a)(1) are designed to include a broad range of measures, including building blocks 2 and 3, is supported by several other indications in the CAA and the legislative history of section 111.
(a)
Scope of CAA section 111(d)(1).
First, the broad scope of CAA section 111(d)(1) supports our interpretation of the BSER because a wide range of control measures is appropriate for the wide range of source categories and air pollutants covered under CAA section 111(d).
In the 1970 CAA Amendments, Congress established a regulatory regime for existing stationary sources of air pollutants that may be envisioned as a three-legged stool, designed to address “three categories of pollutants emitted from stationary sources”: (1) Criteria pollutants (identified under CAA section 109 and regulated under section 110); (2) hazardous air pollutants (identified and regulated under section 112); and (3) “pollutants that are (or may be) harmful to public health or welfare but are not” criteria or hazardous air pollutants.[473]
Congress enacted CAA section 111(d) to cover this third category of air pollutants and, in this sense, Congress designed it to apply to any air pollutants that were not otherwise regulated as toxics or NAAQS pollutants.[474]
This would include air pollutants that the EPA might later, when more information became available, designate as NAAQS or hazardous air pollutants, as well as air pollutants that Congress may not have been aware of at the time.[475]
In addition, the indications are that Congress expected CAA section 111(d) to be a significant source of regulatory activity, by some measures, more active than CAA section 112. This is evident because Congress expected that CAA section 111(d) would cover more air pollutants than either CAA section 109/110 (criteria pollutants) or CAA section 112 (hazardous air pollutants).[476]
In addition, in the 1990 CAA Amendments, Congress enacted CAA section 129 to achieve emission reductions from a major source category, solid waste incinerators, and established CAA section 111(d) as the basic mechanism for that provision. The EPA subsequently promulgated a number of CAA section 129/111(d) rulemakings.[477]
Finally, it should be noted that Congress designed CAA section 111(d) to cover a wide range of source categories—including any source category that the EPA identifies under subsection 111(b)(1)(A) as meeting the criteria of, in general, causing or contributing significantly to air pollution that may reasonably be anticipated to endanger public health or welfare—along with the wide range of air pollutants.
Because Congress designed CAA section 111(d) to cover a wide range of air pollutants—including ones that Congress may not have been aware of at the time it enacted the provision—and a wide range of industries, it is logical that Congress intended that the BSER provision, as applied to CAA section 111(d), have a broad scope so as to accommodate the range of air pollutants and source categories.
(b)
Legislative history of CAA section 111.
(i)
Breadth of “system of emission reduction.”
The phrase “system of emission reduction,” particularly as applied under CAA section 111(d), should be broadly interpreted consistent with its plain meaning but also in light of its legislative history. The version of CAA section 111(d)(1) that Congress adopted as part of the 1970 CAA Amendments read largely as CAA section 111(d)(1) does at present, except that it required states to impose “emission standards” on any existing source. (Congress replaced that term with “standards of performance” in the 1977 CAA Amendments.) The 1970 CAA Amendments version of CAA section 111(d)(1) neither defined “emission standards” nor imposed restrictions on the EPA in determining the basis for the emission standards.[478]
For new sources, CAA section 111(b)(1)(B), as enacted in the 1970 CAA Amendments (and as it largely still
( printed page 64764)
reads), required the EPA to promulgate “standards of performance,” and defined that term, much like the present definition, as emission standards based on the “best system of emission reduction . . . adequately demonstrated.” This quoted phrase was not included in either the House or Senate versions of the provision, and, instead, was added during the joint conference between the House and Senate. The conference report accompanying the text offers no clarifications.
The House and Senate bills do, however, provide some insights. The House bill, H.R. 17255, would have required new sources of non-hazardous air pollutants to “prevent and control such emissions to the fullest extent compatible with the available technology and economic feasibility, as determined by the Secretary.” [479]
The Senate bill, S. 4358, would have established “Federal standards of performance for new sources,” which, in turn, were to “reflect the greatest degree of emission control which the Secretary determines to be achievable through application of the latest available control technology, processes, operating methods,
or other alternatives.”[480]
The Senate Committee Report explains that “performance standards should be met through application of the latest available emission control technology or through
other means of preventing or controlling air pollution.”[481]
This Report further elaborates that the term “standards of performance”
refers to the degree of emission control which can be achieved through process changes, operation changes, direct emission control,
or other methods.
The Secretary should not make a technical judgment as to how the standard should be implemented. He should determine the achievable limits and let the owner or operator determine the most economic, acceptable
technique
to apply.[482]
Thus, the Senate bill clearly envisioned that standards of performance would not be based on a particular technology or even a particular method to prevent or control air pollution.[483]
This vision contrasted with the House bill, which would have restricted performance standards to economically feasible technical controls.
Following the House-Senate Conference, the enacted version of the legislation defined a “standard of performance” to mean
a standard for emissions of air pollutants which reflects the degree of emission limitation achievable through the application of the
best system of emission reduction
which (taking into account the cost of achieving such reduction) the Administrator determines has been adequately demonstrated.[484]
While the phrase “system of emission reduction” was not discussed in the Conference Report, an exhibit titled “Summary of the Provisions of Conference Agreement on the Clean Air Amendments of 1970” was added to the record during the Senate's consideration of the Conference Report and sheds some light on the phrase. According to the summary, “[t]he agreement authorizes regulations to require that new major industry plants such as power plants, steel mills, and cement plants achieve a standard of emission performance based on the latest available control technology, processes, operating methods, and other alternatives.” [485]
In light of this summary, the phrase “system of emission reduction” appears to blend the broad spirit of S. 4358 (which required the “latest available control technology, processes, operating methods, or other alternatives”) with the cost concerns identified in H.R. 17255 (which required consideration of “economic feasibility” when establishing federal emission standards for new stationary sources). This history strongly suggests that Congress intended to authorize the EPA to consider a wide range of measures in calculating a standard of performance for stationary sources. At a minimum, there is no indication that Congress intended to preclude measures or actions such as the ones in building blocks 2 and 3 from the EPA's assessment of the BSER.
Notwithstanding this broad approach, as we discuss in the Legal Memorandum, the legislative history of the 1970 CAA Amendments also indicates that Congress intended that new sources be well-controlled at the source, in light of their expected lengthy useful lives.
In 1977, Congress amended CAA section 111(a)(1) to limit the types of controls that could be the basis of standards of performance for new sources to technological controls. Congress was clear, however, that existing source standards, which were no longer developed as “emission standards,” would not be limited to technological measures. Specifically, the 1977 CAA Amendments revised CAA section 111(a)(1) to require all new sources to meet emission standards based on the reductions achievable through the use of the “best technological system of continuous emission reduction.” [486]
According to the legislative history, [t]his mean[t] that new sources may not comply merely by burning untreated fuel, either oil or coal.” [487]
The new requirement stemmed in part from Congress's concern over the shocks that the country experienced during the 1973-74 Arab Oil Embargo, which led Congress to revise CAA section 111 to “encourage and facilitate the increased use of coal, and to reduce reliance (by new and old sources alike), upon petroleum to meet emission requirements.” [488]
Imposing a new technological requirement (along with a new percentage reduction requirement) under CAA section 111 was designed to “force new sources to burn high-sulfur fuel thus freeing low-sulfur fuel for use in existing sources where it is harder to control emissions and where low-sulfur fuel is needed for compliance.” [489]
Congress nonetheless recognized that despite narrowing new source standards to the best “technological system of continuous emission reduction,” many “innovative approaches may in fact reduce the economic and energy impact of emissions control,” and the Administrator should still be encouraged to consider other technologically based techniques for emissions reduction, including “precombustion cleaning or treatment of fuels.” [490]
This is discussed in more detail below.
Despite these changes with respect to new sources, the 1977 CAA Amendments further reinforce the
( printed page 64765)
notion that with respect to existing sources, the BSER was never intended to be narrowly applied. In 1977, Congress changed CAA section 111(d)(1) to require that states adopt “standards of performance” and made clear that such standards were to be based on the “best system of continuous emission reduction . . . adequately demonstrated,” [491]
but generally maintained the breadth of that term. Although Congress inserted the word “continuous” into the phrase, Congress explained that “standards in the Section 111(d) state plan would be based on the
best available means (not necessarily technological)
for categories of existing sources to reduce emissions.” [492]
This was intended to distinguish existing source standards from new source standards, for which “the requirement for [BSER] has been more narrowly redefined as best technological system of continuous emission reduction.” [493 494]
In the 1990 CAA Amendments, Congress restored the 1970s vintage definition of a standard of performance as applied to both new and existing sources. With respect to existing sources, this had the effect of no longer requiring that the BSER be “continuous.” [495]
Further, nothing in the 1990 CAA Amendments or their legislative history indicates that Congress intended to impose new constraints on the types of systems of emission reduction that could be considered under CAA section 111(d)(1) and (a)(1). In contrast, Congress retained the definition of the term “technological system of continuous emission reduction,” which means “a technological process for production or operation by any source which is inherently low-polluting or nonpolluting,” CAA section 111(a)(7)(A), or “a technological system for continuous reduction of the pollution generated by a source before such pollution is emitted into the ambient air, including precombustion cleaning or treatment of fuels,” CAA section 111(a)(7)(B).
That term continues to be used in reference to new sources in certain circumstances, under CAA section 111(b), (h), and (j).[496]
However, it is not and never has been used to regulate existing sources. In this manner, the 1990 CAA Amendments further reinforce the breadth and flexibility of the phrase “system of emission reduction,” particularly as it applies to existing sources under CAA section 111(d).
For these reasons, the 1970, 1977, and 1990 legislative histories support the EPA's interpretation in this rule that the term is sufficiently broad to encompass building blocks 2 and 3.
(ii)
Reliance on actions taken by other entities.
The legislative history supports the EPA's interpretation of “system of emission reduction” in another way as well: The legislative history makes clear that Congress intended that standards of performance for electric power plants could be based on measures implemented by other entities, for example, entities that “wash,” or desulfurize, coal (or, for oil-fired EGUs, that desulfurize oil). This legislative history is consistent with the EPA's view that the “system of emission reduction” may include actions taken by an entity with whom the owner/operator of the affected source enters into a contractual relationship as long as those actions allow the affected source to meet its emission limitation. By the same token, this legislative history directly refutes commenters' assertions that the phrase “system of emission reduction” must not include actions taken by entities other than the affected sources.[497]
As noted above, in the 1977 CAA Amendments, Congress revised the basis for standards of performance for new fossil fuel-fired stationary sources to be a “technological system of continuous emission reduction,” including “precombustion cleaning or treatment of fuels.” [498]
Precombustion cleaning or treatment reduces the amount of sulfur in the fuel, which means that the fuel can be combusted with fewer SO2
emissions, and that in turn means that the source can achieve a lower emission limit. Congress understood that these fuel cleaning techniques would not necessarily be accomplished at the affected source and, in revising CAA section 111(a)(1), wanted to ensure that such techniques would not be overlooked. For example, the 1977 House Committee report indicates that an assessment of the best technological system of continuous emission reduction for fossil fuel-fired power plants would include off-site or third-party pre-combustion techniques for reducing emissions at the source (“
e.g.,
various coal-cleaning technologies such as solvent refining, oil desulfurization
at the refinery
”).
499
( printed page 64766)
Thus, the standard of performance reflecting the best technological system implementable by an affected source could be based, in part, on technologies used at off-site facilities owned and operated by third-parties.
In the 1990 CAA Amendments, Congress eliminated many of the restrictions and other provisions added in the 1977 CAA Amendments by largely reinstating the 1970 CAA Amendments' definition of “standard of performance.” Nevertheless, there is no indication that in doing so, Congress intended to preclude the EPA from considering coal cleaning by third parties (which had been considered within the scope of the best system of emission reduction even under the 1970 CAA Amendments),[500]
and in fact, the EPA's regulations promulgated after the 1990 CAA Amendments continue to impose standards of performance that are based on third-party coal cleaning.[501]
(c)
Consistency of a broad interpretation of CAA section 111 with the overall structure of the CAA.
Interpreting CAA section 111(d)(1) and (a)(1) to authorize the EPA's consideration of the building block 2 and 3 measures is consistent with the overall structure of the CAA, particularly as it was amended in 1970, when Congress added CAA section 111 in much the same form that it reads today.
In the 1970 CAA Amendments, for the most part, and particularly for stationary source provisions, Congress painted with broad brush strokes, giving broad authority to the EPA or the states. That is, Congress established general requirements that were intended to produce stringent results, but gave the EPA or the states great discretion in fashioning the types of measures to achieve those results.
For example, under CAA section 109, Congress authorized the EPA to promulgate national ambient air quality standards (NAAQS) for air pollutants, and Congress established general criteria and procedural requirements, but left to the EPA discretion to identify the air pollutants and select the standards. Under CAA section 110, Congress required the states to submit to the EPA SIPs, required that the plans attain the NAAQS by a date certain, and established procedural requirements, but allowed the states broad discretion in determining the substantive requirements of the SIPs.
Under CAA section 111(b), Congress directed the EPA to list source categories that endanger public health or welfare and established procedural requirements, but did not include other substantive requirements, and instead gave the EPA broad discretion to determine the criteria for endangerment.
Under CAA section 112, Congress required the EPA to regulate certain air pollutants and to set “emission standards” that meet general criteria, and established procedural requirements, but did not include other substantive requirements and, instead, gave the EPA broad discretion in identifying the types of pollutants and in determining the standards.[502]
By and large, Congress left these provisions intact in the 1977 CAA Amendments.[503 504]
Congress drafted the CAA section 111(d) requirements in the 1970 CAA Amendments, and revised them in the 1977 CAA Amendments, in a manner that is similar to the other stationary source requirements, just described, in CAA sections 109, 110, 111(b), and 112. The CAA section 111(d) requirements are broadly phrased, include procedural requirements but no more than very general substantive requirements, and give broad discretion to the EPA to determine the basis for the required emission limits and to the states to set the standards. It should be noted that this drafting approach is not unique to the CAA; on the contrary, Congress “usually does not legislate by specifying examples, but by identifying broad and general principles that must be applied to particular factual instances.” [505]
In light of this statutory framework, it is clear that Congress delegated to the EPA the authority to administer CAA section 111, including by authorizing the EPA to apply the “broad and general principles” contained in CAA section 111(a)(1) to the particular circumstances we face today.
(3)
Comments and responses.
While some commenters support the EPA's interpretation of section 111 to authorize the inclusion of building blocks 2 and 3 in the BSER, other commenters assert that the emission standards must be based on measures that the sources subject to CAA section 111—in this rule, the affected EGUs—apply to their own design or operations, and, as a result, in this rule, cannot include measures implemented at entities other than the affected EGUs that have the effect of reducing generation, and therefore emissions, from the affected EGUs. The commenters assert that various provisions in CAA section 111 make this limitation clear. We do not find those arguments persuasive.
First, some commenters state that under CAA section 111(d)(1) and (a)(1), the existing sources subject to the standards of performance must be able to achieve their emission limit, but that they are able to do so only through measures integrated into the source's own design and operation. As a result, according to these commenters, those are the only types of measures that may qualify as a “system of emission reduction” that may form the basis of the emissions standards. We disagree. We see nothing in CAA section 111(d)(1) or (a)(1) which by its terms limits CAA section 111 to measures that must be integrated into the sources' own design or operation. Rather, we recognize that in order for an emission limitation based on the BSER to be “achievable,” the BSER must consist of measures that can be undertaken by an affected source—that is, its owner or operator. As noted elsewhere in the
( printed page 64767)
preamble, the affected sources subject to this rule are fully able to meet their emission standards by undertaking the measures described in all three building blocks. Moreover, as discussed, the measures in building blocks 2 and 3 are highly effective in achieving CO2
emission reductions from these affected EGUs, given the unique characteristics of the industry. This reinforces the conclusion that the term “system of emission reduction” is broad enough to include these measures.
The broad nature of CAA section 111(d)(1) and (a)(1) is also confirmed by comparing it to CAA provisions that explicitly require controls on the design or operations of an affected source. The most notable comparison is at CAA section 111(a)(7). The term “technological system of continuous emission reduction,” which was added in 1977 and remains as a separately defined term means, in part, “a technological process
for production or operation
by any source
which is inherently
low-emitting or nonpolluting.” (Emphasis added.) With respect to this portion of the definition (and ignoring the additional text, which includes “precombustion cleaning or treatment of fuels” and clearly encompasses off-site activities), it could be argued that between 1977 and 1990 new source performance standards should be restricted to measures that could be integrated into the design or operation of a source. However, commenters' assertion that the BSER must be limited in a similar fashion ignores the deliberate change in 1990 to restore the broader definition of a standard of performance (
i.e.,
that it be based on the BSER and not the TSCER). In any case, the narrower scope of CAA section 111(a)(7) was never applicable to the regulation of existing sources under CAA section 111(d).
Several other examples of standard setting in the CAA shed light on ways in which Congress has constrained the EPA's review. CAA section 407(b)(2) provides that the EPA base NOX
emission limits for certain types of boilers “on the degree of reduction achievable through the
retrofit
application of the best system of continuous emission reduction.” (Emphasis added.) Likewise, in determining best available retrofit technology under CAA section 169A, the state (or Administrator) must “take into consideration the costs of compliance, the energy and nonair quality environmental impacts, any existing pollution control technology
in use at the source,
the remaining useful life of the source, and the degree of improvement in visibility which may reasonably be anticipated to result
from the use of such technology.
” [506]
(Emphasis added.) These provisions make clear that Congress knew how to constrain the basis for emission limits to measures that are integrated into the design or operation of the affected source, and that its choice to base CAA section 111(d)(1) and (a)(1) standards of performance on a “system of emission reduction” indicates Congress' intent to authorize a broader basis for those standards.
Some commenters also argue that other provisions in CAA section 111 indicate that Congress intended that CAA section 111(d)(1) and (a)(1) be limited to measures that are integrated into the source's design or operations. This argument is unpersuasive for several reasons. First, it would be unreasonable to presume that Congress intended to limit the BSER, indirectly through these other provisions, to measures that are integrated into the affected source's design or operations, when Congress could have done so expressly, as it did for the above-discussed CAA section 407(b)(2) NOX
requirements.
Second, the interpretations that commenters offer for these various provisions misapply the text. For example, commenters note that under CAA section 111(d)(1), (a)(3), and (a)(6), the standards of performance apply to “any existing source,” and an “existing source” is defined to include “any stationary source,” which, in turn, is defined as “any building, structure, facility, or installation which emits or may emit any air pollutant.” Commenters assert that these applicability and definitional provisions indicate that the BSER provisions in CAA section 111(d)(1) and (a)(1) must be interpreted to require that the control measures must be integrated into the design or operations of the source itself.
We disagree. These applicability and definitional provisions are jurisdictional in nature. Their purpose is simply to identify the types of sources whose emissions are to be addressed under CAA section 111(d),
i.e.,
stationary sources, as opposed to other types of sources,
e.g.,
mobile sources, whose emissions are addressed under other CAA provisions (such as CAA Title II). This purpose is made apparent by the terms of CAA section 111(a)(3), which contains two sentences (the second of which commenters seem to ignore). The first sentence provides: “The term `stationary source' means any building, structure, facility, or installation which emits or may emit any air pollutant.” The second sentence provides: “Nothing in subchapter II of this chapter relating to nonroad engines shall be construed to apply to stationary internal combustion engines.” This second sentence explains that stationary internal combustion engines are to be regulated under CAA section 111, and not Title II (relating to mobile sources), which confirms that the purpose of the definition of stationary source is jurisdictional in nature—to identify the emissions that are to be regulated under section 111, as opposed to other CAA provisions.
These applicability and definitional provisions say nothing about the system of emission reduction—whether it is limited to measures integrated into the design or operation of the source itself or may be broader—that may form the basis of the standards for those emissions that are to be promulgated under CAA section 111.
Third, this argument by commenters does not account for the commonsense proposition that it is the owner/operator of the stationary source, not the source itself, who is responsible for taking actions to achieve the emission rate, so that actions that the owner/operator is able to take should be considered in determining the appropriate standards for the source's emissions. Again, it is common sense that buildings, structures, facilities, and installations can take no actions—only owners and operators can install and maintain pollution control equipment; only owners and operators can solicit precombustion cleaning or treatment of fuel services; and only owners and operators can apply for a permit or trade allowances.[507]
Other provisions in CAA section 111 make clear the role of the owner/operator. CAA section 111(e) provides that for new sources, the burden of compliance falls on the “owner or operator.” [508]
The same is necessarily true for existing sources. This supports the EPA's view that the basis for whether a control measure qualifies as a “system of emission reduction” under CAA section 111(d)(1)
( printed page 64768)
and (a)(1) is whether it is something that the owner/operator can implement in order to achieve the emissions standard assigned to the source—if so, the control measure should qualify as a “system of emission reduction”—and not whether the control measure is integrated into the source's own design or operation.
Commenters also argue that CAA section 111(h), which authorizes “design, equipment, work practice or operational standard[s]” (together, “design standards”) only when a source's emissions are not emitted through a conveyance or cannot be measured, makes clear that CAA section 111 standards of performance must be based on measures integrated into a source's own design or operations. We disagree. CAA section 111(h) concerns the relatively rare situation in which an emission standard, which entails a numerical limit on emissions,
is not
appropriate because emissions cannot be measured, due either to the nature of the pollutant (
i.e.,
the pollutant is not emitted through a conveyance) or the nature of the source category (
i.e.,
the source category is not able to conduct measurements). CAA section 111(h) provides that in such cases, the EPA may instead impose design standards rather than establish an emission standard (
i.e.,
the EPA can require sources to implement a particular design, equipment, work practice, or operational standard). When an emissions standard
is
appropriate, as in the present rule, CAA section 111(h) is silent as to what types of measures—whether limited to a source's own design or operations—may be considered as the system of emission reduction.[509]
In any event, CAA section 111(h) applies only to standards promulgated by the Administrator, and therefore appears by its terms to be limited to CAA section 111(b) rulemakings for new, modified, or reconstructed sources, not CAA section 111(d) rulemakings for existing sources.
Some commenters identify other provisions of CAA section 111 that, in their view, prove that CAA section 111 is limited to control measures that are integrated within the design or operations of the source. We do not find those arguments persuasive, for the reasons discussed in the supporting documents for this rule.
Commenters also argue, more generally, that Congress knew how to authorize control measures such as RE, as indicated by Congress's inclusion of those measures in Title IV (relating to acid rain), so the fact that Congress did not explicitly include these measures in the BSER provisions of CAA section 111(d)(1) and (a)(1) indicates that Congress did not intend that they be included as part of the BSER, and instead intended that the BSER be limited to measures integrated into the sources' design or operations. This argument misses the mark. The provisions of CAA section 111(d)(1) and (a)(1) do not explicitly include
any
specific emission reduction measures—neither RE measures (like the ones Congress wanted to incentivize under Title IV), nor measures that are integrated into the sources' design or operations (like the retrofit control measures Congress required under CAA section 407(b)). But this contrast with other CAA provisions does not mean that Congress did not intend the BSER to include any of those types of measures. Rather, this contrast supports viewing a “system of emission reduction” under CAA section 111 as sufficiently broad to encompass a wide range of measures for the purpose of emission reduction of a wide range of pollutants from a wide range of stationary sources.[510]
c.
Deference to interpret the BSER to include building blocks 2 and 3.
To the extent that it is not clear whether the phrase “system of emission reduction” may include the measures in building blocks 2 and 3, the EPA's interpretation of CAA section 111(d) and (a) is reasonable [511]
in light of our discretion to determine “whether
and how
to regulate carbon-dioxide emissions from power plants . . . .” [512]
Our interpretation that a “system of emission reduction” for the affected EGUs may include building blocks 2 and 3 is a reasonable construction of the statute for the reasons described above and in this section below.
(1)
Consistency of building blocks 2 and 3 with the structure of the utility power sector.
(a)
Integration of the utility power sector.
Certain characteristics of the utility power sector are of central importance for understanding why the measures of building blocks 2 and 3 qualify as part of the system of emission reduction. As discussed above, electricity is highly substitutable and the utility power sector is highly integrated, so much so that it has been likened to a “complex machine.” [513]
Specifically, the utility power sector is characterized by physical, as well as operational, interconnections between electricity generators themselves, and between those generators and electricity users. Because of the physical properties of electricity and the current low availability of large scale electricity storage, generation and load (or use) must be instantaneously balanced in real time. As a result, the utility power sector is uniquely characterized by extensive planning and highly coordinated operation. These features have been present for decades, and in fact, over time, the sector has become more highly integrated. Another important characteristics of the utility power sector is that although the states have developed both regulated and de-regulated markets, the generation of electricity reflects a least-cost dispatch approach, under which electricity is generated first by the generators with the lowest variable cost.
These characteristics of the sector have facilitated the overall objective of providing reliable electric service at least cost subject to a variety of constraints, including environmental constraints. Moreover, in each type of market, the sector has developed mechanisms, including the participation of institutional actors, to safeguard reliability and to assure least cost service.
Congress,[514]
the Courts,[515]
the EPA in its regulatory actions,[516]
and states in
( printed page 64769)
their regulatory actions [517]
have recognized the integrated nature of the utility power sector.
(b)
Significance of integrated utility power sector for the BSER.
The fungibility of electricity, coupled with the integration of the utility power sector, means that, assuming that demand is held constant, adding electricity to the grid from one generator will result in the instantaneous reduction in generation from other generators. Similarly, reductions in generation from one generator lead to the instantaneous increase in generation from other generators. Thus, the operation of individual EGUs is integrated and coordinated with the operations of other EGUs and other sources of generation, as well as with electricity users. This allows for locational flexibility across the sector in meeting demand for electricity services. The institutions that coordinate planning and operations routinely use this flexibility to meet demand for electricity services economically while satisfying constraints, including environmental constraints. Because of these characteristics, EGU owner/operators have long conducted their business, including entering into commercial arrangements with third parties, based on the premise that the performance and operations of any of their facilities is substantially dependent on the performance and operation of other facilities, including ones they neither own nor operate. For example, when an EGU goes off-line to perform maintenance, its customer base is served by other EGUs that increase their generation. Similarly, if an EGU needs to assure that it can meet its obligations to supply a certain amount of generation, it may enter into arrangements to purchase that generation, if it needs to, from other EGUs.
Because of this structure, fossil fuel-fired EGUs can reduce their emissions by taking the actions in building blocks 2 and 3. Specifically, fossil fuel-fired EGUs may generate or cause the generation of increased amounts of lower- or zero-emitting electricity—through contractual arrangements, investment, or purchase—which will back out higher-emitting generation, and thereby lower emissions. In addition, fossil fuel-fired EGUs may reduce their generation, which, given the overall emission limits this rule requires, will have the effect of stimulating lower- or zero-emitting generation.
It should also be noted that CO2
is particularly well-suited for building blocks 2 and 3 because it is a global, not local, air pollutant, so that the location where it is emitted does not affect its environmental impact. The U.S. Supreme Court in the
UARG
case highlighted the importance of taking account of the unique characteristics of CO2
.[518]
In light of these characteristics of the utility power sector, as well as the characteristics of CO2
pollution, it is reasonable for the EPA to reject an interpretation of the term “system of emission reduction” that would exclude building blocks 2 and 3 from consideration in this rule and instead restrict consideration to measures integrated into each individual affected source's design or operation, especially since the record and other publicly available information makes clear that the measures in the two building blocks are effective in reducing emissions and are already widely used.
As discussed above, no such restriction on the measures that can be considered part of a “system of emission reduction” is required by the statutory language, and the legislative history demonstrates that Congress intended an interpretation of the phrase broad enough to encompass building blocks 2 and 3. The narrow interpretation advocated by some commenters would permit consideration only of potential CO2
reduction measures that are either more expensive than building blocks 2 and 3 (such as the use of natural gas co-firing at affected EGUs or the application of CCS technology) or measures capable of achieving far less reduction in CO2
emissions (such as the heat rate improvement measures included in building block 1). Imposing such a restrictive interpretation—one which is not called for by the statute—would be inconsistent with CAA section 111's specific requirement that standards be based on the “best” system of emission reduction and, as discussed below, would be inconsistent with Congressional design that the CAA be comprehensive and address the major environmental issues.[519]
The unique characteristics of the sector described above require coordinated action in the fundamental, primary function of EGUs—and in meeting current pollution control requirements to the extent that EGUs operate in dispatch systems that apply variable costs in determining dispatch—and affected EGUs necessarily already plan and operate on a multi-unit basis. In doing so, they already make use of building blocks 2 and 3 to meet operational and environmental objectives in a cost-effective manner, as further described below. CO2
is a global pollutant that is exceptionally well-suited to emission reduction efforts optimized on a broad geographic scale rather than on a unit-by-unit basis. It is also clear from both comments and communications received through the Agency's outreach efforts that affected EGUs will seek to use building blocks 2 and 3 to achieve compliance with the emission standards set in the section 111(d) plans following promulgation of this rule. For these reasons—and the additional reasons discussed below—interpreting “system of emission reduction” so as to allow consideration in this rule of only the individual pieces of the “complex machine,” and to forbid consideration of the ways in which the pieces actually fit and work together as parts of that machine, such as building blocks 2 and 3, cannot be justified. This is particularly so in light of the dilemma presented by the types of control options that commenters argue are the only ones authorized under section 111(a)(1), which are controls that apply to the design or operation of the affected EGUs themselves. On the one hand, the control measures in building block 1 yield only a small amount of emission reductions. On the other hand, control measures such as carbon capture and storage, or co-firing with natural gas, could yield much greater emission reductions, but are substantially more expensive than building blocks 2 and 3.
(2)
Current implementation of measures in building blocks 2 and 3.
The requirement that the “system of emission reduction” be “adequately demonstrated” suggests that we begin our review under CAA section 111(d)(1) and (a)(1) with the systems that sources are already implementing to reduce their emissions. As noted above, fossil fuel-fired EGUs have long implemented, and are continuing to implement, the measures in building blocks 2 and 3 for various purposes, including for the purpose of reducing CO2
emissions [520]
—
( printed page 64770)
and certainly always with the effect of reducing emissions. This is a strong indicator that these measures should be considered part of a “system of emission reduction” for CO2
emissions from these sources. The requirement that the “system of emission reduction” be “adequately demonstrated” indicates that the implementation of control mechanisms or other actions that the sources are already taking to reduce their emissions are of particular relevance in establishing the emission reduction requirements of CAA section 111(d)(1) and (a)(1). As a result, such measures are a logical starting point for consideration as a “system of emission reduction” under CAA section 111.
(3)
Reliance in CAA Title IV on building block measures.
Some of the building block approaches to reducing emissions in the utility power sector were first tested around the time that Congress adopted the 1970 CAA Amendments.[521]
Over time, these techniques have become more established within the industry, and by the 1990 CAA Amendments, Congress based the Title IV acid rain program for existing fossil fuel-fired EGUs in part on the same measures that are considered here.
(a)
Overview.
It is logical that in determining whether the “system of emission reduction” that Congress established in CAA section 111(d)(1) and (a)(1) is broad enough to include the measures in building blocks 2 and 3 as the basis for establishing emission guidelines for fossil fuel-fired EGUs, an inquiry should be made into the tools that Congress relied on in other CAA provisions to reduce emissions from those same sources. The most useful CAA provision to examine for this purpose is Title IV, which includes a nationwide cap-and-trade program under which coal-fired power plants must have allowances for their SO2
emissions.
Title IV includes several signals that it is especially relevant for interpreting and implementing CAA section 111(d) for purposes of this rule. Title IV applies to most of the same sources that this rule applies to—existing coal-fired EGUs and other utility boilers, as well as NGCC units. In addition, Congress added Title IV in the 1990 CAA Amendments at the same time that Congress largely reinstated the 1970-vintage reading of section 111(a)(1) to adopt the currently applicable definition of a “standard of performance,” which is based on the “best system of emission reduction . . . adequately demonstrated.” Moreover, Congress linked Title IV and CAA section 111 in certain respects. Specifically, Congress conditioned the revisions to CAA section 111(a)(1),
i.e.,
eliminating the percentage reduction and most of the other limitations under the 1977 CAA Amendments, on the continued applicability of the Title IV SO2
cap, so that if the cap were eliminated, the changes would, by operation of law, also be eliminated, and the 1977 version of section 111(a)(1) would be reinstated.[522]
Additionally, Congress authorized the EPA to establish standards of performance for new
and
existing industrial (non-EGU) sources of SO2
emissions if emissions from these sources might exceed 1985 levels and failed to decline at the expected rate.[523]
While industrial sources were not required to participate under Title IV—they could elect to do so, under CAA section 410(a)—Congress believed SO2
reductions from these sources were “an essential component of the reductions sought under [Title IV]” and intended that Title IV would “assure[ ] that these projected reductions occur and will not be overcome by future growth in emissions.” [524]
As such, Congress viewed federal standards of performance as the appropriate backstop to Title IV even for sources that could not otherwise be regulated under CAA section 111(d).[525]
Together, these signals suggest that it is reasonable for the EPA to consider Title IV when interpreting and implementing CAA section 111.
For present purposes, the essential features of Title IV are that it regulates SO2
emissions from coal-fired EGUs by adopting a nationwide cap of 8.95 million tons to be achieved through a tradable allowance system. As we explain below, the provisions of Title IV and its legislative history make clear that Congress based the stringency of the emission limitation requirement (8.95 million tons) and the overall structure of the approach (a cap-and-trade system) on Congress's recognition that the affected EGUs had a set of tools available to them to reduce their emissions, including through a shift to lower emitting generation and use of RE, along with add-on controls and other measures. Thus, Title IV provides a close analogy to CAA section 111: Generation shift and RE were part of Congress's basis for the Title IV emission requirements, and that is analogous to building blocks 2 and 3 serving as part of the “system of emission reduction” that is the EPA's basis for the section 111(d) emission guidelines. For this reason, the fact that in Title IV, Congress relied on generation shift and RE as the basis for the SO2
emission limitations for affected EGUs strongly supports interpreting CAA section 111(d)(1) and (a)(1) to include use of those same measures as part of the “system of emission reduction” as the basis for CO2
emission limitations for those same sources.
(b)
Title IV provisions.
Several provisions of Title IV make explicit Congress's reliance on some of the same measures as are in building blocks 2 and 3. Title IV begins with a statement of congressional “findings,” including the finding that “strategies and technologies for the control of precursors to acid deposition exist now that are economically feasible, and improved methods are expected to become increasingly available over the next decade.” CAA section 401(a)(4) (emphasis added). Title IV then identifies as its “purposes,” “to reduce the adverse effects of acid deposition through reductions in annual emissions of sulfur dioxide . . . and nitrogen oxides,” as well as “to encourage energy conservation, use of renewable and clean alternative technologies, and pollution prevention as a long-range strategy, consistent with the provisions of this subchapter, for reducing air pollution and other adverse impacts of energy production and use.” CAA section 401(b) (emphasis added).
By its terms, this statement of Title IV's purposes explicitly embraces the
( printed page 64771)
use of RE. Moreover, the legislative history makes clear that the reference in the “findings” section quoted above to “strategies and technologies” includes generation shift to lower-emitting generation. Specifically, the Senate Report stated that an “allowance system” [526]
would encourage such “technologies and strategies” as
energy efficiency; enhanced emissions reduction or control technologies—like sorbent injection, cofiring with natural gas, integrated gasification combined cycles; fuel-switching and
least-emissions dispatching
in order to maximize emissions reductions. [527]
Congress's reliance on generation shifting and RE to reduce acid rain precursors from affected EGUs in Title IV strongly supports the EPA's authority to identify those same measures as part of the CAA section 111 “system of emission reduction” to reduce CO2
emissions from those same sources.
In addition, Title IV includes other provisions expressly concerning RE. In CAA section 404(f) and (g), Congress set aside a special pool of allowances to encourage use of RE. In order to obtain a special allowance (which would authorize emissions from a coal-fired utility), an electric utility needed to pay for qualifying RE sources “directly or through purchase from another person.” [528]
These measures confirm Congress's recognition that RE was available to the industry, was desirable to encourage from a policy perspective, and was appropriate to consider in determining the amount of pollution reduction the law should require.
(c)
Title IV legislative history.
Numerous statements in the legislative history confirm that Congress based the Title IV requirements on the fact that affected EGUs could reduce their SO2
emissions through a set of measures, including shifting to lower-emitting generation as well as reliance on RE.
For example, the Senate Committee Report [529]
and Senator Baucus,[530]
a member of the Senate Committee on Environment and Public Works and Chairman of the House and Senate Clean Air Conferees, both emphasized that affected EGUs could rely on, among other things, “least-emissions dispatching in order to maximize emissions reductions.” Similarly, statements supporting the RE reserve were included in the legislative history on the House side.
We believe that this provision of the bill will establish a balanced and workable approach that will provide certainty for utility companies that are considering conservation and renewables, while at the same time strengthening the environmental goals of this legislation.[531]
(4)
Reliance on RE measures to reduce CO2.
The Title IV legislative history also makes clear that Congress viewed RE measures as a means to reduce CO2
for the purpose of mitigating climate change. By the time of the 1990 CAA Amendments, Congress had long been aware that emissions of CO2
and other GHGs put upward pressure on world temperatures and threatened to change the climate in destructive ways. In 1967, President Lyndon Johnson sent a letter to Congress recognizing that carbon dioxide was changing the composition of the atmosphere.[532]
The record for the 1970 CAA Amendments include hearings [533]
and a report by the National Academy of Sciences noting that carbon dioxide emissions could heat the atmosphere.[534]
A 1976 report noting the phenomenon was included in the record for the 1977 CAA Amendments.[535]
A 1977 Report by the National Academy of Sciences warned that average temperatures would rise due to the burning of fossil fuel.[536]
By the time of the 1990 CAA Amendments, the dangers had become more clearly evident. Senate hearings beginning in 1988 had presented testimony from Dr. James E. Hansen of the National Aeronautics and Space Administration and other scientists that described the dangers of climate change caused by anthropogenic carbon dioxide and other GHG emissions and asserted that as a result of those emissions, the climate was in fact already changing.[537]
In enacting the 1990 CAA Amendments, Congress identified reductions in carbon dioxide emissions as an important co-benefit of the reductions in coal use and stressed that the RE measures would achieve those reductions. Senator Fowler, the author of the provision that established a RE technology reserve within the allowance system, noted that RE technologies, “can greatly reduce emissions of . . . global warming gases. That makes them a potent weapon against catastrophic climate change . . . .” [538]
In addition, the 1990 CAA Amendments required EGUs covered by the monitoring requirements of the Title IV acid rain program to report their CO2
emissions.[539]
( printed page 64772)
(5)
Other EPA actions that rely on the building block measures.
Another indication that it is reasonable to interpret the CAA section 111(d)(1) and (a)(1) provisions for the BSER to include the measures in building blocks 2 and 3 is that the EPA and states have relied on these measures to reduce emissions in a number of other CAA actions.
For example, in 2005, the EPA promulgated a rule to control mercury emissions from fossil fuel-fired power plants under section 111(d): The Clean Air Mercury Rule (CAMR).[540]
The EPA established a nationwide cap-and-trade program that took effect in two phases: In 2010, the cap was set at 38 tons per year, and in 2018, the cap was lowered to 15 tons per year. The EPA expected, on the basis of modeling, that sources would achieve the second phase, 15-ton per year cap cost-effectively by choosing among a set of measures that included shifting generation to lower-emitting units.[541]
CAMR was vacated by the D.C. Circuit on other grounds,[542]
but it shows that in the only other section 111(d) rule that the EPA attempted for affected EGUs, the EPA relied on shifting generation as part of the BSER in a CAA section 111(d) rulemaking for fossil fuel-fired EGUs.
In 2011, the EPA promulgated the Cross State Air Pollution Rule (CSAPR),[543]
in which it set statewide emission budgets for NOX
and SO2
emitted by fossil fuel-fired EGUs, and based those standards in part on shifts to lower-emitting generation. CSAPR established state-wide emissions budgets based on a range of cost-effective actions that EGUs could take, and set the stringency of the deadlines for some required reductions in part because of the availability of “increased dispatch of lower-emitting generation which can be achieved by 2012.” [544]
The EPA developed a federal implementation plan (FIP) that established a trading program to meet the state-wide emission budgets set by CSAPR. The EPA projected that sources would meet their emission reduction obligations by implementing a range of emission control approaches, including the operation of add-on controls, switches to lower-emitting coal, and “changes in dispatch and generation shifting from higher emitting units to lower emitting units.” [545]
The U.S. Supreme Court upheld CSAPR in
EPA
v.
EME Homer City Generation, L.P.[546]
With respect to RE, in 2004, the EPA provided guidance to states for adopting attainment SIPs under CAA section 110 that include RE measures.[547]
Some states have done so. For example, Connecticut included in its SIP reductions from solar photovoltaic installations.[548]
In 2012, the EPA provided additional guidance on this topic.[549]
In addition, the EPA has partnered with the Northeast States for Coordinated Air Use Management (NESCAUM) and three states (Maryland, Massachusetts, and New York) to identify opportunities for including RE in a SIP and to provide real-world examples and lessons learned through those states' case studies.[550]
(6)
Other rules that relied on actions by other entities.
The EPA has promulgated numerous actions that establish control requirements for affected sources on the basis of actions by other entities or actions other than measures integrated into the design or operations of the affected sources. This section summarizes some of those actions. First, virtually all pollution control requirements require the affected sources to depend in one way or another on other entities, such as control technology manufacturers. Second, the EPA has promulgated numerous regulatory actions that are based on trading of mass-based emission allowances or rate-based emission credits, in which many sources meet their emission limitation requirements by purchasing allowances or credits from other sources that reduce emissions.
(a)
Third-party transactions.
To reiterate, commenters argue that the “system of emission reduction” must be limited to measures taken by the affected source itself because only those measures are under the control of the affected source, as opposed to third parties, and therefore only those measures can assure that the affected source will achieve its emission limits. But this argument is belied by the fact that for a wide range of pollution control measures—including many that are indisputably part of a “system of emission reduction”—affected sources are in fact dependent on third parties. For example, to implement any type of add-on pollution control equipment that is available only from a third-party manufacturer, the affected source is dependent upon that third party for developing and constructing the necessary controls, and for offering them for sale. Indeed, the affected sources may be dependent upon third parties to install (and in some cases to operate) the controls as well, and in fact, in the CAIR rule, the EPA established the compliance date based on the limited availability of the specialized workforce needed to install the controls needed by the affected EGUs.[551]
In addition, EGU owners and operators may be dependent on the actions of third parties to finance the controls and third-party regulators to assure the mechanism for repaying that financing. However, this dependence does not mean that the emission limit based on that equipment is not achievable. Rather, the fact that the owner or operator of the affected source can arrange with the various third parties to
( printed page 64773)
acquire, install, and pay for the equipment means that emission limit is achievable.
In this rule, as noted, the affected EGUs may, in many cases, implement the measures in building blocks 2 and 3 directly, and, in other cases, implement those measures by engaging in market transactions with third parties that are as much within the affected EGUs' control as engaging in market transactions with the range of third parties involved in pollution control equipment. By the same token, the market transactions that the affected EGUs engage in with third parties to implement the measures in building blocks 2 and 3 are comparable to the market transactions that affected EGUs engage in as part of their normal course of business, which include, among many examples, transactions with RTOs/ISOs or balancing authorities, entities in organized markets.
(b)
Emissions trading.
Additional precedent that the “system of emission reduction” may include the measures in building blocks 2 and 3 and is not limited to measures that a source can integrate into its own design or operations, without being dependent on other entities, is found in the many rules that Congress has enacted or that the EPA has promulgated that allow EGUs and other sources to meet their emission limits by trading with other sources. In a trading rule, the EPA authorizes a source to meet its emission limit by purchasing mass-based emission allowances or rate-based emission credits generated from other sources, typically ones that implement controls that reduce their emissions to the point where they are able to sell allowances or credits. As a result, the availability of trading reduces overall costs to the industry by focusing the controls on the particular sources that have the least cost to implement controls. For present purposes, what is relevant is that in a trading program, some affected sources choose to meet their emission limits not by implementing emission controls integrated into their own design or operations, but rather by purchasing allowances or credits. These affected sources, therefore, are dependent on the actions of other entities, which are the ones that choose to meet their emission limits by implementing emission controls, which permits them to sell allowances or credits. They are dependent, however, in the same way that a source acquiring pollution control technology for the purposes of meeting a NSPS is dependent on a vendor of that technology to fulfill its contractual obligations. That is, the source operator purchasing a credit or an allowance is acquiring an equity in the technology or action applied to the credit-selling source for purposes of achieving a reduction in emissions occurring at the selling source. Trading programs have been commonplace under the CAA, particularly for EGUs, for decades. They include the acid rain trading program in Title IV of the CAA, the trading programs in the transport rules promulgated by the EPA under the “good neighbor provision” of CAA section 110(a)(2)(D)(i)(I), the Clean Air Mercury Rule, and the regional haze rules. In each of these actions, the Congress or the EPA recognized that some of the affected EGUs would implement controls or take other actions that would lower their emissions and thereby allow them to sell allowances to other EGUs, which were dependent on the purchase of those allowances to meet their obligations.[552]
For the reasons just described, these trading rules refute commenters' arguments for limiting the scope of the “system of emission reduction.”
(c)
NSPS rules for EGUs that depend on the integrated grid.
The EPA has promulgated NSPS for EGUs that include requirements based on the fact that an EGU may reduce its generation, and therefore its emissions, because the integration of the grid allows another EGU to increase generation and thereby avoid jeopardizing the supply of electricity. For example, in 1979, the EPA finalized new standards of performance to limit emissions of SO2
from new, modified, and reconstructed EGUs. In evaluating the best system against concerns of electric service reliability, the EPA took into account the unique features of power transmission along the interconnected grid and the unique commercial relationships that rely on those features.[553]
Additionally, in 1982, the EPA recognized that utility turbines could meet a NOX
emission limit without unacceptable economic consequences because “other electric generators on the grid can restore lost capacity caused by turbine down time.” [554]
We describe the relevant parts of these rules in greater detail in the Legal Memorandum.
(7)
Consistency with the purposes of the Clean Air Act.
Interpreting the term “system of emission reduction” broadly to include building blocks 2 and 3 (so that the “best system of emission reduction . . . adequately demonstrated” may include those measures as long as they meet all of the applicable requirements) is also consistent with the purposes of the CAA. Most importantly, these purposes include protecting public health and welfare by comprehensively addressing air pollution, and, particularly, protecting against urgent and severe threats. In addition, these purposes include promoting pollution prevention measures, as well as the advancement of technology that reduces air pollution.
(a)
Purpose of protecting public health and welfare.
The first provisions in the Clean Air Act set out the “Congressional findings and declaration of purpose.” CAA section 101. CAA section 101(a)(2) states the finding that “the growth in the amount and complexity of air pollution brought about by urbanization, industrial development, and the increasing use of motor vehicles, has resulted in mounting dangers to the public health and welfare.” CAA section 101(a)(3) states the finding that “air pollution prevention (that is, the reduction or elimination, through any measures, of the amount of pollutants produced or created at the source) and air pollution control at its source is the primary responsibility of States and local governments.” CAA section 101(a) states the finding that “Federal financial assistance and leadership is essential for the development of cooperative Federal, State, regional, and local programs to prevent and control air pollution.”
CAA section 101(b) next states “[t]he purposes” of the Clean Air Act. The first purpose is “to protect and enhance the
( printed page 64774)
quality of the Nation's air resources so as to promote the public health and welfare and the productive capacity of its population.” CAA section 101(b)(1). The second is “to initiate and accelerate a national research and development program to achieve the prevention and control of air pollution.” CAA section 101(b)(2). The third is “to provide technical and financial assistance to State and local governments in connection with the development and execution of their air pollution prevention and control programs.” CAA section 101(b)(3). The fourth is “to encourage and assist the development and operation of regional air pollution prevention and control programs.” CAA section 101(c) adds that “[a] primary goal of this Act is to encourage or otherwise promote reasonable Federal, State, and local governmental actions, consistent with the provisions of this Act, for pollution prevention.”
As just quoted, these provisions are explicit that the purpose of the CAA is “to protect and enhance the quality of the Nation's air resources so as to promote the public health and welfare and the productive capacity of its population.” Moreover, Congress designed the CAA to be “the comprehensive vehicle for protection of the Nation's health from air pollution” [555]
and, in fact, designed CAA section 111(d) to address air pollutants not covered under other provisions, specifically so that “there should be no gaps in control activities pertaining to stationary source emissions that pose any significant danger to public health or welfare.” [556]
Furthermore, in these purpose provisions, Congress recognized that while pollution prevention and control are the primary responsibility of the States, “federal leadership” would be essential.
At its core, Congress designed the CAA to address urgent and severe threats to public health and welfare. This purpose is evident throughout 1970 CAA Amendments, which authorized stringent remedies that were necessary to address those problems. By 1970, Congress viewed the air pollution problem, which had been worsening steadily as the nation continued to industrialize and as automobile travel dramatically increased after World War II,[557]
as nothing short of a national crisis.[558]
With the 1970 CAA Amendments, Congress enacted a stringent response, designed to match the severity of the problem. At the same time, Congress did not foreclose the EPA's ability to address new environmental concerns; in fact, Congress largely deferred to the EPA's expertise in identifying pollutants and sources that adversely affect public health or welfare. In doing so, Congress authorized the EPA to establish national ambient air quality standards for the most pervasive air pollutants—including the precursors for the choking smog that blanketed urban areas [559]
—to protect public health with an ample margin of safety. Disappointed that the states had not taken effective action to that point to curb air pollution, “Congress reacted by taking a stick to the States” [560]
and including within the 1970 CAA Amendments both the requirement that the states develop plans to assure that their air quality areas would meet those standards by no later than five years, and the threat of imposition of federal requirements if the states did not timely adopt the requisite plans. Congress also required the EPA to establish standards for hazardous air pollutants that could result in shutting sources down. Congress added stringent controls on automobiles, overriding industry objections that the standards were not achievable. In addition, Congress added CAA section 111(b), which required the EPA to list categories based on harm to public health and regulate new sources in those categories. Congress then designed CAA section 111(d) to assure, as the Senate Committee Report for the 1970 CAA Amendments noted, that “there should be no gaps in control activities pertaining to stationary source emissions that pose any significant danger to public health or welfare.” [561]
Similarly, the 1977 and 1990 CAA Amendments were also designed to respond to new and/or pressing environmental issues. For example, in 1977 then-EPA Administrator Costle testified before Congress that the expected increase in coal use (in response to various energy crises, including the 1973-74 Arab Oil Embargo) “will make vigorous and effective control even more urgent.” [562]
Similarly, by 1990, Congress recognized that “many of the Nation's most important air pollution problems [had] failed to improve or [had] grown more serious.” [563]
Indeed, President George H. W. Bush said that “ `progress has not come quickly enough and much remains to be done.' ” [564]
Climate change has become the nation's most important environmental problem. We are now at a critical juncture to take meaningful action to curb the growth in CO2
emissions and forestall the impending consequences of prior inaction. CO2
emissions from existing fossil fuel-fired power plants
( printed page 64775)
are by far the largest source of stationary source emissions. They emit almost three times as much CO2
as do the next nine stationary source categories combined, and approximately the same amount of CO2
emissions as all of the nation's mobile sources. The only controls available that can reduce CO2
emissions from existing power plants in amounts commensurate with the problems they pose are the measures in building blocks 2 and 3, or far more expensive measures such as CCS.
Thus, interpreting the “system of emission reduction” provisions in CAA section 111(d)(1) and (a)(1) to allow the nation to meaningfully address the urgent and severe public health and welfare threats that climate change pose is consistent with what the CAA was designed to do.[565]
This interpretation is also consistent with the cooperative purpose of section 111(d) to assure that the CAA comprehensively address those threats through the mechanism of state plans, where the states assume primary responsibility under federal leadership.
See King
v.
Burwell,
576 U.S. (2015), No. 14-114 (2015), slip op. at 15 (“We cannot interpret federal statutes to negate their own stated purposes” (quoting
New York State Dept. of Social Servs.
v.
Dublino,
413 U.S. 405, 419-20 (1973));
id.
at 21 (“A fair reading of legislation demands a fair understanding of the legislative plan.”).[566]
(b)
Purpose of encouraging pollution prevention.
Interpreting “system of emission reduction” to include building blocks 2 and 3 is also consistent with the CAA's purpose to encourage pollution prevention. CAA section 101(c) states that “[a] primary goal of [the CAA] is to encourage or otherwise promote reasonable federal, state, and local governmental actions, consistent with the provisions of this chapter, for pollution prevention.” Indeed, in the U.S. Code, in which the CAA is codified as chapter 85, the CAA is entitled, “Air Pollution Prevention and Control.” [567]
CAA section 101(a)(3) describes “air pollution prevention” as “the reduction or elimination, through
any
measures, of the amount of pollutants produced or created at the source”. (Emphasis added.) The reference to “any measures” highlights the breadth of what Congress considered to be pollution prevention, that is, any and all measures that reduce or eliminate pollutants at the source.[568]
The measures in building blocks 2 and 3 qualify as “pollution prevention” measures because they are “any measures” that “reduc[e] or eliminate[e] . . . the amount of pollutants produced or created at the [fossil fuel-fired affected] source[s].” Thus, consistent with the CAA's primary goals, it is therefore reasonable to interpret a “system of emission reduction,” as including the pollution prevention measures in building blocks 2 and 3.
(c)
Purpose of advancing technology to control air pollution.
This final rule is also consistent with CAA section 111's purpose of promoting the advancement of pollution control technology based on the expectation that American industry will be able to develop innovative solutions to the environmental problems.
The legislative history and case law of CAA section 111 identify three different ways that Congress designed CAA section 111 to authorize standards of performance that promote technological improvement: (i) The development of technology that may be treated as the “best system of emission reduction . . . adequately demonstrated;” under CAA section 111(a)(1); [569]
(ii) the expanded use of the best demonstrated technology; [570]
and (iii) the development of emerging technology.[571]
This rule is consistent with the second of those ways—it expands the use of the measures in building blocks 2 and 3, which are already established and provide substantial reductions at reasonable cost. As discussed below, the use of the measures in these building blocks will be most fully expanded when organized markets develop, and our expectation that those markets will develop is consistent with the Congress's view, just described, that CAA section 111 should promote technological innovation.
This final rule is also consistent with Congress's overall view that the CAA Amendments as a whole were designed to promote technological innovation. In enacting the CAA, Congress articulated its expectation that American industry would be creative and come up with innovative solutions to the urgent and severe problem of air pollution. This is manifest in the well-recognized technology-forcing nature of the CAA, and was expressed in numerous, sometimes ringing, statements in the legislative history about the belief that American industry will be able to develop the needed technology. For example, in the 1970 floor debates, Congress recalled that the nation had put a man on the moon a year before and had won World War II a quarter century earlier, and attributed much of the credit for those singular achievements to American industry and its ability to be productive and innovative. Congress expressed confidence that American industry
( printed page 64776)
could meet the challenges of developing air pollution controls as well.[572]
(d)
Response to commenters concerning purpose.
Commenters have stated that the proposed rule “would transform CAA section 111 into something untethered to its statutory language and unrecognizable to the Congress that created it.” [573]
Commenters with this line of comments focused on the ramifications of building block 4, which the EPA has decided does not belong in BSER using EPA's historical interpretation of BSER. Regardless of whether the comments are accurate with respect to building block 4 measures, they are certainly not accurate with respect to the three building blocks that the EPA is defining as the BSER. This rule would be recognizable to the Congresses that created and amended CAA section 111 and is carefully fashioned to the statutory text in CAA section 111(d) and (a)(1). This final rule would be recognizable to the Congress that adopted CAA section 111 in 1970 as part of a bold, far-reaching law designed to address comprehensively an air pollution crisis that threatened the health of millions of Americans; to have EPA and the States work cooperatively to develop state-specific approaches to address a national problem; to challenge industry to meet that crisis with creative energy; and to give the EPA broad authority—under section 111 and other provisions—to craft the needed emission limitations. This final rule would be recognizable to the Congress that revised CAA section 111 in 1977 to explicitly authorize that standards be based on actions taken by third parties (fuel cleaners). And this final rule would be recognizable to the Congress that revised CAA section 111 in 1990 to be linked to the Acid Rain Program that Congress adopted at the same time, which regulated the same industry (fossil fuel-fired EGUs) through some of the same measures (generation shifts and RE), and that explicitly acknowledged that those measures (RE) would also reduce CO2
and thereby address the dangers of climate change. To reiterate, for the reasons explained in this preamble, this rule is grounded in our reasonable interpretation of CAA section 111(d) and (a)(1).
(8)
Constraints on the BSER—treatment of building block 4 and response to comments concerning precedents.
Although the BSER provisions are sufficiently broad to include, for affected EGUs, the measures in building blocks 2 and 3, they also incorporate significant constraints on the types of measures that may be included in the BSER. We discuss those constraints in this section. These constaints explain why we are not including building block 4 in the BSER. In addition, these constraints explain why our reliance on building blocks 2 and 3 will have limited precedential effect for other rulemakings, and serve as our basis for responding to commenters who expressed concern that reliance on building blocks 2 and 3 would set a precedent for the EPA to rely on similar measures in promulgating future air pollution controls for other sectors.[574]
As discussed above, the emission limits in the CAA section 111(d) emission guidelines that this rule promulgates are based on the EPA's determination, for the affected EGUs, of the “system of emission reduction” that is the “best,” taking into account “cost” and other factors, and that is “adequately demonstrated.” Those components include certain interpretations and applications and provide constraints on the types of measures or controls that the EPA may determine to include in the BSER.
(a)
Emission reductions from affected sources.
The first constraint is that the BSER must assure emission reductions from the affected sources. Under section 111(d)(1), the states must submit state plans that “establish[] standards of performance for any existing source,” and, under section 111(a)(1) and the EPA's implementing regulations, those standards are informed by the EPA's determination of the best system of emission reduction adequately demonstrated. Because the emission standards must apply to the affected sources, actions taken by affected sources that do not result in emission reductions from the affected sources—for example, offsets (
e.g.,
the planting of forests to sequester CO2)—do not qualify for inclusion in the BSER. Building blocks 2 and 3 achieve emission reductions from the affected EGUs, and thus are not precluded under this constraint.
(b)
Controls or measures that affected EGUs can implement.
The second constraint is that because the affected EGUs must be able to achieve their emission performance rates through the application of the BSER, the BSER must be controls or measures that the EGUs themselves can implement. Moreover, as noted, the D.C. Circuit has established criteria for achievability in the section 111(b) case law;
e.g.,
sources must be able to achieve their standards under a range of circumstances. If those criteria are applicable in a section 111(d) rule, the BSER must be of a type that allows sources to meet those achievability criteria. As noted, under this rule, affected EGUs can achieve their emission performance rates in the various circumstances under which they operate, through the application of the building blocks.
(c)
“Adequately demonstrated.”
The third constraint is that the system of emission reduction that the EPA determines to be the best must be “adequately demonstrated.” To qualify as the BSER, controls and measures must align with the nature of the regulated industry and the nature of the pollutant so that implementation of those controls or measures will result in emission reductions from the industry and allow the sources to achieve their emission performance standards. The history of the effectiveness of the controls or other measures, or other indications of their effectiveness, are important in determining whether they are adequately demonstrated.
More specifically, the application of building blocks 2 and 3 to affected EGUs has a number of unique characteristics. Building blocks 2 and 3 entail the production of the same amount of the same product—electricity, a fungible product that can be produced using a variety of highly substitutable generation processes—through the cleaner (that is, less CO2
-intensive) processes of shifting dispatch from steam generators to existing NGCC units, and from both steam generators and NGCC units to renewable generators.
( printed page 64777)
The physical properties of electricity and the highly integrated nature of the electricity system allow the use of these cleaner processes to generate the same amount of electricity. In addition, the electricity sector is primarily domestic—little electricity is exported outside the U.S.—and there is low capacity for storage. In addition, the electricity sector is highly regulated, planned, and coordinated. As a result, holding demand constant, an increase in one type of generation will result in a decrease in another type of generation. Moreover, the higher-emitting generators, which are fossil fuel-fired, have higher variable costs than renewable generators, so that increased renewable generation will generally back out fossil fuel-fired generation.
Because of these characteristics, the electricity sector has a long and well-established history of substituting one type of generation for another. This has occurred for a wide variety of reasons, many of which are directly related to the system's primary purposes and functions, as well as for environmental reasons. As a result, at present, there is a well-established network of business and operational relationships and past practices that supports building blocks 2 and 3. As noted elsewhere, a large segment of steam generators already have business relationships with existing NGCC units, and a large segment of all fossil fuel-fired EGUs already own, co-own, or have invested in RE.
Many of these characteristics are unique to the utility power sector. Moreover, this complex of characteristics, ranging from the physical properties of electricity and the integrated nature of the grid to the institutional mechanisms that assure reliability and the existing practices and business relationships in the industry, combine to facilitate the implementation of building blocks 2 and 3 in a uniquely efficient manner. This supports basing the emission limits on the ability of owners and operators of fossil fuel-fired EGUs to replace their generation with cleaner generation in other locations, sometimes owned by other entities.
As noted above, commenters offered hypothetical examples to illustrate their concerns over precedential effects. Most of their concerns focused on building block 4, and most of their hypothetical examples concerned reductions in demand for various types of products. We address these concerns in the response to comments document, but we note here that, in any event, these concerns are mooted because we are not finalizing building block 4. Some commenters offered hypothetical examples for building blocks 2 and 3 as well. For example, some commenters asserted that the EPA could “develop standards of performance for tailpipe emissions from motor vehicles” by “requiring car owners to shift some of their travel to buses,” which the commenters considered analogous to building block 2; or by “requiring there to be more electric vehicle purchases,” which the commenters considered analogous to building block 3.[575]
Commenters' concerns over precedential impact cannot be taken to mean that the building blocks should not be considered to meet the requirements of the BSER or that the affected EGUs cannot be considered to meet the emission limits by implementing those measures. Moreover, because many of these individual characteristics, and their inherent complexity, are unique to the utility power sector, building blocks 2 and 3 as applied to fossil fuel-fired EGUs will have a limited precedent for other industries and other types of rulemakings. For example, the commenter's hypothetical examples noted above are inapposite for several reasons. The hypotheticals appear to be premised on government action mandating actions not implementable by emitting sources (
e.g.,
that a government would “require[e] car owners to shift some of their travel to buses, or . . . require[e] there to be more electric vehicle purchases”), whereas the measures in building blocks 2 and 3 can be implemented by the affected EGUs. Nor have commenters attempted to address how car owners shifting travel to buses or purchasing more electric vehicles could be translated into lower tailpipe standards for motor vehicles.[576]
(d)
“Best” in light of “cost . . . nonair quality health and environmental impact and energy requirements” and EPA's past practice and current policy.
The fourth constraint, or set of constraints, is that the system of emission reduction must be the “best,” “taking into account the cost of achieving such reduction and any nonair quality health and environmental impact and energy requirements.” As noted, in light of the D.C. Circuit case law, the EPA has considered cost and energy factors on both an individual source basis and on the basis of the nationwide electricity sector. In determining what is “best,” the EPA has broad discretion to balance the enumerated factors.[577]
In interpreting and applying these provisions in this rulemaking to regulate CO2
emissions from affected EGUs under section 111(d), we are acting consistently with our past practice for applying these provisions in previous section 111 rulemakings and for regulating air pollutants from the electricity sector under other provisions of the CAA, as well as current policy.
The great majority of our regulations under section 111 have been 111(b) regulations for new sources. As discussed in the Legal Memorandum and briefly below, the BSER identified under section 111(b) is designed to assure that affected sources are well controlled at the time of construction, and that approach is consistent with the design expressed in the legislative history for the 1970 CAA Amendments that enacted the provision.
Traditionally, CAA section 111 standards have been rate-based, allowing as much overall production of a particular good as is desired, provided that it is produced through an appropriately clean (or low-emitting) process. CAA section 111 performance standards have primarily targeted the means of production in an industry and not consumers' demand for the product. Thus, the focus for the BSER has been on how to most cleanly produce a good, not on limiting how much of the good can be produced.
One example of the focus under section 111 on clean production, not limitation of product is provided by the revised new source performance standards for electric utility steam generating units that we promulgated in 1979 following the 1977 CAA Amendments to limit emissions of SO2, PM, and NOX
. In relevant part, the revised standards limited SO2
emissions to 1.20 lb/million BTU heat input and imposed a 90 percent reduction in potential SO2
emissions. This was based on the application of flue gas desulfurization (FGD) together with coal preparation techniques. In the preamble, we explain that “[t]he intent of the final standards is to encourage power plant owners and operators to install the best available FGD systems and to implement effective operation and maintenance procedures but not to create power supply disruptions.” [578 579]
( printed page 64778)
EPA has taken the same overall approach in its section 111(d) rules,[580]
including the CAMR rule noted below.
Similarly, in a series of rulemakings regulating air pollutants from EGUs under several provisions of the CAA, we have focused our efforts on assuring that electricity is generated through cleaner or lower-emitting processes, and we have not sought to limit the aggregate amount of electricity that is generated. We describe those rules in section II, elsewhere in this section V.B.3., and in the Legal Memorandum.
For example, as discussed in the Legal Memorandum, in the three transport rules promulgated under CAA section 110(a)(2)(D)(i)(I)—the NOX
SIP Call, CAIR, and CSAPR—which regulated precursors to ozone-smog and particulate matter, the EPA based certain aspects of the regulatory requirements on the fact that fossil fuel-fired EGUs could shift generation to lower-emitting sources. In CAMR, the 2005 rulemaking under section 111(d) regulating mercury emissions from coal-fired EGUs, the EPA based the first phase of control requirements on the actions the affected EGUs were required to take under CAIR, including shifting generation to lower-emitting sources. In addition, as also discussed in the Legal Memorandum, in the EPA's 2012 MATS rule regulating mercury from coal-fired EGUs under section 112, at industry's urging, the EPA allowed compliance deadlines to be extended for coal-fired EGUs that desired to substitute replacement power of any type, including NGCC units or RE, for compliance purposes.
While these and other rulemakings for fossil fuel-fired EGUs took different approaches towards lower-emitting generation and renewable generation, they all were based on control measures that reduced emissions without reducing aggregate levels of electricity generation. It should be noted that even though some of those rules established overall emission limits in the form of budgets implemented through a cap-and-trade program, the EPA recognized that the fossil fuel-fired EGUs that were subject to the rules could comply by shifting generation to lower-emitting EGUs, including relying on RE. In this manner, the rules limited emissions but on the basis that the industry could implement lower-emitting processes, and not based on reductions in overall generation.
We are applying the same approach to this rulemaking. Our basis for this rulemaking is that affected EGUs can implement a system of emission reduction that will reduce the amount of their emissions without reducing overall electricity generation. This approach takes into account costs by minimizing economic disruption as well as the nation's energy requirements by avoiding the need for environmental-based reductions in the aggregate amount of electricity available to the consumer, commercial, and industrial sectors.
This approach is a reasonable exercise of the EPA's discretion under section 111, consistent with the U.S. Supreme Court's statements in its 2011 decision,
American Electric Power Co.
v.
Connecticut,
that the CAA and the EPA actions it authorizes displace any federal common law right to seek abatement of CO2
emissions from fossil-fuel fired power plants. There, the Court emphasized that CAA section 111 authorizes the EPA—which the Court identified as the “expert agency”—to regulate CO2
emissions from fossil fuel-fired power plants based an “informed assessment of competing interests . . . . Along with the environmental benefit potentially achievable, our Nation's energy needs and the possibility of economic disruption must weigh in the balance.” [581]
Similarly, the D.C. Circuit, in a 1981 decision upholding the EPA's section 111(b) standards for air pollutants from fossil fuel-fired EGUs, stated that section 111 regulations concerning the electric power sector “demand a careful weighing of cost, environmental, and energy considerations.” [582]
This exercise of policy discretion is consistent with Congress's expectation that the Administrator “should determine the achievable limits” [583]
and “would establish guidelines as to what the best system for each such category of existing sources is.” [584]
As the D.C. Circuit explained, “[i]t seems likely that if Congress meant . . . to curtail EPA's discretion to weigh various policy considerations it would have explicitly said so in section 111, as it did in other parts of the statute.” [585]
Our interpretation that CAA section 111 targets supply-side activities that allow continued production of a product through use of a cleaner process, rather than targeting consumer-oriented behavior, also furthers Congress' intent of promoting cleaner production measures “to protect and enhance the quality of the Nation's air resources so as to promote the public health and welfare and the productive capacity of its population.” [586]
This principle is also consistent with promoting “reasonable . . . governmental actions . . . for pollution prevention.” [587]
In this rule, we are applying that same approach in interpreting the BSER provisions of section 111. That is, we are basing the regulatory requirements on measures the affected EGUs can implement to assure that electricity is generated with lower emissions, taking into account the integrated nature of the industry and current industry practices. Building blocks 1, 2 and 3 fall squarely within this paradigm; they do not require reductions in the total amount of electricity produced.
We recognize that commenters have raised extensive legal concerns about building block 4. We recognize that building block 4 is different from building blocks 1, 2, and 3 and the pollution control measures that we have considered under CAA section 111. Accordingly, under our interpretation of section 111, informed by our past practice and current policy, today's final action excludes building block 4 from the BSER. Building block 4 is outside our paradigm for section 111 as it targets
( printed page 64779)
consumer-oriented behavior and demand for the good, which would reduce the amount of electricity to be produced.
Although numerous commenters urged us to include demand-side EE measures as part of the BSER, as we had proposed to do, we conclude that we cannot do so under our historical practice, current policy, and current approach to interpreting section 111 as well as our historical practice in regulating the electricity sector under other CAA provisions. While building blocks 2 and 3 are rooted in our past practice and policy, building block 4 is not and would require a change (which we are not making) in our interpretation and implementation and application of CAA section 111.
Excluding demand-side EE measures from the BSER has the benefit of allaying legal and other concerns raised by commenters, including concerns that individuals could be “swept into” the regulatory process by imposing requirements on “every household in the land.” [588]
While building block 4 could have been implemented without imposing requirements on individual households, this final rule resolves any doubt on this matter and is not based on the inclusion of demand-side EE as part of the BSER.
By the same token, we are not finalizing reduced generation of electricity overall as the BSER. Instead, components of the BSER focus on shifting generation to lower- or zero-emitting processes for producing electricity.[589]
(e)
Constraints for new sources.
For new sources, practical and policy concerns support the interpretation of basing the BSER on controls that new sources can install at the time of construction, so that they will be well-controlled throughout their long useful lives. This approach is consistent with the legislative history. We discuss this at greater length in the Legal Memorandum.
4. Relationship Between a Source's Implementation of Building Blocks 2 and 3 and Its Emissions
In this section, we discuss the relationship between an affected EGU's implementation of the measures in building blocks 2 and 3 and that affected EGU's own generation and emissions. As discussed above, an affected EGU subject to a CAA section 111(d) state plan that imposes an emission rate-based standard may achieve that standard in part by implementing the measures in building block 2 (for a steam generator) and building block 3 (for a steam generator or combustion turbine). That is, an affected EGU may invest in low- or zero-emitting generation and may apply credits from that generation against its emission rate. Those credits reduce the affected EGU's emission rate and thereby help it to achieve its emission limit.
In addition, the additional low- or zero-emitting generation that results from the affected EGU's investment will generally displace higher-emitting generation. This is because, as described above, higher-emitting generation generally has higher variable costs, reflecting its fuel costs, than, at least, zero-emitting generation. Displacement of higher-emitting generation will lower overall CO2
emissions from the source category of affected EGUs.
If an affected EGU implements building block 2 or 3 by reducing its own generation, it will reduce its own emissions. However, the affected EGU may also or alternatively choose to implement building block 2 or 3 by investing in lower- or zero-emitting generation that does not, in and of itself, reduce the amount of its own generation or emissions. Even so, implementation of building blocks 2 and 3 will reduce CO2
from some affected EGUs, and therefore reduce CO2
on a source category-wide basis.
This outcome is, however, consistent with the requirements of CAA section 111(d)(1) and (a)(1). To reiterate, CAA section 111(d)(1) requires that “any existing source” have a “standard of performance,” defined under CAA section 111(a)(1) as “a standard for emissions of air pollutants which reflects the degree of emission limitation achievable through the application of the best system of emission reduction . . . adequately demonstrated [BSER] . . . .” These provisions require by their terms that “any existing source” must have a “standard of performance,” but nothing in these provisions requires a particular amount—or, for that matter, any amount—of emission reductions from each and every existing source. That the “standard of performance” is defined on the basis of the “degree of emission limitation achievable through the application of the [BSER]” does not mean that each affected EGU must achieve some amount of emission reduction, for the following reasons.
The cornerstone of the definition of the term “standard of performance” is the BSER. In determining the BSER, the EPA must consider the amount of emission reduction that the system may achieve, and must consider the ability of the affected EGUs to achieve the emission limits that result from the application of the BSER. The EPA is authorized to include in the BSER, for this source category, the measures in building blocks 2 and 3 because, when applied to the source category, these measures result in emission standards that may be structured to ensure overall emission reductions from the source category and remain achievable by the affected EGUs. This remains so regardless of whether the “degree of emission limitation achievable through the application of the [BSER]” by any particular source results in actual emission reductions from that source.
The application of the building blocks has an impact that is similar to that of an emissions trading program, under which, overall, the affected sources reduce emissions, but any particular source does not need to reduce its emissions and, in fact, may increase its emissions, as long as it purchases sufficient credits or allowances from other sources. In fact, we expect that many states will carry out their obligations under this rule by imposing standards of performance that incorporate trading or other multi-entity generation-replacement strategies. Indeed, any emission rate-based standard may not necessarily result in emission reductions from any particular affected source (or even all of the affected sources in the category) as a result of the ability of the particular source (or even all of them) to increase its production and, therefore, its emissions, even while maintaining the required emission rate.
5. Reduced Generation and Implementation of the BSER
In the proposed rulemaking, we described the BSER as the measures included in building block 1 as well the set of measures included in building blocks 2, 3 and 4 or, in the alternative, reduced generation or utilization by the affected EGUs in the amount of building blocks 2, 3 and 4. In this final rule, based on the comments and further evaluation, we are refining our approach to the BSER. Specifically, we are determining the BSER as the combination of measures included in building blocks 1, 2, and 3.Building blocks 2 and 3 entail substitution of lower-emitting generation for higher-emitting generation, which ensures that aggregate production levels can continue to meet demand even where an individual affected EGU decreases its
( printed page 64780)
own output to reduce emissions. The amount of generation from the increased utilization of existing NGCC units determines a portion of the amount of reduced generation that affected fossil fuel-fired steam EGUs could undertake to achieve building block 2, and the amount of generation from the use of expanded lower- or zero-emitting generating capacity that could be provided, determines a portion of the amount of reduced generation that affected fossil fuel-fired steam EGUs, as well as the entire amount of reduced generation that affected NGCC units could undertake to implement building blocks 2 and 3. This section discusses the reasons that reduced generation is one of the set of reasonable and well-established actions that an affected EGU can implement to achieve its emission limits. We are not finalizing our proposal that reduced overall generation of electricity may by itself be considered the BSER, for the reason that reduced generation by itself does not fit within our historical and current interpretation of the BSER. Specifically, reduced generation by itself is about changing the amount of product produced rather than producing the same product with a process that has fewer emissions.
a.
Background.
As noted, for both rate-based and mass-based state plans, affected EGUs may take a set of actions to comply with their emission standards. An affected EGU may comply with an emission rate-based standard (
e.g.,
a limit on the amount of CO2
per MWh) by acquiring, through one means or another, credits from lower- or zero-emitting generation (building blocks 2 or 3) to reduce its emission rate for compliance purposes. In addition, the affected EGU may reduce its generation, and if it does so, it then needs to acquire fewer of those credits to meet its emission rate.[590]
Under these circumstances, the affected EGU would in effect replace part of its higher-emitting generation with lower- or zero-emitting generation. On the other hand, an affected EGU that is subject to a mass-based standard—for example, a requirement to hold enough allowances to cover its emissions (
e.g.,
one allowance for each ton of emissions in any year)—may comply at least in part by reducing its generation and, thus, its emissions. Therefore, one type of action that an affected EGU may take to achieve either of these emission limits is to reduce its generation. Further, reduced generation by individual sources offers a pathway to compliance in and of itself. That is, a state may adopt a mass-based goal, assign mass-based standards to its sources, and those sources may comply with their mass-based limits by, in addition to implementing building block 1 measures, reducing their generation in the appropriate amounts, and without taking any other actions.
b.
Well-established use of reduced generation to comply with environmental requirements.
Reduced generation is a well-established method for individual fossil fuel-fired power plants to comply with their emission limits.
Reduced generation in the amounts contemplated in this rule, as undertaken by individual sources to achieve their emission limits, reduces emissions from the affected sources, but because of the integrated and interconnected nature of the power sector, can be accommodated without significant cost or disruption. The electric transmission grid interconnects the nation's generation resources over large regions. Electric system operators coordinate, control, and monitor the electric transmission grid to ensure cost-effective and reliable delivery of power. These system operators continuously balance electricity supply and demand, ensuring that needed generation and/or demand resources are available to meet electricity demand. Diverse resources generate electricity that is transmitted and distributed through a complex system of interconnected components to end-use consumers.
The electricity system was designed to meet these core functions. The three components of the electricity supply system—generation, transmission and distribution—coordinate to deliver electricity from the point of generation to the point of consumption. This interconnectedness is a fundamental aspect of the nation's electricity system, requiring a complicated integration of all components of the system to balance supply and demand and a federal, state and local regulatory network to oversee the physically interconnected network. Electricity from a diverse set of generation resources such as natural gas, nuclear, coal and renewables is distributed over high-voltage transmission lines. The system is planned and operated to ensure that there are adequate resources to meet electricity demand plus additional available capacity over and above the capacity needed to meet normal peak demand levels. System operators have a number of resources potentially available to meet electricity demand, including electricity generated by electric generation units of various types as well as demand-side resources. Importantly, if generation is reduced from one generator, safeguards are in place to ensure that adequate supply is still available to meet demand. We describe these safeguards in the background section of this preamble.
Both Congress and the EPA have recognized reduced generation as one of the measures that fossil fuel-fired EGUs may implement to reduce their emissions of air pollutants and thereby achieve emission limits. Congress, in enacting the allowance requirements in CAA Title IV, under which fossil fuel-fired EGUs must hold an allowance for each ton of SO2
emitted, explicitly recognized that fossil fuel-fired EGUs could meet this requirement by reducing their generation. In fact, Congress anticipated that fossil fuel-fired EGUs may choose to comply with the SO2
emission limits by reducing utilization, and included provisions that specifically addressed reduced utilization. For example, CAA section 408(c)(1)(B) includes requirements for an owner or operator of an EGU that meets the Phase 1 SO2
reduction obligations and the NOX
reduction obligations “by reducing utilization of the unit as compared with its baseline or by shutting down the unit.”
The EPA has also recognized in several rulemakings limiting emissions from fossil fuel-fired EGUs that reduced generation is one of the methods of emission reduction that an EGU was expected to rely on to achieve its emission limitations. Examples include rulemakings to impose requirements that sources implement BART to reduce their emissions of air pollutants that cause or contribute to visibility impairment. As explained earlier, for certain older stationary sources that cause or contribute to visibility impairment, including fossil fuel-fired EGUs, states must determine BART on the basis of five statutory factors, such as costs and energy and non-air quality impacts.[591]
In 1980, the EPA promulgated a regulatory definition of BART: “an emission limitation based on the degree of reduction achievable through the best system of continuous emission reduction for each pollutant which is emitted by an existing stationary facility.” [592]
Both the statutory factors and the regulatory definition resemble the definition of the BSER under CAA section 111(a)(1)
( printed page 64781)
(although, as noted, the statutory definition of BART is more technology focused than the definition of BSER). In its regional haze SIP, the State of New York determined that BART for the NOX
emissions from two coal-fired boilers that served as peaking units was caps on baseline emissions rates and annual capacity factors of 5 percent and 10 percent, respectively.[593]
There have been numerous other instances in which fossil fuel-fired EGUs have reduced their individual generation, or placed limits on their generation, in order to achieve, or obviate, emission standards. In fact, there are numerous examples of EGUs that take restrictions on hours of operation in their permits for the purpose of avoiding CAA obligations, including avoiding triggering the requirements of the Prevention of Significant Deterioration (PSD), Nonattainment New Source Review (NNSR), or Title V programs (including Title V fees), and avoiding triggering HAP requirements. Such restrictions may also be taken to limit emissions of pollutants, such as limiting emissions of criteria pollutants for attainment purposes.
More specifically, EPA's regulations for a number of air programs expressly recognize that certain sources may take enforceable limits on hours of operation in order to avoid triggering CAA obligations that would otherwise apply to the source. Stationary sources that emit or have the
potential to emit
a pollutant at a level that is equal to or greater than specified thresholds are subject to major source requirements.[594]
A source may voluntarily obtain a synthetic minor limitation—that is, a legally and practicably enforceable restriction that has the effect of limiting emissions below the relevant level—to avoid triggering a major stationary source requirement.[595]
Such synthetic minor limits may be based on restrictions on the hours of operation, as provided in EPA's regulations defining “potential to emit,” as well as on air pollution control equipment. “Potential to emit” is defined, for instance, in the regulations for the PSD program for permits issued under federal authority as: “the maximum capacity of a stationary source to emit a pollutant under its physical and operational design. Any physical or operational limitation on the capacity of the source to emit a pollutant, including air pollution control equipment and
restrictions on hours of operation
. . . shall be treated as part of its design if the limitation or the effect it would have on emissions is federally enforceable,” [596]
or “legally and practicably enforceable by a state or local air pollution control agency.” [597]
The regulations for other air programs similarly recognize that potential to emit may be limited through restrictions on hours of operations in their corresponding definitions of “potential to emit.” [598]
These regulatory provisions make clear that restrictions on potential to emit include both “air pollution control equipment” and “restrictions on hours of operation,” and indicate that these are equally cognizable means of restricting emissions to comply with, or avoid, CAA requirements.[599]
As one of many examples of a fossil-fuel fired EGU taking restrictions on hours of operation for the purpose of avoiding CAA obligations, Manitowoc Public Utilities in Wisconsin obtained a Title V renewal permit that limited the operating hours of the single simple-cycle combustion turbine to not more than 194 hours per month, averaged over any consecutive 12 month period, as part of limiting its potential to emit for volatile organic compounds below the Title V threshold of 100 tpy, and carbon monoxide, NOX
and SO2
below the PSD threshold of 250 tpy.[600]
As another example, Sunbury Generation LP in Pennsylvania obtained a minor new source preconstruction permit, called a plan approval, for a repowering project from the Pennsylvania Department of Environmental Protection in 2013 that limited the hours of operation of three combined cycle combustion turbines that were planned for construction in order to remain below the significance threshold for GHGs.[601]
The Legal Memorandum includes numerous other examples of power plants accepting permit limits that reduce generation to meet, or avoid the need to meet, emission limits.
There are several ways that an affected EGU may implement reduced generation. For example, an EGU may accept a permit requirement that specifically limits its operating hours. In addition, an EGU may treat the cost of its generation as including an additional amount associated with environmental impacts, which requires it to raise its bid price, so that the EGU is dispatched less.
c.
Other aspects of reduced generation.
The amounts of increased existing NGCC generation and new renewables, in the amounts reflected in building blocks 2 and 3, can be substituted for generation at affected EGUs at reasonable cost. The NGCC capacity necessary to accomplish the levels of generation reduction proposed for building block 2 is already in operation or under construction. Moreover, it is reasonable to expect that the incremental resources reflected in building block 3 will develop at the levels requisite to ensure an adequate and reliable supply of electricity at the same time that affected EGUs may
( printed page 64782)
choose to reduce their CO2
emissions by means of reducing their generation.
Reduced generation by affected EGUs, in the amounts that affected EGUs may rely on to implement the selected building blocks, will not have adverse effects on the utility power sector and will not reduce overall electricity generation. In light of the emission limits of this rule, because of the availability of the measures in building blocks 2 and 3, and because the grid is interconnected and the electricity system is highly planned, reductions in generation by fossil fuel-fired EGUs in the amount contemplated if they were to implement the building blocks, and occurring over the lengthy time frames provided under this rule, will result in replacement generation that generally is lower- or zero-emitting. Mechanisms are in place in both regulated and deregulated electricity markets to assure that substitute generation will become available and/or steps to reduce demand will be taken to compensate for reduced generation by affected EGUs. As a result, reduced generation will not give rise to reliability concerns or have other adverse effects on the utility power sector and are of reasonable cost for the affected source category and the nationwide electricity system.[602]
All these results come about because the operation of the electrical grid through integrated generation, transmission, and distribution networks creates substitutability for electricity and electricity services, which allows decreases in generation at affected fossil fuel-fired steam EGUs to be replaced by increases in generation at affected NGCC units (building block 2) and allows decreases in generation at all affected EGUs to be replaced by increased generation at new lower- and zero-emitting EGUs (building block 3). Further, this substitutability increases over longer timeframes with the opportunity to invest in infrastructure improvements, and as noted elsewhere, this rule provides an extended state plan and source compliance horizon.
d.
Comments concerning limiting principles.
A commenter stated that “an interpretation of [`system of emission reduction'] that relies primarily on reduced utilization has no clear limiting principle.” [603]
We disagree with this concern, for the following reasons.
As discussed, in this final rule, we are identifying the BSER as the combination of the three building blocks. Building blocks 2 and 3 entail substitution of lower- or zero-emitting generation for higher-emitting generation, and one component of that substitution is reduced generation, which is limited in several respects discussed below. Accordingly, our identification of the BSER in this final rule does not “rel[y] primarily” on reduced utilization in and of itself (and therefore reduced generation of the product overall, electricity) as the BSER. Rather, the BSER is, in addition to building block 1, the substitution of lower- or zero-emitting generation for higher emitting generation, and reduced utilization may be a way to implement that substitution and is one of numerous methods that affected EGUs may employ to achieve or help achieve the emission limits established by these emission guidelines.[604]
The commenter's concerns over a perceived lack of a limiting principle cannot be taken to mean that reduced generation by higher-emitting EGUs cannot be considered to be a method for affected EGUs to achieve their emission limits.
Moreover, reduced generation, as applied to affected EGUs in this rule, is limited in a number of respects. The amount of reduced generation is the amount of replacement generation that is lower- or zero-emitting, that is of reasonable cost, that can be generated without jeopardizing reliability, and that meets the other requirements for the BSER. As discussed, that amount is the amount of generation in building blocks 2 and 3.[605]
Finally, as discussed, the integrated nature of the electricity system, coupled with the high substitutability of electricity, allows EGUs to reduce their generation without adversely affecting the availability of their product. Those characteristics facilitate replacement of generation that has been reduced, and for that reason, EGUs have a long history of reducing their generation and either replacing it directly or having it replaced through the operation of the interconnected electricity system through measures similar to those in building blocks 2 and 3. Thus, an EGU can either directly replace its generation, or simply reduce its generation, and in the latter case, the integrated grid, combined with the high degree of planning and various reliability safeguards, will result in entities providing replacement generation. This means that consumers receive exactly the same amount of the same product, electricity, after the reduced generation that they received before it. No other industry is both physically interconnected in this manner and manufactures such a highly substitutable product; as a result, the use of reduced generation is not easily transferrable to another industry.
6. Reasons That This Rule Is Within the EPA's Statutory Authority and Does Not Represent Over-Reaching
In this section, we respond to adverse comments that the EPA is overreaching in this rulemaking by attempting to direct the energy sector. These commenters construed the proposed rulemaking as the EPA proposing to mandate the implementation of the measures in the building blocks,
( printed page 64783)
including investment in RE and implementation of a broad range of state and utility demand-side EE programs. Commenters added that in some instances, the affected EGUs and states would have no choice but to take the actions in the building blocks because they would not otherwise be able to achieve their emission standards. Commenters also emphasized that with the proposed portfolio approach, the rule would impose federally enforceable requirements on a wide range of entities that do not emit CO2
and have not previously been subject to CAA regulation. Commenters cite the U.S. Supreme Court's statements in
Utility Air Regulatory Group
v.
EPA (UARG)[606]
that caution an agency against interpreting its statutory authority in a way that “would bring about an enormous and transformative expansion in [its] regulatory authority without clear congressional authorization,” and that add, “When an agency claims to discover in a long-extant statute an unheralded power to regulate `a significant portion of the American economy,' . . . we typically greet its announcement with a measure of skepticism.” [607]
Commenters assert that in this rule, the EPA is taking the actions that the
UARG
opinion cautioned against. For the reasons discussed below, these comments are incorrect and misunderstand fundamental aspects of this rule. In addition, to the extent these comments address either building block 4 or the portfolio approach they are moot, because the EPA is not finalizing those elements of the proposal.
In this rule, the EPA is following the same approach that it uses in any rulemaking under CAA section 111(d), which is designed to regulate the air pollutants from the source category at issue. First, the EPA identifies the BSER to reduce harmful air pollution. Second, based on the BSER, the EPA promulgates emission guidelines, which generally take the form of emission rates applicable to the affected sources. In this case, the EPA is promulgating a uniform CO2
emission performance rate for steam-generating EGUs and a uniform CO2
emission performance rate for combustion turbines, and the EPA is translating those rates into a combined emission rate and equivalent mass limit for each state. These emission guidelines serve as the guideposts for state plan requirements. The states, in turn, promulgate standards of performance and, in doing so, retain significant flexibility either to promulgate rate-based emission standards that mirror the emission performance rates in the guidelines, promulgate rate-based emission standards that are equivalent to the emission performance rates in the guidelines, or promulgate equivalent mass-based emission standards. The sources, in turn, are required to comply with their emission standards, and may do so through any means they choose. Alternatively, the state may adopt the state-measures approach, which provides additional flexibility.
Thus, the EPA is not requiring that the affected EGUs take any particular action, such as implementation of the building blocks. Rather, as just explained, the EPA is regulating the affected EGUs' emissions by requiring that the state submit state plans that achieve specified emission performance levels. The states may choose from a wide range of emission limits to impose on their sources, and the sources may choose from a wide range of compliance options to achieve their emission limits. Those options include various means of implementing the building blocks as well as numerous other compliance options, ranging from—depending in part on whether the state imposes a rate-based or mass-based emission limit—implementation of demand-side EE measures to natural gas co-firing.[608]
As some indication of the diverse set of actions we expect to comply with the requirements of this rule, we note that demand-side EE programs, in particular, are expected to be a significant compliance method, in light of their low costs. In addition, the National Association of Clean Air Agencies (NACAA) has issued a report that provides a detailed discussion of 25 approaches to CO2
reduction in the electricity sector.[609]
In addition, we note that the nine RGGI states—Connecticut, Delaware, Maine, Maryland, Massachusetts, New Hampshire, New York, Rhode Island and Vermont—have indicated that they intend to maintain their current state programs, which this rule would allow, and there are reports that other states may seek to join RGGI.[610]
Similarly, California has indicated that it intends to maintain its current state program, which this rule would allow. Other states could employ the types of methods used in Oregon, Washington, Colorado, or Minnesota, described in the background section of this preamble.
As a practical matter, we expect that for some affected EGUs, implementation of the building blocks will be the most attractive option for compliance. This does not mean, contrary to the adverse comments noted above, that this rule constitutes a redesign of the energy sector. As discussed above, the building blocks meet the criteria to be part of the best system of emission reduction . . . adequately demonstrated. The fact that some sources will implement the building blocks and that this may result in changes in the electricity sector does not mean that the building blocks cannot be considered the BSER under CAA section 111(d).
In this rule, as with all CAA section 111(d) rules, the EPA is not directly regulating any entities. Moreover, the EPA is not finalizing the proposed portfolio approach. Accordingly, the EPA is neither requiring nor authorizing the states to regulate non-affected EGUs in their CAA section 111(d) plans.[611]
Moreover, contrary to adverse comments, this rule does not require the states to adopt a particular type of energy policy or implement particulate types of energy measures. Under this rule, a state may comply with its obligations by adopting the emission standards approach to its state plan and imposing rate-based or mass-based emission standards on its affected EGUs. In this manner, this rule is consistent with prior section 111(d) rulemaking actions, in which the states have complied by promulgating one or both of those types of standards of performance. In this rulemaking, as an alternative, the state may adopt the state measures approach, under which the state could, if it wishes, adopt particular types of energy measures that would lead to reductions in emissions from its EGUs. But again, this rule does not require the state to implement a
( printed page 64784)
particular type of energy policy or adopt particular types of energy measures.
It is certainly reasonable to expect that compliance with these air pollution controls will have costs, and those costs will affect the electricity sector by discouraging generation of fossil fuel-fired electricity and encouraging less costly alternative means of generating electricity or reducing demand. But for affected EGUs, air pollution controls necessarily entail costs that affect the electricity sector and, in fact, the entire nation, regardless of what BSER the EPA identifies as the basis for the controls. For example, had some type of add-on control such as CCS been identified as the BSER for coal-fired EGUs, sources that complied by installing that control would incur higher costs. As a result, generation from coal-fired EGUs would be expected to decrease and be replaced at least in part by generation from existing NGCC units and new renewables because those forms of generation would see their competitive positions improved.
This basic fact that EPA regulation of air pollutants from affected EGUs invariably affects the utility sector is well-recognized and in no way indicates that such regulation exceed the EPA's authority. In revising CAA section 111 in the 1977 CAA Amendments, Congress explicitly acknowledged that the EPA's rules under CAA section 111 for EGUs would significantly impact the energy sector.[612]
The Courts have recognized that, too. The U.S. Supreme Court, in its 2011 decision that the CAA and the EPA actions it authorizes displace any federal common law right to seek abatement of CO2
emissions from fossil fuel-fired power plants, emphasized that CAA section 111 authorizes the EPA—which the Court identified as the “expert agency”—to regulate CO2
emissions from these sources in a manner that balances “our Nation's energy needs and the possibility of economic disruption:”
The appropriate amount of regulation in any particular greenhouse gas-producing sector cannot be prescribed in a vacuum: As with other questions of national or international policy, informed assessment of competing interests is required. Along with the environmental benefit potentially achievable, our Nation's energy needs and the possibility of economic disruption must weigh in the balance.
The [CAA] entrusts such complex balancing to EPA in the first instance, in combination with state regulators. Each “standard of performance” EPA sets must “tak[e] into account the cost of achieving [emissions] reduction and any nonair quality health and environmental impact and energy requirements.” § 7411(a)(1), (b)(1)(B), (d)(1); see also 40 CFR 60.24(f) (EPA may permit state plans to deviate from generally applicable emissions standards upon demonstration that costs are “[u]n-reasonable”). EPA may “distinguish among classes, types, and sizes” of stationary sources in apportioning responsibility for emissions reductions. § 7411(b)(2), (d); see also 40 CFR 60.22(b)(5). And the agency may waive compliance with emission limits to permit a facility to test drive an “innovative technological system” that has “not [yet] been adequately demonstrated.” § 7411(j)(1)(A). The Act envisions extensive cooperation between federal and state authorities, see § 7401(a), (b), generally permitting each state to take the first cut at determining how best to achieve EPA emissions standards within its domain, see § 7411(c)(1), (d)(1)-(2).
It is altogether fitting that Congress designated an expert agency, here, EPA, as best suited to serve as primary regulator of greenhouse gas emissions. The expert agency is surely better equipped to do the job than individual district judges issuing ad hoc, case-by-case injunctions.[613]
Similarly, the D.C. Circuit, in its 1981 decision upholding the EPA's rules to reduce SO2
emissions from new coal-fired EGUs under the version of CAA section 111(b) adopted in the 1977 CAA Amendments, stated:
[S]ection 111 most reasonably seems to require that EPA identify the emission levels that are “achievable” with “adequately demonstrated technology.” After EPA makes this determination, it must exercise its discretion to choose an achievable emission level which represents the best balance of economic, environmental, and energy considerations. It follows that to exercise this discretion EPA must examine the effects of technology on the grand scale in order to decide which level of control is best. . . . The standard is, after all, a national standard with long-term effects.[614]
The D.C. Circuit added: “Regulations such as those involved here demand a careful weighing of cost, environmental, and energy considerations. They also have broad implications for national economic policy.” [615]
This rule has “economic, environmental, and energy” impacts, as Congress and the Courts expect in a CAA section 111 rule, but those impacts do not mean that the EPA is precluded from promulgating the rule.
As noted above, in this rule, to control CO2
emissions from affected EGUs, the EPA first considered more traditional air pollution control measures, including supply-side efficiency improvements, fuel-switching (for CO2
emissions, that entails co-firing with natural gas), and add-on controls (for CO2
emissions, that entails CCS). However, it became apparent that even if the EPA could have finalized those controls as the BSER [616]
and established the same uniform CO2
emission performance rates, the affected EGUs would rely on less expensive ways to achieve their emission limits. Specifically, instead of relying on co-firing and CCS, the affected EGUs generally would replace their generation with lower- or zero-emitting generation—the measures in building blocks 2 and 3—because those measures are significantly less expensive and already well-established as pollution control measures. Indeed, some affected EGUs have stated that while they oppose including in the BSER generation shifts to lower- or zero-emitting sources (or, as proposed, demand-side EE), they request that those measures be available for compliance, which indicates their
( printed page 64785)
interest in implementing those measures.[617]
We expect that many sources will choose to comply with their emission limits through the measures in building blocks 2 and 3, but contrary to the assertions of some commenters, this will not result in unprecedented and fundamental alterations to the energy sector. As discussed above, Congress relied on the same measures as those the EPA is including in building blocks 2 and 3 as essential parts of the basis for the Title IV emission limits for fossil fuel-fired EGUs, and the EPA did the same for the emission limits in various rules for those same sources.
In addition, reliance on the measures in building blocks 2 and 3 is fully consistent with the recent changes and current trends in electricity generation, and as a result, would by no means entail fundamental redirection of the energy sector. As indicated in the RIA for this rule, we expect that the main impact of this rule on the nation's mix of generation will be to reduce coal-fired generation, but in an amount and by a rate that is consistent with recent historical declines in coal-fired generation. Specifically, from approximately 2005 to 2014, coal-fired generation declined at a rate that was greater than the rate of reduced coal-fired generation that we expect to result from this rulemaking from 2015 to 2030. In addition, under this rule, the trends for all other types of generation, including natural gas-fired generation, nuclear generation, and renewable generation, will remain generally consistent with what their trends would be in the absence of this rule. In addition, this rule is expected to result in increases in demand-side EE.
In addition, contrary to claims of some commenters, in this rule, the EPA is not attempting to expand its authorities by attempting to expand the jurisdiction of the CAA to previously unregulated sectors of the economy, in contravention of the
UARG
decision. In
UARG,
the U.S. Supreme Court struck down the EPA's interpretation of the PSD provisions of the CAA because the interpretation had the effect of applying the PSD requirements to large numbers of small sources that previously had not been subject to PSD, and because, according to the Court, the EPA acknowledged that Congress did not intend that such sources be subject to the PSD requirements.[618]
Commenters appear to interpret this decision to preclude the EPA from including at least building block 3 in the BSER because it includes measures that involve entities (such as RE developers) that do not emit CO2
and have not previously been subject to the CAA. However, in this rule, the EPA is not attempting to subject any entity other than the affected EGUs in the source category to CAA section 111 requirements. As discussed below, the EPA is not finalizing the proposed portfolio approach, under which states were authorized to include, in their CAA section 111(d) state plans, federally enforceable requirements on entities other than affected EGUs. Thus, as noted above, this final rule does not require or authorize the states to include entities other than affected EGUs in their CAA section 111(d) state plans, and as a result, those entities will not come under CAA jurisdiction [619]
and the parts of the economy that they represent will not be regulated by the EPA.
7. Relative Stringency of Requirements for Existing Sources and New, Modified, and Reconstructed Sources
Commenters also objected that the proposed CAA section 111(d) standards are more stringent than the standards for new, modified or reconstructed sources, and they assert that setting CAA section 111(d) standards that are more stringent than CAA section 111(b) standards would be illogical, contrary to precedent, contrary to the intent of the remaining useful life exception, and arbitrary and capricious.[620]
We disagree with these comments. Comparing the control requirements of the two sets of rules, CAA section 111(d) and 111(b), is an “apples-to-oranges” comparison and, as a result, it is not possible—and it is overly simplistic—to conclude that the CAA section 111(d) requirements are more stringent than the CAA section 111(b) requirements.
Most importantly, the two sets of rules become applicable at different points in time and have significantly different compliance periods. The CAA section 111(b) rule becomes applicable for new, modified and reconstructed sources immediately upon construction, modification, or reconstruction and, in fact, by operation of CAA section 111(e) and (a)(2), new, modified, or reconstructed sources that commenced construction prior to the effective date of the CAA section 111(b) rule must also be in compliance upon the effective date of the rule. In contrast, the requirements under the CAA section 111(d) rule do not become applicable to existing affected EGUs until seven years after promulgation of the rule, when the interim compliance period begins in 2022, and the final compliance period does not begin until 2030. Moreover, the compliance period for the interim requirements is eight years. This later applicability date and longer compliance period for existing sources accommodates a requirement that, on average, those sources have a lower nominal emission limit than the standards for new or modified sources, which those latter sources must comply with immediately.
In addition, the timetables for compliance with the CAA section 111(b) and 111(d) rules should be considered in light of the 8-year review schedule required for CAA section 111(b) rules under CAA section 111(b)(1)(B). Under CAA section 111(b)(1)(B), the EPA is required to “review and, if appropriate, revise” the CAA section 111(b) standards “at least every 8 years.” This provision obligates the EPA to review the CAA section 111(b) rule for CO2
emissions from new, modified, and reconstructed power plants by the year 2023. That mandatory review will reassess the BSER to determine the appropriate stringency for emission standards for new, modified, and reconstructed sources into the future. Therefore, for present purposes of comparing the stringency of the CAA section 111(b) and 111(d) rules, the year 2023 presents an important point of comparison.
Specifically, as noted above, the CAA section 111(b) standards apply to new, modified and reconstructed sources beginning in 2015, while the CAA section 111(d) rule does not take effect until 2022, which happens to fall on the cusp of the 8-year review for the CAA section 111(b) standards.
Even after the section 111(d) rule takes effect in 2022, the flexibility that this rule offers the states has important implications for its stringency and for any comparison to the CAA section 111(b) rule. Although the requirements for the CAA section 111(d) rule begin in 2022, they are phased in, in a flexible manner, over the 2022-2030 period. That is, states are required to meet interim goals for the 2022-2029 period by 2029, and the final goals by 2030, but states are not required to impose requirements on their sources that take
( printed page 64786)
effect in 2022. In fact, states may, if they prefer, impose business-as-usual emission standards on their sources that do not require emission reductions in 2022 and apply emission standards on their sources that do require emission reductions and that take effect no earlier than 2023. Moreover, because emission standards may have an annual compliance period, the states may allow their sources to delay having to comply with any emission reduction requirements until the end of 2023.[621]
Therefore, while the CAA section 111(b) standards apply to new, modified, and reconstructed sources beginning in 2015, the CAA section 111(d) standards may not apply to existing sources until 2023. As a result, by 2023—the year that the CAA section 111(b) standards are required to be reviewed for possible revision—affected EGUs subject to the CAA section 111(d) standards may remain uncontrolled. Under those circumstances, the CAA section 111(d) rule cannot be said to be more stringent than the CAA section 111(b) rule.[622]
Another reason why the section 111(d) rule cannot be said to be more stringent than the section 111(b) rule is that for any individual source, the section 111(d) rule is applied more flexibly and includes more flexible means of compliance. Whereas the CAA section 111(b) rule entails an emission rate that each affected EGU must meet on a 12-month (rolling) basis, the CAA section 111(d) is more flexible. For example, states may adopt the state measures approach and refrain from imposing any requirements on their affected EGUs. In addition, under the CAA section 111(d) rule, sources have more flexible means of compliance. For an emission standards approach, depending on the form of the state requirements (mass-based or rate-based), the state may be expected to authorize trading of mass-based emission allowances or rate-based emission credits, and in addition, the purchase of ERCs. These flexibilities are not included in the CAA section 111(b) rule, rather, as noted, each new, modified, and reconstructed EGU must individually meet its emission standard on a 12-month (rolling) basis. The EPA has frequently required that sources meet a more stringent nominal limit when they are allowed compliance flexibility, particularly, the opportunity to trade.[623]
In addition, states have the discretion to allow their sources to meet emission standards over a longer time period. This distinction between the two rules is another reason why the CAA section 111(d) rule cannot be said to be more stringent in fact than the CAA section 111(b) rule.
There are other reasons why the CAA section 111(d) rule cannot be said to be more stringent. With respect to the CAA section 111(d) and 111(b) rules for existing and new NGCC units, we note the following: As explained in the CAA section 111(b) preamble, the standard for new NGCC units is designed to accommodate a wide range of unit types, including small units and rapid-start units, which are a small part of the expected new NGCC generation capacity. As such, the CAA section 111(b) standard (1,000 lb CO2
/MWh gross, which equates to 1,030 lb CO2
/MWh net) will not constrain the emissions of the great majority of expected new NGCC generation capacity, which is expected to consist of larger base load units (with a capacity of 100 MW or greater) that are not intended to cycle frequently. Their initial emissions are expected to be below 800 lb. CO2
/MWh gross, their emissions over time may be somewhat higher due to equipment deterioration, and as a result, their PSD permits are expected to include emission limits at approximately the 800 lb. CO2
/MWh gross level. A very small amount of the new NGCC generation is expected to be small units (with a capacity of approximately 25 MW) or rapid-start units. Their initial emissions are expected to be approximately 950 lb. CO2
/MWh gross, their emissions over time are expected to be somewhat higher due to equipment deterioration, and it these units that the standard of 1,000 lb. CO2
/MWh gross is designed to constrain.[624]
As a result, the 1,000 lb. CO2
/MWh gross limit applies to all new NGCC units, including the great majority of the expected new capacity consisting of larger, non-rapid start units, even though, as just noted, the great majority of the units are expected to emit at significantly lower emission rates. The CAA section 111(d) standard for existing sources, in contrast, is generally expected to constrain existing NGCC units on average. Moreover, very little of the existing NGCC generation includes small units or, in particular, rapid-start units because the latter are a recently developed technology. To some extent, the same is true for the 111(b) standard for reconstructed NGCC units. The average NGCC rate was approximately 850 lb CO2
/MWh gross in 2014 and, as a result, most sources are emitting below the CAA section 111(b) standard for reconstructed sources. For these reasons, too, the CAA section 111(b) standards for new and reconstructed NGCC units cannot be compared to the 111(d) standards for existing NGCC units.[625]
Moreover, even if commenters were correct that the CAA section 111(d) requirements for existing sources are more stringent than the CAA section 111(b) requirements for new sources, that would not, by itself, call into question the reasonableness of either standard. The stringency of the requirements for each source subcategory is, of course, a direct function of the BSER identified for that source subcategory. In this rulemaking, we explain the basis for the BSER for existing sources, and why we do not include certain measures, such as CCS; and in the CAA section 111(b) rulemaking, we explain the basis for the
( printed page 64787)
BSER for new sources, and why we do not include certain measures, such as the building blocks. As long as the BSER determination is reasonable and the resulting emission limits meet other applicable requirements, those emission limits are valid, even if the one for new sources is less stringent than the one for existing sources. No provision in section 111, nor any statement in its legislative history, nor any of its case law, indicates that the standards for new sources must be more stringent than the standards for existing sources.
C. Building Block 1—Efficiency Improvements at Affected Coal-Fired Steam EGUs
The first category of approaches to reducing CO2
emissions at affected fossil fuel-fired EGUs consists of measures that improve heat rate at coal-fired steam EGUs. Heat rate improvements are changes implemented at an EGU that increase the efficiency with which the EGU converts fuel energy to electric energy, thereby reducing the amount of fuel needed to produce the same amount of electricity and consequently lowering the amount of CO2
produced as a byproduct of fuel combustion. Heat rate improvements yield important economic benefits to affected EGUs by reducing their fuel costs.
An EGU's heat rate is the amount of fuel energy input needed (Btu, higher heating value basis) to produce 1 kWh of net electrical energy output.[626]
In 2012, the generation-weighted average annual heat rate of the 884 coal-fired EGUs included in EPA's building block 1 analysis was approximately 9,732 Btu per gross kWh.[627]
Because an EGU's CO2
emissions are driven primarily by the amount of fuel consumed, improving (
i.e.,
decreasing) heat rate at a coal-fired EGU inherently reduces the carbon-intensity of generation.
As discussed above in section V.A and in the June 2014 proposal,[628]
it is critical to recognize that affected coal-fired EGUs operate in the context of the integrated electricity system. Because of this reality, applying building block 1 in isolation can result in a “rebound effect” that undermines the emissions reductions otherwise achieved by heat rate improvements. As already noted, the building block 1 measures described below cannot by themselves constitute the BSER because the quantity of emission reductions achieved—which is a factor that the courts have required EPA to consider in determining the BSER—would be of insufficient magnitude in the context of this pollutant and this industry. The potential rebound effect, if it occurred, would exacerbate the insufficiency of the emission reductions. However, applying building block 1 in combination with other building blocks can address this concern for the reasons stated in section V.A.4.
We conducted several analyses to assess the potential for heat rate improvements from the coal-fired EGU fleet. As in the proposal, we employed a unit-specific approach that compared each EGU's performance against its own historical performance in lieu of directly comparing an EGU's performance against other EGUs with similar characteristics. Accordingly, as described below, our method effectively controls for the characteristics and factors of an EGU that typically remain constant over time (
e.g.,
a unit is unlikely to dramatically increase or decrease in size). Our methodology for determining the amount of heat rate improvement appropriately included in the BSER as building block 1 is discussed in the next section, below.
1. Summary of Measures Comprising the BSER in Building Block 1
a.
Measures under building block 1—heat rate improvements.
In finalizing the building block 1 portion of this rule, we considered over a thousand individual comments from the public, including individual EGUs and state agencies, on heat rate improvement, which are discussed below and also in the responses to comments document and the GHG Mitigation Measures TSD for the CPP Final Rule. Based on these public comments, we have refined the statistical analyses used in the proposal to identify the potential heat rate improvement that can be achieved on average by affected coal-fired EGUs.
In the proposal, we used two approaches to analyze the variability of an EGU's gross heat rate using a robust dataset comprised of 11 years of hourly gross heat rate data for 884 coal-fired EGUs—over 11 million hours of data collected between 2002 and 2012. The foundation of our first approach was an analysis of the variability of each EGU's gross heat rate, which was accomplished in large part by grouping each EGU's hourly data by similar ambient temperature and capacity factor (
i.e.,
hourly operating level as a percentage of nameplate capacity) conditions. The second approach analyzed the difference between an EGU's average gross heat rate and its best historical gross heat rate performance. We proposed that, on a nationwide basis, affected coal-fired EGUs should be able to achieve 6-percent heat rate improvement: 4-percent improvement from best practices, and an additional 2-percent improvement from equipment upgrades.
We received many comments asserting that the 11-year dataset we had used to determine the 4-percent best practices figure likely reflected some portion of the 2-percent equipment upgrades figure we had separately identified. Accordingly, these commenters claim that the EPA double-counted equipment upgrades in arriving at the full estimate of 6-percent heat rate improvement. Commenters also noted the difficulty, in some cases, of determining whether a heat rate improvement measure is an “equipment upgrade” or “best practice,” such as optimizing soot blowing with intelligent systems, using CO monitors for optimizing combustion, or applying air heater and duct leakage controls.
As noted below in sections V.C.1.b and V.C.3, the EPA acknowledges that some equipment upgrades implemented by EGUs during the 11-year study period are reflected in the hourly heat rate data. Therefore, we made two refinements to our analyses of heat rate improvement potential. First, we refined our statistical approaches to use each EGU's gross heat rate from 2012—the final year of the 11-year study period—as the baseline for calculating heat rate improvement potential. By comparing each EGU's best historical gross heat rate with its 2012 gross heat rate, our analyses account for the enduring effects on heat rate of any equipment upgrades or best practices that an EGU implemented during the study period. Heat rate improvement measures that an EGU maintains in 2012 are reflected in that baseline, and thus are not treated as evidence that the EGU can further improve heat rate. Additionally, in part because of limitations on the information available to us regarding which equipment upgrades have been or could be implemented at individual EGUs, as well concerns about double-counting, we have conservatively decided not to add a separate equipment upgrade component to our estimate of heat rate improvement potential. Nonetheless, we remain confident that additional equipment upgrades
( printed page 64788)
(including measures that are unambiguously equipment upgrades, such as turbine overhauls) are possible at many coal-fired EGUs, as supported by numerous commenters, the Sargent & Lundy study [629]
(S&L) and other industry reports and studies. Many of these reports and studies are referenced in the TSD developed for the proposed rule, as well as in the GHG Mitigation Measures TSD supporting the final CPP.
Several commenters criticized the fact that the proposal assessed potential heat rate improvement on a nationwide basis. These commenters suggested instead that we narrow the geographic scope of our analysis, generally identifying a state-by-state approach as a preferred alternative. In light of commenters' concerns about using a single nationwide approach, as well as for reasons described in Section V.A and elsewhere in this preamble, the final rule assesses potential heat rate improvement regionally, within the Eastern, Western and Texas Interconnections.[630]
For the final rule, we performed several analyses to determine what heat rate improvement was achievable in each interconnection from best practices and equipment upgrades. As in the proposal, these analyses used the 11-year dataset of EGU hourly gross heat rate data from 2002 to 2012. As discussed further in the GHG Mitigation Measures TSD, our reliance on these gross heat rate data was reasonable given that (1) these data are the only comprehensive data available to the EPA, and (2) heat rate is proportional to CO2
emission rate.
As in the proposal, we used more than one analytical method to evaluate the opportunity for EGUs to reduce their CO2
emissions through heat rate improvements. Our final methodology uses three different analytical approaches based on refinements of the two approaches described at the proposal stage. We call these final approaches: (1) The “efficiency and consistency improvements under similar conditions” approach; (2) the “best historical performance” approach; and (3) the “best historical performance under similar conditions” approach. As described below and in the GHG Mitigation Measures TSD, each approach provides an independently reasonable way to estimate the potential for heat rate improvements by EGUs in each region. However, rather than select a potential heat rate improvement value supported by one or only some of these independently reasonable analytical approaches, we conservatively based our final determination for each region on the value for that region supported by all three approaches.
The “efficiency and consistency improvements under similar conditions” approach is a slight refinement of an approach discussed at length in the proposal. As in the proposal, we distributed each hour of gross heat rate data for each EGU into a matrix comprised of 168 bins, based on the ambient temperature and hourly capacity factor of the EGU at the time that hour of gross heat rate data was generated. Each bin represented a 10-degree Fahrenheit (°F) range in ambient temperature (from −20 °F to greater than 110 °F), and a 10-percent range in capacity factor (from 0 percent to greater than 110 percent [631]
). Thus, for example, one bin would contain all of an EGU's hourly gross heat rate data generated during the 11-year study period while that EGU was operating at 80- to 89-percent capacity while ambient temperatures were between 70 °F and 79 °F.
As we explained at proposal and as discussed further in the GHG Mitigation Measures TSD, ambient temperature and hourly capacity factor are important conditions that influence heat rate at individual EGUs. By separating the EGU-specific data into bins based on these variables, and only directly comparing data within a bin, we were largely able to control for the influence of those variables on an EGU's heat rate. Accordingly, having controlled for these two external factors, and having already controlled for unit-specific factors affecting heat rate by analyzing the data for each EGU in isolation, we are confident that the remaining variation in each bin's data was primarily driven by factors under the EGU operator's control.
After allocating an individual EGU's data across the bins, we next established a benchmark for each bin based on the best hourly gross heat rate accounting for outliers (
i.e.,
we set the benchmark at the 10th percentile hourly gross heat rate value) during any consecutive two-year period.[632]
We compared the hourly gross heat rate data within each bin to the EGU's benchmark value. Similar to the proposal, within each bin we assessed the effect on heat rate of improving the consistency of that EGU by reducing hourly gross heat rate values that were greater than the benchmark by a percentage of the distance between each of those higher hourly values and the benchmark.[633]
We refer to this percentage improvement value as the “consistency factor,” because applying it results in values for heat rate that are more consistent with the EGU's benchmark for that bin. In our proposal we evaluated the heat rate improvement that would result from applying consistency factors of 10, 20, 30, 40 and 50 percent of the distance between those less-efficient hourly gross heat rate values and the benchmark; using engineering judgment, we selected a consistency factor of 30 percent, which produced results comparable to those obtained using other approaches for analyzing heat rate. For our final analysis under this approach, we refined the consistency factor based on a statistical assessment of the overall variability of heat rate in that EGU's region, as described in the GHG Mitigation Measures TSD.[634]
As in the proposal, we applied the consistency factor to each bin of each EGU's hourly gross heat rate data, and averaged the result across all bins in that EGU's matrix. The net result was an improved gross heat rate reflecting what that EGU would have achieved between 2002 and 2012 if, under certain ambient temperature and capacity factor conditions, the EGU had improved its gross heat rate during less-efficient hours to be slightly more consistent with the relevant benchmark value. We then compared the improved gross heat rate for each EGU to its actual 2012 historical average gross heat rate. We
( printed page 64789)
chose 2012 as the year of comparison because 2012 was the latest year for which the EPA had data at the time of the proposal, and because using the most recent data reflects the EGU's current operating level and accounts for improvements the EGU may have undertaken over the 11-year study period.
Applying this procedure to all units in our database and averaging the generation-weighted results, we determined that it would be reasonable to conclude that, through application of best practices and equipment upgrades, EGUs on average are at least capable of reducing their CO2
emissions by improving heat rate 4.3 percent in the Eastern Interconnection, 2.1 percent in the Western Interconnection, and 2.3 percent in the Texas Interconnection.[635]
In addition to the statistical approach described above, we employed a “best historical performance” approach refined from the proposal, which compared each EGU's best two-year rolling average gross heat rate to that EGU's 2012 average annual gross heat rate.[636]
We then calculated the differences across all EGUs in a region to determine the potential heat rate improvement that would result if, in 2012, each EGU had performed at the best two-year rolling average gross heat rate that the EGU achieved between 2002 and 2012. Under this analysis of historical gross heat rate, we determined that it would be reasonable to conclude that the average heat rate improvement potential from best practices and equipment upgrades is at least 4.9 percent in the Eastern Interconnection, 2.6 percent in the Western Interconnection and 3.1 percent in the Texas Interconnection.[637]
Finally, we employed the “best historical performance under similar conditions” approach, which combines aspects of the other two approaches. First, as with the “efficiency and consistency improvements under similar conditions approach,” we grouped hourly data for each EGU by ambient temperature conditions and hourly capacity factor. Next, we calculated each EGU's best two-year gross heat rate for each of the 168 ambient temperature-capacity factor bins.[638]
Similar to the “best historical performance” approach, to calculate the potential heat rate improvement, the EPA then compared each EGU's 2012 gross heat rate for each of the ambient temperature-capacity factor bins to the EGU's best two-year gross heat rate for the corresponding bin. Accounting for differences in ambient temperature and capacity factor, we determined that under this analytical approach the average heat rate improvement potential from best practices and equipment upgrades was at least 5.3 percent in the Eastern Interconnection, 3.1 percent in the Western Interconnection and 3.5 percent in the Texas Interconnection.[639]
As in the proposal, we additionally analyzed the data with our analytical approaches using one-year averaging periods in place of the two-year averaging periods described above.[640]
However, because our conservative overall methodology adopts the lowest value that is identified for a region by any of our reasonable analytical approaches, the inherently less conservative results obtained with one-year averaging periods (reproduced below) could not influence the outcome of our methodology as a whole. Overall, applying these three analytical approaches resulted in six heat rate improvement values generated for each region, each of which represents a reasonable estimate of the potential for heat rate improvements by EGUs in that region. Those values ranged from 4.3 to 6.9 percent in the Eastern Interconnection, from 2.1 to 4.7 percent in the Western Interconnection, and from 2.3 to 4.9 percent in the Texas Interconnection. In all three regions, the most conservative values were generated using the “efficiency and consistency improvements under similar conditions” approach with two-year averaging periods and consistency factors. As shown in Table 6, the values produced by that approach were the minimum values for each region produced by any of the three approaches:
Table 6—Heat Rate Improvement Potential by Region and Averaging Period
Analytical approach
Heat rate improvement potential (percent)
by region and averaging period
Western
Texas
Eastern
1 year
2 year
1 year
2 year
1 year
2 year
Efficiency and consistency improvements under similar conditions
3.5
2.1
3.7
2.3
5.6
4.3
Best historical performance
4.1
2.6
4.2
3.1
6.3
4.9
Best historical performance under similar conditions
4.7
3.1
4.9
3.5
6.9
5.3
Accordingly, we have concluded that a well-supported and conservative estimate of the potential heat rate improvements (and accompanying reductions in CO2
emission rates) that EGUs can achieve on average through best practices and equipment upgrades is a 4.3-percent improvement in the Eastern Interconnection, a 2.1-percent improvement in the Western Interconnection and a 2.3-percent improvement in the Texas Interconnection. The decision to use these values as the building block 1 potential in each region is based on the weight of evidence that these are conservative values; for each region, each of the three analytical approaches in our methodology supports our determination that the heat rate improvement value we selected is
( printed page 64790)
achievable. Taken individually, each approach provides an independently reasonable estimate of the potential for heat rate improvement. Furthermore, as described in the GHG Mitigation Measures TSD, these approaches are conservative on even an individual basis because they do not account for the full extent of heat rate improvements available through additional equipment upgrades and best practices. Some EGUs may have faced difficulties achieving significant heat rate improvement in the past and EGU owners may feel they face challenges in the future. Nevertheless, our methodology as a whole indicates that, on average, coal-fired EGUs can at least achieve the percentage heat rate improvement selected for their region through application of best practices and some of the available equipment upgrades. A more detailed discussion of the EPA's analysis in determining the heat rate improvement potential for existing coal-fired EGUs may be found in the GHG Mitigation Measures TSD supporting the final CPP.
No affected coal-fired EGU is specifically required to improve heat rate by any amount as a result of this rule. Rather, as described in section VI, the potential for heat rate improvement is used to determine a CO2
emission performance rate. Those affected EGUs that have done the most to reduce their heat rate will tend to be closer to that CO2
emission rate. In this sense, our approach to determining potential CO2
reductions through heat rate improvements is similar to the way EPA ordinarily approaches standards of performance.[641]
In this final analysis, we do not delineate what proportion of the potential heat rate improvement can be expected from equipment upgrades versus best practices; [642]
only that these heat rate improvements are achievable in the regions through a combination of these methods. As discussed in section V.C.3 below, we believe that a single heat rate improvement goal for each region incorporating both best practices and upgrades, based on the 11 years of hourly heat rate data for 884 coal-fired EGUs available to the EPA, is a reasonable approach that is supported by our analysis, and is particularly conservative given that it does not account for the full range of heat rate improvements achievable through additional equipment upgrades and best practices.
The performance rates quantified in section VI, below, reflect the region-specific values for heat rate improvement. Although the performance rates are based on the least stringent overall performance rate determined to be reasonable for any region, and are thus based in part on the percentage heat rate improvement identified for the region, this rule does not itself require any specific EGU to implement measures resulting in a specific percentage heat rate improvement. Rather, the percentage heat rate improvement value is merely reflected in the CO2
emission performance rates and corresponding mass-based and rate-based state goals. Each state has the flexibility to develop a plan that achieves those CO2
performance rates or emission goals by assigning the emission standards the state considers appropriate to its affected coal-fired EGUs. Similarly, depending on the content of the applicable plan, affected EGUs may achieve their emission standards through use of any of the building block measures described in this rule or any other measures permitted under the plan.
b.
Changes from the proposal.
In the proposed rule, we determined that building block 1 measures could on average achieve a 6-percent heat rate improvement from coal-fired EGUs in the U.S. based on a 4-percent heat rate improvement from implementation of best practices and a 2-percent heat rate improvement from equipment upgrades. Based on comments received and refinements made to our methodology for determining potential heat rate improvement from the hourly gross heat rate dataset of 884 coal-fired EGUs, we have applied this methodology on a regional basis and reduced the overall expected percentage heat rate improvement for coal-fired EGUs to 4.3 percent in the Eastern Interconnection, 2.1 percent in the Western Interconnection, and 2.3 percent in the Texas Interconnection.[643]
These values reflect improvements achievable through both best practices and equipment upgrades because, as described above, we also no longer include a separate estimation of the potential heat rate improvement achievable solely through equipment upgrades.
We received comments on our proposed statistical methodology for determining the CO2
emission reductions opportunities achievable by coal-fired EGUs through heat rate improvements. We have closely reviewed those comments and, for the final rule, have made refinements to our methodology, as described above and explained in more detail in the GHG Mitigation Measures TSD supporting the final CPP.
In the final rule, the EPA extends the implementation deadline from 2020 to 2022. This additional time will be helpful to the states seeking to conduct more targeted analyses of the nature and extent of heat rate improvements that specific coal-fired EGUs can make, considering specific recent improvements or upgrades, planned retirements of older coal-fired EGUs, and other relevant considerations. The extended deadline will also provide additional time to accommodate
( printed page 64791)
changes to heat rate monitoring methods at EGUs and for the installation of new pollution controls that comply with other rules, as discussed below in the summary of key comments.
2. Costs of Heat Rate Improvements
By definition, any heat rate improvement made by EGUs for the purpose of reducing CO2
emissions will also reduce the amount of fuel that EGUs consume to produce the same electricity output. The cost attributable to CO2
emission reductions, therefore, is the net cost of achieving heat rate improvements after any savings from reduced fuel expenses. As summarized below, we estimate that, on average, the savings in fuel cost associated with the percentage heat rate improvements we identified for each region would be sufficient to cover much of the associated costs. Accordingly, the net costs of heat rate improvements associated with reducing CO2
emissions from affected EGUs are relatively low. We recognize that this cost analysis will represent the costs for some EGUs better than others because of differences in individual circumstances. We further recognize that reduced generation from coal-fired EGUs due to the implementation of other building block measures would tend to reduce the fuel savings associated with heat rate improvements, thereby raising the effective cost of achieving the CO2
emission reductions from the heat rate improvements. Nevertheless, we still expect that a significant fraction of the investment required to capture the technical potential for CO2
emission reductions from heat rate improvements would be offset by fuel savings, and that the net costs of implementing heat rate improvements as an approach to reducing CO2
emissions from affected EGUs are reasonable. Even if we conservatively estimate that EGUs will largely rely on equipment upgrades rather than cheaper best practices to reduce heat rate, those reductions can generally be achieved at $100 or less per kW, or approximately $23 per ton of CO2
removed, as described in detail in the GHG Mitigation Measures TSD supporting the final CPP.[644]
Depending on the balance between equipment upgrades and best practices, improving heat rate would even result in a net savings for some EGUs.
Based on the analyses of technical potential and cost summarized above and in Chapter 2 of the GHG Mitigation Measures TSD, we find that heat rate improvements of 4.3, 2.1 and 2.3 percent are reasonable and conservative estimates of what coal-fired EGUs in the Eastern, Western and Texas Interconnections, respectively, can achieve at a reasonable cost.
3. Response to Key Comments
Many commenters said that the EPA should have subcategorized by EGU design or operating characteristics for purposes of evaluating potential heat rate improvements under building block 1.
Several studies categorize EGUs broadly by capacity, thermodynamic cycle, fuel rank or other characteristics. We considered subcategorizing the EGUs by their design and fuel characteristics under building block 1. Although grouping by categories does not account for all of the factors that may affect heat rate, it can provide a useful way of understanding the operating profile of classes of coal-fired EGUs and the fleet as a whole. However, we have declined to subcategorize among affected coal-fired EGUs for both technical and practical reasons. First, as discussed above, our assessment of heat rate improvement potential uses a unit-specific data methodology that compares each EGU's performance against its own historical performance. By substantially basing our analysis on these unit-specific assessments, we inherently factor in the effect of numerous design conditions. We also conducted a regression analysis that evaluated the effect of numerous factors on heat rate, and found that subcategorizing would generally make little difference in our analysis. Additionally, subdividing the EGUs into subcategories would reduce the quantity of EGUs used to calculate each average, which would increase the influence of random and atypical variations in the data on the overall averages, and would thus decrease our confidence in the results. Furthermore, as a practical matter, states are free to apportion reductions in a way that reflects any subcategories of their choosing when determining the emission standards for individual affected EGUs. Additionally, commenters assert that because building block 1 is calculated on an average basis, some affected EGUs will have greater potential than others to reduce CO2
emissions through heat rate improvements. If an affected EGU cannot meet its particular emission standard because it has below-average potential to reduce emissions through heat rate improvements, then in instances where the EGU's state plan allows emissions trading, the EGU can acquire credits or allowances from affected EGUs that have above-average potential. For a further discussion of our reasonable decision not to subcategorize among coal-fired EGUs for purposes of determining building block 1, see the GHG Mitigation Measures TSD supporting the final CPP.
Many commenters told the EPA that EGUs already have undertaken significant efforts to operate efficiently to provide reliable electric service at the lowest reasonable cost; that they believe they cannot significantly improve heat rate; that best practice maintenance activities are performed on a daily basis, including during maintenance outages that allow for the inspection, cleaning and repair of all equipment; that extensive capital investments have been made to install state-of-the art equipment and replace equipment that is beyond repair; and that their employees continuously monitor and control operating levels in the combustion process to maintain maximum combustion of fuel and to avoid wasting available heat energy. In summary, these commenters say they have expended considerable effort and resources to maintain peak boiler efficiency at all times and, therefore, the 6-percent heat rate improvement proposed for building block 1 is unreasonable to apply to EGUs across the board; the EPA should develop a rule that allows treatment of affected EGUs on a case-by-case basis.
We commend the efforts of those who strive to operate and maintain EGUs in the best possible manner to minimize heat loss and CO2
emissions. This rule does allow for treatment of EGUs on a case-by-case basis. States may believe that individual considerations are appropriate in some cases and, accordingly, we have purposely allowed states to make decisions about how to implement specific CO2
reductions. Our determinations of 4.3-, 2.1- and 2.3-percent heat rate improvement for EGUs in the Eastern, Western and Texas Interconnection, respectively, are conservatively based on the lowest value identified by any of our reasonable statistical analyses. If states choose to set limits on individual affected EGUs based in part on the availability of heat rate improvements, the states are free to assess heat rate improvements on a more targeted, case-by-case basis that takes into account an EGU's previous heat rate improvement efforts, or lack thereof. The fact that states (or EGUs complying with state requirements) can make case-by-case
( printed page 64792)
decisions about how to achieve goals does not contradict our conservative estimates—which are based on millions of hours of operating data reported to the EPA by EGUs—of how much EGUs are capable of improving their heat rate in each region overall. Opportunities to improve heat rate abound for affected EGUs as a whole, as evidenced by the fact that the approaches in our statistical methodology each included a comparison of an EGU's historical heat rate to its 2012 heat rate. Our estimates of the potential heat rate improvement are additionally conservative because they are based purely on comparisons among historical gross heat rate data, and thus do not reflect available, cost-effective opportunities to improve heat rate that affected EGUs never implemented during the study period. Finally, to the extent that an affected EGU was in 2012 fully implementing every possible best practice for improving heat rate, it may still be capable of improving heat rate through equipment upgrades.
Other commenters said that a 6-percent heat rate improvement overall is too high; that the heat rate improvement from upgrades are double-counted within the data used to determine heat rate improvements from best practices; and that the 2-percent heat rate improvement specifically for upgrades was inappropriately based on “conceptual” improvements from only one study.
We have reduced the 6-percent heat rate improvement from the proposed rule to three regionalized figures of 4.3 percent (Eastern), 2.1 percent (Western) and 2.3 percent (Texas), as discussed above and described in detail in the GHG Mitigation Measures TSD supporting the final CPP. We expect that, on average, affected coal-fired EGUs can at a minimum improve heat rate in these amounts by implementing best practices and equipment upgrades identified in the GHG Mitigation Measures TSD. These overall heat rate improvement figures do not include an estimated percentage heat rate improvement attributable specifically to upgrades. Although we are no longer including in our calculation of building block 1 a separate 2-percent heat rate improvement attributable solely to equipment upgrades, this decision is not because we believe that our initial 2-percent assessment of equipment upgrades was incorrect. To the contrary, the information presented in the S&L study was similar to that in other industry reports and studies—many of which were referenced in the proposal TSD—describing potential heat rate improvements at EGUs from all types of equipment upgrades. However, we recognized that the possibility existed that some limited portion of that 2 percent was also reflected in our statistical analyses of historical gross heat rate data. In order to ensure that our methodology did not double-count an indeterminate amount of heat rate improvement available through equipment upgrades, we conservatively set aside the entire additional 2 percent attributable solely to equipment upgrades. Accordingly, we determined the amount of potential heat rate improvement in the BSER solely from the heat rate analyses described above, which account for improvements through best practices and equipment upgrades that were at some point achieved by an EGU, but not for the full range of best practices and equipment upgrades that are actually available.
Commenters also said that the EPA did not look at important factors that affect heat rate such as coal type, boiler type, cooling water temperature, age, nameplate capacity or the use of post-combustion pollution controls.
Our statistical methodology compared each unit to its own historical performance and, therefore, largely accounts for the effects that a unit's design or fuel characteristics would have on heat rate. As discussed above, our methodology used hourly data from 884 units over an 11-year period (2002-2012) and compared the variability in the heat rate of each individual unit to that unit's own performance. By assessing potential heat rate improvement by first looking at unit-specific data, our methodology inherently factors in the possible effects of design and fuel characteristics (
e.g.,
coal type, boiler type, nameplate capacity, age, cooling water system, air pollution controls) on heat rate and heat rate variability.
Although cooling water temperature likely plays an important role in a coal-fired EGU's heat rate, as stated by commenters, there are no consistent quality-assured hourly cooling water temperature data available to the EPA. However, in an effort to determine the potential effect of cooling water temperature on heat rate, we looked at a sample of 45 coal-fired EGUs at 19 facilities for which we had hourly surface water temperature data (used as a surrogate for cooling water) from monitors located nearby and upstream of cooling water intake points. Our analysis found that surface water temperature did explain some of the variation in heat rate, but that surface water temperature is strongly correlated with ambient air temperature—a variable we did control for in our methodology. Because of the strong correlation between ambient air temperature and surface water temperature, the availability of a comprehensive dataset of nationwide hourly ambient air temperature, and the similar explanatory power of surface water temperature and ambient air temperature, it is unlikely that separately addressing cooling water temperature would significantly change the results. Rather, we are confident that our use of hourly ambient air temperature in our analyses adequately addressed any significant impact of cooling water temperature. See the GHG Mitigation Measures TSD supporting the final CPP for further details about this analysis. As described further in that TSD, the other potentially relevant variables for which we did not directly control are unlikely to significantly affect the average heat rate.
Commenters said that the heat rate improvement attributable to upgrades will degrade over time or require repeated and costly further upgrades.
We are aware that some heat rate improvement measures can degrade over time. Like most power plant components, some heat rate improvement technologies require maintenance in order to sustain their efficacy over time. Therefore, to avoid degradation, personnel at EGUs will need to diligently apply “best practices” on a regular basis, a practice that numerous commenters say is standard operating procedure. The S&L study includes estimates of associated operations and maintenance (O&M) costs for each heat rate improvement method that is discussed. As we explained in the proposal, the related O&M costs of diligently applying best practices are relatively small compared to the associated capital costs and would, therefore, have little effect on the economics of heat rate improvements.
Commenters stated that heat rate improvement should be set on a basis that is narrower than nationwide—for example, state-by-state or unit-by-unit.
The EPA did not propose and is not finalizing a rule that sets heat rate improvement goals for individual states or for individual coal-fired EGUs. Instead, in the approved state plans developed under this rule, each state will set the emission standards for its various coal-fired EGUs. In doing so, the state may take into account its own view of the amount of heat rate improvement needed (if any) at specific EGUs, and may look to the EPA's analysis of heat rate improvement potential in the applicable region as a guide, while keeping in mind the CO2
emission
( printed page 64793)
performance rate. This broad-based approach is consistent with the traditional rules evaluating the potential for emission reductions on a source-category basis, and is consistent with the broader goal-setting purpose of this rule. Furthermore, the final rule establishes a uniform national performance rate based on the least stringent regional performance rate calculated with the building blocks. Accordingly, affected EGUs in regions not setting the national level have emission reduction opportunities beyond those reflected in the applicable performance rate.
The heat rate improvement measures comprising building block 1 would ordinarily be evaluated on a nationwide basis. However, in this instance there are two good reasons to calculate building block 1 on a regionalized basis. First, a regionalized approach is consistent with the EPA's approach to determining the other building blocks. For building block 1, this means that the heat rate improvement should reflect only as much potential for emission reduction from building block 1 as our analyses indicate can be achieved on average by the affected coal-fired EGUs in that region. This ensures that the BSER for each region is representative of the characteristics and opportunities available within that region, rather than a less logical combination of opportunities in the region and opportunities nationwide. Second, a regionalized approach provides a more representative average of the potential heat rate improvement that EGUs in a given region are capable of achieving. The populations of affected coal-fired EGUs in each region differ in some respects, as discussed in the GHG Mitigation Measures TSD, and the more nuanced regionalized approach thus indirectly accounts for some of those systemic differences. For these and other reasons described in Section V.A. of the preamble with respect to the BSER as a whole, we have reasonably based building block 1 on a regionalized approach. Applying this regionalized approach to building block 1 strikes an appropriate balance between the proposed nationwide analysis and commenters' suggested state-specific analysis, which does not fully reflect the interconnected nature of the system within which affected coal-fired EGUs operate.
The practical consequence of calculating building block 1 on a regionalized versus nationwide basis is minimal. This is because the CO2
emission performance rates are based on the overall performance rate determined to be reasonable for EGUs in the Eastern Interconnection. Our methodology identifies a 4.3 percent potential improvement in the Eastern Interconnection, compared to a 4.0 percent figure across all three interconnections.
We further note, along with some commenters, that site-specific engineering studies or unit-by-unit analyses of heat rate improvement potential for coal-fired EGUs are not available to the EPA; only a small number of site-specific case studies are available in the public literature. We considered that for the EPA to develop a comprehensive, unit-by-unit heat rate improvement study of nearly 900 coal-fired EGUs from scratch, it would likely cost the Agency $50,000 to $100,000 to study each EGU (almost $50 to $100 million total) and require three to four years to complete. Such a granular analysis would not serve the broader goal-setting purpose of this rulemaking. We agree with commenters who have pointed out that a heat rate improvement-estimating effort of that magnitude and duration would be unnecessarily lengthy and expensive. Nor would such a granular analysis be a necessary predicate for states to develop emission standards, or for EGUs to comply with those emission standards. Rather, our methodology relies on individualized, unit-by-unit hourly performance data from 884 EGUs provides conservative and reasonable regional estimates of heat rate improvement potential. Indeed, given the conservative nature of our methodology, a unit-specific approach that evaluates the full range of best practices and equipment upgrades available at individual EGUs—including upgrades not accounted for here—would be more likely to result in higher overall heat rate improvement figures than we are finalizing for building block 1. Furthermore, site-specific information forms the foundation of the EPA's estimated heat rate improvement potential, and similar data likely would be used in any site-specific heat rate improvement engineering study. Finally, EGU-specific detailed design and operation information is not consistently available for all the factors that influence heat rate. The EPA has used the comprehensive data that are available to reasonably and conservatively estimate potential heat rate improvement in each region.
Commenters also said that shifting electricity generation from coal-fired EGUs to other EGUs because of measures implemented under other building blocks will lower the capacity factors of coal-fired EGUs, and thus increase, not decrease, their heat rates.
We expect that most states will develop plans that optimize the operation of existing coal-fired EGUs while utilizing the other building blocks and other measures to reduce emissions from carbon-intensive generation. From our IPM projections, the average annual capacity factor of existing coal-fired EGUs that are expected to remain in operation in 2030 will actually increase compared to 2012. This projection—which is further described in the GHG Mitigation Measures TSD—incorporates expected retirements of inefficient units and generation shifts away from using coal-fired EGUs as peaking units.
Commenters also noted that the EPA used net heat rate in state goals, but used gross heat rate in its heat rate improvement analysis—potentially ignoring the detrimental effect that parasitic load from air pollution control devices (APCD) and other equipment can have on net heat rate.
The EPA's variability analysis necessarily and reasonably used gross output data for each of the 884 EGUs in the EPA's database because they are the only publicly available, unit-specific, hourly performance data. By definition, improvement in gross heat rate would be reflected in the net heat rate. Gross heat rate is the total heat output from the EGU, in units of Btu/gross kWh, and includes the power used by auxiliary equipment required to operate the EGU itself. By contrast, net heat rate is the remaining Btu/kWh after subtracting the power used by the EGU's own auxiliary equipment from the gross heat rate value,
i.e.,
what the EGU is able to provide to the grid. Improvements in net heat rate alone (
e.g.,
reducing parasitic load of on-site equipment) may be possible on many units. Therefore, our use of gross heat rate to estimate potential heat rate improvement was conservative because of the additional opportunities to achieve the uniform performance rate through improvements in net heat rate alone.
Commenters also raised concerns that the EPA was not taking into account net heat rate increases due to additional add-on pollution controls that may, for some units, be required by other rules.[645]
The results of our statistical analyses are based on gross heat rates and would not change with installation of emission controls for CSAPR, MATS, or other rules because these controls will add parasitic load requirements and thereby have an impact on the net heat rates only. Furthermore, we conservatively consider region-wide net heat rate
( printed page 64794)
improvement potential to be the same as that indicated for the region-wide gross heat rate, when in fact it is not. In order to check our assumptions concerning gross versus net heat rate, we used the IPM Power Sector Modeling Platform (version 5.14) and National Electric Energy Data System (NEEDS) (version 5.14) to analyze the anticipated incremental heat input required to operate additional add-on controls to comply with various EPA rules, including CSAPR, MATS, effluent guidelines for EGUs, and coal combustion residuals. From this analysis, we project that between 2012 and 2025, existing coal-fired EGUs are expected to install approximately 18.6 GW of wet flue gas desulphurization (FGD), 16.6 GW of dry FGD, 24.9 GW of selective catalytic reduction (SCR), and 3.9 GW of selective noncatalytic reduction (SNCR). The resulting impact from new pollution controls on existing coal-fired EGUs' heat rate is expected to be very small, at conservatively less than 31 Btu/kWh, or less than 0.3 percent in 2025.[646]
After 2025, this estimate is particularly conservative because the EPA's cost performance models overestimate the parasitic load from individual add-on controls for future years. Furthermore, at some EGUs these newer pollution control devices will replace existing pollution control devices. Accordingly, for these EGUs, the minimal increase in net heat rate due to power required to operate new controls will be at least partially offset by the decrease in net heat rate caused by removal of the control devices currently in place. For more information about this analysis, see the GHG Mitigation Measures TSD supporting the final CPP.
Commenters contended that the 11 years of data used to evaluate potential heat rate improvement is too broad, and that the population of domestic coal-fired EGUs has changed significantly over this time period.
The 11-year span for the hourly gross heat rate data is appropriate because it represents a wide variety of economic conditions, market conditions and fleet composition, while also capturing the relatively recent historical performance of affected coal-fired EGUs. We also noted in the proposal TSD that the population of coal-fired EGUs used in the analytical approaches to determine potential heat rate improvement is made up of coal-fired EGUs that operated in 2012. The gross heat rate data of any coal-fired EGUs that retired prior to 2012 were not included in the dataset.
Commenters stated that many of the changes in heat rate reflected in the 11-year hourly gross heat rate dataset are attributable to changes in monitoring methodology, and thus do not represent heat rate improvements attributable to best practices or equipment upgrades. In addition, commenters are concerned that changes to the monitoring methodology in the future could artificially alter the measured heat rate.
Different stack gas flow monitoring methods can yield more or less accurate measurements of heat input and CO2
emissions. These differences depend on the characteristics of the stack gas flow where the monitoring and reference method measurements are taken, and which options under the Part 75 emission measurement rules are chosen in the application of the various flow rate reference methods. In general, more accurate stack gas flow monitoring methodologies yield lower values that, when used to calculate emissions or heat input, may lower the heat rate values reported to the EPA.
Some EGUs adopted monitoring methodologies that have the potential to affect the exactness of the data we used for assessing heat rate improvements. However, as discussed in detail in the GHG Mitigation Measures TSD supporting the final CPP, our review of the data shows that a relatively small amount of the data are affected by these changes; we are confident that the values adopted for building block 1 are conservative and reasonable estimates of the potential for heat rate improvement in each region. Some changes in monitoring methodology would have the result of tending to cause us to underestimate the potential for heat rate improvement. Furthermore, because our methodology analyzes percentage heat rate improvement based on 2012 gross heat rate data, our results are unaffected by EGUs that used more accurate monitoring methodologies in 2012 or used the same monitoring methodologies consistently throughout the 11-year study period. For these and other reasons discussed in detail in the GHG Mitigation Measures TSD, we remain confident in our results despite the marginal differences attributable to monitoring methodologies in some of the heat rate data for a subset of EGUs.[647]
In terms of concerns with future methodological changes, the overwhelming majority of the 884 EGUs in the dataset we used to assess heat rate improvement have already changed their stack gas flow monitoring methodology in 2012 or earlier. Furthermore, extension of the compliance date to 2022 for this rule, as discussed above, more than adequately allows enough time for EGUs to determine how to actually improve their heat rates and lower CO2
emissions while accommodating future changes to monitoring methodologies. For a more detailed explanation, see the GHG Mitigation Measures TSD supporting the final CPP.
Commenters said that there is no proof that lowering the heat rate will reduce variability or that reduced variability will reduce heat rate,
i.e.,
correlation does not prove causation.
As an initial matter, it is important to note that for the final rule the EPA used three types of statistical analyses to evaluate and estimate potential heat rate improvements of coal-fired EGUs, and only one of these analyses involved any consideration of heat rate variability. All three types of statistical analyses are described in the GHG Mitigation Measures TSD supporting the final CPP.
These commenters are correct that, in the abstract, reducing heat rate variability only means that heat rate will be more consistent—not necessarily lower or higher. However, our analysis is not an abstract evaluation of the potential to reduce variability, as commenters suggest, but rather is an evaluation of the potential heat rate
improvement
achievable through reducing variability—
i.e.,
reducing variability to achieve a more consistently low heat rate. See the more detailed discussion of the statistical procedures used for the final rule, above. In particular, the application of a “consistency factor” in the analyses performed for both the proposed and final rule demonstrates the potential results if each individual EGU operated slightly more consistently with the lower heat rates that the EGU had itself previously achieved under similar conditions.
The consequence of a reduced heat rate is, of course, a lower rate of CO2
emissions, which is the purpose of the BSER for building block 1. This way of thinking about reduced variability is consistent with the utility power sector's own efforts to reduce variability, which are aimed at securing
( printed page 64795)
the economic benefits of a more consistently
lower
overall heat rate.
Some commenters expressed concern that heat rate improvements could trigger applicability of new source review (NSR) provisions. The relationship of this final rule to other regulatory provisions, including NSR, is discussed in section X of the preamble.
D. Building Block 2—Generation Shifts Among Affected EGUs
The second element of the foundation for the EPA's BSER determination for reducing CO2
emissions at affected fossil fuel-fired EGUs entails an analysis of the extent to which fossil steam EGUs can shift generation to existing NGCC EGUs. In this section, we define building block 2 as the gradual shifting of generation from existing fossil steam to existing NGCC within each region up to a maximum NGCC utilization of 75 percent on a net summer basis. In each year of the interim period, this 75 percent net summer maximum potential is subject to a regional limit informed by historical growth rates.
This section summarizes the EPA's analysis supporting that definition. We begin by discussing the sector's ability to reduce CO2
emissions by shifting generation, including selected background information, data on trends toward greater NGCC generation, and various mechanisms for executing or facilitating generation shifts. Next, we describe the amount and timing of generation shift we have determined to be achievable through the building block. We then discuss various elements supporting our quantification of achievable generation shift, including the technical feasibility of NGCC units to increase generation; historical shifts to NGCC generation; considerations related to reliability, natural gas transmission infrastructure, natural gas production, and electricity transmission infrastructure; and regulatory flexibility. A discussion of costs follows. Finally, we respond to certain comments not addressed in the preceding discussions.
1. Demonstration of Ability To Reduce CO2
Emissions Through Shifting Generation
a.
Background of utility power sector.
The ability to shift generation from higher- to lower-emitting sources is compatible with the way EGUs are generally dispatched.[648]
The standard approach to dispatching generation is through Security Constrained Economic Dispatch (SCED), a well-established practice in the electric power industry.[649]
As the name indicates, SCED has two defining components: Economic operation of generating facilities and assurance that the electric system remains reliable and secure.[650]
Economic dispatch generally refers to shorter-term planning and operations from a day ahead through real time. During this period, generating units are committed—a process known as “unit commitment,” in which units are committed to be ready to provide generation to the system when they will be needed—and then dispatched in real time to meet the electricity demand of the system. Overall changes in the level of generation from different facilities are also planned over time periods longer than this 2-day dispatch period. Over a calendar year, for example, units are planned and scheduled seasonally or monthly to ensure that sufficient capacity and energy will be available to meet expected loads in an area. Over a period of a week, units are committed to be prepared to start up or shut down to meet forecast loads, and dispatch is coordinated within this planning and unit commitment framework. This process enables system operators to respond quickly to short-term changes in demand, and also to shift generation among different generation types to match longer-term requirements and goals.
EGUs using technologies with relatively low variable costs, such as nuclear units, are for economic reasons generally operated at their maximum output whenever they are available. Renewable EGUs such as wind and solar units also have low variable costs, but the magnitude and timing of their output generally depend on wind and sun conditions rather than the operators' discretion. In contrast, fossil fuel-fired EGUs have higher variable costs and are also relatively flexible to operate. Fossil fuel-fired EGUs are therefore generally the units that operators use to respond to intra-day and intra-week changes in demand. Because of these typical characteristics of the various EGU types, the primary opportunities for switching generation among existing units available to EGU owners and grid operators generally consist of opportunities to shift generation among various fossil fuel-fired units, in particular between coal-fired EGUs (as well as oil- and gas-fired steam EGUs) and NGCC units. In the short term—that is, over time intervals shorter than the time required to build a new electric generation unit—fossil fuel-fired units consequently tend to compete more with one another than with nuclear and renewable EGUs. The amount of generation shifting from coal-fired EGUs to NGCC units that takes place as a result of this competition is highly relevant to overall power sector GHG emissions, because a typical NGCC unit produces less than half as much CO2
per MWh of electricity generated as a typical coal-fired EGU.
b.
Trends in generation shifts from coal-fired to natural gas-fired sources.
Since at least 2000, fossil fuel-fired generation has been shifting from coal- and oil-fired EGUs to NGCC units, both as a result of construction of additional NGCC units, and also as a result of dispatch of pre-existing NGCC units at higher capacity factors. As a result, generation from NGCC EGUs in 2012 reached over four times the level of NGCC generation in 2000, while generation from coal and oil/gas steam EGUs decreased by around one third.[651]
As we demonstrate in the GHG Mitigation Measures TSD, NGCC units are capable of operating at higher annual capacity factors than they have historically, so there remains considerable opportunity for increased use of existing NGCC units to replace generation currently supplied by higher-emitting coal and oil/gas steam units. The electric utility industry is thus well-positioned to address the requirements of this building block by increasing use of existing NGCC units and correspondingly decreasing use of steam units. The electric industry has been shifting generation to NGCC units in recent years and is expected to continue to retire coal capacity and add new NGCC capacity. In the reference case without implementation of CO2
emission limitations, EIA forecasts 40 GW of coal retirements and 53 GW of NGCC capacity additions from 2014 to 2030.[652]
An EPA review of state Integrated Resource Plans (IRPs) shows a pattern of shifting away from coal steam capacity to NGCC capacity and, in some cases, conversion of coal steam capacity to natural gas steam capacity. For example, Ameren plans to add 600 MW of NGCC capacity and convert two coal units to natural gas steam units, and Duke plans to add 680 MW of
( printed page 64796)
NGCC capacity and convert one coal unit to a natural gas steam unit.[653]
c.
Mechanisms for dispatch shifts from coal-fired to natural gas-fired generation.
There are a variety of patterns of ownership and operational control of EGUs; these ownership and operational structures influence how EGUs will respond to this building block. However, all owners and operators have the ability to comply by using this building block. In terms of ownership, investor-owned utilities (IOUs) serve about 75 percent of the US population, while consumer-owned utilities serve the remaining 25 percent.[654]
In states that have maintained traditional regulation, IOUs are generally vertically integrated (owning generating capacity as well as transmission and distribution infrastructure), and the wholesale sales of these EGUs are regulated by the state; in states that have deregulated their retail service, ownership of the EGU is separated from ownership of transmission, and wholesale sales of generation are regulated by FERC. Consumer-owned utilities comprise municipal utilities, public utility districts of various types owned by government agencies, nonprofit cooperative entities (co-ops), and a number of other entities such as Native American Tribes.
Operational control of the dispatch of power over the electricity grid is superimposed on this pattern of ownership. Prior to electricity restructuring, this dispatch was typically operated by major vertically-integrated utilities or by public power entities. Over the last 15 years, large portions of the power grid are now independently operated by ISOs or RTOs. These entities are regulated by FERC and dispatch power from multiple owners to meet the loads on the bulk power grid.
The combination of multiple ownership and types of operational control adds to the complexity of electricity dispatch, but all affected EGUs, regardless of ownership and type of control, can use this building block to comply with the final rule. The principal difference among the differing entities lies in the types of methods that are available for the affected EGU owner to bring about the shift in generation that will make use of this building block for compliance. There are several alternatives to accomplish this result: The owner of the higher-emitting affected EGU may also own, or have affiliates that own, lower emitting generation and thus reduce its own generation and use its control over these other EGUs to increase their generation; an EGU may be able to reduce its generation and buy replacement power from the market that is lower emitting; or the EGU may be able to reduce its generation and procure generation from a separately-owned lower-emitting EGU. These alternatives will be available in states with either rate or mass-based state plans without any change in their general form. Under a rate-based state plan, an EGU owner may also be able to purchase ERCs and average the ERCs into its emission rate for purposes of demonstrating compliance with its standard of performance. Under standards of performance that incorporate emissions trading, an EGU owner may be able to purchase rate-based emission credits or mass-based emission allowances not needed by other EGUs and use those credits or allowances to help achieve its standard of performance.
The potential to shift generation identified for this building block is entirely consistent with the existing economic dispatch protocols described above. State environmental policies can shift generation in two ways. The first is operational restrictions, such as permit limits on the number of hours that an EGU can operate in order to limit emissions. The second is changes in the relative costs of generation among different types of EGUs related to pollution reduction measures. For example, a regulation that necessitates the use of a control technology that requires the application of a reagent in a certain kind of EGU will increase the variable cost of operating that plant, which in turn may reduce the amount of generation it is called upon to deliver to the grid through security-constrained economic dispatch procedures.
In an organized market, where the system operator dispatches units partly based upon costs, an electric power plant that experiences an increase in its variable costs will tend to operate less than it otherwise would have. For example, market-based pollution control programs require units to hold tradable allowances to authorize their emissions of a regulated pollutant. Such an allowance-holding requirement puts a price on the act of emitting the regulated pollutant, which increases the operating costs of units that emit that pollutant, and thus such units will be dispatched less than they otherwise would without such an allowance-holding requirement. The RGGI is an example of a state program that has this effect. In the present rule, although shifts in the mix of generation to address the costs of pollution control can lead to higher electricity generating costs overall, the EPA analysis shows these costs to be modest and well below their associated benefits.[655]
Many of the NGCC units are owned by the same companies or affiliates that also own steam units. In these cases, changes in EGU generation can be planned by the company or affiliate without the need to engage in separate market transactions with outside parties. Where the affected EGU owner is also the dispatch entity, as in most traditional market structures, the EGU owner will generally have operational control over the unit. Environmental conditions, such as compliance costs or limits on generation, can be factored in with fuel costs for purposes of determining when the unit is committed to be available, how the unit can be most efficiently cycled, and at what level the unit is dispatched.
An analysis of generation data from steam and NGCC units in 2012 shows that 77 percent of the steam generation occurred from an EGU that owned, or that had an affiliate that owned, NGCC generation. Eighty percent of the generation shift potential identified in this building block (increasing NGCC generation up to a 75 percent capacity factor on a net basis to replace steam generation) could occur among these entities that own (either directly or through affiliates) both steam and NGCC generation.[656]
These data show that most EGU generation relevant for this building block is produced by entities that own both steam and NGCC generation.
Another alternative available to an affected EGU owner that does not also own NGCC generation is for the higher-emitting affected EGU to reduce its generation and purchase replacement power from the market. In organized markets such as RTOs, it is available through standard practice, because the owner impacts how its EGUs are dispatched based upon how it bids into the RTO market. In this case, the owner can exercise control over the levels of generation across units by when it offers generation to the market operator (the RTO or ISO), and the prices it bids for this generation. As in traditional economic dispatch by a utility, environmental conditions, compliance
( printed page 64797)
costs, or limits on generation can be incorporated by the owner into the determination of the cost-effective generation pattern of its EGUs.
In regions with organized electricity markets (including, but not limited to, RTOs or ISOs), the various types of EGU owners of higher-emitting sources can reduce their generation, and any resulting deficit in generation on the system can be supplied from other EGUs in the region; for example, a coal-fired unit can reduce generation that is then replaced through the operation of the market by generation from an NGCC unit, subject to dispatch by a regional operator to ensure the reliable delivery of the generation to loads within the region. To comply with this rule, higher-emitting steam units will need greater emission reductions relative to lower-emitting NGCC units which will, in turn, tend to raise steam unit costs compared to NGCC units. As a result, the bids that a steam unit provides a market operator will rise relative to NGCC units. This process of reducing generation from a higher-emitting unit will lead to substitution of lower-emitting generation.
EGU owners that do not participate in an organized electricity market may nevertheless purchase power from the wholesale power market. Purchases in the wholesale power market can be spot purchases, which are typically general purchases of system power supplied by the EGUs across a region, or contract purchases, which may have more provider-specific characteristics (such as specifying the type of unit that is providing the power). Purchases between EGUs through the wholesale power market will have similar emission-lowering properties as operation of the organized market discussed above, because dispatch in balancing areas outside RTOs and ISOs also follows a similar economic dispatch protocol that is informed by each unit's production costs and environmental limitations.
Under this alternative, the steam generators may, in effect, realize emission reductions from building block 2 simply by reducing their generation. Steam generators do not need to purchase replacement electricity as a prerequisite for realizing emission reductions from reducing their own generation because other generators already have an incentive to provide as much electricity as load-serving entities are willing to buy in order to satisfy electricity demand.[657]
As noted above, higher-emitting generation sources will have to incorporate correspondingly higher costs of pollution reduction into their supply bids compared to lower-emitting generation sources, and as a result, load-serving entities will seek to buy a greater share of electricity from the lower-emitting sources because their supply bids will be more economically attractive. Once the steam generators reduce their generation (and associated emissions), the other entities in the electricity system arrange for the replacement electricity. The outcome of this power market process will reduce both the mass and the rate of emissions across sources.
An owner of a source can also reduce the generation of an EGU by substituting generation from a lower-emitting NGCC directly. For an EGU owner without existing NGCC generation, this substitution can take the form of a bilateral contract purchase. In RTOs and ISOs, this alternative often takes the form of a contract for differences, where the replacement source could be an NGCC and the contract specifies a delivery location and the price of the power. In bilateral markets, the contract vehicle could be a Power Purchase Agreement from a replacement source. It is also possible that the owner of a steam unit could directly invest in an existing EGU by purchasing the asset or taking a partial ownership position, thus acquiring the generation from the unit through that means. The acquired generation and its associated emissions could be used for compliance by the higher-emitting EGU, in accordance with the plan under which it is operating. The amount of generation that could be shifted using the approaches described in this paragraph will depend on the type and terms of the commercial arrangements, as well as the potential need for regulated entities to obtain approvals for contracts or for changes in asset positions. The wide range of approaches permitted by this rule provides flexibility, both within a year and across multiple years, for EGUs to fashion these arrangements to fit their circumstances.
Where permitted under its state plan, an EGU would also be able to meet its reduction obligations using ERCs or allowances. The particular nature of this alternative will depend on how a state elects to develop its plan. If a state chooses a mass-based approach, the EGU would simply need to hold allowances to cover its emissions. To realize an emission reduction from building block 2 under this approach, a steam generator would only need either to reduce its emissions by reducing its generation, which would lead to that generator needing fewer allowances to cover its emissions under the program, or to purchase surplus allowances not needed by another EGU that had reduced its emissions. In a rate-based state, the state may choose to provide for compliance through the acquisition of tradable ERCs. To realize an emission reduction from building block 2 under this approach, a steam generator would be able to adjust its effective emission rate by purchasing ERCs that are produced by other sources whose emission rates are lower than the applicable rate standard. In this fashion, a steam generator does not need to purchase lower-emitting replacement power per se in order to demonstrate an emission reduction from this building block; instead, the steam generator may purchase any ERCs that were produced from lower-emitting sources (see section VIII for more detail on how state plans can use an ERC approach to facilitate a rate-based compliance demonstration of this type of emission reduction).[658]
The approaches shown here collectively demonstrate that all steam generators—regardless of size, location, form of ownership, or type of market in which they operate—can implement building block 2 through some or all of the mechanisms described.
2. Amount and Timing of Generation Shift
The EPA has determined that for purposes of quantifying the CO2
emission reductions achievable through building block 2, a reasonable amount of generation shift is the amount of generation shift that would result from existing NGCC units, on average, increasing their annual utilization rates to 75 percent of net summer capacity. However, the building block does not reflect achievement of this average capacity factor at the start of the interim period, but instead reflects a glide path of increases in NGCC utilization over
( printed page 64798)
the interim period. Below, we discuss the glide path, and in the following section we discuss the basis for finding the 75 percent utilization rate, achieved over the period of time consistent with the glide path, to be reasonable.
The EPA received significant public comments expressing concern regarding the proposal's incorporation of the full building block 2 shift in generation by the first year of the interim period. These commenters perceived this approach as requiring states to achieve such a significant portion of the required CO2
emission reductions early in the interim period that states would lack flexibility in when and how they may achieve the required emission reductions. Other commenters expressed concern that the full extent of building block 2 would be difficult for some states to achieve by the first year of the interim period as a result of technical, engineering, and infrastructure limitations or other considerations; that such timing may crowd out other cost-effective options for emission reductions; and that such timing might have negative implications for reliability.
In the proposal, the EPA determined that emission reductions are feasible and achievable at fossil fuel-fired steam EGUs by shifting from more carbon-intensive EGUs to less carbon-intensive EGUs, as part of the BSER. More specifically, the EPA proposed that generation shifts from fossil fuel-fired steam units (which are primarily coal-fired) to NGCC units, up to a utilization of 70 percent on a nameplate capacity basis, could be achieved by 2020. In contrast, the EPA proposed that reductions in CO2
emissions from fossil fuel-fired units associated with other measures, such as increased utilization of RE generating capacity and increased demand-side EE, would be achievable on a phased-in basis between 2020 and 2029, reflecting the time needed for deployment.[659]
In light of the concerns noted above, in the October 2014 NODA, the EPA solicited comment on potential rationales for phasing in the potential to shift generation under building block 2.[660]
As already noted, in the final rule the EPA has revised the interim period to start in 2022, which itself is a meaningful response regarding the concerns expressed by commenters about the timing of building block 2's generation shift potential. In addition, the EPA has evaluated the feasibility over time of building block 2 within the framework of BSER, and is finalizing a change to building block 2 that gradually phases in the shift from existing fossil steam to existing NGCC over the interim period. This phase-in allows for additional time to complete potential infrastructure improvements (
e.g.,
natural gas pipeline expansion or transmission improvements) that might be needed to support more use of existing natural gas-fired generation, and provides states with the increased ability to coordinate actions taken under building block 2 with actions taken under building block 3 (deployment of new renewable capacity).
The phase-in schedule applies a limit to the maximum building block 2 potential in each year of the interim period based on two parameters. The first parameter defines an amount of generation shift to existing NGCC capacity that is feasible by 2022, and the second parameter defines how quickly that amount could grow until the full amount of NGCC generation could be achieved as part of the BSER. Both of these parameters are determined by examining the extent to which gas-fired generation has increased over historical time periods. The first parameter is based on the single largest annual increase in power sector gas-fired generation since 1990, which occurred between 2011 and 2012 and is equal to 22 percent.[661]
We believe that this amount is a conservative estimate of the ability of the sector to increase utilization of NGCC capacity by 2022, given that this increase has already occurred in a single year. The second parameter is based on the average annual growth in gas-fired generation in the power sector between 1990 and 2012, which is approximately 5 percent per year.
In the performance rate calculation methodology, these two parameters constrain the annual rate at which building block 2 shifts generation from fossil steam units to NGCC units. The interim performance rate is an average of annual rates calculated over the 2022-2029 period. The two parameters above limit the extent to which NGCC generation is able to increase and replace fossil steam generation in each year of the interim period. In the first year, NGCC generation is limited to a maximum of a 22 percent increase from 2012 levels in each region. In each subsequent year, regional NGCC generation is limited to a maximum of a 5 percent increase from the previous year. This phase-in continues in the performance rate-setting methodology until the full building block 2 level of shifting from fossil steam generation to NGCC generation is reached. Under this approach, building block 2 is completely phased into the source category calculation of all regions by the end of the interim period.
Table 7—BSER Maximum NGCC Generation by Region and Year (TW
h
)
Region
NGCC generation (TWh)
Maximum
potential
at 75%
2012
(adjusted)
BSER maximum
2022
2023
2024
2025
2026
2027
2028
2029
2030
Limit
22%
5%
5%
5%
5%
5%
5%
5%
5%
Eastern Interconnection
988
735
896
941
988
988
988
988
988
988
988
Western Interconnection
306
198
242
254
267
280
294
306
306
306
306
Texas Interconnection
204
137
167
176
185
194
203
204
204
204
204
This phase-in, in addition to the flexible nature of the goals, ensures that the overall framework of this final rule includes sufficient flexibility, particularly with respect to timing of and strategies for reducing emissions from the affected units, so that states can develop cost-effective strategies and allow for infrastructure improvements to occur should they prove necessary in some locations.
( printed page 64799)
3. Basis for Magnitude of Generation Shift
a.
Technical feasibility of NGCC units to generate at 75% of their capacity.
In order to estimate the potential magnitude of the opportunity to reduce power sector CO2
emissions through shifting generation among existing EGUs, the EPA first examined information on the design capabilities and availability of NGCC units. Availability is defined as the number of hours that generators are available to generate electricity, and it is typically expressed as a percentage of the total number of hours in a year. Since the value of NGCC capacity is related to how much electricity the owner of that capacity can generate and sell, units are typically designed with very high availability ratings. Baseload units have annual average availabilities of approximately 91%-92%, and peaking units are generally available 96% to 98% of peak hours.[662]
The EPA also examined information on the historical availability of NGCC units in practice. This examination showed that, although most NGCC units have historically been operated in intermediate-duty roles for economic reasons, they are technically capable of operating in baseload roles at much higher annual utilization rates. Average annual availability (that is, the percentage of annual hours when an EGU is not in a forced or maintenance outage) for NGCC units in the U.S. generally exceeds 85 percent, and can exceed 90 percent for some groups.[663]
We also researched historical data to determine the utilization rates that NGCC units have already demonstrated their capability to sustain. Over the last several years, the utilization patterns of fossil fuel-fired units have shifted relative to historical dispatch patterns, with NGCC units increasing generation and many coal-fired EGUs reducing generation. In fact, in April 2012, for the first time ever the total quantity of electricity generated nationwide from natural gas was approximately equal to the total quantity of electricity generated nationwide from coal.[664]
These changes in generation patterns have been driven largely by changes over time in the relative prices of natural gas and coal. Although the relative fuel prices vary by location, as do the recent generation patterns, this trend holds across broad regions of the U.S. In the aggregate, the historical data provide ample evidence indicating that, on average, existing NGCC units can achieve and sustain utilization rates higher than their historical average utilization rates.
Utilization of EGUs is often considered using the metric of a capacity factor, which is the percentage of total production potential that an electric generating unit achieves in a given time period. A capacity factor of 75 percent thus represents a unit producing three-quarters of the electricity it could have produced in that time had it utilized its entire capacity. The EPA received multiple comments regarding the proposed use of nameplate capacity in calculating the potential utilization level of existing NGCCs under building block 2. These comments stated that net summer capacity is a more meaningful and reliable metric than nameplate capacity, because net capacity best reflects the electric output available to serve load. The EPA agrees with these comments. The quantification of building block 2 as well as performance rate and state goal calculations in the final rule are all based on net summer generating capacity. An annual utilization rate of 75 percent on a net summer basis is similar to the proposed rule's consideration of 70 percent utilization on a nameplate basis.[665]
The experience of relatively heavily-used NGCC units provides an additional indication of the degree of increase in average NGCC unit utilization that is technically feasible.
The EPA reexamined the historical NGCC plant utilization rate data reported to the EIA, and found that in 2012 roughly 15 percent of existing NGCC plants operated at annual utilization rates of 75 percent or higher on a net summer basis.[666]
In effect, these plants were providing baseload power. In addition to the 15 percent of NGCC plants that operated approximately at a 75 percent utilization rate on an annual basis, some NGCC plants operated at even higher utilization rates for shorter, but still sustained, periods of time in response to high cyclical demand. For example, on a seasonal basis, a significant number of NGCC plants have achieved utilization rates greater than 90 percent on a net summer basis; during the summer of 2012 (June through August), about 30 percent of NGCC plants operated at utilization rates of 75 percent or more across the entire season. During the spring and fall periods when electricity demand levels are typically lower, these plants were sometimes idled or operated at much lower capacity factors. Nonetheless, the data clearly demonstrate that a substantial number of existing NGCC plants have proven the ability to sustain 75 percent utilization rates for extended periods of time. We view this as strong evidence that increasing the annual average utilization rates of existing NGCC units to 75 percent on a net summer basis would be technically feasible.
The EPA believes that an annual average utilization rate of 75 percent on a net summer basis is a conservative assessment of what existing NGCC plants are capable of sustaining for extended periods of time. In 2012, roughly 10 percent of existing NGCC plants operated at annual utilization rates of 80 percent or higher on a net summer basis. While the EPA believes this level is also technically feasible on average for the existing NGCC fleet, the EPA is quantifying building block 2 assuming an NGCC utilization level of 75% on a net summer basis in order to offer sources additional compliance flexibility, given that the extent to which they realize a utilization level beyond 75 percent will reduce their need to rely on other emission reduction measures or building blocks.
b.
Historical generation shifts to NGCC generation.
In 2012, total electric generation from existing NGCC units was 966 TWh.[667]
After the application of the building block 2 potential (increasing NGCC utilization up to a 75 percent capacity factor on a net summer basis, including generation from NGCC units that were under construction), the total generation
( printed page 64800)
from these existing sources is assumed to be 1,498 TWh.[668]
The EPA believes that producing this quantity of generation from this set of NGCC units is feasible. To put this level of generation into context, NGCC generation increased by approximately 439 TWh (an 83 percent increase) between 2005 and 2012. The EPA calculates that assumed NGCC generation in 2022 through the quantification of building block 2 potential is approximately 44 percent higher than 2014 levels. This reflects a smaller growth rate in potential NGCC generation between 2015 and 2022 than has been observed in practice from 2005 to 2012, a time period of the same duration.
c.
Reliability.
We also expect that an increase in NGCC generation of this amount would not impair power system reliability. Sources can achieve increases in utilization of existing NGCCs that displace generation from steam sources without impacting reliability because this shift in average annual utilization across existing EGUs does not inhibit the power sector's ability to maintain adequate dispatchable resources to continue to meet reserve margins and maintain reliability. Furthermore, sources are not required to achieve the exact or even the full extent of the building block 2 generation shift itself, which means that sources will have ample flexibility to maintain reliability-relevant operations while achieving emission reductions through a variety of measures.[669]
d.
Natural gas infrastructure.
The EPA also examined the technical capability of the natural gas supply and delivery system to provide increased quantities of natural gas and the capability of the electricity transmission system to accommodate shifting generation patterns. For several reasons, we conclude that these systems would be capable of supporting the degree of increased NGCC utilization potential in building block 2. First, the natural gas pipeline system is already supporting national average NGCC utilization rates of 60 percent or higher during peak hours, which are the hours when constraints on pipelines or electricity transmission networks are most likely to arise. NGCC unit utilization rates during the range of peak daytime hours from 10 a.m. to 9 p.m. are typically 15 to 20 percentage points above their average utilization rates (which have recently been in the range of 40 to 50 percent).[670]
Fleet-wide combined-cycle average monthly utilization rates have reached 65 percent,[671]
showing that the pipeline system can currently support these rates for an extended period. If the current pipeline and transmission systems allow these utilization rates to be achieved in peak hours and for extended periods, it is reasonable to expect that similar utilization rates should also be possible in other hours when constraints are typically less severe, and be reliably sustained for other months of the year. Furthermore, the NGCC utilization increase assumed in building block 2 could occur without a significant impact on peak demand for natural gas, including winter demand (when the power sector's demand for natural gas competes with other sectors' demands for natural gas), since increasing annual utilization of NGCCs could focus on non-peak periods when NGCC capacity factors are currently low.
The second consideration supporting a conclusion regarding the adequacy of the gas supply infrastructure is that pipeline and transmission planners have repeatedly demonstrated the ability to methodically relieve bottlenecks and expand capacity.[672]
Natural gas pipeline capacity has regularly been added in response to increased gas demand and supply, such as the addition of large amounts of new NGCC capacity from 2001 to 2003, or the delivery to market of unconventional gas supplies since 2008. These pipeline capacity increases have added significant deliverability to the natural gas pipeline network to meet the potential demands from increased use of existing NGCC units. Over a longer time period, much more significant pipeline expansion is possible. In previous studies, when the pipeline system was expected to face very large demands for natural gas use by electric utilities, the pipeline industry projected that increases of up to 30 percent in total deliverability out of the pipeline system would be possible.[673]
There have been notable pipeline capacity expansions over the past five years, and substantial additional pipeline expansions are currently under construction.[674]
Further, the phasing in of building block 2's potential in the determination of the BSER; the flexible nature of multi-year compliance with the ultimate emission reduction requirements of the rule; and the seven years between finalization of this rule and the first year of compliance provide time for infrastructure improvements to occur should they prove necessary in some locations. Combining these factors of currently observed average monthly NGCC utilization rates of up to 65 percent, the flexibility of the emission guidelines, the rates of historical growth, and the availability of time to address any existing pipeline infrastructure limitations, it is reasonable to conclude that the natural gas pipeline system can reliably deliver sufficient natural gas supplies to allow NGCC utilization to increase up to an average annual capacity factor of 75 percent on a net summer basis.
e.
Natural gas production.
We recognize that an increase in NGCC utilization rates at existing units corresponds with an associated increase in natural gas production, consistent with the current trends in the natural gas industry. The EPA expects the growth in NGCC generation assumed for building block 2 to be feasible and consistent with the production potential of domestic natural gas supplies. Increases in the natural gas resource base have led to fundamental changes in the outlook for natural gas. There is general agreement that recoverable natural gas resources will be substantially higher for the foreseeable future than previously anticipated, exerting downward pressure on natural gas prices. According to EIA, proven natural gas reserves have doubled between 2000 and 2012. Domestic dry gas production has increased by 25 percent over that same timeframe (from 19.2 TCF in 2000 to 24.0 TCF in 2012).
( printed page 64801)
EIA's Annual Energy Outlook Reference Case for 2015 projects that production will further increase to 29.5 TCF by 2022 and 33 TCF by 2030, as a result of increased supplies and favorable market conditions. In the AEO 2015 high oil and gas resource case, production is projected to increase to 42.7 TCF in 2030. For comparison, building block 2 assumes NGCC generation growth of 235 TWh from 2012 to reach the level assumed for 2022, and that NGCC generation growth would result in increased gas consumption of less than 2 TCF for the electricity sector, which is less than EIA's projected increase in natural gas production of 5.5 TCF from 2012 to 2022.
The EPA has also assessed the ability of the electricity and natural gas industries to achieve the potential quantified for building block 2 using the Integrated Planning Model (IPM). IPM is a multi-regional, dynamic, deterministic linear programming model of the U.S. electric power sector that the EPA has used for over two decades to evaluate the economic and emission impacts of prospective environmental policies. To inform its projections of least-cost capacity expansion and electricity dispatch, IPM incorporates representations of constraints related to fuel supply, bulk power transmission capacity, and unit availability. The model includes a detailed representation of the natural gas pipeline network and the capability to project economic expansion of that network based on pipeline load factors. At the EGU level, IPM includes detailed representations of key operational limitations such as turn-down constraints, which are designed to account for the cycling capabilities of EGUs to ensure that the model properly reflects the distinct operating characteristics of peaking, cycling, and base load units.
As described in more detail below, the EPA used IPM to assess the costs of increasing generation from existing NGCC capacity. IPM was able to meet average NGCC utilization rates of 75 percent on a net summer basis, while observing the market, technical, and regulatory constraints represented in the model. This modeling also demonstrates the ability of domestic natural gas supplies to increase their production levels, and deliver that supply through the pipeline network, to support the level of NGCC generation quantified in building block 2. Such a result is consistent with the EPA's determination that increasing the average utilization rate of existing NGCC units to 75 percent would be technically feasible.
f.
Transmission planning and construction.
Achieving the generation shift quantified in building block 2 would not impose significant additional burden on the transmission planning process and does not necessitate major construction projects. Two considerations are important for this conclusion:
First, building block 2 applies only to increases in generation at
existing
NGCC facilities and does not contemplate any connection of new capacity to the bulk power grid. Second, regional grids are already supporting operation of the NGCC units for sustained periods of time at the capacity factors quantified in building block 2.[675]
Although some upgrades to the grid (including potential, but modest, expansions of transmission capacity) may be necessary to support the extension of the time that these capacity factors are sustained over the course of the annual time period on which building block 2 is based, such upgrades are part of the normal planning process around the increased use of existing facilities. In fact, the electric transmission system is currently undergoing substantial expansion.[676]
Consequently, EPA does not believe that achieving the generation shift potential in building block 2 would necessitate any significant additional requirements for transmission planning and construction beyond those already being addressed at routine intervals by the power sector. Furthermore, the phasing in of building block 2's potential in the determination of the BSER; the flexible nature of multi-year compliance with the ultimate emission reduction requirements of the rule; and the seven years between finalization of this rule and the first year of compliance all provide time for infrastructure improvements to occur should they prove necessary in some locations.
g.
Regulatory flexibility.
The final consideration supporting our view that natural gas and electricity system infrastructure would be capable of supporting increased NGCC unit utilization rates at a maximum of 75% on a net summer basis is the substantial unit-level compliance flexibility of the emission guidelines. The final rule does not require any particular NGCC unit to achieve any particular utilization rate in any specific hour or year. Thus, even if isolated natural gas or electricity system constraints were to limit NGCC unit utilization rates in certain locations in certain hours, this would not prevent an increase in NGCC generation overall across a state or broader region and across all hours on the order assumed in the generation shift potential quantified for building block 2.
4. Cost
Having established the technical feasibility and quantification of the potential to replace incremental generation at higher-emitting EGUs with generation at NGCC facilities as a CO2
emissions reduction strategy, we next turn to the question of cost. The cost of the power sector CO2
emission reductions that can be achieved through shifting generation among existing fossil fuel-fired EGUs depends on the relative variable costs of electricity production at EGUs with different degrees of carbon intensity. These variable costs are driven by the EGUs' respective fuel costs and by the efficiencies with which they can convert fuel to electricity (
i.e.,
their heat rates). Historically, natural gas has had a higher cost per unit of energy content (
e.g.,
MMBtu) than coal in most locations, but for NGCC units this disadvantage in fuel cost per MMBtu relative to coal-fired EGUs is typically offset in significant part, and sometimes completely, by a technological heat rate advantage.
To consider the cost implications of building block 2, the EPA expanded upon the proposal's extensive analysis of the magnitude and cost of CO2
emission reductions through generation shifting within defined areas (consistent with the application of building blocks for performance rate- and state goal-setting), without consideration of the availability of other emission reduction methods ultimately available to units for compliance.
To evaluate how EGU owners and grid operators could respond to a state plan's possible requirements, signals, or incentives to shift generation from more carbon-intensive to less carbon-intensive EGUs, the EPA analyzed a series of scenarios in which the fleet of NGCC units within each of the regions considered for quantifying BSER (
i.e.,
the three interconnections) was directed to achieve a specified average annual utilization rate across that region on a net basis while maintaining a fixed level of aggregate generation in that region
( printed page 64802)
across all existing fossil fuel-fired sources. The EPA conducted such scenarios to address average utilization rates of 70 percent, 75 percent and 80 percent on a net basis, allowing for shifting of fossil generation between existing units within the regions described above. This scenario identifies a generation pattern that would meet electricity demand at the lowest total cost, subject to all other specified operating and bulk power transfer constraints for the scenario, including the specified average NGCC unit utilization rate.
The costs of the various scenarios were evaluated by comparing the total costs and emissions from each scenario to the costs and emissions from a base case scenario. For the scenario reflecting a 75 percent NGCC utilization rate on a net basis with regional fossil generation shifting, comparison to the base case indicates that the average cost of the CO2
reductions achieved over the 2022-2030 period was $24 per short ton of CO2. We view these estimated costs as reasonable and therefore as supporting the use of a 75 percent net utilization rate target for purposes of quantifying the emission reductions achievable at a reasonable cost through the application of building block 2 in the BSER.
We also conclude from these analyses that potential impacts to fuel prices and electricity prices from achieving the extent of fossil generation shifting quantified for this building block are reasonably within the bounds of power sector experience. For example, in the 75 percent NGCC unit utilization rate scenario where generation shifting is limited to regional boundaries, the delivered natural gas price was projected to increase by an average of 7 percent over the 2022-2030 period, which is well within the range of historical natural gas price variability.[677]
Projected wholesale electricity price increases over the same period were less than 4 percent, which similarly is well within the range of historical electric price variability. These projected impacts on prices were captured in the emission reduction costs of these scenarios already described above, which are reasonable and support use of a 75 percent NGCC utilization rate target for purposes of quantifying the emission reductions achievable through application of the BSER.
However, we also note that the costs (and their incorporated price impacts) just described are higher than we would expect to actually occur in real-world compliance with the final rule's compliance requirements for the following reasons. First, this analysis does not capture the building block 2 phase-in, which assumes an average utilization rate over the interim period of less than 75 percent in all three interconnections. Second, the analysis overstates the extent to which building block 2 is ultimately reflected in the source category performance rates. While the performance rate computation procedure assumes a maximum NGCC utilization rate of 75 percent on a net summer basis, the Eastern Interconnection's realization of this level of NGCC utilization yields higher source category performance rates for steam than what would have been calculated for units in the Western Interconnection and Texas Interconnection if they realized that maximum NGCC utilization rate in conjunction with the other building blocks. In other words, there is substantial building block 2 potential in the Western Interconnection and Texas Interconnection that is not actually captured in the source category performance rates that are ultimately assigned to steam through this rate- and goal-setting approach (where the performance rates are ultimately determined by the BSER region with the highest rate outcome in the calculation). Therefore, the building block 2 analysis overstates the cost of this component of BSER to the extent that it assumes achievement of this generation shift potential that is not reflected in the source category performance rates ultimately determined. Third, as a practical matter, sources will be able to achieve additional emission reductions through other measures that may prove to be less costly than generation shifting and could substitute for the reductions and costs considered here. These building block 2 analyses were focused on evaluating the potential impacts of fossil generation shifting in isolation, and as a result, they do not consider states' and sources' flexibility to choose among alternative CO2
reduction strategies that could offer lower-cost reductions, instead of relying on fossil generation shifting to the extent analyzed here.
Based on the analyses summarized above, the EPA concludes that an average annual utilization rate for each region's NGCC units of up to 75 percent is a technically feasible, cost-effective, and adequately demonstrated building block for BSER.
For further information on the analysis discussed in this section, see Chapter 3 of the GHG Mitigation Measures TSD for the CPP Final Rule.
5. Major Comments and Responses
The EPA received numerous comments regarding building block 2. Many of these comments provided helpful information and insights and have resulted in improvements to the rule. This section summarizes some of these comments, and the remainder of the comments are responded to in the Response to Comment document, available in the docket.
The EPA received comment regarding the potential for an increase in upstream methane emissions from increased utilization of natural gas. Our analysis found that the net upstream methane emissions from natural gas systems and coal mines and CO2
emissions from flaring of methane will likely decrease under the Clean Power Plan. Furthermore, the changes in upstream methane emissions are small relative to the changes in direct emissions from power plants. The technical details supporting this analysis can be found in the Regulatory Impact Analysis.
Commenters also expressed concern that neither a utility nor any state agency controls dispatch in most states. The EPA believes these comments fail to adequately appreciate that the utilities do control the dispatch of units that they own and/or operate, either by being the actual dispatch agent in many cases where there is no RTO or ISO that schedules the dispatch, or by the choice of units and bids they offer into an organized electricity market operated by an RTO or ISO. These entities currently control the dispatch of their units while respecting all existing requirements from environmental rules. This final rule does not change these current circumstances and makes clear that it is the EGU that is responsible for meeting the requirements in the state plan; the state is responsible for the development of that plan, but the state does not need to control the dispatch.
Other comments object to the use of a single capacity factor for all existing NGCCs to quantify building block 2 potential on the grounds that not all units may be able to achieve this utilization level, and that some units may be designed for cycling and so may need upgrades to sustain such utilization. The EPA disagrees with these comments. The 75 percent capacity factor establishes a regional potential for generation from existing NGCC capacity, and it does not establish any individual unit requirements.
Some comments argue that generation limits in permits for some existing NGCC units will limit the amount by
( printed page 64803)
which these units can increase their generation and thereby limit the feasibility of building block 2. The EPA disagrees with these comments. Although permit limits can constrain the ability of individual units to operate above certain levels, building block 2 was developed conservatively, with units operating on average at a level below the maximum levels at which some units have demonstrated the capability to operate. No individual unit is required to achieve the average generation levels used to quantify building block 2. Further, permit limits at individual units can be considered when state plans are developed. There are many flexibilities in the final rule, including the opportunity to establish standards of performance that incorporate emissions trading or develop plans that will respect any existing permit limits at individual units.
The EPA also received comments asserting that increasing generation from new renewables would require increased use of natural gas capacity for back-up and ramping, and therefore it is not possible for NGCC units to run at BSER utilization rates and also be available to support the additional variable renewable generation resulting from building block 3. The EPA disagrees with this comment. The 75% net summer utilization rates defined by building block 2 is a conservative assessment and applied on an annual average basis. It is therefore possible for these existing units to both operate at higher annual utilization rates, and also to operate at higher rates during limited periods and still maintain a 75% net summer average annual utilization rate. While variable renewable generation does require additional load following and ramping resources and unit cycling, these requirements are generally a small part of the overall ramping costs of the system (see NREL, Relevant Studies for NERC's Analysis of EPA's Clean Power Plan 111(d) Compliance). Additionally, while existing NGCC units are an efficient source of ramping to support variable renewables, other units running in an intermediate mode can also provide load following and ramping.
E. Building Block 3—New Zero-Emitting Renewable Generating Capacity
The third element of the foundation for the EPA's BSER determination for reducing CO2
emissions at affected fossil fuel-fired EGUs entails an analysis of the extent to which generation at the affected EGUs can be replaced by using an expanded amount of zero-emitting renewable electricity (RE) generating capacity to produce replacement generation.
In this section we address first the history of and then trends in RE development, as well as the importance of expanding the use of RE. Next we discuss the ability of affected EGUs to access generation from new RE generating capacity, followed by a discussion of renewable energy certificate (REC) markets. We then describe the quantification of the amount of generation from new RE generating capacity achievable through building block 3, including key comments, changes made from the proposal, the method by which RE target generation levels are quantified, and the magnitude and timing of increases in RE generation associated with this building block. Next, we discuss the feasibility of implementing the identified incremental amounts of RE generation. Finally, we address the costs associated with those increases in RE generation.
1. History of RE Development
RE generating technologies are a well-established part of the utility power sector. These technologies generate electricity from renewable resources, such as wind, sun and water. While RE has been used to generate electricity for over a century, the push to commercialize RE more broadly began in the 1970s.[678]
Following a series of energy crises, new federal organizations and initiatives were established to coordinate energy policy and promote energy self-sufficiency and security, including solar energy legislation, the Public Utility Regulatory Policies Act of 1978 (PURPA) and the 1980 Energy Security Act.[679]
PURPA was a key step in stimulating RE development. By requiring utilities to purchase generation from qualifying facilities (
i.e.,
certain CHP and RE generators) at avoided costs, PURPA opened electricity markets to more RE generation and gave rise to non-utility generators that were willing to try new RE technologies.[680]
In addition, since 1992, federal tax policy has provided important financial support via tax credits for the production of RE and investments in RE.
States have also taken a significant lead in requiring the development of RE resources. In particular, a number of states have adopted renewable portfolio standards (RPS), which are regulatory mandates to increase production of RE. As of 2013, 29 states and the District of Columbia had enforceable RPS or similar laws.[681]
These RPS requirements continue to drive robust near-term growth of non-hydropower RE.
2. Trends in RE Development
Today, RE is tightly integrated with the utility power sector in multiple ways: States have set RE targets for electrical load serving entities; utilities themselves are diversifying their portfolios by contracting with RE generators; and new RE generators are being developed to provide more electrical power grid support services beyond just energy (
e.g.,
modern electronics allow wind turbines to provide voltage and reactive power control at all times).[682 683]
Use of RE continues to grow rapidly in the U.S. In 2013, electricity generated from RE technologies, including conventional hydropower, represented 12 percent of total U.S. electricity, up from 8 percent in 2005.[684]
In 2013, U.S. non-hydro RE capacity for the total electric power industry exceeded 80,000 megawatts, reflecting a fivefold increase in just 15 years.[685]
In particular, there has been substantial growth in the wind and solar photovoltaic (PV) markets in the past decade. Since 2009, U.S. wind generation has tripled and solar generation has grown twentyfold.[686]
The global market for RE is projected to grow to $460 billion per year by
( printed page 64804)
2030.[687]
RE growth is further spurred by the significant amount of existing natural resources that can support RE production in the U.S.[688]
In the Energy Information Administration's Annual Energy Outlook 2015, RE generation grows substantially from 2013 to 2040 in the reference case and all alternative cases.[689]
In the reference case, RE generation increases by more than 70 percent from 2013 to 2040 and accounts for over one-third of new generation capacity.[690]
The recent and projected growth of RE is in part a reflection of its increasing economic competitiveness. Numerous studies have tracked capital cost reductions and performance improvements for RE, particularly for solar and wind. For instance, Lazard's analysis of wind and utility-scale solar PV levelized costs of energy (LCOE), on an unsubsidized basis, over the last five years found the average percentage decrease of high and low of LCOE ranges were 58 percent and 78 percent, respectively.[691]
Analyses of wind's competitiveness found falling wind turbine LCOE while the wind industry developed projects at lower wind speed sites using new turbine designs (
e.g.,
increased turbine hub heights and rotor diameters). Performance improvements have come from novel deployments of new turbines designed for lower quality wind sites that are deployed at higher quality wind sites, which have resulted in capacity factor increases for these locations.[692 693]
For utility-scale solar, cost and performance have also improved significantly. Analysis has shown that the installed price of solar photovoltaics (PV) systems, prior to any incentives, has declined substantially since 1998. Capacity-weighted average prices of solar PV in utility-scale deployments were 40 percent lower in 2013 than five years earlier.[694 695]
Initially, price declines were partially driven by oversupply and manufacturers' thin margins, but, in 2014, prices have remained low due to reductions in manufacturing costs.[696]
The capacity factors of new utility-scale installations have increased as systems are optimized to maximize energy production. For example, a growing number of utility-scale PV systems are increasing the direct current capacity of the solar array relative to the alternating current rating of the array's inverter to increase energy production and improve project economics.[697]
The cost and performance improvements for wind and solar are driven by increased scale of production, improved technologies, and advancements in system deployments.
3. Importance of Increasing Use of RE
Currently, the utility power sector accounts for 40 percent of total annual energy consumption in the U.S.[698]
Introducing more zero-emitting RE generation over the long term could significantly reduce CO2
emissions, as production of RE predominantly replaces fossil fuel-fired generation and thereby avoids the emissions from that replaced generation.
A number of studies and recent policy developments have acknowledged RE as an important means of achieving CO2
reductions. California cited the reduction of CO2
emissions from electrical generations as one of the reasons for increasing its RE target from 20 percent to 33 percent by 2020 (and potentially 50 percent by 2030).[699]
A recent IPCC report also concluded that RE has large potential to mitigate CO2
emissions.[700]
Increased use of RE provides numerous benefits in addition to lower CO2
emissions. RE typically consumes less water than fossil fuel-fired EGUs. Wind power and solar PV systems do not require the use of any water to generate electricity; water is only needed for cleaning to ensure efficient operation. In contrast, utility boilers, in particular, require large quantities of water for steam generation and cooling.[701]
Increasing RE use will also continue to lower other air pollutants (
e.g.,
fine particles, ground-level ozone, etc.). In addition, the RIA notes that increasing RE will diversify energy supply, hedge against fossil fuel price increases and create economic development and jobs in manufacturing, installation, and other sectors of the economy.
4. Access to RE by Owners of Affected EGUs
The ability of affected EGUs to co-locate or obtain incremental RE to reduce CO2
emissions is well-demonstrated, whether it is through direct ownership, bilateral contracts, or procurement of the environmental attributes associated with RE generation.[702]
Consequently, the EPA believes that an increase in RE is a proven way to reduce CO2
emissions at affected EGUs of all types at a reasonable cost.
Owners and operators of affected EGUs across the U.S. already have substantial opportunities to procure RE regardless of their organizational structure and/or business model. In many parts of the country, EGUs are owned and operated by vertically integrated utilities. These utilities can be investor-owned utilities that operate under traditional electricity regulation, municipal utilities (munis), or electric cooperatives (co-ops). These utilities have significant control over the types of generating capacity they develop or acquire, and over the electricity mix used to meet demand within their service territories.
Even when EGU owners participating in organized markets do not directly determine dispatch among energy sources, such EGU owners make
( printed page 64805)
decisions about what types of capacity they choose to develop and thus what generation mix they can ultimately supply into that market's dispatch choices. Because zero-emitting RE technologies have relatively low variable costs, an EGU owner's decision to install (or to finance the installation of) RE capacity will yield lower-cost electricity generation that, when available, a system dispatcher will prefer over higher-variable-cost generation from fossil fuel-fired capacity. Therefore, all owners of affected EGUs have a direct path for replacing higher-emitting generation with RE regardless of their organizational type and regardless of whether they operate in a cost-of-service framework or in a competitive, organized market.
Many affected EGUs have already directly invested in RE. Of the 404 entities that owned part of at least one affected EGU under this rule, 178 also owned RE (biomass, geothermal, solar, water or wind). These 178 owners owned 82 percent of affected EGU capacity. As a whole, these entities' share of RE capacity was equal to 25 percent of the total of their affected EGU capacity.[703]
Some of the largest owners of affected EGUs also owned RE (see Table 8). For example, NRG Energy, Inc. owns more than 3,000 megawatts of RE capacity, over 20 percent of which (nearly 800 megawatts) is solar, and almost 80 percent of which (over 2,500 megawatts) is wind. Duke Energy Corporation owns 175 megawatts of solar and over 1,500 megawatts of wind. NextEra Energy, Inc.'s share of RE capacity approaches 40 percent of their total affected EGU capacity.[704]
Table 8 lists a sampling of affected EGUs that have large amounts of fossil fuel-fired capacity and RE capacity:
Table 8—Sample of Owners of Affected EGUs and RE Capacity 705 706
Ultimate parent
Affected EGU capacity
(MW)
Renewable
capacity
(MW)
NRG Energy, Inc
48,787
3,149
Duke Energy Corporation
39,028
5,526
Southern Company
37,168
3,245
American Electric Power Company, Inc
34,940
1,142
NextEra Energy, Inc
29,471
11,626
Calpine Corporation
23,878
1,509
Tennessee Valley Authority
21,717
5,427
Berkshire Hathaway Inc
18,899
6,650
FirstEnergy Corp.
16,175
1,371
Exelon Corporation
10,283
3,361
Nebraska Public Power District
2,003
90
Basin Electric Power Cooperative
1,526
275
American Municipal Power, Inc
1,112
53
Sacramento Municipal Utility District
925
834
Golden Spread Electric Cooperative, Inc
521
78
Large
vertically integrated utilities generally have multiple options for investing in RE, including building their own RE capacity or procuring RE under a long-term power purchase agreement. Municipal utilities and rural cooperatives that own generating asset portfolios, particularly generation and transmission cooperatives and larger municipal utilities, have also used RE to reduce carbon emissions. Large generation and transmission cooperatives also purchase significant quantities of RE for their members. Federal power authorities own or contract for significant amounts of RE.[707 708]
The list of ten electric utilities with the largest amounts of wind power capacity on the system (owned or under contract) includes a variety of affected EGU organizational structures, including vertically integrated investor-owned utilities, municipal utilities, and federal power authorities. Xcel Energy and Berkshire Hathaway Energy rank first and second with 5,736 megawatts and 4,992 megawatts of wind capacity, respectively. Tennessee Valley Authority, a federal power authority, had 1,572 megawatts and CPS Energy, a public utility, had 1,059 megawatts of wind power capacity.[709]
Basin Electric Power Cooperative had 716 megawatts and was the top ranked cooperative utility, but is not on the top ten utilities with wind power capacity list.
Many affected EGUs are already planning on deploying significant amounts of RE according to their integrated resource plans (IRPs). Electric utilities use IRPs to plan operations and investments over long time horizons. These plans typically cover 10 to 20 years and are mandated by public utility commissions (PUCs). A recent study of IRPs, included in the docket for this rulemaking, shows this trend.[710]
For instance, Dominion plans for over 800 megawatts of wind and solar in their 2015 to 2029 planning period.[711]
Duke Energy Carolinas' IRP has no plans for new coal, but describes plans for roughly 1,250 megawatts of additional RE by 2021, and approximately 2,150 megawatts by 2029. A significant
( printed page 64806)
portion (1,670 megawatts) of the planned RE is solar.[712]
Ameren is planning to retire one-third of the coal generating capacity, as well as installing an additional 400 megawatts of wind, 445 megawatts of solar, and 28 megawatts of hydroelectric generating capacity.[713]
Independent power producers (IPPs) also can and do own both RE and fossil generation. For example, NRG is a diversified IPP that operates substantial coal, natural gas, wind, solar, and nuclear capacity. NRG demonstrates the ability of IPPs to reduce utilization of fossil fuel-fired EGUs and replace that generation with RE. NRG announced a goal to cut CO2
emissions from its fleet by 50 percent by 2030 (from a 2014 baseline).[714]
NRG has already reduced CO2
emissions from its fleet by 40 percent since 2005. This achievement demonstrates that when an IPP commits to shifting its generation portfolio, it can do so at reasonable cost and without reliability impacts. The NRG example shows that reduced utilization of fossil fuel-fired EGUs that is replaced by RE also owned by the EGU owner is adequately demonstrated.
EGU owners can also replace fossil fuel-fired generation with RE through bilateral contracts and REC purchases, as described below. Both the bilateral market for RE contracts and REC markets are well-developed. There are no legal or technical obstacles to a fossil fuel-fired EGU owner acting as the counterparty of a bilateral contract for purchase of energy from a RE facility. Any type of EGU owner (utility or otherwise) can purchase and retire RECs. The fact that RECs are purchased by a diverse set of market participants—including residential consumers, commercial businesses, and industrial facilities—demonstrates that such a purchase for all EGU owners is adequately demonstrated.
5. REC Markets
Affected EGU owners do not need to directly invest in, or own, renewable generating capacity in order to replace fossil fuel-fired generation with RE as an emission reduction measure. RECs are used to demonstrate compliance with state RE targets, such as state RPS, and also to substantiate claims stemming from RE use. RECs are tradable instruments that are associated with the generation of one megawatt-hour of RE and represent certain information or characteristics of the generation, called attributes.[715]
RECs may be traded and transferred regardless of the actual energy flow.
The legal basis for RECs is established by state statutes and administrative rules. Nearly all states with a mandatory RPS have established RECs as a means of compliance. The Federal Energy Regulatory Commission (FERC) has observed that states created RECs to facilitate programs designed to promote increased use of RE, and that “attributes associated with the [RE] facilities are separate from, and may be sold separately from, the capacity and energy.” [716]
In complying with states' RPS requirements, utilities have contracted for RECs from in-state and out-of-state resources in accordance with RPS requirements. Utilities may have sourced RECs from out-of-state to reduce the cost of compliance, to source RECs from specific generation types, or for other reasons.[717]
The development of REC markets to facilitate RPS compliance provides evidence that markets can develop to facilitate compliance with rate-based state plans. These markets will afford affected EGU owners an alternative to directly invest in, or own, renewable generating capacity in order to replace fossil fuel-fired generation with RE as an emission reduction measure.
6. Quantification of RE Generation Potential for BSER and Major Comments
The methodology for quantifying RE generation levels under building block 3 is a modified version of the alternative RE approach from proposal, with adjustments that reflect the data and information the EPA collected through stakeholder comments and the EPA's additional analysis and information collection. In evaluating the proposed and alternative RE approaches commenters observed that RPS, as the basis for quantifying RE generation levels under the proposed approach, are policy instruments that states may choose to implement for a variety of reasons not related to CO2
emission reductions. Additionally, differences across RPS policies in eligible resources, crediting mechanisms, deliverability requirements, alternative compliance payments, and other policy elements made the regional averaging of state-level RPS requirements challenging. Finally, commenters provided data demonstrating that RE resource potential can vary significantly within the regions identified under the proposed approach, producing state-level RE generation levels that may not be aligned with the opportunity to deploy incremental RE resources at reasonable cost. In contrast, commenters argued that a methodology similar to the alternative RE approach, which is based on economic potential, represents a more technically sound basis for quantifying building block 3 target generation levels that accounts for regional differences in RE resources and power market conditions, such as projected fuel prices, load growth and wholesale power prices. The EPA agrees with these comments.
Within the framework of the alternative RE approach, the EPA received significant comments on a number of issues, including the use of historical deployment rates, the interstate nature of RE and the power system, merits of total versus incremental RE generation as the metric by which building block 3 generation levels are quantified, types of RE technologies that contribute to those generation levels, cost and performance estimates associated with those RE technologies, magnitude of the reduced cost applied to new RE capacity as an incentive to deploy, and application of a nationally uniform benchmark development rate to modeled projections of economic deployment. Based on commenter data and information, as well as further analysis and information collection, the primary adjustments the EPA made to the alternative RE approach are:
The basis for quantifying building block 3 generation has been modified to incorporate historical deployment patterns for RE technologies as well as the economic potential identified through modeling projections. The introduction of historical capacity additions to the final methodology further grounds building block 3 generation
( printed page 64807)
in demonstrated levels of RE deployment that have been successfully incorporated into the power system. This adjustment also serves to harmonize the approach across all three building blocks in which historical data is the primary basis for identifying emission reduction opportunities under the BSER.
The RE technologies used to quantify building block 3 generation levels are onshore wind, utility-scale solar PV, concentrating solar power (CSP), geothermal and hydropower. Each of these technologies is a utility-scale, zero-emitting resource that was included under the alternative RE approach at proposal. Additionally, the EPA received significant comments on the opportunities and challenges associated with distributed RE technologies. Distributed technologies, as a demand-side resource, present unique data and technical challenges (such as the role of evaluation, measurement and verification (EM&V) procedures in verifying their production, the diverse economic incentives of different parties involved in their deployment, and the variety of grid integration policies and conditions across potential deployment sites) that complicate identifying a technically feasible and cost-effective level of generation. Consequently, the EPA is, at this time, choosing not to include distributed technologies as part of the BSER (although, as explained in section VIII.K of this preamble, distributed RE technologies that meets eligibility criteria may be used for compliance). Finally, any RE technology that has not been deployed in the U.S., including demonstrated RE technologies for which there is clear evidence of technical feasibility and cost-effectiveness (e.g.,
offshore wind), contributes no generation to building block 3 under this historically-based methodology. These RE technologies are consequently reserved for compliance, which offers affected EGUs additional flexibility and will reduce their need to rely on other emission reduction measures or building blocks.
Building block 3 generation levels are expressed in terms of incremental, rather than total, RE generation. As a metric, incremental generation is better aligned with quantifying an amount of expanded RE to replace generation at affected EGUs.[718]
Specifically, the generation levels under building block 3 include generation from capacity that commenced operation subsequent to 2012 (the data year on which the BSER is evaluated). Commenters remarked that it is unnecessary to include generation from RE capacity that was already in operation by 2012 in building block 3 because the impact of that generation on fossil fuel-fired EGUs is already reflected in the observed 2012 emissions and generation data of those EGUs.
Due to the interstate nature of RE and the power system, and consistent with the rationale provided in the October 2014 Notice of Data Availability (NODA), building block 3 generation levels are quantified for each of the three BSER regions—the Eastern Interconnection, Western Interconnection, and Texas Interconnection—rather than at the state-level. This regionalized approach, as described in the NODA, takes into account the opportunity to develop regional RE resources and thus better aligns building block 3 generation levels with the rule's approach to allowing the use of qualifying out-of-state renewable generation for compliance.
Commenters observed that the cost and performance estimates the EPA relied on at proposal from the Energy Information Administration's Annual Energy Outlook 2013 do not reflect the decline in cost and increase in performance that have been demonstrated by current projects, particularly in regards to wind and solar technologies. Commenters provided data from a variety of sources to support these claims, including Lawrence Berkeley National Laboratory (LBNL), the Department of Energy (DOE) and Lazard. Each of these sources supported the contention that RE technologies, particularly wind and solar, have realized gains in cost and efficiency at a scale that has altered the competitive dynamic between RE and conventional resources. As a result, it has become increasingly necessary for any long-term outlook of the utility power sector to continually assess the development of RE technology cost and performance trends. In performing this task, the EPA revised its data for onshore wind and solar technologies to reflect the mid-case estimates from the National Renewable Energy Laboratory's (NREL's) 2015 Annual Technology Baseline. The EPA selected the NREL 2015 Annual Technology Baseline (ATB) estimates based on the quality of its data as well as NREL's demonstrated success in both reflecting and anticipating RE cost and performance trends. In addition to wind and solar technologies, the EPA evaluated hydropower deployment potential based on the latest cost and performance data from NREL's Renewable Energy Economic Potential study.[719]
The benchmark development rate that constrained cost-effective RE deployment under the alternative RE approach in the proposal has been removed from the final methodology.[720]
Commenters detailed several issues with applying the benchmark development rate, including that it does not factor in the total size of the RE resource in a given state and is inconsistent with a regional approach to quantifying target generation levels. EPA agrees with these comments and the benchmark development rate has been eliminated.
In addition to the comments described above, the EPA received significant comments on a wide variety of topics related to building block 3. Many of these comments provided helpful information and insights, and have resulted in improvements to the final rule. These comments, as well as the EPA responses, are available in the Response to Comment document.
The final methodology for quantifying incremental RE target generation levels contains seven steps. Each step is described below.[721]
First, the EPA collected data for each RE technology (onshore wind, utility-scale solar PV, CSP, geothermal and hydropower) to determine the annual change in capacity over the most recent five-year period. From these data, the EPA calculated the five-year annual average change in capacity and the five-year maximum annual change in capacity for each technology.
Second, the EPA determined an appropriate capacity factor to apply to each RE technology that would be representative of expected future performance from 2022 through 2030. For this purpose the EPA relied on NREL's ATB.
Third, the EPA calculated two generation levels for each RE technology. The first generation level is the product of each technology's five-year average capacity change and the assumed future capacity factor. The second generation level is the product of each technology's five-year maximum annual capacity deployment and the assumed future capacity factor. Table 9 below shows the data and assumptions used for these calculations.
( printed page 64808)
Table 9—Historical Capacity Changes and Associated Generation Levels
Assumed
future
capacity
factor
(percent)
Five-Year
average
capacity
change (MW)
Generation
associated
with five
year-average
capacity
change (MWh)
Maximum
annual
capacity
change (MW)
Generation
associated with maximum
annual
capacity
change (MWh)
Utility-Scale Solar PV722
20.7
1,927
3,494,268
3,934
7,133,601
CSP
34.3
251
754,175
767
2,304,590
Onshore Wind
41.8
6,200
22,702,416
13,131
48,081,520
Geothermal
85.0
142
1,057,332
407
3,030,522
Hydropower
63.8
141
788,032
294
1,643,131
Total Generation
N/A
N/A
28,796,222
N/A
62,193,363
Fourth, the EPA quantified the RE
generation from capacity commencing operation after 2012 that can be expected in 2021 (the year before this rule's first compliance period) without the imposition of this rule. Because building block 3 is focused on the ability of fossil fuel-fired EGUs to reduce their emissions by deploying incremental RE, it is reasonable to take into account the considerable amount of RE deployment that is already taking place and is projected to continue doing so before considering the additional deployment that would be motivated by this rule's mandate to reduce emissions from affected EGUs. The EPA considered its base case power sector modeling projections using IPM to quantify this component of future-year RE generation, which the EPA assumes to be 213,084,125 megawatt-hours in 2021.
Fifth, the EPA applied the generation associated with the five-year average capacity change to the first two years of the interim period. Combining the projected 2021 RE generation from capacity starting operation after 2012 with the generation increment associated with the five-year average change in capacity produces 241,880,347 megawatt-hours in 2022 and 270,676,570 megawatt-hours in 2023. The EPA believes it is appropriate to apply the generation associated with the five-year average capacity change for the first two years of the interim period to ensure adequate opportunity to plan for and implement any necessary RE integration strategies and investments in advance of the higher RE deployment levels assumed for later years.
Sixth, for all years subsequent to 2023 the EPA applied the generation associated with the maximum annual capacity change from the historical data analysis. In 2024, this produces a building block 3 generation level of 332,869,933 megawatt-hours (aggregated across all three BSER regions); by 2030, that generation level is 706,030,112 megawatt-hours.
Seventh, to further evaluate the technical feasibility and cost-effectiveness of the building block 3 generation levels (aggregated across all three BSER regions), as well as to produce interconnection-specific levels of building block 3 generation from the national totals described in steps 5 and 6, the EPA conducted analysis using IPM of a scenario directing the power sector to achieve those RE generation levels. IPM modeling projections assess opportunities for RE deployment in an integrated framework across power, fuel, and emission markets. The modeling framework incorporates a host of constraints on the deployment of RE resources, including resource constraints such as resource quality, land use exclusions, terrain variability, distance to existing transmission, and population density; system constraints such as interregional transmission limits, partial reserve margin credit for intermittent RE installations, minimum turndown constraints for fossil fuel-fired EGUs, and short-term capital cost adders to reflect the potential added cost due to competition for scarce labor and materials; and technology constraints such as construction lead times and hourly generation profiles for non-dispatchable resources by season.[723]
Additionally, the EPA assumes in this analysis that deployment of variable, non-dispatchable RE resources is limited to 20 percent of net energy for load by technology type and 30 percent of net energy for load in total at each of IPM's 64 U.S. sub-regions.[724]
The 30 percent constraint applied to variable, non-dispatchable RE resources reflects levels commonly modeled in grid integration studies at the level of the interconnection. These studies have demonstrated that impacts to the grid in reaching levels as high as 30 percent of net energy for load are relatively minor.[725]
For example, the Western Wind and Solar Study Phase 2 found cycling costs ranged from $0.14 to $0.67 per megawatt-hour of added wind and solar generation. These integration cost levels are not impactful in determining cost-effectiveness. As such, applying the 30 percent constraints at the IPM sub-region level is very conservative and provides a high degree of assurance that the RE capacity deployment pattern projected by the model would not incur significant grid integration costs.[726]
In addition to facilitating the EPA's assessment of the feasibility and cost of reaching the aggregate building block 3 generation levels across all three BSER regions, the IPM projections also provide the EPA with a basis for apportioning those generation levels to each interconnection. The EPA considered the projected regional location of the evaluated RE deployment in this analysis, which shows the
( printed page 64809)
majority of such deployment occurring in the Eastern Interconnection. The GHG Mitigation Measures TSD describes in greater detail the process by which the EPA calculated the apportionment of building block 3 generation levels to each of the BSER regions, taking these modeling projections into account. Table 10 describes the annual building block 3 generation levels for each interconnection from 2022 through 2030.
Table 10—Building Block 3 Generation Levels (MW
h
).
Year
Eastern
interconnection
Western
interconnection
Texas
interconnection
2022
166,253,134
56,663,541
18,963,672
2023
181,542,775
60,956,363
28,177,431
2024
218,243,050
75,244,721
39,382,162
2025
254,943,325
89,533,078
50,586,893
2026
291,643,600
103,821,436
61,791,623
2027
328,343,875
118,109,793
72,996,354
2028
365,044,150
132,398,151
84,201,085
2029
401,744,425
146,686,508
95,405,816
2030
438,444,700
160,974,866
106,610,547
Through the quantification methodology detailed above, the EPA has identified amounts of incremental RE generation that are reasonable, rather than the maximum amounts that could be achieved while preserving the cost-effectiveness of the building block. For example, assuming gradual improvement in RE technology capacity factors consistent with historical trends, expanding the portfolio of RE technologies that contribute to the building block 3 generation level, and applying the five-year maximum capacity change values to all years of the interim period are adjustments that would produce higher building block 3 generation levels and maintain the primacy of historical data in quantifying RE generation potential. External analysis and studies of RE penetration levels strongly support the technical feasibility and cost-reasonableness of RE deployment well in excess of the levels established by building block 3, as detailed in section V.E.7. By identifying reasonable rather than maximum achievable amounts, we are increasing the assurance that the identified amounts are achievable by the source category and providing greater flexibility to individual affected EGUs to choose among alternative measures for achieving compliance with the standards of performance established for them in their states' section 111(d) plans.
7. Feasibility of RE Deployment
The 2030 level of RE deployment and the rate of progress during the interim period in getting to that level are well supported by comments received, DOE and NREL analysis, and external studies evaluating the costs of and potential for RE penetration. The EPA has assessed the feasibility of RE in terms of deployment potential, system integration, reliability, backup capacity, transmission investments, and RE supply chains.
Historical RE deployment rates are a strong indication of the feasibility of the 2030 level of deployment and interim period pathway. The use of RE continues to grow rapidly in the U.S. In 2013, electricity generated from RE, including conventional hydropower, represented 12 percent of total U.S. electricity, up from 8 percent in 2005. In particular, there has been substantial growth in the wind and solar markets in the past decade. Since 2009, wind energy has tripled and solar has grown tenfold.
The expected future capacity installations in 2022-2030 needed to reach the 2030 level of incremental RE generation are consistent with historical deployment patterns. Forecasts by Cambridge Energy Research Associates (CERA) of 17 gigawatts in 2015 and historical deployment of 16 gigawatts in 2012 are significant. The average deployment of wind over the past five years was 6,200 megawatts per year; 2014 deployment of solar PV, both distributed and utility-scale, was 6,201 megawatts. This contribution from solar PV is consistent with the rapid reduction in costs that is currently being observed and is expected to continue.
Grid operators are reliably integrating large amounts of RE, including variable, non-dispatchable RE today. For example, Iowa and South Dakota produced more than 25 percent of their electricity from wind in 2013, with a total of nine states above 12 percent and 17 states at more than 5 percent. California served nearly 19 percent of total load in 2013 with RE resources, not including behind-the-meter distributed solar resources, and approximately 25 percent of total load with RE in 2014. On an instantaneous basis, California is regularly serving above 25 percent of load with RE resources, recently began seeing over 5,000 megawatt-hours of solar energy, and is on track for 33 percent of load with no serious reliability or grid integration issues. Germany exceeded 28 percent non-hydro RE as a percentage of total energy in first half of 2014. Other recent examples include: ERCOT met 40 percent of demand on March 31, 2014 with wind power; SPP met 33 percent of demand on April 6, 2013 with wind power; and, Xcel Energy Colorado met 60 percent of demand on May 2, 2013 with wind power. Operational and technical upgrades to the power system may be required to accommodate high levels of variable, non-dispatchable RE like wind and solar over longer time periods; however, the penetration levels cited above have been achieved without negative impacts to reliability due in large part to low-cost measures such as expanded operational flexibility and effective coordination with other regional markets.
RE can contribute to reliable system operation. The abundance and diversity of RE resources in the U.S. can support multiple combinations of RE in much higher penetrations. When California, the Midwest, PJM, New York, and New England experienced record winter demand and prices during the polar vortex, wind generation played a key role in maintaining system reliability.
Wind and solar PV are increasingly productive and capable of being accurately forecast, which improves grid reliability. Increasing capacity factors mean less variability and more generation. While the wind industry develops more projects at lower wind speed sites, wind turbine design changes are driving capacity factors higher among projects located in a given
( printed page 64810)
wind resource regime.[727]
Average capacity factors have risen from the low 30 percent range to high 30 percent range and continue to improve. One key recent advancement is the increasing use of turbines designed for low to medium wind speed sites (with higher hub-heights and larger rotors, relative to nameplate capacity) at higher wind-speed sites with low turbulence.
New variable RE generators can provide more electrical power grid support services beyond just energy. Modern wind turbine power electronics allow turbines to provide voltage and reactive power control at all times. Wind plants meet a higher standard and far exceed the ability of conventional power plants to “ride-through” power system disturbances, which is essential for maintaining reliability when large conventional power plants break down. Xcel Energy sometimes uses its wind plants' exceedingly fast response to meet system need for frequency response and dispatchable resources. Utility-scale PV can incorporate control systems that enable solar PV to contribute to grid reliability and stability, such as voltage regulation, active power controls, ramp-rate controls, fault ride through, and frequency control. Solar generation is capable of providing many ancillary services that the grid needs but, like other generators, needs the proper market signals to trade energy generation for ancillary service provision.
The transmission network can connect distant high-quality RE to load centers and improve reliability by increasing system flexibility. Investments in transmission and distribution upgrades also enable improvements in system-wide environmental performance at lower cost.
The potential range of new transmission construction is within historical investment magnitudes. Under nearly all scenarios analyzed for the DOE's Quadrennial Energy Review, circuit-miles of transmission added through 2030 are roughly equal to those needed under the base case, and while those base case transmission needs are significant, they do not appear to exceed historical annual build rates. DOE's Wind Vision findings project 11.5 gigawatts of wind per year from 2021-2030. This deployment level would require 890 circuit miles per year of new transmission; 870 miles per year have been added on average between 1991 and 2013. 11.5 gigawatts per year is consistent with building block 3 deployment levels for wind capacity over the compliance period. DOE's SunShot scenario, which increases utility-scale PV to 180 gigawatts by 2030, required spending of $60 billion on transmission through 2050. On an average annual basis, this expenditure is within the historical range of annual transmission investments made by IOUs in recent decades.
Incremental grid infrastructure needs can be minimized by repurposing existing transmission resources. Transmission formerly used to deliver fossil-fired power to distant loads can—and is—being used to deliver REwithout new infrastructure. First Solar's Moapa project uses transmission built to deliver coal-fired power from Navajo to Los Angeles. NV Energy's retirement of Reid-Gardner will free up additional transmission capacity. The Milford wind projects in Utah already utilize transmission that was built to deliver coal power to Los Angeles.
Storage can be helpful but is not essential for the feasibility of RE deployment because there are many sources of flexibility on the grid. DOE's Wind Vision and many other studies have found an array of integration options (
e.g.,
large balancing areas, geographically dispersed RE, weather forecasting used in system operations, sub-hourly energy markets, access to neighboring markets) for RE beyond storage. Storage is a system resource, as its value for renewables is a small share of its total value.
Increasing regional coordination between balancing areas will increase operational flexibility. The Energy Imbalance Market (EIM) recently implemented by the California ISO and Pacificorp is a good example of the increased coordination that will be helpful in ensuring that resources across the West are being utilized in an efficient way.
Significant wind and solar supply chains have developed in the past decade to serve the fast-growing US RE market. For wind, domestic production capability would likely have to increase to accommodate projected builds under the CPP in the 2022-2030 time period; however, the global supply chain has expanded significantly to serve multiple markets and can augment production from the domestic supply chain, if necessary. At the start of 2014, the U.S. domestic supply chain could produce 10,000 blades (6.2 gigawatts) and 4300 towers (8 gigawatts) annually. It is not anticipated that expanded domestic manufacturing will be constrained by raw materials availability or manufacturing capability. For solar technologies, the global supply chain has a capacity that has significantly expanded over the past few years from 1.4 gigawatts per year in 2004 to 22.5 gigawatts per year in 2011. Current capacity exceeds these levels and is expected to grow. For PV systems, raw materials like tellurium and indium are at highest risk of supply shortage, but these materials are not used in the PV technologies currently being deployed at large-scale.
8. Cost of CO2
Emission Reductions From RE Generation
The EPA believes that RE generation at the levels represented in building block 3 can be achieved at reasonable costs. In the EPA's modeling of the building block 3 generation level, the projected cost of achieving CO2
reductions through this expansion of RE generation is $37 per ton on average from 2022 through 2030.[728]
There are a number of reasons why the EPA believes that the cost of CO2
emission reductions from RE generation will be lower than this analysis suggests. First, modeling constraints that restrict variable, non-dispatchable RE technologies to 30 percent of net energy for load at each of the 64 U.S. IPM regions is a conservative limit intended to eliminate significant grid integration costs at increased levels of RE penetration. In fact, many regions have already demonstrated levels of RE penetration that exceed the constraints, and in practice intermittency can be managed across larger regions than the 64. Consequently, the extent to which these regions could, in practice, achieve higher levels of RE deployment without facing substantial grid integration costs would lead to a lower-cost RE outcome than is estimated by this analysis. Second, there are multiple RE technologies not quantified under building block 3 that affected EGUs may use to demonstrate compliance (distributed generation technologies, offshore wind, etc.). Based on preliminary analysis from DOE and NREL, cost-effective opportunities for distributed generation alone could satisfy one-third to over one-half of the stringency associated with building block 3.[729]
Third, as discussed in section V and VI of the preamble, the BSER reflects the degree of emission limitation achieved through the application of the building blocks in the
( printed page 64811)
least stringent region. By definition, in the other two regions the BSER is less stringent than the simple combination of the three building blocks, rendering a portion of the emission reduction potential quantified by the building blocks unnecessary to achieving the interim and final CO2
emission performance rates. For example, the EPA has calculated that in excess of 160,000,000 megawatt-hours of building block 3 potential is not required to achieve the final CO2
emission performance rates in 2030—and would be accessible to affected EGUs for compliance.[730]
Therefore, it is reasonable to expect that it would cost less to achieve the component of building block 3 potential that is reflected in the calculation of the final CO2
emission performance rates, as compared to the results of this analysis which assumed achievement of the entire quantified building block 3 potential. The EPA believes that these factors provide significant opportunities for achievement of the building block 3 generation levels at lower costs than estimated in this analysis.
VI. Subcategory-Specific CO2
Emission Performance Rates
A. Overview
In this section, the EPA sets out subcategory-specific CO2
emission performance rates to guide states in development of their state plans. The emission performance rates reflect the emission rates for two generating subcategories affected by the rule (fossil steam generation and gas-fired combustion turbines).[731]
These final emission performance rates reflect the EPA's quantification of the BSER based on the three building blocks described in section V above. This procedure follows a similar logic to BSER quantification at proposal, but it keeps the emission performance rates separate for fossil steam and NGCC subcategories instead of immediately blending them together into a single value for all affected EGUs. Commenters noted that the proposed rule established guidelines that were based on the aggregation of units, and their reduction potential, in a state rather than providing technology-specific guidelines. While many commenters appreciated the flexibility this state-focused structure provided, some noted two concerns with this approach: (1) It would potentially create different incentives for the same generating technology class depending on the state in which that generator was located, and (2) it deviated from the EPA's previous interpretation of the 111(d) regulatory guidelines by not providing technology-specific standards of performance. In response to these comments and our further consideration, the final rule establishes subcategory-specific emission performance rates that are identical across units within a subcategory regardless of where a unit is located within the contiguous U.S. These subcategory-specific emission performance rates are then translated into state-specific goals which, as in the proposal, reflect the particular energy mix present in each state. That translation is presented in section VII.
These performance rates reflect the average emission rate requirement for each subcategory. Similar to the proposal, they are presented as adjusted average emission rates that reflect other generation components of BSER (
e.g.,
renewable) in addition to the fossil component. These performance rates must be achieved by 2030 and sustained thereafter. The interim performance rates apply over a 2022-2029 interim period and would be achieved on average through reasonable implementation of the best system of emission reduction (based on all three building blocks) described above. In other words, the interim performance rates are consistent with a reasonable deployment schedule of BSER technologies as they scale up to their full BSER potential by 2030. The performance rates are meant to reflect emission performance required across all affected EGUs when averaged together and inclusive of lower-emitting BSER components.
The performance rates are expressed in the form of adjusted [732]
output-weighted-average CO2
emission rates for affected EGUs. However, states are authorized to use a converted statewide rate-based or mass-based goal as discussed in the next section. The EPA has determined that the statewide rate-based and mass-based CO2
goals are expressions of the emission performance rates equivalent to application of the emission performance rates to affected EGUs within a state.
The EPA is finalizing the performance rates in a manner consistent with the proposal, with appropriate adjustments based on comments. Stakeholders had the opportunity to demonstrate during the comment period that application of one or more of the building blocks would not be expected to produce the level of emission reduction quantified by the EPA because implementation of the building block at the levels envisioned by the EPA was technically infeasible, or because the costs of doing so were significantly higher than projected by the EPA. The EPA has considered all of this input in setting final performance rates.
The remainder of this section addresses two sets of topics. First, we discuss several issues related to the form of the performance rates. Second, we describe the performance rates, computation procedure, and adjustments made between proposal and final based on stakeholder feedback in the comment period.
Some of the topics addressed in this section are addressed in greater detail in supplemental documents available in the docket for this rulemaking, including the CO2
Emission Performance Rate and Goal Computation TSD for CPP Final Rule and the Greenhouse Gas Mitigation Measures TSD. Specific topics addressed in the various TSDs are noted throughout the discussion below.
B. Emission Performance Rate Requirements
The EPA has developed a single performance rate requirement for existing fossil steam units in the contiguous U.S., and a single rate for existing gas turbines in the contiguous U.S., reflecting application of the BSER, based on all three building blocks described earlier, to pertinent data. The rates are intended to represent CO2
emission rates achievable by 2030 after a 2022-2029 interim period on an output-weighted-average basis by all affected EGUs, with certain computation adjustments described below to reflect the potential to achieve mass emission reductions by avoiding fossil fuel-fired generation.
1. Final Emission Performance Rate Requirements
The emission performance rates are set forth in Table 11 below, followed by
( printed page 64812)
a description of the computation methodology.
Table 11—Emission Performance Rates
[Adjusted output-weighted-average pounds of CO2
per net MWh from all affected fossil fuel-fired EGUs]
Subcategory
Interim rate
Final rate
Fossil Fuel-Fired Electric Steam Generating Units
1,534
1,305
Stationary Combustion Turbines
832
771
The emission performance rates are expressed as adjusted output-weighted-average emission rates for each subcategory. As discussed later in this section, the emission rate computation includes an adjustment designed to reflect mass emission reductions associated with lower-emitting BSER components. The adjustment is made by estimating the annual net generation associated with an achievable amount of qualifying incremental lower-carbon and zero-carbon generation and substituting those MWhs for the baseline electricity generation and CO2
emissions from the higher-emitting affected EGUs. Under the final rule approach, regionally identified building block 3 potential generation replaces fossil steam and NGCC generation on a pro-rata basis corresponding to the baseline mix of fossil generation in each region.
2. Interim Emission Performance Rates
Some commenters suggested that the interim period starting in 2020 provided too little time for implementation of measures required to demonstrate compliance during the interim period. As discussed in section V.A.3.g of this preamble, the EPA has determined that an interim period beginning in 2022 provides sufficient time for states to undertake necessary planning exercises and for the implementation of measures towards achieving the performance rates. The EPA determined the interim rates in a manner similar to proposal, with an adaptation to address the revised timing of the interim compliance period (beginning in 2022 rather than in 2020 as proposed). They reflect the averaging of estimated emission performance rates for each year in the interim period (
i.e.,
2022-2029).
The interim performance rates are less stringent than the final 2030 emission performance rates because the amount of emission reduction potential identified for the BSER increases over time, as explained in section V.
C. Form of the Emission Performance Rates
1. Rate-Based Guidelines
The interim and final emission performance rates for fossil steam and NGCC units are presented in the form of adjusted output-weighted-average CO2
emission rates that the affected fossil fuel-fired units could achieve, through application of the measures comprising the BSER (or alternative control methods). Several aspects of this form of emission rate are worth noting at the outset: The use of emission rates expressed in terms of net rather than gross energy output; the use of output-weighted-average emission rates for all affected EGUs; the use of adjustments to accommodate incremental NGCC generation and RE measures that reduce CO2
emissions by reducing the quantity of fossil fuel-fired generation and associated emissions; and the adjustability of the goals based on the severability of the underlying building blocks.
a.
Rationale for rate-based guidelines.
First, the EPA sets an emission rate requirement for each subcategory by identifying the technology-specific reductions available under the building blocks. We then give each state the choice to apply the emission performance rates directly to the affected EGUs within the state or provides the opportunity to use the statewide rate-based goal or the equivalent mass-based form translated from the emission performance rates for state plan purposes. The emission performance rates reflect the BSER, and the statewide rate-based goal and statewide mass-based goal are alternative metrics for realizing the emission performance rates at the aggregate affected fleet level for a state.
Stakeholders have expressed support for having the flexibility to choose from among the multiple options for crafting an implementation plan to realize the BSER. The EPA is providing emission performance rate-based guidelines that apply uniformly to technology subcategories nationwide, and the EPA is providing corresponding state emission rate goals and state mass goals to further enhance compliance flexibility for each state. This approach allows each state to adopt a plan that it considers optimal and is consistent with the state flexibility principle that is central to the EPA's development of this program.
b.
Net vs. gross MWh.
The second aspect noted above concerns the expression of the goals in terms of net energy output [733]
—that is, energy output encompassing net MWh of generation measured at the point of delivery to the transmission grid rather than gross MWh of generation measured at the EGU's generator. The difference between net and gross generation is the electricity used at a plant to operate auxiliary equipment such as fans, pumps, motors, and pollution control devices. Because improvements in the efficiency of these devices represent opportunities to reduce carbon intensity at existing affected EGUs that would not be captured in measurements of emissions per gross MWh, goals are expressed in terms of net generation. As noted by commenters, EGUs have familiarity and in some places already have in place equipment necessary to collect and report hourly net generation.[734]
c.
Output-weighted performance rates for all affected EGUs.
This final rule provides an expression of the BSER as subcategory-specific emission performance rates rather than the state goals provided at proposal. Whereas the proposal also estimated the BSER impact on fossil steam and NGCC emissions and generation, it went one step further by averaging these two technology rates into a single rate for each state. Under this final rule, the EPA is identifying the fossil steam rate and the NGCC rate separately instead of only presenting them in a blended fashion at the state level.[735]
These two emission performance rates are the expression of the BSER for the final rule for affected EGUs located within the contiguous U.S.
The modification from a blended emission rate in the proposed rule to a subcategory-specific emission performance rate for affected EGU categories in the final rule was made in response to comments that technology
( printed page 64813)
subcategory-specific emission rates were more analogous to prior 111(d) efforts and more consistent with the statute. The EPA received significant comments suggesting a technology subcategory-specific rate is consistent with past section 111(d) regulations. However, many commenters also supported the flexibility provided to states through a state goal metric provided at proposal. Therefore, the EPA does provide alternative statewide rate-based and mass-based goals in the next section.
The EPA's main consideration has been to ensure that the expression of the BSER reflects opportunities to manage CO2
emissions by shifting generation among different types of affected EGUs. Both the performance rates in this final rule and the state goals at proposal rely on the adjusted emission rate metric to reflect that potential shifting. Specifically, because CO2
emission rates differ widely across the fleet of affected EGUs, and because transmission interconnections typically provide system operators with choices as to which EGU should be called upon to produce the next MWh of generation needed to meet demand, opportunities exist to manage utilization of high carbon-intensity EGUs based on the availability of less carbon-intensive generating capacity. For states and generators, this means that CO2
emission reductions can be achieved by shifting generation from EGUs with higher CO2
emission rates, such as coal-fired EGUs, to EGUs with lower CO2
emission rates, such as NGCC units. Our analysis indicates that shifting generation among EGUs offers opportunities to achieve large amounts of CO2
emission reductions at reasonable costs. The realization of these opportunities can be reflected in an emission rate established in the form of an output-weighted-average emission rate where the weighting reflects the varying levels of replacement generation technologies.
d.
Severability of building blocks.
Section V above discusses the severability of the three building blocks upon which the CO2
emission performance rates are based. Because the building blocks can be implemented independently of one another and the emission performance rates reflect the sum of the emission reductions from all of the building blocks, if any of the building blocks is found to be an invalid basis for the “best system of emission reduction . . . adequately demonstrated,” the rates would be adjusted to reflect the emissions reductions from the remaining building blocks. The sole exception, as described above, is the application of building block 1 in isolation, which would not be implemented independently. The performance rates and statewide goals that would result from any combination of the building blocks could be computed using the formulas and data included in the CO2
Emission Performance Rate and Goal Computation TSD for CPP Final Rule and its appendices using the methodology described below and elaborated on in that TSD.
D. Emission Performance Rate-Setting Equation and Computation Procedure
The methodology used to compute the performance rates is summarized on a step-by-step basis below in section 3. The methodology is described in more detail in the CO2
Emission Performance Rate and Goal Computation TSD for CPP Final Rule, which includes a numerical example illustrating the full procedure. The quantification of the building blocks used in the computation procedure is discussed in Section V above and in the Greenhouse Gas Mitigation Measures TSD.
1. Inventory of Likely Affected EGUs
In order to calculate the subcategory-specific emission performance rates reflecting the BSER, the EPA first needed to develop a baseline inventory of likely affected EGUs in order to estimate the impact of the BSER. The EPA developed an inventory of likely affected units that were operating in 2012 or that began construction prior to January 8, 2014 and that appeared to meet the final rule's applicability criteria.[736]
This inventory does not constitute a final applicability determination, but best reflects the EPA's estimate of units subject to the 111(d) applicability criteria as laid out in Section IV. The EPA identified a list of likely affected units at proposal comprised of approximately 3,000 EGUs. The agency took comment on this list and has made a number of updates to the inventory in response to those comments and in regards to applicability criteria changes resulting from comments. However, the inventory does not reflect a final applicability determination, and where a unit's status was unclear, the EPA generally treated the unit's status in a manner consistent with the proposal and publically available reported data.[737]
Since the final rule's applicability includes under construction units, the EPA also identified units that had not yet commenced operation by the 2012 baseline period, but that commenced construction before January 8, 2014. The EPA received significant comment on the proposal's sole use of the National Electric Energy Data System (NEEDS) to identify these under construction units. Commenters suggested that the EPA also utilize EIA and 2012 proposed unit-level files to help better identify under construction units. In some cases, NEEDS did not reflect units that had commenced construction. Therefore, the EPA updated its approach to identifying units that had commenced construction prior to January 8, 2014, but that had not commenced operation in 2012. In the final rule, the EPA uses EIA data, comments, as well as NEEDS data to identify these under construction units.[738 739 740]
These units that were operating by 2012 along with those that had not commenced operation by 2012 but had commenced construction by January 8, 2014, reflect the EPA baseline inventory of likely affected EGUs. The CO2
Emission Performance Rate and Goal Computation TSD for CPP Final Rule explains the prime mover, capacity, and fuel criteria used to identify the likely affected EGUs.[741]
The EPA received significant comment that units that came online during the baseline year (
e.g.,
2012) should be treated as under construction rather than operating units in 2012 for purposes of estimating baseline values, because their 2012 operation may be
( printed page 64814)
misrepresentative of anticipated future-year operation due to partial year operation in 2012. The EPA has made an adjustment to flag these units as having commenced operation during 2012 and treat them as under construction units, consistent with commenters' suggestion; for BSER computational purposes, generation and emissions for these units are estimated based on a representative first full year of operation for that technology class.
2. Data Year
In the proposed rule, the EPA considered using a historical-year data set or a projected-year data set as a starting point for applying the technology assumptions identified under BSER. The EPA proposed using 2012 data as it was the most recent data year for which complete data were available when the EPA undertook analysis for the proposed rule and it reflected actual performance at the state level. The EPA took comment on alternative data sets. In particular, the EPA issued a NODA on October 30, 2014 (79 FR 64543) in which we provided 2010 and 2011 historic data for consideration.
The EPA received a significant number of comments supporting the use of historical data as the basis from which to quantify performance rates reflecting BSER. Some commenters supported the 2012 data year as the best reflection of the power fleet, and some suggested that the EPA use a different year or a historical average to control for data anomalies in 2012. Moreover, some commenters pointed out that using 2010, 2011, 2012 data, or an average of the three would not address their concerns about recent year anomalies in hydro generation due to high snow pack. Some commenters also suggested the EPA use a baseline including years prior to 2012, not to increase representativeness of the power sector, but as a means of recognizing early action.
In this final rule, the EPA is taking an approach to the baseline year where we still largely rely on reported 2012 data as the best and most recent available data representing the power sector from which to apply the BSER, but also including targeted baseline adjustments to address commenter concerns with 2012 data.[742]
Below, we explain why—at the nationwide level—2012 data are preferable, more objective, and more accurate than a prior year, or an average of years, for informing the baseline. Then, we explain the adjustments that we are making to the 2012 data along with our rationale for such adjustments, in response to comments we received.
Some commenters supported the EPA's use of 2012 data to inform performance rates, and the EPA agrees that 2012 data with targeted adjustments, relative to other historical years, best reflects the power sector and best informs the performance rates that pertain to the BSER. The EPA believes that starting with 2012 data is more accurate and better informs the BSER than an earlier historical year or historical multi-year average for the following reasons:
(1) Of the historical data fully available at the time the proposal analysis began, 2012 was the most recent and best reflects the power fleet. Approximately 43 GW of new capacity came online in 2010 and 2011. In other words, there was 43 GW of capacity online as of 2012 that had not been in service at some point during the 2010-2011 period. Likewise, approximately 17 GW of capacity that were operable in 2010 and/or 2011 were retired prior to 2012.[743]
Using state-level, prior year data, either on its own, or as part of a multi-year baseline, is not as representative of the current power fleet as the 2012 data, which better reflects significant changes in power sector infrastructure.
(2) A three-year baseline would not address some of the substantive concerns raised by commenters. Many commenters pointed out that using a three-year baseline would not address their critical concern about variation in the hydrological cycle due to snow pack (particularly in the Northwest), because the snow pack was significantly above average in both 2011 and 2012. The EPA agrees with commenters that we can better address their baseline data concerns regarding an average hydro year by identifying those states with a significant share of hydro generation and variation in that hydro generation, and making targeted adjustments to those states' affected fossil generation levels in order to reflect a more typical snow-pack year. This procedure is described in more detail below and in theTSDs.
(3) In addition to being, in the EPA's view, a less representative baseline of the existing power fleet, a multi-year baseline would also likely entail complexity when determining how to average together yearly fleet data while appropriately accounting for fleet changes occurring during those years. The 2012 baseline starting point maximizes the EPA's reliance on latest reported operating data and minimizes the need for fleet capacity adjustments. For instance, because of year-to-year fleet turnover, the averaging of multiple baseline years would require additional assumptions in regards to which generation to consider from a fleet that is changing in a given state or region (or even where units are switching fuel sources such as a coal-to-gas conversion).
(4) Due to the region-based approach to quantify building blocks and the BSER as subcategory-specific emission performance rates, variations in unit-level data do not significantly impact the calculation of emission performance rates. For instance, if one fossil unit is operating less in a given year due to an outage, another fossil unit in the same region is generally operating more. Therefore, at the regional level, fossil generation and emissions do not vary to the same degree that unit-level data varies. Moreover, the variation at the regional level that does exist in 2012 relative to previous years is not necessarily unrepresentative variation, but illustrates trends in the power sector infrastructure that are desirable to capture for purposes of determining a representative year from which further improvements in CO2
emissions performance can be made. Because the EPA is moving from a state approach at proposal to a regional approach for calculating the expression of the BSER in this final rule, unit-level operational variation from year to year becomes even less relevant to the calculation of regional emission performance rates.
(5) Some commenters suggested the EPA use an earlier baseline year as a means of recognizing early action. They noted that an earlier baseline would reflect a higher-emitting fleet and therefore when the same level of building block MWhs are applied, they would result in a higher (
i.e.,
less stringent) state goal. The EPA disagrees with this view for several reasons. First, the objective of selecting a baseline to inform BSER is to have one that best reflects the power sector and consequently the best system of emission reductions of which the power fleet is capable. Using an earlier baseline that “inflates” the starting point would undermine this objective, not serve it. Second, the EPA disagrees with the premise of this comment—that the baseline would change and building block potentials would stay the same. For instance, building block 2 functions based on incremental generation potential (incremental generation = potential generation−baseline generation). This incremental value would increase if an earlier baseline period was used that had less existing NGCC generation.
(6) Some commenters pointed out that the EPA relied on multi-year historical data in allowance allocation in previous rulemakings (
e.g.,
CAIR and/or CSAPR allocations). However, that comparison is not relevant to the quantification of emission reduction potential under 111(d). In those previous instances, the EPA was considering typical unit-level behavior for allowance allocation purposes—not for determining the emission reduction requirements of the program. Those allowance allocation determinations were independent of and subsequent to the determination of emission reduction requirements in those rulemakings.
(7) The EPA received significant comment that 2012 was not a representative year for natural gas prices, and thus the EPA should use another year. The EPA disagrees with this comment, and does not view it as grounds for a change to the baseline period. While the EPA does recognize that Henry
( printed page 64815)
Hub natural gas prices were lower in 2012 relative to previous years, this does not invalidate the suitability of the data year selection. The EPA's objective in selecting a baseline is to identify potential reductions when BSER technologies are applied; year-to-year variation in market prices for natural gas does not frustrate this effort. For instance, a region may have generated only 5 MWh of NGCC generation in 2011 when gas prices were higher, and 10 MWh of NGCC generation in 2012 when gas prices dropped. However, this does not change the outcome of the quantification of the BSER, because the building block is based on the emission reduction
potential
of the fleet. That potential (
e.g.,
a fuller realization of the existing NGCC generation potential equivalent to 15 MWh) does not change regardless of the year used for baseline NGCC generation. Therefore, a different data year may change a baseline data point, but it would not change the total potential NGCC generation for quantifying the emission performance rates in these circumstances.
In summary, the EPA believes that continuing to rely on 2012 data while incorporating select data adjustments as detailed below is not only a reasonable choice and adequately supported, but a more reliable and preferable starting point for determining the BSER requirements.
3. Adjustments That the EPA Made to the 2012 Data
The EPA made corrections to unit-level 2012 data based on commenter feedback. In addition, we also made some adjustments to 2012 data, not to address a correction, but to address a concern about the representativeness of the data. Although the EPA determined that the 2012 data year better informed its BSER determination than a preceding year or a multi-year average, commenters did identify some limitations that we are addressing through targeted adjustments. These are discussed below:
(1) Adjustments to state-level data to account for annual variation in the hydrologic cycle as it relates to fossil generation.
Hydropower plays a unique role in a handful of states in that (1) it is a significant portion of their generation portfolio, (2) it varies on an annual basis, and (3) 2012 was an outlier year for snow-pack (meaning hydropower was above and fossil generation was below its historical average).The EPA notes that these three conditions are not present in other weather-based RE technologies like solar or wind.[744]
Therefore, no similar adjustment was needed to account for weather patterns with these technologies.
Unlike market conditions (
e.g.,
changes in natural gas prices) that may produce different generation profiles year-to-year but that do not change the overall generating potential of the state's power fleet, variation in the hydrologic cycle does fundamentally change the generating potential of the state's power fleet in hydro-intensive states as they no longer have the same generating potential in an average year as they had in a “high hydro” year. The CO2
Emission Performance Rate and Goal Computation TSD for CPP Final Rule provides analysis and explains the adjustment that the EPA made to the state-level 2012 data for Idaho, Maine, Montana, Oregon, South Dakota, and Washington to better reflect fossil generation levels when hydro generation performed at its average level as observed over a 1990-2012 timeframe. The EPA agrees with commenters that using a 2010-2012 baseline would not address the concern as 2011 was also an outlier year relative to historical snow-pack and hydro generation.
(2) Extended unit outages due to maintenance.
Generally, because of the regional-level approach to calculate performance rates, the EPA does not believe that unit-level variations in operation influence the subcategory-specific performance rates reflecting BSER. For instance, as some units ramp down, and others ramp up to replace their load at the regional level, total fossil generation changes little due to these fossil-for-fossil substitutions. Unit-level variation does not inherently entail region-wide variation.
However, the EPA did receive comment that in limited cases, this could have a substantial impact on an individual state if it chooses to use a rate-based or mass-based statewide goal. Even though the EPA is calculating subcategory-specific performance rates that it believes are not affected by this type of unit-level variation, it still evaluated the possible impacts it may have when converting to state goals in the next section. The EPA examined units nationwide with 2012 outages to determine where an individual unit-level outage might yield a significant difference in state goal computation. When applying this test to all of the units informing the computation of the BSER, emission performance rates, and statewide goals, the EPA determined that the only unit with a 2012 outage that (1) decreased its output relative to preceding and subsequent years by 75 percent or more (signifying an outage), and (2) could potentially impact the state's goal as it constituted more than 10 percent of the state's generation was the Sherburne County Unit 3 in Minnesota. The EPA therefore adjusted this state's baseline coal steam generation upwards to reflect a more representative year for the state in which this 900 MW unit operates.
(3) Many commenters also noted that because the EPA uses annual data, 2012 was not representative for units coming online part way through the year. The EPA relies on annual data, so if a unit is underrepresented in a certain part of the year because it is not yet online, then another unit is likely over-represented as it is operating more than it otherwise would when the second unit commences operation. Therefore, the resulting state-level and regional-level aggregate annual generation level used in determining the BSER may be considered to be representative and there is not necessarily a need for any adjustment.
However, the EPA recognizes that the over-represented and under-represented units do not necessarily fall within the same state, and therefore this potential difference in the state location of the affected units could have an impact when estimating appropriate statewide goals. To address this comment, the EPA adjusted the 2012 generation data for fossil units coming online during 2012 to a more representative annual operating level for that type of unit reflecting its incremental impact on generation and emissions. This effectively resulted in increased baseline emissions and generation assumed for those units beyond their reported partial-year operations in 2012. Conceptually, the assumption of full-year operation at units that came online partway through 2012 could pair with an assumed reduction in the operation of other units somewhere in the same region. However, the EPA made no corresponding deduction to represent this likely decreased utilization at other affected units because it was impossible to project the state location of such units with certainty and the assumed utilization level was meant to reflect the incremental impact on the baseline. As a result, this data adjustment increases the total generation and emissions for units reporting in the 2012 baseline beyond the 2012 reported levels.
Additionally, as done in proposal, the EPA continued to identify under construction units that did not begin operation in 2012, but had commenced construction prior to January 8, 2014 and would commence operation sometime after 2012. As described in the next section, the EPA estimated baseline generation and emissions for these units as they had no 2012 reported data.
In summary, this final rule continues to rely on the latest reported 2012 data as the foundation for quantifying the BSER. However, the EPA has made limited adjustments, in addition to corrections identified by commenters, to the 2012 data to address some of the relevant concerns raised by commenters. Therefore, the baseline is informed by 2012 data, but not limited to 2012 data.[745]
4. Equations
In this section we describe how we develop the equations used to determine the emission performance rates for fossil steam and NGCC units that express and implement BSER. More detailed
( printed page 64816)
information regarding rate computation, including example calculations, can be found in the CO2
Emission Performance Rate and Goal Computation TSD for CPP Final Rule, which is available in the docket for this action. Here we first present the general principles we follow when developing equations to express the BSER; then, we summarize the steps taken to assemble baseline data to reflect 2012 baseline emissions and generation, and apply the building blocks that constitute the BSER to derive performance rates that will be used by states to implement BSER. Section VII then explains how these nationwide performance rates are reconstituted into a statewide goal metric similar to the proposal in order to allow a state (at its discretion) to use a statewide goal as a mechanism for demonstrating compliance at the aggregate state level in a state plan, as an alternative to applying the emission performance rates to its affected EGUs directly.
When developing equations to implement BSER, we adhere to a number of basic principles. First, we ensure that the equations are consistent with the BSER itself, and in particular, reflect the redistribution of generation among fossil steam, NGCC and renewables embodied in building blocks 2 and 3. In doing this, we account for the interactions between building blocks in a way that is consistent with the assessment of incremental building block generation potential and the compliance framework for Emission Reduction Credits (ERCs). In particular, we must ensure that each increment of building block 3 emission reduction potential is applied to either fossil steam or NGCC units but not both. The equations we develop must also take account of the dual status of existing NGCC units, which are simultaneously affected units and provide generation that is an element of the BSER itself.
In addition, we are applying the BSER, as we have done in calculating other section 111(d) standards, to a defined population of existing affected sources, represented in this case by the generation of the source category in the 2012 adjusted baseline. This provides an empirical historical baseline against which we define the performance rates and their state goal equivalents. In doing so, we must account for any offsetting increases in emissions that result from applying the BSER control measures, as we have done in setting other standards. For example, when determining BSER for particulate matter control, a number of pollution control devices (such as sorbent injection technologies) themselves create particulate matter. If the particulate matter created by these control devices were not appropriately accounted for when developing the standard intended to address the primary emissions of particulate, this could create an unreasonably stringent PM standard. In the current context, this means recognizing that increasing NGCC capacity utilization in accordance with building block 2 both offsets higher emitting steam generation and increases emissions at the NGCC units themselves, which are also affected entities that must demonstrate compliance with the BSER. Thus, it is essential that we apply the building blocks in a way that avoids creating a level of stringency in the performance standards for affected EGUs that goes beyond what we have determined to be the BSER—while at the same time ensuring that equations apply the building blocks to generate performance standards that represent the full application of the BSER to the affected EGUs.
Under section 111, the EPA adopts emission performance standards that are based on the BSER. The emission performance rates reflect our recognition of the value of giving sources the flexibility to adopt equivalent emissions reduction strategies and measures that for them may be preferable (in a specific circumstance) to the technologies and measures that we define as the BSER. An important function of the emission performance rates representing the BSER is to provide the flexibility needed to allow alternative compliance options, including the development of new technologies or the deployment of effective technologies outside of the BSER technologies. In the guidelines we issued under section 111(d) for landfill gas, for example, we adopted the primary standard based on flaring of any captured landfill gas, but we also developed equations that led to an expression of the BSER that allowed for the alternative of capturing the gas and combusting it in an electrical generating unit.
Finally, in deriving the emission performance rates, there are a number of considerations we took into account. First, it is important that the baseline from which the rates are derived be transparent and based on observable, historical data. Second, the emission performance rates must reflect the emission reductions achievable through the best system of emission reduction. Because the BSER includes shifting of emissions from higher-emitting to lower-emitting sources, state compliance frameworks will likely involve a combination of physical measures at the plant (where either rate or generation may be reduced) and some form of credit for lower-emitting generation (or demand side measures) outside of the plant. In this context, the emission performance rates must provide appropriate incentives for affected entities to achieve the emission reductions encompassed in the BSER, including through state plans that provide crediting for lower-emitting generation. Third, and as set forth below, we must account for the EPA's determination that pro rata implementation of building block 3 is the best reflection of the potential for RE to displace both fossil steam and NGCC, and the dual role of NGCC units as both affected sources and a BSER compliance technology.
This set of considerations was central to the development of the BSER equations that the EPA describes next. They were particularly important for steps five through seven below which address building blocks 2 and 3, building blocks that have both significant overlap with each other and which impact steam and NGCC units in an integrated way.
Step-by-Step Discussion of Equations
Step one (compilation of baseline data). On a unit-level basis, the EPA obtained total annual quantities of CO2
emissions, net generation (MWh), and capacity (MW) from reported 2012 data for likely affected EGUs that had commenced operation prior to 2012.[746]
The EPA made changes to the historical unit-level data based on comments received at proposal. For each state and region, the agency aggregated the 2012 operating data for all coal-fired steam EGUs as one group, all oil- and gas-fired steam EGUs as a second group, and all NGCC units as a third group. The EPA adjusted these state values upwards in
( printed page 64817)
a limited number of instances to reflect the hydropower and unit outage concerns raised in comments and described above. As discussed above, the EPA first only aggregated the reported data for units that commenced operation prior to 2012. For those likely affected units that commenced operation during 2012, the EPA treated that capacity consistent with its framework for under construction affected units, which were added next. This was done in response to comments recognizing the fact that the year during which a unit commences operation may not have been representative of its potential generation and emissions.
For the under construction units (
i.e.,
those under construction prior to January 8, 2014 but which had not commenced operation by December 31, 2011), the EPA estimated their incremental impact on the baseline generation and emissions using their capacity. The EPA assumed a 55 percent capacity factor for under construction NGCC units and a 60 percent capacity factor for under construction fossil steam units, which are consistent with the values and methodology the EPA proposed for under construction units.[747]
These values are informed by the 2012 capacity factors for other units in these technology classes that recently commenced operation.[748]
Using these capacity factors along with the capacity for the units, the EPA estimated an annual baseline generation value for these units. The agency then estimated annual baseline CO2
emissions for these under construction units using the average emission rate of generating units of the same technology in the state where the under construction unit is located. Where no generators of the same technology existed in a given state, the EPA used the national baseline average for that technology. This is similar to the adjustment made at proposal for under construction units, with the main difference being units that commenced operation in 2012 are now also treated as under construction for baseline data purposes in the final rule.
The estimated emissions and generation for under construction units were added to the 2012 reported emissions and generation data for the affected units that had already commenced operation prior to 2012 to derive an adjusted historical baseline total for each state that was reflective of all likely affected 111(d) sources.[749]
Step two (aggregation to the regional level). The EPA took comment on applying building blocks at the regional level, and received significant comment supporting such an approach. Therefore, whereas the proposal aggregated the baseline data to the state level, the final rule further aggregated it to the regional level prior to building block application. The regions reflect the Eastern, Western, and Texas Interconnections. The shift to a regional framework was based on comments suggesting that the EPA would better capture the interstate impacts of the building blocks and reflect the interconnected nature of the electric grid under a regional structure. The basis for the regions is defined and discussed in Section V.A.3.
Step three (identification of source category baseline emission rates). As discussed in the beginning of this section, the EPA took a technology-specific approach to quantifying guidelines. Therefore, whereas the proposal first averaged the fossil steam rate and NGCC rate together before applying the building blocks and defining state goals, the final rule applied the building blocks at the regional level to give a separate fossil steam rate and NGCC rate for each region. The starting point for calculating the subcategory-specific emission performance rates was the baseline regional emission rates for both fossil steam and NGCC in the year 2012 with the modifications discussed above.
Step four (application of building block 1). The baseline CO2
emissions amount for the coal-fired steam EGU fleet in each region was reduced by 2.1, 2.3, and 4.3 percent in the Western, Texas, and Eastern Interconnections respectively, while the coal generation level was held constant, reflecting the EPA's assessment of the average opportunities in each region to reduce CO2
emission rates across the existing fleet of coal-fired steam EGUs through heat rate improvements that are technically achievable at a reasonable cost. The EPA then averaged together the region's baseline oil- and natural gas-fired steam rate with its building block 1 adjusted coal steam rate to get a fossil steam rate post-building block 1.[750 751]
Step five (application of building block 3). At proposal, the EPA incorporated incremental RE MWhs (where incremental means the amount above the adjusted 2012 baseline) by adding them to the denominator of the emission rate goal. In response to comments on this approach, the EPA issued a NODA discussing an alternative methodology of incorporating building block 3 in a manner more analogous to building block 2 treatment, where the incremental MWhs identified for the building block replace baseline fossil MWhs on a one-to-one basis. The EPA is adopting this replacement methodology for building block 3 in the final rule consistent with comments noting that such a computational procedure better reflects the reduction potential of that building block.
Under this methodology, all of building block 2 incremental NGCC potential and part of building block 3 incremental RE potential were ultimately applied to replace higher-emitting fossil steam generation and emissions, while the remaining building block 3 potential was applied to replace NGCC generation and emissions. Commenters noted that under this approach building block 3 should be applied first, or the EPA would understate the potential of building block 2 by subtracting out some NGCC generation after the 75 percent utilization level of NGCC had been applied to replace fossil steam. The EPA agrees and calculated the building block 3 impacts first in developing the emission performance rates.
To implement this, first, building block 3 replacement potential was identified for each region to arrive at a total amount of incremental zero-
( printed page 64818)
emitting generation hours available to replace fossil generation in the region. Because renewable generation can replace both fossil steam and NGCC on the grid, the EPA determined that it was appropriate to apply these incremental zero-emitting generation hours to replace generation and associated emissions from each of the fossil steam and NGCC fleets in the region on a pro-rata basis in the following manner.[752]
The EPA determined the percent of fossil steam generation and the percent of NGCC generation of total affected fossil generation in each region's baseline. We then assigned those percentages of the incremental zero-emitting MWhs to each of those technology source categories.[753]
The incremental zero-emitting generation assigned to each technology replaced the same amount of fossil generation from that technology's baseline value.
Step six (application of building block 2). If the remaining generation level for the NGCC fleet in a region, taking into account the previous step's replacement of NGCC generation, was less than 75 percent of the fleet's potential summertime generating capacity (the potential capacity factor the EPA determined to represent the BSER), then the NGCC generation in the region was assumed to increase to levels equal to the lesser of (1) its potential at a 75 percent capacity factor [754]
or (2) a generation level above which there is no longer fossil steam generation remaining within the same region to replace. In other words, the regional NGCC capacity factor was only assumed to reach 75 percent if there was sufficient higher-emitting fossil steam generation that it could replace after step five. The increase in NGCC generation at this step compared to the post-building block 3 level was matched by an equal decrease in fossil steam generation reflecting the 1 for 1 MWh hour replacement. At this point, the generation for both steam and NGCC reflect the final distribution of generation between the subcategories after application of the building blocks. But the emission performance rates must account for CO2
emissions and generation from incremental gas and renewable generation that comprise building blocks 2 and 3, to reflect and enable the emission reductions achievable under the best system of emission reduction, and ensure that the shared implementation of the BSER by steam and NGCC generation is reflected in the rates.
Step seven (accounting for and facilitating the emission reductions achievable through the implementation of the best system of emission reduction).
This step quantifies the aggregate emission changes associated with the emission rate improvement and generation replacement patterns described in steps four, five, and six to arrive at an adjusted fossil steam emission rate and an adjusted NGCC emission rate for each region that will, as discussed above, (1) enable the implementation of all three building blocks, (2) be based on observable, concrete baselines, and (3) reflect the BSER.
First, in developing the emission performance rates, the EPA had to answer the question of how to reflect the building blocks in the equations defining the rates in a manner that would enable the generation shifts that are essential components of the BSER. In the case of building block 3, the EPA accomplished this by incorporating the pro rata share of incremental (above baseline) zero emitting generation into the emission rates for each group of affected EGUs, thus ensuring that these EGUs would have to include a corresponding amount of zero-emitting generation in their compliance calculations, either through the acquisition of credits or through some other mechanism as determined by their state in its implementation plan.
For building block 2, a similar mechanism is needed. Accordingly, a portion of the NGCC generation and emissions used to replace fossil steam must be averaged into the steam rate, analogous to what was done with building block 3. The EPA considered two approaches to define the quantity of NGCC generation and emissions to be averaged into the steam rate: (1) Incremental NGCC generation after the implementation of building block 3 and (2) incremental NGCC generation from baseline levels. For the reasons below, the EPA has determined that the second approach better reflects the considerations discussed above.
As discussed above, it is beneficial that the baseline from which emission performance rates are derived be transparent and based on observable historical data. The first approach, however, depends on the level of incremental NGCC generation relative to what is available after the implementation of building block 3. This level of NGCC generation (obtained after replacing baseline levels of generation with NGCC's pro rata share of incremental RE generation) only exists as an intermediate step in the BSER calculation. It is not based on an observable or concrete level of generation.
In Section VIII we discuss methods for creating ERCs for implementing shifting of generation from steam to NGCC, and this discussion illustrates the value of relying on an observable and concrete baseline. In that section we suggest that incentivizing and facilitating the purchase of ERCs as a compliance option for steam units could be implemented through the use of a factor that creates a fraction of an allowable credit for each hour that an NGCC operates. This factor is derived from the incremental generation of NGCC post-building block 2, relative to the baseline. While a different factor could be derived from the hypothetical intermediate level resulting from the pro rata application of zero emitting generation to NGCC in building block 3 (by transferring the full amount of NGCC emissions and generation replacing steam generation in building block 2), the EPA believes that grounding baselines in historical data (such as those used to derive the 2012 baseline) is both more transparent and easier to understand in a way that is more useful to states and utilities, in contrast to the practical challenges of relying on a calculated level that corresponds to an interim step within the emission performance rate calculation. As long as the crediting framework for creating ERCs is consistent with the amount of gas emissions and generation that is transferred to the coal rate, either the chosen option or the option of transferring the entire quantity of gas emissions and generation that occurred in step six to the coal rate would provide an incentive for the power market to implement the shift in generation from coal to gas.[755]
( printed page 64819)
Also as discussed above, it is important that the compliance equations reflect the BSER pro rata allocation of RE to fossil steam and NGCC generation. The first approach to define the quantity of NGCC generation and emission to be averaged into the steam rate would require the steam rate to take into account the total additional NGCC generation that results from the application of building block 3 before building block 2 has been applied. This approach would reflect in the compliance rate for steam units a greater share of the implementation of building block 3. Ensuring that emission performance rates for both steam and gas units reflect the emission reduction potential of building block 3 is integral to the building block 3 methodology and also recognizes that application of building block 3 on a pro-rata basis was intended to achieve emission reductions from both NGCC and fossil steam commensurate with their emissions reduction opportunities.
If the EPA were to use the increment of NGCC emissions and generation derived at the intermediary step after the application of building block 3, rather than the increment relative to the 2012 baseline, the effect would be to largely assign to fossil steam the building block 3 generation shift apportioned to NGCC. That, in turn, would have undermined the fact that building block 3 was determined to be a BSER measure applicable to the entire source category, comprising NGCC as well as fossil steam, and would have conflicted with the preceding steps we are taking to develop the equations. Instead, by using only the incremental NGCC generation relative to the baseline, the EPA has ensured that the logic behind the pro rata displacement of fossil generation by RE generation is reflected in the emission rates. Having established the appropriate way to measure the amount of incremental gas generation placed in the fossil steam rate, the EPA is able to calculate the subcategory-specific emission performance rates. For the numerator of the fossil steam rate, the EPA multiplied the remaining fossil steam generation (post-step six) by the fossil steam rate reflecting the heat rate improvement from building block 1 (step four). We then added in the emissions associated with the incremental NGCC generation from step six by multiplying the incremental NGCC generation as discussed above (difference between the baseline NGCC generation level and post-step six NGCC generation) by the baseline NGCC rate for that region.[756]
This constitutes the numerator of the fossil steam emission rate.
For the fossil steam denominator, the EPA added the remaining fossil steam generation (post-step six), the incremental NGCC generation defined above, and the amount of zero emitting building block 3 MWhs apportioned to fossil steam generation in the region (step five). Dividing the fossil steam numerator described above by this fossil steam denominator resulted in a regional adjusted fossil steam rate reflecting the three building blocks.
For the NGCC performance rate, the EPA calculated a numerator in a similar manner. First, we took the remaining NGCC generation (post step six) and multiplied it by the regional baseline NGCC rate to calculate the total emissions in the numerator. For the denominator, the EPA added the remaining NGCC generation (post step six) to the amount of zero-emitting building block 3 generation assigned to that technology in step five. Dividing the emissions by this total generation value (inclusive of the RE generation apportioned to NGCC) provided a regional adjusted NGCC rate.[757]
Step eight (determining the nationwide subcategory-specific emission performance rate).
Following step seven, we evaluated the resulting adjusted fossil steam rates and NGCC rates for each region and identified the highest (least stringent) emission rate among the three regions for each technology category. This becomes the nationwide emission performance rate for that technology class. This ensures that the same rates are applied to facilities in each region and that these rates are achievable by facilities in all three regions.
Finally, the EPA repeated steps four through eight for each year 2022-2030.[758]
The resulting annual rates vary because the amount of building block 2 and 3 potential in each year varies. The rates for years 2022-2029 were averaged together to calculate an interim rate, and the 2030 value becomes the final emission performance rate for that year forward. As described in the corresponding TSD, the EPA rounded the interim and final subcategory-specific emission performance rates up to the nearest integer to ensure that they did not slightly overstate BSER potential through use of conventional rounding. Unless otherwise stated, conventional rounding is used elsewhere during the calculation process.
It bears emphasis that the procedure described above was used only to determine emission performance rates, and the particular data inputs used in the procedure are not intended to represent specific requirements that would apply to any individual EGU or to the collection of EGUs in any state. The specific requirements applicable to individual EGUs, to the EGUs in a given state collectively, or to other affected entities in the state, would be based on the emission standards established through that state's plan. The details of how states could demonstrate compliance with the emission performance rates or statewide goals through different state plan approaches that recognize emission reductions achieved through all the building blocks are discussed further in section VIII on state plans.
Finally, the procedures and assumptions in the equation to calculate emission performance rates are not intended to reflect a compliance scenario in a future year, but rather reflect a representative year in which the building blocks are applied. The power sector fleet will continue to turn over, and in some cases has already experienced turnover beyond the baseline period. However, while the system's fleet may change, the EPA believes this turnover will only further promote the feasibility of the emission performance rates. Fleet turnover has trended towards, and is expected to continue to trend towards, lower-emitting generation sources that will make reductions more readily available.
( printed page 64820)
VII. State-Specific CO2
Goals
A. Overview
In section VI of this preamble, the EPA provides the methodology for computing subcategory-specific CO2
emission performance rates, based on the BSER. The subcategory-specific CO2
emission performance rates are the quantitative expression of the BSER as determined by the EPA. In this section, we provide state rate-based goals and mass-based goals that can be used in the alternative, by states, as an equivalent quantitative expression of the BSER in establishing standards of performance for affected EGUs in state plans. In this section, the EPA also describes reasons for providing state-specific rate-based goals and mass-based goals equivalent to the emission performance rates, supported by the many requests from commenters for the provision of these alternative expressions of the BSER established by the EPA. We further ensure this equivalence, and therefore reflection of the BSER, by requiring that rate-based state goals and mass-based state goals fully implement the BSER, including by ensuring that affected EGUs operating under mass-based emission standards are not incented by dint of the mass-emissions constraint to shift generation to unaffected fossil fuel-fired sources to an extent that deviates from, or negates, the implementation of the BSER.
The EPA is reconstituting the emission performance rates discussed in section VI into statewide CO2
emission performance goals for each state for the purpose of facilitating states' development of state plans encompassing maximum flexibilities in implementing the BSER. This state-specific goal is not a compliance requirement, but rather an alternative yet equivalent expression of the BSER that the state may choose to use to establish emission standards for its affected EGUs. The state goal is the equivalent of the technology-specific CO2
emission performance rates and represents the equivalent of the state's applying the emission performance rates directly to its affected EGUs in the form of standards of performance. As discussed further in section VIII on state plans, the states are charged with setting emission standards for the affected EGUs in their respective jurisdictions such that the affected EGUs operating under those standards together satisfy the requirements of the final emission guidelines and statute by meeting the emission performance rates or equivalent statewide emission performance goals, and thereby meet emission standards that reflect the BSER.
In the June 2014 proposal, the EPA proposed a set of state-specific emission rate-based CO2
goals (in lbs of CO2
per MWh of electricity generated). In addition, the EPA proposed emission rate-based CO2
goals for areas of Indian country and U.S. territories with affected EGUs in a supplemental proposal on November 4, 2014. To provide flexibility to states, territories, tribes and implementing authorities, the proposals authorized each implementing authority to translate the form of the goal to a mass-based form (
i.e.,
goals expressed in terms of total tons of CO2
per year from affected EGUs), as long as the translated goal was equivalent to the rate-based goal. Upon issuance of the proposed rule, the EPA continued the extensive outreach effort to stakeholders and members of the public that the EPA had engaged in for many months preceding the proposal. We also issued a notice of data availability (79 FR 67406, November 13, 2014) and technical support document (Docket ID: EPA-HQ-OAR-2013-0602-22187) to further clarify potential methods for the translation to a mass-based equivalent. The outreach provided additional opportunities for all jurisdictions with affected EGUs—both individually and in regional groups—as well as numerous industry groups and non-governmental organizations, to meet with the EPA and ask clarifying questions about, and give initial reactions to, the proposed components, requirements and timing of the rulemaking. As a result of the outreach and notice of data availability, the EPA received informed substantive comments for the EPA to consider for the final rule.
Numerous commenters encouraged and supported the EPA's efforts to allow states the maximum possible degree of flexibility in developing plans for their affected EGUs, either as a mass-based or rate-based CO2
goal. States and other stakeholders supported the option to translate rate-based goals to mass-based goals for state plans and requested a simple and transparent method for determining mass-based statewide CO2
goals that are equivalent to statewide rate-based CO2
goals and thus reflective of the BSER. We received substantial comments on the potential methodologies for the translation of rate-based goals to mass-based goals. Several commenters requested that the EPA provide the translation to a statewide mass-based goals directly while others requested flexibility to translate to mass using a variety of methodologies and tools. In the context of these comments, the EPA has considered the appropriateness of rate-based and mass-based goals as an expression of BSER and their equivalence to the quantitative expression of BSER through the two CO2
emission performance rates.
Based on the comments received, the EPA is providing a straightforward translation methodology from the CO2
emission performance rates to yield statewide rate-based and mass-based CO2
emission performance goals described in this section. The EPA is providing state mass-based goals in this final rule in place of having states determine the mass themselves. The mass-based goals are the result of a mathematical derivation that provides goals that are an equivalent expression of the BSER. Section VIII below discusses mechanisms for states to plan for and demonstrate achievement of the statewide CO2
emission performance goals.
CAA section 111(d) requires states to submit a plan that establishes standards of performance for affected EGUs that implement the BSER. States meet the statutory requirements of CAA section 111(d) and the requirements of the final emission guidelines by submitting emission standards for affected EGUs that meet the performance rates, which reflect the application of the BSER as determined by the EPA. Therefore, as a first step for states that choose to submit plans that meet the rate-based or mass-based goals, the goals must be determined to have equivalence as an application of the BSER. For the rate-based and mass-based state goals provided here, this equivalence is evident in the mathematical derivation of the goals, as is described in sections VII.B and VII.C below.
Further (as described in section VIII.J), the state plan must demonstrate that it has measures in place to ensure that any alternative to the performance rates (
i.e.,
rate-based or mass-based state goals that it uses to establish standards of performance) does not result in affected EGUs' failing to implement either the BSER measure themselves or alternative methods of compliance with emission standards that achieve equivalent reductions in emissions or carbon intensity. The EPA has identified one way in which affected EGUs could fail to meet, at a minimum, of the emission performance levels that would result from implementing the BSER, which state plans must do.
Specifically, the EPA has determined that the three building blocks are the BSER, including shifting generation from an affected EGU to a lower-emitting affected EGU or to a non-
( printed page 64821)
emitting EGU and that states are required to establish standards of performance that require affected EGUs to achieve, at a minimum, the emission performance levels that reflect the BSER (recognizing that affected sources may choose from a range of equivalent actions (
e.g.,
undertaking the measures included in the building blocks, shifting generation to low-emitting or zero-emitting resources not included in the building blocks or achieving demand-side EE or transmission efficiency—either through operational undertakings, direct investment or emissions trading). Substantial shifting of generation from affected EGUs to new fossil fuel-fired EGUs, such as new NGCC units, represents a deviation from implementing the BSER or its compliance equivalent.
Since the two subcategory-specific emission performance rates represent the BSER, states that established standards of performance at or below those rates, by definition, would be implementing state plans that created no risk that affected EGUs would shift generation to new fossil-fired EGUs to an extent that would deviate from the BSER. Similarly, the EPA has determined that states using rate-based goals as the foundation for plans implementing the BSER are unlikely to foster generation shifts to new fossil fuel-fired sources to an extent that would deviate from the BSER. In contrast, however, EPA analysis has identified a concern that a mass-based state plan that failed to include appropriate measures to address leakage could result in failure to achieve emission performance levels consistent with the BSER.[759]
Section VII.B describes how the form of the rate-based state goals minimizes the risk of generation shifts to new fossil fuel-fired sources, or “leakage,” by providing affected EGUs with a sufficient incentive to run, similar to the performance rates. Section VII.D. discusses how there is a potential for leakage under mass-based state goals because affected EGUs are incented to operate in a manner—in particular, by shifting generation to new NGCC units (as opposed to shifting generation as contemplated by the BSER or undertaking equivalent alternative compliance actions)—that would result in negating the equivalence with the emission performance rates and thus the BSER, and specifies that requirements are needed in mass-based implementation to assure those incentives are realigned.[760]
B. Reconstituting Statewide Rate-Based CO2
Emission Performance Goals From the Subcategory-Specific Emission Performance Rates
In order to provide states flexibility for planning purposes, the EPA is providing a state-specific averaging of the subcategory-specific emission performance rates to determine a statewide goal. While the emission performance rates reflect the quantification of performance based on the BSER and embody the reductions estimated under building blocks 1, 2, and 3, the state goals reflect an equivalent approach through which states may choose to adopt and implement those subcategory-specific performance rates.
The EPA quantified the potential reductions of the BSER in the subcategory-specific emission performance rates established in section VI. These rates themselves reflect the reduction potential expected in emission rates under the BSER for each year from 2022 to 2030. To establish state goals, the EPA applied these rates to the baseline generation levels to estimate the affected fleet emission rate that would occur if all affected EGUs in the fleet met the subcategory-specific rates. This step respects the flexibility of sources to meet the rates in any manner that they see fit (
e.g.,
on-site abatement technology, fuel switching, co-firing, credit purchase, etc.), and does not limit them to their building block assumptions. For example, the EPA derived the statewide rate-based CO2
emission performance goals for 2030 by multiplying the fossil steam emission performance rate for 2030 by the baseline fossil steam generation in a state and multiplying the NGCC emission performance rate for 2030 by the baseline NGCC generation in a state. The resulting emissions for fossil steam and NGCC are then added together for each state. This emission total is divided by that state's baseline generation values from the likely affected EGUs in order to develop a state's rate-based CO2
emission performance goal for 2030. This blended rate reflects the collective emission rate a state may expect to achieve when its baseline fleet of likely affected EGUs continues to operate at baseline levels while meeting its subcategory-specific emission performance rates reflecting the BSER. The EPA believes that using the adjusted 2012 baseline is the most appropriate way to combine the rates. First, as explained in Section VI, the EPA believes there are significant advantages to using real world data to set a baseline rather than using projected data. The adjusted 2012 data is the logical starting point because it is the data that all of the emission performance rates (discussed in Section VI) are based upon. Furthermore, it is clear that generation shifts as projected under the BSER are not the appropriate baseline. The emission performance rates already factor in the BSER assumptions about changes in generation (
e.g.,
implementation of building block 2 significantly lowers the emission performance rate for fossil-steam units). If, on top of that, changes in generation were factored into the calculation of a combined rate, those changes in generation would be factored into the combined rate twice (once when calculating the individual emission performance rates and a second time, when incorporating those rates into a combined state rate).
This step is repeated for each year from 2022-2029 using the emission performance rates calculated for each of those years in the previous section. The EPA also repeats this step for the interim state goal using the interim subcategory rates. The EPA then averages together the annual amounts in increments of 3 years, 3 years, and 2 years for 2022-2024, 2025-2027, and 2028-2029 to estimate emission rate averages for those periods that can provide one illustrative pathway for states to consider in meeting their interim goals. These 3- and 2-year increment are not regulatory guidelines or equivalents for interim goals, but rather benchmarks for demonstrating plan performance as discussed in Section VIII.F illustrative of a potential gradual reduction compliance strategy that states may use to reach their interim and final state goals.
As described in the steps above, the statewide goals represent an equivalent arithmetic combination of the subcategory-specific emission performance rates, weighted by the historical baseline generation levels upon which the BSER is premised. In particular, as discussed above, the method for deriving these goals assures equivalent flexibility by applying the CO2
emission performance rates to the baseline levels, which respects the flexibility of affected EGUs to meet the rates in whatever way they wish. This corresponding treatment of affected EGUs based on the adjusted 2012 baseline ensures sufficient incentive to affected existing EGUs to generate and thus avoid leakage, similar to the CO2
( printed page 64822)
emission performance rates (this is further discussed in section VII.D below). Consequently, the statewide goals are equivalent to the CO2
emission performance rates and are thus an equivalent expression of the BSER. The rate-based statewide goals are provided below in Table 12.
C. Quantifying Mass-Based CO2
Emission Performance Goals From the Statewide Rate-Based CO2
Emission Performance Goals
The EPA is also establishing mass-based statewide CO2
emission performance goals for each state, which are provided below in Table 13. For state plans choosing to meet a mass-based goal, such a goal must be equivalent to the CO2
emission performance rates in their application of the BSER, as required by the statute and the final emission guidelines. In the following discussion we describe the mathematical calculations that provide an equivalent expression of the BSER. In evaluating the equivalence of the form of mass goals, the EPA must also recognize the impact that the form of the standard has on the relative incentives that the implementation of these goals provides to affected and unaffected EGUs. This section specifies how we have established a quantitative basis for mass goals that is equivalent to CO2
emission performance rates. The next section (section VII.D) specifies how we require state plans to ensure equivalence to the CO2
emission performance rates through certain requirements that realign the potential difference in incentives provided to affected and unaffected EGUs to generate under a mass-based implementation compared to a rate-based implementation that could result in leakage.
The starting place for quantifying mass-based statewide CO2
emission performance goals is the emission amounts directly represented in the numerator of the statewide rate-based CO2
emission performance goals. Each state-specific emission amount is the product of the fossil steam emission performance rate and historical fossil steam generation, added to the product of the NGCC emission performance rate and historical NGCC generation. The resulting emission amounts for each state represent the emissions associated with rate-based compliance at historical generation levels.
However, under a rate-based state plan, all affected EGUs have the opportunity to increase utilization, provided that sufficient emission reduction measures are available to maintain the necessary ratio of emissions to generation as quantified by the subcategory-specific emission performance rates. Due to the nature of the emission performance rate methodology, which selects the highest of the three interconnection-based values for each source category as the CO2
emission performance rate, there are cost-effective lower-emitting generation opportunities quantified under the building blocks that are not necessary for affected EGUs in the Western and Texas interconnections to demonstrate compliance at historical generation levels. The EPA recognizes that these lower-emitting generation opportunities are available to affected EGUs at a national level as a means to increase their own output (and, as a result, their own emissions) while maintaining the relevant emission performance rate. To afford affected EGUs subject to a mass-based goal similar compliance flexibility as EGUs subject to a rate-based goal, the EPA has quantified the emissions associated with the potential realization of these lower-emitting generation opportunities and incorporated those additional tons into each state's mass-based goal.[761]
Because the derivation of these mass-based goals respects the arithmetic of the subcategory-specific emission performance rates and the flexibility of affected EGUs to achieve those rates while utilizing up to the full potential quantified in the building blocks, the derivation of these mass-based state goals offers an equivalent expression of BSER in mass form.
The mass goals for existing sources are presented in Table 13. Although their derivation is equivalent to the subcategory-specific emission performance rates, in order to maintain this equivalence in the establishment of emission standards in state plans mass goals must be implemented in combination with requirements that align the incentives provided to affected and unaffected EGUs, specifically in order to prevent leakage.
D. Addressing Potential Leakage in Determining the Equivalence of State-Specific CO2
Emission Performance Goals
As described in section VI, the subcategory-specific emission performance rates reflect the BSER as determined by the EPA. This final rule allows states to establish emission standards that meet either rate-based or mass-based state goals. As stated above, rate-based state goals were published in the proposed rule, and commenters not only supported having the flexibility to use rate-based goals or mass-based goals as part of state plans, but also requested that the EPA include mass-based goals in this final rule. But to ensure the equivalence of mass-based state goals, we must consider how the form of the goal affects its implementation and how the incentives it provides to affected EGUs on the interstate grid affect whether or not the BSER is fully implemented.
Because of the integrated nature of the utility power sector, the form of the emission performance requirements for existing sources may ultimately impact the relative incentives to generate and emit at affected EGUs as opposed to shifting generation to new sources, with potential implications for whether a given set of standards of performance is, at a minimum, consistent with the BSER, in the context of overall emissions from the sector. In this context, we, again, define as “leakage” the potential of an alternative form of implementation of the BSER (
e.g.,
the rate-based and mass-based state goals) to create a larger incentive for affected EGUs to shift generation to new fossil fuel-fired EGUs relative to what would occur when the implementation of the BSER took the form of standards of performance incorporating the subcategory-specific emission performance rates representing the BSER. In the proposal, the EPA recognized that the statutory construction regarding the BSER is to reduce emissions, which can be achieved through shifts of generation. Movement of generation between and among sources is needed to produce overall reductions, particularly movement from higher-emitting affected EGUs to lower-emitting affected EGUs, and from all affected EGUs to zero-emitting RE. In all of these cases, the fossil sources involved in these generation shifts are subject to obligations under this final rule.[762]
However, leakage, where shifts in generation to unaffected fossil fuel-fired sources result in increased emissions, relative to what would have happened
( printed page 64823)
had generation shifts consistent with the BSER occurred, is contrary to this construction. Therefore, if the form of the standard does not address leakage or incents the kinds of generation shifts that we identify as leakage, the states must otherwise address leakage in order to ensure that the standards of performance applied to the affected EGUs are, in the aggregate, at least equivalent with the emission performance rates, and therefore appropriately reflect the BSER as required by the statute. Commenters noted that shifting generation and emissions from existing sources to new sources undermined the intent of this rule and the overall emission reduction goals, and that requiring states to address leakage is consistent with the obligation that states establish standards of performance that, in the aggregate, at a minimum, reflect the BSER for affected EGUs operating in the interconnected electricity sector.
This section specifically addresses the need for state plans designed to achieve either rate- or mass-based state goals to ensure that their plans succeed in implementing standards of performance that reflect the BSER by minimizing the difference in incentives provided to affected EGUs and new sources to generate in order to maintain equivalent emission performance with the CO2
emission performance rates.
Rate-based goals do not in our view implicate leakage to an extent that would negate or limit the implementation of the BSER because under a rate-based state goal, similar to the subcategory-specific emission performance rates, existing lower-emitting affected EGUs, primarily NGCC units, are incentivized to increase their utilization in order to improve the average emission rates of affected EGUs overall. New units that are not subject to the rate-based state goal, and that are not an allowable measure for adjusting an EGU's CO2
emission rate, will not have this incentive to increase utilization, and as a result, the imposition of a rate-based goal on affected EGUs is unlikely to encourage increased generation and emissions from unaffected new EGUs. The form of the rate-based state goals provides an equivalent or greater incentive to affected existing EGUs as they are provided in the CO2
emission performance rates, and similarly avoid the potential for leakage. Under both approaches, existing NGCC units can generate ERCs. These ERCs provide an economic incentive to utilize existing NGCC units rather than new NGCC units. Further, ERCs from incremental RE incentivize new renewable generation over new NGCC generation. Both of these features, which exist in the context of implementation with a state rate-based goal or CO2
emission performance rates, provide significant incentives to ensure that, consistent with the BSER, shifting of generation does not occur between existing fossil fuel-fired units and new NGCC units.
Mass-based goals for existing sources, however, incur a leakage risk to the extent that they incent generation shifts from affected EGUs to unaffected fossil fuel-fired sources in a way that negates the reliance on the BSER. In contrast to various forms of rate-based implementation, mass-based implementation in a state plan can unintentionally incentivize increased generation from unaffected new EGUs as a substitute action for reducing emissions at units subject to the existing source mass goal in ways that would negate the implementation of the BSER and would result in increased emissions. This occurs because, unlike in a rate-based system where rate-based averaging lowers the cost of generation from existing NGCC units relative to generation from new NGCC units, in a mass-based system the allowance price increases the cost of generation from existing NGCC units relative to generation from new NGCC units. The extent to which electricity providers opt to rely on this increase in unaffected new source utilization as a substitute for improving the emissions performance across existing sources would be fundamentally inconsistent with relying on the BSER to reduce emissions as the basis of the subcategory-specific emission performance rates.
As a result, notwithstanding the fact that mass goals for existing sources are quantified in a way that is an equivalent expression of the BSER, the form of mass goals is only equivalent if leakage is satisfactorily addressed in the state plan's establishment of emission standards and implementation measures. The EPA is therefore requiring that states adopting a mass-based state plan include requirements that address leakage, or otherwise provide additional justification that leakage would not occur under the state's implementation of mass-based emission standards. This requirement enables states to establish standards of performance that meet a mass-based goal equivalent to the performance rates and therefore reflect the BSER, as required by section 111(d). The required demonstration and options for state plans to minimize leakage are discussed in detail in section VIII.J of this preamble.
Further supporting the need for this requirement, the EPA has evaluated the mass goals in concert with some of the options to minimize leakage described in that section. As mentioned above, the EPA analysis identified a concern regarding leakage in a mass-based approach, namely that the mass-based implementation without measures to address leakage produced higher generation from new NGCC units and lower emission performance when compared to a rate-based implementation. Further analysis where implementation of the mass-based goals was coupled with measures to address leakage produce utility power sector emissions performance that is similar to emissions performance under the rate goals.[763]
E. State Plan Adjustments of State Goals
The EPA notes that it is the emission performance rates in section VI that constitute the application of the BSER to the affected EGUs and serve as the chief regulatory requirement of this rulemaking. The statewide CO2
rate-based and mass-based emission performance goals provided here are metrics that states may choose to adopt when demonstrating compliance at the state level, and states may consider these goals when determining how to set unit-level compliance requirements. The EPA believes that the regional nature of determining the emission performance rates encompasses a large population size and makes it robust against unit-level variation and unit-level inventory discrepancies. The EPA does acknowledge that state-level rate-based goals or mass-based goals may be sensitive to applicability changes within a state's affected population. In the proposal, the EPA used a baseline that aggregated data for what it believed to be affected units and asked states, companies and other stakeholders to provide corrections in their comments. We received input from many commenters and have corrected information as appropriate. Therefore, we believe the baseline to be accurate. However, if subsequent applicability review or formal applicability determinations change the status of units in regards to being affected or unaffected by this rulemaking, states can, via state plan submittal or revision, adjust their statewide rate or mass goal to reflect this change of status.
This adjustment flexibility provision is based on comments received at proposal. For example, some
( printed page 64824)
stakeholders noted that the affected status of particular units was unclear. The EPA recognizes that all the necessary data to determine the affected status of some units may not be available at this time. As stated above, the EPA does not believe unit-level variation or inclusion/exclusion disparities between baseline inventory and affected units will impact the regionally determined emission performance rates discussed in the previous section. However, variations in baseline data or inventory may have an impact on the
state-level
rate-based or mass-based goals provided in this section. Therefore, the EPA is allowing the flexibility for states to demonstrate the need for this type of adjustment under the justifications above and utilize an adjusted value for compliance purposes when submitting or revising its state plan. The EPA will evaluate the appropriateness of such an adjusted value based on the state's demonstration and evaluate the approvability of a plan or plan revision accordingly.
Rate-based statewide CO2
emission performance goals are listed below in Table 12. Mass-based statewide CO2
emission performance goals are found in
Table 13.
Table 12—Statewide 764
Rate-Based CO2
Emission Performance Goals
[Adjusted output-weighted-average pounds of CO2
per net MWh from all affected fossil fuel-fired EGUs]
State name
Interim goal—
Step 1
Interim goal—
Step 2
Interim goal—
Step 3
Interim goal
Final goal
Alabama
1,244
1,133
1,060
1,157
1,018
Arizona *
1,263
1,149
1,074
1,173
1,031
Arkansas
1,411
1,276
1,185
1,304
1,130
California
961
890
848
907
828
Colorado
1,476
1,332
1,233
1,362
1,174
Connecticut
899
836
801
852
786
Delaware
1,093
1,003
946
1,023
916
Florida
1,097
1,006
949
1,026
919
Georgia
1,290
1,173
1,094
1,198
1,049
Idaho
877
817
784
832
771
Illinois
1,582
1,423
1,313
1,456
1,245
Indiana
1,578
1,419
1,309
1,451
1,242
Iowa
1,638
1,472
1,355
1,505
1,283
Kansas
1,654
1,485
1,366
1,519
1,293
Kentucky
1,643
1,476
1,358
1,509
1,286
Lands of the Fort Mojave Tribe
877
817
784
832
771
Lands of the Navajo Nation
1,671
1,500
1,380
1,534
1,305
Lands of the Uintah and Ouray Reservation
1,671
1,500
1,380
1,534
1,305
Louisiana
1,398
1,265
1,175
1,293
1,121
Maine
888
827
793
842
779
Maryland
1,644
1,476
1,359
1,510
1,287
Massachusetts
956
885
844
902
824
Michigan
1,468
1,325
1,228
1,355
1,169
Minnesota
1,535
1,383
1,277
1,414
1,213
Mississippi
1,136
1,040
978
1,061
945
Missouri
1,621
1,457
1,342
1,490
1,272
Montana
1,671
1,500
1,380
1,534
1,305
Nebraska
1,658
1,488
1,369
1,522
1,296
Nevada
1,001
924
877
942
855
New Hampshire
1,006
929
881
947
858
New Jersey
937
869
829
885
812
New Mexico *
1,435
1,297
1,203
1,325
1,146
New York
1,095
1,005
948
1,025
918
North Carolina
1,419
1,283
1,191
1,311
1,136
North Dakota
1,671
1,500
1,380
1,534
1,305
Ohio
1,501
1,353
1,252
1,383
1,190
Oklahoma
1,319
1,197
1,116
1,223
1,068
Oregon
1,026
945
896
964
871
Pennsylvania
1,359
1,232
1,146
1,258
1,095
Rhode Island
877
817
784
832
771
South Carolina
1,449
1,309
1,213
1,338
1,156
South Dakota
1,465
1,323
1,225
1,352
1,167
Tennessee
1,531
1,380
1,275
1,411
1,211
Texas
1,279
1,163
1,086
1,188
1,042
Utah *
1,483
1,339
1,239
1,368
1,179
Virginia
1,120
1,026
966
1,047
934
Washington
1,192
1,088
1,021
1,111
983
West Virginia
1,671
1,500
1,380
1,534
1,305
Wisconsin
1,479
1,335
1,236
1,364
1,176
Wyoming
1,662
1,492
1,373
1,526
1,299
* Excludes EGUs located in Indian country within the state.
( printed page 64825)
Table 13—Statewide Mass-Based CO2
Emission Performance Goals
[Adjusted output-weighted-average tons of CO2
from all affected fossil fuel-fired EGUs]
State
Interim goal—
Step 1
Interim goal—
Step 2
Interim goal—
Step 3
Interim goal
Final goal
Alabama
66,164,470
60,918,973
58,215,989
62,210,288
56,880,474
Arizona*
35,189,232
32,371,942
30,906,226
33,061,997
30,170,750
Arkansas
36,032,671
32,953,521
31,253,744
33,683,258
30,322,632
California
53,500,107
50,080,840
48,736,877
51,027,075
48,410,120
Colorado
35,785,322
32,654,483
30,891,824
33,387,883
29,900,397
Connecticut
7,555,787
7,108,466
6,955,080
7,237,865
6,941,523
Delaware
5,348,363
4,963,102
4,784,280
5,062,869
4,711,825
Florida
119,380,477
110,754,683
106,736,177
112,984,729
105,094,704
Georgia
54,257,931
49,855,082
47,534,817
50,926,084
46,346,846
Idaho
1,615,518
1,522,826
1,493,052
1,550,142
1,492,856
Illinois
80,396,108
73,124,936
68,921,937
74,800,876
66,477,157
Indiana
92,010,787
83,700,336
78,901,574
85,617,065
76,113,835
Iowa
30,408,352
27,615,429
25,981,975
28,254,411
25,018,136
Kansas
26,763,719
24,295,773
22,848,095
24,859,333
21,990,826
Kentucky
76,757,356
69,698,851
65,566,898
71,312,802
63,126,121
Lands of the Fort Mojave Tribe
636,876
600,334
588,596
611,103
588,519
Lands of the Navajo Nation
26,449,393
23,999,556
22,557,749
24,557,793
21,700,587
Lands of the Ute Tribe of the Uintah and Ouray Reservation
2,758,744
2,503,220
2,352,835
2,561,445
2,263,431
Louisiana
42,035,202
38,461,163
36,496,707
39,310,314
35,427,023
Maine
2,251,173
2,119,865
2,076,179
2,158,184
2,073,942
Maryland
17,447,354
15,842,485
14,902,826
16,209,396
14,347,628
Massachusetts
13,360,735
12,511,985
12,181,628
12,747,677
12,104,747
Michigan
56,854,256
51,893,556
49,106,884
53,057,150
47,544,064
Minnesota
27,303,150
24,868,570
23,476,788
25,433,592
22,678,368
Mississippi
28,940,675
26,790,683
25,756,215
27,338,313
25,304,337
Missouri
67,312,915
61,158,279
57,570,942
62,569,433
55,462,884
Montana
13,776,601
12,500,563
11,749,574
12,791,330
11,303,107
Nebraska
22,246,365
20,192,820
18,987,285
20,661,516
18,272,739
Nevada
15,076,534
14,072,636
13,652,612
14,344,092
13,523,584
New Hampshire
4,461,569
4,162,981
4,037,142
4,243,492
3,997,579
New Jersey
18,241,502
17,107,548
16,681,949
17,426,381
16,599,745
New Mexico*
14,789,981
13,514,670
12,805,266
13,815,561
12,412,602
New York
35,493,488
32,932,763
31,741,940
33,595,329
31,257,429
North Carolina
60,975,831
55,749,239
52,856,495
56,986,025
51,266,234
North Dakota
25,453,173
23,095,610
21,708,108
23,632,821
20,883,232
Ohio
88,512,313
80,704,944
76,280,168
82,526,513
73,769,806
Oklahoma
47,577,611
43,665,021
41,577,379
44,610,332
40,488,199
Oregon
9,097,720
8,477,658
8,209,589
8,643,164
8,118,654
Pennsylvania
106,082,757
97,204,723
92,392,088
99,330,827
89,822,308
Rhode Island
3,811,632
3,592,937
3,522,686
3,657,385
3,522,225
South Carolina
31,025,518
28,336,836
26,834,962
28,969,623
25,998,968
South Dakota
4,231,184
3,862,401
3,655,422
3,948,950
3,539,481
Tennessee
34,118,301
31,079,178
29,343,221
31,784,860
28,348,396
Texas
221,613,296
203,728,060
194,351,330
208,090,841
189,588,842
Utah*
28,479,805
25,981,970
24,572,858
26,566,380
23,778,193
Virginia
31,290,209
28,990,999
27,898,475
29,580,072
27,433,111
Washington
12,395,697
11,441,137
10,963,576
11,679,707
10,739,172
West Virginia
62,557,024
56,762,771
53,352,666
58,083,089
51,325,342
Wisconsin
33,505,657
30,571,326
28,917,949
31,258,356
27,986,988
Wyoming
38,528,498
34,967,826
32,875,725
35,780,052
31,634,412
* Excludes EGUs located in Indian country within the state.
F. Geographically Isolated States and Territories With Affected EGUs
Alaska, Hawaii, Guam, and Puerto Rico constitute a small set of states and U.S. territories representing about one percent of total U.S. EGU GHG emissions. Based on the current record, the EPA does not possess all of the information or the analytic tools needed to quantify the application of the BSER for these states and territories, particularly data regarding RE costs and performance characteristics needed for building block 3 of the BSER. The NREL data for RE that the EPA is relying upon for building block 3 does not cover the non-contiguous states and territories.
The EPA acknowledges that NREL has collaborated with the state of Hawaii to provide technical expertise in support of the state's aggressive goals for clean energy, including analyses of the grid integration and transmission of solar and wind resources.[765]
The EPA also recognizes that there are studies and data for some renewable resources in some of the other non-contiguous jurisdictions. However, taken as a whole, the data we currently possess do not allow us to quantify the emissions reductions available from building block 3 using the same methodology used for
( printed page 64826)
the contiguous states encompassed by the three interconnections. Lastly, the IPM model used to support the EPA's analysis is geographically limited to the contiguous U.S. As a result of these factors, the EPA currently lacks the necessary analytic resources to set emission performance goals for these areas.
Because of the lack of suitable data and analytic tools needed to develop area-appropriate building block targets as defined in section V, the EPA is not setting CO2
emission performance goals for Alaska, Hawaii, Guam, or Puerto Rico in this final rule at this time. The EPA believes it is within its authority to address performance goals only for the contiguous U.S. states in this final rule. Under section 111(d), the EPA is not required, at the time that the EPA promulgates section 111(b) requirements for new sources, to promulgate emission guidelines for all of the sources that, if they were new sources, would be subject to the section 111(b) requirements if there is a reasonable basis for deferring certain groups of sources. As discussed, in this rule, the EPA has a reasonable basis for deferring setting goals for these four jurisdictions. In addition, the Courts have recognized the authority of agencies to develop regulatory programs in step-by-step fashion. As the U.S. Supreme Court noted in
Massachusetts
v.
EPA,
549 U.S. 497, 524 (2007): “Agencies, like legislatures, do not generally resolve massive problems in one fell regulatory swoop;” and instead they may permissibly implement such regulatory programs over time, “refining their preferred approach as circumstances change and as they develop a more nuanced understanding of how best to proceed.” [766]
The EPA recognizes, however, that EGUs in Alaska, Hawaii, Puerto Rico, and Guam emit CO2
and that there are opportunities to reduce the carbon intensity of generation in those areas over time. We recognize further that there are efforts underway to increase the use of RE in these jurisdictions. In particular, we recognize that Hawaii has tremendous opportunities for RE and has adopted very ambitious goals: 40 percent clean energy by 2030 and 100 percent by 2045. Since 2008, Alaska has apportioned in excess of $1.34 billion pursuing its aspirational goal of 50 percent of the state's total yearly electric load from renewable and alternative energy sources by 2025. Puerto Rico's goal is to achieve 20 percent RE sales by 2035, and the territory is working hard to meet the requirements of the Mercury and Air Toxics Standards, which will reduce emissions from its power plants substantially. Guam's RPS is to achieve 25 percent REsales by 2035.
The agency intends to continue to consider these issues and determine what the appropriate BSER is for these areas. As part of that effort, the agency will investigate sources of information and types of analysis appropriate to devise the appropriate levels for building block 3 and BSER performance levels. Because we recognize that these areas face some of the most urgent climate change challenges, severe public health problems from air pollution and some of the highest electricity rates in the U.S., the EPA is committed to obtaining the right information to quantify the emission reductions that are achievable in these four areas and putting goals in place soon.
VIII. State Plans
A. Overview
After the EPA establishes the emission guidelines that set forth the BSER, each state with one or more affected EGUs [767]
shall then develop, adopt and submit a state plan under CAA section 111(d) that establishes standards of performance for the affected EGUs in its jurisdiction in order to implement the BSER. Starting from the foundation of CAA section 111(d) and the EPA's implementing regulations (40 CFR part 60 subpart B), the EPA's proposal laid out a number of options, variations and flexibilities that were intended to provide states and affected EGUs the ability to design state plans that accorded with states' specific situations and policies (now and in the future), and to ensure reliability and affordability of electricity across the system and for all ratepayers. The proposal has prompted numerous discussions between and among stakeholders, especially states and groups of states, including state environmental and energy regulators and policy officials. The EPA has received many comments from a wide range of stakeholders seeking a final rule that afforded freedom and flexibility to consider a wide range of standards of performance to implement the BSER, but also providing significant feedback on the elements and options in the proposal and constructive suggestions for alternative approaches. The EPA has carefully considered all of this input, and is finalizing emission guidelines that continue to provide a variety of options for states to fashion their plans in ways legally supportable by the CAA, while also making certain adjustments to address key comments.
The next few paragraphs present an overview of the main features of the final emission guidelines, highlighting key changes from proposal. In the rest of this section, we describe in detail the various elements of the final emission guidelines' requirements for state plans.
The proposal contained rate-based goals for each state, reflecting a blended reduction target for that state's fossil fired EGUs, and provided that states could either meet that rate-based goal or convert it to a mass-based equivalent goal. Reflecting the final BSER described in section V and in response to many comments desirous that the EPA establish mass-based goals in the final rule, these final guidelines include three approaches that states may adopt for purposes of implementing the BSER, any one of which a state may use in its plan. These are: (1) Establishing standards of performance that apply the subcategory-specific CO2
emission performance rates to their affected EGUs, (2) adopting a combination of standards and/or other measures that achieve state-specific rate-based goals that represent the weighted aggregate of the CO2
emission performance rates applied to the affected EGUs in each state, and (3) adopting a program to meet mass-based CO2
emission goals that represent the equivalent of the rate-based goal for each state. These alternatives, as well as the other options we are finalizing, ensure that both states and affected EGUs enjoy the maximum flexibility and latitude in meeting the requirements of the emission guidelines and that the BSER is fully implemented by each state.
In the proposal, we provided two designs for state plans: One where all the reduction obligations are placed directly on the affected EGUs and one, which we called the “portfolio approach,” that could include measures to be implemented, in whole or in part, by parties other than the affected EGUs. In the final guidelines, we retain that
( printed page 64827)
basic choice, but with some modifications to respond to comments we received, especially on the portfolio approach. In their plans, states will be able to choose either to impose federally enforceable emission standards that fully meet the emission guidelines directly on affected EGUs (the “emission standards” approach) or to use a “state measures” approach, which would be composed, at least in part, of measures implemented by the state that are not included as federally enforceable components of the plan but result in the affected EGUs meeting the requirements of the emission guidelines. A state measures type plan must include a backstop of federally enforceable standards on affected EGUs that fully meet the emission guidelines and that would be triggered if the state measures fail to result in the affected EGUs achieving on schedule the required emission reductions.
States that choose an emission standards plan may establish as standards of performance for their affected EGUs the subcategory-specific CO2
emission performance rates, which express the BSER.[768]
This would satisfy the requirement described in section VIII.D.2.a.3 that a state demonstrate its plan would achieve the CO2
emission performance rates; in this case, no further demonstration would be necessary. Alternatively, a state may establish emission standards for affected EGUs at different levels from the uniform subcategory-specific emission performance rates, provided that when implemented, the emission standards achieve the CO2
emission performance rates or state rate- or mass-based CO2
emission goal set forth by the EPA for the state. States that adopt differential standards of performance among their affected EGUs must demonstrate that, in the aggregate, the differential standards of performance will result in their affected EGUs meeting the CO2
emission performance rates, the state's rate-based CO2
emission goal or its mass-based CO2
emission goal.
In the proposal, we proposed that states could use the portfolio approach to meet either a rate- or mass-based goal. In these final emission guidelines, the state measures approach is available only for a state choosing a mass-based CO2
emission goal, to provide certainty that the state measures are achieving the required emission reductions. Similar to emission standards plans with differential standards of performance, states that adopt state measures plans must demonstrate that the state measures, alone or in conjunction with any federally enforceable emission standards on affected EGUs also included in the state plan, will result in the affected EGUs in the state meeting the state's mass-based CO2
emission goal. A “state measures” type plan must also include a backstop provision—triggered if, during the interim period, the state plan fails to achieve the emission reduction trajectory identified in the plan or if, during the final phase, the state plan fails to meet the final state mass-based CO2
emission goal—that would impose federally enforceable emission standards on the affected EGUs adequate to meet the emission guidelines when fully implemented.
The final guidelines reflect the changes to the timing of the reductions within the interim period, which is laid out in section V as part of the determination of the BSER. States may adopt in their plans emission reduction trajectories different from the illustrative three-step trajectory included in these guidelines for purposes of creating a “glide path” between 2022 and 2029, provided that the interim and final CO2
emission performance rates or state CO2
emission goals are met.
We recognize that while we are establishing 2022 as the date by which the period for mandatory reductions must start as part of our BSER determination, utilities and other parties are moving forward with projects that reduce emissions of CO2
from affected EGUs. We received numerous comments urging us to allow credit for these early actions. The final guidelines encourage those early reductions, by making clear that states may, in their plans, allow EGUs to use allowances or ERCs generated through the CEIP. The final guidelines also require that states include in their final plans a schedule of the actions they will be taking to ensure that the period for mandatory reductions will begin as required starting in 2022, and submit a progress report on those actions.
For all types of plans, the final guidelines make clear that states may adopt programs that allow trading among affected EGUs. The final guidelines retain the flexibility for states to do individual plans, or to join with other states in a multi-state plan. In addition, and in response to comments from many states and other stakeholders, the guidelines provide that states may design their programs so that they are “ready for interstate trading,” that is, that they contain features necessary and suitable for their affected EGUs to engage in trading with affected EGUs in other “trading ready” states without the need for formal arrangements between individual states.
We have been mindful of the concerns raised by stakeholders about reliability. The final BSER, especially the changes in the timing of the interim period, substantially address these concerns. The flexibilities provided for the design of state plans, including the ability to use trading programs, further enhance system reliability. We have included, as an additional assurance, a reliability safety valve for use where the built-in flexibilities are not sufficient to address an immediate, unexpected reliability situation.
The EPA believes that all the flexibilities provided in the final rule are not only appropriate, but will enhance the success of the program. CO2
is a global pollutant, and where and when the reductions occur is not as significant to the environmental outcome as compared to many other pollutants. The flexibilities provided in the final guidelines will better reflect the unique interconnectedness of the electricity system, and will allow states and EGUs to reduce CO2
emissions while maintaining reliability and affordability for all consumers.
In developing the plan, the state rulemaking process must meet the minimum public participation requirements of the implementing regulations as applicable to these guidelines, including a public hearing and meaningful engagement with all members of the public, including vulnerable communities. In the community and environmental justice considerations section, section IX of this preamble, the EPA addresses the actions that the agency is taking to help ensure that vulnerable communities are not disproportionately impacted by this rule. These actions include conducting a proximity analysis, setting expectations for states to engage meaningfully with vulnerable communities and requiring that they describe their plans for doing so as they develop their state plans, providing communities with access to additional resources, providing communities with information on federal programs and resources available to them, recommending that states take a multi-pollutant planning approach that examines the potential impacts of co-pollutants on overburdened communities, and conducting an assessment to determine if any localized air quality impacts need to be further addressed. Additionally, the EPA outlines the continued engagement that it will be conducting with states and communities throughout the state plan development process.
( printed page 64828)
As discussed in more detail in section VIII.E, commenters, particularly states, provided compelling information establishing that for some, and perhaps many, states it will take longer than the agency initially anticipated to develop and submit their required plans. In response to those comments, we are finalizing a plan submittal process that provides additional time for states that need it to submit a final plan submittal to the EPA after September 6, 2016. Within the time period specified in the emission guidelines (from as early as September 6, 2016, to as late as September 6, 2018, depending on whether the state receives an extension), the state must submit its final state plan to the EPA. The EPA then must determine whether to approve or disapprove the plan. If a state does not submit a plan, or if the EPA disapproves a state's plan, then the EPA has the express authority under CAA section 111(d) to establish a federal plan for the state.[769]
During and following implementation of its approved state plan, each state must demonstrate to the EPA that its affected EGUs are meeting the interim and final performance requirements included in this final rule through monitoring and reporting requirements.
This section is organized as follows. First, we discuss the timeline for state plan performance and provisions to encourage early action. Second, we describe the types of plans that states can submit. Third, we summarize the components of an approvable state plan submittal. Fourth, we address the process and timing for submittal of state plans and plan revisions. Fifth, we address plan implementation and achievement of CO2
emission performance rates or state CO2
emission goals for affected EGUs, and the consequences if they are not met. Sixth, we discuss general considerations for states in developing and implementing plans, including consideration of a facility's “remaining useful life” and “other factors” and electric reliability. Seventh, we note certain resources that are available to facilitate state plan development and implementation. Finally, we discuss additional considerations for inclusion of CO2
emission reduction measures in state plans, including: Accounting for emission reduction measures in state plans; requirements for mass-based and rate-based emission trading approaches; EM&V requirements for RE and demand-side EE resources and other measures used to adjust a CO2
rate; and treatment of interstate effects.
B. Timeline for State Plan Performance and Provisions To Encourage Early Action
This section describes state plan requirements related to the timing of achieving the emission reductions required in the guidelines and the state plan performance periods. This section also describes the CEIP the EPA is establishing to encourage early investment in certain types of RE projects, as well as in demand-side EE projects implemented in low-income communities.
1. Timeline for State Plan Performance
The final guidelines establish three types of performance periods: (1) A final deadline by which and after which affected EGUs must be in compliance with the final reduction requirements, (2) an interim period, and (3) within that interim period, three multi-year interim step periods. As discussed below and in section V, these performance periods are consistent with our determination of the BSER and are also responsive to the key comments we received on this aspect of the state plans.
A performance period is a period for which the final plan submittal must demonstrate that the required CO2
emission performance rates or state CO2
emission goal will be met. The final guidelines establish 2030 as the deadline for compliance by affected EGUs with the final CO2
emission performance rates or CO2
rate or mass emission goal; 2030 is the beginning of the final performance period. The interim performance period is 2022 to 2029, and there are three interim step periods—2022-2024, 2025-2027, and 2028-2029—where increasingly stringent emission performance rates or state emission goals must be met. The state may submit a plan that incorporates alternative interim step emission performance rates or state emission goals to those provided by EPA, as long as on average or cumulatively, as appropriate, they result in the equivalent of the interim emission performance rates or state emission goals in the emission guidelines. These timelines are based on careful consideration of the substantial comments we received on both the timing of the interim period and the trajectory of compliance by affected EGUs over the interim period and our determination of the BSER, discussed in section V above. The modifications we have made to the timelines included in the proposal respond to these comments and to concerns about, among other things, reliability, feasibility, and cost.
As previously discussed, the EPA has determined that the BSER includes implementation of reduction measures over the period of 2022 through 2029, with final compliance by affected EGUs in 2030. Therefore, the final rule requires that interim CO2
emission performance rates or state CO2
emission goals be met for the interim period of 2022-2029. Many commenters expressed a desire that the EPA designate steps during the interim period to create an interim goal that offered states and utilities greater flexibility and choice in determining their own emission reduction trajectories over the course of the interim period. Since our intent at proposal was to provide such flexibility and choice, and since it remains our intent to do so in this final rule, we are addressing these comments by including in the 2022-2029 interim period three interim step periods (2022-2024, 2025-2027, 2028-2029), which correspond roughly to the phasing in of the BSER. We note, however, that the final rule also allows states the flexibility to define an alternate trajectory of emission performance between 2022 and 2029, provided that (1) the state plan specifies its own interim step CO2
emission performance rates or state CO2
emission goals, (2) meeting the alternative interim step CO2
emission performance rates or state CO2
emission goals will result in the interim emission performance rates or state CO2
emission goal being met on an 8-year average or cumulative basis, and, (3) the final CO2
emission performance rates or state CO2
emission goal is achieved. To be approvable, a state plan submittal must demonstrate that the emission performance of affected EGUs will meet the interim step CO2
emission performance rates or interim step state CO2
emission goals over the 2022-2024, 2025-2027, and 2028-2029 periods and the final CO2
emission performance rates or state CO2
emission goal no later than 2030.[770]
This relatively long period—first for planning, then for implementation and achievement of the interim and final CO2
emission performance rates or state CO2
emission goals—provides states and
( printed page 64829)
utilities with substantial flexibility regarding methods and timing of achieving emission reductions from affected EGUs. The EPA believes that timing flexibility in implementing measures provides significant benefits that allow states to develop plans that will help achieve a number of goals, including, but not limited to: Reducing cost, addressing reliability concerns, addressing concerns about stranded assets, and facilitating the integration of meeting the emission guidelines and compliance by affected EGUs with other air quality and pollution control obligations on the part of both states and affected EGUs. Moreover, we note that over the course of time between submittal of final plans and 2030, circumstances may change such that states may need or wish to modify their plans. The relatively lengthy performance periods provided in the final rule should help keep those situations to a minimum but will also accommodate them if necessary.[771]
The EPA envisions that the agency, states and affected EGUs will have an ongoing relationship in the course of implementing this program. Since the record also indicates a high degree of interest on the part of states and stakeholders in pursuing banking and trading programs, the timing and level of stringency of the interim CO2
performance rates or state CO2
emission goals we are finalizing should provide states and affected EGUs with ample capacity to accommodate such changes without necessitating changes in state plans in many instances.
The timelines established in the final rule respond to the issues raised in numerous comments regarding the concept of the interim period, including comments supporting the flexibility afforded states in developing their plans and the timing necessary to meet the 2030 emission requirements. Some commenters supported beginning the interim goal plan period at 2020. Others stated that the investments necessary to meet the proposed interim emission performance goals beginning in 2020 are unachievable in that timeframe or would place too great a burden on affected EGUs, states, and ratepayers. Some suggested that the 2020 interim goal step should be eliminated in favor of later start dates, including 2022, 2025, or other years. Some commenters urged the EPA to establish phased interim steps creating a steady downward trajectory that allowed several years for each step, compatible with the “chunkiness” of utility planning processes. Yet other commenters provided input suggesting that states be allowed to establish their own set of emission performance steps during the interim plan performance period and thereby control their own emission reduction trajectory or “glide path” for achievement of the interim goal and the 2030 goal, or that the EPA not establish any interim standards at all. Commenters also noted that for some states, there was not a significant difference between the interim and final goal, and, therefore, no glide path for those states. As discussed in previous sections, based on this input and our final determination of the BSER, the EPA has adjusted the interim period to include 2022-2029, is establishing three interim performance periods creating a reasonable trajectory from 2022 to 2030, and is also retaining the flexibility for states to establish their own emission reduction trajectory during the interim period.
As noted, the EPA has determined that the period for mandated reductions should begin in 2022, instead of 2020 as we proposed, because of the substantial amount of comment and data we received indicating that states and utilities reasonably needed that additional time to take the steps necessary to start achieving reductions. In order to assure the EPA and the public that states are making progress in implementing the plan between the time of the state plan submittal and the beginning of the interim period, and as discussed in further detail in section VIII.D, the final rule requires that the state plan submittal include a timeline with all the programmatic plan milestone steps the state will take between the time of the state plan submittal and 2022 to ensure the plan is effective as of 2022.
2. Provisions To Encourage Early Action
Many commenters supported providing incentives for states and utilities to deploy CO2
-reducing investments, such as RE and demand-side EE measures, as early as possible. In the proposal, the EPA requested comment on an approach that would recognize emission reductions that existing programs provide prior to the initial plan performance period starting from a specified date. We also requested comment on options for that specified date and on conditions that should apply to counting those pre-compliance emission reductions toward a state goal. The EPA received many comments requesting that the agency recognize early actions for the emission reductions they provide prior to the performance period, that the EPA allow those pre-compliance impacts to be counted toward meeting requirements under the rule, and that certain conditions should be applied to recognition of early reductions so as to ensure the emission reductions required in the rule. We also received comments from stakeholders regarding the disproportionate burdens that some communities already bear, and stating that all communities should have equal access to the benefits of clean and affordable energy. The EPA recognizes the validity and importance of these perspectives, and as a result has determined to provide a program—called the Clean Energy Incentive Program (CEIP)—in which states may choose to participate. This section describes this program.
The CEIP is designed to incentivize investment in certain RE and demand-side EE projects that commence construction in the case of RE, or commence operation in the case of EE, following the submission of a final state plan to the EPA, or after September 6, 2018, for states that choose not to submit a final state plan by that date, and that generate MWh (RE) or reduce end-use energy demand (EE) during 2020 and/or 2021. State participation in the program is optional; the EPA is establishing this program as an additional flexibility to facilitate achievement of the CO2
emission reductions required by this final rule, regardless of the type of state plan a state chooses to implement.
Under the CEIP, a state may set aside allowances from the CO2
emission budget it establishes for the interim plan performance period or may generate early action ERCs (ERCs are discussed in more detail in section VIII.K.2), and allocate these allowances or ERCs to eligible projects for the MWh those projects generate or the end-use energy savings they achieve in 2020 and/or 2021. A state implementing a mass-based plan approach, as described in section VIII.C, may issue early action allowances; a state implementing a rate-based plan approach, also described in section VIII.C, may issue early action ERCs. For each early action allowance or ERC a state allocates to such projects, the EPA will provide the state with an appropriate number of matching allowances or ERCs, as outlined below, for the state to allocate to the project. The EPA will match state-issued early action ERCs and allowances up to an amount that represents the equivalent of 300 million short tons of CO2
emissions. The EPA intends that a portion of this pool will be reserved for eligible wind and solar projects, and a portion will be reserved for low-income EE projects. In the proposed federal plan, the EPA is
( printed page 64830)
taking comment on the size of each reserve, and is proposing provisions to provide that any unallocated amounts would be redistributed among participating states.
The EPA has determined that the size of this 300 million short ton CO2
-equivalent matching pool is an appropriate reflection of the CO2
emission reductions that could be achieved by the additional early investment in RE and demand-side EE the agency expects will be incentivized by the CEIP. For example, in 2012, 13 GW of utility scale wind were deployed,[772]
and, in 2014, 3.4 GW of utility-scale solar [773]
plus 2-3 GW of distributed solar were deployed,[774]
according to industry estimates. Assuming 19 GW per year of RE from 2017-2020 based on these historic maximums yields an installed base of 76 GW of RE potentially eligible for CEIP incentives in 2020 and/or 2021. Assuming an average capacity factor of 30 percent, this would translate into approximately 200 TWh/year of generation, which would be eligible for approximately 300 million short tons of matching allowances over the 2-year period, if the RE MWh were converted to allowances based on the 2012 carbon intensity of 0.8 short tons per MWh. This would leave the remaining half of the pool of matching federal allowances available for EE projects implemented in low-income communities, and additional growth in RE deployment beyond these historic maximums as potentially enabled by reductions in cost and improvements in performance.
For a state to be eligible for a matching award of allowances or ERCs from the EPA, it must demonstrate that it will award allowances or ERCs only to eligible projects. These are projects that:
Are located in or benefit a state that has submitted a final state plan that includes requirements establishing its participation in the CEIP;
Are implemented following the submission of a final state plan to the EPA, or after September 6, 2018, for a state that chooses not to submit a complete state plan by that date;
For RE: Generate metered MWh from any type of wind or solar resources;
For EE: Result in quantified and verified electricity savings (MWh) through demand-side EE implemented in low-income communities; and
Generate or save MWh in 2020 and/or 2021.
The following provisions outline how a state may award early action ERCs or allowances to eligible projects, and how the EPA will provide matching ERCs or allowances to states.
For RE projects that generate metered MWh from any type of wind or solar resources: For every two MWh generated, the project will receive one early action ERC (or the equivalent number of allowances) from the state, and the EPA will provide one matching ERC (or the equivalent number of allowances) to the state to award to the project.
For EE projects implemented in low-income communities: For every two MWh in end-use demand savings achieved, the project will receive two early action ERCs (or the equivalent number of allowances) from the state, and the EPA will provide two matching ERCs (or the equivalent number of allowances) to the state to award to the project.
Early action allowances or ERCs awarded by the state, and matching allowances or ERCs awarded by the EPA pursuant to the CEIP, may be used for compliance by an affected EGU with its emission standards and are fully transferrable prior to such use.
The EPA discusses the CEIP in the proposed federal plan rule, and will address design and implementation details of the CEIP, including the appropriate factor for determining equivalence between allowances and MWh and the definition of a low-income community for project eligibility purposes, in a subsequent action. Before doing so, the EPA will engage states and stakeholders to gather additional information concerning implementation topics, and to solicit information about the concerns, interests and priorities of states, stakeholders and the public.
In order for a state that chooses to participate in the CEIP to be eligible for a future award of allowances or ERCs from the EPA, a state must include in its initial submittal a non-binding statement of intent to participate in the program. In the case of a state submitting a final plan by September 6, 2016, the state plan would either include requirements establishing the necessary infrastructure to implement such a program and authorizing its affected EGUs to use early action allowances or ERCs as appropriate, or would include a non-binding statement of intent as part of its supporting documentation and revise its plan to include those requirements at a later date.
Following approval of a final state plan that includes requirements for implementing the CEIP, the agency will create an account of matching allowances or ERCs for the state that reflects the pro rata share—based on the amount of the reductions from 2012 levels the affected EGUs in the state are required to achieve relative to those in the other participating states—of the 300 million short ton CO2
emissions-equivalent matching pool that the state is eligible to receive. Thus, states whose EGUs have greater reduction obligations will be eligible to secure a larger proportion of the federal matching pool upon demonstration of quantified and verified MWh of RE generation or demand side-EE savings from eligible projects realized in 2020 and/or 2021.
Any matching allowances or ERCs that remain undistributed after September 6, 2018,[775]
will be distributed to those states with approved state plans that include requirements for CEIP participation. These ERCs and allowances will be distributed according to the pro rata method outlined above. Unused matching allowances or ERCs that remain in the accounts of states participating in the CEIP on January 1, 2023, will be retired by the EPA.
For purposes of establishing a state plan program eligible for an award of matching allowances or ERCs from the EPA, such a program must include a mechanism for awarding early action emission allowances or ERCs for eligible actions that reduce or avoid CO2
emissions in 2020 and/or 2021, and that is implemented in a way such that the early action allowances or ERCs allocated by the state would maintain the stringency of the state's goal for emission performance from affected EGUs in the performance periods established in this rule. Specifically, the state must demonstrate in its plan that it has a mechanism in place that enables issuance of ERCs or allowances from the state to parties effectuating reductions in 2020 and/or 2021 in a manner that would have no impact on the aggregate emission performance of affected EGUs required to meet rate-based or mass-based CO2
emission standards during
( printed page 64831)
the compliance periods.[776]
This demonstration is not required to account for matching ERCs or allowances that may be issued to the state by the EPA. Participation in this program is entirely voluntary, and nothing in these provisions would have the effect of requiring any particular affected EGU to achieve reductions prior to 2022, or requiring states to offer incentives for emission reductions achieved prior to 2022.[777]
These and other details will be developed in the subsequent action.
The EPA is providing the CEIP as an option for states implementing plans—and is including a similar program for the federal plan proposal being issued concurrently—for several reasons. Chief among them is that offered by commenters to the effect that the overall cost of achievement of the emission performance rates or state goals could be reduced by an approach that granted some form of beneficial recognition to emissions reduction investments that both occur and yield reductions prior to the first date on which the program of the interim plan performance period. Other commenters pointed out that to the extent that states and utilities would benefit from the availability of low-cost RE and other zero-emitting generation options during the interim and final plan performance periods, the EPA should include in the final emission guidelines provisions that accelerate deployment of RE resources, since in so doing the final emission guidelines would speed achievement of expected reductions in the cost of those technologies commensurate with their accelerated deployment. In addition, the incentives and market signal generated by the CEIP can help sustain the momentum toward greater RE investment in the period between now and 2022 so as to offset any dampening effects that might be created by setting the start date 2 years later than at proposal.
The specific criteria the EPA is establishing for eligible RE projects reflect a variety of considerations. First, the EPA seeks to preserve the incentive for project developers to execute on planned investments in all types of solar and wind technologies. Commenters raised concerns that the fast pace of reductions underlying the emission targets in the proposed rule could potentially shift investment from RE to natural gas, thus dampening the incentive to develop wind and solar projects, in particular. Second, the EPA, consistent with the CAA's design that incentivizes technology and accelerates the decline in the costs of technology, seeks to drive the widespread development and deployment of wind and solar, as these broad categories of renewable technology are essential to longer term climate strategies. Finally, in contrast to other CO2
-reducing technologies—including other zero-emitting or RE technologies—solar and wind projects often require lead times of shorter duration, which would allow them to generate MWh beginning in 2020.
The specific criterion the EPA is establishing for eligible EE projects—namely that these projects be implemented in low-income communities—is also consistent with the technology-forcing and development design of CAA section 111. The EPA believes it is appropriate to offer an additional incentive to remove current barriers to implementing demand-side EE programs in low-income communities. While the EPA acknowledges that a number of states have demand-side EE programs focused on these communities,[778]
the agency also recognizes that there have been historic economic, logistical, and information barriers to implementing programs in these communities. As a result, the costs of implementing demand-side EE programs in these communities are typically higher than in other communities and stand as barrier to harvesting potentially cost effective reductions and advancing these technologies. The EPA intends for the CEIP to help incentivize increased deployment of projects that will deliver demand-side EE benefits to these communities, which will in turn lower the costs of these approaches. These lower costs will help new technologies and delivery mechanisms penetrate in the future, thus improving the cost of implementation of the emission guidelines overall, consistent with Congress' design in the New Source Performance Standard provisions of the CAA. Further, reducing barriers to demand-side EE in low-income communities will help ensure that the benefits of the final rule are shared broadly across society and that potential adverse impacts on low-income ratepayers are avoided. It complements other steps the federal government is taking to bring clean energy technologies to these communities, as we discuss in section IX of this preamble.
More broadly, the CEIP responds to the urgency of meeting the challenge of climate change in two key ways. First, of course, it fosters reductions before 2022. Second, in targeting investments in wind, solar and low-income EE, it focuses on the kinds of measures and technologies that are the essential foundation of longer-term climate strategies, strategies that inevitably depend on the further development and widespread deployment of highly adaptable zero-emitting technologies.
We are not requiring that projects demonstrate to states that they are “additional” or surplus relative to a business-as-usual or state goal-related baseline in order to be eligible. At the same time, we believe that including an incentive to develop projects that benefit low-income communities will increase the likelihood of investments being made that would not have been made otherwise.
In order to be awarded matching ERCs or allowances by the EPA for projects that meet the eligibility criteria, a final state plan must have requirements establishing the appropriate infrastructure to issue early action ERCs or allowances to eligible project providers by 2020. The state must require that the state or its agent will, in accordance with state plan requirements approved as meeting the ERC issuance and EM&V requirements included in section VIII.K: (1) Evaluate project proposals from eligible RE and demand-side EE project providers, including the EM&V plans that must accompany such proposals; (2) evaluate monitoring and verification reports submitted by eligible providers following project implementation, which contain the quantified and verified MWh of RE generation or energy savings achieved
( printed page 64832)
by the project in 2020 and/or 2021; (3) issue ERCs or allowances to eligible providers for these MWh results; (4) ensure that no MWh of renewable generation or energy savings receives early action or matching ERCs or allowances more than once.[779]
The CEIP will provide a number of benefits. First, the program will provide incentives designed to reduce energy bills early in the implementation of the guidelines through earlier and broader application of energy saving technologies, and help ensure that these benefits are fully shared by low-income communities. Second, the EPA believes that stimulating or supporting early investment in RE generation technologies could accelerate the rate at which the costs of these technologies fall over the course of the interim performance period. Third, the CEIP will provide affected EGUs and states with additional emission reduction resources to help them achieve their state plan obligations. Finally, the program will improve the liquidity, in the early years of the program, of the ERC and allowance markets we expect to emerge for compliance with the requirements of these guidelines.[780]
The EPA is establishing this program as an option for states that wish to drive investments in RE and low-income EE that will result in actual, early reductions in CO2
emissions from affected EGUs. States are also authorized to set their own glide path, or interim step performance rates or goals, so long as the interim and final performance rates or goals are met, and could do so in a way that takes into account the availability of the CEIP to assist affected EGUs in meeting the applicable glide path and performance rates or goals. While the EPA is not requiring states to take advantage of this program, its availability simply enhances these already-existing implementation and compliance flexibilities while at the same time delivering meaningful benefits, particularly for low-income communities. The EPA looks forward to an upcoming public dialogue about the implementation details of the CEIP.
C. State Plan Approaches
1. Overview
Under the final emission guidelines, states may adopt and submit either of two different types of state plans. The first would apply all requirements for meeting the emission guidelines to affected EGUs in the form of federally enforceable emission standards.[781]
We refer to this as an “emission standards” state plan type. The second, which we refer to as a “state measures” plan type, would allow the state mass CO2
emission goals to be achieved by affected EGUs in part, or entirely, through state measures [782]
that apply to affected EGUs, other entities, or some combination thereof. The state measures plan type also includes a mandatory contingent backstop of federally enforceable emission standards for affected EGUs that would apply in the event the plan does not achieve its anticipated level of emission performance as specified in the state plan during the period that the state is relying on state measures. The inclusion of a backstop of federally enforceable emission standards in a state measures plan type is legally necessary for a state plan to meet the terms of 111(d), which specifically require a state to submit standards of performance.
These two types of state plans and their respective approaches, either of which could be implemented on a single-state or multi-state basis, allow states to meet the statutory requirements of CAA section 111(d) while accommodating the wide range of regulatory requirements and other programs that states have deployed or will deploy in the electricity sector that reduce CO2
emissions from affected EGUs. Further, as described in detail below, both types of plans are responsive to comments we received from states and other stakeholders. In addition to providing states the option of developing an emission standards or state measures type plan, the final rule makes clear that states that choose an emission standards plan can adopt a plan that meets either the CO2
emission performance rates, a rate-based CO2
emission goal, or a mass-based CO2
emission goal.
Under these two basic plan types, the final emission guidelines provide states with a number of potential plan pathways for meeting the emission guidelines. A plan pathway represents a specific plan design approach used to meet the emission guidelines. These plan pathways are discussed in section VIII.C.2 through C.5 below, and further elaborated in sections VIII.J (for mass-based emission standards) and VIII.K (for rate-based emission standards).
The final emission guidelines provide four streamlined plan pathways. These streamlined plan pathways represent straightforward plan approaches for meeting the emission guidelines, and avoid the need to meet additional plan requirements and include additional elements in a plan submittal. The streamlined plan pathways include the following:
Establishing federally enforceable, mass-based CO2
emission standards for affected EGUs, complemented by state-enforceable mass-based CO2
emission standards for new fossil fuel-fired EGUs.[783]
This approach could involve an emission budget trading program that includes affected EGUs as well
( printed page 64833)
as new fossil fuel-fired EGUs. This approach facilitates interstate emission trading, through either a single-state “ready-for-interstate-trading” plan approach or through a multi-state plan. Under a “ready-for-interstate-trading” plan, interstate emission trading may occur without the need for a multi-state plan.[784]
Establishing federally enforceable, mass-based CO2
emission standards for affected EGUs.[785]
This approach facilitates interstate emission trading, through either a single-state “ready-for-interstate-trading” plan approach or through a multi-state plan. In a separate concurrent action, the EPA is proposing a model rule for states that could be used in a plan implementing this approach.[786]
Establishing federally enforceable, subcategory-specific rate-based CO2
emission standards for affected EGUs, consistent with the CO2
emission performance rates in the emission guidelines. This approach provides for interstate emission trading, through either a single-state “ready-for-interstate-trading” plan approach or through a multi-state plan.[787]
In a separate concurrent action, the EPA is proposing a model rule for states that could be used in a plan implementing this approach.
Establishing federally enforceable rate-based CO2
emission standards at a single level that applies for all affected EGUs, consistent with the state rate-based CO2
goal for affected EGUs in the emission guidelines.[788]
This approach provides for interstate emission trading, through a multi-state plan that meets a single weighted average multi-state rate-based CO2
goal.[789]
The final emission guidelines also provide for a range of additional custom plan approaches that a state may pursue, if it chooses, to address specific circumstances or policy objectives in a state. The custom plan pathways, while viable options for meeting the emission guidelines, come with additional plan requirements and plan submittal elements. These additional plan requirements and plan submittal elements are necessary to ensure that the emission guidelines are met and that the necessary level of CO2
emission performance is achieved by affected EGUs.
Based on this overall approach, the final emission guidelines provide for a range of state options—both easily implementable approaches that can be used to meet the emission guidelines, and more customizable approaches that can be used, if a state chooses, to address special circumstances or state policy objectives.
2. “Emission Standards” State Plan Type
The emission standards type of state plan imposes requirements solely on affected EGUs in the form of federally enforceable emission standards. This type of state plan, as described below, may consist of rate-based emission standards for affected EGUs or mass-based emission standards for affected EGUs.
The state plan submittal for an emission standards type plan must demonstrate that these federally enforceable emission standards for affected EGUs will achieve the CO2
emission performance rates or the applicable state rate-based or mass-based CO2
emission goal for affected EGUs.
Both rate-based and mass-based emission standards included in a state plan must be quantifiable, verifiable, enforceable, non-duplicative and permanent. These requirements are described in more detail at section VIII.D.2.
Rate-based and mass-based emission standards may incorporate the use of emission trading, as described below. The EPA anticipates the use of emission trading in state plans, given the advantages of this approach and comments suggesting a high degree of interest on the part of states, utilities, and independent power producers in the inclusion of emission trading in state plans.[790]
The EPA notes it is proposing model rules for both mass-based and rate-based emission trading programs. States could adopt and submit the finalized model rules for either emission trading program to meet the requirements of CAA section 111(d) and these emission guidelines. The EPA will evaluate the approvability of such submission, as with any state plan submission, through independent notice-and-comment rulemaking. The EPA notes that state plan submittals that adopt the finalized model rule may be administratively and technically more straightforward for the EPA in evaluating approvability, as the EPA will have determined that the model rule meets the applicable requirements of the emission guidelines through the process of finalization of such rule.
a.
Rate-based approach.
The first type of “emission standards” plan approach a state may choose is one that uses rate-based emission standards. Under this plan approach, the plan would include federally enforceable emission standards for affected EGUs, in the form of lb CO2
/MWh emission standards.
A rate-based “emission standards” plan may be designed to either meet the CO2
emission performance rates for affected EGUs or achieve the state's rate-based CO2
emission goal for affected EGUs. A plan could be designed such that compliance by affected EGUs would assure achievement of either the CO2
emission performance rates for affected EGUs or the state rate-based CO2
emission goal. To meet the CO2
emission performance rates for affected EGUs, a plan would establish separate rate-based emission standards for affected fossil fuel-fired electric utility steam generating units and stationary combustion turbines (in lb CO2
/MWh) that are equal to or lower than the CO2
emission performance rates in the emission guidelines. To meet a state rate-based CO2
goal, a plan would establish a uniform rate-based emission standard (in lb CO2
/MWh) that applies to all affected EGUs in the state. This uniform emission rate would be equal to or lower than the applicable state rate-based CO2
goal specified in the final emission guidelines.
Under these two approaches, compliance by affected EGUs with the rate-based emission standards in a plan would ensure that affected EGUs meet the CO2
emission performance rates in the emission guidelines or the state rate-based CO2
goal for affected EGUs. No further demonstration would be necessary by the state to demonstrate that its plan would achieve the CO2
emission performance rates or the state's rate-based CO2
goal.
Alternatively, if a state chooses, it could apply rate-based emission standards to individual affected EGUs, or to categories of affected EGUs, at a lb CO2
/MWh rate that differs from the CO2
emission performance rates or the state's rate-based CO2
goal. In this case, compliance by affected EGUs with their emission standards would not necessarily ensure that the collective, weighted average CO2
emission rate for these affected EGUs meets the CO2
emission performance rates or the state's rate-based CO2
goal.[791]
( printed page 64834)
Under this type of approach, therefore, the state would be required to include a demonstration,[792]
in the state plan submittal, that its plan would achieve the CO2
emission performance rates or applicable state rate-based CO2
goal. This demonstration would include a projection of the collective, weighted average CO2
emission rate the fleet of affected EGUs would achieve as a result of compliance with the emission standards in the plan. Once the plan is implemented, if the CO2
emission performance rates or applicable state rate-based CO2
goal are not achieved, corrective measures would need to be implemented, as described in section VIII.F.3.
Under a rate-based approach, a state may include in its plan a number of provisions to facilitate affected EGU compliance with the emission standards. First, a state may encourage (or require) EGUs to undertake actions to reduce CO2
emissions at the affected EGU level, such as heat rate improvements or fuel switching. These measures are discussed in section VIII.I. Second, a state may implement a market-based emission trading program, which enables EGUs to generate and procure ERCs, a tradable compliance unit representing one MWh of electric generation (or reduced electricity use) with zero associated CO2
emissions. Considerations and requirements for rate-based trading programs are discussed in section VIII.K.
ERCs would be issued by the administering state regulatory body. The state may issue ERCs to affected EGUs that emit below a specified CO2
emission rate, as well as for measures that provide substitute generation for affected EGUs or avoid the need for generation from affected EGUs. These ERCs may then be used to adjust the reported CO2
emission rate of an affected EGU when demonstrating compliance with a rate-based emission standard. For each submitted ERC, one MWh is added to the denominator of the reported CO2
emission rate, resulting in a lower adjusted CO2
emission rate.
Eligible measures that may generate ERCs, as well as the accounting method for adjusting a CO2
emission rate, are discussed in section VIII.K.1. Requirements for rate-based emission trading approaches are discussed in section VIII.K.2. Quantification and verification requirements for measures eligible to generate ERCs are discussed in section VIII.K.3.
(1)
Rate-based emission standards based on operational or other standards.
As discussed in further detail in section VIII.D.2.d.3, regarding the legal considerations and statutory language of CAA section 111(h), the EPA is finalizing that design, equipment, work practice, and operational standards cannot be considered to be “standards of performance” for this final rule. However, a state may elect to use emission standards for affected EGUs that result in a reduced CO2
lb/MWh emission rate for affected EGUs because of operational or other standards. The state would include in its state plan an emission standard that is the rate standard that results from the applicable operational or other standard. For example, a state might choose to recognize that an individual affected EGU has plans to retire, and those plans could be codified in the state plan by adopting an emission standard of 0 CO2
lb/MWh as of a certain date. The state would thus include in the state plan an emission standard of 0 CO2
lb/MWh for that affected EGU that applies after a specified date.
An approvable plan could apply such emission standards to a subset of affected EGUs or all affected EGUs. As with any rate-based plan, the state would need to demonstrate that the plan would achieve the required level of emission performance for affected EGUs, in CO2
lb/MWh. A plan could also apply such emission standards to a subset of affected EGUs in the state while applying other rate-based emission standards to the remainder of affected EGUs in the state. For example, a plan might include an emission standard of 0 CO2
lb/MWh reflecting a retirement mandate for one or more affected EGUs in a state and apply a rate-based emission standard equal to the CO2
emission performance rates or a state's rate-based CO2
emission goal to the remainder of affected EGUs.
As with all emission standards, emission standards based on design, equipment, work practice, and operational standards must be quantifiable, verifiable, enforceable, non-duplicative and permanent. These requirements are described in more detail at section VIII.D.2.
(2)
Additional considerations for rate-based approach.
Additional considerations and requirements for rate-based emission standards state plans are addressed in section VIII.K. This includes the basic accounting method for adjusting the reported CO2
emission rate of an affected EGU, as well as requirements for the use of measures to adjust a CO2
emission rate, both of which are discussed in sections VIII.K.1 through 3. Such requirements include eligibility, accounting, and quantification and verification requirements (EM&V) for the use of CO2
emission reduction measures that provide substitute generation for affected EGUs or avoid the need for generation from affected EGUs in rate-based state plans. Section VIII.K.4 addresses multi-state coordination among rate-based emission trading programs.
b.
Mass-based approach.
The second “emission standards” approach a state may elect to use is mass-based emission standards applied to affected EGUs. Under this approach, the plan would include federally enforceable emission standards for mass CO2
emissions from affected EGUs. The plan would be designed to achieve the mass-based CO2
goal for a state's affected EGUs (see section VII) or a level of CO2
emissions equal to or less than the mass-based CO2
goal plus the new source complement CO2
emissions (see section VIII.J.2.b, Table 14).[793]
Under a mass-based approach, a state could require that individual affected EGUs meet a specified mass emission standard. Alternatively, a state could choose to implement a market-based emission budget trading program. The EPA envisions that the latter option is most likely to be exercised by states seeking to implement a mass-based emission standard approach, as it would maximize compliance flexibility for affected EGUs and enable the state to meet its mass goal in the most economically efficient manner possible.
(1)
Mass-based emission standard applied to individual affected EGUs.
One pathway a state could take to achieve its mass-based CO2
goal would be to apply mass-based emission standards to individual affected EGUs, in the form of a limit on total allowable
( printed page 64835)
CO2
emissions. These emission standards would be designed such that total allowable CO2
emissions from all affected EGUs in a state are equal to or less than the state's mass-based CO2
goal, or a state's mass-based CO2
goal plus the new source complement CO2
emissions specified in section VIII.J.2.b, Table 14. The individual affected EGUs would be required to emit at or below their mass-based standard to demonstrate compliance. Under this approach, individual affected EGUs would be required to undertake source-specific measures to assure their CO2
emissions do not exceed their assigned emission standard. Affected EGU compliance with the emission standards prescribed under this type of mass-based approach would ensure that the affected EGUs in a state achieve the state's mass-based CO2
goal, or mass-based CO2
goal plus new source complement.
(2)
Mass-based emission standard with a market-based emission budget trading program.
A second pathway a state could take to achieve its mass-based CO2
goal would be to implement a market-based emission budget trading program. This type of program provides maximum compliance flexibility to affected EGUs, and as a result, may be attractive to states that choose to implement a mass-based approach in their state plan.
An emission budget trading program establishes a combined emission standard for a group of emission sources in the form of an emission budget. Emission allowances are issued in an amount up to the established emission budget.[794]
Allowances may be distributed to affected emission sources (as well as to other parties) through a number of different methods, including direct allocation to affected sources or auction. These allowances can be traded among affected sources and other parties. The emission standard applied to individual emission sources is a requirement to surrender emission allowances equal to reported emissions, with each allowance representing one ton of CO2.
The EPA views an emission budget trading program as a highly efficient, market-based approach for reducing CO2
emissions from affected EGUs. Such programs include a limit on mass CO2
emissions while providing both short-term and long-term price signals that encourage the owners or operators of affected EGUs, as well as other entities, to determine the most efficient means of achieving the mass emission standard. Notably, such an approach incentivizes actions taken at affected EGUs to reduce CO2
emissions, as well as the use of strategies such as RE and demand-side EE as complementary measures that reduce CO2
emissions. However, unlike under a rate-based approach, for this latter set of measures there is no need to address and describe these state measures in a state plan submission or quantify and verify the RE and EE MWh of generation and savings. As a result, a mass-based emission budget trading program incentivizes and recognizes a wide range of emission reduction actions while being relatively simple for a state to implement and administer. Furthermore, the EPA notes that such an approach still allows for a state to address electricity load growth, as load growth can be met through low- and zero-emitting generating resources, as well as avoided through demand-side EE and demand-side management (DSM) measures.
Additional considerations and requirements for mass-based emission standards state plans are addressed in section VIII.J. This includes use of emission budget trading programs in a state plan, including provisions required for such programs (section VIII.J.2.a) and the design of such programs in the context of a state plan. Section VIII.J addresses program design approaches that ensure achievement of a state mass-based CO2
emission goal (section VIII.J.2.c), as well as how states can use emission budget trading programs with broader source coverage and other flexibility features in a state plan, such as the programs currently implemented by California and the RGGI participating states (section VIII.J.2.d). Section VIII.J.2.e addresses other considerations for the design of emission budget trading programs that states may want to consider, such as allowance allocation approaches. Section VIII.J.3 addresses multi-state coordination among emission budget trading programs used in states that retain their individual state mass-based CO2
goals.
(3)
Mass-based emission standards based on operational or other standards.
As discussed in section VIII.C.2.a.(1) above, a state may elect to use mass-based emission standards for affected EGUs that result in a reduced total tonnage of CO2
emissions from affected EGUs because of operational or other standards. The state would include in its state plan an emission standard that is the mass standard that results from the applicable operational or other standard. For example, a state might choose to recognize that an individual affected EGU has plans to retire, and those plans could be codified in the state plan by adopting an emission standard of 0 total tons of CO2, as of a certain date. The state would thus include in the state plan an emission standard of 0 total tons of CO2
for that affected EGU that applies after a specified date. Under a mass-based approach, the state could also include an emission standard (
e.g.,
a mass limit) that reflects the result of a limit on an affected EGU's total operating hours over a specified period. Such an emission standard would be based on an affected EGU's potential to emit given a specified number of operating hours.
An approvable plan could apply such emission standards to a subset of affected EGUs or all affected EGUs. As with any mass-based plan, the state would need to demonstrate that the plan would achieve the required level of emission performance for affected EGUs, in total tons of CO2
. A plan could also apply such emission standards to a subset of affected EGUs in the state while applying other emission standards to the remainder of affected EGUs in the state. For example, a plan might include an emission standard of 0 tons of CO2
for one or more affected EGUs, reflecting a retirement mandate for one or more affected EGUs in a state, and include the remainder of affected EGUs in an emission budget trading program.
3. “State Measures” State Plan Type
The second type of state plan is what we refer to as a “state measures” plan. As previously discussed, the EPA believes states will be able to submit state plans under the emission standards plan type, and its respective approaches, and achieve the CO2
emission performance rates or state rate-based or mass-based CO2
goals by imposing federally enforceable requirements on affected EGUs. Upon further consideration of the requirements of CAA section 111(d), in consideration of the comments we received on the proposed portfolio approach and the state commitments approach, and in order to provide flexibility and choice to states that may wish to adopt a plan that does not place all the obligations on affected EGUs, the EPA is finalizing the state measures plan type in addition to the emission standards plan type. The EPA believes the state measures plan type will provide states with additional latitude in accommodating existing or planned programs that involve measures implemented by the state, or by entities other than affected EGUs, that result in avoided generation and CO2
emission
( printed page 64836)
reductions at affected EGUs. This includes market-based emission budget trading programs that apply, in part, to affected EGUs, such as the programs implemented by California and the RGGI participating states in the Northeast and Mid-Atlantic, as well as RE and demand-side EE requirements and programs, such as renewable portfolio standards (RPS), EERS, and utility- and state-administered incentive programs for the deployment of RE and demand-side EE technologies and practices. The EPA believes this second state plan type will afford states with appropriate flexibility while meeting the statutory requirements of CAA section 111(d).
Measures implemented under the state measures plan type could include RE and demand-side EE requirements and deployment programs. This type of plan could align with existing state resource planning in the electricity sector, including RE and demand-side EE investments by state-regulated electric utilities. The state measures plan type also can accommodate emission budget trading programs that address a broader set of emission sources than just affected EGUs subject to CAA section 111(d), such as the programs currently implemented by California and the RGGI participating states. The EPA also notes that the state measures plan type could accommodate imposition by a state of a fee for CO2
emissions from affected EGUs, an approach suggested by a number of commenters.
This plan type would allow the state to implement a suite of state measures that are adopted, implemented, and enforceable only under state law, and rely upon such measures in achieving the required level of CO2
emission performance from affected EGUs. The state measures under this plan type could be measures involving entities other than affected EGUs, or a combination of such measures with emission standards for affected EGUs, so long as the state demonstrates that such measures will result in achievement of a state's mass-based CO2
goal (or mass-based CO2
goal plus new source complement), as discussed below. The EPA notes that under this plan type, a state could also choose to include any emission standards for affected EGUs, which are required to be included in the plan as federally enforceable measures, to be implemented alongside or in conjunction with state measures the state would implement and enforce.
For a state measures plan to be approvable, it must include a demonstration of how the measures, whether state measures alone or state measures in conjunction with any federally enforceable emission standards for affected EGUs, will achieve the state mass-based CO2
emission goal for affected EGUs (or mass-based CO2
goal plus new source complement). However, because the state measures would not be federally enforceable emission standards, the plan must also include a backstop of federally enforceable emission standards for all affected EGUs, in order for the state measures plan type to satisfy the requirement of CAA section 111(d) that a state establish standards of performance for affected EGUs. This backstop would impose federally enforceable emission standards on the state's affected EGUs in the case that the state measures fail to achieve the state mass-based CO2
goal. The backstop, discussed further below, would assure that the state CO2
emission goal or CO2
emission performance rates are fully achieved by affected EGUs in the form of federally enforceable emission standards.
a.
Requirements for state measures under a state measures type plan.
Under the state measures plan type, state measures must be satisfactorily described in the supporting material for a state plan submittal. The supporting material would need to demonstrate that the state measures meet the same integrity elements that would apply to federally enforceable emission standards. Specifically, the state plan submittal must demonstrate that the state measures are quantifiable, verifiable, enforceable, non-duplicative and permanent. These requirements are described in more detail at section VIII.D.2. Under the state measures plan, if a state chooses to impose emission standards on affected EGUs, such emission standards must be included in the federally enforceable plan as they would be under an emission standards plan.
The EPA would assess the overall approvability of a state measures plan based, in part, on the state's satisfactory demonstration that the state measures, in conjunction with any federally enforceable emission standards on the affected EGUs that might be included in the plan, would result in the state plan's achievement of the mass-based CO2
goal for the state's affected EGUs (or mass-based CO2
goal plus new source complement). This includes a demonstration of adequate legal authority and funding to implement the state plan and any associated measures. The EPA's determination that such a plan is satisfactory would be based in part on whether the state measures are adequately described in the supporting documentation and the plan submittal demonstrates that the state measures are quantifiable, verifiable, enforceable, non-duplicative and permanent as described above. This is necessary for the EPA to ensure that the results achieved through the plan are quantifiable and verifiable, and to assess whether the state measures are anticipated to achieve the state mass-based CO2
goal for affected EGUs (or mass-based CO2
goal plus new source complement).
The EPA's evaluation of the approvability of a state measures plan would also include an assessment of whether the backstop consisting of federally enforceable emission standards for the state's affected EGUs would ensure that the required emission performance level is fully achieved by affected EGUs, in the case that the state measures fail to achieve the state mass-based CO2
goal (or mass-based CO2
goal plus new source complement), or the state does not meet programmatic state measures milestones during the interim period. The trigger for the backstop must also satisfactorily provide for the implementation of the backstop emission standards.
b.
Considerations for the backstop included in a state measures type plan.
As further discussed in section VIII.C.6.c, the EPA believes a backstop, composed of federally enforceable emission standards for the affected EGUs that are sufficient to achieve the state CO2
emission goal or the CO2
emission performance rates in the event that state measures do not result in the required CO2
emission performance, is necessary for the state measures plan type to meet the requirements of CAA section 111(d). The state plan must specify the backstop that would apply federally enforceable emission standards to the affected EGUs if the state measures plan does not achieve the anticipated level of CO2
emission performance by affected EGUs, or a state does not meet programmatic state measures milestones during the interim period. The state plan must include promulgated regulations (or other requirements) that fully specify these emission standard requirements, which must be quantifiable, verifiable, enforceable, non-duplicative and permanent. These requirements are described in more detail at section VIII.D.2.
These federally enforceable emission standards must be designed such that compliance by affected EGUs with the emission standards would achieve the CO2
emission performance rates or state's rate- or mass-based interim and final goals for affected EGUs. The
( printed page 64837)
backstop emission standards must specify CO2
emission performance levels that would apply for the interim plan performance period (including specifying levels for each of the interim step 1 through step 3 periods) and the final two-year plan performance periods.[795]
If a state chose, these backstop emission standards could be based on a model rule or federal plan promulgated by the EPA.
The state measures plan must specify the trigger and conditions under which the backstop federally enforceable emission standards would apply that is consistent with the requirements in the emission guidelines. The trigger and attendant conditions for deployment of the backstop would address the CAA section 111(d) requirement that states submit a program that provides for the implementation of standards of performance. The state measures plan must specify the level of emission performance that will be achieved by affected EGUs as a result of implementation of the state measures plan during the interim and final plan performance periods. This includes the level of emission performance during the interim plan periods 2022-2024, 2025-2027 and 2028-2029, as well as the performance level that would be achieved during every subsequent 2-year final plan performance period (2030-2031, and subsequent 2-year periods). If actual CO2
emission performance by affected EGUs fails to meet the level of emission performance specified in the plan over the 8-year interim performance period (2022-2029) or for any 2-year final goal performance period, the state measures plan must require that the backstop federally enforceable emission standards would take effect and be applied to affected EGUs. Similarly, the plan must require that the backstop standards take effect if actual emission performance is deficient by 10 percent or more relative to the performance levels that the state has chosen to specify in the plan for the interim step 1 period (2022-2024) or the interim step 2 period (2025-2027). The backstop standards are also triggered if, at the time of the state's annual reports to the EPA during the interim period, the state has not met the programmatic state measures milestones for the reporting period. The state measures plan must provide that, in the event the backstop is triggered, such emission standards would be effective within 18 months of the deadline for the state's submission of its periodic report to the EPA on state plan implementation and performance, as described in section VIII.D.2.c.[796 797]
The backstop emission standards must make up for the shortfall in CO2
emission performance. The shortfall must be made up as expeditiously as practicable. The state may address the requirement to make up for the shortfall in CO2
emission performance by submitting, as part of the final plan, backstop emission standards that assure affected EGUs would achieve the state's interim and final CO2
emission goals or the CO2
emission performance rates for affected EGUs, and then later submit appropriate revisions to the backstop emission standards adjusting for the shortfall through the state plan revision process. The state may alternately effectuate this by submitting, along with the backstop emission standards, provisions to adjust the emission standards to account for any prior emission performance shortfall, such that no modification of the emission standards is necessary in order to address the emission performance shortfall.
For example, assume a state measures plan identified a mass-based CO2
standard for affected EGUs of 100 million tons during the interim step 1 performance period (2022-2024), 90 million tons during the interim step 2 performance period (2025-2027), and 80 million tons during the interim step 3 performance period (2028-2029). Over the entire interim plan performance period (2022-2029), the interim mass-based CO2
goal is cumulative emissions of 270 million tons. Assume that CO2
emissions from affected EGUs in the interim step 1 period were actually 115 million tons, triggering implementation of the backstop. In this instance, the mass-based standard for affected EGUs implemented as part of the backstop during subsequent plan performance periods would need to ensure that cumulative CO2
emissions during the 2022-2029 interim period do not exceed 270 million tons. This could be achieved, for example, by implementing a mass standard of 75 million tons during the interim step 2 performance period (rather than the 90 million tons originally specified in the plan), or some other combination during the remaining interim step 2 and 3 performance periods.[798]
The emission standards included as the backstop in the plan must specify calculations for how such adjustments will be made.
4. Summary of Comments on State Plan Approaches
The EPA received a wide range of comments on the basic plan approaches in the proposal. Numerous commenters supported providing states with the option of implementing a rate-based or mass-based approach. Some commenters expressed concern that a rate-based approach would not reduce overall emissions, and could actually lead to increased emissions. The EPA does not agree with this latter comment, because both approaches would result in adequate and appropriate constraints on CO2
emissions. As documented in the RIA, a rate-based approach would result in a substantial reduction in CO2
emissions relative to emissions under a business-as-usual case.
Numerous commenters supported allowing states to implement a rate-based emission standard approach applied to affected EGUs. There was also broad support in comments for allowing states to pursue a mass-based approach in the form of mass emission standards on affected EGUs. The EPA is finalizing both of these approaches.
The EPA received a mix of comments for and against the proposed portfolio approach, in which state requirements and other measures that apply to non-EGU entities would be part of a state's federally enforceable state plan. Multiple commenters supported the portfolio approach because it would align with existing state and utility planning processes in the electric power sector, and would maximize state discretion and flexibility in developing plans. Commenters mentioned the range of state requirements and utility programs overseen by states that could be used under a portfolio approach and result in achieving the CO2
emission goal for affected EGUs, including state RPS, EERS and utility-administered EE programs. Commenters noted that the portfolio approach would provide states maximum flexibility to take local circumstances, economics and state
( printed page 64838)
policy into account when developing their plans.
By contrast, multiple commenters opposed the portfolio approach. Some commenters questioned how a portfolio approach would work, and whether the EPA had provided sufficient detail explaining how such a plan approach could be implemented by a state. In particular, multiple commenters questioned how different state programs, such as utility-administered EE programs, could be made federally enforceable in practice under CAA section 111(d).[799]
Multiple commenters expressed concern about making state requirements and utility programs for RE and demand-side EE enforceable under the CAA. Some of these commenters supported the state commitments plan approach that the EPA took comment on in the proposal, which was a variant of the portfolio approach. Under the state commitment variant, measures that applied to entities other than affected EGUs would not be federally enforceable under the CAA, but state commitments to implement those measures would be federally enforceable elements of a state plan under the CAA.
After considering these comments, the EPA is not finalizing the portfolio approach or the state commitment variant. However, the EPA is finalizing the state measures plan type, as described above, which would accommodate state choices and allow states to rely upon a variety of measures, as was envisioned under the portfolio approach, in a way that meets the statutory requirements of CAA section 111(d).
5. Multi-State Plans and Multi-State Coordination
The EPA views the ability of a state to implement an individual plan or a multi-state plan as a significant flexibility that allows a state to tailor implementation of its plan to state policy objectives and circumstances. The EPA sees particular value in multi-state plans and multi-state coordination, which allow states to implement a plan in a coordinated fashion with other states. Such approaches can lead to more efficient implementation, lower compliance costs for affected EGUs and lower impacts on electricity ratepayers. Coordinated approaches also will help states identify and address any potential electric reliability impacts when developing plans.
The EPA received broad support in comments for allowing states to implement multi-state plan approaches, and has made multiple changes in the final rule to address many suggestions outlining different approaches states may want to take. These changes are intended to provide streamlined approaches for multi-state coordination while maintaining transparency and assuring that the CO2
emission performance rates or state CO2
emission goals are achieved.
The EPA is finalizing two approaches that allow states to coordinate implementation in order to meet the emission guidelines.[800]
First, states may meet the requirements of the emission guidelines and CAA section 111(d) by submitting multi-state plans that address the affected EGUs in a group of states. The EPA is finalizing the proposed approach by which multiple states aggregate their rate or mass CO2
goals and submit a multi-state plan that will achieve a joint CO2
emission goal for the fleet of affected EGUs located within those states (or a joint mass-based CO2
goal plus a joint new source CO2
emission complement).[801]
Second, the EPA is also finalizing another approach, in response to comments received on the proposed rule. This approach enables states to retain their individual state goals for affected EGUs and submit individual plans, but to coordinate plan implementation with other states through the interstate transfer of ERCs or emission allowances.[802]
This approach facilitates interstate emission trading without requiring states to submit joint plans.[803]
The EPA considers these to be individual state plans, not multi-state plans.
States have the option to implement this second approach in different ways, as discussed in section VIII.C.5.c. These different implementation options allow states to tailor their implementation of linked emission trading programs, based on state policy preferences, as well as economic and other considerations. These different options provide varying levels of state control over emission trading system partners and require varying levels of coordination in the course of state plan development.
In response to comments, the EPA is also further clarifying how multi-state plans with a joint goal for affected EGUs may be implemented. The EPA is clarifying that states may participate in more than one multi-state plan, if necessary, for example, to address affected EGUs in states that are served by more than one ISO or RTO. The EPA is further clarifying that a subset of affected EGUs in a state may participate in a multi-state plan. These clarifications are discussed in section VIII.C.5.d.
a.
Summary of comments on multi-state plans.
Multiple commenters supported the EPA's proposed approach that would allow states to implement a multi-state plan to meet a joint CO2
emission goal. However, a number of states commented that states should also be allowed to coordinate without aggregating multiple individual state goals into a single joint goal. Many states questioned the incentives that a state would have to aggregate its goal with other states that have different goals, and also noted the administrative complexities presented by states seeking to formally coordinate state plans with one another.
The EPA notes that there are multiple incentives for states to collaborate by implementing a multi-state plan to meet an aggregated joint goal, regardless of the specific level of their individual goals, because states share grid regions and impacts from plan implementation will be regional in nature. Further, multiple analyses, including those by ISOs and RTOs, indicate that regional approaches could achieve state goals at lesser cost than individual state plan approaches. However, the EPA also recognizes the value in allowing for collaboration where states retain individual goals. These approaches could provide some of the benefits of a joint goal while reducing the negotiations among states necessary to develop a multi-state plan with a joint goal. As a result, the EPA has finalized the additional approaches described in section VIII.C.5 to provide for coordination while maintaining individual goals. These approaches would allow for interstate transfer of ERCs or emission allowances while retaining individual state goals.
( printed page 64839)
Many commenters suggested that states should be encouraged to join or form regional market-based programs. Many commenters touted the economic efficiency benefits of such approaches, and noted that such programs have features that support electric reliability.
The EPA agrees with these comments, and notes that it encouraged such approaches in the proposal. While the EPA is not requiring states to join and/or form regional market-based programs, we note that such programs can be helpful for many reasons, including features that support reliability. Market-based programs allow greater flexibility for affected EGUs both in the short-term and long-term. Under a market-based program, affected EGUs have the ability to obtain sufficient allowances or credits to cover their emissions in order to comply with their emission standards. Additionally, we continue to encourage states to cooperate regionally. Regional cooperation in planning and reliability assessments is an important tool to meeting system needs in the most cost-effective, efficient, and reliable way.
b.
Multi-state coordination through a joint emission goal.
Multiple states may submit a multi-state plan that achieves an aggregated joint CO2
emission goal for the affected EGUs in the participating states (or a joint mass-based CO2
goal plus a joint new source CO2
emission complement).[804]
The joint emission goal approach is acceptable for both types of state plans, the “emission standards” plan type and the “state measures” plan type. However, the EPA is requiring that a joint goal may apply only to states implementing the same type of plan, either an “emission standards” plan or a “state measures” plan.[805]
Under this approach, a rate-based multi-state plan would include a weighted average rate-based emission goal, derived by calculating a weighted average CO2
emission rate based on the individual rate-based goals for each of the participating states and 2012 generation from affected EGUs. A mass-based multi-state plan would include an aggregated mass-based CO2
emission goal for the participating states, in cumulative tons of CO2, derived by summing the individual mass-based CO2
emission goals of the participating states.[806]
Such plans could include emission standards in the form of a multi-state rate-based or mass-based emission trading program.[807]
Alternatively, states could submit a multi-state plan using a state measures approach.[808]
Both approaches could provide for implementation of a multi-state emission trading program.
c.
Multi-state coordination among states retaining individual state goals.
States that do not wish to pursue a joint CO2
emission goal with other states may pursue a second pathway to multi-state collaboration. States may submit individual plans that will meet the CO2
emission performance rates or a state mass CO2
goal for affected EGUs (or mass-based CO2
goal plus the new source CO2
emission complement), but include implementation in coordination with other state plans by providing for the interstate transfer of ERCs or CO2
allowances, depending on whether the state is implementing a rate-based or mass-based emission trading program. This form of coordinated implementation may occur under both an “emission standards” type of plan and a “state measures” type of plan, where states are implementing emission trading programs.[809]
For rate-based plans, this type of coordinated approach is limited to state plans with rate-based emission standards that are equal to the CO2
emission performance rates in the emission guidelines.
Under this approach, a state plan could indicate that ERCs or CO2
allowances issued by other states with an EPA-approved state plan could be used by affected EGUs for compliance with the state's rate-based or mass-based emission standard, respectively. Such plans must indicate how ERCs or emission allowances will be tracked from issuance through use by affected EGUs for compliance,[810]
through either a joint tracking system, interoperable tracking systems, or an EPA-administered tracking system.[811]
The EPA would assess the approvability of each state's plan individually—the use of ERCs or emission allowances issued in another state would not impact the approvability of the components of the individual state plan.[812]
However, the EPA would also assess linkages with other state plans, to ensure that the joint tracking system or interoperable tracking systems used to implement rate-based or mass-based emission trading programs across states are properly designed with necessary components, systems, and procedures to maintain the integrity of the linked emission trading programs.
Coordinated state plan implementation among states that retain individual state mass-based CO2
goals (or that implement individual state plans with rate-based emission standards consistent with the CO2
( printed page 64840)
emission performance rates in the emission guidelines) is discussed in more detail in sections VIII.J and K. Section VIII.J discusses coordinated implementation among states implementing individual mass-based emission budget trading programs and section VIII.K discusses coordinated implementation among states implementing individual rate-based emission trading programs.
d.
Multi-state plans that address a subset of EGUs in a state.
The EPA is clarifying in the final emission guidelines that a state may participate in more than one multi-state plan. Under this approach, the state would identify in its submittal the subset of affected EGUs in the state that are subject to the multi-state plan or plans. This could involve a subset of affected EGUs that are subject to a multi-state plan, with the remainder of affected EGUs subject to a state's individual plan. Alternatively, different affected EGUs in a state may be subject to different multi-state plans. In all cases, the state would need to identify in each specific plan which affected EGUs are subject to such plan, with each affected EGU subject to only one multi-state plan or subject only to the state's individual plan (if relevant).
These scenarios may occur where a state chooses to cover affected EGUs in different ISOs or RTOs in different multi-state plans. This will provide states with flexibility to participate in multi-state plans that address the affected EGUs in a respective grid region, in the case where state borders cross grid regions.
These scenarios may also occur where a state is served by multiple vertically integrated electric utilities with service territories that cross state lines. This will provide states with flexibility to participate in multi-state plans that address the affected EGUs owned and operated by a utility with a multi-state service territory.
6. Legal Bases and Considerations for State Plan Types and Approaches
a.
Legal basis for emission standards approach.
The emission standards approach is consistent with the requirements of CAA section 111(d). If a state simply adopts the CO2
emission performance rates, then the corresponding rate-based emission standards in the state plan establish standards of performance for affected EGUs as required under section 111(d)(1)(A). Similarly, if a state chooses to achieve the rate-based CO2
emission goal through rate-based emission standards applicable only to affected EGUs, or to achieve the mass-based CO2
emission goal through mass-based emission standards applicable only to affected EGUs (or, alternatively, to achieve the mass CO2
goal and a new source CO2
emission complement through federally enforceable mass-based emission standards in conjunction with state enforceable emission standards on new sources), then the set of rate-based emission standards or the set of mass-based emission standards in the state plan establishes standards of performance for affected EGUs as required under section 111(d)(1)(A). The EPA has the authority to approve emission standards for affected EGUs as part of a state plan under all three cases (as long as such emission standards meet the requirements of CAA section 111(d) and the final emission guidelines), thereby making such emission standards federally enforceable upon approval by the EPA. In all three cases, the emission standards must be quantifiable, verifiable, enforceable, non-duplicative and permanent; this ensures that the plan provides for implementation and enforcement of the standards of performance (
i.e.
the emission standards) as required by section 111(d)(1)(B). Finally, as described in section VIII.B.7.b below, standards of performance may include emission trading. Thus, the credit and allowance trading that is allowed under the emission standards approach is consistent with the statutory requirement that the plan establish standards of performance.
We note that the standard the statute provides for the EPA's review of a state plan is whether it is “satisfactory.” We interpret a “satisfactory” plan as one that meets all applicable requirements of the CAA, including applicable requirements of these guidelines. Some commenters suggested that “satisfactory” should be taken to mean something less (such as mostly or substantially meeting requirements) but the structure of 111(d) shows otherwise. When a state plan is unsatisfactory, section 111(d)(2) gives the EPA the “same” authority to promulgate a federal plan as the EPA has under section 110(c). Under section 110(c), the EPA has authority to promulgate a federal implementation plan if a SIP does not comply with all CAA requirements (see sections 110(k)(3) and 110(l)).
For example, if an emission standards type plan includes an emission standard that is unenforceable due to defective rule language, then the plan is not satisfactory because it does not comply with the guideline requirement that emission standards must be enforceable. On the other hand, if a state plan complies with all applicable requirements of the CAA (including these guidelines), then the EPA must approve it as satisfactory. This is true even if the emission standards in the state plan are more stringent than the minimum requirements of these guidelines, or the state plan achieves more emission reductions than required by these guidelines. This follows from section 116 of the CAA as interpreted by the U.S. Supreme Court in
Union Elec. Co.
v.
EPA,
427 U.S. 246, 263-64 (1976).
b.
Legal basis for emissions trading in state plans.
There are three legal considerations with respect to emissions trading in state plans. First, we explain how the definition of “standard of performance” in section 111(a)(1) allows section 111(d) plans to include standards of performance that authorize emissions trading. Second, we explain how the EPA interprets the phrase “provides for implementation and enforcement of [the] standards of performance” in the context of a rate-based ERC trading program. Third, we give a similar explanation of the EPA's interpretation of the same phrase in the context of a mass-based allowance trading program.
(1). In the proposal, the EPA proposed that CAA section 111(d) plans may include standards of performance that authorize emissions averaging and trading. 79 FR 34830, 34927/1 (June 18, 2014). We are finalizing that states may include the use of emission trading in approvable state plans.
For purposes of this legal discussion, in the case of an emission limitation expressed as an emission rate, trading takes the form of buying or selling ERCs that an affected EGU may generate if its actual emission rate is lower than its allowed emission rate or that an eligible resource may generate. In the case of an emission limitation expressed as a mass-based limit, trading takes the form of buying or selling allowances.
As quoted in full above, the definition of “standard of performance” under CAA section 111(a)(1) is a “standard for emissions of air pollutants which reflects the degree of emission limitation achievable through the application of the best system of emission reduction which . . . the Administrator determines has been adequately demonstrated.”
Both an emission rate that may be met through tradable ERCs, and a mass limit requirement that emissions not exceed the number of tradable allowances surrendered by an affected source, qualify as a “standard for emissions.” The term “standard” is not defined, but its everyday meaning is a rule or
( printed page 64841)
requirement,[813]
which, under the only (or at least a permissible) reading of the provision, would include an emission rate that may be met through tradable ERCs and a requirement to retire tradable allowances.
Treating a tradable emission rate or mass limit requirement as a “standard of performance” is consistent with past EPA practice. In the Clean Air Mercury Rule, promulgated in 2005, the EPA established tradable mass limits as the emission guidelines for certain air pollutants from fossil fuel-fired EGUs, and explained that a tradable mass limit qualifies as a “standard for emissions.” [814]
In addition, in the 1995 Municipal Solid Waste (MSW) Combustor rule the EPA authorized emission trading by sources.[815]
It should be noted that CAA section 302(l) includes another definition of “standard of performance,” which is “a requirement of continuous emission reduction, including any requirement relating to the operation or maintenance of a source to assure continuous emission reduction.” As described above, section 111(d) contains its own, more specific definition of “standard of performance,” which a tradable emission rate or mass limit satisfies. Whether or not section 302(l) applies in light of section 111(d)'s more specific definition, a tradable emission rate or mass limit also meets section 302(l)'s requirements. A tradable emission rate applies continuously in that the source is under a continuous obligation to meet its emission rate, and that is so regardless of the averaging time,
e.g.,
a rate that must be met on an annual basis. Similarly, a mass limit requirement implemented through the use of allowances applies continuously in that the source is continuously under an obligation to assure that at the appropriate time, its emissions will not exceed the allowances it will surrender. In this respect, a tradable emission rate or mass limit requirement is similar to a non-tradable emission rate that must be met over a specified period, such as one year. In all of these cases, a source is continuously subject to its requirement although it may be able to emit at different levels at different points in time. It should also be noted that a tradable emission rate or mass limit requirement is appropriate for CO2
emissions, the air pollutant covered by this rule, because the environmental effects of CO2
emissions are not dependent on the location of the emissions.
(2). In our final rule, we are prescribing certain specific requirements for trading systems for ERCs in a rate-based approach. These specific requirements are in addition to the generic requirements for any state plan (see section VIII.D.2.d below for the legal basis for the generic components for state plans) and are intended to ensure the integrity of the ERC trading system. The integrity of the trading system is key to ensuring that a state plan provides for implementation and enforcement of the standards of performance, as required by section 111(d)(1)(B). Requirements relating to ERCs in a rate-based trading system, and allowances in a mass-based system, must also be submitted as federally enforceable components of the state plan, as such requirements provide for the implementation and enforcement of a tradable emission rate or mass limit for an affected EGU.
However, as described in section VIII.C.6.d, the EPA has legal concerns regarding whether federally enforceable requirements under a CAA section 111(d) state plan can be imposed on entities other than affected EGUs. It is important to note that the use of ERCs and inclusion of state plan requirements regarding a rate-based trading system, and the use of allowances and inclusion of state plan requirements regarding a mass-based trading system, does not run afoul of these legal concerns, as neither the requirements of section 111(d) nor of the federally enforceable state plan in either case extend to non-EGU generators or third-party verifiers of such compliance units.
(3). In our final rule, we are prescribing certain specific requirements for trading systems for allowances in a mass-based approach. These specific requirements are in addition to the generic requirements for any state plan (see section VIII.D.2.d below for the legal basis for the generic requirements for state plans) and are intended to ensure the integrity of the allowance trading system. The integrity of the trading system is key to ensuring that a state plan provides for implementation and enforcement of the standards of performance.
c.
Legal basis for state measures plan type.
The EPA believes the state measures plan type is consistent with CAA section 111(d). Section 111(d)(1) requires a state to submit a plan that “(A) establishes standards of performance for any existing source for [certain] air pollutant[s] . . . and (B) provides for the implementation and enforcement of such standards of performance.” Section 111(d)(2)(A) indicates that the EPA must approve the state plan if it is “satisfactory.”
For states that choose to adopt and submit a state measures plan, such state must submit a state plan that includes standards of performance for CO2
emissions from affected EGUs in the form of a federally enforceable backstop in order to meet the requirements of section 111(d). Section 111(d) unambiguously requires a state to submit a plan that establishes standards of performance for certain sources, but does not mandate when such standards of performance must be in effect or implemented in order to meet applicable compliance deadlines. Instead, Congress has delegated to the EPA the determination of the appropriate effective date of standards of performance submitted under state plans to meet the requirements of section 111(d). In other words, where the statute is silent, the EPA has authority to provide a reasonable interpretation. The EPA's interpretation is that for states that submit state plans establishing standards of performance under section 111(d), the effective date of such standards of performance may be later in time, perhaps indefinitely, for a number of reasons and under certain conditions. A key condition is that the state plan provides for the achievement of the required reduction by means other than the standards of performance on the timetable required by the BSER, with provision for federally enforceable standards of performance to be implemented if those other means fall short. The EPA believes it is reasonable to defer the effective date for standards of performance for affected EGUs as long as affected EGU CO2
emissions are projected to achieve, and do achieve, the requisite state goal.
Additionally, under the state measures plan type, if a state chooses to impose emission standards for the affected EGUs in conjunction with state measures that apply to other entities for any period prior to the triggering of the backstop, this final rule requires such emission standards to be submitted as federally enforceable measures included in the state plan. The EPA believes this is appropriate to help ensure the performance of a state measures plan will meet the requirements of this final rule. Section 111(d) clearly authorizes states to impose, and the EPA to approve, federally enforceable emission standards for affected EGUs. Though federally enforceable emission standards for affected EGUs in a state
( printed page 64842)
measures plan themselves would not necessarily achieve the requisite state goals, the EPA is authorized to approve state plans when they satisfactorily meet applicable requirements. The EPA can evaluate whether a state measures plan is satisfactory by determining whether any federally enforceable emission standards for affected EGUs in conjunction with state measures on other entities will result in the achievement of the requisite emissions performance level. As previously explained in this final rule, the performance rates and the state goals are the arithmetic expression of BSER as applied across affected EGUs in a state as a source category. In a state measures plan, the evaluation of whether a state measures plan is satisfactory goes to evaluating both the state measures and any federally enforceable emission standards on the affected EGUs to determine whether the plan as a whole will result in the affected EGUs achieving the applicable goals that reflect BSER.
Section 111(d)(1)(B) also requires a state to submit a program that provides for the implementation and enforcement of the applicable standards of performance. Under the state measures approach, this requirement regarding implementation is satisfied in part by the submission of an approvable trigger mechanism for the backstop and appropriate monitoring, reporting and recordkeeping requirements. The trigger mechanism provides for the “implementation” of the backstop,
i.e.,
the standards of performance, by putting the backstop into effect once the associated trigger is deployed. In other words, when the CO2
performance level under a state plan exceeds the trigger as described in section VIII.C.4.b, the emission standards that were submitted as the federally enforceable backstop and any attendant requirements must be implemented and in effect. The statutory requirement under CAA section 111(d)(2) regarding enforcement is also satisfied under the state measures plan type by the state submitting standards of performance sufficient to meet the requisite emission performance rates or state goal, in the form of the backstop, for inclusion as part of the federally enforceable state plan.
Additionally, by requiring states that choose to impose emission standards on affected EGUs under the state measures approach to submit such emission standards for inclusion in the federally enforceable plan, this requirement further provides for implementation and enforcement as required by the statute. Regulating the affected EGUs through federally enforceable emission standards themselves in conjunction with any state measures the state chooses to rely upon further assures the likelihood of the affected EGUs achieving the state goals as required under this rule and section 111(d).
The state measures plan is a variation of the proposed portfolio approach in that both plan types allow the state to rely upon measures that impose requirements on sources other than affected EGUs in meeting the requisite state CO2
emission goal. The state measures plan type is also a variation of the proposed state commitment approach in that the measures involving entities other than affected EGUs are not included as part of the federally enforceable 111(d) state plan, but the state may rely upon such measures that have the effect of reducing CO2
emissions from affected EGUs as a matter of state law. The EPA took comment on the proposed portfolio approach and state commitment approach, and on the utilization of measures on entities other than affected EGUs in meeting the requirements of the emission guidelines and CAA section 111(d). With respect to the proposed state commitment approach, the EPA received comments recommending that the EPA require a federally enforceable backstop with emission standards sufficient to achieve the requisite CO2
emission performance. The backstop component the EPA is finalizing as part of the state measures plan type is consistent with the EPA's statements in the proposal regarding states' obligations under section 111(d) to establish emission standards for affected EGUs, as the backstop contains federally enforceable emission standards for affected EGUs that will achieve the requisite CO2
emission performance, and is consistent with comments received regarding the proposed state commitment approach.
The state measures plan type the EPA is finalizing is also a logical outgrowth of the comments received on the proposed portfolio approach. As further explained below, legal questions remain as to whether state plans under section 111(d) can include federally enforceable measures that impose requirements on sources other than affected EGUs. However, a number of commenters and stakeholders expressed robust support for the ability to rely on measures and programs that do not impose requirements on affected EGUs themselves through plan types such as the proposed portfolio and state commitment approaches. The EPA is reasonably interpreting 111(d) as authorizing the state measures plan type, and believes this plan type is also responsive to, and accommodating of, states and stakeholders who have expressed the importance of being able to rely upon various measures that have the effect of reducing CO2
emissions from affected EGUs. The EPA is finalizing the state measures plan type upon careful consideration of statutory requirements and comments received based on the proposed portfolio approach and state commitment approach.
The EPA additionally notes that the state measures plan type is not precluded by the recent Ninth Circuit Court of Appeals' decision in
Committee for a Better Arvin et al.
v.
US EPA et al.,
Nos. 11-73924 and 12-71332 (May 20, 2015). The court held that the EPA violated the CAA by approving a California SIP which relied on emission reductions from state-only mobile source standards (“waiver measures”) without including those standards in the SIP. The court first looked at the plain language of section 110(a)(2)(A) of the CAA, which states that SIPs “shall include” the emission limitations and other control measures on which a state relies to comply with the CAA. The court then stated that the EPA's action was also inconsistent with the structure of the CAA. The EPA has the primary responsibility to protect the nation's air quality, but in the court's view, the EPA itself would be unable to enforce the state-only standards. In addition, the court stated that the EPA's action was inconsistent with citizens' right to enforce SIP provisions under section 304.
There are a number of reasons why this decision does not preclude the state measures plan type. The Ninth Circuit's textual analysis does not apply here, as the language of section 110(a)(2)(A) does not control for 111(d) state plans. Section 111(d)(1) requires state plans to “establish standards of performance” and to “provide for implementation and enforcement” of the standards of performance, but, unlike section 110(a)(2)(A), section 111(d) does not specifically say that every emission reduction measure must be “included” in the state plan and be made federally enforceable. Even if section 111(d) did impose such requirements, the state measures approach satisfies them because the trigger is included in the plan as a federally enforceable implementation measure, and the backstop included in the plan also contains standards of performance that reflect the BSER and are federally enforceable once they are triggered.
The Ninth Circuit's structural analysis also does not apply. The availability of the trigger and backstop gives the EPA
( printed page 64843)
and citizens a federally enforceable route to ensure that all necessary emission reductions take place in order to achieve the standards of performance. This is markedly different than the state-only standards, where according to the Ninth Circuit, the EPA and citizens had no route to ensure that all necessary emission reductions took place in order to attain the NAAQS. In addition, case law suggests that federal enforceability for every requirement may not be necessary when there are sufficient federally enforceable requirements to satisfy the statute, see
National Mining Ass'n
v.
United States EPA,
59 F.3d 1351 (D.C. Cir. 1995); in this case federal enforceability for the state-only measures is not necessary to meet the statutory requirements of section 111(d)(1) as the federally enforceable trigger and backstop are sufficient.
d.
Legal considerations with proposed portfolio approach.
The EPA is not finalizing the portfolio approach that was included in the proposed rulemaking, 79 FR 34830, 34902 (June 18, 2014). In the proposal, the EPA noted that the portfolio approach raised legal questions. 79 FR 34830, 34902-03. A number of commenters stated that the portfolio approach is unlawful because it exceeds the limitations that section 111(d)(1) places on state plans. Upon further review, we agree with these comments.
Section 111(d)(1) provides that state plans shall “establish[] “standards of performance for any existing source” and “provide[] for the implementation and enforcement of . . . standards of performance” under CAA section 111(d)(1). Although in the proposal we identified possible interpretations of section 111(d)(1) that could justify the proposed portfolio approach, after reviewing the comments, we are not adopting those interpretations. Because section 111(d)(1) specifically requires state plans to include only (A) standards for emissions imposed on affected sources and (B) measures that implement and enforce such standards,[816]
we interpret it as allowing federal enforceability only of requirements or measures that are in those two specifically required provisions. We therefore do not interpret the term “implementation of . . . such standards of performance” to authorize the EPA to approve state plans with obligations enforceable against the broad array of non-emitting entities that would have been implicated by the portfolio approach. Thus, the EPA is not finalizing the portfolio approach, and in the event that states submit such measures to the EPA for inclusion in the state plan, the EPA would not approve them into the state plan and therefore would not make them federally enforceable.
We note that section 111(d) limits on federal enforceability of requirements against non-affected sources do not imply that the BSER cannot be based on actions by non-affected sources. As discussed in section V, the BSER may be based on the ability of owners/operators of affected sources to engage in commercial relationships with a wide range of other entities, from the vendors, installers, and operators of air pollution control equipment to, in this rulemaking, owners/operators of RE.
The EPA notes it is also not finalizing the proposed state commitment approach or state crediting approach. The EPA believes the finalized state measures plan type provides states with the same flexibilities as would have been allowed under these two proposed approaches, and does so in a way that is legally supportable by the CAA. Therefore, the EPA does not believe it necessary to finalize the state commitment approach or state crediting approach.
e.
Legal basis for multi-state plans.
While nothing in section 111(d)(1) explicitly authorizes either states to adopt and submit multi-state plans, or the EPA to approve them as satisfactory, nothing in section 111(d)(1) explicitly prohibits it, either. In addition, nothing in section 111(d)(2)(A)'s standard of “satisfactory” prohibits the EPA from considering multi-state plans as satisfactory. There is thus a gap that the EPA may reasonably fill.
In light of the purpose of these emission guidelines, to reduce emissions of a pollutant that globally mixes in the stratosphere, and the mechanisms to reduce those emissions, which may have beneficial effects across state lines, it is reasonable to allow for multi-state plans. Thus, our gap-filling interpretation of section 111(d) in this context is reasonable.
D. State Plan Components and Approvability Criteria
1. Approvability Criteria
In the “Criteria for Approving State Plans” section of the preamble to the June 2014 proposal (section VIII.C), the EPA proposed the following as necessary components of an approvable state plan:
1. The plan must contain enforceable measures that reduce EGU CO2
emissions;
2. The projected CO2
emission performance by affected EGUs must be equivalent to or better than the required CO2
emission performance level in the state plan;
3. The EGU CO2
emission performance must be quantifiable and verifiable;
4. The plan must include a process for state reporting of plan implementation, CO2
emission performance outcomes, and implementation of corrective measures, if necessary.
After reviewing the comments we received concerning the approvability criteria, the EPA has decided against maintaining the four proposed approvability criteria separately from the list of components required for an approvable plan, which may be confusing and potentially redundant. The EPA has determined that a satisfactory state plan that meets the required plan components discussed below will inevitably meet the proposed approvability criteria. The EPA, therefore, has incorporated the proposed approvability criteria into the section titled “Components of a state plan submittal” (section VIII.D.2 below). There is no functional change in the approvability criteria or the components of a state plan addressed in the proposal; they are simply combined and this change does not have a substantive effect on state plan development or approval.
Under the proposed “Enforceable Measures” criterion (section VIII.C.1 of the proposal preamble), the EPA specifically requested comment on the appropriateness of applying existing EPA guidance on enforceability to state plans under CAA section 111(d), considering the types of entities that might be included in a state plan.[817]
The EPA also requested comment on whether the agency should provide guidance on enforceability considerations related to requirements in a state plan for entities other than affected EGUs, and if so, what types of entities. Comments received strongly suggested that the EPA provide guidance on enforceability considerations for non-EGU affected entities, particularly for RE and EE. Comments also requested additional guidance specific to this rulemaking, including examples of enforceable measures for specific activities, such as
( printed page 64844)
solar thermal technologies, waste heat recovery, net-metering energy savings and state RPS.
These enforcement considerations arose primarily under the proposed portfolio approach for state plans, which would have allowed state plans to include federally enforceable measures that apply to entities that are not affected EGUs. In this action, the EPA is finalizing the state measures approach instead of the portfolio approach, under which a state can rely upon measures that are not federally enforceable as long as the plan also includes a backstop of federally enforceable emission standards that apply to affected EGUs. As explained in depth in section VIII.C, if the state is adopting the state measures approach, the state plan submittal will need to specify, in the supporting materials, the state-enforceable measures that the state is relying upon, in conjunction with any federally enforceable emission standards for affected EGUs, to meet the emission guidelines. As part of the state measures approach, the EPA is finalizing a requirement for a federally enforceable backstop, which requires the affected EGUs to meet emission standards that fully achieve the CO2
emission performance rates or the state's CO2
emission goal if the state measures do not meet the state's mass-based CO2
emission goal. Because the EPA is not finalizing the portfolio approach, which would have allowed states to include federally enforceable measures in a state plan that apply to entities that are not affected EGUs, the agency is not providing additional guidance on federal enforceability of measures that might apply to such entities. As proposed, we are requiring that state plans include a demonstration that plan measures are enforceable, which for emission standards plan types is discussed in section VIII.D.2.b.3 below and for state measures plan types is discussed in section VIII.D.2.c.6 below.
Commenters also requested that the EPA allow states to rely on provisions with flexible compliance mechanisms in state plans and clarify how to address flexible compliance mechanisms when demonstrating achievement of a state CO2
emission goal. Additionally, a commenter requested that the enforceability mechanisms that the EPA requires in state plans should support existing programs, as well as new programs in other states, by minimizing program changes required purely to conform with federal requirements, while still providing enough additional program review and accounting to ensure that CO2
emission reductions are achieved. These and related comments contributed to the EPA's decision to finalize the option for states to submit a state measures plan, which would be comprised, at least in part, of measures implemented by the state that are not included as federally enforceable components of the plan, with a backstop of federally enforceable emission standards for affected EGUs that fully meet the emission guidelines and that would be triggered if the plan failed to achieve the CO2
emission performance levels specified in the plan on schedule. For more information on the state measures plan approach, see section VIII.C.3 of this preamble above.
2. Components of a State Plan Submittal
In this action, the EPA is finalizing that a state plan submittal must include the components described below. As a result of constructive comments received from many commenters and additional considerations, the EPA is finalizing state plan components that are responsive to that input and are appropriate for the types of state plans allowed in the final emission guidelines. A state plan submittal must also be consistent with additional specific requirements elsewhere in this final rule and with the EPA implementing regulations at 40 CFR 60.23-60.29, except as otherwise specified by this final rule. These requirements apply to both individual state plan submittals and multi-state plan submittals. When a state plan submittal is approved by the EPA, the EPA will codify the approved CAA section 111(d) state plan in 40 CFR part 62. Section VIII.D.3 discusses the components of a state plan submittal that would be codified as the state CAA section 111(d) plan when the state plan submittal is approved by the EPA.
The EPA is finalizing that states can choose to meet the emission guidelines through one of two types of state plans: an emission standards plan type or a state measures plan type. A state pursuing the emission standards plan type may opt to submit a plan that meets the CO2
emission performance rates for affected EGUs or meets the state rate-based or mass-based CO2
emission goal for affected EGUs. A state implementing a state measures approach plan type must submit a plan where the state measures, in conjunction with any emission standards on the affected EGUs, result in achievement of the state mass-based CO2
goal for affected EGUs. The backstop required to be submitted as part of a state measures plan may achieve the CO2
emission performance rates for affected EGUs or the state rate-based or mass-based CO2
emission goal. The content of the state plan submittal will vary depending on which plan type the state decides to adopt. States that choose to participate in multi-state plans must adequately address plan components that apply to all participating states in the multi-state plan.
The rest of this section covers components that are required for all types of plans, as well as components specific to each specific type of plans. Section VIII.D.2.a addresses the components required for all plan submittals. Section VIII.D.2.b addresses the additional components required for submittals under the emission standards plan type. Section VIII.D.2.c addresses additional components required for submittals under the state measures plan type.
a.
Components required for all state plan submittals.
The EPA is finalizing requirements that a final plan submittal must contain the following components, in addition to those in either section VIII.D.2.b (for the emission standards plan type) or VIII.D.2.c (for the state measures plan type) of this section.
(1)
Description of the plan approach and geographic scope.
The description of the plan type must indicate whether the state will meet the emission guidelines on an individual state basis or jointly through a multi-state plan, and whether the state is adopting an emission standards plan type or a state measures plan type. For multi-state plans this component must identify all participating states and geographic boundaries applicable to each component in the plan submittal. If a state intends to implement its individual plan in coordination with other states by allowing for the interstate transfer of ERCs or emission allowances, such links must also be identified.[818]
(2)
Applicability of state plans to affected EGUs.
The state plan submittal must list the individual affected EGUs that meet the applicability criteria of 40 CFR 60.5845 and provide an inventory of CO2
emissions from those affected EGUs for the most recent calendar year prior to plan submission for which data are available.
(3)
Demonstration that a state plan will achieve the CO2emission performance rates or state CO2emission goal.
A state plan submittal must demonstrate that the federally
( printed page 64845)
enforceable emission standards for affected EGUs and/or state measures are sufficient to meet either the CO2
emission performance rates or the state's CO2
emission goal for affected EGUs in the emission guidelines for the interim and final plan performance periods. This includes during the interim period of 2022-2029, including the interim step 1 period (2022-2024); interim step 2 period (2025-2027); and interim step 3 period (2028-2029) period, as well as during the final period of 2030-2031 and subsequent 2-year periods.[819]
A demonstration of CO2
emission performance is required through 2031. For the post-2031 period, the demonstration requirement may be satisfied by showing that emission standards or state measures on which the demonstration through 2031 is based are permanent and will remain in place. As discussed in more detail in section VIII.J, states adopting a plan based upon a mass-based state CO2
emission goal must demonstrate that they have addressed the risk of potential emission leakage in their mass-based state plan.
The type of demonstration of CO2
emission performance and documentation required for such a demonstration in a state plan submittal will vary depending on how the CO2
emission standards for affected EGUs and/or state measures in a state plan are applied across the fleet of affected EGUs in a state, as discussed below.[820]
(a)
State plan type designs that require a projection of CO2emission performance.
Whether a projection of affected EGU CO2
emission performance must be included in a state plan submittal depends on the design of the state plan. The following plan designs do not require a projection of CO2
emission performance by affected EGUs under the state plan because they ensure that the CO2
emission performance rates or state rate-based or mass-based CO2
goals are achieved when affected EGUs comply with the emission standards:
State plan establishes separate rate-based CO2
emission standards for affected fossil fuel-fired electric utility steam generating units and stationary combustion turbines (in lb CO2
/MWh) that are equal to or lower than the CO2
emission performance rates in the emission guidelines during the interim and final plan performance periods.
State plan establishes a single rate-based CO2
emission standard for all affected EGUs that is equal to or lower than the state's rate-based CO2
goal in the emission guidelines during the interim and final plan performance periods.
State plan establishes mass-based CO2
emission standards for affected EGUs that cumulatively do not exceed a state's mass-based CO2
goal in the emission guidelines during the interim and final plan performance periods.
State plan establishes mass-based CO2
emission standards for affected EGUs that, together with state enforceable limits on mass emissions from new EGUs, cumulatively do not exceed the state's EPA-specified mass CO2
emission budget [821]
in the emission guidelines during the interim and final plan performance periods.
All other state plan designs must include a projection of CO2
emission performance by affected EGUs under the state plan.
For example, if a state chooses to apply rate-based CO2
emission standards to individual affected EGUs, or to subcategories of affected EGUs (such as fossil fuel-fired electric utility steam generating units and stationary combustion turbines), at a lb CO2
/MWh rate that differs from the CO2
emission performance rates or the state's rate-based CO2
goal in the emission guidelines, then a projection is required. Also, if a state chooses to implement a mass-based program including both affected EGUs and new EGUs, but with total allowable emissions in excess of the presumptively approvable EPA-specified mass CO2
emission budget for that state, the state must provide a projection of CO2
emission performance. Likewise, if a state chooses a state measures state plan approach, a projection of CO2
emission performance is required.
(b)
Methods and tools.
A satisfactory demonstration of the future CO2
emission performance of affected EGUs must use technically sound methods that are reliable and replicable. A state plan submittal must explain how the projection method and/or tool works and why the method and/or tool chosen is appropriate considering the type of emission standards and/or state measures included (or relied upon, in the case of state measures) in a state plan. The results of the demonstration must be reproducible using the documented assumptions described in the state plan submittal. The method and projection of EGU generation and CO2
emissions can differ from the EPA's forecast in the RIA. The EPA received comments on whether it would require specific modeling tools and input assumptions. Commenters raised concerns that the EPA may require states to use proprietary models, and that states do not have the financial resources to use such models. The EPA is not requiring a specific type of method or model, as long as the one chosen uses technically sound methods and tools that establish a clear relationship between electricity grid interactions and the range of factors that impact future EGU economic behavior, generation, and CO2
emissions. The EPA will assess whether a method or tool is technically sound based on its capability to represent changes in the electric system commensurate to the set of emission standards and state measures in a state plan while accounting for the key parameters specified in section VIII.D.2.a.(3)(c) below. Including a base case CO2
emission projection in the state plan submittal (
i.e.,
one that does not include any federally enforceable CO2
emission standards included in a plan or state-enforceable measures referenced in a plan submittal), will help facilitate the EPA's assessment of the CO2
emission performance projection. Methods and tools could range from applying future growth rates to historical generation and emissions data, using statistical analysis, or electric sector energy modeling.
(c)
Required documentation of projections.
When required to provide a CO2
emission performance projection, the state must also provide comprehensive documentation of analytic parameters for the EPA to assess the reasonableness of the projection. The analytic parameters, when considered as a whole, should reflect a logically consistent future outlook of the electric system. Refer to the Incorporating RE and Demand-side EE Impacts into State Plan Demonstrations TSD of the final rule for further details on quantifying impacts of eligible RE and demand-side EE measures.
The CO2
emission performance projection documentation must include:
( printed page 64846)
Geographic representation, which must be appropriate for capturing impacts and/or changes in the electric system
Time period of analysis, which must extend through 2031
Electricity demand forecast (MWh load and MW peak demand) at the state and regional level. If the demand forecast is not from NERC, an ISO or RTO, EIA, or other publicly available source, then the projection must include justification and documentation of underlying assumptions that inform the development of the demand forecast, such as annual economic and demand growth rate, population growth rate.
Planning reserve margins
Planned new electric generating capacity
Analytic treatment of the potential for building unplanned new electric generating capacity
Wholesale electricity prices
Fuel prices, when applicable;
Fuel carbon content
Unit-level fixed operations and maintenance costs, when applicable;
Unit-level variable operations and maintenance costs, when applicable;
Unit-level capacity
Unit-level heat rate
If applicable, EGU-specific actions in the state plan designed to meet the required CO2
emission performance, including their timeline for implementation
If applicable, state-enforceable measures, with electricity savings and renewable electricity generation (MWhs) expected for individual and collective measures, as applicable. Quantification of MWhs expected from EE and RE measures will involve assumptions that states must document, as described in the Incorporating RE and Demand-side EE Impacts into State Plan Demonstrations TSD.
Annual electricity generation (MWh) by fuel type and CO2
emission levels, for each affected EGU
ERC or emission allowance prices, when applicable
The state must also provide a clear demonstration that the state measures and/or federally enforceable emission standards informing the projected achievement of the emission performance requirements will be permanent and remain in place.
The EPA encourages participation in regional modeling efforts which are designed to allow sharing of data and help promote consistent approaches across state boundaries. A state that submits a single-state plan must consider interstate transfer of electricity across state boundaries, taking into account other states' plan types reflecting the best available information at the time of the CO2
emission performance projection. Projections of CO2
emission performance for multi-state plans and single-state plans that include multi-state coordination must either use a single (regional) electricity demand forecast or must document the use of electricity demand forecasts from different information sources and demonstrate how any inconsistencies between the individual electricity demand forecasts have been reconciled.
(d)
Additional projection requirements under a rate-based emission standards plan.
For an emission standards plan that applies rate-based CO2
emission standards to individual affected EGUs, or to subcategories of affected EGUs, at a lb CO2
/MWh rate that differs from the CO2
emission performance rates or the state's rate-based CO2
goal in the emission guidelines, a projection of affected EGU CO2
emission performance is required. The state must demonstrate that the weighted average CO2
emission rate of affected EGUs, when weighted by generation (in MWh) from affected EGUs subject to the different rate-based emission standards, will be equal to or less than the CO2
emission performance rates or the state's rate-based CO2
emission goal during the interim and final plan performance periods.
The projection will involve an analysis of the change in generation of affected EGUs given the compliance costs and incentives under the application of different emission rate standards across affected EGUs in a state. It must accurately represent the emission standards in the plan, including the use of market-based aspects of the emission standards (if applicable), such as use of ERCs or emission allowances as compliance instruments.
In addition to the elements described in the previous section (c), the projection under this plan design must include:
The assignment of federally enforceable emission standards for each affected EGUs;
A projection showing how generation is expected to shift between affected EGUs and across affected EGUs and non-affected EGUs over time;
Underlying assumptions regarding the availability and anticipated use of the MWh of electricity generation or electricity savings from eligible measures that can be issued ERCs;
The specific calculation (or assumption) of how eligible MWh of electricity generation or savings that can be issued ERCs are being used in the projection to adjust the reported CO2
emission rate of affected EGUs, consistent with the accounting methods for adjusting the CO2
emission rate of an affected EGU specified in section VIII.K.1 of the emission guidelines, if applicable;
ERC prices, if applicable;
If a state plan provides for the ability of RE resources located in states with mass-based plans to be issued ERCs for use in adjusting the reported CO2
emission rates of affected EGUs, consideration in the projection that such resources must meet geographic eligibility requirements, based on power purchase agreements or related documentation, consistent with the requirements at section VIII.K.1 and section VIII.L; and
Any other applicable assumptions used in the projection.
(e)
Additional projections requirements for a state measures plan.
For a state measures plan, a projection of affected EGU CO2
emission performance must demonstrate that the state measures, whether alone or in conjunction with any federally enforceable CO2
emission standards for affected EGUs, will achieve the state's mass-based CO2
goals in the emission guidelines for the interim and final periods. The projection must accurately represent individual state-enforceable measures (or bundled measures) and timing for implementation of these state measures.
A state must demonstrate that its state-enforceable measures, along with any federally enforceable CO2
emission standards for affected EGUs included in a state plan, will achieve the state mass-based CO2
goal. In addition to the elements described in section VIII.D.2.a.(3).(c), the state must clearly document, at a minimum:
The assignment of federally enforceable emission standards for each affected EGUs, if applicable; and
the individual state measures, including their projected impacts over time.
Because different types of state measures could have varying degrees of impact on reducing or avoiding CO2
emissions from affected EGUs, and different state measures may interact with one another in terms of CO2
emission reduction impacts, the method and tools a state uses to project CO2
emissions impacts must have the capability to project how the combined set of state-enforceable measures are likely to impact CO2
emissions at affected EGUs. If a state chooses to use an emission budget trading program as a mass-based state measure, for example, the state must choose an analytic method or tool that can account for and properly represent any program flexibilities that impact CO2
emissions from affected EGUs, such as use of out-of-sector GHG offsets and cost-containment provisions. The state would show that the emissions budget trading program relied upon for the state measures plan, as well as any other state measures, ensure that the sum of emissions at all affected EGUs will be lower than or equal to the state's CO2
emission goal in the time periods specified in these guidelines. All flexibilities must be clearly documented in the demonstration.
( printed page 64847)
(4)
Monitoring, reporting and recordkeeping requirements for affected EGUs.
The state plan submittal must specify how each emission standard is quantifiable and verifiable by describing the CO2
emission monitoring, reporting and recordkeeping requirements for affected EGUs. The applicable monitoring, recordkeeping and reporting requirements for affected EGUs are outlined in section VIII.F.
In the June 2014 proposal, the EPA proposed that states must include in their state plans a record retention requirement for affected EGUs to maintain records for at least 10 years following the date of each occurrence, measurement, maintenance, corrective action, report or record. Commenters requested clarification of the record retention requirements for states as compared to for affected EGUs and also requested that the EPA clarify onsite versus offsite record maintenance requirements for affected EGUs. The EPA is finalizing that states must include in their plans a record retention requirement for affected EGUs of not less than 5 years following the date of each compliance period, compliance true-up period, occurrence, measurement, maintenance, corrective action, report, or record, whichever is latest. Affected EGUs must maintain each record onsite for at least 2 years after the date of the occurrence of each record and may maintain records offsite and electronically for the remaining years. Each record must be in a form suitable and readily available for expeditious review. The EPA finds that these final recordkeeping requirements are appropriate and consistent with the requirements for other CAA section 111(d) emission guidelines.
(5)
State reporting and recordkeeping requirements.
A state plan submittal must contain the process, content and schedule for state reporting to the EPA on plan implementation and progress toward meeting the CO2
emission performance rates or state CO2
emission goal.
The EPA requested comments on whether full reports containing all of the report elements should only be required every 2 years and on the appropriate frequency of reporting of the different proposed elements, considering both the goals of minimizing unnecessary burdens on states and ensuring program transparency and effectiveness. Commenters recognized that different reporting frequencies may be appropriate for different types of state plans. The EPA agrees with the commenters and is finalizing state reporting requirements based on the type of plan the state chooses to adopt and implement. These state reporting requirements and reporting periods are discussed in section VIII.D.2.b (for emission standards plan types) and VIII.D.2.c (for state measures plan types). The EPA finalizes that each state report is due to the EPA no later than the July 1 following the end of each reporting period. The EPA recognizes the multiple comments received recommending extending the state report due date from July 1 to a later date or to allow the states the flexibility to propose an alternative report submittal date. The EPA is not pursuing these recommendations due to the implications of the state reports' due date and the trigger and schedule for implementation of corrective measures (for the emission standards approach) or the backstop federally enforceable emission standards (for the state measures approach). The EPA believes the July 1 deadline for states to submit reports to the EPA on plan implementation is feasible given that the information required to be included in the reports will be available per the reporting requirements for affected EGUs in state plans.
In addition to the state reporting requirements discussed in section VIII.D.2.b (for emission standards approach) and VIII.D.2.c (for state measures approach) and as discussed below, states must include in the supporting material of a final state plan submittal a timeline with all the programmatic plan milestone steps the state will take between the time of the final state plan submittal and 2022 to ensure the plan is effective as of 2022. The EPA is also finalizing a requirement that states must submit a report to the EPA in 2021 that demonstrates that the state has met the programmatic plan milestone steps that the state indicated it would take from the submittal of the final plan through the end of 2020, and that the state is on track to implement the approved state plan as of January 1, 2022. A final state plan submission must include a requirement for the state to submit this report to the EPA no later than July 1, 2021. This report will help the EPA further assist and facilitate plan implementation with states as part of an ongoing joint effort to ensure the necessary reductions are achieved.
The EPA is finalizing the requirement that submissions related to this program be submitted electronically. Specifically, this includes negative declarations, state plan submittals (including any supporting materials that are part of a state plan submittal), any plan revisions, and all reports required by the state plan. The EPA is developing an electronic system to support this requirement that can be accessed at the EPA's Central Data Exchange (CDX) (
https://www.epa.gov/cdx/). See section VIII.E.8 for additional information on electronic submittal requirements.
In the June 2014 proposal, the EPA proposed that states must keep records, for a minimum of 20 years, of all plan components, plan requirements, plan supporting documentation and status of meeting the plan requirements, including records of all data submitted by each affected EGU used to determine compliance with its emission standards. The EPA received multiple comments recommending that the EPA reduce recordkeeping requirements due to the burden in expenditure of resources and manpower to maintain records for at least 20 years. Commenters recommended that recordkeeping requirements be reduced to 5 years consistent with emission guidelines for other existing sources.
After considering the comments received, this final rule requires that a state must keep records of all plan components, plan requirements, supporting documentation, and the status of meeting the plan requirements defined in the plan for the interim plan period from 2022-2029 (including interim steps 1, 2 and 3). After 2029, states must keep records of all information relied upon in support of any continued demonstration that the final CO2
emission performance rates or goals are being achieved. The EPA agrees with comments that a 20-year record retention requirement could be unduly burdensome, and has reduced the length of the record retention requirement for the final rule. During the interim period, states must keep records for 10 years from the date the record is used to determine compliance with an emission standard, plan requirement, CO2
emission performance rate or CO2
emission goal. During the final period, states must keep records for 5 years from the date the record is used to determine compliance with an emission standard, plan requirement, CO2
emission performance rate or CO2
emissions goal. All records must be in a form suitable and readily available for expeditious review. States must also keep records of all data submitted by each affected EGU that was used to determine compliance with each affected EGU's emission standard, and such data must meet the requirements of the emission guidelines, except for any information that is submitted to the EPA electronically pursuant to requirements in 40 CFR part 75. If the state is adopting and implementing the state measures approach, the state must also
( printed page 64848)
maintain records of all data regarding implementation of each state measure and all data used to demonstrate achievement of the mass CO2
emission goal and such data must meet the requirements of the emission guidelines. The EPA finds that these final recordkeeping requirements balance the need to maintain records while reducing the strain on state resources.
(6)
Public participation and certification of hearing on state plan.
A robust and meaningful public participation process during state plan development is critical. For the final plan submittal, states must meaningfully engage with members of the public, including vulnerable communities, during the plan development process. This section describes how the EPA will evaluate a state plan for compliance with the minimum required elements for public participation provided in the existing implementing regulations as well as recommendations for other steps the state can take to assure robust and inclusive public participation.
The existing implementing regulations regarding public participation requirements are in 40 CFR 60.23(c)-(f). Per the implementing regulations, states must conduct a public hearing on a final state plan before such plan is adopted and submitted. State plan development can be enhanced by tapping the expertise and program experience of several state government agencies. The EPA encourages states to include utility regulators (
e.g.
the PUCs) and state energy offices as appropriate early on and throughout in the development of the state plan.[822]
The EPA notes that utility regulators and state energy offices have the opportunity during the public participation processes required for state plans to provide input as well. The EPA also encourages states to conduct outreach meetings (that could include public hearings or meetings) with vulnerable communities on its initial submittal before the plan is submitted. In its final plan submittal, a state must provide certification that the state made the plan submittal available to the public and gave reasonable notice and opportunity for public comment on the state plan submittal. The state must demonstrate that the public hearing on the state plan was held only after reasonable notice, which will be considered to include, at least 30 days prior to the date of such hearing, notice given to the public by prominent advertisement announcing the date(s), time(s) and place(s) of such hearing(s). For each hearing held, a state plan submittal must include in the supporting documentation the list of witnesses and their organizational affiliations, if any, appearing at the hearing, and a brief written summary of each presentation or written submission pursuant to the requirements of the implementing regulations at 40 CFR 60.23. Additionally, the EPA recommends that states work with local municipalities, community-based organizations and the press to advertise their state public hearing(s). The EPA also encourages states to provide background information about their proposed final state plan or their initial submittal in the appropriate languages in advance of their public hearing and at their public hearing. Additionally, the EPA recommends that states provide translators and other resources at their public hearings, to ensure that all members of the public can provide oral feedback.
As previously discussed in this rule, recent studies also find that certain communities, including low-income communities and some communities of color (more specifically, populations defined jointly by ethnic/racial characteristics and geographic location) are disproportionately affected by certain climate change related impacts.[823]
Also as discussed in this rule, effects from this rule can be anticipated to affect vulnerable communities in various ways. Because certain communities have a potential likelihood to be impacted by state plans, the EPA believes that the existing public participation requirements under 40 CFR 60.23 are effectuated for the purposes of this final rule by states engaging in meaningful, active ways with such communities.
In addition, certain communities whose economies are significantly dependent on coal, or whose economies may be affected by ongoing changes in the utility power and related sectors, may be particularly concerned about the final rule. The EPA encourages states to make an effort to provide background information about their proposed initial submittal and final state plans to these communities in advance of their public hearing. In particular, the EPA encourages states to engage with workers and their representatives in the utility and related sectors, including the EE sector.
The EPA notes that meaningful public involvement goes beyond the holding of a public hearing. The EPA envisions meaningful engagement to include outreach to vulnerable communities, sharing information and soliciting input on state plan development and on any accompanying assessments, such as those described in section IX. The agency uses the terms “vulnerable” and “overburdened” in referring to low-income communities, communities of color, and indigenous populations that are most affected by, and least resilient to, the impacts of climate change, and are central to our community and environmental justice considerations. In section VIII.E, the EPA provides states with examples of resources on how they can engage with vulnerable communities in a meaningful way. With respect specifically to ensuring meaningful community involvement in their public hearing(s), however, the EPA recommends that states have both a Web site and toll-free number that all stakeholders, including overburdened communities, labor unions, and others can access to get more information regarding the upcoming hearing(s) and to get their questions related to upcoming hearings answered. Furthermore, the EPA recommends that states work with their local government partners to help them in reaching out to all stakeholders, including vulnerable communities, about the upcoming public hearing(s).
(7)
Supporting documentation.
The state plan submittal must provide supporting material and technical documentation related to applicable components of the plan submittal.
(a)
Legal authority.
In its submittal, a state must adequately demonstrate that it has the legal authority (regulations/legislation) and funding to implement and enforce each component of the state plan submittal, including federally enforceable emission standards for affected EGUs and state measures. A state can make such a demonstration by providing supporting material related to the state's legal authority used to implement and enforce each component of the plan, such as copies of statutes, regulations, PUC orders, and any other applicable legal instruments. For states participating in a multi-state plan, the submittal(s) must also include as supporting documentation each state's necessary legal authority to implement the portion of the plan that applies within the particular state, such as copies of state regulations and statutes, including a showing that the states have
( printed page 64849)
the necessary authority to enter into a multi-state agreement.
(b)
Technical documentation.
As applicable, the state submittal must include materials necessary to support the EPA's evaluation of the submittal including analytical materials used in the calculation of interim goal steps (if applicable), analytical materials used in the multi-state goal calculation (if multi-state plan), analytical materials used in projecting CO2
emission performance that will be achieved through the plan, relevant implementation materials and any additional technical requirements and guidance the state proposes to use to implement elements of the plan.
(c)
Programmatic plan milestones and timeline.
As part of the state plan supporting documentation, the state must include in its submittal a timeline with all the programmatic plan milestone steps the state will take between the time of the state plan submittal and 2022 to ensure the plan is effective as of January 1, 2022. The programmatic plan milestones and timeline should be appropriate to the overall state plan approach included in the state plan submittal.
(d)
Reliability.
As discussed in more detail in section VIII.G.2, each state must demonstrate as part of its state plan submission that it has considered reliability issues while developing its plan.
b.
Additional components required for the emission standards plan type.
The EPA is finalizing requirements that a final plan submittal using the emission standards plan type must contain the following components, in addition to the components discussed in the preceding section VIII.D.2.a.
(1)
Identification of interim period emission performance rates or state goal (for 2022-2029), interim step performance rates or interim state goals (2022-2024; 2025-2027; 2028-2029) and final emission performance rates or state goal (2030 and beyond).
The state plan submittal must indicate whether the plan is designed to meet the CO2
emission performance rates or the state rate-based or mass-based CO2
emission goal. As noted in the emission guidelines, the EPA is finalizing CO2
emission performance rates for fossil fuel-fired steam generating units and for stationary combustion turbines. The EPA has translated the source category-specific CO2
emission performance rates into equivalent state-level rate-based and mass-based CO2
goals in order to maximize the range of choices that states will have in developing their plans. The state may choose to develop a state plan that meets the CO2
performance rates for the two subcategories of affected EGUs or develop a plan that adopts either the rate-based or the mass-based state CO2
emission goal provided in the emission guidelines.
Each state plan submittal must identify the emission performance rates or rate-based or mass-based CO2
emission goal that must be achieved through the plan (expressed in numeric values, including the units of measurement, such as pounds of CO2
per net MWh of useful energy output or tons of CO2). The plan submittal must identify the CO2
interim period performance rates or state goal (for 2022-2029), interim step performance rates or state goals (interim step performance rates or state goal 1 for 2022-2024; interim step performance rates or state goal 2 for 2025-2027; interim step performance rates or state goal 3 for 2028-2029) and final CO2
emission performance rates or state goal of 2030 and beyond.
The EPA has finalized an interim performance rates or state goal for the interim period of 2022-2029 and a final performance rates or state goal to be met by 2030. For the interim period, the EPA has also finalized three interim step performance rates or state goals: interim step 1 performance rates or state goal for 2022-2024, interim step 2 performance rates or state goal for 2025-2027 and interim step 3 performance rates or state goal for 2028-2029.[824]
States are free to establish different interim step performance rates or interim step state goals than those the EPA has specified in this final rule. If states choose to determine their own interim step performance rates or state goals, the state must demonstrate that the plan will still meet the interim performance rates or state goal for 2022-2029 finalized in the emission guidelines and the plan submittal must include in its supporting documentation a description of the analytic process, tools, methods, and assumptions used to make this demonstration.
For states participating in a multi-state plan with a joint goal (for interim and final periods), the individual state goals in the emission guidelines would be replaced with an equivalent multi-state goal for each period (interim and final). For a rate-based multi-state plan this would be a weighted average rate-based emission goal, derived by the participating states, by calculating a weighted average CO2
emission rate based on the individual rate-based goals for each of the participating states and 2012 generation from affected EGUs. For a mass-based multi-state plan, the joint goal would be a sum of the individual mass-based goals of the participating states, in tons of CO2. The plan submittal must include in its supporting documentation a description of the analytic process, tools, methods, and assumptions used to calculate the joint multi-state goal.
(2)
Identification of federally enforceable emission standards for affected EGUs.
The state plan submittal for an emission standards plan type must include federally enforceable emission standards that apply to affected EGUs. The emission standards must meet the requirement of component (3) of this section, “Demonstrations that each emission standard is quantifiable, non-duplicative, permanent, verifiable, and enforceable.” The plan must identify the affected EGUs to which these standards apply. The compliance periods for each emission standard for affected EGUs, on a calendar year basis, must be as follows for the interim period: January 1, 2022-December 31, 2024; January 1, 2025-December 31, 2027; and January 1, 2028-December 31, 2029. Starting on January 1, 2030, the compliance period for each emission standard is every 2 calendar years. States can choose to set shorter compliance periods for the emission standards than the compliance periods the EPA is finalizing in this rulemaking, but cannot set longer periods. As discussed in more detail in section VIII.F, the EPA recognizes that the compliance periods provided for in this rulemaking are longer than those historically and typically specified in CAA rulemakings. The EPA determined that the longer compliance periods provided for in this rulemaking are acceptable in the context of this specific rulemaking because of the unique characteristics of this rulemaking, including that CO2
is long-lived in the atmosphere, and this rulemaking is focused on performance standards related to those long-term impacts.
For state plans in which affected EGUs may rely upon the use of ERCs for meeting a rate-based federally enforceable emission standard, the state plan must include requirements addressing the issuance, tracking and use for compliance of ERCs consistent with the requirements in the emission guidelines. These requirements are discussed in sections VIII.K.1-2. The state plan must also demonstrate that the appropriate ERC tracking infrastructure that meets the
( printed page 64850)
requirements of the emission guidelines will be in place to administer the state plan requirements regarding ERCs and document the functionality of the tracking system. State plan requirements must include provisions to ensure that ERCs are properly tracked from issuance to submission for compliance. The state plan must also demonstrate that the MWh for which ERCs are issued are properly quantified and verified, through plan requirements for EM&V and verification that meet the requirements in the emission guidelines. EM&V requirements are discussed in section VIII.K.3. Rate-based emission standards must also include monitoring, reporting, and recordkeeping requirements for CO2
emissions and useful energy output for affected EGUs; and related compliance demonstration requirements and mechanisms. These requirements are discussed in more detail in sections VIII.F and VIII.K.
For state plans using a mass-based emission trading program approach, the state plan must include implementation requirements that specify the emission budget and related compliance requirements and mechanisms. These requirements must include: CO2
emission monitoring, reporting, and recordkeeping requirements for affected EGUs; provisions for state allocation of allowances; provisions for tracking of allowances, from issuance through submission for compliance; and the process for affected EGUs to demonstrate compliance (allowance “true-up” with reported CO2
emissions).
(3)
Demonstration that each emission standard is quantifiable, non-duplicative, permanent, verifiable and enforceable.
The plan submittal must demonstrate that each emission standard is quantifiable, non-duplicative, permanent, verifiable and enforceable with respect to an affected EGU, as outlined below.
An emission standard is quantifiable if it can be reliably measured, using technically sound methods, in a manner that can be replicated.[825]
An emission standard is non-duplicative with respect to an affected EGU if it is not already incorporated in another state plan, except in instances where incorporated as part of a multi-state plan. An example of a duplicative emission standard would occur, for example, where a quantified and verified MWh from a wind turbine could be applied in more than one state's CAA section 111(d) plan to adjust the reported CO2
emission rate of an affected EGU (
e.g.,
through issuance and use of an ERC), except in the case of a multi-state plan where CO2
emission performance is demonstrated jointly for all affected EGUs subject to the multi-state plan or where states are implementing coordinated individual plans that allow for the interstate transfer of ERCs.[826]
This does not mean that measures used to comply with an emission standard cannot also be used for other purposes. For example, a MWh of electric generation from a wind turbine could be used by an electric distribution utility to comply with state RPS requirements and also be used by an affected EGU to comply with emission standard requirements under a state plan. Another example is when actions taken pursuant to CAA section 111(d) requirements can satisfy other CAA program requirements (
e.g.,
Regional Haze requirements, MATS).
An emission standard is permanent if the emission standard must be met for each applicable compliance period.
An emission standard is verifiable if adequate monitoring, recordkeeping and reporting requirements are in place to enable the state and the Administrator to independently evaluate, measure, and verify compliance with it.
An emission standard is enforceable if: (1) It represents a technically accurate limitation or requirement and the time period for the limitation or requirement is specified; (2) compliance requirements are clearly defined; (3) the entities responsible for compliance and liable for violations can be identified; and (4) each compliance activity or measure is enforceable as a practical matter in accordance with EPA guidance on practical enforceability,[827]
and the Administrator, the state, and third parties maintain the ability to enforce against affected EGUs for violations and secure appropriate corrective actions, in the case of the Administrator pursuant to CAA sections 113(a)-(h), in the case of a state, pursuant to its state plan, state law or CAA section 304, as applicable, and in the case of third parties, pursuant to CAA section 304.
In developing its CAA section 111(d) plan, to ensure that the plan submittal is enforceable and in conformance with the CAA, a state should follow the EPA's prior guidance on enforceability.[828]
These guidance documents serve as the foundation for the types of monitoring, reporting, and emission standards that the EPA has found can be, as a practical matter, enforced.
In the proposed regulatory text describing the enforcing measures that states must include in state plans, the EPA inadvertently excluded a required demonstration that states and other third parties can enforce against affected EGUs for violations of an emission standard included in a state plan via civil action pursuant to CAA section 304. Commenters noted the EPA's intent to require this demonstration based on statements in both the proposal preamble text and “State Plan Considerations” TSD [829]
and based on the requirements of CAA section 304. We are finalizing a requirement for a demonstration that states and other third parties can enforce against affected EGUs for violations of an emission standard included in a state plan via civil action as part of the required plan component demonstrating enforceability. We are finalizing this requirement as a logical outgrowth of proposal preamble text, the proposal preamble citation to existing enforceability guidance documents that discuss this requirement, comments received, and the clear statutory foundation.
(4)
State reporting requirements.
After consideration of the comments received regarding state reporting
( printed page 64851)
requirements, the EPA is finalizing for state plans using the emission standards approach that a state report is due to the EPA no later than the July 1 following the end of each reporting period. Within the interim period (2022-2029) the EPA is finalizing the following interim reporting periods: Interim step 1 covers the three calendar years 2022-2024, interim step 2 covers the three calendar years 2025-2027, and interim step 3 covers the two calendar years 2028-2029. A biennial state report is required starting in 2030 and beyond covering the two calendar years of each reporting period. This final reporting schedule reduces the reporting frequency for states implementing the emission standards approach and is responsive to comments received that different reporting frequencies may be appropriate for different type of state plans. The EPA believes that because of the federally enforceable emission standards that apply to affected EGUs and their corresponding monitoring, reporting and recordkeeping requirements under the emission standards plan type, a lesser frequency of reporting by the state is warranted.
The state must include in each report to the EPA the status of implementation of emission standards for affected EGUs under the state plan, including current aggregate and individual CO2
emission performance by affected EGUs during the reporting period. The state report must include compliance demonstrations for affected EGUs and identify whether affected EGUs are on schedule to meet the applicable CO2
emission performance rate or emission goal during the performance periods and compliance periods, as specified in the state plan. For rate-based emission trading programs, the report must also include for EPA review the state's review of the administration of their state rate-based emission trading program, as discussed in section VIII.K.2.g.
As discussed in more detail in section VIII.F, the state must include an interim performance check in the report submitted after each of the first two interim step periods. The interim performance check will compare the CO2
emission performance level identified in the state plan for the applicable interim step period with the actual CO2
emission performance achieved by affected EGUs during the period. In the report due to the EPA on July 1, 2030, the state must include a comparison of the actual CO2
emission performance achieved by affected EGUs for the interim period (2022-2029) with the interim CO2
emission performance rates or state rate-based or mass-based CO2
interim goal, as applicable. The report due on July 1, 2030, must also include the actual CO2
emission performance achieved by affected EGUs during the interim step 3 period (2028-2029). Starting in 2032, the biennial state report must include a final performance check to demonstrate that the affected EGUs continue to meet the final CO2
emission performance rates or state rate-based or mass-based CO2
goal.
For state plans that use the emission standards approach and are subject to the corrective measures provisions in the emission guidelines, if actual CO2
emission performance (
i.e.,
the emissions or emission rate) of affected EGUs exceeds the specified level of CO2
emission performance in the state plan by 10 percent or more during the interim step 1 or step 2 reporting periods, the state report must include a notification to the EPA that corrective measures have been triggered. The same notification is required if actual CO2
emission performance fails to meet the specified level of emission performance in the state plan for the 8-year interim performance period or any final plan reporting period. Corrective measures are discussed in detail in section VIII.F.
c.
Additional components required for the state measures approach.
The EPA is finalizing requirements that a final plan submittal using the state measures approach must contain the following components, in addition to the components discussed in section VIII.D.2.a. We note again that states choosing the state measures plan type must use a mass-based state goal for the state measures and any emission standards on the affected EGUs prior to the triggering of the backstop.
(1)
Identification of interim state mass goal (for 2022-2029), interim step state mass goals (2022-2024; 2025-2027; 2028-2029) and final state mass goal (2030 and beyond).
The state plan submittal must identify the mass-based CO2
emission goal that must be achieved through the plan (expressed in tons of CO2). The plan submittal must identify the state CO2
interim period goal (for 2022-2029), interim step goals (interim step goal 1 for 2022-2024; interim step goal 2 for 2025-2027; interim step goal 3 for 2028-2029) and final CO2
emission goal of 2030 and beyond.
For each state, the EPA has finalized an interim goal for the interim period of 2022-2029 and a final goal to be met by 2030. For the interim period, the EPA has also finalized three interim step goals: Interim step 1 goal for 2022-2024, interim step 2 goal for 2025-2027 and interim step 3 goal for 2028-2029.[830]
States are free to establish different interim step goals than those the EPA has specified in this final rule. If states choose to determine their own interim step goals, the state must demonstrate that it will still meet the interim goal for 2022-2029 finalized in this action and the plan submittal must include in its supporting documentation a description of the analytic process, tools, methods, and assumptions used to make this demonstration.
For states participating in a multi-state plan with a joint goal (for interim and final periods), the individual state goals in the emission guidelines would be replaced with an equivalent multi-state goal for each period (interim and final). The joint goal would be a sum of the individual mass-based goals of the participating states, in tons of CO2. The plan submittal must include in its supporting documentation a description of the analytic process, tools, methods, and assumptions used to calculate the joint multi-state goal.
(2)
Identification of federally enforceable emission standards for affected EGUs (if applicable).
If applicable, the state plan submittal must include any federally enforceable CO2
emission standards that apply to affected EGUs, and demonstrate that those emission standards meet the requirements that apply in the context of an emission standards approach, discussed in the preceding section VIII.D.2.b. Specifically, the state plan submittal must demonstrate that each federally enforceable emission standard is quantifiable, non-duplicative, permanent verifiable, and enforceable. If a state measures plan type includes CO2
emission standards that apply to affected EGUs, these emission standards must be federally enforceable.
(3)
Identification of backstop of federally enforceable emission standards.
A state measures plan must include a backstop of federally enforceable emission standards for affected EGUs that fully achieve the interim and final CO2
emission performance rates or the state's interim and final CO2
emission goal if the state plan fails to achieve the intended level of CO2
emission performance. The backstop emission standards could be based on the finalized model rule that the EPA is proposing in a separate action. For the federally enforceable backstop, the state plan submittal must identify the
( printed page 64852)
federally enforceable emission standards for affected EGUs, demonstrate that those emission standards meet the requirements that apply in the context of an emission standards approach, discussed in the preceding section, identify a schedule and trigger for implementation of the backstop that is consistent with the requirements in the emission guidelines as discussed in section VIII.C.3.b and identify all necessary state administrative and technical procedures for implementing the backstop (
e.g.
how and when the state would notify affected EGUs that the backstop has been triggered). Aspects of the backstop are discussed in detail in section VIII.C.3.b.
(4)
Identification of state measures.
A state adopting a state measures plan type must provide as a part of the supporting documentation of its plan submittal, a description of all the state enforceable measures the state will rely upon to achieve the requisite state mass-based goal, the applicable state laws or regulations related to such measures, and identification of parties or entities implementing or complying with such state measures. The state must also include in its supporting documentation the schedule and milestones for the implementation of the state measures, showing that the measures are expected to achieve the mass-based CO2
emission goal for the interim period (including the interim step periods) and meet the final goal by 2030. A state measures plan submittal that relies upon state measures that include RE and demand-side EE programs and projects must also demonstrate in its supporting documentation that the minimum EM&V requirements in the emission guidelines apply to those programs and projects as a matter of state law.
(5)
State reporting requirements.
After consideration of the comments received regarding state reporting requirements, the EPA is requiring in this final rule for states using the state measures approach that an annual state report is due to the EPA no later than July 1 following the end of each calendar year during the interim period. This annual state report must include the status of implementation of federally enforceable emission standards (if applicable) and state measures, and must include a report of the periodic programmatic state measures milestones to show progress in program implementation. The programmatic state measures milestones with specific dates for achievement should be appropriate to the state measures described in the supporting documentation of the state plan submittal. The EPA believes that annual state reporting is appropriate for state measures approach due to the flexibility inherent to the approach described in section VIII.C.3 including the potential use by the state of a wider variety of state measures, responsible parties, etc. This reporting frequency will also increase the degree of certainty on plan performance for states pursuing the state measures approach.
As discussed in section VIII.F, for states using the state measures approach, the EPA is finalizing that at the end of the first two interim step periods, the state must also include in their annual report to the EPA the corresponding emission performance checks. The interim performance checks will compare the CO2
emission performance level identified in the state plan for the applicable interim step period versus the actual CO2
emission performance achieved by the aggregate of affected EGUs. In the report submitted to the EPA on July 1, 2030, the state must also report the actual CO2
performance check for the interim period (2022-2029) with the interim mass-based CO2
goal, as well as the actual CO2
emission performance achieved by affected EGUs during the interim step 3 period (2028-2029).
Beginning with the final period, the state must submit biennial reports no later than July 1 after the end of each reporting period that includes an actual performance check to demonstrate that the state continues to meet the final state CO2
goal.
If, at the time of the state report to the EPA, the state has not met the programmatic state measures milestones for the reporting period, or the performance check shows that the actual CO2
emission performance of affected EGUs warrants implementation of backstop requirements,[831]
the state must include in the state report a notification to the EPA that the backstop has been triggered and describe the steps taken by the state to inform the affected EGUs that the backstop has been triggered. In the event of such an exceedance under the state measures approach, the backstop federally enforceable emission standards for the affected EGUs must be effective within 18 months of the deadline for the state reporting to the EPA on plan implementation and progress toward meeting the emission performance rates or mass-based or rate-based state CO2
emission goal. For example, if a state report due on July 1, 2025, shows that actual CO2
emission performance of affected EGUs is deficient by 10 percent or more relative to the specified level of emission performance for 2022-2024 in the state plan, the backstop federally enforceable emission standards for affected EGUs must be effective as of January 1, 2027.
(6)
Supporting documentation.
(a)
Demonstration that each state measure is quantifiable, non-duplicative, permanent, verifiable and enforceable.
A state using the state measures approach, in support of its plan, must also include in the supporting documentation of the state plan submittal the state measures that are not federally enforceable emission standards, and describe how each state measure is quantifiable, non-duplicative, permanent, verifiable, and enforceable with respect to an affected entity.
A state measure is quantifiable if it can be reliably measured, using technically sound methods, in a manner that can be replicated.
A state measure is non-duplicative with respect to an affected entity if it is not already incorporated as a state measure or an emission standard in another state plan or state plan supporting material, except in instances where incorporated in another state as part of a multi-state plan. This does not mean that measures in a state measure cannot also be used for other purposes. For example actions taken pursuant to CAA section 111(d) requirements can satisfy other CAA program requirements (
e.g.,
Regional Haze requirements, MATS) and state requirements (
e.g.,
RPS).
A state measure is permanent if the state measure must be met for each applicable compliance period.
A state measure is verifiable if adequate monitoring, recordkeeping and reporting requirements are in place to enable the state to independently evaluate, measure and verify compliance with it.
A state measure is enforceable [832]
if: (1) It represents a technically accurate limitation or requirement and the time period for the limitation or requirement
( printed page 64853)
is specified; (2) compliance requirements are clearly defined; (3) the affected entities responsible for compliance and liable for violations can be identified; and (4) each compliance activity or measure is practically enforceable in accordance with EPA guidance on practical enforceability,[833]
and the state maintains the ability to enforce against affected EGUs for violations and secure appropriate corrective actions pursuant to its plan or state law.
The EPA will disapprove a state plan if the documentation is not sufficient for the EPA to be able to determine whether the state measures are expected to yield CO2
emission reductions sufficient to result in the necessary CO2
emission performance from affected EGUs for the mass-based state CO2
emission goal to be achieved.
d.
Legal basis for the components.
(1)
General legal basis.
Under section 111(d), state plans must “provide for the implementation and enforcement of [the] standards of performance.” Similar language occurs elsewhere in the CAA. First, for SIPs, section 110(a)(1) requires SIPs to “provide for implementation, maintenance, and enforcement” of the NAAQS. However, section 110(a)(2), unlike 111(d), details a number of specific requirements for SIPs that, in part, speak exactly to how a SIP should “provide for implementation, maintenance, and enforcement” of the NAAQS. We note that section 111(d) provides explicitly only that the “procedures,” and not the substantive requirements, for section 111(d) state plans should be “similar” to those in section 110, and thus a substantive requirement in section 110(a)(2) is not an independent source of authority for the EPA to require the same for section 111(d) plans. However, when there is a gap for the EPA to fill in interpreting how a section 111(d) plan should “provide for implementation and enforcement of [the] standards of performance,” and Congress explicitly addressed a similar gap in section 110, then it may be reasonable for the EPA to fill the gap in section 111(d) using an analogous mechanism to that in section 110(a)(2), to the extent that the section 110(a)(2) requirement makes sense and is reasonable in the context of section 111(d). On the other hand, that Congress did not explicitly provide such details as are found in section 110(a)(2) indicates that Congress intended to give the EPA considerable leeway in interpreting the ambiguous phrase “provides for implementation and enforcement of [the] standards of performance.”
For example, section 110(a)(2)(E)(i) explicitly requires states to provide necessary assurances that they have adequate personnel, funding and authority to carry out the SIP. Section 111(d), on the other hand, does not explicitly contain this requirement. Thus, there is a gap to fill with respect to this issue when the EPA interprets section 111(d)'s requirement that plans “provide for implementation and enforcement” of the standards of performance, and it is reasonable for the EPA to fill the gap by requiring adequate funding and authority, both because adequate funding and authority are fundamental prerequisites to adequate implementation and enforcement of any program, and because Congress has explicitly recognized this fundamental nature in the section 110 context.[834]
We note two other places where the CAA requires a state program to satisfy similar language regarding implementation and enforcement. First, section 112(l)(1) allows states to adopt and submit a program for “implementation and enforcement” of section 112 standards. Section 112(l)(5) further provides that the program must (among other things) have adequate authority to enforce against sources, and adequate authority and resources to implement the program. Second, section 111(c) provides that, if a state develops and submits “adequate procedures” for “implementing and enforcing” section 111(b) standards of performance for new sources in that state, the Administrator shall delegate to the state the Administrator's authority to “implement and enforce” those standards. The EPA has interpreted these ambiguous provisions in the EPA's “Good Practices Manual for Delegation of NSPS and NESHAPS” and recommended (in the context of guidance) that state programs have a number of components, such as source monitoring, recordkeeping, and reporting, in order to adequately implement and enforce section 111(b) or 112 standards. This again indicates it is reasonable for the EPA to fill a gap in section 111(d)'s language and similarly require source monitoring, recordkeeping, and reporting, as these are fundamental to implementing and enforcing standards of performance that achieve the state performance rates or goals.
Some commenters argued that states have primary authority over the content of state plans and that the EPA lacks authority to disapprove a state plan as unsatisfactory simply because it lacks one or more of these components. We disagree. The EPA has the authority to interpret the statutory language of section 111(d) and to make rules that effectuate that interpretation. With respect to the components of an approvable plan, we are interpreting the statutory phrase “provide for implementation and enforcement” and making rules that set out the minimum elements that are necessary for a state plan to be “satisfactory” in meeting this statutory requirement. This does not in any way intrude on the state's ability to decide what mix of measures should be used to achieve the necessary emission reductions. Nor does it intrude in any way on the state's ability to decide how to satisfy a component. For example, for legal authority, we are not dictating which state agencies or officials must specifically have the necessary legal authority; that is entirely up to the state so long as the fundamental requirement to have adequate legal authority to implement and enforce the plan is met.
In addition, the EPA has already determined in the 1975 implementing regulations that certain components, such as monitoring, recordkeeping, and reporting, are necessary for implementation and enforcement of section 111(d) standards of performance. 40 FR 53340, 53348/1 (Nov. 17, 1975). Thus, EPA's position here is hardly novel. The EPA notes in discussing the implementing regulations, nothing in this final rule reopens provisions or issues that were previously decided in the original promulgation of the regulations unless otherwise explicitly reopened for this rule.
(2)
Legal considerations with changes to affected EGUs.
In the proposed rulemaking, the EPA proposed the interpretation that if an existing source is subject to a section 111(d) state plan, and then undertakes a modification or reconstruction, the source remains subject to the state plan, while also becoming subject to the modification or reconstruction
( printed page 64854)
requirements. 79 FR 34830, 34903-4. The EPA is not finalizing a position on this issue in this final rule, and is re-proposing and taking comment on this issue through the federal plan rulemaking being proposed concurrently with this action. The EPA's deferral of action on this issue does not impact states' and affected EGUs' pending obligations under this final rule relating to plan submission deadlines, as this issue concerns potential obligations or impacts after an existing source is subject to the requirements of a state plan. The EPA will propose and finalize its position on this issue through the federal plan rulemaking, which will be well in advance of the plan performance period beginning in 2022, at which point state plan obligations on existing sources are effectuated.
(3)
Legal considerations regarding design, equipment, work practice or operational standards.
In the proposal, the EPA asked for comment on three approaches to inclusion of design, equipment, work practice and operational standards in section 111(d) plans. 79 FR 34830, 34926/3 (June 18, 2014). Under the first approach, states would be precluded from including these standards in section 111(d) plans unless the design, equipment, work practice or operational standard could be understood as a “standard of performance” or could be understood to “provide for implementation and enforcement” of standards of performance. We also asked, for the first approach, whether it was even possible, given the statutory language of 111(h), to consider a design, equipment, work practice or operational standard as a “standard of performance.” Under the second approach, states could include design, equipment, work practice or operational standards in the event that it could be shown a “standard of performance” was not feasible, as set out in section 111(h). Under the third approach, a state could include design, equipment, work practice and operational standards in a 111(d) plan without any constraints. We also asked whether, if there was legal uncertainty as to the status of these standards, the EPA should authorize states to include them in their 111(d) plans with the understanding that if the EPA's authorization were invalidated by a court, states would have to revise their plans accordingly.
The EPA is finalizing the first approach. Specifically, a state's standards of performance (in other words, either the federally enforceable backstop under the state measures approach or the emission standards under the emission standards approach) cannot consist of (in whole or part) design, equipment, work practice or operational standards. A state may include such standards in a 111(d) plan in order to implement the standards of performance. For example, a state taking a mass-based approach may include in its 111(d) plan a limit on hours of operation on a particular affected EGU, but that operational standard itself cannot substitute for a mass-based emission standard on the affected EGU.[835]
This follows from the statute. First, section 111(h)(1) authorizes the Administrator, when it is not feasible for certain reasons (specified in 111(h)(2)) to prescribe or enforce a standard of performance, to instead promulgate a design, equipment, work practice or operational standard. If a standard of performance could include design, equipment, work practice or operational standards, such authority would be unnecessary. Second, 111(h)(5) states that design, equipment, work practice or operational standards “described in” 111(h) shall be treated as standards of performance for the purposes of the CAA. This creates a strong inference that standards of performance otherwise should not include design, equipment, work practice, or operational standards. Finally, the general definition of “standard of performance” in section 302(l) is similar to the definition of “emission limitation” (or “emission standard”) in section 302(k), with the exception that the definition of “emission limitation” explicitly includes design, equipment, work practice and operational standards, but the definition of “standard of performance” omits them. Thus, as with our discussion of the term “standard of performance” above in VIII.C.6.b, even if the general definition of “standard of performance” in 302(l) applies to 111(d), the omission of design, equipment, work practice, and operational standards in 302(l) confirms our interpretation that they cannot be a 111 “standard of performance” (except under the limited circumstances in 111(h)). We conclude that it is reasonable, and perhaps compelled, to interpret the term “standards of performance” in 111(d) to not include design, equipment, work practice and operational standards.
However, section 111(d) requires plans to “provide for implementation and enforcement of [the] standards of performance.” This language does not explicitly prohibit a plan from including design, equipment, work practice and operational standards, and allows for them to be included so long as they are understood to provide for implementation of the standards of performance. If they are included, the 111(d) plan must still be “satisfactory” in other respects, in particular in establishing standards of performance that are not in whole or in part design, equipment, work practice, and operational standards.
(4)
Legal basis for engagement with communities.
As previously discussed, section 111(d)(1) requires the EPA to promulgate procedures “similar” to those in section 110 under which states adopt and submit 111(d) plans. Section 110(a)(1) requires states to adopt and submit implementation plans “after reasonable notice and public hearings.” The implementing regulations under 40 CFR 60.27 reflect similar public participation requirements with respect to section 111(d) state plans. The EPA is sensitive to the legal importance of adequate public participation in the state plan process, including public participation by affected communities. As previously discussed in this rule, recent studies also find that certain communities, including low-income communities and some communities of color, are disproportionately affected by certain climate change-related impacts. Because certain communities have a potential likelihood to be impacted by state plans for this rule, the EPA believes that the existing public participation requirements under 40 CFR 60.23 are effectuated for the purposes of this final rule by states engaging in meaningful, active ways with such communities. By requiring states to demonstrate how they have meaningfully engaged with vulnerable communities potentially impacted by state plans as part of the state plan development process, states meeting this requirement will satisfy the applicable statutory and regulatory requirements regarding public participation.
3. Components of the Federally Approved State Plan
In this action the EPA finalizes that, to be fully approved, a state plan submittal must meet the criteria and include the required components described above. The EPA will propose and take final action on each state plan submittal in the
Federal Register
and provide an opportunity for notice and comment. When a state plan submittal
( printed page 64855)
is approved by the EPA, the EPA will codify the approved 111(d) state plan in 40 CFR part 62. The following components of the state plan submittal will become the federally enforceable state 111(d) plan:
Federally enforceable emission standards for affected EGUs
Federally enforceable backstop of emission standards for affected EGUs
Implementing and enforcing measures for federally enforceable emission standards including EGU monitoring, recordkeeping and reporting requirements
State recordkeeping and reporting requirements
E. State Plan Submittal and Approval Process and Timing
1. Overview
In this action the EPA is finalizing that state plan submittals are due on September 6, 2016, with the option of an extension to submit final state plans by September 6, 2018, which is 3 years after finalization of this rule. The compelling nature of the climate change challenge, and the need to begin promptly what will be a lengthy effort to implement the requirements of these guidelines, warrant this schedule. The EPA also believes, for reasons further described in the next section, why this schedule is achievable for states to submit final plans. We discuss the timing of state plans in more detail in this section below.
Discussed in the following sections are state plan submittal and timing, required components for initial submittals and the 2017 update, multi-state plan submissions, process for EPA review of state plans, failure to submit a plan, state plan modifications (including modifications to interim and final CO2
emission goals), plan templates and electronic submittal, and legal bases regarding state plan process.
2. State Plan Submittal and Timing
The implementing regulations (40 CFR 60.23) require that state plans be submitted to the EPA within 9 months of promulgation of the emission guidelines, unless the EPA specifies otherwise.[836]
For these 111(d) guidelines, the EPA is finalizing that each state must by September 6, 2016, either submit a final plan submittal or seek an extension to submit a final plan by September 6, 2018. In the case of a state electing to participate in the CEIP, this 2016 submittal must include a non-binding statement of intent to participate in the program. To seek an extension of the September 6, 2016 deadline until no later than September 6, 2018, a state must submit an initial submittal by September 6, 2016, that addresses three required components sufficiently to demonstrate that a state is able to undertake steps and processes necessary to timely submit a final plan by the extended date of September 6, 2018. If an extension is requested and granted, states must also submit a 2017 update by September 6, 2017, that documents the state's continued progress towards meeting the September 6, 2018 final plan submittal deadline.
In the proposal, EPA proposed a 13 month final state plan submittal deadline, with a 1 year possible extension for states submitting individual state plans and a 2 year possible extension for states submitting multi-state plans as part of a multi-state region. The EPA received substantive comment on the achievability of these proposed deadlines for state plan submittals. Multiple commenters expressed concern that due to timing of legislative cycles (some of which are every 2 years), regulatory processes, and other necessary tasks, states would find it extremely difficult to submit plans in 1 or 2 years, whether or not they were planning to submit as part of a multi-state region. The EPA agrees based on this input that a schedule shorter than 3 years will be challenging for many—though not all—states. In light of the comments received and in order to provide maximum flexibility to states while still taking timely action to reduce CO2
emissions, in this final rule the EPA is allowing for a 2 year extension until September 6, 2018, for both individual and multi-state plans, to provide a total of 3 years for states to submit a final plan if an extension is received. Based on comments received, information the EPA has regarding steps states have already begun taking towards plan development, and extensive experience with similar state plan submission deadlines under CAA section 110 SIPs, the EPA believes states will be able to submit final plans within 3 years by September 6, 2018, in the event states are not required to submit a final plan by September 6, 2016. We address the substantive requirements of initial submittals and the 2017 update in the next section. States that receive 2-year extensions may submit the final plan earlier than September 6, 2018, if they so choose.
The EPA highlights that one purpose of the initial submittal is to encourage and potentially facilitate states to do necessary planning and engagement with stakeholders so states are able to submit an approvable final state plan by the extended deadline of September 6, 2018. Some states have well-developed existing programs and the attendant legal authority underpinning such programs to more easily meet the September 6, 2016 deadline by submitting a final plan which largely contains or relies upon such existing programs.[837]
Based on comments and stakeholder feedback, however, the EPA anticipates that many states intending to develop and submit a final plan will seek the optional extension given the time it may take to undergo necessary legislative, stakeholder, and planning processes. The EPA acknowledges that the initial submittal of September 6, 2016, is not essential to the ability of states to submit final plans by September 6, 2018, so that even without this 2016 deadline, the EPA could require states to meet the 2018 deadline. Even so, this earlier date in the 3 year planning process serves as a useful “check-in” that provides several significant advantages. First, this earlier date provides all states an opportunity to understand what approaches other states are considering. Because there are significant benefits to regional cooperation, the EPA believes that a formal process to collect and then provide this information will help all states develop better plans. Second, because the guidelines provide significant flexibility, the ability for the EPA to provide early input to states who may be pursuing more innovative approaches will help ensure that all state plans are ultimately approvable. The EPA therefore believes the initial submittal is an appropriate means by which to offer the optional extension, and for reasons further described in section VIII.E.3, that the requirements of the initial submittal are achievable by September 6, 2016, so states will be able to develop and submit a plan that meets the requirements of the final emission guidelines and section 111(d) of the CAA by the extended date.
Additionally, some states may not submit a state plan as required by the final emission guidelines and section 111(d) of the CAA. For states that do not submit a state plan, the CAA gives the EPA express authority to implement a federal plan for sources in that state upon determination by the EPA that a state has failed to submit a state plan by the required date. For states that do not intend to submit a state plan to meet the obligations of this final rule, by promulgating a federal plan for affected EGUs in states that do not submit a plan by September 6, 2016, such affected EGUs would have a maximum of an
( printed page 64856)
additional 2 years to plan for and determine compliance strategies than had promulgation of a federal plan been predicated on states failing to submit a plan by September 6, 2018. The EPA also notes that this final rule affords states and affected EGUs with many implementation flexibilities and approaches for state plans that the EPA itself may not have the authority to implement through a federal plan. Therefore, affected EGUs subject to a federal plan promulgated for a state that refuses to submit a state plan may benefit from an additional 2 years to plan for compliance with a federal plan with potentially fewer flexibilities.
If no affected EGU is located within a state, the state must submit a letter to the EPA certifying that no such facilities exist by September 6, 2016.[838]
The EPA will publish a notice in the
Federal Register
to notify the public of receipt of such letters. If an affected EGU is later found to be located in that state, the state must submit a final plan addressing such affected EGU or the EPA will determine the state has failed to submit a plan as required by the emission guidelines and CAA section 111(d), and begin the process of implementing a federal plan for that affected EGU.
In the case of a tribe that has one or more affected EGUs located in its area of Indian country, if the tribe either does not submit a CAA section 111(d) plan or does not receive EPA approval of a submitted plan, the EPA has the responsibility to establish a CAA section 111(d) plan for that area if it determines that such a plan is necessary or appropriate to protect air quality.[839]
See the proposed federal plan rulemaking for further information.
The EPA notes that the current implementing regulations at 40 CFR part 60 do not specify who has the authority to make a formal submission of the state plan to the EPA for review. In order to clarify who on behalf of a state is authorized to submit an initial submittal, 2017 update, final state plan (or negative declaration, if applicable), and any revisions to an approved plan, the EPA has included a requirement in this final rule mirroring that of the requirement in 40 CFR part 51 App. V.2.1.(a) with respect to SIPs that identifies the Governor of a state as the authorized official for submitting the state plan to the EPA. If the Governor wishes to designate another responsible official the authority to submit a state plan, the EPA must be notified via letter from the Governor prior to the 2016 deadline for plan submittal so that they have the ability to submit the initial submittal or final plan in the State Plan Electronic Collection System (SPeCS). If the Governor has previously delegated authority to make CAA submittals on the Governor's behalf, a state may submit documentation of the delegation in lieu of a letter from the Governor. The letter or documentation must identify the designee to whom authority is being designated and must include the name and contact information for the designee and also identify the state plan preparers who will need access to SPeCS discussed in section VIII.E.8. A state may also submit the names of the state plan preparers via a separate letter prior to the designation letter from the Governor in order to expedite the state plan administrative process. Required contact information for the designee and preparers includes the person's title, organization and email address. The EPA recommends this information be submitted early in the state planning process to allow sufficient time for completion of SPeCS registration so that those authorized to use the system are provided access.
3. Components of an Initial Submittal and 2017 Update
As noted, states may request a 2-year extension to submit a final plan through making an initial submittal by September 6, 2016. For the extension to be granted, the EPA is finalizing that the initial submittal must address three required components sufficiently to demonstrate that a state is able to undertake steps and processes necessary to timely submit a final plan by the extended date of September 6, 2018: [840]
An identification of final plan approach or approaches under consideration, including a description of progress made to date.
An appropriate explanation for why the state requires additional time to submit a final plan by September 6, 2018.
Demonstration or description of opportunity for public comment on the initial submittal and meaningful engagement with stakeholders,[841]
including vulnerable communities, during the time in preparation of the initial submittal and plans for engagement during development of the final plan.
During the public comment period, multiple commenters stated that the proposed timeframe for states to submit an initial submittal was not achievable, citing, among other things, the number of decisions needed to be made by a state or states, and that the EPA needed to clarify the requirements for an initial submittal. Multiple commenters also expressed concern that the requirements for an initial submittal required final decisions to be made by states, and that the initial submittal deadline was not enough time for states to make these decisions.
It is important to note that the EPA is not requiring the adoption of any enforceable measures or final decisions in order for the state to address any of the initial submittal components by September 6, 2016. The EPA believes the absence of requiring enforceable measures to be included with the initial submittal greatly supports the ability of states intending to develop a final state plan to submit an initial submittal by September 6, 2016. States are required to submit enforceable measures supported by technically complex documentation, such as modeling, and adopted through state public participation and regulatory or legislative processes as part of SIPs under other parts of the CAA within timeframes comparable to the time the EPA is providing for initial submittals.[842]
In order to further address the commenters' concerns regarding possible ambiguity of the requirements for an initial submittal so that an extension is granted, the EPA is providing clarity regarding the required components for an initial submittal. Regarding the component that states address an appropriate explanation for an extension, the EPA proposed that appropriate explanations for seeking an extension beyond 2016 for submitting a final plan include: A state's required schedule for legislative approval and administrative rulemaking, the need for multi-state coordination in the development of an individual state plan, or the process and coordination necessary to develop a multi-state plan. In this final rule, the EPA is finalizing these as appropriate explanations for seeking an extension beyond 2016, but makes clear—as explained further below—that other appropriate explanations will be acceptable as well. It is important to note that the initial submittal does not require legislation
( printed page 64857)
and/or regulations to be passed prior in order for the state to be granted an extension, but the initial submittal should describe any concrete steps the state has already taken on legislation and/or administrative rulemaking and detail what the remaining steps are in those processes before a final plan can be submitted. The EPA also sought comment on other circumstances for which an extension of time would be appropriate, and also whether some explanations for extensions should not be permitted. Commenters stated that states should be able to seek extensions whenever an extension can be reasonably justified, and that the EPA should take at face value states' good faith efforts by accepting any state assertion that more time is needed to develop a plan unless there is clear evidence to the contrary. The EPA believes there may be appropriate explanations states may submit in addition to the ones described in this final rule sufficient to demonstrate that a state is able to undertake steps and processes necessary to timely submit a final plan by the extended date of September 6, 2018. Given the opportunity for states to submit appropriate explanations other than the ones detailed here, the EPA believes addressing this component requiring an appropriate explanation for an extension is easily achievable by September 6, 2016.
In order to additionally clarify the required components of the initial submittal, the following are types of explanations of information states may provide as part of the initial submittal to sufficiently address each of the three required components for getting an extension:
Details on whether a state is considering a single or multi-state plan, a plan that meets the CO2
emission performance rates or state CO2
rate or mass emission goal, and/or an emission standards or state measures plan type.
A description of how the state intends to address development of the required components of the final state plan, including describing what actions have already been taken, what steps remain, and the schedule for completing those steps.
A commitment to maintain any existing measures the state intends to rely upon for its final plan in order to achieve the necessary reductions once the performance period begins.
Describing public participation opportunities such as stakeholder and community meetings, or public hearings, throughout the 3 year plan development process. This could also include leverage of public participation approaches that states already use to identify and engage potentially affected communities.
The EPA emphasizes the required initial submittal components are intended to provide a reasonable pathway for states to demonstrate whether they will be able to submit an approvable plan by the extended date of September 6, 2018. The EPA also anticipates that through the requirement to address these components, the initial submittal will also facilitate state planning and stakeholder engagement, particularly as one component requires the public and stakeholders to have an opportunity to comment on the initial submittal. As previously described, these components do not require final decisions to be made by states, and this is further illustrated by the clarifications on how states may meet each of the three required components. Accordingly, the EPA believes none of these components is onerous for states to address in an initial submittal by the September 6, 2016 deadline. To further underscore this point, the EPA is further explaining the clarifying examples listed above of how states may address the three required components, and highlighting the achievability of these examples for states to address through the initial submittal by September 6, 2016.
For identification of the final plan approach or approaches the state is considering, and description of progress made to date, states could identify whether the state is considering the option of the CO2
emission performance rates, a rate-based CO2
goal, or a mass-based CO2
goal, and whether the state is intending to pursue a single-state or multi-state plan. Stakeholders commented that states will not be far enough along in the rule development process to have made these decisions. Commenters also stated that many state legislatures would need to pass legislation giving state environmental agencies legal authority and direction before they could begin to make decisions such as rate or mass-based approach or single or multi-state plan submittal. In order to address the commenters' concerns, the EPA wishes to clarify that state approaches identified in the initial submittal do not need to be final and/or formalized through a state legislature, and that states may opt to identify pursuit of more than one approach at the same time, or to indicate the status of the deliberation of this issue within the state.
The EPA received substantive comment regarding the potential adverse consequences for states pursuing a multi-state approach and receiving an extension until 2018, where, for various reasons, a state or states then decide(s) to pursue the single state approach. Commenters viewed this as being potentially problematic since, as proposed, a single state could only receive an extension until 2017, and if a multi-state plan effort does not work out the deadline for seeking the extension until 2017 would have passed. The EPA notes finalizing a 2 year extension that is available for any state, whether they are pursuing an individual state plan or a multi-state plan resolves the commenters' concern about conflicting extension deadlines if states involved in a multi-state effort decide not to pursue the multi-state approach. Importantly, such identification in an initial submittal does not obligate the state to then actually adopt that approach in their final plan as the EPA acknowledges that based on state processes and public input through plan development during the extended submission period, a state may end up adopting a state plan approach more suitable to the needs of that state and its affected EGUs than previously identified in the initial submittal.
States can also describe progress made to date by identifying steps already taken to address development of the final state plan, as the EPA recognizes that states in general have already taken a number of steps to prepare for state plan development to meet the obligations of this rule. For example, since proposal, states have: Begun exploring tradeoffs among various state plan approaches such as individual versus multistate coordination, increased utilization of demand-side EE and RE programs, and implementing rate-based versus mass-based programs; increased their understanding of existing state programs and policies that reduce carbon emissions; built relationships and communications between key state institutions such as environmental agencies, PUCs, governors' offices, and energy regulators; hosted public stakeholder meetings to educate and solicit input from the public; and begun discussing state processes for developing potential state plans. States may meet the first required component by describing steps such as these already undertaken.
The EPA underscores that states may easily address the first component of the initial submittal by describing such steps, and also address the second required component by identifying next steps (which may be a natural extension of these already implemented activities), and laying out a schedule for development of a final plan. States that have taken these steps would especially
( printed page 64858)
be able to address the component regarding an appropriate explanation for an extension as the EPA recognizes the substantial work such states have begun to put towards development of state plans, and the continuation of this work justifies additional time to complete necessary steps to result in an approvable state plan. The EPA emphasizes that for states who intend to submit a final plan and need an extension, the components of the initial submittal are not intended to require burdensome final action by states by September 6, 2016, but to identify a viable path to completing a final plan by September 6, 2018.
An initial submittal that contains a commitment to maintain any existing measures the state intends to rely upon for its final plan in order to get the necessary reductions once the performance period begins (
e.g.
RE standards and demand-side EE programs the state intends to rely upon through a state measures plan type), at least until the final plan is approved, also addresses the requirement that states provide an appropriate explanation for an extension. Given the state's request for additional time prior to putting in place enforceable measures to reduce CO2,
it would be reasonable and appropriate, and in keeping with the goals of 111(d) to ensure that any existing CO2
reduction measures that the state intends to rely upon remain in place while the state is developing a final plan. Such commitment would demonstrate that the state is taking substantive steps towards successful development of a final plan within 3 years.
Regarding the required public participation component of the initial submittal, the EPA believes this requirement is both achievable for states to submit an initial submittal by the September 6, 2016 deadline, and provides a benefit in facilitating state plan development so that states are more likely to be able to submit a final plan within 3 years if the extension is granted. The EPA can use a comment opportunity on the initial submittal to advise the state whether aspects of the draft initial submittal and overall plan development are appropriate for purposes of meeting the requirements of the final rule so that the state will be able to procure the extension through an acceptable initial submittal and submit a final plan by the extended deadline. The EPA notes the comment period on the initial submittal is only one opportunity the EPA has to assist a state in the state plan development process. The EPA has historically worked with states throughout the state plan development process to help ensure that the state plan is approvable once submitted to the EPA, and expects this level of engagement with states to continue throughout the plan development process. This requirement will also facilitate early identification of concerns stakeholders and the public may have with aspects of a final plan the state is considering. As states have longtime and extensive experience with responding to public comments in numerous contexts, including in the context of other CAA programs such as section 110 SIP development and in permit issuance under NSR and Title V, the EPA anticipates states will be able to timely address the initial submittal public participation.
As previously discussed, because certain communities have a potential likelihood to be impacted by state plans, the EPA believes that the existing public participation requirements under 40 CFR 60.23 are effectuated for the purposes of this final rule by states engaging in meaningful, active ways with such communities. Therefore, the public participation component of the initial submittal includes meaningful engagement with vulnerable communities, throughout the state plan development process and including through the initial submittal. In order to demonstrate to the EPA that states are actively engaging with communities, states could provide in their initial submittal a summary of steps they have already taken to engage the public and how they intend to continue meaningful engagement, including with vulnerable communities, during the additional time (if an extension is granted) for development of the final plan. In addition to approaches that states already use to identify and engage potentially affected communities, the EPA encourages states to use the proximity analysis conducted for this rulemaking (which is described in section IX.A) as a tool to help them identify overburdened communities that could be potentially impacted by their plans. Other tools, such as EJ screen, can also be helpful. The EPA in its continued outreach with states during the implementation phase will also provide resources to assist them in engaging with communities. The EPA believes that through the provision of these resources states will also more easily be able to address this required component of the initial submittal regarding public engagement, including with vulnerable communities, by September 6, 2016.
In addition to the resources the EPA intends to provide to states, there are existing resources states can take advantage of to address this component as well. On the steps that states could take to engage vulnerable communities in a meaningful way, the Agency recommends that states consult the EPA's May 2015
Guidance on Considering Environmental Justice During the Development of Regulatory Actions.
In this document, the EPA defines meaningful involvement as ensuring that “potentially affected community members have an appropriate opportunity to participate in decisions about a proposed activity (
i.e.,
rulemaking) that may affect their environment and/or health; the population's contribution can influence the EPA's [regulatory authority's] rulemaking decisions; the concerns of all participants involved will be considered in the decision-making process; and the EPA [decision-makers] will seek out and facilitate the involvement of those potentially affected by the EPA's [or other regulatory authority's] rulemaking process.” [843]
Additionally, this guidance document also encourages those writing rules to consider the positive impacts that a rulemaking will have on communities).[844]
Another resource that the EPA recommends that states consult when devising their state plans is the document “Considering Environmental Justice in Permitting” available on the agency's Web site.[845]
Both of the resources discussed above can add to what states may already have in place to effectively engage vulnerable communities in the rulemaking process.
The EPA recommends that as part of their meaningful engagement with vulnerable communities, states work with communities to ensure that they have a clear understanding of the benefits and any potential adverse impacts that a state plan might have on their overburdened communities and that there is a clear process for states to respond to input from communities.
If a state seeks an extension by submitting an appropriate initial submittal addressing the three required components as described above by September 6, 2016, the EPA will review the submittal. If the state does not submit an initial submittal by September 6, 2016, that contains the three required components, the EPA
( printed page 64859)
will notify the state by letter, within 90 days, that the agency cannot grant the extension request based the state's initial submittal. The EPA will notify a state by letter only if the initial submittal does not address the three required components. An extension for submitting a final plan will be deemed granted if the EPA does not deny the extension request based on the initial submittal. The EPA has determined this approach is authorized by, and consistent with, 40 CFR 60.27(a) of the implementing regulations.
For states that request and receive a 2-year extension, the state must submit an update halfway through that extension, by September 6, 2017. In the proposal the EPA included a requirement regarding a 2017 check in. Because the EPA is finalizing that states are able to get a 2-year extension regardless of whether they are submitting an individual or multi state final plan, the EPA believes it appropriate to ensure through the 2017 update that the state is making continuous progress on its initial submittal and that it is on track to meet the final plan submittal deadline of September 6, 2018. The EPA will also be able to use the information provided through the 2017 update to further assist states in plan development.
The final rule requires that states address in the 2017 update the following components:
A summary of the status with respect to required components of the final plan, including a list of which components are not yet complete.
A commitment to a plan approach (e.g.,
single or multi-state, rate or mass emission performance level), including draft or proposed legislation and/or regulations.
An updated comprehensive roadmap with a schedule and milestones for completing the plan, including progress to date in developing a final plan and steps taken in furtherance of actions needed to finalize a final plan.
In order to assess whether a state is on track to submit a final plan by the 2018 extension deadline, the EPA is requiring that the 2017 update must contain a progress update on components from the initial submittal and a list of which final plan components are still not complete.
The EPA is also requiring that the 2017 update include a commitment to the type of plan approach the state will take in the final plan submittal. During the public comment period, many commenters stated that legislative action would be required to enact this final rule at the state level, and that the proposal did not provide enough time for legislative action or other regulatory actions needed for a state to be granted an extension. In order to respond to these comments, the EPA is clarifying that proposed or passed legislation or regulations are not required in the initial submittal due by September 6, 2016. While a state may indicate consideration of multiple state plan approaches in the initial submittal, the EPA is requiring that the state commit to one approach in the 2017 update. This commitment must include draft or proposed legislation or regulations that must become final at the state level prior to submitting a final plan submittal to the EPA. While commenters expressed concern with not being able to have legislation enacted in time to receive an extension until 2018, the EPA has determined that 2 years is a reasonable timeframe for a state to decide on the type of approach it will take in the final plan submittal and to draft legislation or regulations for this approach in order to timely meet the extended September 6, 2018 deadline.
4. Multi-State Plan Submittals
For states wishing to participate in a multi-state plan, the EPA is finalizing three forms of submittal that states may choose for the submittal of a multi-state plan.
First, the EPA is finalizing its proposed approach where one multi-state plan submittal is made on behalf of all participating states. The joint submittal must be signed by authorized officials for each of the states participating in the multi-state plan and would have the same legal effect as an individual submittal for each participating state. The joint submittal must adequately address plan components that apply jointly for all participating states and for each individual state in the multi-state plan, including necessary state legal authority to implement the plan, such as state regulations and statutes. Because the multi-state plan functions as a single plan, each of the required plan components (
e.g.,
plan emission goals, program implementation milestones, emission performance checks, and reporting) would be designed and implemented by the participating states on a multi-state basis.
The EPA received comments from states requesting flexibility for multi-state plan submittals. In response to these comments, the EPA is also finalizing two additional options on which it solicited comment. First, states participating in a multi-state plan can provide a single submittal—signed by authorized officials from each participating state—that addresses common plan elements. This option requires individual participating states to provide supplemental individual submittals that provide state-specific elements of the multi-state plan. The common multi-state submittal must address all relevant common plan elements and each individual participating state submittal must address all required plan components (including common plan elements, even if only through cross reference to the common plan submittal). Under this approach, the combined common submittal and each of the individual participating state submittals would constitute the multi-state plan submitted for EPA review. The joint common submittal must be signed by authorized officials for each of the states participating in the multi-state plan and would have the same legal effect as an individual submittal for each participating state.
Second, the EPA is finalizing an approach where all states participating in a multi-state plan separately make individual submittals that address all elements of the multi-state plan. These submittals would need to be materially consistent for all common plan elements that apply to all participating states, and would also address individual state-specific aspects of the multi-state plan. Each individual state plan submittal would need to address all required plan components. The EPA encourages states participating in this type of multi-state plan to use as much common material as possible to ease review of the state plans.
These approaches will provide states with flexibility in addressing contingencies where one or more states submit plan components that are not approvable. In such instances, these options simplify the EPA's approval of remaining common or individual portions of a multi-state plan and help address contingencies during plan development where a state fails to finalize its participation in a multi-state plan, with minimal disruption to the submittals of the remaining participating states. These additional submittal approaches also facilitate multi-state plans where the participating states are coordinating the implementation of their plans but are not taking on a joint multi-state emission goal for affected EGUs. For example, states may seek to engage in a multi-state approach that links rate-based or mass-based emission trading programs through appropriate authorizations (
e.g.
reciprocity agreements, or state regulations) that allow affected EGUs to use emission allowances or RE/EE credits issued in
( printed page 64860)
one state for compliance with an emission standard in another state.
In order to avoid a multi-state plan becoming unapprovable due to one state submitting an unapprovable portion of a multi-state plan, withdrawing from the multi-state plan, or failing to implement the multi-state plan, states may include express severability clauses if their multi-state plan is able to stand without further revision if one of the situations described above occurs. The severability clause must specify how the remainder of the multi-state plan or individual state plan would continue to function with the withdrawal of a state or states, and may also include pre-specified revisions. The EPA will evaluate the appropriateness of such a clause as part of its review of the multi-state plan submittal.
5. Process for EPA Review of State Plans
Our proposal laid out the basic steps for the EPA's review and action on submitted state plans and, at some length, discussed the required components of state plans, as further described in the preceding sections. We received a number of thoughtful and helpful comments on these issues. We are finalizing the basic requirements in this rule and are proposing, in the companion proposed federal plan under section 111(d), some additional procedural elements we believe will be helpful to states, stakeholders and the EPA moving forward.
Following the September 6, 2016 deadline for state plan submittals, the EPA will review plan submittals. For a state that submits an initial submittal by September 6, 2016, and requests an extension of the deadline for the submission of a final state plan submittal, the EPA will determine if the initial submittal meets the minimum requirements for an initial submittal. If the state does not submit an initial submittal by September 6, 2016, that contains the three required components, the EPA will notify the state by letter, within 90 days, that the agency cannot grant the extension request based the state's initial submittal. If the initial submittal meets the minimum requirements specified in the emission guidelines, the state's request for a deadline extension to submit a final plan submittal will be deemed granted, and the final plan submittal must be submitted to the EPA by no later than September 6, 2018.
After receipt of a final plan submittal, the EPA will review the plan submittal and, within 12 months, approve or disapprove the plan through a notice-and-comment rulemaking process publicized in the
Federal Register
, similar to that used for acting upon SIP submittals under section 110 of the CAA. The implementing regulations currently provide for the EPA to act on a final plan within 4 months after the deadline for submission, which is consistent with versions of section 110 prior to the 1990 Amendments to the CAA. 40 CFR 60.27(b). To be consistent with the current version of section 110, the EPA intends to adopt a timeline of 12 months to review final plan submittals upon receipt of complete submittals, as is generally consistent with the timing requirements of section 110 with respect to complete SIP submittals. Such a timeline would also provide the EPA with adequate time for review and rulemaking procedures, and ensuring an opportunity for public notice and opportunity for comment. We note, however, that we proposed this timeline for review and action on state plans in our proposal, but our proposal was specific to the timeline for state plans submitted pursuant to this rule rather than for state plans submitted under 111(d) generally.[846]
We are finalizing as part of this rule that state plans submitted to meet the requirements of this rule will be reviewed and acted upon by the EPA within 12 months of submission. Because such timeline would be appropriate to be made to 111(d) state plans more generally, we are also proposing the appropriate revisions to the implementing regulations as part of the federal plan proposal for section 111(d).
In addition, while the proposal and this final rule lay out in considerable detail the required components of a state plan, the EPA believes that it would also be helpful to include in the rule a completeness determination process, similar to that used for SIP submittals under section 110, which will allow the EPA to determine whether a final plan submittal contains the components necessary to enable the EPA to determine through notice and comment rulemaking whether such submittal complies with the requirements of section 111(d). This is a procedural requirement under CAA section 110(k)(1) for SIPs, and the EPA believes this requirement is appropriate to establish under section 111(d)'s direction to the EPA to prescribe through regulations a procedure similar to that provided by section 110. However, because the EPA did not propose such regulations as part of the proposal for this action, the EPA is proposing such regulations as part of the federal plan proposal for section 111(d). The EPA notes that this preamble (in section VIII.D) and final rule lay out required components of state plans and all the requirements for a state plan submittal, and therefore states have the necessary information at this time to develop state plans. The upcoming completeness criteria will not add to or change these required components, but only add a procedural step that allows the EPA to identify whether there are absent or insufficient components in the plan submittal that would render the EPA unable to act on such submittal because it is incomplete. As we further explain in the federal plan proposal, a determination by the EPA that a plan submittal is incomplete has the effect of a state having a still-pending statutory obligation to submit a plan that meets the requirements of section 111(d).
The EPA is planning to propose an amendment to the section 111(d) implementing regulations that will add the partial approval/disapproval and conditional approval mechanisms in section 110(k)(3) and (4) to the procedure for acting on section 111(d) plans. The input the agency received in response to the proposal for these guidelines indicated that the flexibility provided by these mechanisms could be useful getting state plans in place. The EPA agrees, and is proposing to amend the implementing regulations as part of the rulemaking for the federal 111(d) plan. The EPA is not taking final action on these changes in this action.
The later timing for our action on partial approval/disapproval and conditional procedures does not create any issue with finalizing this rule. These procedural adjustments will only come into play after states have submitted their plans and the EPA is required to act on them, and we intend to finalize these procedural changes prior to September 6, 2016, when the first plan submittals would occur. Until then, the EPA believes that every plan is submitted with the intent to be fully approvable and there is no need for states to rely on the possibility of these procedures when developing their plans. Conditional approval and partial approval/disapproval should be used to deal with approvability issues that arise despite the best efforts of states and the EPA to work together to make sure a submittal in the first instance is fully approvable. The EPA plans to finalize any changes in the implementing regulations before the EPA is required to act on state submittals, so that the EPA and states will have appropriate flexibility in the plan approval process.
( printed page 64861)
6. Failure To Submit a Plan
If a state does not submit a final plan submittal by the applicable deadline, or submits a final plan the EPA determines to be incomplete, the EPA will notify the state by letter of its failure to submit. The EPA will publish a
Federal Register
notice informing the public of its finding of failure to submit. Upon a finding of failure to submit for a state, a regulatory clock will run requiring the EPA to promulgate a federal plan for such state no later than 1 year after the EPA makes the finding unless the state submits, and the EPA approves, a state plan during this time. Refer to the federal plan proposal for more details on how and when a federal plan would be triggered.
7. State Plan Modifications
a.
Modifications to an approved state plan.
During the course of implementation of an approved state plan, a state may wish to update or alter one or more of the enforceable measures in the state plan, or replace certain existing enforceable measures with new measures. The EPA received broad support for allowing states to submit modifications to approved state plans, and we agree that this is an important aspect of this program. In this rulemaking, therefore, the EPA is finalizing that a state may revise its state plan, and states in a multi-state plan may revise their joint plan. Consistent with the timing for final plan submittals originally submitted by states, the EPA will act on state plan revisions within 12 months of a complete submittal. The EPA expects that the long plan performance timeframes in this final rule and flexibility provided to states in developing state plans will lessen the need for modifications to approved state plans.
A state may enter or exit a multi-state plan through a plan modification, with certain limitations. Multiple commenters stated that the EPA should clarify the plan modification process in such instances.
Where a state with a single-state approved plan seeks to join a multi-state plan, the state may submit a modification of its plan indicating that it is joining the multi-state plan and including the necessary plan components under the multi-state plan. The current participants of the multi-state plan will also need to submit a plan modification, to acknowledge the new state participant and to recalculate the multi-state rate-based or mass-based CO2
goal. Functionally, both the modification of the single-state plan of the new participant and the multi-state plan of the current plan participants could be addressed through the same plan modification submittal or addressed under a plan modification submittal comparable to the alternate formats for multi-state plan submittals addressed in section VIII.E.4.
The entry or exit of a state to/from a multi-state plan involves the recalculation of the multi-state rate-based or mass-based CO2
goal for affected EGUs in the participating states. The recalculated multi-state rate-based or mass-based CO2
goal must take into account and ensure achievement of the individual state rate-based or mass-based CO2
goal for any state that is joining the multi-state plan. If implementation of the individual state plan has triggered corrective measures or backstop emission standards prior to the plan modification, as described in section VIII.F.3, the modification must take into account the need to make up for any shortfall in CO2
emission performance in the individual state plan prior to joining the multi-state plan. Where one or more states are leaving a multi-state plan through a plan modification, the process is similar and the same considerations must be taken into account in connection with the states that are leaving the multi-state plan.
As a result of these requirements and considerations, the EPA is finalizing certain requirements for multi-state plan modifications. A multi-state plan modification may be submitted to the EPA at any time. However, an approved multi-state plan modification may only take effect at the beginning of a new interim or final plan performance period. These requirements are necessary to ensure that the emission performance rates or state rate-based or mass-based CO2
goals in the emission guidelines are achieved. In addition, such requirements for the timing of the effective date of multi-state plan modifications are necessary for coordination of the implementation of multi-state plans, especially where such plans include a multi-state emission trading approach. This approach is also consistent with the approach the EPA is proposing for the implementation of federal plan, where relevant for a state(s).
The EPA solicited comment on whether, for new projections of emission performance included in a submitted plan modification, the projection methods, tools, and assumptions used should match those used for the projection in the original demonstration of plan performance, or should be updated to reflect the latest data and assumptions, such as assumptions for current and future economic conditions and technology cost and performance. Comments received on this topic were generally supportive of allowing the use of updated data in state plan modifications, citing that states should have the ability to determine whether the original data and assumptions or updated data and assumptions are appropriate. The EPA is finalizing that new projections of emission performance, the projection methods, tools, and assumptions do not have to match those used for the projection in the original demonstration of plan performance; they can be updated to reflect the latest data and assumptions, such as assumptions for current and future economic conditions and technology cost and performance.
As discussed in more detail in section VIII.G.2, the final rule has several measures to ensure that it does not interfere with the industry's ability to maintain reliability. One such measure is that if a state cannot address a reliability issue in accordance with an approved state plan, the state can submit a request to the EPA to modify the state plan. See section VIII.G.2 for a more detailed discussion of this issue.
The EPA is not finalizing any circumstances under which a state may or may not revise its state plan, with the exception that a state may not revise its state plan in a way that results in the affected EGU or EGUs not meeting the requisite CO2
emission performance levels.
b.
Modifications to interim and final CO2emission goals.
As discussed in section VII, the final rule specifies that the state interim and final CO2
emission goals for affected EGUs in a state may be adjusted to address changes within a state's fleet of affected EGUs. If these changes occur before a state submits its initial submittal or final plan, the state should indicate in its submittal the circumstance that necessitates the goal adjustment and the revised interim or final CO2
emission goal. If the circumstances occur after a state has an approved plan, a state must submit a modification to its approved plan. The plan revision submittal must indicate the circumstance that necessitates the goal adjustment, the revised interim and/or final CO2
emission goal, and the adjustments to the enforceable measures in the plan.
8. Plan Templates and Electronic Submittal
The EPA is finalizing the requirement that submissions related to this program
( printed page 64862)
be submitted electronically. Specifically, that includes negative declarations, state plan submittals (including any supporting materials that are part of a state plan submittal), any plan revisions, and all reports required by the state plan. The rule provides that files that are submitted to the EPA in an electronic format may be maintained by states in an electronic format. The submission of the information by the authorized official must be in a non-editable format. In addition to the non-editable version, the EPA is also requiring that all plan components designated as federally enforceable must be submitted in an editable version as well, as discussed below.
a.
Submittal of an editable version of federally enforceable plan components.
To ensure that the EPA has the ability to identify, evaluate, merge, update and track federally enforceable plan components in a timely and comprehensive manner, the EPA is requiring states to submit an editable copy of the specific plan components in their submittals that are designated as federally enforceable, either effective upon the EPA plan approval or as a state plan backstop measure. The editable version is in addition to the non-editable version. Examples of editable file formats include Microsoft Word, Apple Pages and WordPerfect.
b.
Revisions to an approved plan.
States shall provide the EPA with both a non-editable and editable copy of any submitted revision to existing approved federally enforceable plan components, including state plan backstop measures. The editable copy of any such submitted plan revision must indicate the changes made, if any, to the existing approved federally enforceable plan components, using a mechanism such as redline/strikethrough. This approach to identifying the changes made to the existing federally enforceable plan components is consistent with the criteria for determining the completeness of SIP submissions set forth in Section 2.1(d) of Appendix V to 40 CFR part 51.
c.
Electronic submittal.
It is the EPA's experience that electronic submittal of information has increased the ease and efficiency of data submittal and data accessibility. The EPA is developing the SPeCS, a web accessible electronic system to support this requirement that will be accessed at the EPA's Central Data Exchange (CDX) (
https://www.epa.gov/cdx/). The EPA will pre-register authorized officials and plan preparers in CDX. See section VIII.E.2 for additional information on the pre-registration process for authorized officials and plan preparers. Detailed instructions for accessing CDX and SPeCS will be outlined in the “111(d) SPeCS User Guide: How to submit state 111(d) plan material to EPA” which will be available on the EPA's Clean Power Plan Toolbox for States. The EPA will provide SPeCS training for states prior to the state plan submittal due date.
Once in CDX, SPeCS can be selected from the Active Program Service List. The preparer (
e.g.,
state representative compiling a state plan submittal) assembles the submission package. The preparer can upload files and complete electronic forms. However, the preparer may not formally submit and sign packages. Only registered authorized officials may submit and sign for the state with the exception of draft submittals. The EPA's intent is to allow submittal of draft plans or parts of plans for early EPA review prior to formal submission by the authorized official and will allow preparers, as well as authorized officials, to submit draft documents. The authorized official will be able to assemble submission packages and will be able to modify submission packages that a preparer has assembled. The key difference between the preparer and the authorized official is that the authorized official can submit and sign a package for formal EPA review using an electronic signature. In the case of a multi-state plan, each participating state's authorized official must provide an electronic signature.
The process has been designed to be compliant with the Cross-Media Electronic Reporting Rule (CROMERR), under 40 CFR part 3, which provides the legal framework for electronic reporting under all of the EPA's environmental regulations. The framework includes criteria for assuring that the electronic signature is legally associated with an electronic document for the purpose of expressing the same meaning and intention as would a handwritten signature if affixed to an equivalent paper document. In other words, the electronic signature is as equally enforceable as a paper signature. For more information on CROMERR, see the Web site:
https://www.epa.gov/cromerr/. States who claim that a state plan submittal or supporting documentation includes confidential business information (CBI) must submit that information on a compact disc, flash drive, or other commonly used electronic storage media to the EPA. The electronic media must be clearly marked as CBI and mailed to U.S. EPA/OAQPS/CORE CBI Office, Attention: State and Local Programs Group, MD C539-01, 4930 Old Page Rd., Durham, NC 27703.
The EPA received a number of comments on the electronic submittal of state plans. Some commenters preferred the option to submit electronically rather than the requirement to do so. In the final rule, for the reasons discussed below, the EPA is requiring electronic submittal of state plans and not allowing alternate options for plan submittal (
e.g.
paper submittal).
Requiring electronic submittal is in keeping with current trends in data availability and will result in less burden on the regulated community. Electronic submittal will facilitate two-way business communication between states and the EPA, will guide states through the submittal process to ensure submission of all required plan components, and will enable states to submit proposed plans to the EPA electronically for early EPA comments. Electronic submittal will also facilitate, expedite and promote national consistency in the EPA's review of state plans and promote transparency by providing stakeholder-specific access to updated information on state plan status and posting of plan requirements for viewing by the public, government regulators and regulated entities. The EPA recently implemented an electronic submittal process for SIPs under CAA section 110 and continues to explore opportunities to increase the ease and efficiency with which states and the regulated community can meet regulatory data submittal requirements. In summary, the EPA believes electronic submittal will be enormously beneficial in terms of improving coordination and cooperation between the EPA and its state partners in developing approvable state plans. We note, however, that there may be some circumstances where having paper copies of the plan is needed to facilitate public engagement, and encourage states to take those considerations into account.
d.
Plan templates.
In the proposal, the EPA requested comment on the creation of templates for initial submittals and final state plan submittals. Multiple commenters requested the EPA provide state plan templates. One commenter requested templates for different plan designs (
e.g.
a mass-based trading framework, a rate-based trading framework, multi-state compliance and a utility-based portfolio approach) and for specific plan components (
e.g.
how to incorporate a state RE standard and an EE program into a state plan, how to assess the emission reductions delivered by RE and EE). The EPA has determined that the broad range of approaches states may take in preparing individual or multi-state plans makes the
( printed page 64863)
development of specific templates challenging and likely not useful to states. However, concurrent with this final rule, the EPA is proposing model rules for both rate- and mass-based programs in conjunction with the proposed federal plan. These effectively can serve as a template for states when preparing their state plan submittals. The EPA will continue extensive outreach to states and work closely with them on the need for additional tools and guidance to facilitate the development of approvable state plans.
9. Legal Basis Regarding State Plan Process
CAA section 111(d)(1) requires the EPA to promulgate procedures “similar” to those in section 110 under which states adopt and submit CAA section 111(d) plans. The EPA has interpreted this provision previously in the implementing regulations found in 40 CFR part 60 subpart B. As discussed above, the EPA intends that planned revisions to the part 60 implementing regulations will clarify (among other things) whether certain procedures are appropriate for the EPA's action on CAA section 111(d) state plans, and if so, precisely how those procedures should apply. The EPA is proposing these revisions to the CAA section 111(d) implementing regulations in the notice of proposed rulemaking for the federal plan being issued concurrently with this final rule. In this section we discuss the legal basis for procedures that the EPA is finalizing in this action: Initial submittals, extensions, and plan revisions.
First, by using the ambiguous word “similar,” Congress delegated authority to the EPA to determine precisely what procedures would govern 111(d) plans. “Similar” does not have an identical meaning as the word “same.” One definition of “similar” is “having likeness or resemblance, especially in a general way.” The American College Dictionary 1127 (C.L. Barnhart, ed. 1970). On the other hand, “same” is defined as “alike in kind, degree, quality; that is, identical” or “unchanged in character.”
Id.
at 1073.
Had Congress intended that the procedures for section 111(d) plans be indistinguishable from those in section 110, Congress knew how to say so.
See, e.g.,36 U.S.C. 2352(b)(2)(B) (“same procedures”). And had Congress intended that the procedures for section 111(d) plans be as close as possible to those in section 110, Congress knew how to say that.
See, e.g.,38 U.S.C. 4325(c) (agency “shall ensure,
to the maximum extent practicable, that the procedures are similar
to” certain other procedures). Therefore, Congress must have intended to give the EPA leeway to create procedures for section 111(d) state plans that somewhat vary from those in section 110, so long as the section 111(d) procedures are reasonably tied to the purpose and text of section 111(d). In other words, “similar” creates a gap in the statute that the EPA may reasonably fill.
a.
Initial submittals and extensions.
Initial submittals in this instance are a reasonable gap-filling procedural step. As explained in our proposal, certain aspects of section 111(d) plan development for these particular guidelines warrant our creation of this procedural step, even though section 110 does not provide for initial submittals. As explained above, though, we are not bound under section 111(d)(1) to follow exactly the same procedures.
With respect to the timing of initial submittals, final submittals, and extensions, we note that section 111 does not prescribe any particular deadlines, instead leaving it to EPA's discretion to establish “similar” procedures to section 110. The implementing regulations for section 111(d) plans require state plans to be submitted within 9 months of finalization of emission guidelines. Section 110(a)(1) provides that states should adopt and submit SIPs that provide for implementation, maintenance, and enforcement of the NAAQS within 3 years, or such shorter period as the Administrator may prescribe.[847]
As further explained in Section VIII.E., the EPA is providing states with up to 3 years to submit a final plan under this rule, contingent upon the grant of an extension through an initial submittal due by September 6, 2016. Section 110(a)(1) does not provide any particular factors for the Administrator to consider in prescribing a shorter period. Thus, the EPA's prescription of a shorter period for either an initial submittal or a final plan submittal is consistent with the discretion granted in section 110(a)(1). We further discuss why the September 6, 2016 initial submittal deadline is reasonable in Section VIII.E., and such deadline is achievable by states seeking to submit a final plan within 3 years. We also note that section 110(b) provides for extensions of 2 years for plans to implement secondary NAAQS, that other provisions in part D provide for extensions of due dates of attainment plans in certain circumstances, and that the section 111(d) implementing regulations provide for extensions generally. We conclude, in view of the above discussion of “similar,” that the approach of initial submittals and extensions of due dates as proposed are reasonable procedures that, while not identical to the procedures in section 110, are still similar.
Some commenters argued that the 1-year period for initial submittals and, even assuming an extension, the additional 1- to 2-year period for final submittals were unreasonably short, particularly in light of the possibility that some state legislatures might need to act to provide adequate legal authority for these particular plans. We are not finalizing the 1-year extension for single state submittals, and we have addressed concerns about legal authority for the initial submittals by allowing states to identify remaining legislative action in those submittals.
With respect to the overall period of up to 3 years for submittals, we continue to find it reasonable and consistent with other deadlines in the CAA. First, section 110(a)(1) requires states to submit a plan for implementation, maintenance, and enforcement of new NAAQS within 3 years of promulgation of that NAAQS. This is true even if the EPA promulgates a NAAQS for a previously non-criteria pollutant. In that case, it is possible and even likely that at least some state agencies will lack statutory authority to regulate the new pollutant. Nonetheless, Congress dictated that states should submit section 110(a)(1) plans within 3 years.
Furthermore, we note that under subpart 1 of Part D of Title 1, attainment plans are generally due no later than 3 years after designation of a nonattainment area, and under other subparts of Part D, plans are due even more quickly. For example, under subpart 4, attainment plans for particulate matter are generally due 18 months after designation, and under subpart 5, the same deadline applies for attainment plans for sulfur oxides, nitrogen dioxide and lead. Developing attainment plans may or may not require states to seek additional legislative authority, but certainly in terms of complexity they are similar to section 111(d) plans for this guideline. In general, attainment plans must contain (among other things) a comprehensive inventory of sources of the relevant pollutant and its precursors (which in populated areas can be very numerous), control measures for those sources (including individualized control measures for the larger sources), and modeled demonstrations of
( printed page 64864)
attainment (which in some instances requires photochemical grid modeling). Thus, it is reasonable to have the same timeline for these section 111(d) plans as Congress generally provided for attainment plans in section 172(b).
b.
State plan modifications.
Section 110(l) provides for states to revise their SIPs, as does 40 CFR 60.28 for section 111(d) plans. Section 110(l) also sets out a standard for revisions: It prohibits the EPA from approving a SIP revision that would interfere with any applicable requirement concerning attainment or reasonable further progress, or any other applicable requirement of the CAA. Under the existing section 111(d) implementing regulations, the Administrator will disapprove section 111(d) plan revisions as unsatisfactory when they do not meet the requirements of subpart B to part 60. See 40 CFR 60.27(c)(3). However, the implementing regulations do not set forth a substantive standard like that in section 110(l).
Section 111(d)(1) does not mention revisions (except indirectly through the reference to section 110) and, therefore, does not explicitly provide any substantive requirements for them. There is, therefore, a gap in the statute that the EPA may reasonably fill, since many stakeholders commented on the desirability of states being able to modify their plans, and the EPA agrees. It is reasonable, at a minimum, that the state plan as revised should continue to provide for implementation and enforcement of the standards of performance, and to achieve the CO2
emission performance rates or state CO2
emission performance goal. This is analogous to the substantive requirements of section 110(l), which as explained above for section 110(a)(2), we may consider in determining how to reasonably fill statutory gaps for section 111(d) plans.
In our proposal, we stated that certain revisions to state plans under these emission guidelines, those that revised enforceable measures for affected EGUs, should satisfy some additional conditions. First, the state should demonstrate that the plan continues to achieve the CO2
emission performance rates or state CO2
emission performance goal. We proposed that this demonstration might be simple for minor revisions, but for major revisions a more complete demonstration may be required. We are finalizing this proposal. As legal basis for this position, we note that a demonstration is necessary to show that a state plan provides for implementation of standards of performance that achieve the CO2
emission performance rates or state CO2
emission performance goal, and as explained above we can reasonably require the same of revisions.
It is also reasonable to tailor the requirements of the demonstration to the magnitude of the revision. The EPA has taken a similar approach to tailoring the requirements for a technical demonstration that, under section 110(l), a SIP revision does not interfere with any applicable requirement concerning attainment of the NAAQS. If a SIP revision does not relax the stringency of any SIP measure, then the demonstration is simple. If the SIP revision does relax the stringency of SIP measures, then a qualitative or quantitative analysis may be necessary to show non-interference, depending on the nature of the revision, the current air quality in the area, and other factors.
Finally, we proposed that revisions “should not result in reducing the required emission performance for affected EGUs specified in the original approved plan. In other words, no `backsliding' on overall plan emission performance through a plan modification would be allowed.” 79 FR 34917/1. We received adverse comments that this standard did not have a basis in section 111(d). According to commenters, since the standard for EPA approval of a section 111(d) plan is whether the plan is satisfactory in establishing and providing for implementation and enforcement of standards of performance that achieve the emission performance rates or goal, the same standard should apply to revisions. In other words, the standard for revisions should be whether the plan as revised is satisfactory. We believe that our proposal was unclear as to this point, and we agree that the standard for revisions should be the same as for submittals. We have finalized this position.
F. State Plan Performance Demonstrations
This section describes state plan requirements related to compliance periods, monitoring and reporting for affected EGUs; plan performance demonstrations; consequences if the CO2
emission performance rates or state CO2
emission goals are not met; and out-year requirements.
1. Compliance Periods, Monitoring and Reporting Requirements for Affected EGUs
For plans that include emission standards on affected EGUs, the EGU emission standards for the interim period must have schedules of compliance for each interim step 1, 2 and 3 for the calendar years 2022-2024, 2025-2027 and 2028-2029, respectively. For the final period, EGUs must have emission standards that have schedules of compliance for each 2 calendar years starting in 2030 (
i.e.,
2030-2031, 2032-2033, 2034-2035, etc.). If a backstop is triggered for a state measures plan, the schedule of compliance for the federally enforceable emission standards must begin no later than 18 months after the backstop is triggered and end at the end of the same compliance period. For example, if a backstop is triggered on July 1, 2025, the compliance period for the backstop emission standards must begin no later than January 1, 2027, and end on December 31, 2027. The next compliance period for the backstop emission standards would be January 1, 2028-December 31, 2029.
In the June 2014 proposal, the EPA proposed that the appropriate averaging time for any rate-based emission standard for affected EGUs be no longer than 12 months within a plan performance period and no longer than 3 years for a mass-based standard. The EPA solicited comments on longer and shorter averaging times for emission standards included in state plans. The EPA received comments stating that the proposed 12-month averaging was too short and that there was no reason why the compliance period under a rate-based plan should be different from a mass-based plan. Comments stated that a multi-year averaging period is appropriate for rate-based and mass-based plans to account for variations that can occur in a single year, allowing operators the flexibility they need to manage unforeseen events. The commenters also recommended that the final rule use discrete 3-year periods for compliance reconciliation instead of the rolling-average approach proposed.
The EPA has considered all comments received on this matter and is finalizing the compliance periods specified above, which respond to the comments by applying to both rate- and mass-based programs, providing compliance periods longer than 1 year, and establishing block compliance periods rather than a rolling average approach. We agree with comments that longer averaging periods allow for operational and seasonal variability to even out. The EPA finalizes that states can choose to set shorter compliance periods for their emission standards but none that are longer than the compliance periods the EPA is finalizing in this rulemaking. If a state chooses to set shorter compliance periods, we urge them to make efforts to be cognizant of other deadlines facing EGUs to assure that there will not be
( printed page 64865)
conflicts. The EPA recognizes that the compliance periods provided for in this rulemaking are longer than those historically and typically specified in CAA rulemakings. “The time over which [the compliance standards] extend should be as short term as possible and should generally not exceed one month.” See
e.g.,
June 13, 1989 “Guidance on Limiting Potential to Emit in New Source Permitting” and January 25, 1995 “Guidance on Enforceability Requirements for Limiting Potential to Emit through SIP and § 112 Rules and General Permits.” However, the EPA has determined that the longer compliance periods provided for in this rulemaking are acceptable in the context of this specific rulemaking because of the unique characteristics of this rulemaking, including that CO2
is long-lived in the atmosphere, and this rulemaking is focused on performance standards related to those long-term impacts. The distinction between these unique characteristics and the EPA's general practice regarding compliance periods is bolstered by the EPA guidance on appropriate averaging periods for emission limitations in NAAQS implementation. For example, the EPA guidance has stated that in implementation of the ozone standards, which have a short averaging period, the averaging period for VOC emission limitations should be correspondingly short. See 51 FR 43857. A longer averaging period for VOC emission limitations (VOCs are one of the key precursors to ozone formation) can allow spikes in emissions that adversely impact ambient air and violate the short term ozone standards. This is precisely the opposite of the unique characteristics cited above: the long-lived persistence of CO2
in the stratosphere and the intent of these guidelines to address the long-term impacts.
State plans must contain requirements for tracking and reporting actual plan performance during implementation, which includes reporting of CO2
emissions from affected EGUs. Affected EGUs must comply with emissions monitoring and reporting requirements that are largely incorporated from 40 CFR part 75 monitoring and reporting requirements. The majority of affected EGUs are already familiar with the reporting requirements of part 75, and because of this, the EPA has chosen to streamline the applicable reporting requirements for affected EGUs under the state plans in the final rule. States must require all affected EGUs to monitor and report hourly CO2
emissions and net energy output (including total net MWh output that is comprised of generation, and where applicable, useful thermal output converted to net MWhs) on a quarterly basis in accordance with 40 CFR part 75. Note that this requirement applies for all types of state plans, regardless of whether the state chooses the option of the CO2
emission performance rates, a state rate-based CO2
emission goal, or a state mass-based CO2
emission goal.
In the June 2014 proposal, the EPA proposed that state plans must include monitoring, reporting and recordkeeping requirements for useful energy output from affected EGUs. Multiple commenters questioned whether gross rather than net electrical production should be reported by affected EGUs and recommended that the EPA should utilize gross rather than net generation. Many commenters recommended electricity be reported in the form used in the 111(b) rules for consistency between reporting requirements and simplification of calculation of emission limitations between new and old sources. Commenters also stated that to the extent the EPA seeks to provide guidance to states regarding its preferred monitoring and reporting procedures, the EPA should encourage states to avoid imposing additional monitoring and reporting burdens by taking advantage of the monitoring requirements that already exist to the greatest extent possible. For example, the commenters noted that the 40 CFR part 75 monitoring procedures used to comply with other programs, such as the Title IV Acid Rain Program, provide much of the data that would be needed to demonstrate compliance under the rule. Comments stated that the June 2014 proposal appeared to mandate a monitoring approach that would eliminate key flexibilities provided in the part 75 regulations, thus requiring utilities to maintain separate document collection and reporting procedures and potentially eliminating important alternative monitoring options intended to ensure representative, cost-effective monitoring approaches are available. The commenters asked the EPA to revise its proposal to make clear that the procedures established under part 75 will suffice or explain the need for any exceptions. Commenters indicated that the rule should require all affected EGUs to monitor CO2
emissions and net hourly electric output under 40 CFR part 75, and report the data using the EPA's Emission Collection and Monitoring Plan System (ECMPS) assuring a more uniform monitoring and reporting process for all EGUs. The EPA believes that the final monitoring and reporting requirements (via ECMPS) address the issue of duplicative requirements and alleviate concern about lost flexibility raised by commenters.
2. Plan Performance Demonstrations
The state plan must include emission performance checks, and for state measures plans, periodic program implementation milestones. The state plan must provide for tracking of emission performance, and for measures to be implemented if the emission performance of affected EGUs in the state does not meet the applicable CO2
emission performance rates or state CO2
emission goal during a performance period.
As discussed above in section VII, the agency is finalizing CO2
emission performance rates or state-specific CO2
emission goals that represent emission levels to be achieved by 2030 and emission levels to be achieved over the 2022-2029 interim period, and over three interim steps of 2022-2024, 2025-2027 and 2028-2029. A state may choose to define different interim step emission levels for achieving its required 2022-2029 average performance rate. The EPA recognizes the importance of ensuring that, during the 8-year interim period (2022-2029) for the interim performance rates or interim state goal, a state is making steady progress toward achieving the required level of emission performance. For both emission standards plans and state measures plans, the final rule requires periodic checks on overall emission performance leading to corrective measures or implementation of the backstop, if necessary, as described in section VIII.F.3 below. States must demonstrate that the interim steps were achieved at the end of the first two interim step periods.
In 2032 and every 2 years thereafter, states must demonstrate that affected EGUs achieved the final performance rates or state goal on average or cumulatively, as appropriate, during each 2-year reporting period (
i.e.,
2030-31, 2032-33, 2034-2035 etc.). The multi-year performance periods for measuring actual plan performance against the performance rates or state goals allow states some flexibility that accounts for seasonal operation of affected EGUs, and inclusion of RE and demand-side EE efforts.
For a rate-based plan, emission performance is an average CO2
emission rate for affected EGUs representing cumulative CO2
emissions for affected EGUs over the course of each reporting period divided by cumulative MWh
( printed page 64866)
energy output [848]
from affected EGUs over the reporting period, with rate adjustments for qualifying measures, such as RE and demand-side EE measures. For a mass-based plan, emission performance is total tons of CO2
emitted by affected EGUs over the reporting period.
For emission standards plans, as discussed in section VIII.D, the state must submit a report to the EPA containing the emissions performance comparison for each reporting period no later than the July 1 following the end of each reporting period (
i.e.,
by July 1, 2025; July 1, 2028; July 1, 2030; July 1, 2032; and so on). As discussed in section VIII.D, the emission comparison required in the July 1, 2030 report must compare the actual emissions from affected EGUs over the interim period (2022-2029) with the interim CO2
emission performance rates or state CO2
emission goal. The report is not required to include a comparison for the interim step 3 period, but must include the actual emissions from affected EGUs during the interim step 3 period.
The EPA notes that for certain types of emission standards plans, with mass-based emission standards in the form of an emission budget trading program, achievement of a state's mass-based CO2
goal (including interim step goals and final goal) will be assessed by the EPA based on compliance by affected EGUs with their emission standards under the program, rather than CO2
emissions during a specific interim step period or final period. This approach is limited to plans with emission budget trading programs where compliance by affected EGUs with the emission standards will ensure that, on a cumulative basis, the state interim and final mass-based CO2
goals are achieved.[849]
This approach allows for CO2
allowance banking across plan performance periods, including from the interim period to the final period. As a result, CO2
emissions by affected EGUs could differ from the state mass-based CO2
goal during an individual plan performance period, but on a cumulative basis CO2
emissions from affected EGUs would not exceed what is allowable if the interim and final CO2
goals are achieved.
Also as discussed in section VIII.D, states that choose a state measures plan must submit an annual report no later than July 1 following the end of each calendar year in the interim period. This annual report must include the status of the implementation of programmatic state measures milestones identified in the state plan submittal. The annual report that follows the end of each reporting period (
i.e.,
2022-2024, 2025-2027, and 2028-2029) must also include an emissions performance comparison for the reporting period, as described above for the emission standards plan. As discussed in section VIII.D, the emission comparison required in the July 1, 2030 report must compare the actual emissions from affected EGUs over the interim period (2022-2029) with the interim CO2
emission performance rates or state CO2
emission goal. The report is not required to include a comparison for the interim step 3 period, but must include the actual emissions from affected EGUs during the interim step 3 period. Beginning with the final period of 2030 and onward, states using a state measures plan must submit a biennial report no later than July 1 following the end of each reporting period with an emission performance comparison for each reporting period, consistent with the reporting requirements for emission standards plans.
In the June 2014 proposal, the EPA proposed that a state report is due to the EPA no later than July 1 of the year immediately following the end of each reporting period. The EPA requested comment on the appropriate frequency of reporting of the different proposed reporting elements, considering both the goals of minimizing unnecessary burdens on states and ensuring program effectiveness. In particular, the agency requested comment on whether full reports containing all of the elements should only be required every 2 years rather than annually and whether these reports should be submitted electronically, to streamline transmission.
The EPA mainly received adverse comments for requiring annual state reporting; commenters stated that this requirement was too burdensome for both states and the EPA. Commenters also requested that the EPA extend the due date of the annual report from July 1 to at least December 31. Commenters stated that because of the timing of current data collection and the need to leave time to organize and submit the reports, allowing only 6 months after the close of the year is problematic. Commenters asked that the EPA consider reducing the amount of data required if annual reporting was required.
Considering the comments received and the goals of minimizing unnecessary burdens on states and ensuring program effectiveness, the EPA has reduced the frequency of reporting of emissions data to every 3 years for the first two interim steps and every 2 years thereafter. However, the EPA is finalizing that state reports are due to the EPA no later than July 1 following the end of each reporting period. The EPA believes states can design their state plans to receive the data and information needed for these reports in a timely manner so that this requirement can be met. Furthermore, some of the state reporting requirements, such as reporting of EGU emissions, can be met through existing reporting mechanisms (ECMPS) and would not place additional burdens on states.
3. Consequences if Actual Emission Performance Does Not Meet the CO2
Emission Performance Rates or State CO2
Emission Goal
The EPA recognizes that, under certain scenarios, an approved state plan might fail to achieve a level of emission performance that meets the emission guidelines or the level of performance established in a state plan for an interim milestone. Despite successful implementation of certain types of plans, emissions under the plan could turn out to be higher than projected at the time of plan approval because actual conditions vary from assumptions used when projecting emission performance. Emissions also could theoretically exceed projections because affected entities under a state plan did not fulfill their responsibilities, or because the state did not fulfill its responsibilities.
The final rule specifies the consequences in the event that actual emission performance under a state plan does not meet, or is not on track to meet, the applicable interim and interim step CO2
emission performance rates or state goals in 2022-2029, or does not meet the applicable final CO2
emission performance rates or state CO2
emission goal in 2030-2031 or later. The determination that a state is not on track to meet the applicable interim goal or interim step goals in 2022-2029 or the applicable final goal in 2030-2031 or later, or the CO2
emission performance rates, will be made through the actual performance checks to be included in state reports of performance data described in section VIII.D.2.a above.
For emission standards plans, the final rule specifies that corrective measures must be enacted once triggered. Corrective measures apply
( printed page 64867)
only to emission standard plans in which full compliance by affected EGUs would not necessarily lead to achievement of the emission performance rates or CO2
emission goals.[850]
For such plans, corrective measures are triggered if actual CO2
emission performance by affected EGUs is deficient by 10 percent or more relative to the specified level of emission performance in the state plan for the step 1 or step 2 interim performance periods. Corrective measures also are triggered if actual emission performance fails to meet the specified level in the plan for the 8-year interim period 2022-2029, or for any 2-year final goal performance period (beginning in 2030). In such cases, the state report must include a notification to the EPA that corrective measures have been triggered. If, in the event of such an exceedance, the EPA determines that corrective measures have been triggered and the state has failed to notify the EPA, the EPA will inform the affected EGUs that corrective measures have been triggered.[851]
When corrective measures are triggered, if the state plan does not already contain corrective measures, the state must submit to the EPA a plan revision including corrective measures that adjust requirements or add new measures. The corrective measures must both ensure future achievement of the CO2
emission performance rates or state CO2
emission goal and achieve additional emission reductions to offset any emission performance shortfall that occurred during a performance period. The shortfall must be made up as expeditiously as practicable. The state plan revision submission must explain how the corrective measures both make up for the shortfall and address the state plan deficiency that caused the shortfall. The state must submit the revised plan to the EPA as expeditiously as practicable and within 24 months after submitting the state report indicating the exceedance. The 24-month time period allows time to identify corrective measures and make rule changes through state regulatory processes. The EPA will then act on the plan revision within 12 months, consistent with other plan revisions and with the timing for final plan submittals originally submitted by states. The state must implement corrective measures within 6 months of the EPA's approval of a plan revision adding them.
For states using the state measures approach, the EPA is finalizing the backstop requirement as described in section VIII.C.3 of this preamble. As discussed in section VIII.D.2, the determination that a state using the state measures approach is not on track to meet the applicable interim goal or interim step goals in 2022-2029, or the applicable final goal in 2030-2031 or later, is based on checks that must be included in state reports that must be submitted annually during the interim period and biennially during the final period. The state must annually report on its progress in meeting its programmatic state measures milestones during the interim period. In addition, the state must report actual emission performance checks, similar to the requirements discussed above for emission standards plans, in 2025, 2028, 2030, and every 2 years thereafter. If, at the time of the state report to the EPA, the state did not meet the programmatic state measures milestones for the reporting period, or the performance check shows that the plan's actual CO2
emission performance warrants implementation of backstop requirements,[852]
the state must include in the state report a notification to the EPA that the backstop has been triggered. If, in the event of such an exceedance, the EPA determines that the backstop has been triggered and the state has failed to notify the EPA, the EPA will inform the affected EGUs that the backstop has been triggered.[853]
For multi-state plans, corrective measure or backstop provisions would be required for the same plan approaches for which those provisions are required in individual state plans. For multi-state plans using plan approaches to which corrective measures or backstop requirements apply, all states that are party to the multi-state plan would be subject to corrective action or backstop requirements, and requirements to make up the past CO2
emission performance shortfall, if those requirements were triggered. This is because multi-state plans are joint plans (even if created through separate state submittals). That would not be the case for coordinated individual state plans linked through interstate ERC or emission allowance trading. In the case of coordinated individual state plans, for plan types subject to corrective measure or backstop requirements, the state where the CO2
emission performance deficiency occurs would be required to implement corrective measures or backstop requirements for affected EGUs, as applicable, and remedy the past CO2
emission performance shortfall.
Multiple commenters requested that corrective measures not be required in the case of a catastrophic, uncontrollable event. We recognize that there are potential system emergencies that cannot be anticipated that could cause a severe stress on the electricity system for a length of time such that the multi-year requirements in a state plan may not be achievable by certain affected EGUs without posing an otherwise unmanageable risk to reliability. We are finalizing a reliability safety valve, which includes an initial period of up to 90 days during which a reliability-critical affected EGU or EGUs will not be required to meet the emission standard established for it under the state plan but rather will meet an alternative standard. While the initial 90-day period is in use, the emissions of the affected EGU or EGUs that exceed their obligations under the approved state plan will not be counted against the state's overall goal or emission performance rate for affected EGUs and will not be counted as an exceedance that would otherwise trigger corrective measures under an emission standard plan type or an exceedance that would trigger a backstop under a state measures plan type. Use of the reliability safety valve will not alter or abrogate any other obligations under the approved state plan. After the initial period of up to 90 days, the reliability-critical affected EGU is required to continue to operate under the original state plan emission standard or an alternative standard as part of the
( printed page 64868)
reliability safety valve, and the state must revise its plan to accommodate changes needed to respond to ongoing reliability requirements and to ensure than any emissions excess of the applicable state goals or performance rates occurring after the initial period of up to 90 days are accounted for and offset. See section VIII.G.2.e of this preamble.
Multiple commenters supported the inclusion of strong enforcement measures for ensuring the interim and final goals are met, including the required use of corrective measures when triggered. Other commenters provided feedback as to the percentage that actual emission performance would need to exceed the level of emission performance specified in the statewide plan to trigger corrective measures. Some commenters supported the trigger that we are finalizing (actual emissions or emission rate performance that is 10 percent or more than the specified level of emission performance in the state plan for the interim step 1 or step 2 performance periods), while some recommended a lower or higher trigger.
The agency is finalizing the trigger at the level of 10 percent for the interim step 1 or step 2 performance periods. Ten percent is a reasonable level to ensure that when deficiencies in state plan performance begin to emerge, corrective measures (or backstop requirements) will be implemented promptly to avoid emissions shortfalls (or minimize the extent of shortfalls) relative to the 8-year interim goal and the final goal, which reflect the BSER. The 10 percent figure also provides latitude for a state's emission improvement trajectory during the interim period to deviate a bit from its planned path without triggering these requirements, as the state initiates or ramps up programs to meet the 8-year interim goal and final goal.
The EPA requested comment on whether the agency should promulgate a mechanism under CAA section 111(d) similar to the SIP call mechanism in CAA section 110. Under this approach, after the agency makes a finding of the plan's failure to achieve the CO2
emission performance rates or state CO2
emission goal during a performance period, the EPA would require the state to cure the deficiency with a new plan within a specified period of time. If the state still lacked an approved plan by the end of that time period, the EPA would have the authority to promulgate a federal plan under CAA section 111(d)(2)(A). 79 FR 34830, 34908/1-2 (June 18, 2014).
The EPA intends that planned revisions to the part 60 implementing regulations will clarify (among other things) whether the EPA has authority to call for plan revisions under section 111(d) when a state's plan is not complying with the requirements of this guideline, and if so, precisely what procedures should apply. The EPA is proposing these revisions to the 111(d) implementing regulations in the notice of proposed rulemaking for the federal plan. The EPA is not taking final action now on this issue or the related change to the implementing regulations.
a.
Legal basis for corrective measures.
The EPA discussed the concept of corrective measures in our 1992 General Preamble for the Implementation of Title I of the CAA Amendments of 1990. 57 FR 13498 (Apr. 16, 1992). The General Preamble sets out four general principles that apply to all SIPs, “including those involving emissions trading, marketable permits and allowances.”
Id.
at 13568. The fourth principle, accountability, means (among other things) that “the SIP must contain means . . . to track emission changes at sources and provide for corrective action if emissions reductions are not achieved according to the plan.” In the General Preamble, we noted that Part D of Title I explicitly provided for this in certain instances by requiring milestones and contingency measures.
Some commenters noted that the contingency measures explicitly required by part D are required to be adopted in the attainment plan and ready to implement when a milestone is not achieved or the area fails to attain the relevant NAAQS. These commenters therefore concluded that corrective measures for 111(d) plans should likewise already be adopted in the 111(d) plan and ready to implement. We disagree. Under Part D, contingency measures are not expected to fully bring the area into attainment. In fact, this would not be possible given the difficulty of predicting in advance exactly what measures would be needed to fully attain. A better analogue in Part D for the corrective measures in these guidelines is the primary way Part D addresses failure to attain: The state is required to revise its plan in various ways within a certain time in order to bring about attainment. See,
e.g.,
section 179(d). This is analogous to what we are requiring for corrective measures. Thus, part D contingency measures are unlike the corrective measures in this rule.
However, the requirement to revise an attainment plan in response to failure to attain differs somewhat from the corrective measures in these guidelines. Under these guidelines, the corrective measures must make up the difference by which the plan fell short of the goal, including any prior shortfall that had accumulated if the plan fell short of the goal in prior years. There is no corresponding requirement in attainment planning to increase the stringency of the plan by an amount that somehow makes up for any shortfall in attainment from prior years; instead the revised plan must demonstrate attainment going forward, and other more stringent requirements (such as requirements for best available control measures) may be triggered.
This distinction is the natural result of the difference between these guidelines and NAAQS attainment planning. In this case, we are finalizing guidelines representing technology-based standards for a pollutant with cumulative and long-lasting effects. If a plan falls short of a performance goal, then in effect the standards of performance in the plan have failed to reflect the BSER over the corresponding period. Due to the cumulative effects of CO2
, it is possible to remedy this failure by requiring the plan to be revised in such a way that the standards of performance in the revised plan will reflect the BSER over the cumulative plan period, and this can be done by requiring the revised plan to make up the shortfall from the previous period. In short, the flexibility that these guidelines provide should not come at the cost of allowing the standards of performance to reflect less than the BSER over the long run.[854]
Some commenters noted that 111(d) does not contain explicit provisions regarding corrective measures, and they therefore inferred that the EPA is not authorized to require them. That inference is mistaken. The requirement for 111(d) plans to “provide for implementation and enforcement” of the standards of performance is ambiguous and does not directly speak to whether corrective measures should or should not be required. There is therefore a gap for the EPA to fill. While the discussion above about Part D does not independently provide any authority to fill this gap, the fact that Congress created a scheme with stages of planning in Part D suggests that it would be reasonable, if appropriate, to fill this gap in 111(d) in a similar way.
In this guideline, it is appropriate for emission standards plans to fill this gap with corrective measures if triggered. There are two ways an emission standards plan can provide for implementation of standards of performance that achieve the CO2
( printed page 64869)
emission performance rates or requisite state CO2
emission performance goal. First, the state can set emission standards that necessarily achieve the performance rates or goal, even if the affected EGUs in the future vary in their relative amounts of electricity generated. Second, the state can set emission standards that are demonstrated to achieve the performance rates or goal based on assumptions about the relative amounts of electricity generated, but which may turn out to not actually achieve the goal even if all affected EGUs comply. This is analogous to an attainment plan that demonstrated attainment by the applicable attainment date, but due to unpredicted economic changes actually failed to attain. In this second case, the EPA interprets the ambiguous language “provide for implementation . . . of standards of performance” in the context of achieving the performance rate or emissions goal, to mean that at the time the plan is submitted it must contain some mechanism to check the progress of the plan and correct course. The EPA has determined that, for this particular rule, the minimum mechanism is the set of milestones and provisions for corrective measures specified in this rule. Indeed, not requiring corrective measures in the case of deficient plan performance would undercut the viability of state plan options other than emission standard plans with uniform rates applied to all affected EGUs within the state.
4. Out-Year Requirements: Maintaining or Improving the Level of Emission Performance Required by the Emission Guidelines
The agency is determining CO2
emission performance rates and state CO2
emission goals for affected EGU emission performance based on application of the BSER during specified time periods. This raises the question of whether affected EGU emission performance should be maintained at the 2030 level—or instead should be further improved—once the final CO2
emission performance rate or state CO2
emission goal is met in 2030. This involves questions of performance rate and goal-setting as well as questions about state planning. The EPA believes that Congress either intended the emission performance improvements required under CAA section 111(d) to be maintained or, through silence, authorized the EPA to reasonably require maintenance. Other CAA section 111(d) emission guidelines set emission limits that do not expire. Therefore, the EPA is finalizing that the level of emission performance for affected EGUs represented by the final CO2
emission performance rates or state CO2
emission goal must continue to be maintained in the years after 2030.
As noted above, the state plan must demonstrate that plan measures are projected to achieve the final emission performance level by 2030. In addition, the state plan must identify requirements that continue to apply after 2030 and are likely to maintain affected EGU emission performance meeting the final goal. The state plan would be considered to provide for maintenance of emission performance consistent with the final goal if the plan measures used to demonstrate projected achievement of the final goal by 2030 will continue in force and not sunset. After implementation, the state is required to compare actual plan performance against the final goal on a 2-year average basis starting in 2030, and to implement corrective measures or a backstop if triggered.
In the proposal, the EPA noted that “CAA section 111(b)(1)(B) calls for the EPA, at least every eight years, to review and, if appropriate, revise federal standards of performance for new sources” in order to assure regular updating of performance standards as technical advances provide technologies that are cleaner or less costly. The proposal “requests comment on the implications of this concept, if any, for CAA section 111(d).” 79 FR 34830, 34908/3 (June 18, 2014).
We acknowledge the obligation to review section 111(b) standards as stated. The EPA is not finalizing any position with respect to any implications of this concept for section 111(d). We are promulgating rules for section 111(d) state plans that will establish standards of performance for existing sources to which a section 111(b) standard of performance would apply if such sources were new sources, within the definition in section 111(a)(2) of “new source.” It is not necessary to address at this time whether subsequent review and/or appropriate revision of the corresponding section 111(b) standard of performance have any implications for review and/or revision of this rule.
a.
Legal basis for maintaining emission performance.
In the proposal, the EPA proposed “that the level of emission performance for affected EGUs represented by the final goal should continue to be maintained.” The EPA explained that “Congress either intended the emission performance improvements required under CAA section 111(d) to be permanent or, through silence, authorized the EPA to reasonably require permanence. Other CAA section 111(d) emission guidelines set emission limits to be met permanently.” 79 FR 34830, 34908/2 (June 18, 2014). We also requested comment on whether “we should establish BSER-based state performance goals that extend further into the future (
e.g.
beyond the proposed planning period), and if so, what those levels of improved performance should be.”
Id.
at 34908/3.
We received adverse comment on establishing BSER-based state performance goals beyond the proposed planning period. Commenters argued that we did not have a sufficient basis at this time to determine what those future goals should be. We agree and have decided not to establish such goals. We are finalizing, though, that the level of emission performance for affected EGUs represented by the final goal should continue to be maintained, for the reasons given in our proposal and quoted above.
The general structure of the CAA supports our interpretation. Section 111(d) plans establish standards of performance that reflect the BSER, a technology-based standard. Generally speaking, in the future technology will only improve, and correspondingly the CAA does not provide explicit processes to relax technology-based standards. In contrast, the provisions in Part D of title I that address attainment of health-based standards, the NAAQS, explicitly provide that once the NAAQS are attained, emission reduction measures may be relaxed so long as the NAAQS are maintained. The absence in section 111(d) of explicit provisions for future relaxation of emission reduction measures, as compared to Part D, supports our interpretation that the emission reductions continue to be on-going after the CO2
emission performance rates or state CO2
emission goals are achieved in 2030. This is consistent with our past practice for section 111(d) rules, which do not contain any provision that in the future removes or relaxes the promulgated guidelines. In light of the persistence of CO2
as a pollutant and its long-term impacts, it is particularly critical in these guidelines to explicitly provide for continuing emission reductions.
G. Additional Considerations for State Plans
1. Consideration of a Facility's “Remaining Useful Life” and “Other Factors”
This section discusses the way in which the final emission guidelines address the CAA section 111(d)(1)
( printed page 64870)
provision requiring the Administrator, in promulgating 111(d) regulations, to “permit the State in applying a standard of performance to any particular source under a [111(d)] plan . . . to take into consideration, among other factors, the remaining useful life of the existing source to which such standard applies.”
The final guidelines permit a state, in developing its state plan, to fully consider and take into account the remaining useful life of an affected EGU and other factors in establishing the requirements that apply to that EGU, as discussed further below. Therefore, consideration of facility-specific factors and in particular, remaining useful life, does not justify a state making further adjustments to the performance rates or aggregate emission goal that the guidelines define for affected EGUs in a state and that must be achieved by the state plan. Thus, these guidelines do not provide for states to make additional goal adjustments based on remaining useful life and other facility-specific factors because they can fully consider these factors in designing their plans.
a.
Statutory and regulatory backdrop.
This section describes the statutory and existing regulatory background concerning facility-specific considerations in implementation of section 111(d).
Section 111(d)(1)(A) requires states to submit a plan that “establishes standards of performance” for existing sources. Under section 111(d)(1)(B), the plan must also “provide for implementation and enforcement of such standards of performance.” Finally, the last sentence of section 111(d)(1) provides: “Regulations of the Administrator under this paragraph shall permit the State in applying a standard of performance to any particular source under a plan submitted under this paragraph to take into consideration, among other factors, the remaining useful life of the existing source to which such standard applies.”
The EPA's 1975 implementing regulations [855]
addressed a number of facility-specific factors that might affect requirements for an existing source under section 111(d). Those regulations provide that for designated pollutants, standards of performance in state plans must be as stringent as the EPA's emission guidelines. Deviation from the standard might be appropriate where the state demonstrates with respect to a specific facility (or class of facilities):
(1) Unreasonable cost of control resulting from plant age, location, or basic process design;
(2) Physical impossibility of installing necessary control equipment; or
(3) Other factors specific to the facility (or class of facilities) that make application of a less stringent standard or final compliance time significantly more reasonable.
This provision was amended in 1995 (60 FR 65387, December 19, 1995), and is now prefaced with the language “Unless otherwise specified in the applicable subpart on a case-by-case basis for particular designated facilities or classes of facilities.” 40 CFR 60.24(f).
b.
Our proposal regarding the implementing regulations.
Our proposal stated that the reference to “[u]nreasonable cost of control resulting from plant age” in 60.24(f) “implements” the statutory provision on remaining useful life. We also stated that the implementing regulations “provide the EPA's default structure for implementing the remaining useful life provision of CAA section 111(d).” We noted that the prefatory language “unless otherwise specified in the applicable subpart” gives the EPA discretion to alter the extent to which the implementing rules applied if appropriate for a particular source category and guidelines. We requested comment on our analysis of the existing implementing regulations and any implications for our regulatory text in respect to how these guidelines relate to those regulations.
Commenters stated, among other things, that the sentence concerning “remaining useful life” was added in the 1977 CAA Amendments and that therefore it could not be said that provisions from the 1975 implementing regulations “implement” the sentence. The EPA does not think as a general matter that it is necessarily impossible that a pre-statutory amendment rule could continue to serve as a reasonable implementation of a post-statutory amendment provision. However, we also think it is appropriate, as we suggested in the June 2014 proposal, to specify in the applicable subpart for these guidelines that the provisions in 60.24(f) should not apply to the class of facilities covered by these guidelines. As a result, regardless of whether the implementing regulations appropriately implement the “remaining useful life” provision in general, the relevant consideration is that, as we now explain, these particular guidelines “permit the State in applying a standard of performance to any particular source under a plan submitted under this paragraph to take into consideration, among other factors, the remaining useful life of the existing source to which such standard applies.”
c.
How these emission guidelines permit states to consider remaining useful life and other facility-specific factors.
The EPA notes that, in general, the implementing regulation provisions for remaining useful life and other facility-specific factors are relevant for emission guidelines in which the EPA specifies a presumptive standard of performance that must be fully and directly implemented by each individual existing source within a specified source category. Such guidelines are similar to a CAA section 111(b) standard in their form. For example, the EPA emission guidelines for sulfuric acid plants, phosphate fertilizer plants, primary aluminum plants, Kraft pulp plants, and municipal solid waste landfills specify emission limits for sources.[856]
In the case of such emission guidelines, some individual sources, by virtue of their age or other unique circumstances, may warrant special accommodation.
In these final guidelines for state plans to limit CO2
from affected EGUs, however, the agency does not specify presumptive performance rates that each individual EGU is to achieve in the absence of trading. Instead, these guidelines provide collective performance rates for two classes of affected EGUs (steam generating units and stationary combustion turbines), and give states the alternative of developing plans to achieve a state emission goal for the collective group of all affected EGUs in a state. Providing states with the ability to consider facility-specific factors such as remaining useful life in designing their state plans is one of the fundamental reasons that the EPA designed the final rule in this way. In addition, the significant revisions since proposal to address achievability concerns (
e.g.,
moving the start date from 2020 to 2022, and other changes in interim and final state goals summarized in the next section) will help to ensure that states in practice can consider remaining useful life and other facility-specific factors in setting EGU requirements. Of course, EGUs vary considerably in age, so remaining useful life is potentially
( printed page 64871)
relevant to regulation of some units and not others.
The guidelines capitalize on the inherent flexibility offered by the CO2
emission performance rates and by the state CO2
emission goals approach, allowing states flexibility on the form of the EGU standards that they include in CAA section 111(d) plans. A state could select a form of standards (
e.g.,
marketable credits or permits, retirement of certain older facilities after their useful life, etc.) that avoids or diminishes concerns about facility-specific factors such as remaining useful life. If a state adopted the CO2
emission performance rates for fossil fuel-fired electric utility steam generating units and stationary combustion turbines in conjunction with rate-based trading, though, the state would be taking remaining useful life into consideration by allowing affected EGUs to comply using ERCs. In effect, under a trading program with repeating compliance periods, a facility with a short remaining useful life has a total outlay that is proportionately smaller than a facility with a long remaining useful life, simply because the first facility would need to comply for fewer compliance periods and would need proportionately fewer ERCs than the second facility. Buying ERCs would avoid excessive up-front capital expenditures that might be unreasonable for a facility with a short remaining useful life, and would reduce the potential for stranded assets.
In addition to providing states with flexibility on the form of the standards of performance in their plans, the guidelines leave to each state the design of the specific requirements that fall on each affected EGU in applying those standards. To the extent that an emission standard that a state may wish to adopt for affected EGUs raises facility-specific issues, the state may make adjustments to a particular facility's requirements on facility-specific grounds, so long as any such adjustments are reflected (along with any necessary compensating emission reductions to meet the state goal) in the state's CAA section 111(d) plan submission.
Finally, we note that these guidelines permit states to use a rate or mass CO2
emission goal, and that each of these pathways allow states multiple design choices. Under either pathway states can take into consideration remaining useful life and seek to avoid stranded assets.
The EPA believes that this approach to permitting states to consider remaining useful life is appropriate because it reflects, and is compatible with, the interconnected nature of the electricity system.
Although this discussion emphasizes state flexibility on plan design, it is important to note that the main intended beneficiaries of state flexibility are the affected EGUs themselves. As a key case in point, the EPA has endeavored to craft the final guidelines to support and facilitate state plans that include trading systems, including interstate trading systems that can help EGUs continue to operate with the flexibility that they currently enjoy on regional grid levels.
Trading can provide affected EGUs that have a limited remaining useful life with the flexibility to comply through purchasing allowances or ERCs, thereby avoiding major capital expenditures that would create long-term debt. By buying allowances or ERCs, affected EGUs with a limited remaining useful life contribute to achieving emission reductions from the source category during the years that they operate. During its lifetime, a facility with a short remaining useful life will need fewer total credits or allowances than an otherwise comparable facility with a long remaining useful life, but the annualized cost to the two facilities is the same.[857]
In part to help states address remaining useful life considerations, the final guidelines facilitate state plans that employ trading in multiple ways:
By allowing trading under emission standards plans and state measures plans, and under rate-based plans and mass-based plans;
By defining national EGU performance rates that make it easier for states to set up rate-based trading regimes that allow for interstate trading of ERCs;
By clearly defining the requirements for mass-based and rate-based trading systems to ensure their integrity; and
By providing information on potential allocation approaches for mass-based trading.
In addition, the EPA is separately proposing model trading rules for rate-based and mass-based trading to assist states with design of these programs in the section 111(d) context.
d.
Why remaining useful life and other facility-specific factors do not warrant adjustments in the guidelines' performance rates and state goals.
Under the final guidelines, remaining useful life and other facility-specific considerations do not provide a basis for adjusting the CO2
emission performance rates, or the state's rate-based or mass-based CO2
emission goals, nor do they affect the state's obligation to develop and submit an approvable CAA section 111(d) plan that adopts the CO2
emission performance rates or achieves the goal by the applicable deadline. After considering public comments discussed below and in the response to comments document, the EPA has retained this aspect of the proposed rule for the reasons described below.
As noted above, the final guidelines provide aggregate emission goals for affected EGUs in each state, in addition to the CO2
emission performance rates. The guidelines also reflect a number of changes from proposal to address concerns about achievability of proposed state goals that were raised in public comments, many of which were explicitly prompted by consideration of the remaining useful life issue. The result is to afford states with broad flexibility to design requirements for affected EGUs to achieve the CO2
emission performance rates or state CO2
emission goals in ways that avoid requiring major capital expenditures, or imposing unreasonable costs, on those affected EGUs that have a limited remaining useful life. State plans may use any combination of the emissions reduction methods represented by the building blocks, and may also choose to employ emission reduction methods that were not assumed in calculating state goals.
To be more specific, the EPA notes that a state is not required to achieve the same level of emission reductions with respect to any one building block as assumed in the EPA's BSER analysis. A state may use any combination of measures, including those not specifically factored into the BSER by the EPA. The EPA has estimated reasonable rather than maximum possible implementation levels for each building block in order to establish EGU emission rates and state goals that are achievable while allowing states to take advantage of the flexibility to pursue some building blocks more aggressively, and others less aggressively, than is reflected in the agency's computations, according to each state's needs and preferences. The guidelines provide further flexibility by allowing state plans to use emission reduction methods not reflected in the BSER. A description of multiple emission reduction methods is provided in sections VIII.I-K.
e.
Response to key comments on remaining useful life.
In response to the proposed guidelines, some commenters said that the proposed state goals were
( printed page 64872)
unachievable and therefore too stringent to provide states, as a practical matter, with the flexibility to consider remaining useful life for individual units. These commenters said the result would be premature retirements and stranded assets.
In the final guidelines, the EPA has addressed the comments about lack of practical flexibility to consider remaining useful life by revising key elements of the guidelines in ways that will ensure that the CO2
emission performance rates and state CO2
emission goals are achievable considering cost. At the same time, the final guidelines maintain the broad flexibility of each state to design its own compliance pathway, taking into account any facility-level concerns—including remaining useful life—in designing EGU requirements.
The changes to the BSER and goal-setting methodologies include:
Starting the interim goal period in 2022 rather than 2020, which allows more lead time for states and regulated entities and helps to ensure that the interim goal is achievable
Revising the goal-setting formula and the state goals themselves
Updating analyses of achievable levels of improvement through the building blocks that together represent the BSER, while keeping them at reasonable, rather than maximum, levels (thus creating headroom which can, and is intended to, help to accommodate the range of ages of different facilities)
Providing an explicit phase-in schedule for meeting the revised interim goals, while also allowing a state the option of choosing its own emission reduction trajectory
The final guidelines also contain changes to avoid certain inconsistencies between the goal-setting methodology and accounting of reductions under state plans that could have made state goals less achievable for some states.
Together, the changes described above help to ensure that the CO2
emission performance rates and state CO2
emission goals established in the final guidelines are achievable, and leave states with the practical ability to issue rules that take into account the remaining useful life of affected EGU.
As explained in the Legal Memorandum accompanying this rule, the EPA believes that Congress intended the remaining useful life provision to provide a mechanism for states to avoid the imposition of unreasonable retrofit costs on existing sources with relatively short remaining useful lives, a scenario that could result in stranded assets. However, commenters on the proposed rule raised a different stranded assets concern not primarily related to retrofit costs—a concern that the proposed rule could cause changes in economic competitiveness of particular EGUs that would prompt their retirement before the end of their economically useful lives. These commenters said the proposed state goals were so stringent that states would have no choice but to adopt requirements that would result in retirements of coal-fired capacity that had been built relatively recently or had recently made pollution control investments. In response to these comments, the EPA has conducted a stranded assets analysis which demonstrates that the CO2
emission performance rates and state goals in the final guidelines provide sufficient flexibility to states to address stranded asset concerns. The EPA shares the goal of minimizing stranded assets. Although nothing in section 111(d) explicitly bars a guideline that results in some facilities becoming uneconomic before the end of their useful lives, the EPA nonetheless has striven to design the guidelines so as to give states flexibility to develop plans that include, for example, differential treatment of affected EGUs or opportunities to rely on emissions trading, to allow power companies to recover their investments in generation units.
For purposes of the stranded assets analysis, the EPA considered a potential “stranded asset” to be an investment in a coal-fired EGU (or in a capital-intensive pollution control installed at such an EGU) that retires before it is fully depreciated. Book life is the period over which long-lived assets are depreciated for financial reporting purposes. The agency estimated typical book life by researching financial statements of utility and merchant generation companies in filings to the Securities and Exchange Commission. The agency estimated the book life of coal-fired EGUs to be 40 years, and assumed a 20-year book life for pollution control retrofits. The book life of coal-fired EGUs (coal steam and IGCC) is twice as long as the debt life and the depreciation schedule used for federal tax purposes. Although the book life for environmental retrofits is often 15 years, the agency conservatively assumed 20 years in this analysis.
The analysis examined coal generation in the three large regional interconnections of the U.S. The analysis found that in both 2025 and 2030, for each region, the amount of 2012 coal generation included in the final guidelines' emission performance rate calculation—specifically, the generation remaining after the BSER calculation—is greater than the amount of 2012 generation from coal-fired EGUs that are not fully depreciated in those years under the book life assumptions described above. This shows that the final rule allows flexibility for states to preserve these units as part of their plans.
To put this analysis in perspective: The EPA's role is to set emission guidelines that meet the statutory requirements, which includes consideration of cost in identifying the BSER, as the EPA has done in these guidelines. States have a broad degree of flexibility to design plans to achieve the rates in the emission guidelines in a manner that meets their policy priorities, including ensuring cost-effective compliance. Although not a required component of the EPA's consideration of cost, this analysis shows that the CO2
emission performance rates in the final guidelines can be met without the retirement of affected EGUs before the end of their book life, and without the retirement of affected EGUs before the end of the book life of capital-intensive pollution control retrofits installed on those EGUs. Thus, according to this analysis, the CO2
emission performance rates and state CO2
emission goals need not result in stranded assets. The EPA recognizes that power plant economics are determined by many aspects of markets that are outside of the EPA's control, such as wholesale power prices and capacity prices, and that the compliance path of least cost may involve retiring assets that have not fully depreciated. Nonetheless, this analysis further demonstrates the extent of flexibility available to states in designing their plans to best serve the policy priorities of the state. Details are available in a memorandum to the docket.[858]
Several commenters said that the statute does not authorize the EPA to require other facilities to achieve greater reductions to compensate for a facility that warrants relief based on remaining useful life. One said that consideration of remaining useful life and other relevant factors is a one-way ratchet that provides relief to sources that cannot achieve the BSER, and that the EPA turns that approach on its head by prohibiting a state from providing such relief to a specific facility unless it can identify another facility to “punish” by requiring additional emissions reductions to offset that relief.
The EPA disagrees with these comments, which proceed from an incorrect premise. The EPA is not determining a BSER-based emission level achievable by each individual facility without trading, and then
( printed page 64873)
requiring better-than-BSER from some facilities to make up for worse-than-BSER performance that a state authorizes for other facilities because of a short remaining useful life. Rather, as previously noted, the guidelines set CO2
emission performance rates and state CO2
emission goals that represent the average or aggregate emission level achievable by affected EGUs based on regional average estimates of the impact of applying the BSER to collective groupings of affected EGUs.[859]
In estimating the amount of improvement achievable through each building block (
e.g.,
improvement in heat rate or amount of generation shift to lower-emitting EGUs), the EPA has estimated the average level achievable by EGUs in a region rather than attempting to estimate the level achievable by each and every affected EGU in the absence of trading. Thus, the fact that an individual facility may be unable, for example, to achieve the average level of heat rate improvement assumed in goal-setting is consistent with the EPA's analysis, and does not undermine the EPA's determination of CO2
emission performance rates and state CO2
emission goals. The Legal Memorandum discusses additional reasons that the agency disagrees with comments that the guideline must permit adjustments in the guidelines' CO2
emission performance rates and state CO2
emission goals based on remaining useful life considerations.
An additional reason that the EPA believes that consideration of remaining useful life and other facility-specific factors does not warrant adjustments to state goals is that the design of the guidelines does not mandate that states impose requirements that would call for substantial capital investments at affected EGUs late in their useful life. Multiple methods are available for reducing emissions from affected EGUs that do not involve capital investments by the owner/operator of an affected EGU. For example, generation shifts among affected EGUs, and addition of new RE generating capacity do not generally involve capital investments by the owner/operator at an affected EGU. Additional emission reduction methods available to states that do not entail significant capital costs at affected EGUs are discussed elsewhere in this preamble.
Heat rate improvements at affected EGUs may require capital investments. However, states have flexibility to design their plan requirements; they are not required to mandate heat rate improvements at plants that have limited remaining useful life. In fact, a state can choose whether or not to require heat rate improvements at all. The agency also notes that capital expenditures for heat rate improvements would be much smaller than capital expenditures required for example, for purchase and installation of scrubbers to remove SO2; a fleet-wide average cost for heat rate improvements based primarily on best practices at coal-fired generating units would not likely exceed $100/kW, compared with a typical SO2
wet scrubber cost of $500/kW (costs vary with unit size).[860]
Even if a state did choose to adopt requirements for heat rate improvements, the proposed guidelines would allow states to regulate affected EGUs through flexible regulatory approaches that do not require affected EGUs to incur large capital costs (
e.g.,
averaging and trading programs). Under the EPA's final approach—establishing state goals and providing states with flexibility in plan design—states have flexibility to make exactly the kind of judgments necessary to avoid requiring capital investments that would result in stranded assets.
Remaining useful life and other factors, because of their facility-specific nature, are potentially relevant as states determine requirements that are directly applicable to affected EGUs. If relief is due a particular facility, the state has an available toolbox of emission reduction methods that it can use to develop a section 111(d) plan that will achieve the CO2
emission performance rates or state CO2
emission goals on time. The EPA therefore concludes that the remaining useful life of affected EGUs, and the other facility-specific factors identified in the existing implementing regulations, should not be regarded as a basis for adjusting the CO2
emission performance rates or a state CO2
emission goal, and should not relieve a state of its obligation to develop and submit an approvable plan that achieves that goal on time.
f.
Legal considerations regarding remaining useful life.
Section 111(d)(1) requires the EPA in promulgating section 111(d) regulations to “permit the State in applying a standard of performance to any particular source under a plan submitted under this paragraph to take into consideration, among other factors, the remaining useful life of the existing source to which such standard applies.” Here, we discuss the legal basis for determining that the emission guidelines are consistent with this statutory requirement. For details, please see the Legal Memorandum.
Section 111(d)(1) only requires that EPA emission guidelines permit states to take into account remaining useful life (among other factors), but section 111(d)(1) does not specify how the EPA must permit that. In other words, the meaning of the provision and the way that the EPA is to implement it in promulgating guidelines are not specified further in the provision. The provision is ambiguous and capable of implementation in several ways, and therefore the EPA has discretion to interpret and apply it. Furthermore, section 111(d)(1) does not suggest that states must be given carte blanche to consider remaining useful life in any way that can be imagined. As detailed above in sections VIII.G.1.c-e, these guidelines permit states to take into account remaining useful life in a number of reasonable ways and thus the guidelines satisfy the statutory obligation.
The phrase “remaining useful life” also appears in the visibility provisions of section 169A. There, in determining best available retrofit technology (BART), the state (or the EPA) must take into consideration (among other factors) “the remaining useful life of the source.” 42 U.S.C. 7491(g)(2); see also
id.
(g)(1) (reasonable progress). In the context of the visibility program, we have interpreted this provision to mean that the remaining useful life should be considered when calculating the annualized costs of retrofit controls.
See40 CFR Pt. 51, App. Y, IV.D.4.k.1. This annualized cost is then used to determine a cost effectiveness, in dollars per ton of pollutant removed on an annual basis. As a result, a technology with a large initial capital cost that might have a reasonable cost-effectiveness for a facility with a long remaining useful life would have a much higher and possibly unreasonable cost-effectiveness for a facility with a short remaining useful life.
Although section 111(d)(1) is different than section 169A(g)(2) and need not be interpreted in the same way, we would note (as discussed in detail in sections VIII.G.1.c-e, section 5.11 of the Response to Comments document, and the Legal Memorandum) that (for
( printed page 64874)
example) a trading program under these section 111(d) guidelines only requires compliance on a periodic basis and does not require any initial capital expenditures. Thus, over the life of the facility, a facility with a short remaining useful life will need fewer total credits or allowances than an otherwise comparable facility with a long remaining useful life, but the annualized cost to the two facilities is the same. In other words, under a trading program remaining useful life of a source is automatically accounted for in the way it is accounted for under the visibility program.
Some commenters stated that the EPA's interpretation of remaining useful life is impermissible. These commenters claimed that states, if they wish to take into account remaining useful life at one affected EGU, must relax the stringency of the emission standard for that EGU. Then, the state would be compelled to increase the stringency of emission standards at other affected EGUs in order to achieve the state performance goal. According to these commenters, section 111(d) does not allow this outcome.
First, the commenters are mistaken in their premise. As discussed in section VIII.G.1, section 5.11 of the Response to Comments document, the Legal Memorandum, and in the example immediately above, states can impose the exact same emission standards on two affected EGUs and still take into account remaining useful life through the availability of trading. In other words, states need not relax an emission standard here and strengthen an emission standard there in order to take into account remaining useful life. Thus, these guidelines permit states to take into account remaining useful life without any of the effects commenters are concerned about.
Second, even if states decide to relax emission standards at one EGU, on the basis of remaining useful life or any other factor, nothing in the last sentence of section 111(d)(1) prohibits these guidelines from requiring the state plan to still meet the CO2
emission performance rates or state CO2
emission goal. In fact, that sentence is completely silent on the issue. Thus, the EPA has the discretion to determine what should be the concomitant effects if a state chooses to consider remaining useful life in a particular way. In this case the concomitant effect of a state relaxing one emission standard may be that the state must make up for it elsewhere in order to meet the goal, but nothing in section 111(d)(1), including the statutory requirement to permit consideration of remaining useful life, prohibits that outcome.
2. Electric Reliability
The final rule features overall flexibility, a long planning and implementation horizon, and a wide range of options for states and affected EGUs to achieve the CO2
emission performance rates or state CO2
emission goal. This design reflects, among other things, the EPA's commitment to ensuring that compliance with the final rule does not interfere with the industry's ability to maintain the reliability of the nation's electricity supply. Comments from state, regional and federal reliability entities, power companies and others, as well as consultation with the Department of Energy (DOE) and Federal Energy Regulatory Commission (FERC), helped inform a number of changes made in this final rule to address reliability. In addition, FERC conducted one national and three regional technical conferences on the proposed rule in which the EPA participated and at which the issue of reliability was raised by numerous participants.
As discussed throughout the preamble and TSDs, the electricity sector is undergoing a period of intense change. While the change in the resource mix has accelerated in recent years, wind, solar, other RE, and EE resources have been reliably participating in the electric sector for a number of years. Many of the potential changes to the electric system that the final rule may encourage, such as shifts to cleaner sources of power and efforts to reduce electricity demand, are already well underway in the electric industry. To the extent that the final rule accelerates these changes, there are multiple features well embedded in the electricity system that ensure that electric system reliability will be maintained. Electric system reliability is continually being considered and planned for. For example, in the Energy Policy Act of 2005, Congress added a section to the Federal Power Act to make reliability standards mandatory and enforceable by FERC and the North American Electric Reliability Corporation (NERC), the Electric Reliability Organization which FERC designated and oversees. Along with its standards development work, NERC conducts annual reliability assessments via a 10-year forecast and winter and summer forecasts; audits owners, operators, and users for preparedness; and educates and trains industry personnel. Numerous other entities such as FERC, DOE, state PUCs, ISOs/RTOs, and other planning authorities also consider the reliability of the electric system. There are also numerous remedies that are routinely employed when there is a specific local or regional reliability issue. These include transmission system upgrades, installation of new generating capacity, calling on demand response, and other demand-side actions.
Additionally, planning authorities and system operators constantly consider, plan for, and monitor the reliability of the electricity system with both a long-term and short-term perspective. Over the last century, the electric industry's efforts regarding electric system reliability have become multidimensional, comprehensive, and sophisticated. Under this approach, planning authorities plan the system to assure the availability of sufficient generation, transmission, and distribution capacity to meet system needs in a way that minimizes the likelihood of equipment failure.[861]
Long-term system planning happens at both the local and regional levels with all segments of the electric system needing to operate together in an efficient and reliable manner. In the short-term, electric system operators operate the system within safe operating margins and work to restore the system quickly if a disruption occurs.[862]
Mandatory reliability standards apply to how the bulk electric system is planned and operated. For example, transmission operators and balancing authorities have to develop, maintain, and implement a set of plans to mitigate operating emergencies.[863]
As the electricity market changes and new challenges emerge, electric system regulators and industry participants make changes to how the electric system is designed and operated to respond to these challenges. For example, expressing reliability and rate concerns about fuel assurance issues, FERC recently issued an order requiring ISOs/RTOs to report on the status of their efforts to address market and system performance associated with fuel assurance.[864]
In February of 2015, Midcontinent Independent System
( printed page 64875)
Operator (MISO), California Independent System Operator Corporation (CAISO), New York Independent System Operator (NYISO), Southwest Power Pool (SPP), ISO New England (ISO-NE), and PJM Interconnection (PJM) each filed a report with FERC highlighting their efforts to respond to fuel assurance concerns.[865]
This is just one of many examples where electric system regulators and industry participants recognize a potential reliability issue and are proactively searching for solutions.
The EPA's approach in this final rule is consistent with our commitment to ensuring that compliance with the final rule does not interfere with the industry's ability to maintain the reliability of the nation's electricity supply. Many aspects of the final rule's design are intended to support system reliability, especially the long compliance period and the basic design that allows states and affected EGUs flexibility to include a large variety of approaches and measures to achieve the environmental goals in a way that is tailored to each state's and utility's energy resources and policies. Despite the flexibility built into the design of the proposal, and the long emission reduction trajectory, many commenters expressed concerns that the proposed rule could jeopardize electric system reliability. We note that the EPA has received similar comments in EPA rulemakings dating as far back as the 1970s. The EPA has always taken and continues to take electric system reliability comments very seriously. These reoccurring comments with regard to reliability notwithstanding, the electric industry has done an excellent job of maintaining reliability, including when it has had to comply with environmental rules with much shorter compliance periods and much less flexibility than this final rule provides. Now, more than ever, the electric industry has tools available to maintain reliability, including mandatory and enforceable reliability standards.[866]
As with numerous prior CAA regulations affecting the electric power sector, environmental requirements for this industry are accommodated within the existing extensive framework established by federal and state law to ensure that electricity production and delivery are balanced on an ongoing basis and planned sufficiently to ensure reliability and affordability into the future. In addition, changes that the EPA is making in this final rule respond directly to the comments and the suggestions that we received on reliability and provide further assurance that implementation of the final rule will not create reliability concerns.
First, the final rule allows significant flexibility in how the applicable CO2
emission performance rates or the statewide CO2
goals are met. Given the differing characteristics of the electric grid within each state and region, there are many paths to meeting the final rule's requirements that can be taken while continuing to maintain a reliable electricity supply. As further described elsewhere in section VIII, states can develop plans to meet the CO2
emission performance rates or state CO2
emission goals by choosing from a variety of state plan types and approaches that afford states and affected EGUs appropriate flexibility. EE and other measures that were not included in the determination of the BSER can strengthen a state's ability to establish a plan to meet the CO2
emission performance rates or state CO2
emission goals by providing a considerable amount of headroom above the levels of the rates and goals. EE especially, because it reduces load, can provide assurance that reliability can and will be maintained. Additionally, the final rule offers opportunities for trading among affected EGUs within and between states, and other multi-state approaches that will further support electric system reliability.
Second, the final rule provides sufficient time to ensure system reliability. The final rule retains the 2030 date for the final period, which commenters largely supported as reasonable and not a concern for reliability, and addresses one of the key issues that commenters pointed to as a reliability-related concern by both moving the start of the interim period from 2020 to 2022 and adjusting the interim goals to provide a more gradual phasing-in of the initial reduction requirement and thus a more gradual emissions reduction trajectory or glide path to the final 2030 goals. These changes deliver on the intent of the proposal to afford states and affected EGUs the latitude to determine their own emissions reduction schedules over the interim period. Both FERC's May 15, 2015 letter [867]
and the comment record made it clear that providing sufficient time for planning and implementation is essential to ensuring electric system reliability. The EPA has responded by providing additional time to allow for planning and implementation of the final rule requirements, while at the same time allowing enough time between the beginning of the interim period and 2030 to achieve state goals or emission performance rates. We note that the final rule does not require that all states have met their interim goal or performance rate by 2022 but rather that they meet it on average or cumulatively, as appropriate, during the 2022 to 2029 period.
As a result of these changes, the states themselves will have a meaningful opportunity—which, again, many commenters suggested the timing and stringency of the proposal failed to create despite our intent to do so—to determine the timing, cadence and sequence of actions needed for states and sources to meet final rule requirements while accommodating the ongoing activity needed to ensure system reliability. The final rule provides more than 6 years before reductions are required and an 8-year period from 2022 to 2029 to meet interim goals. Moreover, while the final rule requires each state to submit a plan by September 6, 2016, we recognize that some states may need more than 1 year to complete all of the actions needed for their final state plans, including
( printed page 64876)
consideration of reliability. Therefore, states have the opportunity to receive an extension for submitting a final plan. If the state needs additional time to submit a final plan, then the state may submit an initial submittal by September 6, 2016, that must address three required components sufficiently to demonstrate that a state is able to undertake steps and processes necessary to timely submit a final plan by the extended date of September 6, 2018.
Third, we are including in the final rule a requirement that each state demonstrate in its final state plan submittal that it has considered reliability issues in developing its plan. This was suggested by a number of commenters, and we agree that it is a useful element to state plan development.
Fourth, the final rule provides a mechanism for a state to seek a revision to its plan in order to address changes in circumstances that could have reliability impacts if not accommodated in the plan. The long compliance timeframe, with several interim steps, naturally provides opportunities for states, working with their utilities and reliability entities, to assess how implementation is proceeding, identify unforeseen changes that may warrant plan revisions, and work with the EPA to make necessary revisions. Similarly, the ready availability of emissions trading as a compliance tool affords EGUs ample flexibility to integrate compliance with both routine and critical reliability needs.
Fifth, in response to a variety of comments, we are providing a reliability safety mechanism that provides a path for a state to come to the EPA during an immediate, unforeseen, emergency situation that threatens reliability to notify the EPA that an affected EGU or EGUs may need to temporarily comply with modified emission standards to respond to this kind of reliability concern.
Sixth and finally, we are committed to maintaining an ongoing relationship with FERC and DOE as this final rule is implemented to help ensure continued reliable electric generation and transmission.
We provide more details about these various elements of the final rule, as well as other features of the rule that support system reliability, below.
a.
Summary of key comments.
The EPA received a number of comments regarding the proposed rule and electric reliability. Many commenters provided specific, useful ideas regarding changes that could be made to the proposal to specifically address their reliability concerns. For example, many commenters state that allowing additional time to comply could help in meeting the final rule requirements while addressing their reliability concerns. Some commenters suggest that additional time would allow them to evaluate potential reliability impacts and system changes that need to be made to comply with final rule requirements while allowing affected EGUs time to meet interim CO2
emissions goals. The EPA also received comment that market-based approaches have features that could help support reliability, and therefore we should encourage states to join or form regional market-based programs. Commenters also stated that the EPA should require states to consult with grid operators who would analyze the impact of state plans on reliability. A number of commenters also suggested that the EPA should include some sort of reliability safety valve in the final rule. We note that many participants at the FERC technical conferences on the proposed rule also discussed a reliability safety valve in great detail with many suggestions for how such a reliability mechanism could be designed. The EPA appreciates these and all the comments we received regarding the interaction of the proposal and electric reliability. We have carefully considered all comments, consulted further with FERC and incorporated many of the suggested changes in this final rule.
b.
Final rule flexibility.
In issuing this final rule, the EPA considered public comments on the potential interaction between the proposal and electric reliability. While we have made every effort to develop guidelines that would allow states and utilities to steer clear of potential reliability disruptions, a number of commenters argued that the possibility of an unanticipated reliability event cannot be entirely eliminated. It is important to note that there are many factors that influence system reliability and, given the complexity of the electric grid, electric system planners and operators likely will not completely avoid reliability issues, even in the absence of these guidelines. The EPA designed the final rule to ensure to the greatest extent possible that actions taken by states and affected EGUs to comply with the final rule do not increase potential reliability issues or complicate their resolution. In fact, to the extent that meeting final rule requirements results in the reduction of demand, upgrades in transmission efficiency and infrastructure, and investment in new, more efficient technologies, the outcome could be that the system is more robust and faces fewer risks to electric reliability.
One specific concern raised by many commenters is that the proposed plan development schedule may not leave sufficient time to conduct reliability planning between the development of state plans and the proposed start of the interim period in 2020. To address these concerns and to support a more effective reliability planning process, the EPA is moving the start of the interim period from 2020 to 2022 and adjusting the interim goals to provide a gradually phased-in initial reduction requirement and a more gradual glide path to the final 2030 goals. This more gradual application of the BSER over the 2022-2029 interim period provides the state with substantial latitude in selecting the emission reduction glide path for affected EGUs over that period. As noted above, the final rule also provides states with up to 3 years to adopt and submit their final state plans, and afterwards states can, if necessary, revise their plans, as discussed in section VIII.E.7. This timing gives system planners and operators the opportunity to do what they have already been doing; looking ahead to forecast potential contingencies that pose reliability risks and identifying those actions needed to mitigate those risks. The final rule allows states to develop a pathway over the interim period that reflects their own circumstances, such as reflecting planned additions and changes in generation mix and potentially taking advantage of opportunities for trading of credits or allowances by affected EGUs within and between states. Because achievement of the emission rates or goals can be demonstrated over several years, state plans can accommodate situations where, for example, it may take time to develop new generation, pipelines, or transmission while still providing many options for meeting the final rule requirements and planning for the reliability of the system.
c.
Considering reliability during state plan development process.
Under CAA section 111(d)(1)(B), state plans must provide for the implementation and enforcement of standards of performance for affected EGUs. The EPA does not believe a state that establishes standards of performance for affected EGUs without taking reliability concerns into consideration satisfactorily provides for the implementation of such standards of performance as required by CAA section 111(d)(1)(B), as a serious reliability issue would disrupt the state's provision
( printed page 64877)
of implementation of the state plan. Therefore, the EPA is requiring that each state demonstrate as part of its final state plan submission that it has considered reliability issues while developing its plan in order to ensure that standards of performance can be implemented and enforced as required by the CAA. If system reliability is threatened, the ability of affected EGUs to meet the requirements of this final rule could be compromised if they are required to operate beyond the emission standards established in state plans in order to maintain the reliability of the electric grid. The requirement that states consider reliability as part of the development of state plans is therefore designed to ensure that state plans are flexible enough to avoid this kind of potential conflict between maintaining reliability and providing for the implementation of emission standards for affected EGUs as required by the CAA.
A number of commenters, notably ISOs and RTOs, also discussed reliability concerns in the context of state plans and pointed out that planning and anticipation of change are among the essential ingredients of ensuring the ongoing reliability of the electricity system. To that end, they recommended that as states are developing state plans, their activity include the consideration of the reliability needs of the region in which affected EGUs operate and of the potential impact of actions to be taken in compliance with state plans. Therefore, we are requiring that each state demonstrate in its final state plan submittal that it has considered reliability issues in developing its plan. One particularly effective way in which states can make this demonstration is by consulting with the relevant ISOs/RTOs or other planning authorities as they develop their plans and documenting this consultation process in their state plan submissions. If a state chooses to consider reliability through consultation with the ISO/RTO or other planning authority, the EPA recommends that the state request that the planning authority review the state plan at least once during the plan development stage and provide its assessment of any reliability implications of the plan. Additionally, we encourage states that are considering reliability through an ISO/RTO or other planning authority consultation process to have a continuing dialogue with those entities during development of their final state plan. While following the recommendations of the planning authority would not be mandatory, the state should document its consultation process, any response and recommendations from the planning authority, and the state's response to those recommendations in its final state plan submittal to the EPA. This consultation is designed to inform how the state might adjust its plan for meeting the CO2
reduction requirements under this guideline; the consultation is not a basis for relaxing that requirement. While we consider this process to be an effective way for a state to demonstrate that it considered reliability in developing its final state plan, a state may provide other comparable support for a demonstration that it has considered reliability during the state plan development process.[868]
Also as discussed elsewhere in this preamble, the EPA encourages states to include state utility regulators and the state energy offices in the development of the state plan. These agencies have expertise that can help to assure that state plans complement the state's power sector. The EPA believes that this requirement to demonstrate consideration of reliability will provide an effective reliability evaluation in the state plan development process. It should further help states avoid any conflicts between state plans and the maintenance of reliability during implementation of the state plan and associated emission standards. Finally, we also encourage states as they develop their plans to consider, to the extent possible, other potential issues that may impact affected EGUs. For example, an affected EGU may be in an ISO/RTO that puts certain deadlines on generators that may not line up perfectly with state plan deadlines.
d.
State plan modifications.
If, during the implementation of a state plan, a reliability issue cannot be addressed within the range of actions or mechanisms encompassed in an approved state plan, the state can submit a plan revision to the EPA to amend its plan. In such a circumstance, the state plan may need to be adjusted to enable affected EGUs to continue to meet final rule requirements without causing an otherwise unmanageable reliability threat. In all cases the plan revision must still ensure the affected EGUs meet the emission performance level set out in the 111(d) final rule. Whether or not these circumstances occur will depend in part upon how each state designs its state plan. States that design plans with a high level of flexibility, such as market-based plans or multi-state plans, are less likely to face a potential conflict between state plan requirements and the maintenance of reliability. States that participate in multi-state programs will be better able to weather unexpected reliability risks.
Events not anticipated at the time of the final plan submittal—such as the retirement of a large low- or zero-emitting unit—may trigger the request for state plan revisions. It may also be the case that affected EGU-specific emission standards in a state plan are proving to be too inflexible to allow the plan to accommodate market or other changes in the power sector. In such instances, there should be a lead time between the announced retirement of the unit and the need to amend the state plan. Therefore, the state should be able to utilize the revisions process that the EPA provides.
The EPA will review a plan revision per the implementing regulation requirements of 40 CFR part 60.28. If the state's request for a state plan revision must be addressed in an expedited manner to assure a reliable supply of electricity, the state must document the risks to reliability that would be addressed by the plan revision by providing the EPA with a separate analysis of the reliability risk from the ISO/RTO or other planning authority. This analysis should be accompanied by a statement from the ISO/RTO or other planning/reliability authority that there are no practicable alternative resolutions to the reliability risk. In this case, the EPA will conduct an expedited review of the state plan revision.[869]
e.
Reliability safety valve.
In this section we describe a reliability safety valve, available to states with affected EGUs providing reliability-critical generation in emergency circumstances. Specifically and as discussed below the reliability safety valve provides i) a 90-day period during which the affected EGU will not be required to meet the emission standard established for it under the state plan but rather will meet an alternative standard, and ii) a period beginning after the initial 90 days during which the reliability-critical affected EGU may be required to continue to operate under an alternative standard rather than under the original state plan emission standard, as needed in light of the emergency circumstances, and the state must during this period revise its plan to accommodate changes
( printed page 64878)
needed to respond to ongoing reliability requirements. Any emissions in excess of the applicable state goals or performance rates occurring after the initial 90-day period must be accounted for and offset.
Many commenters expressed concerns that a serious, unforeseen event could occur during the final rule implementation period that would require immediate reliability-critical responses by system operators and affected EGUs that would result in unplanned or unauthorized emissions increases. After reviewing the comments, we believe that it is highly unlikely that there would be a conflict between activities undertaken under an approved state plan and the maintenance of electric reliability, except in the case of a state plan that puts relatively inflexible requirements on specific EGUs. While some have pointed out that severe weather or other short-term events could potentially conflict with state plans, we note that most of those events are of short duration and would not require major—if any—adjustments to emission standards for affected EGUs or to state plans. For example, during an event like the extreme cold experienced in periods of the winter of 2013-2014, affected EGUs may need to run at a higher level for a short period of time to accommodate increased demand and/or short-term unavailability of other generators. However, because compliance by affected EGUs will be demonstrated over 2-3 years, such a short-term event would not cause affected EGUs to be out of compliance with their applicable emission standards. States can also ensure that this is true by developing plans that allow adequate compliance flexibility to accommodate such short-term events. We note that we have included in this final rule a number of different features designed to facilitate emissions trading between and among EGUs on an interstate basis—and have done so, in no small part, in response to comments from states and stakeholders seeking to put in place or operate under state-level and interstate emissions trading regimes. Affected EGUs operating in those circumstances and operating, in addition, subject to state plans that incorporate flexible glide paths and trading would be able to accommodate an unanticipated reliability event.
We recognize, however, that affected EGUs operating in a state with a relatively inflexible state plan could face unanticipated system emergencies that could cause a severe stress on the electricity system for a length of time such that the requirements in that state's plan may not be achievable by certain affected EGUs without posing an otherwise unmanageable risk to reliability. In particular, there could be extremely serious events, outside the control of affected EGUs, that would require an affected EGU or EGUs operating under an inflexible state plan to temporarily operate under modified emission standards to respond to this kind of reliability concern. Examples of such an event could include, a catastrophic event that damages critical or vulnerable equipment necessary for reliable grid operation; a major storm that floods and causes severe damage to a large NGCC plant so that it must shut down; or a nuclear unit that must cease generating unexpectedly and therefore other affected EGUs need to run so as to exceed their requirements under the approved state plan. This is not an all-inclusive list, but the examples illustrate several key attributes of the kinds of circumstances in which the reliability safety valve would apply. First, the event creating the reliability emergency would be unforeseeable, brought about by an extraordinary, unanticipated, potentially catastrophic event. Second, the relief provided would be for EGUs compelled to operate for purposes of providing generation without which the affected electricity grid would face some form of failure. Third, the EGU or EGUs in question would be subject to the requirements of a state plan that imposes emissions constraints such that the EGU or EGUs' operation in response to the reliability emergency resulted in levels of emissions that violated those constraints. We do not anticipate that EGUs operating under a plan that permitted emissions trading would meet these criteria.
The final guidelines provide a reliability safety valve for these types of situations. If an emergency situation arises, the state must submit an initial notification to the appropriate EPA regional office within 48 hours that it is necessary to modify the emission standards for a reliability-critical affected EGU or EGUs for up to an initial 90 days. The notification must include a full description, to the extent it is known at the time, of the emergency situation that is being addressed. It must also identify with particularity the affected EGU or EGUs that are required to run to assure reliability. It must also specify the modified emission standards at which the affected EGU or EGUs will operate. The EPA will consider this notification to be an approved short-term modification to the state plan, allowing the EGU to operate at an emission standard that is an alternative to the emission standard originally specified in the relevant state plan, subject to confirmation by the further documentation described below.[870]
Within 7 days of submitting the initial notification, the state must submit a second notification providing documentation to the appropriate EPA regional office that includes a full description of the reliability concern and why an unforeseen, emergency situation that threatens reliability requires the affected EGU or EGUs to operate under modified emission standards (including discussion of why the flexibilities provided under the state's plan are insufficient to address the concern). The state must also describe in its documentation how it is coordinating or will coordinate with relevant reliability coordinators and planning authorities to alleviate the problem in an expedited manner, and indicate the maximum time that the state anticipates the affected EGU or EGUs will need to operate in a manner inconsistent with its or their obligations under the state's approved plan, and the modified emission standards or levels at which the affected EGU or EGUs will be operating at during this period if it has changed from the initial notification. The documentation must also include a written concurrence from the relevant reliability coordinator and/or planning authority confirming the existence of the imminent reliability threat and supporting the temporary modification request or an explanation of why this kind of concurrence cannot be provided. Additionally, if the relevant planning authority has conducted a system-wide or other analysis of the reliability concern, the state must include that information in its request. If the state fails to submit this documentation on a timely basis, the EPA will notify the state, which must then notify the affected EGU(s) that they must operate or resume operations under the original approved state plan emission standards.
It is important to note that the affected EGUs must continue to monitor and report their emissions and generation pursuant to requirements in this final rule and under the state plan during any short-term modification. For the duration of the up to 90-day short-term modification, the emissions of the affected EGU or EGUs that exceed their obligations under the approved state
( printed page 64879)
plan will not be counted against the state's overall goal or emission performance rate for affected EGUs. Such a modification will not alter or abrogate any other obligations under the approved state plan.
During this short-term modification period, the EPA expects that the source, the state and the relevant reliability coordinator and/or planning authority will assess whether the reliability issue can be addressed in a way that would allow the EGU or EGUs to resume operating under the original approved state plan within the 90-day period or whether revisions to the state plan need to be made to address the unexpected circumstances for the longer term (the unexpected unavailability of a nuclear unit, for example).
The EPA recognizes that an emergency may persist past 90 days. At least 7 days before the end of the initial 90-day reliability safety valve period, the state must notify the appropriate EPA regional office whether the reliability concern has been addressed and that the EGU or EGUs can resume meeting the original emission standards established in the state plan prior to the short-term modification.
If there still is a serious, ongoing reliability issue at the end of the short-term modification period that necessitates the EGU or EGUs to emit beyond the amount allowed under the state plan, the state must provide to the EPA a notification that it will be submitting a state plan revision and submit the plan revision as expeditiously as possible, specifying in the notice the date by which the revision will be submitted. The state must document the ongoing emergency with a second written concurrence from the relevant reliability coordinator and/or planning authority confirming the continuing urgent need for the EGU or EGUs to operate beyond the requirements of the state plan and that there is no other reasonable way of addressing the ongoing reliability emergency but for the EGU or EGUs to operate under an alternative emission standard than originally approved under the state plan. In this event, the EPA will work with the state on a case-by-case basis to identify an emission standard for the affected EGU or EGUs for the period before a new state plan revision is approved. After the initial 90-day period, any excess emissions beyond what is authorized in the original approved state plan will count against the state's overall goal or emission performance rate for affected EGUs.
The EPA intends for this reliability safety valve to be used only in exceptional situations. In addition, this reliability safety valve applies only to this final rule and has no effect on CAA requirements to which the state or the affected EGUs are otherwise subject. As discussed earlier, we are providing states with the flexibility to design programs that allow affected EGUs to meet compliance obligations while responding to reliability needs, even in emergency situations. This flexibility means that a conflict between the requirements of the state plan and maintenance of reliability should be extremely rare. We recognize, however, that a state with an inflexible plan could be faced with more than one emergency and in this case the reliability safety valve may be used more than once. If the state finds that a second reliability emergency arises that conflicts with the state plan, the state must submit a revision to its state plan so that the state plan is flexible enough to assure that such conflicts do not recur and that the state is providing for the implementation of the standards of performance for affected EGUs as required by the CAA.
f.
Coordination among federal partners.
The EPA, DOE, and FERC have agreed to coordinate efforts to help ensure continued reliable electricity generation and transmission during the implementation of the final rule. The three agencies have developed a coordination strategy that reflects their joint understanding of how they will work together to monitor final rule implementation, share information, and resolve any difficulties that may be encountered. This strategy is based on the successful working relationship that the three agencies established in their joint effort to work together to monitor reliability during MATS implementation.
g.
Analyses of the reliability impacts of the proposal.
The EPA appreciates that a large number of entities from many different industry perspectives have published reports and analysis with respect to electric reliability and the 111(d) proposed rule. We take concerns about reliability very seriously, and we appreciate the attention given to this issue in the comments and shared with us in public forums. It is important to note that these studies were conducted prior to promulgation of this final rule, and thus were only able to consider electric reliability with respect to the proposal. The EPA has made changes and improvements to the proposal in response to comments and new information, and some of the changes are relevant to the final rule's potential effect on electric reliability. One notable change pertains to the start of the interim period, which is now 2022 rather than 2020. Another important change to the final rule is a more gradual phase-in of the BSER for affected EGUs over the interim period (from 2022 through 2029). The final rule also provides considerable flexibility and multiple pathways to states, including allowing their EGUs to use multi-state trading and other approaches, which would allow essential units to continue to meet their compliance obligation while generating even at unplanned but reliability-critical levels. In addition, we have included in the final rule a reliability safety valve provision that can be utilized in certain emergency situations. These changes, in addition to already existing industry mechanisms and planning requirements, will help to ensure that industry will be able to maintain electric reliability. The EPA is confident that the final rule will cut harmful electric power plant pollution while maintaining a reliable electric grid because the final rule provides industry with the time and flexibility needed to continue its current and ongoing planning and investing to modernize and upgrade the electric power system.
In June of 2015, M.J. Bradley & Associates issued a report that enumerated a set of useful guiding principles for studying and evaluating the reliability impacts of the final rule.[871]
The report enumerated six principles: (1) A study should be transparent about the assumptions and data used; (2) a study should accurately reflect the existing status of the grid in its modeling assumptions; (3) a study should clearly identify the base case and not confuse what will happen as a result of the final rule with what would have happened anyway; (4) where possible, a study should contain sensitivities and probabilities as they are looking into the future which is necessarily uncertain; (5) a study should reflect the flexibility provided to states to allow them to design compliance approaches to maximize reliability; and (6) a study should provide realistic and reliability-focused results. These principles are helpful to keep in mind when reviewing recent studies.
NERC published its analyses of the proposed rule in November 2014 and again in April 2015.[872]
The EPA
( printed page 64880)
appreciates NERC's attention to, and interest in, the proposed rule. However, we note that like some other studies, NERC assumes considerably less flexibility than actually is provided to states and EGUs in this final rule. The final rule provides states with considerable time and latitude in designing plans that are tailored to the system in which their EGUs operate, which should be reflected in any reliability analysis. Also, the NERC study does not fully reflect the current electric grid. For example, the amount of RE generation that NERC assumes for 2020 is similar to levels of generation that we see today whereas projections for 2020 are considerably higher.[873]
Further, NERC conflates retirements that may happen as a result of the rule with those that are already planned. The Brattle Group has also reviewed NERC's November 2014 initial analysis of the proposed rule, noting that it is important to distinguish between concerns about the building blocks and reliability concerns about compliance with state plans.[874]
The Brattle Group concluded that there are real world solutions to NERC's concerns. These include making use of the many flexible options available to states under the rule to mitigate reliability risks.
Multiple ISOs/RTOs also provided analyses of the proposed rule, including MISO, PJM, ERCOT, and SPP.[875]
For example, MISO conducted an analysis of coal units at risk for retirement, finding that 14 GW of coal may be at risk.[876]
SPP performed a resource adequacy analysis that assumes planned retirements plus the EPA's projected retirements, but did not similarly account for the building of new generation capacity.[877]
While we appreciate MISO's and SPP's concerns regarding retirements and the potential that reserves will fall below reserve requirement levels, it is important to consider the many ways in which states can develop plans that account for their potential reliability concerns. The final rule continues to give states significant flexibility in how they comply with requirements, including both BSER measures and measures that were not included in the determination of the BSER as a means to comply. For example, demand-side EE measures can greatly assist states and affected EGUs in meeting the standards and/or state plan. Many studies assume that state plans will simply apply the BSER and do not recognize the large number of compliance approaches and opportunities that states and affected EGUs have available to them. The Analysis Group recently analyzed reliability considerations in MISO as the region considers how to comply with the final rule.[878]
The Analysis Group found that despite the large amount of coal-fired generating capacity that will likely be retired in MISO in the coming years, the entities responsible for electric system reliability in MISO are prepared to collaboratively address any reliability issues that arise and that there is a “strong tool kit for managing `Essential Reliability Services' needed to assure high-quality electric service.” [879]
ERCOT also performed an analysis, modeling numerous scenarios.[880]
ERCOT stated that its modeling identified two potential reliability problems—impacts of units retiring and increased levels of renewable generation on the ERCOT grid.[881]
As noted above, the final rule gives additional time for compliance, providing needed time to obtain new or replacement generation necessary as some existing generators retire. Moreover, affected EGUs needed for reliability should be able to employ the flexibilities afforded to them as they seek lower and zero-emitting generation. Finally, we note that ERCOT has a history of notable success in integrating RE into its electric grid, giving ERCOT significant expertise regarding challenges that may arise with the addition of new RE in order to comply with the final rule. In fact, a recent Brattle Group report used ERCOT as a case study for how to effectively integrate a large number of RE into the electric grid.[882]
PJM conducted its own analysis at the request of the Organization of PJM States (OPSI).[883]
This analysis is consistent with many of the M.J. Bradley guiding principles. PJM designed various scenarios to capture the impact of the proposed rule under a series of assumptions. Because the EPA had not yet issued the final rule, PJM cautioned against using the report as a reliability analysis or predictor of the future. PJM stated that, since 2007, PJM's capacity markets have helped to attract 35,000 MWs of additional generation. Even though 26,000 MWs will retire between 2009 and 2016, the PJM capacity market has procured sufficient resources to maintain reliability.
WECC also produced a study which is part of a longer-term, phased effort.[884]
The assumptions, methodology, and limitations were all clearly presented, and there was extensive involvement by a range of stakeholders. WECC stated that it is embarking on a phased-study process that seeks to “provide the industry with unbiased and
( printed page 64881)
independent analysis of this issue.” [885]
WECC concluded that the effects of the proposal on resource adequacy may be minimal but that resource adequacy cannot be fully assessed without realistic and/or proposed compliance scenarios.[886]
Analysis Group analyzed the proposed rule, finding that it provides states and affected EGUs with a wide range of options and operational discretion that can prevent reliability issues while also reducing carbon pollution and costs.[887]
Analysis Group noted that some of the concerns raised by stakeholders about the proposed rule assume “inflexible implementation, are based upon worst-case scenarios, and assume that policy makers, regulators, and market participants will stand on the sidelines until it is far too late to act” to ensure reliability.[888]
It stated that these assumptions are not consistent with past actions.
We appreciate the time that multiple entities took to analyze and consider the potential impacts of the proposed rule. As we issue the final rule and states draft plans to implement the rule, we look forward to further analysis by these and other groups. Such analysis can provide states with needed resources to help them design state plans that will augment the efforts of the industry to maintain electric reliability.
3. Consideration of Effects on Employment and Economic Development
States in designing their state plans should consider the effects of their plans on employment and overall economic development to assure that the opportunities for economic growth and jobs that the plans offer are manifest. To the extent possible, states should try to assure that any communities that can be expected to experience job losses can also take advantage of the opportunities for job growth or otherwise transition to healthy, sustainable economic growth. The EPA's illustrative analysis indicates that there may be some additional job losses in sectors related to coal extraction and generation that are attributable to implementation of this rule. At the same time, the EPA's illustrative analysis indicates that there may be new jobs in the utility power sector associated with both improving the efficiency of fossil fuel-fired power plants, construction and operation of new natural gas-fired and RE production, and actions to increase demand-side EE. Consideration of these effects in the context of the particulars of the state plan can help states craft plans that, to the extent possible, meet multiple environmental, economic, and workforce development goals.
The Partnerships for Opportunity and Workforce and Economic Revitalization (POWER) Initiative is a new interagency effort led by the Economic Development Administration in the Department of Commerce. POWER was launched to respond to current trends in the power sector: “The United States is undergoing a rapid energy transformation, particularly in the power sector. This transformation is producing cleaner air and healthier communities, and spurring new jobs and industries. At the same time, it is impacting workers and communities who have relied on the coal industry as a source of good jobs and economic prosperity, particularly in Appalachia, where competition with other coal basins provides additional pressure.” [889]
The POWER Initiative aligns, leverages, and targets economic and workforce development assistance to communities and workers affected by changes in the coal industry and the utility power sector. The POWER Initiative is competitively awarding planning assistance and implementation grants with funding from the Department of Commerce, Department of Labor, Small Business Administration, and the Appalachian Regional Commission to partnerships anchored in impacted communities. These grants will help communities organize themselves, develop comprehensive strategic plans that chart their economic future, and execute coordinated economic and workforce development activities based on their strategic plans.[890]
In addition to POWER, however, the EPA encourages states to use economic and labor market analysis to identify where they can deploy strategies to: (1) Provide a range of employment and training assistance to workers, and economic development assistance to communities affected by the rapid changes underway in the power sector and closely related industries, to diversify their economies, attract new sources of investment, and create new jobs; and (2) mobilize existing education and training resources, including those of community and technical colleges and registered apprenticeship programs, to ensure that both incumbent and new workers are trained for the skills necessary to meet employer demand for new workers in the utility, construction and related sectors, that such training includes career pathways for members of low-income communities and other vulnerable communities to attain employment in these sectors, and that such training results in validated skill certifications for workers.
4. Workforce Considerations
Some stakeholders commented that, to ensure that emission reductions are realized, it is important that construction, operations and other skilled work undertaken pursuant to state plans is performed to specifications, and is effective, safe, and timely. A good way to ensure a highly proficient workforce is to require that workers have been certified by: (1) An apprenticeship program that is registered with the U.S. DOL, Office of Apprenticeship or a state apprenticeship program approved by the DOL; (2) a skill certification aligned with the U.S. DOE Better Building Workforce Guidelines and validated by a third party accrediting body recognized by DOE; or (3) other skill certification validated by a third party accrediting body.
5. Tenth Amendment Legal Considerations
Some commenters have raised concerns that the emission guidelines and requirements for 111(d) state plans violate principles of federalism embodied in the U.S. Constitution, particularly the Tenth Amendment. These commenters claim that states will be unconstitutionally “coerced” or “commandeered” into taking certain actions in order to avoid the prospect of either a federal 111(d) plan applying to sources in the state, or of losing federal funds.
We disagree on both fronts. First, the prospect of a federal plan applying to sources in a state does not “coerce” or
( printed page 64882)
“commandeer” that state into submitting its own satisfactory plan. Far from violating principles of federalism, this rule provides states with the initial opportunity to submit a satisfactory state plan, and provides states flexibility in developing that plan. If a state declines to take advantage of that opportunity, affected EGUs in that state will instead be subject to a federal plan that satisfies statutory requirements.[891]
This approach is consistent with ordinary cooperative federalism regimes that federal courts have routinely upheld against Tenth Amendment challenges.[892]
Second, states that decline to take certain actions under this rule will not face the prospect of sanctions, such as withdrawn federal highway funds. CAA section 111 does not contain sanctions provisions, and we are finalizing revisions to these emission guidelines making explicit that the EPA will not withhold federal funds from a state on account of that state's failure to submit or implement an approvable 111(d) state plan.
Some commenters pointed to section 110(m) as a possible source of the EPA's sanction authority.[893]
Section 110(m) grants the EPA discretionary authority to withhold some federal highway funds under certain conditions. However, section 110(m) requires the EPA to adopt regulations to “establish criteria for exercising” this discretionary authority, and the only EPA regulations implementing section 110(m) apply to SIPs submitted under section 110.[894]
The EPA never intended to even imply that we would contemplate using this authority to encourage state participation in this rule under section 111. To the contrary, we believe that imposition of a federal plan rather than sanctions is the appropriate path in the context of this program. Accordingly, regardless of whether the EPA could theoretically apply discretionary sanctions against states in the section 111(d) context, the final rule forbids the agency from exercising any such authority. We have included in this rule a provision that prohibits the agency from imposing sanctions in the event that a state fails to submit or implement a satisfactory plan under this rule. As states consider whether to take advantage of the opportunity to develop state plans, they can be assured that the EPA will not withdraw federal funding should they decline to participate.
6. Title VI
States that are recipients of EPA financial assistance must comply with all federal nondiscrimination statutes that together prohibit discrimination on the bases of race, color, national origin (including limited-English proficiency), disability, sex and age. These laws include: Title VI of the Civil Rights Act of 1964; Section 504 of the Rehabilitation Act of 1973; Section 13 of the Federal Water Pollution Control Act Amendments of 1972; Title IX of the Education Act Amendments of 1972; and the Age Discrimination Act of 1975. Compliance with these nondiscrimination statutes is a recipient's separate and distinct obligation from compliance with environmental regulations. In other words, all recipients are required to ensure that all aspects of their state plans do not violate any of the federal nondiscrimination statutes, including Title VI.
The EPA's Office of Civil Rights (OCR) is responsible for carrying out compliance with these federal nondiscrimination statutes and does so through a variety of means including: Complaint investigation; agency-initiated compliance reviews; pre-grant award assurances and audits; and technical assistance and outreach activities. Anyone who believes that any of the federal nondiscrimination laws enforced by OCR have been violated by a recipient of EPA financial assistance may file an administrative complaint with the EPA's OCR.
H. Resources for States To Consider in Developing Plans
As part of the stakeholder outreach and comment processes, the EPA asked states what the agency could do to facilitate state plan development and implementation. In addition, after the comment period closed, the EPA continued to consult with state organizations including the Association of Air Pollution Control Agencies (AAPCA), Environmental Council of the States (ECOS), National Association of Clean Air Agencies (NACAA), National Association of Regulatory Utility Commissioners (NARUC), National Association of State Energy Officials (NASEO) and the National Governors Association (NGA).
Some states indicated that they wanted the EPA to create resources to assist with state plan development, especially resources related to accounting for RE and demand-side EE in state plans. They requested clear methodologies for estimating emission reductions from RE and demand-side EE policies and programs so that these could be included as part of their compliance strategies. Stakeholders said that these tools and metrics should build upon the EPA's “Roadmap for Incorporating Energy Efficiency/Renewable Energy Policies and Programs into State and Tribal Implementation Plans,” as well as the State Energy Efficiency Action Network's “Energy Efficiency Program Impact Evaluation Guide.” In addition, stakeholders requested clear guidance on how to measure the impacts of RE and demand-side EE programs using established EM&V protocols.
The EPA also heard that states would like guidance on plan development to be released at the same time as this final rule. This guidance should include allowable programs and policies for compliance, examples of compliance pathways, clear information on multi-state plan development, and identification of tools.
As a result of this feedback, in consultation with U.S. DOE and other federal agencies, the EPA continued to refine its toolbox of decision support resources at:
https://www2.epa.gov/www2.epa.gov/cleanpowerplantoolbox
. The site includes information on regulatory requirements, including state plan guidance and state plan decision support. The state plan guidance section serves as a central repository for the final emission guidelines, RIA, guidance documents, TSDs and other supporting materials. The state plan decision support section includes information to help states evaluate different approaches and measures they might consider as they initiate plan development. This section includes, for example, a summary of existing state climate and RE and demand-side EE policies and programs, information on electric utility actions that reduce CO2, and tools and information to estimate
( printed page 64883)
the emissions impact of RE and demand-side EE programs.
The EPA notes that our inclusion of a measure in the toolbox does not mean that a state plan must include that measure. In fact, inclusion of measures provided at the Web site does not necessarily imply the approvability of an approach or method for use in a state plan. States will need to demonstrate that any measure included in a state plan meets all relevant criteria and adequately addresses elements of the plan components discussed in section VIII.D of this preamble.
I. Considerations for CO2Emission Reduction Measures That Occur at Affected EGUs
This section describes a range of emission reduction actions that may be taken at affected EGUs that reduce CO2
emissions from an affected EGU and/or improve its CO2
emission rate, and the accounting treatment for these actions in a state plan. Some of these actions do not necessitate additional accounting, monitoring or reporting requirements. Such actions are discussed in section VIII.I.1 below, and include heat rate improvements, fuel switching from one fossil fuel to another, integration of RE into EGU operations, and combined heat and power (CHP) expansion or retrofit. Other actions, however, do necessitate additional accounting, monitoring, or reporting requirements. These include use of CCS, CCU and biomass, as discussed in section VIII.I.2 below.
The discussion in this section applies for both rate-based and mass-based plans. Additional accounting considerations for mass-based plans are discussed in section VIII.J. Additional accounting considerations for rate-based plans, including how actions that substitute for generation from affected EGUs or avoid the need for generation from affected EGUs may be used in a state plan to adjust the CO2
emission rate of an affected EGU, are discussed in section VIII.K.
1. Actions Without Additional Accounting and Reporting Requirements
Many actions will reduce the reported CO2
emissions or CO2
emission rate of an affected EGU, without the need for additional accounting or monitoring and reporting requirements beyond the required CEMS tracking of actual stack CO2
emissions and tracking of actual energy output.[895]
The effect of these actions will result in changes in reported CO2
emissions and/or energy output by an affected EGU. These actions include:
heat rate improvements;
fuel switching to a fossil fuel with lower carbon content (e.g.,
from coal to natural gas);
CHP, including retrofit of an affected EGU to a CHP configuration, or revising the useful energy outputs (electrical and thermal) at an affected EGU already operating in a CHP configuration.[897]
Heat rate improvements, fuel switching, integrating RE and CHP would not require any additional accounting or monitoring and reporting, because under the emission guidelines affected EGUs are already required to monitor and report CO2
emissions at the stack level, and to monitor and report useful energy outputs. Stack monitoring would reflect reductions in CO2
emissions from efficiency improvements, changes in fuel use (including incorporation of RE), and other on-site changes.
2. Actions With Additional Accounting and Reporting Requirements
Certain actions that may be taken at an affected EGU to reduce CO2
emissions, specifically application of CCS and CCU, and use of biomass, require additional accounting and reporting.
a.
Application of CCS.
Affected EGUs may utilize retrofit CCS technology to reduce reported stack CO2
emissions from the EGU.[898]
Affected EGUs that apply CCS under a state plan must meet the same monitoring, recordkeeping and reporting requirements for sequestered CO2
as new units that implement CCS to meet final standards of performance under CAA section 111(b) for new EGUs.[899]
Specifically, the final CAA section 111(b) rule for new sources requires that, if a new affected EGU uses CCS to meet the applicable CO2
emission limit, the EGU must report in accordance with 40 CFR part 98 subpart PP (Suppliers of Carbon Dioxide), and the captured CO2
must be injected at a facility or facilities that report in accordance with 40 CFR part 98 subpart RR (Geologic Sequestration of Carbon Dioxide).[900,901]
See 40 CFR 60.5555(f). Taken together, these requirements ensure that the amount of captured and sequestered CO2
will be tracked as appropriate at project- and national-levels, and that the status of the CO2
in its sequestration site will be monitored, including air-side monitoring and reporting. As detailed in the preamble for the CAA section 111(b) standards for new EGUs, the EPA found that there is ample evidence that CCS is technically feasible and that partial CCS can be implemented at a new fossil fuel-fired steam generating EGU at a cost that is reasonable and that is consistent with the cost of other dispatchable, non-NGCC generating options. In the June 2014 proposal, the EPA noted that CCS technology at existing EGUs would entail additional considerations beyond those at issue for newly constructed EGUs. Specifically, the cost of integrating a retrofit CCS system into an existing facility may be expected to be substantial, and some existing EGUs may have space limitations and thus may not be able to accommodate the expansion needed to install the equipment to implement CCS. Further, the EPA noted that aggregated costs of applying CCS as a component of the BSER for the large number of existing fossil fuel-fired steam EGUs would be substantial and would be expected to affect the cost and potentially the supply of electricity on a national basis. Because there are lower-cost systems of emission reduction available to reduce emissions from existing plants, the EPA
( printed page 64884)
did not propose nor finalize CCS as a component of the BSER for existing EGUs.
However, the EPA noted that CCS may be a viable CO2
mitigation technology at some existing sources and that it would be available to states and to sources as a compliance option. Numerous commenters agreed with the EPA's proposed determination that CCS technology is not part of the BSER building blocks for existing EGUs. Other commenters opposed inclusion of CCS requirements in state plans and provided specific reasons why CCS would not be applicable in certain states. Many commenters felt that CCS technology is not adequately demonstrated and is not economically practical at this time. Other commenters argued that CCS is an available technology and that it can be implemented at more EGUs than predicted by EPA modeling.
Some commenters noted that there are opportunities to reduce the cost of CCS implementation by selling the captured CO2
for use in Enhanced Oil Recovery (EOR) operations. One commenter expressed concern that federal requirements under the Greenhouse Gas Reporting Program—specifically the requirement (mentioned above) to report under 40 CFR part 98 subpart RR—would foreclose, rather than encourage, the use of captured CO2
for EOR. The EPA received similar public comments on the CAA 111(b) proposal for new EGUs. The EPA disagrees with the commenters' assertions and addressed those in the preamble for the final standards of performance and in the Response-to-Comments (RTC) document for the CAA 111(b) NSPS rulemaking. The EPA noted that the cost of compliance with subpart RR is not significant enough to offset the potential revenue for the EOR operator from the sale of produced oil for CCS projects that are reliant on EOR. The costs associated with subpart RR are relatively modest, especially in comparison with revenues from an EOR field.
After consideration of the variety of comments we received on this issue, we are confirming our proposal that CCS is not an element of the BSER, but it is an available compliance measure for a state plan. EGUs implementing CCS would need to follow reporting requirements established in the final CAA section 111(b) rule for new affected EGUs.
b.
Application of CCU.
The EPA received comments suggesting that carbon capture and utilization (CCU) technologies should also be allowed as a CO2
emission rate adjustment measure for affected EGUs.
Potential alternatives to storing CO2
in geologic formations are emerging and may offer the opportunity to offset the cost of CO2
capture. For example, captured anthropogenic CO2
may be stored in solid carbonate materials such as precipitated calcium carbonate (PCC) or magnesium or calcium carbonate, bauxite residue carbonation, and certain types of cement through mineralization. The carbonate materials produced can be tailored to optimize performance in specific industrial and commercial applications. For example, these carbonate materials have been used in the construction industry and, more recently and innovatively, in cement production processes to replace Portland cement.
The Skyonics Skymine® project, which opened its demonstration project in October 2014, is an example of captured CO2
being used in the production of carbonate products. This plant converts CO2
into commercial products. It captures over 75,000 tons of CO2
annually from a San Antonio, Texas, cement plant and converts the CO2
into other products including sodium carbonate and sodium bicarbonate.[902]
Other companies—including Calera [903]
and New Sky [904]
—also offer commercially available technology for the beneficial use of captured CO2. These processes can be utilized in a variety of industrial applications—including at fossil fuel-fired power plants.
However, consideration of how these emerging alternatives could be used to meet CO2
emission performance rates or state CO2
emission goals would require a better understanding of the ultimate fate of the captured CO2
and the degree to which the method permanently isolates the captured CO2
or displaces other CO2
emissions from the atmosphere.
Several commenters also suggested that algae-based CCU (
i.e.,
the use of algae to convert captured CO2
to useful products—especially biofuels) should be recognized for its potential to reduce emissions from existing fossil-fueled EGUs.
Unlike geologic sequestration, there are currently no uniform monitoring and reporting mechanisms to demonstrate that these alternative end uses of captured CO2
result in overall reductions of CO2
emissions to the atmosphere. As these alternative technologies are developed, the EPA is committed to working collaboratively with stakeholders to evaluate the efficacy of alternative utilization technologies, to address any regulatory hurdles, and to develop appropriate monitoring and reporting protocols to demonstrate CO2
reductions.
In the meantime, state plans may allow affected EGUs to use qualifying CCU technologies to reduce CO2
emissions that are subject to an emission standard, or those that are counted when demonstrating achievement of the CO2
emission performance rates or a state rate-based or mass-based CO2
emission. State plans must include analysis supporting how the proposed qualifying CCU technology results in CO2
emission mitigation from affected EGUs and provide monitoring, reporting, and verification requirements to demonstrate the reductions. The EPA would then review the appropriateness and basis for the analysis and the verification requirements in the course of its review of the state plan.
c.
Application of biomass co-firing and repowering.
The EPA received multiple comments supporting the use of biomass feedstocks as a means of reducing CO2
emissions within state plans. Several commenters also asserted that states should be able to determine how biomass can be used in their plans. Additionally, the EPA received a range of comments regarding the valuation of CO2
emissions from biomass combustion. Some argued that all biomass feedstocks should be considered “carbon neutral,” while others maintained that only the full stack emissions from biomass combustion should be counted. As discussed in the next section, the revised
Framework for Assessing Biogenic Carbon Dioxide for Stationary Sources [905]
and 2012 Science Advisory Board peer review of the
2011 Draft Framework
find that it is not scientifically valid to assume that all biogenic feedstocks are “carbon neutral, but that the net biogenic CO2
atmospheric contribution of different biomass feedstocks can vary and depends on various factors, including feedstock type and characteristics, production practices, and, in some cases, the alternative fate of the feedstock.[906]
Other comments focused on the use of sustainably-derived agricultural and forest biomass feedstocks, including stakeholders who
( printed page 64885)
supported and those against such feedstocks as approvable elements, and those who wanted further definition of these feedstocks. As discussed above and in more detail below, these final guidelines provide that states can include qualified biomass in their plans and include provisions for how qualified biomass feedstocks or feedstock categories will be determined. The EPA will review the appropriateness and basis for determining qualified biomass feedstocks or feedstock categories in its review of the approvability of a state plan.
(1)
Considerations for use of biomass in state plans.
The EPA recognizes that the use of some biomass-derived fuels can play a role in controlling increases of CO2
levels in the atmosphere. The use of some kinds of biomass has the potential to offer a wide range of environmental benefits, including carbon benefits. However, these benefits can typically only be realized if biomass feedstocks are sourced responsibly and attributes of the carbon cycle related to the biomass feedstock are taken into account.
In November 2014, the agency released a second draft of the technical report,
Framework for Assessing Biogenic Carbon Dioxide for Stationary Sources.
The revised
Framework,
and the EPA's Science Advisory Board (SAB) peer review of the
2011 Draft Framework,
finds that it is not scientifically valid to assume that all biogenic feedstocks are “carbon neutral” and that the net biogenic CO2
atmospheric contribution of different biogenic feedstocks generally depends on various factors related to feedstock characteristics, production, processing and combustion practices, and, in some cases, what would happen to that feedstock and the related biogenic emissions if not used for energy production.[907]
The revised Framework also found that the production and use of some biogenic feedstocks and subsequent biogenic CO2
emissions from stationary sources will not inevitably result in increased levels of CO2
to the atmosphere, unlike CO2
emissions from combustion of fossil fuels.
The SAB peer review panel agreed that the use of biomass feedstocks derived from the decomposition of biogenic waste in landfills, compost facilities or anaerobic digesters did not constitute a net contribution of biogenic CO2
emissions to the atmosphere. And further, information considered in preparing the second draft of the Framework, including the SAB peer review and stakeholder input, supports the finding that use of waste-derived feedstocks [908]
and certain forest-derived industrial byproducts (such as those without alternative markets) are likely to have minimal or no net atmospheric contributions of biogenic CO2
emissions, or even reduce such impacts, when compared with an alternate fate of disposal.
In addition, as detailed in the President's Climate Action Plan,[909]
part of the strategy to address climate change includes efforts to protect and restore our forests, as well as other critical landscapes including grasslands and wetlands, in the face of a changing climate. This country's forests currently play a critical role in addressing carbon pollution, removing more than 13 percent of total U.S. GHG emissions each year.[910]
Conservation and sustainable management can help ensure our forests and other lands will continue to remove carbon from the atmosphere while also improving soil and water quality, reducing wildfire risk and enhancing forests' resilience in the face of climate change.
Many states have recognized the importance of forests and other lands for climate resilience and mitigation, and have developed a variety of sustainable forestry policies, RE incentives and standards, and GHG accounting procedures. Some states, for example Oregon and California, have programs that recognize the multiple benefits that forests provide, including biodiversity and ecosystem services protection as well as climate change mitigation through carbon storage. Oregon has several programs focused on best forest management practices and sustainability, including the Oregon Indicators of Sustainable Forests, that promote environmentally, economically and socially sustainable management of state forests. California's Forest Practice Regulations support sustained production of high-quality timber while considering ecological, economic and social values, and the state's Greenhouse Gas Reduction Fund provides resources for forestry projects to improve forest health, maintain carbon storage and avoid GHG emissions from pests, wildfires and conversion to non-forest uses.
Several states focus on sustainable bioenergy, as seen with the sustainability requirements for eligible biomass in the Massachusetts RPS, which, among other requirements, limits old growth forest harvests. Many states employ complementary programs that together work to address sustainable forestry practices. For example, Wisconsin uses a state forest sustainability framework that provides a common system to measure the sustainability of the state's public and private forests, in conjunction with a series of voluntary best management guideline manuals for sustainable woody biomass and agriculturally-derived biomass. In addition to state-specific programs, some states also actively participate in sustainable forest management or certification programs through third-party entities such as the Sustainable Forestry Initiative (SFI) and the Forest Stewardship Council (FSC). For example, in addition to other state sustainability programs, New York has certified more than 780,000 acres of state forestland to both SFI and FSC's sustainable forest management programs. SFI and FSC have certified more than 63 and 35 million acres of forestland across the U.S., respectively.
These examples demonstrate how states already use diverse strategies to promote sustainable forestry and agricultural management while realizing their unique economic, environmental and RE goals. As states evaluate options for meeting the emission guidelines, they may consider how sustainably-derived biomass and sustainable forestry and agriculture programs, such as the examples highlighted above, may help them control increases of CO2
levels in the atmosphere. In addition, the EPA's work on assessing biogenic CO2
emissions from stationary sources may also help inform states' efforts to assess the role of different biogenic
( printed page 64886)
feedstocks in their plans and broader climate strategies.[911]
The EPA is engaging in a second round of targeted peer review on the revised Framework with the SAB in 2015.[912]
As part of this technical process, and as the EPA and states implement these emission guidelines, the EPA will continue to assess and closely monitor overall bioenergy demand and associated landscape conditions for changes that might have negative impacts on public health or the environment.
(2)
Additional considerations and requirements for biomass fuels.
The EPA anticipates that some states may consider the use of certain biomass-derived fuels used in electricity generation as a way to control increases of CO2
levels in the atmosphere, and will include them as part of their state plans to meet the emission guidelines. Not all forms of biomass are expected to be approvable as qualified biomass (
i.e.,
biomass that can be considered as an approach for controlling increases of CO2
levels in the atmosphere). Affected EGUs may use qualified biomass in order to control or reduce CO2
emissions that are subject to an emission standard requirement, or those that are counted when demonstrating achievement of the CO2
emission performance rates or a state rate-based or mass-based CO2
emission goal.
State plan submissions must describe the types of biomass that are being proposed for use under the state plan and how those proposed feedstocks or feedstock categories should be considered as “qualified biomass” (
i.e.,
a biomass feedstock that is demonstrated as a method to control increases of CO2
levels in the atmosphere). The submission must also address the proposed valuation of biogenic CO2
emissions (
i.e.,
the proposed portion of biogenic CO2
emissions from use of the biomass feedstock that would not be counted when demonstrating compliance with an emission standard, or when demonstrating achievement of the CO2
emission performance rates or a state rate-based or mass-based CO2
emission goal).
With regard to assessing qualified biomass proposed in state plans, the EPA generally acknowledges the CO2
and climate policy benefits of waste-derived biogenic feedstocks and certain forest- and agriculture-derived industrial byproduct feedstocks, based on the conclusions supported by a variety of technical studies, including the revised
Framework for Assessing Biogenic Carbon Dioxide for Stationary Sources.
The use of such waste-derived and certain industrial byproduct biomass feedstocks would likely be approvable as qualified biomass in a state plan when proposed with measures that meet the biomass monitoring, reporting and verification requirements discussed below and other measures as required elsewhere in these emission guidelines.
Given the importance of sustainable land management in achieving the carbon goals of the President's Climate Action Plan, sustainably-derived agricultural and forest biomass feedstocks may also be acceptable as qualified biomass in a state plan, if the state-supplied analysis of proposed qualified feedstocks or feedstock categories can adequately demonstrate that such feedstocks or feedstock categories appropriately control increases of CO2
levels in the atmosphere and can adequately monitor and verify feedstock sources and related sustainability practices. Information in the revised Framework, the second SAB peer review process, and the state and third party programs highlighted in the previous section can assist states when considering the role of qualified biomass in state plan submittals.
Regardless of what biomass feedstocks are proposed, state plans must specify how biogenic CO2
emissions will be monitored and reported, and identify specific EM&V, tracking and auditing approaches for qualified biomass feedstocks. As discussed in section VIII.D.2, state plan submittals must include CO2
emission monitoring, reporting and recordkeeping measures. In the case of sustainably-derived forest- and agriculture-derived feedstocks, this will also include measures for verifying feedstock type, origin and associated sustainability practices. Section VIII.K describes how state plan submittals must specify the requirements and procedures that EM&V measures must meet. As discussed in section VIII.K, the EPA is addressing potential EM&V measures for qualified biomass in EPA's model trading rule and draft EM&V guidance, such as measures that would ensure that biomass-related biogenic CO2
benefits are quantifiable, verifiable, non-duplicative, permanent and enforceable.
State plan submittals must ensure that all biomass used meets the state plan requirements for qualified biomass and associated biogenic CO2
benefits, such as using robust, independent third party verification and establishing measures to maintain transparency, including disclosure of relevant documentation and reports. State plan submittals must include measures for tracking and auditing performance to ensure that biomass used meets the state plan requirements for qualified biomass and associated biogenic CO2
benefits. Details on how to adjust CO2
rates through the use of qualified biomass feedstocks are provided in section VIII.K.1.
The EPA will review the appropriateness and basis for proposed qualified biomass and biomass treatment determinations and related accounting, monitoring and reporting measures in the course of its review of a state plan. The EPA's determination that a state plan satisfactorily proves that proposed biomass fuels qualify would be based in part on whether the plan submittal demonstrates that proposed state measures for qualified biomass and related biogenic CO2
benefits are quantifiable, verifiable, enforceable, non-duplicative and permanent. The EPA recognizes that CCS technology (described above in section VIII.I.2.a) could be applied in conjunction with the use of qualified biomass.
(3)
Biomass co-firing.
Affected EGUs may use qualified biomass co-fired with fossil fuels at an affected EGU. As discussed above in this section, not all forms of biomass are expected to be approvable and states should propose biomass feedstocks and treatment of biogenic CO2
emissions in state plans, along with supporting analysis where applicable. The EPA will review the appropriateness and basis for such determinations and accounting measures in the course of its review of a state plan.
An affected EGU using qualified biomass as a fuel must monitor and report both its overall CO2
emissions and its biogenic CO2
emissions. If biomass is to be used as means to control increases of CO2
levels in the atmosphere in a state plan, the plan must specify requirements for reporting biogenic CO2
emissions from affected EGUs.
(4)
Biomass repowering.
Affected EGUs could fully repower to use primarily qualified biomass. The characteristics of affected EGUs, as discussed in section IV.D, include the use of at least 10 percent fossil fuel for applicability of these emission guidelines. An EGU repowering with at least 90 percent biomass fuels instead of fossil fuels becomes a non-affected
( printed page 64887)
EGU.[913]
An EGU repowering with less than 90 percent biomass would remain an affected EGU and therefore need to propose biomass feedstocks and treatment of biogenic CO2
emissions in state plans, along with supporting analysis where applicable.
J. Additional Considerations and Requirements for Mass-Based State Plans
This section discusses considerations and requirements for different types of mass-based state plans. This includes mass-based state plans using emission budget trading programs, and coordination among such programs where states retain individual mass CO2
emission goals. CAA section 111(d) requires states to submit, in part, a plan that establishes standards of performance for affected EGUs which reflect the BSER. The state plan must be satisfactory with respect to this requirement in order for the EPA to approve the plan. As previously described, states meet the statutory requirements of 111(d) and the requirements of the final emission guidelines by establishing emission standards for affected EGUs that meet the performance rates, which reflect the application of BSER as determined by the EPA. This final rule allows states to alternatively establish emission standards that meet rate-based or mass-based goals. The state goals must be equivalent to the performance rates in order to reflect the application of the BSER as required by the statute and the final emission guidelines. Therefore, a state choosing a mass-based implementation must address leakage as part of its mass-based plan in order to satisfactorily establish emission standards for affected EGUs that reflect the BSER as set by the EPA.
1. Accounting for CO2
Emission Reduction Measures in Mass-Based State Plans
As discussed in section VIII.I, measures that occur at affected EGUs will result in CO2
emission reductions that are automatically accounted for in reported CO2
emissions. Other measures that provide substitute generation for affected EGUs or avoid the need for generation from affected EGUs, such as demand-side EE, are automatically accounted for under a mass-based plan to the extent that these measures reduce reported CO2
emissions from affected EGUs. Unlike under a rate-based plan, no additional accounting is necessary in order to recognize these emission reductions.
2. Use of Emission Budget Trading Programs
This section addresses the use of emission budget trading programs in a mass-based state plan, including provisions required for such programs and the design of such programs in the context of a state plan. This includes program design approaches that ensure achievement of a state mass-based CO2
emission goal (or mass-based CO2
goal plus new source CO2
emission complement) (section VIII.J.2.b), as well as how states can use emission budget trading programs with broader source coverage and other flexibility features in a state plan, such as the programs currently implemented by California and the RGGI participating states (section VIII.J.2.c). Section VIII.J.2.d addresses other considerations for the design of emission budget trading programs that states may want to consider, such as allowance allocation approaches. Section VIII.J.3 addresses multi-state coordination among emission budget trading programs used in states that retain their individual state mass-based CO2
goals.
a.
State plan provisions required for a mass-based emission budget trading program approach.
For a mass-based emission trading program approach, the state plan would include as its federally enforceable emission standards requirements that specify the emission budget and related compliance requirements and mechanisms. These requirements would include: CO2
emission monitoring, reporting, and recordkeeping requirements for affected EGUs; provisions for state allocation of allowances; provisions for tracking of allowances, from issuance through submission for compliance; and the process for affected EGUs to demonstrate compliance (allowance “true-up” with reported CO2
emissions). Mass-based emission standards that take the form of an emission budget trading program must be quantifiable, verifiable, enforceable, non-duplicative and permanent. These requirements are described in more detail at section VIII.D.2.
Where a state plan establishes mass-based emission standards for affected EGUs only, the emission standards and the implementing and enforcing measures may be included in the state plan as the full set of requirements implementing the emission budget trading program. Where an emission budget trading program in a state plan addresses affected EGUs and other fossil fuel-fired EGUs or emission sources, pursuant to the approaches described in sections VIII.J.2.b-d below, the requirements that must be included in the state plan are the federally enforceable emission standards in the state plan that apply specifically to affected EGUs, and the requirements that specifically require affected EGUs to participate in and comply with the requirements of the emission budget trading program. This includes the requirement for an affected EGU to surrender emission allowances equal to reported CO2
emissions, and meet monitoring and reporting requirements for CO2
emissions, among other requirements. These requirements may be submitted as part of the federally enforceable state plan through mechanisms with the appropriate legal authority and effect, such as state regulations, Title V permit requirements for affected EGUs, and other possible instruments that impose these requirements specifically with respect to affected EGUs. Under this approach, the full set of regulations establishing the emission budget trading program that applies to affected EGUs and other fossil fuel-fired EGUs and other emission sources (if relevant) must be described as supporting documentation in the state plan submittal for EPA to evaluate the approvability of the plan by determining whether the affected EGUs will achieve the requisite goal.
b.
Requirement for emission budget trading programs to address potential leakage.
In Section VII.D, the EPA specifies that potential emission leakage must be addressed in a state plan with mass-based emission standards. The EPA received comments suggesting various solutions to this concern, such as the inclusion of new sources under the rule and quantitative adjustments to mass CO2
goals for affected EGUs. In response to this issue, the EPA has sought to give states flexibility in how they meet this requirement and base the acceptable solutions on what will best suit a state's unique characteristics and state plan structure.
To address the potential for emission leakage to new sources under a mass-based plan approach, which could prevent a mass-based program from successfully achieving a mass-based CO2
goal consistent with BSER, the EPA is requiring that a state submitting a plan that is designed to meet a state mass-based CO2
goal for affected EGUs demonstrate that the plan addresses and mitigates the risk of potential emission leakage to new sources. The following
( printed page 64888)
options provide sufficient demonstration that potential emission leakage has been addressed in a mass-based state plan: [914]
1. Regulate new non-affected fossil EGUs as a matter of state law in conjunction with emission standards for affected EGUs in a mass-based plan. If a state adopts an EPA-provided mass budget [915]
that includes the state mass-based CO2
goal for affected EGUs plus a new source CO2
emission complement, this option could be presumptively approvable.
2. Use allocation methods in the state plan that counteract incentives to shift generation from affected EGUs to unaffected fossil-fired sources. If a state adopts allowance set-aside provisions exactly as they are outlined in the finalized model rule, this option could be presumptively approvable.
3. Provide a demonstration in the state plan, supported by analysis, that emission leakage is unlikely to occur due to unique state characteristics or state plan design elements that address and mitigate the potential for emission leakage.
In the first option, states may choose to regulate new non-affected fossil fuel-fired EGUs, as a matter of state law, in conjunction with federally enforceable emission standards for affected EGUs under a mass-based plan. This regulation of both new and existing sources, as part of a state plan approach, is conceptually analogous to a method that has been adopted by the mass-based systems adopted by California and the RGGI participating states. To address potential emission leakage under this option, the mass-based plan includes federally enforceable emission standards for affected EGUs, and the supporting documentation for the plan describes state-enforceable regulations for, at a minimum, all new grid-connected fossil fuel-fired EGUs that meet the applicability standards for EGUs subject to CAA section 111(b). States have the option of regulating a wider array of sources if they choose, as a matter of state law.
For this option, a state must adopt, as a matter of state law, a mass CO2
emission budget of sufficient size to cover both affected EGUs under the existing source mass CO2
goal provided in this final rule, along with sufficient CO2
emission tonnage to cover projected new sources. There are two pathways that states can use for adopting such an emission budget that applies to both affected EGUs and new sources. The EPA is providing a mass budget for each state that account for the state's mass CO2
goal for affected EGUs and a complementary emission budget for new sources, referred to as the new source CO2
emission complement. States that both adopt the EPA-provided mass budget, based on the state mass-based CO2
goal for affected EGUs plus the new source CO2
emission complement, and regulate new sources under this emission budget as a matter of state law, in conjunction with federally enforceable emission standards for affected EGUs as part of the mass-based state plan may be able to submit a presumptively approvable plan. Such a plan would include federally enforceable emission standards for affected EGUs, and in the supporting documentation of the plan, would describe that the state is regulating new sources under a mass CO2
emission budget that is equal to or less than the state mass-based CO2
goal for affected EGUs plus the EPA-specified CO2
emission complement, in conjunction with the federally enforceable emission standards for affected EGUs. If the state plan is designed to achieve the EPA provided mass budget, plan performance will be evaluated based on whether the existing affected EGUs, regulated under the federally enforceable state plan, and new sources regulated as a matter of state law, together meet the total mass budget that includes the state's mass CO2
goal for affected EGUs and a complementary emission budget for new sources.
EPA-specified mass CO2
emission budgets for each state, including the state's mass CO2
goal and a new source CO2
emission complement, are provided in Table 14 below. The derivation of the new source CO2
emission complements is explained in a TSD titled New Source Complements to Mass Goals, which is available
in the docket.
Table 14—New Source Complements to Mass Goals
State
New source
complements
(short tons of CO2)
Mass goals 916
+ new source complements
(short tons of CO2)
Interim
Final
Interim
Final
Alabama
856,524
755,700
63,066,812
57,636,174
Arizona
1,424,998
2,209,446
34,486,994
32,380,197
Arkansas
411,315
362,897
34,094,572
30,685,529
California
2,846,529
4,413,516
53,873,603
52,823,635
Colorado
1,239,916
1,922,478
34,627,799
31,822,874
Connecticut
135,410
119,470
7,373,274
7,060,993
Delaware
78,842
69,561
5,141,711
4,781,386
Florida
1,753,276
1,546,891
114,738,005
106,641,595
Georgia
677,284
597,559
51,603,368
46,944,404
Idaho
94,266
146,158
1,644,407
1,639,013
Illinois
818,349
722,018
75,619,224
67,199,174
Indiana
939,343
828,769
86,556,407
76,942,604
Iowa
298,934
263,745
28,553,345
25,281,881
Kansas
260,683
229,997
25,120,015
22,220,822
Kentucky
752,454
663,880
72,065,256
63,790,001
Louisiana
484,308
427,299
39,794,622
35,854,321
Maine
40,832
36,026
2,199,016
2,109,968
Maryland
170,930
150,809
16,380,325
14,498,436
Massachusetts
225,127
198,626
12,972,803
12,303,372
Michigan
623,651
550,239
53,680,801
48,094,302
Minnesota
286,535
252,806
25,720,126
22,931,173
( printed page 64889)
Mississippi
410,440
362,126
27,748,753
25,666,463
Missouri
668,637
589,929
63,238,070
56,052,813
Montana
421,674
653,801
13,213,003
11,956,908
Nebraska
216,149
190,706
20,877,665
18,463,444
Nevada
770,417
1,194,523
15,114,508
14,718,107
New Hampshire
71,419
63,012
4,314,910
4,060,591
New Jersey
313,526
276,619
17,739,906
16,876,364
New Mexico
527,139
817,323
14,342,699
13,229,925
New York
522,227
460,753
34,117,555
31,718,182
North Carolina
692,091
610,623
57,678,116
51,876,856
North Dakota
245,324
216,446
23,878,144
21,099,677
Ohio
949,997
838,170
83,476,510
74,607,975
Oklahoma
581,051
512,654
45,191,382
41,000,852
Oregon
453,663
703,399
9,096,826
8,822,053
Pennsylvania
1,257,336
1,109,330
100,588,162
90,931,637
Rhode Island
70,035
61,791
3,727,420
3,584,016
South Carolina
344,885
304,287
29,314,508
26,303,255
South Dakota
46,513
41,038
3,995,462
3,580,518
Tennessee
358,838
316,598
32,143,698
28,664,994
Texas
5,328,758
8,516,408
213,419,599
198,105,249
Utah
981,947
1,522,500
27,548,327
25,300,693
Virginia
450,039
397,063
30,030,110
27,830,174
Washington
531,761
824,490
12,211,467
11,563,662
West Virginia
602,940
531,966
58,686,029
51,857,307
Wisconsin
364,841
321,895
31,623,197
28,308,882
Wyoming
1,185,554
1,838,190
36,965,606
33,472,602
Lands of the Navajo Nation
809,562
1,255,217
25,367,354
22,955,804
Lands of the Uintah and Ouray Reservation
84,440
130,923
2,645,885
2,394,354
Lands of the Fort Mojave Tribe
37,162
57,619
648,264
646,138
Total
33,717,871
41,187,289
1,878,255,620
1,709,291,348
States can, in the alternative, provide their own projections for a new source CO2
emission complement to their mass-based CO2
goals for affected EGUs. In the supporting documentation for the state plan submittal, the state must specify the new source budget, specify the analysis used to derive such a new source CO2
emission complement, and demonstrate that under the state plan affected EGUs in the state will meet the state mass-based CO2
goal for affected EGUs as a result of being regulated under the broader CO2
emission cap that applied to both affected EGUs and new sources. Such a projection should take into account the mass goal quantification method outlined in section VII.C and the CO2
Emission Performance Rate and Goal Computation TSD, including the fact that the mass-based state goals already incorporate a significant growth in generation from historical levels. The EPA will evaluate the approvability of the plan based on whether the federally enforceable emission standards for affected EGUs in conjunction with the state-enforceable regulatory requirements for new sources will result in the affected EGUs meeting the state mass-based CO2
goal. If, rather than designing a plan to achieve the EPA provided mass budget, the state uses its own projections for a new source complement and the plan is approved to meet this new source complement, plan performance will be evaluated based on whether the existing affected EGUs, regulated under the federally enforceable state plan, meet the state's mass CO2
goal for affected EGUs.
The second demonstration option allows states to use allowance allocation methods that counteract incentives to shift generation from affected EGUs to unaffected fossil-fired sources. These allocation approaches must be specified in state plans as part of the provisions for state allocation of allowances required under a mass-based plan approach (see section VIII.J.2.a). The EPA is proposing the inclusion of two allocation strategies as part of the mass-based approach in the proposed federal plan and model rule: Updating output-based allocations and an allowance set-aside that targets RE. These options are described in more detail below. If a state were to adopt allowance set-aside provisions exactly as they are outlined in the finalized model rule, they could be considered presumptively approvable. The allowance allocation alternative for addressing leakage was chosen for the federal plan and model rule proposal because EPA does not have authority to extend regulation of and federal enforceability to new fossil fuel-fired sources under CAA section 111(d), and therefore we cannot include them under a federal mass-based plan approach.
An updating output-based allocation method allocates a portion of the total CO2
emission budget to affected EGUs based, in part, on their level of electricity generation in a recent period or periods. Therefore, the total allocation to an EGU that is eligible to receive allowances from an output-based allowance set-aside is not fixed, but instead depends on its generation. Under this approach, each eligible affected EGU may receive a larger allowance allocation if it generates more. Therefore, eligible affected EGUs will have an incentive to generate more in order to receive more allowances, aligning their incentive to generate with new sources.
This allocation method can be implemented through the creation of a
( printed page 64890)
set-aside that reserves a subset of the total allowances available to sources, and distributes them based upon the criteria described above. Because the total number of allowances is limited, this allocation approach will not exceed the overall state mass-based CO2
goal for affected EGUs. Instead, it merely modifies the distribution of allowances in a manner designed to mitigate potential emission leakage.
The other allocation strategy included as part of the mass-based approach in the proposed federal plan and model rule is a set-aside of allowances to be allocated to providers of incremental RE. A set-aside can also be allocated to providers of demand-side EE, or to both RE and demand-side EE. The increased availability of RE generation can serve as another source of generation to satisfy electricity demand. Increased demand-side EE will reduce the demand that sources need to meet. Therefore, both RE and demand-side EE can serve to reduce the incentive that new sources have to generate, and therefore align their incentives with affected EGUs. Thus, increased RE and demand-side EE, supported by a dedicated set-aside, can also serve to address potential emission leakage.
If a state is submitting a plan with an allocations approach that differs from that of the finalized model rule, the state should also provide a demonstration of how the specified allocation method will provide sufficient incentive to counteract potential emission leakage.
Finally, a state can provide a demonstration that emission leakage is unlikely to occur, without implementing either of the two strategies above, as a result of unique factors, such as the presence of existing state policies addressing emission leakage or unique characteristics of the state and its power sector that will mitigate the potential for emission leakage. This demonstration must be supported by credible analysis. The EPA will determine if the state has provided a sufficient demonstration that potential emission leakage has already been adequately addressed, or if additional action is required as part of the state plan.
Aside from the possible incentives for emission leakage addressed in this section, there may be other potential generation incentives across states and unit subcategories that could increase CO2
emissions, particularly in an environment where various states are implementing a variety of state plan approaches in a shared grid region. Some examples of these incentives, particularly those that were specified by commenters, are discussed in section VIII.L. That section also describes how the EPA has structured this final rule to either prevent or minimize the potential for foregone emission reductions from differential incentives that may result from state plan implementation. These safeguards include placing restrictions on interstate trading when there could be a risk of such differential incentives. Additionally, the nature of the CO2
emission performance rates and state rate-based CO2
goals helps to minimize these potential effects, as does the MWh-accounting method for adjusting the CO2
emission rates of affected EGUs under rate-based plans.
However, without a better understanding of the different mechanisms that states may ultimately choose to meet the emission guidelines, and how different requirements in different states may interact, the EPA cannot project every potential differential incentive that could lead to a loss of CO2
emission reductions. Therefore, once program implementation begins, the EPA will assess how emission performance across states may be affected by the interaction of different regulatory structures implemented through state plans. Based upon that evaluation, the EPA will determine whether there are potential concerns and what course of action may be appropriate to remedy such concerns.
c.
Emission budget trading programs that ensure achievement of a state CO2goal.
A mass-based emission budget trading program can be designed such that compliance by affected EGUs will achieve the state mass-based CO2
goal. Under this approach, a state plan would establish CO2
emission budgets for affected EGUs during the interim and final plan performance periods that are equal to or lower than the applicable state mass-based CO2
goals specified in section VII. A mass-based emission budget trading program can also be designed such that compliance by affected EGUs in conjunction with new fossil fuel-fired EGUs meeting applicable requirements under state law will achieve a mass-based CO2
goal plus new source CO2
emission complement. Under this approach, a state would establish CO2
emission budgets under state law for affected EGUs plus new sources during the interim and final plan performance periods that are equal to or lower than the applicable state mass-based CO2
emission goal plus the new source CO2
emission complement specified in Table 14 in section VIII.J.2.b above, and describe such emission budgets in the supporting documentation of the state plan. Under either program, compliance periods for affected EGUs (or for affected EGUs plus new fossil fuel-fired EGUs meeting applicable requirements under state law) would also be aligned with the interim and final plan performance periods. This approach would limit total CO2
emissions from affected EGUs (or total CO2
emissions from affected EGUs and new fossil fuel-fired EGUs meeting applicable requirements under state law) during the interim and final plan performance periods to an amount equal to or less than the state's mass-based CO2
goal (or mass-based CO2
goal plus new source CO2
emission complement).
Under this approach, compliance by affected EGUs with the mass-based emission standards in a plan would ensure that the state achieves its mass-based CO2
goal for affected EGUs (or mass-based CO2
goal plus new source CO2
emission complement). No further demonstration would be necessary by the state to demonstrate that its plan would achieve the state's mass-based CO2
goal (or mass-based CO2
goal plus new source CO2
emission complement).
For this type of plan, where the emission budget is equal to or less than the state mass CO2
goal (or mass-based CO2
goal plus new source CO2
emission complement),[917]
the EPA would assess achievement of the state goal based on compliance by affected EGUs with the mass-based emission standards, rather than reported CO2
emissions by affected EGUs during the interim plan performance periods and final plan performance periods. This approach would allow for allowance banking between performance periods, including the interim and final performance periods outlined in this final rule.
Banking provisions have been used extensively in rate-based environmental programs and mass-based emission budget trading programs. This is because banking reduces the cost of attaining the requirements of the regulation. The EPA has determined that the same rationale and outcomes apply under a CO2
emission rate approach, in that allowing banking will reduce compliance costs. Banking encourages additional emission reductions in the near-term if economic to meet a long-term emission rate constraint, which is beneficial due to social preferences for environmental improvements sooner rather than later. It is also beneficial when addressing pollutants that are long-lived in the atmosphere, such as CO2, and where increasing atmospheric concentration of
( printed page 64891)
the pollutant leads to increasing adverse atmospheric impacts.
Banking also provides long-term economic signals to affected emission sources and other market participants where actions taken today will have economic value in helping meet tighter emission constraints in the future, provided those emission sources expect that the banked ERCs or emission allowances may be used for compliance in the future. Linking short-term and long-term economic incentives, which allows owners or operators of affected EGUs and other market participants to assess both short-term and long-term incentives when making decisions about compliance approaches or emission reduction investments, reduces long-term compliance costs for affected EGUs and ratepayer impacts. In addition, the increased temporal flexibility provided by banking would further help address potential electric reliability concerns, as banked ERCs can be used to meet emission standard requirements for an affected EGU.
d.
Addressing emission budget trading programs with broader source coverage and other flexibility features.
As described in section VIII.C above, under the emission standards plan type, a mass-based emission budget trading program with broader source coverage and other flexibility features may be designed such that compliance by affected EGUs (or compliance by affected EGUs plus new fossil fuel-fired EGUs meeting applicable requirements under state law) would assure achievement of the applicable state mass-based CO2
goal (or mass-based CO2
goal plus new source CO2
emission complement).[918]
However, emission budget trading programs, including those currently implemented by California and the RGGI participating states, include a number of different design elements that functionally expand the emission budget under certain circumstances. If a state chose, it could apply such mass-based emission standards, in the form of an emission budget trading program that differs in design from that outlined in section VIII.J.2.c above. These types of emission budget trading programs must be submitted as a part of a state measures plan type. Where an emission budget trading program addresses affected EGUs and other fossil fuel-fired EGUs, the requirements that must be included in the state plan are the federally enforceable emission standards in the state plan that apply specifically to affected EGUs, and the requirements that specifically require affected EGUs to participate in and comply with the requirements of the emission budget trading program. This includes the requirement for an affected EGU to surrender emission allowances equal to reported CO2
emissions, and meet monitoring and reporting requirements for CO2
emissions, among other requirements. These requirements may be submitted as part of the federally enforceable state plan through mechanisms with the appropriate legal authority and effect, such as state regulations, relevant Title V permit requirements for affected EGUs, and other possible instruments that impose these requirements specifically with respect to affected EGUs.[919]
Under this approach, the full set of regulations establishing the emission budget trading program that applies to affected EGUs and other fossil fuel-fired EGUs and other emission sources (if relevant) must be described as supporting documentation in the state plan submittal. This structure is appropriate to ensure that states with an emission budget trading program that addresses both affected EGUs and other fossil fuel-fired EGUs do not inappropriately submit requirements regarding entities other than affected EGUs for inclusion in the federally enforceable state plan.
Such state programs could include a number of different design elements. This includes broader program scope, where a program includes other emission sources beyond affected EGUs subject to CAA section 111(d) and new fossil fuel-fired EGUs, such as industrial sources. Programs might also include design elements that make allowances available in addition to the established emission budget. This includes project-based offset allowances or credits from GHG emission reduction projects outside the covered sector and cost containment reserve provisions that make additional allowances available at specified allowance prices.[920]
In the case where an emission budget trading program contains elements that functionally expand the emission budget in certain circumstances, compliance by affected EGUs with the mass-based emission standards would not necessarily ensure that CO2
emissions from affected EGUs do not exceed the state's mass-based CO2
goal (or mass-based CO2
goal plus new source CO2
emission complement). However, states could modify such programs to remove flexibility mechanisms that functionally expand the emission budget, such as out-of-sector offsets and certain cost containment reserve mechanisms, and submit the program under an emission standards plan type.
Where a state chooses to retain such flexibility mechanisms as part of an emission budget trading program, the program may only be implemented as part of a state measures plan type because these state flexibility mechanisms would not assure CO2
emissions from affected EGUs do not exceed the state's mass-based CO2
goal (or mass-based CO2
goal plus new source CO2
emission complement). A description of the state measures plan type and related requirements is provided in section VIII.C.3.
Under this type of approach, the state would be required to include a demonstration,[921]
in its state plan submittal, of how its state measures, in conjunction with any emission standards on affected EGUs, would achieve the state mass-based CO2
goal (or mass-based CO2
goal plus new source CO2
emission complement). This demonstration would include a projection of the total CO2
emissions from the fleet of affected EGUs that would occur as a result of compliance with the emission standards in the plan. Section VIII.D.2 discusses how such demonstrations could address design elements of emission budget trading programs with broader scope and additional compliance flexibility mechanisms, such as those included in the California and RGGI programs. Once the plan is implemented, if the mass-based CO2
goal is not achieved during a plan performance period, the backstop federally enforceable emission standards included in the state plan that apply to affected EGUs would be implemented, as described in section VIII.C.3.b.[922]
( printed page 64892)
e.
Considerations for mass-based emission budget trading programs.
The EPA notes that while an emission budget trading program included in an emission standards plan must be designed to achieve a state mass-based CO2
goal (or mass-based CO2
goal plus new source CO2
emission complement), states have wide discretion in the design of such programs, provided the emission standards included in the plan are quantifiable, verifiable, enforceable, non-duplicative, and permanent.
(1)
Allowance allocation.
A key example is state discretion in the CO2
allowance allocation methods included in the program.[923]
This includes the methods used to distribute CO2
allowances and the parties to which allowances are distributed. For example, if a state chose, it could include CO2
allowance allocation provisions that provide incentives for certain types of complementary activities, such as RE generation, that help achieve the overall CO2
emission limit for affected EGUs established under the program. In addition, a state could use its allocation provisions to encourage investments in RE and demand-side EE in low-income communities. States could also use CO2
allowance allocation provisions to provide incentives for early action, such as RE generation or demand-side EE savings that occur prior to the beginning of the interim plan performance period in 2022. For example, a state could include CO2
allowance allocation provisions where CO2
allowances are distributed to RE generators based on MWh of RE generation that occurs prior to 2022. Such provisions might be addressed through a finite set-aside of CO2
allowances that are available for allocation under these provisions. This set-aside could be additional to a set-aside created by the state for the CEIP discussed in section VIII.B.2.
(2)
Facility-level compliance.
If a state chose, it could evaluate compliance (
i.e.,
allowance true-up) under its emission budget trading program at the facility level, rather than at the individual unit level. The EPA has adopted facility-level compliance in the emission budget-trading programs it administers, including the Acid Rain Program (70 FR 25162), Clean Air Interstate Rule (70 FR 25162), and Cross-State Air Pollution Rule (76 FR 48208). Under this approach, states would still track reported unit-level CO2
emissions—while evaluating compliance at the facility level—allowing them to track increases and decreases of CO2
emissions at individual EGUs.
An individual state may provide for the use of CO2
allowances issued by another state(s) for compliance with the mass-based emission standards in its plan. This type of state plan would include requirements that enable affected EGUs to use allowances issued in other states for compliance under the state's emission budget trading program. This type of state plan must also indicate how CO2
allowances will be tracked from issuance through use for compliance, through either a joint tracking system, interoperable tracking systems, or use of an EPA-administered tracking system.[924]
Two different implementation approaches could be used to create such links. A state could submit a “ready-for-interstate-trading” plan using an EPA-approved tracking system, but the plan would not identify links with other states. A state could also submit a plan with specified bilateral or multilateral links that explicitly identify partner states.
Interstate allowance linkages would not affect the approvability of each state's individual plan. However, different considerations apply for the approvability of an individual plan with such links, based on whether the emission budget trading program in the plan applies only to affected EGUs or includes other emission sources, and if the plan is designed to meet a state mass-based CO2
goal for affected EGUs only or to meet a mass-based CO2
goal plus a new source CO2
emission complement).
Under the first “ready-for-interstate-trading” implementation approach, a state would indicate in its state plan that its emission budget trading program will be administered using an EPA-approved (or EPA-administered) emission and allowance tracking system.[925]
State plans using a specified EPA-approved tracking system would be deemed by the EPA as ready for interstate linkage upon approval of the state plan. No additional EPA approval would be necessary for states to link their emission budget trading programs, and affected EGUs in those states could engage in interstate trading subsequent to EPA plan approval.
A state would indicate in its plan submittal that its emission budget trading system will use a specified EPA-approved tracking system. The state would also indicate in the regulatory provisions for its emission budget trading program that it would recognize as usable for compliance any emission allowance issued by any other state with an EPA-approved state plan that also uses the specified EPA-approved tracking system.
States could also adopt such a collaborative emission trading approach over time (through appropriate state plan revisions if the plan is not already structured as ready-for-interstate-trading), without requiring all of the original participating states to revise their EPA-approved plans.
Under the second implementation approach, a state could specify the other states from which it would recognize issued emission allowances as usable for compliance with its emission budget trading program. The state would indicate in the regulatory provisions for its emission budget trading program that emission allowances issued in other identified partner states may be used by affected EGUs for compliance. Such plans must indicate how allowances will be tracked from issuance through use for compliance, through either a joint tracking system, interoperable tracking systems, or EPA-administered tracking system. The EPA would assess the design and functionality of this tracking system(s) when reviewing individual submitted state plans.
Under this approach, states could also join such a collaborative emission trading approach over time. However, all participating states would need to revise their EPA-approved plans. If the expanded linkage is among previously approved plans with mass-based emission standards, approval of the plan revision would be limited to assessing the functionality of the shared tracking system or interoperable tracking systems
( printed page 64893)
in order to maintain the integrity of the linked programs.[926]
a.
Considerations for linked emission budget trading programs.
For individually submitted plans, interstate emission allowance linkages would not affect the approvability of each state's plan. However, approvability of an individual linked plan would differ based on the structure of the emission budget trading program included in the plan. These differences for plan approvability address distinctions among programs that include only affected EGUs and programs that cover a broader set of emission sources, as well as if the plan is designed to meet a state mass-based CO2
goal for affected EGUs only or to meet a mass-based CO2
goal plus a new source CO2
emission complement. Differences in approval criteria are necessary to ensure that each individual state plan demonstrates it will achieve a state's mass-based CO2
emission goal for affected EGUs (or mass-based CO2
goal plus new source CO2
emission complement). The accounting applied to individual plans to assess whether a state achieves its mass-based CO2
goal (or mass-based CO2
goal plus new source CO2
emission complement) will also differ, based on whether an emission budget trading program includes only affected EGUs (or affected EGUs and applicable new fossil fuel-fired EGUs) or a broader set of emission sources. These considerations are addressed below, for both types of emission budget trading programs.
(1)
Links among emission budget trading programs that only include affected EGUs
or affected EGUs and applicable new fossil fuel-fired EGUs. Where the emission budget trading programs in each plan apply only to affected EGUs subject to the final rule (or emission budget trading programs that apply to affected EGUs under the state plan and applicable new fossil fuel-fired EGUs under state law), and include compliance timeframes for affected EGUs that align with the interim and final plan performance periods, both plans would functionally be meeting an aggregated multi-state mass-based goal (or aggregated mass-based CO2
goal plus new source CO2
emission complement), but without formally aggregating the goal (or aggregated mass-based CO2
goal plus new source CO2
emission complement). CO2
emissions from affected EGUs in both states could not exceed the total combined CO2
emission budgets under the emission standards in the two states. A net “import” of CO2
allowances from one state would mean that allowable CO2
emissions in the other net “exporting” state are less than that state's established emission budget. On a multi-state basis, CO2
emissions from affected EGUs could not exceed the sum of the states' emission budgets.
Under this approach, if the emission budget for the mass-based emission standard in each plan is equal to or lower than the state's mass-based CO2
goal (or aggregated mass-based CO2
goal plus new source CO2
emission complement, if applicable), compliance by affected EGUs with the mass emission standard in a state [927]
would ensure that cumulatively the mass CO2
goals (or mass-based CO2
goals plus new source CO2
emission complements) of the linked states are achieved. As a result, achievement of an individual state's mass CO2
goal (or mass-based CO2
goal plus new source CO2
emission complement) would be assessed by the EPA based on compliance by affected EGUs with the mass-based emission standards in the state plan, rather than reported CO2
emissions by affected EGUs in the state.[928]
The same accounting approach will apply for such plans in all cases, even if the state is linked to another state emission budget trading program that includes a broader set of emission sources (
e.g.,
sources beyond affected EGUs, or beyond affected EGUs plus applicable new fossil fuel-fired EGUs), as described below. In all cases, where a state plan includes an emission budget trading program that applies only to affected EGUs (or beyond affected EGUs plus applicable new fossil fuel-fired EGUs), and includes compliance timeframes that align with plan performance periods, achievement of a state mass CO2
goal (or mass-based CO2
goal plus new source CO2
emission complement) will be assessed by the EPA based on whether affected EGUs comply with the mass-based emission standard, rather than reported CO2
emissions from affected EGUs.
(2)
Links with emission budget trading programs that include a broader set of emission sources.
State plans may involve emission budget trading programs that include affected EGUs, applicable new fossil fuel-fired EGUs if a plan includes a new source CO2
emission complement, and other non-affected emission sources.[929]
Generally, such plans must demonstrate that the mass-based CO2
goal for affected EGUs (or mass-based CO2
goal plus new source CO2
emission complement) in a state will be achieved, as a result of implementation of the emission budget trading program.[930]
Where a program includes other non-affected emission sources (
i.e.,
non-affected emission sources that are not subject to a new source CO2
emission complement) and is linked with other programs,[931]
the state plan submittal must include a demonstration that the mass-based CO2
goal (or mass-based CO2
goal plus new source CO2
emission complement) will be achieved, considering the emission allowance links with other programs. The EPA, in determining the approvability of each state's plan under this approach, would evaluate the linkages between plans. Specifically, the EPA would evaluate whether the linkages would enable the affected EGUs (or affected EGUs in conjunction with applicable new fossil fuel-fired EGUs) in each participating state to meet the state's applicable mass-based CO2
goal (or mass-based CO2
goal plus new source CO2
emission complement).
During plan implementation, the EPA would assess whether the affected EGUs in a state achieved the state's mass-based CO2
goal (or mass-based CO2
goal plus new source CO2
emission complement) as follows. Reported CO2
( printed page 64894)
emissions from affected EGUs under such plans must be at or below a state's mass-based CO2
emission goal (or mass-based CO2
goal plus new source CO2
emission complement) during an identified plan performance period, with the following state accounting adjustments for net “import” and net “export” of CO2
allowances:
Net “imports” of CO2allowances:
Reported CO2
emissions from affected EGUs in a state may exceed the state CO2
mass goal (or mass-based CO2
goal plus new source CO2
emission complement) during an identified plan performance period in the amount of an adjustment for the net “imported” CO2
allowances during the plan performance period. The adjustment represents the CO2
emissions (in tons) equal to the number of net “imported” CO2
allowances. Under this adjustment, such allowances must be issued by a state with an emission budget trading program that only applies to affected EGUs (or affected EGUs plus applicable new fossil fuel-fired EGUs). Net “imports” of allowances are determined through review of tracking system compliance accounts.
Net “exports” of CO2allowances:
Reported CO2
emissions from affected EGUs in a state during an identified plan performance period must be equal to or less than the CO2
mass goal (or mass-based CO2
goal plus new source CO2
emission complement) minus an adjustment for the “exported” CO2
allowances during the plan performance period. The adjustment represents CO2
emissions (in tons) equal to the number of net “exported” CO2
allowances. Net “exports” of allowances are determined through review of tracking system compliance accounts.
Where CO2
emissions from affected EGUs exceed these levels (based on reported CO2
emissions with applied plus or minus adjustments for net CO2
allowance “imports” or “exports”) over the 8-year interim period or during any final plan reporting period, or by 10 percent or more during the interim step 1 or step 2 periods, a state would be considered to, in the case of the interim and final periods, not have met its CO2
mass goal during an identified plan performance period, and in the case of the interim step periods, to not be on course to meet the final goal. As a result, under a state measures state plan, implementation of the backstop federally enforceable emission standards for affected EGUs in the state plan would be triggered.
A net transfer of CO2
allowances during a plan performance period represents the net number of CO2
allowances (issued by a respective state) that are transferred from the compliance accounts of affected EGUs in that state to the compliance accounts of affected EGUs in another state.[932]
This net transfer is determined based on compliance account holdings at the end of the plan performance period.[933]
For example, assume two states, State A and State B, with emission budgets of 1,000 tons of CO2
. Each state issues 1,000 CO2
allowances. At the end of a plan performance period, affected EGUs in State A collectively hold 500 CO2
allowances in their compliance accounts that were issued by State A. Affected EGUs in State B collectively hold in their compliance accounts 500 CO2
allowances issued by State A and 1,000 CO2
allowances issued by State B. In this simplified example, a net transfer of 500 CO2
allowances has occurred between State A and State B. State A has “exported” 500 CO2
allowances to State B, while State B has “imported” 500 CO2
allowances from state A.
K. Additional Considerations and Requirements for Rate-Based State Plans
This section discusses considerations and requirements for rate-based state plans. This section discusses eligibility, accounting, and quantification and verification requirements (EM&V) for the use of CO2
emission reduction measures that provide substitute generation for affected EGUs or avoid the need for generation from affected EGUs in rate-based state plans. These measures may be used to adjust the CO2
emission rate of an affected EGU under a rate-based state plan. This adjustment may occur when an affected EGU is demonstrating compliance with a rate-based emission standard, or when a state is demonstrating achievement of the CO2
emission performance rates or applicable rate-based state CO2
emission goal in the emission guidelines. This section also discusses requirements for state plans that include rate-based emission trading programs, including approaches and requirements for coordination among such programs where states retain individual state rate-based CO2
emission goals.
1. Adjustments to CO2
Emission Rates in Rate-Based State Plans
Section VIII.K.1.a below describes the basic accounting method for adjusting a CO2
emission rate, as well as eligibility requirements for measures that may be used for adjusting a CO2
emission rate. Section VIII.K.1.b addresses measures that may not be used to adjust the CO2
emission rate of an affected EGU in a state plan, and explains the basis for this exclusion. Section VIII.K.1.c addresses measures that reduce CO2
emissions outside the electric power sector. Such measures may not be counted under either a rate-based or mass-based state plan.
a.
Measures taken to adjust the CO2emission rate of an affected EGU.
This section describes how measures that substitute for generation from affected EGUs or avoid the need for generation from affected EGUs may be used in a state plan to adjust the CO2
emission rate of an affected EGU. This section discusses the required accounting method for adjusting a CO2
emission rate, as well as general eligibility requirements that apply to different categories of measures that may be used to adjust a CO2
emission rate. Where relevant, this section also discusses additional specific accounting methods and other relevant requirements that apply to different categories of measures.
A CO2
emission rate adjustment may be applied in different rate-based state plan contexts. For example, in a rate-based emission trading program, adjustments may be applied through the use of ERCs.[934]
Regardless of the type of plan in which an adjustment is applied, the same basic accounting and general eligibility requirements described in this section will apply.
As discussed in this section, a wide range of actions may be taken to adjust the reported CO2
emission rate of an affected EGU in order to meet a rate-based emission standard and/or demonstrate achievement of a state CO2
rate-based emissions goal. All of the measures described in this section will substitute for generation from affected EGUs or avoid the need for generation
( printed page 64895)
from affected EGUs, thereby reducing CO2
emissions. This includes incremental NGCC and RE measures included in the EPA's determination of the BSER, as well as other measures that were not included in the determination of the BSER, such as other RE resources, demand-side EE, CHP, WHP, electricity transmission and distribution improvements, nuclear energy, and international RE imports connected to the grid in the contiguous U.S., as discussed elsewhere in this preamble.
The EPA believes that the broad categories of measures listed in this section address the wide range of actions that are available to reduce CO2
emissions from affected EGUs under a rate-based state plan. However, the actions that a state could include in a rate-based state plan are not necessarily limited to those described in this section. Other specific actions not listed here may be incorporated in a state plan, provided they meet the general eligibility requirements listed in this section, as well as the other relevant requirements in the emission guidelines.[935]
Nor are states required to include in their plans all of the actions that are described in this section.
This section discusses the basic accounting method for adjusting the reported CO2
emission rate of an affected EGU, through the use of measures that substitute for or avoid generation from affected EGUs. That method is based on adding MWh from such measures to the denominator of an affected EGU's reported CO2
emission rate (lb CO2
/MWh). Those additional MWh are based on quantified and verified electricity generation or electricity savings from eligible measures, and in the case of an affected EGU's compliance with its emission standard, are reflected in ERCs. This section also addresses eligibility requirements for resources that are used to adjust an affected EGU's CO2
emission rate.
(1)
General accounting approach for adjusting a CO2emission rate.
In this final rule, the reported CO2
emission rate of an affected EGU may be adjusted based on quantified and verified MWh from qualifying zero-emitting and low-emitting resources, as described in sections VIII.K.1.a.(2)-(10) below. These MWh are added to the denominator of an affected EGU's reported CO2
emission rate, resulting in a lower adjusted CO2
emission rate.
The measures described in these sections reduce mass CO2
emissions from affected EGUs by substituting zero- or low-emitting generation for generation from affected EGUs, or by avoiding the need for generation altogether (in the case of resources that lower electricity demand through improved demand-side EE and DSM). In both of these cases, generation from an affected EGU is replaced, through substitute generation or a reduction in electricity demand. To the extent that qualifying zero-emitting and low-emitting resources result in reduced generation and CO2
emissions from an individual affected EGU, those emission impacts are reflected in lower reported CO2
emissions and a reduction in MWh generation from the affected EGU. However, while there will be a reduction in CO2
emissions at the affected EGU, the fact that both CO2
emissions and MWh generation are reduced means that such impacts do not alter the reported CO2
emission rate of the affected EGU. As a result, the MWh of replacement generation must be added to the denominator of the reported CO2
emission rate in order to represent those impacts in the form of an adjusted CO2
emission rate. In this manner, adding MWh from these resources to the denominator of an affected EGU's CO2
emission rate allows mass CO2
emission reductions from these measures to be fully reflected in an adjusted CO2
emission rate.
The following provides a simple calculation example of how MWh of replacement generation added to the denominator of an affected EGU's reported CO2
emission rate results in a lower adjusted CO2
emission rate. Assume an affected EGU with CO2
emissions of 200,000 lb and electric generation of 100 MWh during a reporting period. The affected EGU's reported CO2
emission rate is 2,000 lb/MWh (200,000 lb CO2
/100 MWh = 2,000 lb/MWh). When complying with its rate-based emission limit, the affected EGU submits 10 ERCs, representing 10 MWh of replacement generation.[936]
Adding 10 MWh of replacement generation to the reported MWh generation of the affected EGU results in an adjusted CO2
emission rate of 1,818 lb CO2
/MWh (200,000 lb CO2
/110 MWh = 1,818 lb CO2
/MWh).
In the case of rate-based CO2
emission standards, an affected EGU demonstrates compliance with the emission standards if the affected EGU's adjusted CO2
emission rate calculated in the aforementioned manner is less than or equal to the applicable CO2
emission standard rate.[937]
The CO2
emission performance rates or rate-based CO2
goal in the emission guidelines are met if the adjusted CO2
emission rate of affected EGUs in a state is at or below the specified CO2
emission rate in a state plan that applies for an identified plan performance period.
Numerous commenters requested that the EPA ensure consistency between goal-setting calculations and the methodology used to demonstrate achievement of a CO2
emission rate under a state plan. This approach for adjusting a CO2
emission rate corresponds with how RE, one of the components of the BSER that involves adjustment of a CO2
emission rate, is represented in the CO2
emission performance rates in the emission guidelines. Specifically, in the calculation of final CO2
emission performance rates, the MWhs of RE are reflected in two adjustments of the rate: A reduction of CO2
emissions from affected EGUs in the numerator and a one-to-one replacement of affected EGU generation in the denominator, where it is assumed that replaced generation from an affected EGU is subtracted from the denominator and the same number of zero-emitting MWh are added.[938]
When demonstrating achievement of a CO2
emission performance rate, the reported CO2
emissions already reflect the actual emission reductions from the deployment of qualifying zero-emitting and low-emitting resources across the regional grid; a further adjustment of CO2
emissions would double count CO2
emissions impacts across the grid. Consistent with the EPA's calculation of the CO2
emission performance rates and state rate-based CO2
goals in the emission guidelines, the zero-emitting MWhs (from substitute generation or a reduction in electricity demand) must still be added to the denominator of a reported CO2
emission rate to calculate an adjusted CO2
emission rate that appropriately reflects the replaced generation. Thus, the resultant rate, where the numerator reflects CO2
emission reductions from qualifying measures, and the denominator reflects replaced generation, is consistent with the goal-setting calculation.
Several commenters suggested that the EPA consider the regional nature of the electricity grid and how RE and demand-side EE impacts generation and CO2
emissions across the grid when accounting for the impacts of RE and
( printed page 64896)
demand-side EE measures in a rate-based plan approach. This MWh accounting structure corresponds with the regional treatment of RE resources in the BSER that provide substitute generation in the EPA-calculated CO2
emission performance rates in the emission guidelines. Consistent with assumptions used in calculating the CO2
emission performance rates in the emission guidelines, affected EGUs and states can take full credit for the MWh resulting from eligible measures they are responsible for deploying, no matter where those measures are implemented. CO2
emission reductions from the eligible measures may occur across the region; however, an affected EGU or a state may only take credit for avoided CO2
emissions at that affected EGU or set of EGUs in question, as reflected in the reported stack CO2
emissions of affected EGUs.
Because of the separate accounting of MWhs and CO2
emissions, with emission impacts inherent in reported stack CO2
emissions and zero-emitting MWh impacts requiring explicit adjustments, the accounting method corresponds with the use of MWh-denominated ERCs in the rate-based emission trading framework specified in this rule. The accounting method only requires a quantification of the MWh generated or avoided by an eligible measure, and thus credits or adjustments can be denominated in MWh and do not need to represent an approximation of the CO2
emission reductions that result from those MWhs. This creates a crediting system or rate adjustment process that is simpler to implement than one that requires an approximation of avoided CO2
emissions.
The MWh accounting method also creates a crediting system or rate adjustment process that is indifferent to the rate-based CO2
emission goals of individual states, or the specific CO2
emission rate standards that states may apply, and the relative stringency of those goals or standards. Use of ERCs in rate-based emission trading programs is addressed in detail in section VIII.K.2. As a result, the MWh accounting method addresses interstate effects, because it inherently accounts for how generation replacement and CO2
emission reduction impacts may cross state borders. For example, if the accounting method was informed by avoided CO2
emission rates, it could create perverse incentives for development of zero- or low-emitting resources in states that result in the greatest calculated estimate of CO2
emission reductions for each replacement MWh. Instead, this accounting method is indifferent to avoided CO2
emission rates and creates the same number of zero-emitting credits or adjustment for each MWh of energy generation or savings, wherever they occur. For a detailed discussion on how the accounting method addresses interstate effects, see section VIII.L.
(2)
General eligibility requirements for resources used to adjust a CO2emission rate.
The EPA is finalizing certain general eligibility requirements for resources used to adjust a CO2
emission rate. These requirements align eligibility with certain factors and assumptions used in establishing the BSER, and by extension, application of the BSER to the performance levels established for affected EGUs in the emission guidelines, as well as state rate and mass CO2
goals. As a result, the requirements ensure that measures that may be used in a state plan are treated consistently (to the extent possible) with the EPA's assessment of the BSER.[939]
These general requirements also address potential interactions among rate and mass plans, as discussed more fully in section VIII.L.
As discussed in the sections that follow, the general eligibility criteria address:
The date from which eligible measures may be installed (e.g.,
installation of RE generating capacity and installation of EE measures);
the date from which MWh from eligible measures may be counted, and applied toward adjusting a CO2
rate; and
the need to demonstrate that eligible measures replace or avoid generation from affected EGUs.
(a)
Eligibility date for installation of RE/EE and other measures and MWh generation and savings.
Incremental emission reduction measures, such as RE and demand-side EE, can be recognized as part of state plans, but only for the emission reductions they provide during a plan performance period. Specifically, this means that measures installed in any year after 2012 are considered eligible measures under this final rule, but only the quantified and verified MWh of electricity generation or electricity savings that they produce in 2022 and future years may be applied toward adjusting a CO2
emission rate. For example, MWh generation in 2022 from a wind turbine installed in 2013 may be applied toward adjusting a CO2
emission rate. This 2012 date applies to all eligible measures that are used to adjust a CO2
emission rate under a state plan. For example, eligible measures, such as CHP, nuclear power and DSM, also must be installed after 2012, but only their generation or savings produced in 2022 and after can be used to adjust a CO2
emission rate.
As discussed in section VIII.C.2.a, a MWh of generation or savings that occurs in 2022 or a subsequent year may be carried forward (or “banked”) and applied in a future year. For example, a MWh of RE generation that occurs in 2022 may be applied to adjust a CO2
emission rate in 2023 or future years, without limitation.[940]
These MWh may be banked from the interim to final periods.
This eligibility date criterion is consistent with the date of installation for “incremental” RE capacity that is included in the BSER building block 3, which is the basis for RE MWh incorporated in the CO2
emission performance rates for affected EGUs in the emission guidelines. For more information on RE in the BSER, see section V.E.
Many commenters asserted that proposed state goals did not sufficiently account for actions states take that reduce CO2
emissions prior to the first plan performance period, and therefore requested that MWhs of electricity generation or electricity savings that occur prior to the first plan performance period be eligible to apply toward adjusting the CO2
emission rates of affected EGUs. The EPA recognizes the importance of early state action as the basis for significant CO2
emission reductions and as a key part of enabling state plans to achieve the CO2
emission performance levels or state CO2
goals. The ability to count eligible measures installed in 2013 and subsequent years for the MWhs they generate during a plan performance period provides significant recognition for early action, corresponding with the BSER framework that is based on cost-effective actions that many sources are already doing, while still conforming to CO2
performance rates and state goals that are forward-looking. In order to provide additional incentives for early investment in RE and demand-side EE, the EPA is also establishing the CEIP, as discussed in section VIII.B.2. ERCs distributed by states and the EPA through this program may also be used by affected EGUs to demonstrate compliance with an emission standard,
( printed page 64897)
and may be banked from the interim to final periods.
Commenters' concerns about treatment of early actions are further addressed by changes from proposal to the BSER assumptions and the methodology used by the EPA to establish the CO2
emission performance levels and rate-based state CO2
goals in the emission guidelines. The specifics of these changes are addressed in section V.A.3. Three examples of those changes are provided below.
First, affected EGUs that have maximized their CO2
emission reduction opportunities available through early action will be better positioned to meet the BSER CO2
emission performance rates or state goal applied to affected EGUs in their state. For example, a steam generating unit that has already reduced its CO2
emission rate through a heat rate improvement may have a CO2
emission rate of 2,000 lb/MWh whereas its rate was 2,100 lb/MWh prior to the improvement. Therefore, it has less distance to cover to meet its CO2
emission performance rate.
Second, generation from existing RE capacity installed prior to 2013 has been excluded from the EPA's calculation of the CO2
emission performances rates in the emission guidelines. That RE generating capacity will still provide zero-emitting generation to the grid meeting demand that will not need to be addressed by existing affected EGUs and will better position states and affected EGUs to meet the CO2
performances rates or state rate- or mass-based CO2
goals.
Third, commenters expressed concern that demand-side EE targets as part of proposed state goals reflected an assumption of installation of increased EE measures starting in 2017, which seemed to be an implicit requirement to take action prior to the performance period. Because demand-side EE is not used in calculating the CO2
emission performance rates in the final emission guidelines, this is no longer a concern. Furthermore, eligible demand-side EE actions that occur after 2012 can be applied toward adjusting the CO2
emission rates of affected EGUs, providing a significant compliance option that is not assumed in emission performance rates or state goals.
(b)
Demonstration that measures substitute for grid generation.
Eligible measures must be grid-connected. This eligibility criterion aligns incremental NGCC generation in building block 2. It also aligns with RE generation in building block 3 of the BSER, which substitutes for the need for generation from affected EGUs.
All EE measures must result in electricity savings at a building, facility, or other end-use location that is connected to the electricity grid. EE measures only avoid electric generation from grid-connected EGUs if the electrical loads where the efficiency improvements are made are interconnected to the grid.
Commenters sought clarity on this issue, so the EPA is providing this requirement as part of the final rule. Some commenters advocated for the inclusion of measures that were not grid connected as eligible resources, arguing that some of these measures substituted for non-affected EGUs and resulted in reductions in CO2
emissions. However, eligible measures must be able to substitute for generation from affected EGUs as defined under this rule, and thus must be tied to the electrical grid.
(c)
Geographic eligibility.
All eligible emission reduction measures, including RE generation and demand-side EE, may occur in any state, with certain limitations, as described below. To the extent these measures are tied to a state plan,[941]
these measures may be used to adjust a CO2
emission rate, regardless of whether the associated generation or electricity savings occur inside or outside the state.[942]
This approach is generally consistent with the approach used in building block 3 of the BSER, which reflects regionally available RE. It also recognizes that emission reduction measures have impacts on electricity generation across the electricity system, both within and beyond a state's borders. A more in-depth discussion of the basis for treatment of in-state and out-of-state measures is provided in section VIII.L.
State plans must demonstrate that emission standards and state measures (if applicable) are non-duplicative. Given the geographic eligibility approach described here, this includes a demonstration that a state plan does not allow recognition of a MWh, for use in adjusting the CO2
emission rate of an affected EGU, if the MWh is being or has been used for such a purpose under another state plan. Discussion of how such a demonstration can be made in the context of a rate-based emission trading program is in section VIII.D.2.b.
The EPA received many comments on the treatment of in-state and out-of-state RE and demand-side EE. Most commenters recommended crediting of both in-state and out-of-state RE and demand-side EE measures, similar to the final rule approach for eligible emission reductions measures. Commenters argued that this approach makes sense based on the nature of the interconnected electricity grid and allows states and utilities to fully account for their RE and demand-side EE efforts, whether that RE or EE, and its related impacts, occurs inside or outside of their state. Some commenters expressed concerns that, at proposal, states with significant RE resources had large amounts of existing RE capacity included in their state CO2
goals, but that RE was functionally credited to other states for use in meeting their goals because it was associated with measures (such as an RPS) likely to be included in another state's plan. This concern has been addressed through changes in the BSER RE assumptions in the final rule. This includes regionalization of the RE building block, and removal of existing RE capacity constructed prior to 2012 from the building block. The result of these changes is that the RE incorporated in the BSER is more equally shared across states.
(i)
Measures that occur in states with mass-based plans.
As discussed above, eligible measures for adjusting the CO2
emission rate of an affected EGU may occur in any state, with certain conditions. This includes a condition that applies to eligible measures that occur in a state with an EPA-approved plan that is meeting a state mass-based CO2
goal. Eligible measures that could be used to adjust a CO2
emission rate under a rate-based state plan which are located in a state with a mass-based plan are restricted from being counted under another state's rate-based plan. An exception is made for RE measures that occur in such mass-based states, because of its unique role in BSER. RE measures must meet additional eligibility criteria in order to be used to adjust the CO2
emission rate of an affected EGU in a state with a rate-based plan. This exception only applies to RE; other emission reduction measures that were not included in the determination of the BSER located in mass-based states, including demand-side EE, are restricted from ERC issuance in rate-based states.
( printed page 64898)
These criteria are intended to address the fact that eligible measures should lead to substitution of generation from affected EGUs, with related impacts on CO2
emissions from affected EGUs. Where states with mass-based plans implement mass-based CO2
emission standards, CO2
emissions reductions from affected EGUs must occur in order to comply with these emission standards and, unlike the rate-based approach, zero- and low-emitting MWhs do not play a specified role in demonstrating that the mass-based standards have been met.[943]
Since they are not counted in the mass-based demonstration, eligible measures located in mass-based states could be used in a state with a rate-based plan to adjust the CO2
emission rate of affected EGUs. Such adjustments would obviate the need for comparable CO2
emission reductions at affected EGUs in the rate-based state or the use of other measures to make a rate adjustment. In this scenario, to the extent that eligible measures substitute solely for generation from affected EGUs in a state with mass-based emission limits, and are also used to adjust the reported CO2
emission rate of affected EGUs in a rate-based state, no incremental CO2
emissions reductions would occur in the rate-based state as a result of the eligible measures.[944]
The result would be forgone CO2
emission reductions that would otherwise occur across the two states. These dynamics are further addressed in section VIII.L.
For RE measures located in a mass-based state to have some or all of its generation counted under a rate-based plan in another state, it must be demonstrated that the generation was delivered to the grid to meet electricity load in a state with a rate-based plan.[945]
Some examples of documentation that can serve as a demonstration include a power delivery contract or power purchase agreement. The EPA is giving states flexibility regarding the nature of this demonstration, but a state plan must describe the nature of the required demonstration and have it be approved by the EPA.
Under an emission standards plan, this demonstration must be made by the provider of the RE measure seeking ERC issuance under the rate-based emission standards in a rate-based state, as part of the eligibility application for the measure.[946]
The rate-based state must include in its state plan provisions that describe a sufficient demonstration of geographic eligibility for the RE generation under rate-based emission standards.
Further examples of eligible demonstrations and how they should be outlined in state plans are provided in section VIII.L.
(ii)
Measures that occur in states, including areas of Indian country, that do not have affected EGUs.
States, including areas of Indian country, that do not have any affected EGUs within their borders may be providers of credits for generation from zero- or low-emitting resources to adjust CO2
emission rates. In its supplemental proposal for the proposed rulemaking, the EPA sought comment on whether or not jurisdictions without affected fossil fuel generation units subject to the proposed emission guidelines should be authorized to participate in state plans. Commenters were supportive of allowing those jurisdictions without affected EGUs the opportunity to participate in state plans. CO2
reduction measures in areas without affected EGUs have the potential to provide cost-effective opportunities to reduce emissions and should be available on a voluntary basis to affected EGUs. Commenters noted that some tribes, for example, have many untapped RE resources that could be developed, and they should be able to realize the benefits of contributing to a state plan. Commenters stated that because of the integrated nature of the U.S. electricity grid, it is appropriate to allow all jurisdictions with the ability to contribute to and benefit from CO2
emission reductions or CO2
emission rate adjustments.
For participating states, they must adhere to EM&V standards, installation dates, and any other criteria that apply to all states. Section VIII.K.3 below identifies and discusses the EM&V requirements used to quantify MWh savings from generation from zero- or low-emitting sources.
States, including areas of Indian country, that do not have any affected EGUs may provide ERCs to adjust CO2
emissions provided they are connected to the contiguous U.S. grid and meet the other requirements for eligibility. To qualify for ERCs from zero or low-emitting resources, it must be demonstrated that the generation was delivered to the grid to meet electricity load in a state with a rate-based plan.[947]
Some examples of documentation that can serve as a demonstration include a power delivery contract or power purchase agreement. The EPA is giving states flexibility regarding the nature of this demonstration, but a state plan must describe the nature of the required demonstration and have it be approved by the EPA.
In addition to generation from zero- or low-emitting resources, demand-side EE resources in areas of Indian country located within the borders of states with rate-based emission standards for affected EGUs may also be issued ERCs. In these instances, the area of Indian country is located within the rate-based service area subject to a rate-based state plan. The ERCs from demand-side EE resources must meet the eligibility requirements to adjust a CO2
emission rate, including installation date and EM&V requirements described below in section VIII.K.3. If the area of Indian country is located within the borders of a state that is meeting a mass-based CO2
goal, then the demand-side EE resources are not eligible to be issued ERCs. Similarly, demand-side EE resources in any state with a mass-based CO2
goal are not eligible to provide ERCs.
Non-contiguous states and territories may not be providers of ERCs to the contiguous U.S. states. As discussed previously in section VII.F, we have not set CO2
emission performance goals for Alaska, Hawaii, Guam, or Puerto Rico in this final rule at this time.
(iii)
Measures that occur outside the U.S.
The EPA will work with states using the rate-based approach that are interested in allowing the use of RE from outside the U.S. to adjust CO2
emission rates. In these cases, all conditions for creditable domestic RE must be met, including that RE resources must be incremental and installed after 2012, and all EM&V standards must be met. In addition, the country generating the ERCs must be connected to the U.S. grid, and there must be a power purchase agreement or other contract for delivery of the power with an entity in the U.S. RE generation capacity outside the U.S. that existed prior to 2012 but was not exported to the U.S. is not considered new or incremental generation and, therefore,
( printed page 64899)
not eligible for adjusting CO2
emission rates under this rule. For example, a new transmission interconnection to existing RE in Canada would not be considered incremental, but a new interconnection to RE where the RE was built after 2012 would be considered incremental. See below in section VIII.K.1.a.(3) for more specifics regarding the use of incremental hydroelectric power in a rate-based approach.
The EPA received comments encouraging the use of international zero-emitting electricity imports in state plans, particularly hydroelectric power from Canada. Canada currently provides states such as Minnesota and Wisconsin with RE through existing grid connections. New projects are in various stages of development to increase generating capacity, which could be called upon as a base load resource to supplement variable forms of RE generation. Commenters said that the EPA should permit the use of all incremental hydropower—both domestic and international—towards EGU CO2
emission rate adjustments providing that double-counting can be prevented; and the EPA acknowledges this may be allowable, as long as the specified criteria have been met.
(3)
RE.
RE measures may be used to adjust a CO2
emission rate, provided they meet the general eligibility requirements outlined above and the MWh electricity generation is properly quantified and verified.[948]
As used in this section, RE includes electric generating technologies using RE resources, such as wind, solar, geothermal, hydropower, biomass and wave and tidal power. A capacity uprate at an existing RE facility (
i.e.,
an uprate to generating capacity originally installed as of 2012 or earlier) is eligible to adjust a CO2
emission rate. The capacity uprate must occur after 2012. Such uprates to capacity represent incremental capacity added after 2012.
Quantification and accounting criteria for incremental RE (and nuclear generation) are as follows. The incremental generating capacity (in nameplate MW) is divided by the total uprated generating capacity (in nameplate MW) and then multiplied by generation output (in MWh) from the uprated generator. For example, if a hydroelectric power plant expands generating nameplate capacity from 100 MW to 125 MW and generation output increased to 1,000 MWh, then 200 MWh ((25 MW/125 MW) * 1,000 MWh) is eligible for use in adjusting a CO2
emission rate, regardless of the overall level of generation for the period.[949]
Many commenters supported using RE deployment as measures to adjust the CO2
emission rate of affected EGUs. Some commenters specifically agreed with the EPA's determination that only new and incremental RE (including hydropower) should be used to adjust CO2
emission rates. Those commenters objected to counting existing RE that are already embedded in the baseline emissions and generation mix. A significant number of commenters supported the integration of RE into a rate-based credit trading system.
Certain additional requirements apply for hydropower and biomass (including waste-to-energy) RE, as described below.
(a)
Hydroelectric power.
Consistent with other types of RE, new hydroelectric power generating capacity installed after 2012 is eligible for use in adjusting a CO2
emission rate.
Relicensed facilities are considered existing capacity and, therefore, are not eligible for use in adjusting a CO2
emission rate, unless there is a capacity uprate as part of the relicensed permit. In such a case, only the incremental capacity is eligible for use in adjusting a CO2
emission rate.
The EPA noted that many commenters preferred that generation from hydropower displace generation from fossil sources. One commenter suggested that existing zero-emitting sources, including hydropower, do not reduce emissions from existing fossil generation, but that new or uprated zero-emitting sources would, because of their low variable rate, reduce fossil emissions. Several commenters recommended allowing incremental generation from new or uprated zero-emitting sources, including hydropower, be available for compliance.
(b)
Biomass.
RE generating capacity installed after 2012 that uses qualified biomass as a fuel source is eligible for use in adjusting a CO2
emission rate.[950]
As discussed in section VIII.I.2.c., if a state intends to allow for the use of biomass as a compliance option for an affected EGU to meet a CO2
emission standard, a state must propose qualified biomass feedstocks and treatment of biogenic CO2
emissions in its plan, along with supporting analysis and quality control measures, and the EPA will review the appropriateness and basis for such determinations in the course of its review of a state plan. Where an RE generating unit uses qualified biomass, as designated in an approved state plan, MWh generation from the unit could be used to adjust the reported CO2
emission rate of an affected EGU. Total MWh generation from an RE generating unit that uses qualified biomass must be prorated based on either the heat input supplied from qualified biomass as a proportion of total heat input or on the proportion of biogenic CO2
emissions compared to total stack CO2
emissions from the RE generating unit. Either approach must incorporate the approved valuation of biogenic CO2
emissions from qualified biomass in the plan (
i.e.,
the proportion of biogenic CO2
emissions from use of qualified biomass feedstock that would not be counted).
Section VIII.K describes the requirements and procedures for EM&V, and discusses how all eligible resources must demonstrate how they will quantify and verify MWh savings using best-practice EM&V approaches. One way to make this demonstration for eligible resources could be to use the presumptively approvable EM&V approaches that are included in the final model trading rule.
(c)
Waste-to-energy.
Qualified biomass may include the biogenic portion of MSW combusted in a waste-to-energy facility.[951]
With regard to assessing qualified biomass proposed in state plans, the EPA generally acknowledges the CO2
emissions and climate policy benefits of waste-derived biomass, which includes biogenic MSW inputs to waste-to-energy facilities. The process and considerations for the use of biomass in state plans are discussed in section VIII.I.2.c.
MSW can be directly combusted in waste-to-energy facilities to generate electricity as an alternative to landfill disposal. In the U.S., almost all incineration of MSW occurs at waste-to-energy facilities or industrial facilities where the waste is combusted and energy is recovered.[952]
Total MSW generation in 2012 was 251 million tons, but of that total volume generated, almost 87 million tons were recycled
( printed page 64900)
and composted.[953]
Increasing demand for electricity generated from waste-to-energy facilities could increase competition for and generation of waste stream materials—including discarded organic waste materials—which could work against programs promoting waste reduction or cause diversion of these materials from existing or future efforts promoting composting and recycling. The EPA and many states have recognized the importance of integrated waste materials management strategies that emphasize a hierarchy of waste prevention, starting with waste reduction programs as the highest priority and then focusing on all other productive uses of waste materials to reduce the volume of disposed waste materials.[954]
For example, Oregon and Vermont have strategies that emphasize waste prevention, followed by reuse, then recycling and composting materials prior to treatment and disposal.[955]
Information in the revised
Framework for Assessing Biogenic CO2Emissions from Stationary Sources
and other technical studies and tools (
e.g.,
EPA Waste Reduction Model, EPA Decision Support Tool) should assist both states and the EPA in assessing the role of biogenic feedstocks used in waste-to-energy processes, where use of such feedstocks is included in a state plan.[956]
When developing their plans, states planning to use waste-to-energy as an option for the adjustment of a CO2
emission rate should assess both their capacity to strengthen existing or implement new waste reduction, reuse, recycling and composting programs, and measures to minimize any potential negative impacts of waste-to-energy operations on such programs. States must include that information in their plan submissions. The EPA will reject as qualified biomass any proposed waste-to-energy component of state plans if states do not include information on their efforts to strengthen existing or implement new waste reduction as well as reuse, recycling and composting programs, and measures to minimize any potential negative impacts of waste-to-energy operations on such programs. Only electric generation at a waste-to-energy facility that is related to the biogenic fraction of MSW and that is added after 2012 is eligible for use in adjusting a CO2
emission rate.
A state plan must include a method for determining the proportion of total MWh generation from a waste-to-energy facility that is eligible for use in adjusting a CO2
emission rate. The EPA will evaluate the method as part of its evaluation of the approvability of the state plan. Measuring the proportion of biogenic to fossil CO2
emissions can be performed through sampling and testing of the biogenic fraction of the MSW used as fuel at a waste-to-energy facility (
e.g.,
via ASTM D-6866-12 testing or other methods—ASTM, 2012; Bohar, et al. 2010), or based on the proportion of biogenic CO2
emissions to total CO2
emissions from the facility. For an example of the former method, if the biogenic fraction of MSW is 50 percent by input weight, only the proportion of MWh output attributable to the biogenic portion of MSW at the waste-to-energy facility may be used to adjust an affected EGU CO2
emission rate. Alternatively, as an example of the latter method, if biogenic CO2
emissions represent 50 percent of total reported CO2
emissions, a facility would need to estimate the fraction of biogenic to fossil MSW utilized and the net energy output of each component (based on relative higher heating values) to determine the percent of the MWh output from the waste-to-energy facility that may be used to adjust an affected EGU's CO2
emission rate. Section VIII.K describes the requirements and procedures for EM&V, and discusses how all eligible resources must demonstrate how they will quantify and verify MWh savings using best-practice EM&V approaches. One way to make this demonstration for eligible resources could be to use the presumptively approvable EM&V approaches that are included in the final model trading rule.
The EPA received multiple comments supporting the use of waste-to-energy as part of state plans. Some commenters expressed concern that non-biogenic materials, such as plastics and metal, would be incinerated along with biogenic materials. As discussed above, only electric generation related to the biogenic fraction of MSW at a waste-to-energy facility added after 2012 is eligible for use in adjusting a CO2
emission rate. The EPA also received comments that expressed concern about the potential negative impacts on recycling and waste reduction efforts, while other commenters asserted that waste-to-energy practices encourage recycling programs. Some commenters also expressed concern about what treatment would be approvable for emissions from waste-to-energy practices. As discussed above, potential negative impacts from waste-to-energy production on recycling, waste reduction, and composting programs should be evaluated and efforts to mitigate negative impacts must be discussed in the supporting documentation of state plans.
(4)
DSM.
Avoided MWh that result from DSM may be used to adjust a CO2
emission rate. Eligible DSM actions are those that are zero-emitting and avoid, rather than shift, the use of electricity by an electricity end-user.[957]
The MWh that may be used for such an adjustment are determined based on the MW of demand reduction multiplied by the hours during which such a demand reduction is achieved (MW of demand reduction × hours = MWh avoided). DSM measures must be appropriately quantified and verified, in accordance with requirements in the emission guidelines, as discussed in section VIII.K.3.
(5)
Energy storage.
Energy storage may not be directly recognized as an eligible measure that can be used to adjust a CO2
emission rate, because storage does not directly substitute for electric generation from the grid or avoid electricity use from the grid.[958]
The electric generation that is input to an energy storage unit may be used to adjust a CO2
emission rate, but the output from the energy storage unit may not.[959]
However, energy storage can be used as an enabling measure that facilitates greater use of RE, which can be used to adjust a CO2
emission rate. For example, utility scale energy storage may be used to facilitate greater grid penetration of RE generating capacity and can also be used to store RE generation that may have otherwise been shed in times of excess generating capacity. Likewise, on-site energy storage at an electricity end-user can
( printed page 64901)
enable greater use of RE to meet on-site electricity demand.[960]
The EPA received multiple comments regarding the overall merits of energy storage. Consistent with the discussion above, the majority of commenters observed that storage technology enables greater grid penetration of RE and supports more efficient and effective operations of both RE and fossil-fuel plants. Commenters further noted that energy storage can provide RE to the grid when it is most needed, while simultaneously taking pressure off fossil-fuel plants to respond to sudden shifts in demand. Despite broad acknowledgment of the benefits of storage, public comments underscore its indirect and supporting role in providing zero-emission MWh to the grid (consistent with the EPA's decision to exclude energy storage as an eligible measure that can be used to adjust a CO2
emission rate).
(6)
Transmission and distribution (T&D) measures.
Electricity T&D measures that improve the efficiency of the T&D system and/or reduce electricity use may be used to adjust a CO2
emission rate. This includes T&D measures that reduce losses of electricity during delivery from a generator to an end-user (sometimes referred to as “line losses” [961]
) and T&D measures that reduce electricity use at the end-user, such as conservation voltage reduction (CVR).[962]
The EPA received many comments in support of advanced energy technologies, including energy storage and transmission and distribution upgrades, and including these technologies in the suite of potential measures that states could consider for emission rate adjustments in their state plans. Comments pointed out that in addition to helping achieve emission standards, T&D efficiency improvements make the grid more robust and flexible, as well as delivering environmental benefits. In many parts of the country, grid operators, transmission planners, transmission owners and regulators are already taking steps to expand and modernize T&D networks. Commenters suggested that the EPA clarify the eligibility and criteria under which such measures would be permitted in a state plan.
To be eligible, T&D measures must be installed after 2012. This general eligibility requirement is discussed above in section VIII.K.1.a. The MWh of avoided losses or reduction in end-use that result from T&D measures must be appropriately quantified and verified, as discussed in section VIII.K.3.
(7)
Demand-side EE, including water system efficiency.
Demand-side EE measures may be used to adjust a CO2
emission rate, provided they meet the general eligibility requirements outlined above and the MWh electricity savings are properly quantified and verified.[963]
As used in this section, demand-side EE may include a range of eligible measures, provided that the measures can be quantified and verified in accordance with the EM&V requirements in the emission guidelines, which are addressed in section VIII.K.3. Examples of demand-side EE measures include, but are not limited to, EE measures that reduce electricity use in residential and commercial buildings, industrial facilities, and other grid-connected equipment. Water efficiency programs that improve EE at water and wastewater treatment facilities also provide demand-side EE savings opportunities. EE measures, for the purposes of this section, may consist of EE measures installed as the result of individual EE projects, such as those implemented by energy service companies, as well as multiple EE measures installed through an EE deployment program (
e.g.
appliance replacement and recycling programs, and behavioral programs) administered by electric utilities, state entities, and other private and non-profit entities.[964]
EE measures, for the purposes of this section, may also consist of state or local requirements that result in electricity savings, such as building energy codes and state appliance and equipment standards. Other interventions that result in electricity savings may also be considered an EE measure for the purposes of this section, provided the intervention can be specified and quantified and verified in accordance with EM&V requirements in the emission guidelines.
Numerous commenters expressed support for including demand-side EE as an eligible measure states and affected EGUs can use to meet the emission guidelines. Commenters touted the value of demand-side EE as a resource that delivers energy savings, lowers bills, creates jobs and reduces CO2
emissions. Commenters called for the EPA to allow for the use of a broad range of demand-side EE measures to meet the emission guidelines, including, but not limited to, utility and non-utility EE deployment programs; energy savings performance contracts; measures that reduce electricity use in residential and commercial buildings, industrial facilities and other grid-connected equipment; state and local requirements that result in electricity savings, such as building energy codes and state appliance and equipment standards; appliance replacement and recycling programs; and behavioral programs. The EPA also received comments supporting the use of water sector EE programs and projects. Commenters identified water and wastewater utilities as particularly well-suited for participating in EE programs and providing a source of electricity savings. Investments such as replacing pumps and other aging equipment and repairing leaks can result in greater EE. The EPA agrees that these electricity savings should be eligible for adjustments to CO2
emission rates at affected EGUs.
(8)
Nuclear power.
As is discussed in section V.A.3, upon consideration of comments received, the EPA has not included nuclear generation from either existing or under construction units in the determination of the BSER. In addition to comments received on the provisions for determining the BSER, the EPA also received comments requesting that the EPA allow all generation from nuclear generating units to be recognized as an
( printed page 64902)
eligible measure that can be used to adjust a CO2
emission rate. Commenters also recommended that the EPA consider nuclear generating units and RE generating units in a consistent manner for CO2
emission rate adjustments in state plans. We agree with comments that nuclear generation and RE should be treated consistently when it comes to CO2
emission rate adjustments.
The EPA has determined that generation from new nuclear units and capacity uprates at existing nuclear units will be eligible for use in adjusting a CO2
emission rate, just like new and uprated capacity RE. However, consistent with the reasons discussed for not including the preservation of existing nuclear capacity in the BSER—namely, that such preservation does not actually reduce existing levels of CO2
emissions from affected EGUs—preserving generation from existing nuclear capacity is not eligible for use in adjusting a CO2
emission rate.
In contrast, any incremental zero-emitting generation from new nuclear capacity would be expected to replace generation from affected EGUs and, thereby, reduce CO2
emissions; and the continued commitment of the owner/operators to completion of the new units and improving the efficiency of existing units through uprates can play a key role in state plans. Therefore, consistent with treatment of other low- and zero-emitting generation, new nuclear power generating capacity installed after 2012 and incremental generation resulting from nuclear uprates after 2012 are measures eligible for adjusting a CO2
emission rate. However, existing nuclear units (
i.e.,
those that originally commenced operation in 2012 or earlier years) that receive operating license extensions are not eligible for use in adjusting a CO2
emission rate, except where such units receive a capacity uprate as a result of the relicensing process. Only the incremental capacity from the uprate is eligible for use to adjust a CO2
emission rate.
Applicable generation (in MWh) from incremental nuclear power is determined in the same manner as that described for incremental RE above.
(9)
Combined heat and power (CHP) units.
Electric generation from non-affected CHP units [965]
may be used to adjust the CO2
emission rate of an affected EGU, as CHP units are low-emitting electric generating resources that can replace generation from affected EGUs. Electrical generation from non-affected CHP units that meet the eligibility criteria under section VIII.K.1.a can be used to adjust the reported CO2
emission rate of an affected EGU.
Where a state plan provides for the use of electrical generation from eligible non-affected CHP units to adjust the reported CO2
emission rate of an affected EGU, the state plan must provide a required calculation method for determining the MWh that may be used to adjust the CO2
emission rate. This proposed accounting method must adequately address the considerations discussed below. The EPA will review whether a state's proposed accounting method for electric generation from eligible non-affected CHP units is approvable per the requirements of the final emission guidelines, as part of its overall plan review of the rate-based emission standards and implementing and enforcing measures in the state plan. The EPA notes that the proposed model rule for a rate-based emission trading program includes a proposed accounting method for non-affected CHP units. The accounting method provided in a final model rule could be a presumptively approvable accounting approach.
The proposed accounting method in a state plan must address the following considerations. The accounting approach proposed in a state plan must take into account the fact that a non-affected CHP unit is a fossil fuel-fired emission source, as well as the fact that the incremental CO2
emissions related to electrical generation from a non-affected CHP unit are typically very low. In accordance with these considerations, a non-affected CHP unit's electrical MWh output that can be used to adjust the reported CO2
emission rate of an affected EGU should be prorated based on the CO2
emission rate of the electrical output associated with the CHP unit (a CHP unit's “incremental CO2
emission rate”) compared to a reference CO2
emission rate. This “incremental CO2
emission rate” related to the electric generation from the CHP unit would be relative to the applicable CO2
emission rate for affected EGUs in the state and would be limited to a value between 0 and 1.
This low CO2
emission rate for electrical generation from a non-affected CHP unit is a product of both the fact that CHP units are typically very thermally efficient and the fact that a portion of the CO2
emissions from a non-affected CHP unit would have occurred anyway from an industrial boiler used to meet the thermal load in the absence of the CHP unit. In contrast, the CHP unit also provides the benefit of electricity generation while resulting in very low incremental CO2
emissions beyond what would have been emitted by an industrial boiler. As a result, the accounting method proposed in a state plan should not presume that CO2
emission reductions occur outside the electric power sector, but instead only would account for the CO2
emissions related to the electrical production from a CHP unit that is used to substitute for electrical generation from affected EGUs.
Non-affected CHP units can use qualified biomass fuels. As described in section VIII.I.2.c, states must submit state plan requirements regarding qualified biomass feedstocks and treatment of biogenic CO2
emissions in state plans, along with supporting analysis and quality control measures, and the EPA would review the appropriateness and basis for such determinations in the course of its review of the approvability of a state plan. Considerations for qualified biomass included in state plans are discussed in section VIII.I.2.c, while accounting requirements for RE using biomass are provided in section VIII.K.1.a.(3)(b).
Most comments received on CHP recommended that the EPA explicitly describe how CHP can be accounted for in a state plan. Commenters described the CO2
emission reductions achieved through CHP's thermal efficiency and the precedent set in other federal and state rules that have included CHP as a compliance option. Some commenters pointed out that without such a description, states would not be able to readily take advantage of the CO2
emission reductions that result from the use of CHP.
(10)
WHP.
WHP units that meet the eligibility criteria under section VIII.K.1 may be used to adjust the CO2
emission rate of an affected EGU. There are several types of WHP units. There are units, also referred to as bottoming cycle CHP units, where the fuel is first used to provide thermal energy for an industrial process and the waste heat from that process is then used to generate
( printed page 64903)
electricity.[966]
There are also WHP facilities where the waste heat from the initial combustion process is used to generate additional power. Under both configurations, unless the WHP unit supplements waste heat with fossil fuel use, there is no additional fossil fuel used to generate this additional power. As a result, there are no incremental CO2
emissions associated with that additional power generation. As a result, the incremental electric generation output from the WHP facilities could be considered zero-emitting, for the purposes of meeting the emission guidelines, and the MWh of electrical output could be used to adjust the CO2
emission rate of an affected EGU.[967]
The MWh of electrical output from a WHP unit that can be recognized may not exceed the MWh of industrial or other thermal load that is being met by the WHP unit, prior to the generation of electricity.[968]
Most commenters that addressed WHP noted the benefits of WHP at the same time that they discussed the benefits of CHP. The commenters reflected that WHP is another potential compliance option and requested it be discussed explicitly as a compliance option that can be used to meet the emission guidelines. The comments discussed WHP benefits but did not elaborate on a preferred accounting method for MWh of electrical generation from WHP that could be used to adjust the CO2
emission rate of an affected EGU.
b.
Measures that may not be used to adjust a CO2emission rate.
This section addresses measures that may not be used to adjust a CO2
emission rate. New, modified, and reconstructed EGUs covered under the CAA section 111(b) final Standards of Performance for Greenhouse Gas Emissions from New Stationary Sources: Electric Utility Generating Units rule are not approvable sources of electric generation for adjusting the CO2
emission rate of an affected EGU under a rate-based state plan. As discussed earlier in section VII.D of this preamble, a key concern under this rule is leakage to new units that are not covered by the emission guidelines. Emissions leakage, or increased CO2
emissions due to increased utilization of unaffected sources, is contradictory to objectives of this rule and should, therefore, be minimized. Allowing affected EGUs to adjust their emission rates as a result of lower-emitting new NGCC units not covered under this section 111(d) rule would not mitigate leakage concerns, and could even exacerbate the situation. Consequently, new EGUs covered under the CAA section 111(b) rule are not allowable measures in state plans because the EPA believes it would result in increased emission leakage.
The EPA received comments both supporting and opposing the use of new NGCC units in state plans. In addition to leakage concerns, commenters expressed concern with the potential incentives created by including new NGCC capacity in the BSER or as a compliance mechanism in state plans. Some commenters suggested that including new NGCC capacity in the BSER or for compliance would distort market incentives to build new NGCC units, particularly if new units were allowed to generate ERCs that could be sold to affected EGUs. These commenters suggested that the additional incentive for new NGCC units could make existing NGCC units less competitive. Other commenters suggested that including new NGCC capacity in state plans would promote generation from new CO2
-emitting units at the expense of new zero-emitting units, increasing overall emissions within a state. This effect would be exacerbated if state plans allowed new NGCC units to be treated as “zero-emitting” for purposes of compliance—as suggested by other commenters. In addition, commenters expressed concern that the EPA's inclusion of new NGCC capacity in setting the BSER or in compliance could negatively impact ratepayers over the long-term by sending the wrong signal to industry and resulting in stranded assets if, in the future, carbon emissions become more expensive or the EPA proposes to incorporate sources built under the forthcoming section 111(b) standard into the section 111(d) program. Commenters also expressed concern that including generation from new NGCC units could create unreasonable uncertainty, given limitations on the ability to accurately project new NGCC builds, could create undue pressure on natural gas prices, and could create unfair disparities in the compliance opportunities afforded different states. In light of the emissions leakage concerns, and in consideration of these comments, the EPA is not allowing shifting generation to new NGCC units to be used as a measure for adjusting CO2
emission rates for affected EGUs in rate-based state plans.
In addition, other new and existing non-affected fossil fuel-fired EGUs that are not subject to CAA section 111(b) or 111(d), such as simple cycle combustion turbines, may not be used to adjust the CO2
emission rate of an affected EGU. While generation from such units could substitute for generation from affected EGUs, the EPA has determined that additional incentives for such generation, in the form of an explicit adjustment to the CO2
rate of an affected EGU, are not necessary or warranted. Providing for such an adjustment could create perverse incentives for the construction of new simple cycle combustion turbines that are not subject to the applicability criteria of the final Standards of Performance for Greenhouse Gas Emissions from New Stationary Sources: Electric Utility Generating Units rule. These units could provide only limited adjustment credit, as operation beyond a certain capacity factor threshold would trigger applicability under CAA section 111(b). Further, providing for the ability to generate adjustment credits would provide incentives for construction of less efficient fossil generating capacity than would likely otherwise be constructed (
e.g.,
addition of a simple cycle combustion turbine rather than a NGCC unit). In addition, providing for the ability to generate adjustment credits could create perverse incentives for the continued operation of less efficient existing fossil generating capacity. Such outcomes run counter to the objectives of this final rule.
c.
Measures that reduce CO2emissions outside the electric power sector.
Measures that reduce CO2
emissions outside the electric power sector may not be counted toward meeting a CO2
emission performance level for affected EGUs or a state CO2
goal, under either a rate-based or mass-based approach, because all of the emission reduction measures included in the EPA's determination of the BSER reduce CO2
emissions from affected EGUs. Examples of measures that may not be counted toward meeting a CO2
emission performance level for affected EGUs or a state CO2
goal include GHG offset projects representing emission reductions that occur in the forestry and agriculture sectors,[969]
direct air capture,
( printed page 64904)
and crediting of CO2
emission reductions that occur in the transportation sector as a result of vehicle electrification.
2. Requirements for Rate-Based Emission Trading Approaches
As made clear in the proposal,[970]
all emission standards in a state plan must be quantifiable, verifiable, enforceable, non-duplicative and permanent.[971]
This requirement is applicable to emission standards that include a rate-based emission trading program. The State Plan Considerations TSD for the proposal also explained that in order to ensure a plan is enforceable, a state plan must: identify in its plan the entity or entities responsible for meeting compliance and other enforceable obligations under the plan; include mechanisms for demonstrating compliance with plan requirements or demonstrating that other binding obligations are met; and provide a mechanism(s) for legal action if affected EGUs are not in compliance with plan requirements or if other entities fail to meet enforceable plan obligations. A state plan using a rate-based emission trading approach must therefore include rate-based emission standards for affected EGUs along with related implementation and compliance requirements and mechanisms.[972]
These related requirements include those applicable to rate-based emission standards more broadly: CO2
emission monitoring, reporting, and recordkeeping requirements for affected EGUs, including requirements for monitoring and reporting of useful energy output. By satisfactorily addressing these requirements, state plans including a rate-based emission trading program will be able to meet the statutory requirements of CAA section 111(d) regarding the need for state plans to provide for the implementation and enforcement of emission standards, as well as meet the requirement that each emission standard be quantifiable, verifiable, non-duplicative, permanent, and enforceable with respect to each affected EGU.
The EPA also specifically proposed that for state plans that rely on measures that avoid EGU CO2
emissions, such as RE and demand-side EE measures, the state will also need to include quantification, monitoring, and verification provisions in its plan for these measures. The EPA is finalizing requirements specific to rate-based emission trading programs as requirements the EPA has determined are necessary to assure the integrity of a rate-based approach that includes an emission trading program, and therefore assures a state plan using such an approach appropriately provides for the implementation and enforcement of rate-based emission standards in accordance with CAA section 111(d).[973]
These specific requirements for a rate-based emission trading program include provisions for issuance of ERCs by the state and/or its designated agent; provisions for tracking ERCs, from issuance through submission for compliance; and the administrative process for submission of ERCs by the owner or operator of an affected EGU to the state, in order to adjust its reported CO2
emission rate when demonstrating compliance with a rate-based emission standard.[974]
These requirements must be submitted for inclusion in the federally enforceable plan, per the statutory requirement that states provide for the implementation and enforcement of emission standards. A rate-based trading program would provide for the implementation and enforcement of rate-based emission standards for a state plan that allows its affected EGUs to adjust a rate by the use of an ERC.
The EPA will review a state plan submittal including a rate-based emission trading program to assure that the plan contains the requirements necessary to assure the integrity of a rate-based approach, and therefore provide for the implementation and enforcement of rate-based emission standards. These requirements are discussed in more detail in this section.
The EPA also notes it is proposing model rules for both mass-based and rate-based emission trading programs. State plans that include the finalized model rule for a rate-based emission trading program could be presumptively approvable as meeting the requirements of CAA section 111(d) and these emission guidelines. The EPA would evaluate the approvability of such plans through independent notice and comment rulemaking.
A state may issue ERCs to an affected EGU that performs at a CO2
emission rate below a specified CO2
emission rate, as well as to providers of qualifying measures that provide substitute generation for affected EGUs or avoid the need for generation from affected EGUs. This latter category includes providers of qualifying RE and demand-side EE measures, as well as other types of measures, as discussed in section VIII.K.1.a.[975]
ERCs may be used by an affected EGU to adjust its reported CO2
emission rate when demonstrating compliance with a rate-based emission standard. This adjustment is made by adding MWh to the denominator of an affected EGU's reported CO2
emission rate, in the amount of submitted ERCs, resulting in a lower adjusted rate. To demonstrate compliance with a rate-based emission standard, an affected EGU would report its CO2
lb/MWh emission rate to the state regulatory body, and would also surrender to the state any ERCs it wishes to use to adjust its reported emission rate. The state regulator would then cancel the submitted ERCs. The affected EGU would add the MWh the ERCs represent to the denominator of its reported CO2
lb/MWh emission rate to demonstrate compliance with its emission standard. The state regulator could facilitate its evaluation of the affected EGU's compliance (as well as evaluation by the affected EGU, the EPA, and others) by providing functionality in its tracking system to run such compliance calculations. If the affected EGU's adjusted CO2
emission rate is equal to or lower than its applicable emission rate standard, the affected EGU would be in compliance.
a.
Issuance of ERCs to affected EGUs.
ERCs may be issued to affected EGUs that emit below a specified CO2
emission rate, as discussed below. For issuance of ERCs to affected EGUs, the state plan must specify the accounting method and administrative process for ERC issuance. This includes the
( printed page 64905)
calculation method for determining the number of ERCs to be issued to an affected EGU, based on reported CO2
emissions and MWh energy output, in comparison to a reference CO2
emission rate. The reference rate is a specified CO2
lb/MWh emission rate that an affected EGU's reported CO2
emission rate is compared to, when determining the amount of ERCs that may be issued to an affected EGU.
Following determination of the number of ERCs an affected EGU is eligible to receive, based on an affected EGU's reported CO2
emission rate compared to a specified reference rate, the state regulatory body would issue those ERCs into a tracking system account held by the owner or operator of the affected EGU. Tracking system requirements are addressed below at section VIII.K.2.c.
The accounting method that may be applied in a state plan differs depending on whether a state plan includes a single rate-based emission standard that applies to all affected EGUs (
e.g.,
if a plan is designed to meet a state rate-based CO2
goal) or separate rate-based emission standards that apply to subcategories of affected EGUs, namely fossil fuel-fired electric utility steam generating units and stationary combustion turbines. In both cases, ERCs are issued in MWh, based on the difference between an affected EGU's reported CO2
emission rate (in CO2
lb/MWh) and a specified CO2
lb/MWh emission rate that the reported rate is compared to (referred to as a “reference rate”). The reference rate may be an affected EGU's assigned CO2
emission limit rate or another CO2
emission rate, as described below. Where an affected EGU's reported CO2
emission rate is lower than the specified reference CO2
emission rate, ERCs may be issued.
Where a state plan includes emission standards in the form of a single rate-based emission standard that applies to all affected EGUs, the reference rate is the CO2
emission rate limit for affected EGUs. In this instance, ERCs may be issued based on an affected EGU's reported CO2
emission rate as a proportion of the emission limit rate. For example, if the emission rate limit is 2,000 lb CO2
/MWh and the affected EGU emits at a rate of 1,000 lb CO2
/MWh, 0.5 MWh would be awarded for every MWh generated by the affected EGU. ERCs would be issued to affected EGUs in whole MWh increments. The calculation method is as follows:
ERCs [976]
= reported MWh by affected EGU [977]
× ((CO2
emission rate limit for affected EGUs [978]
—affected EGU reported CO2
emission rate [979]
)/CO2
emission rate limit for affected EGUs)
For the example above, the calculation is as follows:
If the affected EGU in this example generated 1,000,000 MWh, 500,000 ERCs would be issued.
Where a state plan includes separate emission standards for subcategories of affected EGUs, specifically affected fossil fuel-fired electric utility steam generating units and stationary combustion turbines, the reference rate differs for affected fossil fuel-fired electric utility steam generating units and stationary combustion turbines. Additionally, if the state plan applies emission standards for its affected EGUs that are equal to the subcategorized CO2
emission performance rates there is a unique opportunity for the adjustment of an affected EGU's emission rate using ERCs that are generated as a result of building block 2 incremental NGCC unit operation. The EPA is requiring state plans to account for incremental NGCC generation in ERC generation if a state plan applies the subcategorized CO2
emission performance rates to its affected EGUs as emission standards. Additionally, the EPA is requiring that a NGCC unit is not able to use ERCs generated by it or any other NGCC unit's building block 2 incremental generation.
For affected steam generating units, the reference CO2
emission rate is the assigned CO2
emission rate limit for steam generating units, and the following accounting method for generating ERCs applies:
ERCs [980]
= reported MWh × ((steam generating unit CO2
emission rate limit [981]
—steam generating unit reported CO2
emission rate)/steam generating unit CO2
emission rate limit).
For an affected NGCC stationary combustion turbine in a subcategorized rate-based emission trading program, the following equation provides a required accounting method for generating ERCs based on operation with respect to the NGCC unit's emission standard:
ERCs = NGCC unit's reported MWh—((NGCC unit's CO2
emission standard [982]
—NGCC unit's reported CO2
emission rate)/NGCC unit's CO2
emission standard)
According to this equation, ERC issuance is assessed based on the difference between the CO2
emission rate standard for the NGCC unit [983]
and the reported CO2
emission rate of the affected NGCC unit. In other words, affected NGCC stationary combustion turbines earn ERCs for generation when they perform at an emission rate better than the reference rate for stationary combustion turbines, similarly to how affected steam units can earn ERCs.
In a subcategorized rate-based emission trading program, a state must use the incremental operation of an affected NGCC unit quantified for building block 2 to allow a NGCC unit to generate ERCs based on its expected incremental generation.
A state plan that provides for the use of ERCs issued based on incremental affected NGCC generation must provide a required calculation method that allows for issuance of ERCs based on the ability of incremental generation from affected stationary combustion turbines to substitute for generation from affected steam generating units (as represented in building block 2), while also respecting the fact that affected stationary combustion turbines must also meet an assigned CO2
emission rate limit for the entirety of its MWh energy output. This accounting method must reflect the application of the BSER, as described in section V, and the accounting method must not create incentives to rearrange dispatch between existing NGCC units to generate additional ERCs without changing the overall level of NGCC generation.
The EPA will review whether a state's accounting method is approvable per the requirements of the statute and this final rule as part of its overall plan review of the rate-based emission standards and implementing and enforcing measures in the state plan. The EPA notes that the proposed model rule for a rate-based emission trading program includes a proposed accounting method and takes comments on alternatives. The accounting method provided in a final model rule could be a presumptively approvable approach for issuance of ERCs based on the ability of incremental generation from affected stationary combustion turbines to
( printed page 64906)
substitute for generation from affected steam generating units. A state's accounting requirements for generation of ERCs based on incremental affected NGCC generation must maintain consistency with the EPA's application of the BSER when calculating CO2
emission performance rates for affected stationary combustion turbine and steam generating units. In particular, a state's accounting method must maintain consistency of accounting in a state rate-based CO2
emission standard with the EPA's application of building block 2 in calculating CO2
emission performance rates for affected fossil fuel-fired electric utility steam generating units and stationary combustion turbines, which is based on use of incremental generation from affected stationary combustion turbine to replace generation from affected steam generating units.
b.
Issuance of ERCs for RE, demand-side EE, and other measures.
ERCs may be issued for qualifying measures.[984]
For issuance of ERCs for qualifying measures, state plan requirements for ERC issuance must include a two-step process. In the first step of the process, a potential ERC provider submits an eligibility application for a qualifying program or project [985]
to the administering state regulator (or its agent [986]
). The state regulator reviews the application to determine whether, in this example, an EE/RE program or project meets eligibility requirements for the issuance of ERCs.[987]
An eligibility application must include a description of the program or project, a projection of the MWh generation or energy savings anticipated over the life of the program or project, and an EM&V plan that meets state plan requirements. The EM&V plan must describe how MWh of RE generation or energy savings resulting from the program or project will be quantified and verified.[988]
A state, in its emission standard regulations, must include requirements for EM&V plans that are consistent with the requirements in the emission guidelines for EE/RE measures and other eligible measures, as discussed in sections VIII.K.1 and VIII.K.3.
The EPA has determined that state requirements for an eligibility application must include review of the application by an independent verifier, approved by the state as eligible per the requirements of the final emission guidelines to provide such verification, prior to submittal. This requirement builds on the approach used for assessing GHG offset projects, both in international emission trading programs and the GHG emission budget trading programs implemented by California and the RGGI participating states.[989]
An assessment by an independent verifier would be included as a component of an eligibility application.
The EPA has determined that independent verification requirements are necessary to ensure the integrity of state rate-based emission trading programs included in a state plan, given the wide range of eligible measures that may generate ERCs and the broad geographic locations in which those measures may occur. Inclusion of an independent verification component provides technical support for state regulatory bodies to ensure that eligibility applications and M&V reports are thoroughly reviewed prior to issuance of ERCs. Inclusion of an independent verification component is also consistent with similar approaches required by state PUCs for the review of demand-side EE program results and GHG offset provisions included in state GHG emission budget trading programs.
State plans with rate-based emission trading programs must include requirements regarding the qualification status of an independent verifier. An independent verifier is a person (including any company, any corporate parent or subsidiary, any contractors or subcontractors, and the actual person) who has the appropriate technical and other qualifications to provide verification reports. The independent verifier must not have, or have had, any direct or indirect financial or other interest in the subject of its verification report or ERCs that could impact its impartiality in performing verification services. State plans must require that a person be approved by the state as an independent verifier, as defined by this final rule, as eligible to perform the verifications required under the approved state plan. State plans must also include a mechanism to temporarily or permanently revoke the qualification status of an independent verifier, such that it can no longer provide verification services related to an eligibility application or M&V report for at least the duration of the period it does not meet the qualification requirements for independent verifiers in an approved state plan. The EPA's proposed model rate-based emission trading rule contains provisions addressing accreditation and conflicts of interest for independent verifiers. State plans that adopt the finalized model rule could be presumptively approvable with respect to these requirements regarding independent verifiers.
The state's eligibility requirements and application procedures must ensure that only eligible actions may generate ERCs and that documentation is submitted only once for each program or project, and to only one state program.[990]
These provisions will ensure that actions that are eligible for the issuance of ERCs are “non-duplicative.” [991]
The tracking system used to administer a state's rate-based emission trading system must provide transparent, electronic, public access to information about program and project eligibility applications, including EM&V plans, and regulatory approval status.
In the second step of the process, following implementation of the RE/EE program or project (as described in this example) that was approved in step one, the RE/EE provider periodically submits a M&V report to the state regulatory body documenting the results of the
( printed page 64907)
program or project in MWh of electric generation or energy savings.[992]
These results are quantified according to the EM&V plan that was approved as part of step one. These results are verified by an accredited independent verifier, and its verification assessment must be included as part of the M&V report submitted to the state regulatory body. The administering state regulator (or its agent) then reviews the M&V report, and determines the number of ERCs (if any) that should be issued, based on the report. Finally, the state regulatory body (or its agent) issues ERCs to the provider of the approved program or project. These ERCs are issued to the tracking system account held by the program or project provider.
State plan requirements must ensure that only one ERC is issued for each verified MWh. This is addressed through registration in the tracking system of programs and projects that have been qualified for the issuance of ERCs, to ensure that documentation is submitted only once for each RE/EE action, and to only one state program.[993]
The tracking system must provide transparent electronic public access to submitted M&V reports and regulatory approvals related to such reports.[994]
Such reports are the basis for issuance of ERCs.
c.
Tracking system requirements.
State requirements must include provisions to ensure that ERCs issued to any eligible entity are properly tracked from issuance to submission by affected EGUs for compliance (where ERCs are “surrendered” by the owner or operator of an affected EGU and “retired” or “cancelled”), to ensure they are only used once to meet a regulatory obligation. This is addressed through specified requirements for tracking system account holders, ERC issuance, ERC transfers among accounts, compliance true-up for affected EGUs,[995]
and an accompanying tracking system that meets requirements specified in the emission trading program regulations. Each issued ERC must have a unique identifier (
e.g.,
serial number) and the tracking system must provide for traceability of issued ERCs back to the program or project for which they were issued.
The EPA received a number of comments from states and stakeholders about the value of the EPA's support in developing and/or administering tracking systems to support state administration of rate-based emission trading systems. This could include regional systems and/or a national system. The EPA is exploring options for providing such support and is conducting an initial scoping assessment of tracking system support needs and functionality.
d.
Effect of improperly issued ERCs.
Because the goal of this rulemaking is the actual reduction of CO2
emissions, it is fundamental that ERCs represent the MWh of energy generation or savings they purport to represent. To this end, only valid ERCs that actually meet the standards articulated in this rule may be used to satisfy any aspect of compliance by an affected EGU with emission standards. Despite safeguards included in the structure of ERC issuance and tracking systems, such as the review of eligibility applications and M&V reports, and state issuance of ERCs, ERCs may be issued that do not, in fact, represent eligible zero-emission MWh as required in the emission guidelines. A variety of situations may result in such improper ERC issuance, ranging from simple paperwork errors to outright fraud.
An approvable state plan that allows affected EGUs to comply with their emission standards in part through reliance on ERCs must include provisions making clear that an affected EGU may only demonstrate compliance with an ERC that represents the one MWh of actual energy generation or savings that it purports to represent and otherwise meets the emission guidelines.
e.
Banking of ERCs.
ERCs issued in 2022 or a subsequent year may be carried forward (or “banked”) and used for demonstrating compliance in a future year.[996]
For example, an ERC issued for a MWh of RE generation that occurs in 2022 may be applied to adjust a CO2
emission rate in 2023 or future years without limitation. ERCs may be banked from the interim plan performance period to the final plan performance period. Banking provides a number of advantages while ensuring that the same output-weighted average CO2
emission rates of the interim and final state CO2
goals are achieved over the course of a state plan. Banking provisions have been used extensively in rate-based environmental programs and mass-based emission budget trading programs.[997]
This is because banking reduces the cost of attaining the requirements of the regulation. The EPA has determined that the same rationale and outcomes apply under a CO2
emission rate approach, in that allowing banking will reduce compliance costs. Banking encourages additional emission reductions in the near-term if economic to meet a long-term emission rate constraint, which is beneficial due to social preferences for environmental improvements sooner rather than later.[998]
State plans must specify whether the state is allowing or restricting the banking of ERCs between compliance periods for affected EGUs. State plans must also prohibit borrowing of any ERCs from future compliance periods by affected EGUs or eligible resources.
f.
Considerations for ERC issuance.
The EPA notes that state-administered and state-overseen EE programs, such as those administered by state-regulated electric distribution utilities, could play a key role in supplying energy savings to a rate-based emission trading system in the form of ERCs. These programs have been the primary means for delivering EE programs and energy savings at scale, and also allow for a state to conduct a portfolio planning process to guide EE program design and focus in a manner that best provides multiple benefits to electricity ratepayers in a state. Such portfolio planning processes typically treat EE as an energy resource comparable to electricity generation.
( printed page 64908)
The EPA also notes that non-ERC certificates may be issued by states and other bodies for MWh of energy generation and energy savings that are used to meet other state regulatory requirements, such as state RPS and EERS, or by individuals to make environmental or other claims in voluntary markets.
The EPA defines an ERC in the emission guidelines as a tradable compliance instrument that represents a zero-emission MWh (for the purposes of meeting the emission guidelines) from a qualifying measure that may be used to adjust the reported CO2
emission rate of an affected EGU subject to a rate-based emission standard in an approved state plan under CAA section 111(d). The sole purpose of an ERC is for use by an affected EGU in demonstrating compliance with a rate-based emission standard in such an approved state plan.
An ERC is issued separately from any other instruments that may be issued for a MWh of energy generation or energy savings from a qualifying measure. Such other instruments may be issued for use in meeting other regulatory requirements (
e.g.,
such as state RPS and EERS requirements) or for use in voluntary markets. An ERC may be issued based on the same data and verification requirements used by existing REC and EEC tracking systems for issuance of RECs and EECs.
The EPA notes that the definitions of other instruments, such as RECs, differ (as established under state statute, regulations, and PUC orders) and that requirements under state regulatory programs that use such instruments, such as state RPS, also differ. As a result, states may want to assess, when developing their state plan, how such existing instruments may interact with ERCs. For example, a state may want to assess how issuance of ERCs pursuant to a state plan may interact with compliance with a state RPS by entities affected under relevant state RPS regulations or PUC orders. The interaction of other instruments and ERCs may also impact existing or future arrangements in the private marketplace. Actions taken by states, separate from the design of their state plan, could address a number of these potential interactions. For example, state RPS regulations that specify a REC for a MWh of RE generation, and the attributes related to that MWh, may or may not explicitly or implicitly recognize that the holder of the REC is also entitled to the issuance of an ERC for a MWh of electricity generation from the eligible RE resource. This could impact existing and future RE power purchase agreements or REC purchase agreements. Such interactions among existing instruments and ERCs could also impact how marketing claims are made in the voluntary RE market. How a state might choose to address these potential interactions will depend on a number of factors, including the utility regulatory structure in the state, existing statutory and regulatory requirements for state RPS, and existing RE power purchase agreements and REC contracts.
g.
Program review.
The EPA is requiring that states periodically review the administration of their rate-based emission trading programs. The results of these program reviews must be submitted by states to the EPA as part of their required reports on the implementation of their state plans, as described in sections VIII.D.a.(5) and VIII.D.2.b.(4), and must be made publicly available. Such a review submitted as part of a required state report provides for the implementation of rate-based emission standards per the requirements of CAA section 111(d)(2). For a rate-based emission trading program, the review must cover the reporting period addressed in the state's periodic reports to the EPA on plan implementation.
The program review must address all aspects of the administration of a state's rate-based emission trading program, including the state's evaluations and regulatory decisions regarding eligibility applications for ERC resources and M&V reports (and associated EM&V activities), and the state's issuance of ERCs. The program review must assess whether the program is being administered properly in accordance with the state's approved plan; whether ERC eligibility applications and M&V reports are being properly evaluated and acted upon (
i.e.,
approved or disapproved); whether reported annual MWh of generation and savings from qualified ERC resources are being properly quantified, verified, and reported in accordance with approved EM&V plans, and whether appropriate records are being maintained. The program review must also address determination of the eligibility of verifiers by the state and the conduct of verifiers, including the quality of verifier reviews. Where significant deficiencies are identified by the state's program review, those deficiencies must be rectified by the state in a timely manner.
States must collect, compile, and maintain sufficient data in an appropriate format to support the periodic program review. The EPA will review the results of each program review. The EPA may also audit a state's administration of its rate-based emission trading program and pursue appropriate remedies where significant deficiencies are identified.
3. EM&V Requirements for RE, Demand-Side EE, and Other Measures Used To Adjust a CO2
Rate
This section discusses EM&V for RE, demand-side EE, and other measures that are used to generate ERCs or otherwise adjust an emission rate.[999]
EM&V is applied for purposes of quantifying and verifying MWh in rate-based state plans, as described below. Rate-based state plans must require that eligible resources document in EM&V plans and M&V reports how all MWh saved and generated from eligible measures will be quantified and verified. Additionally, with respect to EM&V, the EPA's proposed model rule identifies certain industry best practices that, upon finalization, could be adopted as presumptively approvable components of a state plan.[1000]
As discussed in section VIII.K.1, quantified and verified MWh of RE generation, EE savings,[1001]
and other eligible measures may be used to adjust a CO2
emission rate when demonstrating compliance with the emission guidelines. In states implementing emission standard type plans with rate-based trading, affected EGUs adjust their reported emission rate using ERCs, which represent MWh that are quantified and verified according to the EM&V requirements described in this section. The EPA will evaluate the overall approvability of the state plan taking into consideration whether the state's submitted EM&V requirements satisfy these final emission guidelines.
a.
Discussion of proposed EM&V approach and public comment.
The EPA proposed that a state plan that incorporates RE and demand-side
( printed page 64909)
EE measures must include an EM&V plan that explains how the effect of these measures will be determined in the course of plan implementation. The proposal sought comment on the suitability of current state and utility EM&V approaches for RE and demand-side EE programs in the context of an approvable state plan, and on whether harmonization of state approaches, or supplemental actions and procedures, should be required in an approvable state plan, provided that supporting EM&V documentation meets applicable minimum requirements. In the proposal, the EPA also indicated that it would issue guidance to help states, sources, and project providers quantify and verify MWh savings and generation resulting from zero-emitting RE and demand-side EE efforts.
The proposal and associated “State Plans Considerations” TSD [1002]
suggested that the EPA's EM&V requirements could leverage existing industry practices, protocols, and tracking mechanisms currently utilized by the majority of states implementing RE and demand-side EE. The EPA further noted that many state regulatory bodies and other entities already have significant EM&V infrastructure in place and have been applying, refining, and enhancing their evaluation and quality assurance approaches for over 30 years, particularly with regard to the quantification and verification of energy savings resulting from utility-administered EE programs. The proposal also observed that the majority of RE generation is typically quantified and verified using readily available, reliable, and transparent methods such as direct metering of MWh.
As a result, the agency took comment on whether this infrastructure is appropriate in the context of approvable state plans for use in rate-based state plans that include RE, demand-side EE, and other measures. The majority of commenters addressing this question responded affirmatively, indicating that existing EM&V infrastructure is appropriate to assure quality, credibility, and integrity. However, commenters also noted that EM&V methods are routinely improving and changing over time, and that the EPA's requirements and guidance should be responsive to such changes, should avoid locking in outdated methods, and should be updated to maintain relevance.
Another point made by commenters is that, despite the observed improvements in EM&V over time, quantification knowledge is more robust for some EE program and policy types than for others. Additionally, there is relatively limited experience applying EM&V protocols and procedures to emission trading programs, where each MWh of replaced generation can be bought and sold by a regulated source. As a result, the EPA's final emission guidelines and proposed model rule include a number of safeguards and quality-control features that are intended to ensure the accuracy and reliability of quantified EE savings.
b.
Requirements for EM&V and M&V submittals.
As discussed in section VIII.K.2, these final guidelines require that state plans include a requirement that EM&V plans and M&V reports be submitted to the state for rate-based emission trading programs. States must require that at the initiation of an eligible measure, project providers must develop and submit to the state an EM&V plan that documents how requirements for quantification and verification will be carried out over the period that MWh generation or savings are produced. States must also require that after a project or program is implemented, the provider must submit periodic M&V reports to confirm and describe how each of the requirements was applied. These reports must also specify the actual MWh savings or generation results, as quantified by applying EM&V methods on a retrospective (ex-post) basis. States may not allow MWh values that are quantified using ex-ante (pre-implementation) estimates of savings. As previously described, the EPA took comment on the suitability of current state and utility EM&V approaches for RE and demand-side EE programs in the context of an approvable state plan. These final requirements regarding EM&V plans and M&V reports are intended to leverage and closely resemble those already in routine use.
For energy generating resources, including RE resources, states may leverage the programs and infrastructure they have in place for achievement of their RPS and take advantage of registries in place for the issuance and tracking of RECs. Many existing REC tracking systems already include well-established safeguards, documentation requirements, and procedures for registry operations that could be adapted to serve similar functions in relation to the final emission guidelines. For example, a key element of RPS compliance in many states that parallels the final rule's requirements is that each generating unit must be uniquely identified and recorded in a specified registry to avoid the double counting of credits at the time of issuance and retirement. In addition, the existing reports and documentation from tracking systems may, together with eligible independent third party verification reports, serve as the substantive basis for eligibility applications, EM&V plans and M&V reports for the issuance of ERCs to energy generating resources for affected EGUs to meet their obligations under the final rule. With respect to actual monitoring requirements, many existing REC registries include provisions for the monitoring of MWh of generation that would be appropriate to meet state plan requirements pursuant to the final rule, such as requirements to use a revenue quality meter.
For demand-side EE, states must require that EM&V plans that are developed for purposes of adjusting an emission rate under this final rule include several specific components. The EPA notes these components reflect existing provisions in a wide range of publicly or rate-payer funded EE programs and energy service company projects. One of these components state plans must require is a demonstration of how savings will be quantified and verified by applying industry best-practice protocols and guidelines, as well as an explanation of the key assumptions and data sources used. State plans must require EM&V plans to include and address the following:
A baseline that represents what would have happened in the absence of the EE intervention, such as the equipment that would most likely have been installed—or that a typical consumer or building owner would have continued using—in a given circumstance at the time of EE implementation
The effects of changes in independent factors affecting energy consumption and savings; that is, factors not directly related to the EE action, such as weather, occupancy, or production levels
The length of time the EE action is anticipated to continue to remain in place and operable, effectively providing savings (in years)
Examples and discussion of industry best-practices for executing each of the above-listed components is provided in the EPA's draft EM&V guidance for demand-side EE, which is being released in conjunction with the proposed model rule. The model trading rule defines certain EM&V provisions for demand-side EE, as well as specific provisions for non-affected CHP and RE resources, including incremental hydroelectric power, biomass RE facilities, and waste-to-energy facilities,
( printed page 64910)
that may be presumptively approvable upon finalization.
The EPA notes that state plans incorporating the finalized model rule for rate-based emission trading programs could be presumptively approvable as meeting the requirements of CAA section 111(d) and the EM&V provisions in these emission guidelines. The EPA will evaluate the approvability of such state plans through independent notice and comment rulemaking.
c.
Skill certification standards.
Using a skilled workforce to implement demand-side EE and RE projects and other measures intended to reduce CO2
emissions, and to evaluate, measure, quantify and verify the savings associated with EE projects or the additional generation from performance improvements at existing RE projects are both important in existing best industry practices. Several commenters pointed out that skill certification standards can help to assure quality and credibility of demand-side EE, RE, and other CO2
emission reduction projects. The EPA also recognizes that a skilled workforce performing the EM&V is important to substantiate the authenticity of emissions reductions.
The EPA is therefore recommending in conjunction with the EM&V requirements discussed in this section, that states are encouraged to include in their plans a description of how states will ensure that the skills of workers installing demand-side EE and RE projects or other measures intended to reduce CO2
emissions as well as the skills of workers who perform the EM&V of demand-side EE and RE performance will be certified by a third party entity that:
(1) Develops a competency based program aligned with a job task analysis and certification scheme;
(2) Engages with subject matter experts in the development of the job task analysis and certification schemes that represent appropriate qualifications, categories of the jobs, and levels of experience;
(3) Has clearly documented the process used to develop the job task analysis and certification schemes, covering such elements as the job description, knowledge, skills, and abilities;
(4) Has pursued third-party accreditation aligned with consensus-based standards, for example ISO/IEC 17024.
Examples of such entities include: Parties aligned with the Department of Energy's (DOE) Better Building Workforce Guidelines and validated by a third party accrediting body recognized by DOE; or by an apprenticeship program that is registered with the federal Department of Labor (DOL), Office of Apprenticeship; or with a state apprenticeship program approved by the DOL, or by another skill certification validated by a third party accrediting body. This can help to substantiate the authenticity of emission reductions due to demand-side EE and RE and other CO2
emission reduction measures.
Individual rate-based state plans may provide for the interstate transfer of ERCs, which would enable an ERC issued by one state to be used for compliance by an affected EGU with a rate-based emission standard in another state. Such plans would include regulatory provisions in each state's emission standard requirements that indicate that ERCs issued in other partner states may be used by affected EGUs for compliance. Such plans must indicate how ERCs will be tracked from issuance through use for compliance, through either a joint tracking system, interoperable tracking systems, or an EPA-administered tracking system.[1003]
The approaches described in this section are only allowed for states that impose rate-based emission limits for affected EGUs that are equal to the CO2
emission performance levels in the emission guidelines. This approach is necessary to ensure that each state that is allowing for the interstate transfer of ERCs is implementing rate-based emission standards for affected EGUs at the same lb CO2
/MWh level.[1004]
This assures that all the participating states are issuing ERCs to affected fossil steam and NGCC units that emit below their assigned emission standards on the same basis.
This approach avoids providing different incentives, in the form of issued ERCs, to affected steam generating units and NGCC units in different states that have comparable CO2
emission rates. Providing different incentives to similar affected EGUs across states could create distortionary effects that lead to shifts in generation among states based on the different CO2
emission rate standards applied by states to similar types of affected EGUs. Providing for the interstate trading of ERCs in this instance would exacerbate these distortionary effects by providing arbitrage opportunities.
When demonstrating that a state's CO2
emission goal is achieved as a result of plan implementation, a state with linkages to other states would be required to demonstrate that any ERCs issued by another state that are used by affected EGUs in the state for compliance with its rate-based CO2
emission standards were issued by states with an EPA-approved state plan.[1005]
States could implement these linkages among state plans with rate-based emission trading systems through three different implementation approaches: (1) Plans that are “ready-for-interstate-trading;” (2) plans that include specified bilateral or multilateral linkages; and (3) plans that provide for joint ERC issuance among states with materially consistent regulations. These approaches are summarized below:
Ready-for-interstate-trading plans:
A state plan recognizes ERCs issued by any state with an EPA-approved plan that also uses a specified EPA-approved [1006]
or EPA-administered tracking system. Plans are approved individually. A state plan need not designate the individual states by name from which it would accept issued ERCs. States can join such a coordinated approach over time, without the need for plan revisions.[1007]
Specified bilateral linkage:
States recognize ERCs issued by named partner states. Partner states must demonstrate that they use a shared tracking system, interoperable tracking systems, or an EPA-administered tracking system. Plans are approved individually, including review of the shared tracking system or interoperable tracking systems.
Joint ERC issuance:
States implement materially consistent rate-based emission
( printed page 64911)
trading program regulations and share a tracking system. States coordinate their review of submissions for ERC issuance [1008]
and their issuance of ERCs to the shared tracking system. Issued ERCs are recognized as usable for compliance in all states using the shared tracking system. Plans are approved individually, including review of the shared tracking system.
These implementation approaches are designed to streamline the process for linking emission trading programs, avoid or limit the need for plan revisions as new states join a collaborative emission trading approach, and facilitate the development of regional or broader multi-state markets for ERCs.[1009]
L. Treatment of Interstate Effects
This section discusses how differing characteristics across states and sources could create risks of increased emissions under this rule through double counting of emission reduction measures or through foregone emission reductions due to movement of generation from source to source. The section also discusses how the final rule addresses these concerns: First, through the characteristics of goal-setting and the framework of state plans, and second, through specific requirements intended to minimize the risk of double counting and increased emissions.[1010]
The section is structured as follows. First, this section discusses the dynamics that cause these risks to potentially arise. Second, it provides a discussion of how the risks of double counting and foregone reductions are minimized through the following provisions: The nature of the final emission performance rates, multi-state plan options that limit distortionary effects, the structure of mass-based plan and rate-based plan accounting for emission reductions measures, and specified restrictions on the counting in a rate-based plan of emission reduction measures located in a mass-based state. Finally, the section discusses how the rate-based accounting framework minimizes incentives to develop emission reduction measures in particular states due to differences in rates.
In the June 2014 proposal, the EPA acknowledged that emission reduction measures implemented under a state plan will likely have impacts across many affected sources both within and across state boundaries due to the dynamic and interstate nature of the electric grid. These interactions may be driven in part due to differences in power sector dynamics across states, including the types of affected EGUs in a state, the availability of eligible zero-emitting resources, and the costs of different compliance options and existing policies in states. These state-level characteristics play out across dynamic regional grids that provide electricity across states. EGUs are dispatched both within and across state borders and are constantly adjusting behavior in response to available generation and electricity demand on the regional grid. Whenever CO2
emission reduction measures, such as RE or demand-side EE, are implemented, the measure can affect EGU generation and CO2
emissions across the regional grid. These impacts can change across multiple affected EGUs on a minute-to-minute, hour-to-hour, and day-to-day basis as electricity demand changes and different generating resources are dispatched. These impacts will also change in the long-term, as the generating fleet and load behavior change over a period of years. Interactions among EGUs across states may be further driven by the plan types (
i.e.,
rate-based or mass-based) and the individual characteristics of the plans that states choose to adopt.
In the context of this complex environment of federal and state policies and interstate grids, commenters expressed concern about the risk of double-counting of measure impacts, particularly across state plans. Commenters stated that there is potential for distortionary incentives that could undermine overall CO2
emission reductions (often termed emissions “leakage”). Commenters requested that the EPA ensure that states avoid double-counting and minimize leakage effects when demonstrating achievement of state goals.
The EPA acknowledges that some amount of shifts in generation between sources within and across state borders will inevitably be present and unavoidable in the context of this rule and may affect how affected EGUs achieve the applicable CO2
performance rates or state goals under a state plan. In fact, the definition of the BSER is premised upon shifts in generation across sources, particularly shifts from higher- to lower-emitting units that result in overall emission reductions. However, in the context of these shifts, the extent to which the movement of generation may be driven not by the potential to capture lower-cost emission reduction but by arbitrage across different emission rates, causing inefficiencies in the power markets and possibly eroding overall emission reductions, should be minimized.
In particular, the EPA has determined final emission performance rates that serve to reduce relative differences between state goals, and thus also focus the potential for generation shifting between affected EGUs on achieving the emission reductions quantified in the BSER. In the proposal, goals differed more substantially between states based upon an assessment of what emission reduction potential units could access located within their state. Commenters observed that due to the interconnected nature of the power sector, units are not limited to such emission reduction measures within their state, and indeed any operational decisions that units take necessarily influence operational decisions at other units throughout the interconnected grid. As a result, in the final rule, we are finalizing CO2
emission performance rates, informed by regional emission reduction potential, for fossil fuel-fired electric utility steam generating units and stationary combustion turbines that are applied consistently across all affected EGUs. As the same source category-specific performance rates are applied to all units in the contiguous U.S. regardless of the state in which they are located, any differences between state goals in this final rule stem only from the relative prevalence in each state of fossil fuel-fired electric utility steam generating units and stationary combustion turbines. Consequently, there is substantially less incentive in this final rule for units to shift generation across state lines based solely on differences in state goals, since there is substantially less difference between the final rule's state goals, and since those state goals are themselves premised on nationally consistent
( printed page 64912)
source category-specific performance rates.
The EPA has also incorporated elements into the rule that seek to minimize double-counting and the distortionary effects that could potentially increase emissions. First, states have the option to adopt multi-state plans that reflect regional interactions while eliminating chances for double counting and providing a level playing field for trading of rate-based ERCs or mass-based allowances. Second, in the method for rate-based plan compliance, the rule provides a general accounting approach for adjusting an affected EGU's or state's CO2
rate that inherently acts to minimize state differences. These points are further discussed below.
For both rate-based and mass-based approaches, the rule provides states with the option of creating either “ready-for-interstate-trading” plans or multi-state plans. These options for states working together provide opportunities to enable protections against double counting and minimize the presence of distortionary effects.
“Ready-for-interstate-trading” and multi-state plans engage multiple states in the same system for the purpose of trading mass-based allowances or issuing and trading rate-based ERCs. This allows for efficient implementation of protections against double counting provided in state plan requirements, as multiple states are participating in the same tracking systems. This is particularly useful in the context of rate-based ERC issuance and tracking, where it must be ensured that the ERCs being generated are unique across rate-based plans.
This final rule also reduces distortionary effects within the context of multi-state plans. It does so by restricting states to interstate trading with equivalently denominated mass-based allowances or rate-based ERCs. In a mass-based context, all affected EGUs will trade uniform mass-based allowances, whether in a “ready-for-interstate-trading” plan or multi-state plan. In a rate-based plan context, “ready-for-interstate-trading” states must all adopt as their goal the CO2
emission performance rates as their joint goal. This assures that all the participating states are issuing ERCs using the same subcategorized performance rates, and that the sources in each state have equivalent incentives for trading ERCs. Similarly, under multi-state plans, the relevant states must choose to adopt identical rates, either the CO2
emission performance rates or a weighted average goal rate based on the rate-based goals of all the states involved. These requirements along with a method for calculating a weighted average goal rate are specified in section VIII.C.5.
Under all types of state plans, states must ensure that the emission reduction measures counted as part of meeting their plan requirements are not duplicative of any measures that are counted by another state, in order to avoid double counting of the MWhs of generation or energy savings that these measure produce. Depending on the accounting method used to reflect these measures in state goals, interstate effects could still allow for the double counting of the emission reductions resulting from these measures, particularly if mathematical adjustments were made to stack emissions to reflect these reductions. Depending on how these measures are accounted for, the reductions could be counted by both the state that deployed the measure, and the state that reports a reduction in fossil generation or reported emissions. In this final rule, the accounting approaches for both mass-based and rate-based plans have been specifically designed to eliminate the risk of double counting of reductions, because emission reduction measures are accounted for only through their inherent impact on stack emissions for affected EGUs.
Mass-based plans rely exclusively on reported stack emissions for determining whether a mass-based CO2
emission goal is achieved. This means that under a mass-based plan any emission reduction measures that are implemented are automatically accounted for in reduced stack emissions of CO2
from affected EGUs, which avoids concerns about counting the same mass reductions in two different mass-based states.
In a rate-based plan, there needs to be an explicit adjustment of reported CO2
emission rates from affected EGUs, to reflect the measures that substitute low- or zero-emitting generation or energy savings for affected EGU generation. States with rate-based plans must demonstrate that measures used to adjust their CO2
emission rate, such as RE and demand-side EE, are non-duplicative. The proposal attempted to address this issue in part by limiting demand-side EE that states could claim to in-state measures. In fact, those in-state measures still have an impact outside of the state and under the proposal's approach, states would have been restricted from taking credit for all the measures they have put in place that reduce CO2
emissions. Therefore, the EPA is finalizing a treatment that allows states to count all in-state and out-of-state measures, while addressing interstate effects through the structure of the rule's accounting approach for adjusting the CO2
emission rate of an affected EGU, detailed in section VIII.K.1 above, used to show that the state has met its obligation under its state plan.
The general accounting approach for adjusting the CO2
emission rate of an affected EGU inherently accounts for the regional nature of how substitute generation and energy savings will impact affected EGU generation and CO2
emissions. The following discussions refer to the substituting generation and energy savings in question as RE and demand-side EE, but this method can apply to other measures that were not included in the determination of the BSER that substitute for affected EGU generation. The adjusted CO2
emission rate gives credit to the affected EGU or state for the MWhs of RE and demand-side EE it is responsible for deploying, by allowing those MWhs to be added to the denominator of the CO2
rate, but makes no adjustment to the numerator. Instead, the numerator reflects reported stack emissions, which will reflect the extent to which RE and demand-side EE reduced the affected EGU's generation and emissions, without needing to account for the state in which the RE or demand-side EE originated, or approximating exactly how it impacted the regional grid. Double-counting of CO2
emission reductions is prevented because the reported emissions from each unit are represented in the numerator of each of those units' emission rates, and those real emissions capture whatever emission reduction impact occurred with regard to any particular MWh of RE or demand-side EE. Because the general accounting approach disallows any adjustment to any EGU's reported emissions, it is not possible for the real emission reductions prompted by any particular measure to be double-counted.
Double-counting of MWhs in the denominator can be avoided because it is relatively straightforward to quantify the MWhs that the affected EGU is responsible for deploying and add them to the denominator, and this method aligns well with the MWh-denominated trading system described in this final rule. As long as it is assured that the MWhs of RE and demand-side EE are only being claimed by one affected EGU or state, as is outlined in section VIII.K, then there is no double-counting of MWh. Therefore, the accounting method avoids double counting of both CO2
emission reductions and MWhs, the two characteristics of RE and demand-side EE measures that affect CO2
emission rates. For further discussion of the
( printed page 64913)
MWh-based accounting method, including a calculation example, see section VIII.K.1.
There may also be interactions between mass-based and rate-based plans regarding counting measures, specifically where measures that provide substitute or avoided generation, such as RE and demand-side EE, are located in a mass-based state and can also be used by a rate-based state in meeting the CO2
performance rates or state goals. The EPA received comments on this particular issue, and many expressed concerns that this use of mass-based resources in a rate-based state would result in double-counting of emission reductions.
Commenters provided analyses specifying how two states can benefit from the same RE and demand-side EE measures as a result of rate- and mass-based plan interactions. Some commenters considered this double-counting of emission reductions, and requested specific mathematical adjustments of reported generation or CO2
emissions from affected EGUs under either rate-based or mass-based state plans in order to eliminate double-counting.
The EPA has determined that, in the context of interactions among rate-based and mass-based plans, there is not explicit double-counting of the CO2
emission reductions associated with counting measures located in mass-based states, considering the accounting methods outlined in this final rule. First, as discussed above, the accounting method for adjusting the CO2
emission rate only counts the MWhs generated by a measure to adjust the MWh in the denominator of the reported CO2
emission rate. The CO2
emissions impacts of the measures will be reflected in the rate-based state only to the extent that the MWhs resulted in lower reported CO2
emissions from an affected EGU in the rate-based state. To the extent that measures that provide substitute or avoided generation reduce generation from affected EGUs in a mass-based state, the effect of those measures is reflected in lower reported CO2
emissions of the mass-based EGUs. The CO2
emission reductions reflected in the rate and the mass state will necessarily be mutually exclusive, because both are based on reported stack emissions. Additionally, the mechanism in the mass-based state that is assuring CO2
emission reductions is the mass budget, which is met by affected EGUs adjusting their generation. Low- or zero-emitting MWhs from resources like RE and demand-side EE can serve load in the mass-based state and play a role in lowering compliance costs, but they play no direct role in mass-based compliance. As a result, no double-counting of emission reductions can take place.
Though there is no risk of double-counting emissions, some commenters expressed the concern that overall CO2
emissions reductions would be foregone in situations where a source in a rate-based state counts the MWh from measures in a mass-based state, but the generation from that measure acts solely to serve load in the mass-based state. In that scenario, expected CO2
emission reduction actions in the rate-based state are foregone as a result of counting MWh that resulted in CO2
emission reductions in a mass-based state. Therefore the EPA is restricting the ability of rate-based states to claim emission reduction measures, such as RE and demand-side EE, located in mass-based states.
While the EPA understands this concern regarding foregone reductions, we do not believe it is appropriate to restrict RE crediting unilaterally between rate-based and mass-based states. Such a restriction could cut some states off from regional RE supplies that are assumed in the BSER building block 3 and incorporated in the CO2
emission performance rates and state CO2
goals. Allowing crediting between rate- and mass-based states, as long as the risk of foregone CO2
emission reduction actions in rate-based states are minimized, will assure a supply of eligible RE MWhs that will further enable affected EGUs and states to meet obligations under the final rule. Therefore, the EPA has determined that it is appropriate for rate-based states to count MWhs from RE located in mass-based states, subject to the condition that the generation in question was intended to meet electricity load in a state with a rate-based plan.[1011]
This may apply to some or all of the generation from an individual RE installation. To assure that the RE generation in question meets this condition, the EPA is requiring that RE generation from RE installations located in a mass-based state can only be counted in a rate-based state if the electricity generated is delivered with the intention to meet load in a state with a rate-based plan, and was treated as a generation resource used to serve regional load that included the rate-based state. This can be demonstrated through, for example, the provision of a power delivery contract or power purchase agreement in which an entity in the rate-based state contracts for the supply of the MWhs in question. The EPA is providing flexibility to states regarding the nature of the required demonstration, though the state must specify eligible demonstrations for approval in state plans. Under an emission standards plan, this demonstration would be made by the provider of the measure seeking ERC issuance to the rate-based state.
The following are examples of how requirements for a demonstration could be established in state plans and used to allow RE in a mass-based state to be counted in a rate-based state. For an emission standards state plan, a state could specify in the regulations for the rate-based emission standards included in its state plan that it will require an RE provider that seeks the issuance of ERCs to show that load-serving entities in the rate-based state have contracted for the delivery of the RE generation that occurs in a mass-based state to meet load in a rate-based state. Under this approach, an RE provider in a mass-based state could submit as part of an eligibility application a delivery contract or power purchase agreement showing that the generation was procured by the utility, and was treated as a generation resource used to serve regional load that included the rate-based state. This documentation would be sufficient demonstration to allow the RE generating resource to meet this additional geographic eligibility requirement for the amount of generation in question. All quantified and verified RE MWhs submitted for ERC issuance would need to be associated with that power purchase contract or agreement, and this fact would need to be demonstrated in the M&V reports submitted for issuance of ERCs.
The ability for a rate-based state to count MWhs located in a mass-based state under the above conditions is limited to RE. Rate-based states are not allowed to claim demand-side EE or any other emission reduction measures that were not included in the determination of the BSER located in mass-based states for ERC issuance. While this limits rate-based sources' access to additional resources, providing that access would result in a risk of foregone reductions. Further, unlike RE, there is no obligation related to demand-side EE and other measures that were not included in the determination of the BSER incorporated in the CO2
emission performance rates or state rate-based goals which would necessitate facilitating access to those resources. This treatment also does not apply to
( printed page 64914)
fossil-fuel fired EGUs, such as NGCC units. If a mass-based emission standard has been applied to an affected EGU, there is no valid way to calculate whether it has MWh that are eligible for crediting, as is possible under a rate-based plan.
Finally, as stated earlier, commenters also expressed concern about the potential for relative increases in emissions to occur given relative differences between sources and states. These differences could include states' goals under either the rate- or mass-based approaches, or states' accounting of new sources. These differences could induce increased generation in one state over another because the costs of compliance and relative costs of generation would vary between states. There was particular concern regarding how these differences would provide incentives for increasing generation at new fossil sources and expanding utilization of existing affected EGU generation in states that have less stringent goals, and that this movement of generation would result in increased emissions overall. This could potentially result in the achievement of performance rates but with fewer overall CO2
emissions reductions than projected nationally under the proposal.
Commenters suggested that the issuance and trading of emission credits across states under a rate-based approach would result in incentives to create credits, through the development of RE for example, in certain states with higher state goals, and this could also be a source of increased overall emissions. They noted that RE siting would thus not occur in the most optimal locations. The commenters assumed that zero-emitting credits are denominated in mass units by multiplying the number of MWh by some emission rate: Either the state goal rate, the current state emission rate, a regional emission rate, or a calculated marginal rate. If those rates were higher in any states, zero-emitting MWhs would create more mass-denominated credits in those states, and thus RE and demand-side EE would be more valuable.
The incentive to target the location of zero-emitting generation or energy savings between states based on variation in its emission reduction value has been minimized by the fact that states participating in rate-based interstate trading must adopt the same emission performance rates or rate-based state goals. It is further minimized, even outside of an interstate trading framework, by the nature of the accounting method finalized in this rule. As explained above regarding the general accounting approach and the trading framework, we are adjusting rates using calculated MWhs, not based upon an emission reduction approximation as commenters outlined above. Not only does the method allow emission reductions to be accounted for as they occur across the grid, but it means the ERCs being traded across states represent one MWh of zero-emitting generation in whatever state it originated, and its value is unaffected by any emission rate associated with its state of origin. Thus, the finalized accounting and trading methods minimize the relative incentives for generating zero-emitting ERCs in a particular state based upon the rates that apply to that state.
IX. Community and Environmental Justice Considerations
In this section we provide an overview of the actions that the agency is taking to help ensure that vulnerable communities are not disproportionately impacted by this rulemaking.[1012]
As described in the Executive Summary, climate change is an environmental justice issue. Low-income communities and communities of color already overburdened with pollution are likely to be disproportionately affected by, and less resilient to, the impacts of climate change. This rulemaking will provide broad benefit to communities across the nation, as its purpose is to reduce GHGs, the most significant driver of climate change. While addressing climate change will provide broad benefits, it is particularly beneficial to low-income populations and some communities of color (in particular, populations defined jointly by ethnic/racial characteristics and geographic location) where people are most vulnerable to the impacts of climate change (a more robust discussion of the impacts of climate change on vulnerable communities is provided in the Executive Order 12898 section XII.J of this preamble). While climate change is a global phenomenon, the adverse effects of climate change can be very localized, as impacts such as storms, flooding, droughts, and the like are experienced in individual communities.
Vulnerable communities also often receive more than their fair share of conventional air pollution, with the attendant adverse health impacts. The changes in electricity generation that will result from this rule will further benefit communities by reducing existing air pollution that directly contributes to adverse localized health effects. These air quality improvements will be achieved through this rule because the electric generating units that emit the most GHGs also have the highest emissions of conventional pollutants, such as SO2, NOX
, fine particles, and HAP. These pollutants are known to contribute to adverse health outcomes, including the development of heart or lung diseases, such as asthma and bronchitis, increased susceptibility to respiratory and cardiac symptoms, greater numbers of emergency room visits and hospital admissions, and premature deaths.[1013]
The EPA expects that the reductions in utilization of higher-emitting units likely to occur during the implementation of state plans will produce significant reductions in emissions of conventional pollutants, particularly in those communities already overburdened by pollution, which are often low-income communities, communities of color, and indigenous communities. These reductions will have beneficial effects on air quality and public health both locally and regionally. Further, this rulemaking complements other actions already taken by the EPA to reduce conventional pollutant emissions and improve health outcomes for overburdened communities.
By reducing millions of tons of CO2
emissions that are contributing to global GHG levels and providing strong leadership to encourage meaningful reductions by countries across the globe, this rule is a significant step to address health and economic impacts of climate change that will fall disproportionately on vulnerable communities. By reducing millions of tons of conventional air pollutants, the rule will lead to better air quality and improved health in those communities. We heard from many commenters who recognize and welcome those benefits.
There are other ways in which the actions that result from this rulemaking may affect communities in positive or potentially adverse ways and we also heard about these from commenters.
While the agency expects overall emission decreases as a result of this
( printed page 64915)
rulemaking, we recognize that some EGUs may operate more frequently, as a result of this rulemaking. To the extent that we project increases in utilization as a result of this rulemaking, we expect these increases to occur generally in lower-emitting NGCC units, which have minimal or no emissions of SO2
and HAP, lower emissions of particulate matter, and much lower emissions of NOX
compared to higher-emitting steam units. We acknowledge the concerns that have been raised on this point but also the difficulty in anticipating prior to plan implementation where those impacts might occur. In addition to providing for a robust state planning process with opportunity for meaningful input, the EPA is encouraging states to evaluate the actual impacts of their plans once implemented and, as described below, the EPA intends to conduct an assessment of whether and where emission increases may that may result from plan implementation and to work with states to mitigate adverse impacts, if any, in overburdened communities.
In addition to the many positive anticipated health benefits of this rulemaking, it also will increase the use of clean energy and will encourage EE. These changes in the electricity generation system, which are already occurring but may be accelerated by this program, are expected to have other positive benefits for communities. The electricity sector is, and will continue to be, investing more in RE and EE. The construction of renewable generation and the implementation of EE programs such as residential weatherization will bring investment and employment opportunities to the communities where they take place. We recognize that certain communities whose economies may be affected by changes in the utility and related sectors may be particularly impacted by the final rule. The EPA encourages states to make an effort to engage with these communities, including workers and their representatives in these sectors, including EE. It is important to ensure that all communities share in the benefits of this program. And while we estimate that its benefits will greatly exceed its costs (as noted in the RIA for this rulemaking), it is also important to ensure that to the extent there are increases in electricity costs, that those do not fall disproportionately on those least able to afford them.
The EPA has engaged with community groups throughout this rulemaking, and we received many comments on the issues outlined above from community groups, environmental justice organizations, faith-based organizations, public health organizations, and others.[1014]
This input has informed this final rulemaking and prompted the EPA to consider other steps that the agency can take in the short and long term to assist states and stakeholders to consider environmental justice and impacts to communities in plan development and implementation.
It has also prompted us to work with our federal partners to make sure that states and communities have information on federal resources available to assist communities. We describe these resources below, as well as resources that the EPA will be providing to assist communities in accessing EE/RE and financial assistance programs. In our discussion below we also provide models of programs that other states are currently using to assist communities in accessing available resources that states could use when developing their plans.
Finally, and importantly, we recognize that communities must be able to participate meaningfully in state plan development. In this section, we discuss the requirements in the final rule for states, as they develop their plans, to provide opportunities for public involvement, and resources available to states and communities to enhance the success of the public process.
A. Proximity Analysis
The EPA is committed to assisting states and communities to develop plans that ensure there are no disproportionate, adverse impacts on overburdened communities. To provide information fundamental to beginning that process, the EPA has conducted a proximity analysis for this final rulemaking that summarizes demographic data on the communities located near power plants.[1015]
The EPA understands that, in order to prevent disproportionately, high and adverse human health or environmental effects on these communities, both states and communities must have information on the communities living near facilities, including demographic data, and that accessing and using census data files requires expertise that some community groups may lack. Therefore, the EPA used census data from the American Community Survey (ACS) 2008-2012 to conduct a proximity analysis that can be used by states and communities as they develop state plans and as they later assess the final plans' impacts. The analysis and its results are presented in the EJ Screening Report for the Clean Power Plan, which is located in the docket for this rulemaking at EPA-HQ-OAR-2013-0602.
The proximity analysis provides detailed demographic information on the communities located within a 3-mile radius of each affected power plant in the U.S. Included in the analysis is the breakdown by percentage of community characteristics such as income and minority status. The analysis shows a higher percentage of communities of color and low-income communities living near power plants than national averages. It is important to note that the impacts of power plant emissions are not limited to a 3-mile radius and the impacts of both potential increases and decreases in power plant emissions can be felt many miles away. Still, being aware of the characteristics of communities closest to power plants is a starting point in understanding how changes in the plant's air emissions may affect the air quality experienced by some of those already experiencing environmental burdens.
Although overall there is a higher fraction of communities of color and low-income populations living near power plants than national averages, there are differences between rural and urban power plants. There are many rural power plants that are located near small communities with high percentages of low-income populations and lower percentages of communities of color. In urban areas, nearby communities tend to be both low-income communities and communities of color. In light of this difference between rural and urban communities proximate to power plants and in order to adequately capture both the low-income and minority aspects central to environmental justice considerations, we use the terms “vulnerable” or “overburdened” when referring to these communities. Our intent is for these terms to be understood in an expansive sense, in order to capture the full scope of communities, including indigenous communities most often located in rural areas, that are central to our environmental justice and community considerations.
As stated in the Executive Order 12898 discussion located in section XII.J of this preamble, the EPA believes that all communities will benefit from this final rulemaking because this action directly addresses the impacts of climate change by limiting GHG emissions through the establishment of CO2 emission guidelines for existing affected fossil fuel-fired power plants.
( printed page 64916)
The EPA also believes that the information provided in the proximity analysis will promote engagement between vulnerable communities and their states and will be useful for states as they begin developing their plans. In addition to providing the proximity analysis in the docket of this rulemaking, the EPA will disseminate the proximity analysis to states and will make it publicly available on its Clean Power Plan (CPP) Community Portal. Furthermore, the EPA has also created an interactive mapping tool that illustrates where power plants are located and provides information on a state level. This tool is available at:
https://cleanpowerplanmaps.epa.gov/CleanPowerPlan/.
Additionally, the EPA encourages states to conduct their own analyses of community considerations when developing their plans. Each state is uniquely knowledgeable about its own communities and well-positioned to consider the possible impacts of plans on vulnerable communities within its state. Conducting state-specific analyses would not only help states assess possible impacts of plan options, but it would also enhance a state's understanding of the means to engage these communities that would most effectively reach them and lead to valuable exchanges of information and concerns. A state analysis, together with the proximity analysis conducted by the EPA, would provide a solid foundation for engagement between a state and its communities.
Such state-specific analyses need not be exhaustive. An examination of the options a state is considering for its plan, and any projections of likely resulting increases in power plant emissions affecting low-income populations, communities of color populations, or indigenous communities, would be informative for communities. The analyses could include available air quality monitoring data and information from air quality models, and, if available, take into account information about local health vulnerabilities such as asthma rates or access to healthcare. Alternatively, a simple analysis may consider expected EGU utilization in geographic proximity to overburdened communities. The EPA will provide states with information on its publicly available environmental justice screening and mapping tool, EJ SCREEN, which they may use in conducting a state-specific analysis. The EPA will also provide states with resources containing examples of analyses that other states have conducted to examine the impacts of their programs on overburdened communities. Additionally, the EPA encourages states to submit a copy of their analysis if they choose to conduct one, with their initial and final plan submittals.
B. Community Engagement in State Plan Development
In sections VIII.D-E of this preamble, the EPA explains that states need to engage meaningfully with communities and other stakeholders during the initial and final plan submittal processes. Meaningful engagement includes outreach to vulnerable communities, sharing information and soliciting input on state plan development and on any accompanying assessments such as those described above, and selecting methods for engagement to support communities' involvement at critical junctures in plan formulation and implementation. This engagement also includes providing the public the opportunity to comment on the state's initial submittal and responding to significant comments received, including comments from vulnerable communities, as well as conducting a public hearing and responding to comments before a final state plan is submitted. Additionally, the EPA expects that states will conduct outreach meetings, which could include public hearings or listening sessions, before the initial submittal is made. The EPA also encourages states to provide background information about their proposed final state plan or their initial state plan in the appropriate languages in advance of their public hearing and at their public hearing. The EPA recommends that states provide translators and other resources at their public hearings, to ensure that members of the public can provide oral feedback.
In the initial submittal, the final rule requires that states provide information to the agency about the community engagement they have undertaken and the means by which they intend to involve vulnerable communities and other stakeholders as they develop their final plan. Furthermore, as noted in section VIII.E of this preamble, in determining if states are eligible for a 2-year extension for submission of final plans, the rule requires that states demonstrate how they are meaningfully engaging vulnerable communities and other interested stakeholders as part of their public participation process. The EPA consulted its May 2015,
Guidance on Considering Environmental Justice During the Development of Regulatory Actions,
when crafting this rulemaking and recommends that states consult it to assist them in engaging meaningfully with vulnerable communities.[1016]
Additionally, states in their initial submittal and 2017 update must show how they identified the communities with whom they are engaging as they develop their plans. Some suggested actions that states could take to engage actively with the public, including conducting meaningful engagement with vulnerable communities, are outlined in section VIII.E of this preamble. Additionally, as outlined in section VIII.D, the final plan submitted by states must include an overview of the public hearing(s) conducted and information on how the state ensured that the hearing(s) were accessible to stakeholders including vulnerable communities.
The EPA is committed to supporting states in effectively engaging with communities as they develop and implement their plans. The EPA will provide training and other resources throughout the implementation process that will assist states and communities in understanding plan requirements and options for plan development. These trainings will be a continuation of those that the EPA has already conducted with communities and states both pre- and post-proposal. The EPA will reach out to a wide variety of community stakeholders, including groups representing environmental justice communities, faith-based organizations, academic organizations working with vulnerable and overburdened communities, affordable housing advocates, public health professionals, public health organizations, and other community stakeholders.
C. Providing Communities With Access to Additional Resources
In addition to providing resources to states, the EPA encourages states to be aware of existing efforts undertaken by other states aimed at providing low-income communities access to financial and technical assistance programs for EE and RE, and to consider similar approaches that may make sense for their own states. The EPA encourages states to consider targeting economic development resources to communities that are likely to be negatively affected by ongoing changes in the utility and related sectors in support of efforts to diversify their economies, attract new sources of investment, and create new jobs.
One example of a program targeted at low-income communities is the
( printed page 64917)
Maryland EmPOWER Low Income Energy Efficiency Program (LIEEP).[1017]
The LIEEP program administered by the Maryland Department of Housing and Community Development (DHCD) helps low-income households through free installation of energy conservation materials (
i.e.,
installation, hot water system improvements, lighting retrofits, furnace cleaning, tuning and safety repairs, refrigerator retrofits, etc.).[1018]
Funding for this program is provided by EmPOWER Maryland partners: Baltimore Gas and Electric, Southern Maryland Electric Cooperative, Delmarva Power, Allegheny Energy and Pepco.[1019]
This program is available to both homeowners and renters.[1020]
Additionally, the Maryland Department of Housing provides low-income families with home heating bill assistance and furnace repairs and replacements through the Maryland Energy Assistance Program (MEAP).[1021]
Maryland's Electric Universal Service Program (EUSP) helps low-income electric customers with their electric bills.[1022]
Another example of a program is EmPower New York, which provides no-cost energy solutions to low-income populations.[1023]
Currently there are about 100,000 people who are receiving assistance. Both homeowners and renters are eligible to receive assistance under this program. The types of assistance available include EE upgrades (plugging leaks, adding insulation, replacing inefficient refrigerators and freezers and new energy-efficient lighting). Other states, like the State of Colorado's Energy Outreach Colorado program, offer similar resources for low-income populations.[1024]
In 2013, the New York State Energy and Research Development Authority (NYSERDA) was able to secure a triple-A rated financial guarantee from the state's Clean Water State Revolving Fund (SRF) for a $24 million bond issue. Proceeds funded residential EE loans that were available to all utility customers, including low-income households. SRF eligibility was based on the beneficial impact of EE investment in reducing atmospheric deposition on impaired water bodies consistent with Section 319 of the Clean Water Act.
As discussed below, there are also many federal programs that can help low-income populations access the benefits of RE, EE, and the economic benefits of a cleaner energy economy.
In the coming months, the EPA will continue to provide information and resources for communities and states on existing federal, state, local, and other financial assistance programs to encourage EE/RE opportunities that are already available to communities. For example the EPA will provide a catalog of current or recent state and local programs that have successfully helped communities adopt EE/RE measures. The goal of these resources is to help vulnerable communities gain the benefits of this rulemaking by encouraging that states use these types of tools in their state plans. The use of these RE/EE tools can also help low-income households reduce their electricity consumption and bills.
The EPA recognizes the potential impacts that this rulemaking could have on jobs in communities. Therefore, in section VIII.G of this preamble, the EPA has outlined that states, in designing their state plans, should consider the effects of their plans on employment and overall economic development to realize the opportunities for economic growth and jobs that the plans offer. To the extent possible, states should try to assure that communities that may be expected to experience job losses can also take advantage of the opportunities for job growth or otherwise transition to healthy, sustainable economic growth (
e.g.,
with regard to delivering EE measures and installing rooftop solar panels). Additionally, as part of the resources that we will be providing to states and low-income communities, the EPA will provide information on the Administration's Partnerships for Opportunity and Workforce and Economic Revitalization (POWER) Initiative and other programs that specifically target economic development assistance to communities affected by changes in the coal industry and the utility power sector.[1025]
D. Federal Programs and Resources Available to Communities
Federal agencies have a history of bringing EE and RE to low-income communities. Earlier this summer, the Administration announced a new initiative to scale up access to solar energy and cut energy bills for all Americans, in particular low- and moderate-income communities, and to create a more inclusive solar workforce. As part of this new initiative, the U.S. Department of Energy (DOE), the U.S. Department of Housing and Urban Development (HUD), U.S. Department of Agriculture (USDA), and the EPA launched a National Community Solar Partnership to unlock access to solar energy for the nearly 50 percent of households and businesses that are renters or do not have adequate roof space to install solar systems, with a focus on low- and moderate-income communities. The Administration also set a goal to install 300 megawatts (MW) of RE in federally subsidized housing by 2020 and plants to provide technical assistance to make it easier to install solar energy on affordable housing, including clarifying how to use federal funding for EE and RE. To continue enhancing employment opportunities in the solar industry for all Americans, AmeriCorps is providing funding to deploy solar energy and create jobs in underserved communities, and DOE is working to expand solar energy education and opportunities for job training.
These recent announcements build on the many existing federal programs and resources available to improve EE and accelerate the deployment of RE in vulnerable communities. Some examples of these resources include: the Department of Energy's Weatherization Assistance Program, Health and Human Service's Low Income Home Energy Assistance Program, the Department of Agriculture's Energy Efficiency and Conservation Loan Program, High Cost Energy Grant Program, and the Rural Housing Service's Multi-Family Housing Program.
HUD supports EE improvements and the deployment of RE on affordable housing through its Energy Efficient Mortgage Program, Multifamily Property Assessed Clean Energy Pilot with the State of California, PowerSaver Program, and the use of Section 108 Community Development Block Grants. The Department of Treasury provides several tax credits to support RE development and EE in low-income communities, including the New Markets Tax Credit Program and the Low-Income Housing Tax Credit. The EPA's RE-Powering America's Land Initiative promotes the reuse of potentially contaminated lands, landfills and mine sites—many of which are in low-income communities—for RE through a combination of tailored redevelopment tools for communities and developers, as well as site-specific technical support. The EPA's Green
( printed page 64918)
Power Partnership is increasing community use of renewable electricity across the country and in low-income communities. The EPA partners with EE programs throughout the country that leverage ENERGY STAR to deliver broad consumer energy-saving benefits, of particular value to low-income households who can least afford high energy bills. ENERGY STAR also works with houses of worship to reduce energy costs—savings that can then be repurposed to their community mission, including programs and assistance to residents in low-income communities. The EPA will be working with these federal partners and others to ensure that states and vulnerable communities have access to information on these programs and their resources.
The federal government also has a number of programs to expand employment opportunities in the energy sector, including for underserved populations. Examples of these include HUD, DOE, and the Department of Education's “STEM, Energy, and Economic Development” program; DOE's Diversity in Science and Technology Advances National Clean Energy in Solar (DISTANCE-Solar) Program; Grid Engineering for Accelerated Renewable Energy Deployment (GEARED); the Department of Labor's Trade Adjustment Assistance Community College and Career Training (TAACCCT), Apprenticeship USA Advancing Apprenticeships in the Energy Field, Job Corps Green Training and Greening of Centers, and YouthBuild; and the EPA's Environmental Workforce Development and Job Training (EWDJT) program.
E. Multi-Pollutant Planning and Co-Pollutants
As outlined in the final Clean Power Plan, states and sources have continued obligations to meet all other CAA requirements addressing conventional pollutants. Because the CAA envisions control of these other pollutants as a continuous process (through provisions such as periodic review of the NAAQS and residual risk requirements under the MACT program), the EPA believes that the Clean Power Plan provides an opportunity for states to consider strategies for meeting future CAA planning obligations as they develop their plans under this rulemaking. Multi-pollutant strategies that incorporate criteria pollutant reductions over the planning horizons specific to particular states, jointly with strategies for reducing CO2
emissions from affected EGUs needed to meet Clean Power Plan requirements over the time horizon of this rule, may accomplish greater environmental results with lower long-term costs. Such strategies may also provide opportunities for states, communities, and affected facilities to consider the most effective means of meeting these obligations while limiting or eliminating localized emission increases that would otherwise affect overburdened communities. Furthermore, this type of multi-pollutant approach has been suggested by states and regulated sources in past rulemakings as a tool to determine the best system of emission reductions. The EPA recommends that states consider such strategies in consultation with their communities, affected facilities, and other stakeholders.
Air quality in a given area is affected by emissions from nearby sources and may be influenced by emissions that travel hundreds of miles and mix with emissions from other sources.[1026]
In the Cross-State Air Pollution Rule the EPA used its authority to reduce emissions that significantly contribute to downwind exposures. The RIA for the final Cross-State Air Pollution Rule anticipates substantial health benefits for the population across a wide region. Similarly, the EPA believes that, like the Cross-State Air Pollution Rule, this rulemaking will result in significant health benefits because it will reduce co-pollutant emissions of SO2
and NOX
on a regional and national basis.[1027]
Thus, localized increases in NOX
emissions may well be more than offset by NOX
decreases elsewhere in the region that produce a net improvement in ozone and particulate concentrations across the area.
Another effect of the final CO2
emission guidelines for affected existing fossil fuel-fired EGUs may be increased utilization of other, unmodified EGUs—in particular, high efficiency gas-fired EGUs—with relatively low GHG emissions per unit of electrical output. These plants may operate more hours during the year and could emit pollutants, including pollutants whose environmental effects would be localized and regional rather than global as is the case with GHG emissions. Changes in utilization already occur in response to energy demands and evolving energy sources, but the final CO2
emission guidelines for affected existing fossil fuel-fired EGUs can be expected to cause more such changes. Increased utilization of solid fossil fuel-fired units generally would not increase peak concentrations of PM2.5, NOX, or ozone around such EGUs to levels higher than those that are already occurring because peak hourly or daily emissions generally would not change; however, increased utilization may make periods of relatively high concentrations more frequent. It should be noted that the gas-fired sources likely to be dispatched more frequently have very low emissions of primary PM, SO2, and HAP per unit of electrical output and that they must continue to comply with other CAA requirements that directly address the conventional pollutants, including federal emission standards, rules included in SIPs, and conditions in Title V operating permits, in addition to the guidelines in this final rulemaking. Therefore, local (or regional) air quality for these pollutants is not likely to be significantly affected.
For natural gas-fired EGUs, the EPA found that regulation of HAP emissions “is not appropriate or necessary because the impacts due to HAP emissions from such units are negligible based on the results of the study documented in the utility RTC.” [1028]
Because gas-fired EGUs emit essentially no mercury, increased utilization will not increase methyl mercury concentrations in water bodies near these affected EGUs. In studies done by DOE/NETL comparing cost and performance of coal- and NGCC-fired generation, they assumed SO2, NOX, PM (and Hg) emissions to be “negligible.” Their studies predict NOX
emissions from a NGCC unit to be approximately 10 times lower than a subcritical or supercritical coal-fired boiler.[1029]
Many, although not all, NGCC units are also very well controlled for emissions of NOX
through the application of after combustion controls such as selective catalytic reduction.
F. Assessing Impacts of State Plan Implementation
It is important to the EPA that the implementation of state plans be assessed in order to identify whether they cause any adverse impacts on communities already overburdened by disproportionate environmental harms and risks. The EPA will conduct its own assessment during the implementation phase of this rulemaking to determine whether the implementation of state plans developed pursuant to this rulemaking and other air quality rules are, in fact, reducing emissions and improving air quality in all areas or whether there are localized air quality impacts that need to be addressed under other CAA authorities. Furthermore, the
( printed page 64919)
EPA recommends that states conduct evaluations of their own to determine the impacts of their plans on overburdened communities. An example of one such approach to assessing a state plan for reducing GHGs is the California Air Resources Board's (CARB),
First Update on the Climate Change Scoping Plan: Building on the Framework Pursuant to AB32: The California Global Warming Solutions Act of 2006,
which outlines ongoing evaluations that it will conduct to determine the impacts of its programs (throughout the implementation stages) on overburdened communities.[1030]
CARB's Adaptive Management Plan for the Cap-and-Trade Program is one particular evaluation, which is intended to assess any localized emissions increases resulting from the program so that the state can appropriately respond.[1031]
The EPA recommends that states consider CARB's approaches and other programs as models for conducting ongoing assessments of the impacts of their state plans on overburdened communities. The EPA will provide training for states and communities on resources that they can use to assess options for plan development and implementation that appropriately consider localized impacts, especially effects of co-pollutants, as well as training on how to develop and carry out these evaluations.
This training will include guidance in accessing the publicly available information that sources and states currently report that can help with ongoing assessments of state plan impacts. For example, unit-specific emissions data and air quality monitoring data are readily available. This information, together with the assessment that the EPA will conduct in the implementation phase of this rulemaking and other analyses that states may develop, will enable states and communities to monitor any disproportionate emissions that may result in adverse impacts and to address them.
G. EPA Continued Engagement
The EPA is committed to helping ensure that this action will not have disproportionate adverse human health or environmental effects on vulnerable communities. Throughout the implementation phase of this rulemaking, the agency will continue to provide trainings and resources to assist communities and states as they engage with one another. Additionally, we will provide states with recommendations on best practices for engaging with vulnerable communities. The EPA, through its outreach efforts during implementation, will continue to solicit feedback from communities and states on topics for which they would like additional trainings and resources.
The EPA will also provide states with resources containing examples of analyses that other states have conducted to examine the impacts of their programs on vulnerable communities, as well as information on its publicly available environmental justice screening and mapping tool, EJ SCREEN. States are encouraged to use this preliminary information as well as other available information to conduct their own analyses. As described above, the EPA will assess the impacts of this rulemaking during its implementation. The EPA will house this assessment, along with the proximity analysis and other information generated throughout the implementation process, on its Clean Power Plan (CPP) Community Portal that will be linked to this rulemaking's Web site (
www.epa.gov/cleanpowerplan). In addition, the EPA has expanded its set of resources that are being developed to help states and communities understand the breadth of policy options and programs that have successfully brought EE/RE to overburdened communities. The EPA is committed to continuing its engagement with states and communities from the beginning of plan development through plan implementation.
A more detailed discussion concerning the application of Executive Order 12898 in this rulemaking can be found in section XI.J of this preamble. A summary of the EPA's interactions with communities is in the EJ Screening Report for the Clean Power Plan, available in the docket of this rulemaking. Furthermore, the EPA's responses to public comments, including comments received from communities, are provided in the response to comments documents located in the docket for this rulemaking.
In summary, the EPA in this final rulemaking has designed an integrative approach that helps to ensure that vulnerable communities are not disproportionately impacted by this rulemaking. The proximity analysis that the agency has conducted for this rulemaking is a central component of this approach. Not only is the proximity analysis a useful tool to help identify overburdened communities that may be impacted by this rulemaking, states can use this tool as they engage with communities in the development of their plans, consider a multi-pollutant approach, help low-income communities access EE/RE and financial assistance programs and assess the impacts of their state plans. Additionally, in order to continue to ensure that vulnerable communities are not disproportionately impacted by this rulemaking, the EPA will also be conducting its own assessment during the implementation phase. Furthermore, the EPA will continue to engage with communities and states throughout the implementation phase of this rulemaking to help ensure that vulnerable communities are not disproportionately impacted.
X. Interactions With Other EPA Programs and Rules
A. Implications for the New Source Review Program
The new source review (NSR) program is a preconstruction permitting program that requires major stationary sources of air pollution to obtain permits prior to beginning construction. The requirements of the NSR program apply both to new construction and to modifications of existing major sources. Generally, a source triggers these permitting requirements as a result of a modification when it undertakes a physical or operational change that results in a significant emission increase and a net emissions increase. NSR regulations define what constitutes a significant net emissions increase, and the concept is pollutant-specific. As a result of the decision in
Utility Air Regulatory Group (UARG)
v.
Environmental Protection Agency (EPA),
134 S. Ct. 2427 (2014), a modification that increases only GHG emissions above the applicable level will not trigger the requirement to obtain a PSD permit. Under existing EPA regulations, a modifying major stationary source would trigger PSD permitting requirements for GHGs if it undergoes a change or change in the method of operation (modification) that results in a significant increase in the emissions of a pollutant other than GHGs and results in a GHG emissions increase of 75,000 tons per year CO2
e as well as a GHG emissions increase on a mass basis. Once it has been determined that a change triggers the requirements of the NSR program, the source must obtain a permit prior to making the change. The pollutant(s) at issue and the air quality designation of the area where the
( printed page 64920)
facility is located or proposed to be built determine the specific permitting requirements.
As part of its CAA section 111(d) plan, a state may impose requirements that require an affected EGU to undertake a physical or operational change to improve the unit's efficiency that results in an increase in the unit's dispatch and an increase in the unit's annual emissions. If the emissions increase associated with the unit's changes exceeds the thresholds in the NSR regulations for one or more regulated NSR pollutants, including the netting analysis, the changes would trigger NSR.
While there may be instances in which an NSR permit would be required, we expect those situations to be few. As previously discussed in this preamble, states have considerable flexibility in selecting varied measures as they develop their plans to meet the goals of the emission guidelines. One of these flexibilities is the ability of the state to establish emission standards in their CAA section 111(d) plans in such a way so that their affected sources, in complying with those standards, in fact would not have emissions increases that trigger NSR. To achieve this, the state would need to conduct an analysis consistent with the NSR regulatory requirements that supports its determination that as long as affected sources comply with the emission standards in their CAA section 111(d) plan, the source's emissions would not increase in a way that trigger NSR requirements.
For example, a state could decide to use demand-side measures or increase reliance on RE as a way of reducing the future emissions of an affected source initially predicted (without such alterations) to increase its emissions as a result of a CAA section 111(d) plan requirement. In other words, a state plan's incorporation of expanded use of cleaner generation or demand-side measures could yield the result that units that would otherwise be projected to trigger NSR through a physical change that might result in increased dispatch would not, in fact, increase their emissions, due to reduced demand for their operation. The state could also, as part of its CAA section 111(d) plan, develop conditions for a source expected to trigger NSR that would limit the unit's ability to move up in the dispatch enough to result in a significant net emissions increase that would trigger NSR (effectively establishing a synthetic minor limit).[1032]
In addition, in this final rule, we have also adjusted the date of the period for mandatory reductions to 2022, instead of 2020, and provided states with flexibility with respect to the glide path. This obviates concerns that there is insufficient time for sources that may need permits to obtain them and allows additional planning time for these changes to be undertaken in a manner that does not trigger PSD. As a result of such flexibility and anticipated state involvement, we expect that a limited number of affected sources would trigger NSR when states implement their plans.
B. Implications for the Title V Program
In the preamble to the June 18, 2014 proposal, the EPA discussed the issue of excessive title V fees resulting inadvertently as a consequence of the promulgation of the first section 111 standard to regulate GHGs. Specifically, the EPA explained that when the first section 111 standard is promulgated for GHGs, if we do not revise 40 CFR parts 70 and 71 (the operating permit rule), then certain permitting authorities would be required to charge emissions-based fees for GHGs, resulting in fees that would be far in excess of what is required to cover the reasonable costs of the permitting programs. To avoid this situation, the EPA proposed as part of the re-proposed carbon pollution standards for newly constructed fossil fuel-fired power plants (70 FR 1429-1519; January 8, 2014) to exempt GHGs from the list of air pollutants that are subject to fee calculation requirements under the operating permit rules. Also, we proposed several options to impose a smaller fee adjustment for GHGs that would be reasonable and designed to recover the costs of addressing GHGs in permitting without being excessive.
In a separate action in this issue of the
Federal Register
, the EPA is finalizing changes to the operating permits rules to address the title V fee issue. In particular, we are taking final action to exempt GHGs from emissions-based fee calculation requirements under the operating permit rules. In addition, we are also finalizing a modest GHG fee adjustment to recover the costs of addressing GHGs in permitting. The GHG adjustments we are finalizing are based on accounting for the number of permit actions that require a GHG assessment in a given period, rather than accounting for emissions levels of GHGs. Finally, the EPA is also finalizing the addition of text within 40 CFR part 60, subpart TTTT, to clarify that the fee pollutant for operating permit purposes is GHG (as defined in 40 CFR 70.2 and 71.2) to add clarity to our regulations and to avoid the potential need for possible future rulemakings to adjust the title V fee regulations if any constituent of GHG, other than CO2, becomes subject to regulation under CAA section 111 for the first time.
This title V fee issue is a one-time occurrence resulting from the promulgation of the first CAA section 111 standard to regulate GHGs (the standards of performance for new, modified, and reconstructed EGUs, also promulgated in this issue of the
Federal Register
). The title V fee issue is not an issue for any other subsequent CAA section 111 regulations, such as this section 111(d) standard; thus, there is no need to address any title V fee issues in this final rule as part of this action.
In the proposal, the EPA discussed that the section 111 rules would have no effect on the applicability thresholds for GHG under the operating permit rules. After the proposal for this rulemaking was published, the U.S. Supreme Court issued its opinion in
UARG
v.
EPA,
134 S.Ct. 2427 (June 23, 2014), and in accordance with that decision, the D.C. Circuit subsequently issued an amended judgment in
Coalition for Responsible Regulation, Inc.
v.
Environmental Protection Agency,
Nos. 09-1322, 10-073, 10-1092 and 10-1167 (D.C. Cir., April 10, 2015). Those decisions support the same overall conclusion, as the EPA discussed in the proposal, with respect to the effect of this final section 111 rule on the applicability thresholds for GHGs under the operating permits rules, though for different reasons.
With respect to title V, the Supreme Court said that EPA may not treat GHGs as an air pollutant for purposes of determining whether a source is a major source required to obtain a title V operating permit. In accordance with that decision, the D.C. Circuit's amended judgment vacated the title V regulations under review in that case to the extent that they require a stationary source to obtain a title V permit solely because the source emits or has the potential to emit GHGs above the applicable major source thresholds. The D.C. Circuit also directed the EPA to consider whether any further revisions to its regulations are appropriate in light of
UARG
v.
EPA,
and, if so, to undertake to make such revisions. These court
( printed page 64921)
decisions make clear that promulgation of CAA section 111 requirements for GHGs will not result in EPA imposing a requirement that stationary sources obtain a title V permit solely because such sources emit or have the potential to emit GHGs above the applicable major source thresholds.
C. Interactions With Other EPA Rules
Fossil fuel-fired EGUs are, or potentially will be, impacted by several other recently finalized or proposed EPA rules.[1033]
The EPA recognizes the importance of assuring that each of the rules described below can achieve its intended environmental objectives in a commonsense, cost-effective manner, consistent with underlying statutory requirements, and while assuring a reliable power system. Executive Order 13563, “Improving Regulation and Regulatory Review,” issued on January 18, 2011, states that “[i]n developing regulatory actions and identifying appropriate approaches, each agency shall attempt to promote . . . coordination, simplification, and harmonization. Each agency shall also seek to identify, as appropriate, means to achieve regulatory goals that are designed to promote innovation.” Within the EPA, we are paying careful attention to the interrelatedness and potential impacts on the industry, reliability and cost that these various rulemakings can have.
1. Mercury and Air Toxics Standards (MATS)
On February 16, 2012, the EPA issued the MATS rule (77 FR 9304) to reduce emissions of toxic air pollutants from new and existing coal- and oil-fired EGUs. The MATS rule will reduce emissions of heavy metals, including mercury, arsenic, chromium, and nickel; and acid gases, including hydrochloric acid and hydrofluoric acid. These toxic air pollutants, also known as hazardous air pollutants or air toxics, are known to cause, or suspected of causing, damage nervous system damage, cancer, and other serious health effects. The MATS rule will also reduce SO2
and fine particle pollution, which will reduce particle concentrations in the air and prevent thousands of premature deaths and tens of thousands of heart attacks, bronchitis cases and asthma episodes.
New or reconstructed EGUs (
i.e.,
sources that commence construction or reconstruction after May 3, 2011) subject to the MATS rule are required to comply by April 16, 2012 or upon startup, whichever is later.
Existing sources subject to the MATS rule were required to begin meeting the rule's requirements on April 16, 2015. Controls that will achieve the MATS performance standards are being installed on many units. Certain units, especially those that operate infrequently, may be considered not worth investing in given today's electricity market, and are closing. The final MATS rule provided a foundation on which states and other permitting authorities could rely in granting an additional, fourth year for compliance provided for by the CAA. States report that these fourth year extensions are being granted. In addition, the EPA issued an enforcement policy that provides a clear pathway for reliability-critical units to receive an administrative order that includes a compliance schedule of up to an additional year, if it is needed to ensure electricity reliability.
2. Cross-State Air Pollution Rule (CSAPR)
The CSAPR requires states to take action to improve air quality by reducing SO2
and NOX
emissions that cross state lines. These pollutants react in the atmosphere to form fine particles and ground-level ozone and are transported long distances, making it difficult for other states to attain and maintain the NAAQS. The first phase of CSAPR became effective on January 1, 2015, for SO2
and annual NOX, and May 1, 2015, for ozone season NOX
. The second phase will become effective on January 1, 2017, for SO2
and annual NOX, and May 1, 2017, for ozone season NOX
. Many of the power plants participating in CSAPR have taken actions to reduce hazardous air pollutants for MATS compliance that will also reduce SO2
and/or NOX. In this way these two rules are complementary. Compliance with one helps facilities comply with the other.
3. Requirements for Cooling Water Intake Structures at Power Plants (316(b) Rule)
On May 19, 2014, the EPA issued a final rule under section 316(b) of the Clean Water Act (CWA) (33 U.S.C. 1326(b)) (referred to hereinafter as the 316(b) rule.) The rule was published on August 15, 2014 (79 FR 48300; August 15, 2014), and became effective October 14, 2014. The 316(b) rule establishes new standards to reduce injury and death of fish and other aquatic life caused by cooling water intake structures at existing power plants and manufacturing facilities.[1034]
The 316(b) rule subjects existing power plants and manufacturing facilities that withdraw in excess of 2 million gallons per day) of cooling water, and use at least 25 percent of that water for cooling purposes, to a national standard designed to reduce the number of fish destroyed through impingement and a national standard for establishing entrainment reduction requirements. All facilities subject to the rule must submit information on their operations for use by the permit authority in determining 316(b) permit conditions. Certain plants that withdraw very large volumes of water will also be required to conduct additional studies for use by the permit authority in determining the site-specific entrainment reduction measures for such facilities. The rule provides significant flexibility for compliance with the impingement standards and, as a result, is not projected to impose a substantial cost burden on affected facilities. With respect to entrainment, the rule calls upon the permitting authority to establish appropriate entrainment reduction measures, taking into account, among other factors, remaining useful plant life and quantified and qualitative social benefits and cost. The permit writer may also consider impacts on the reliability of energy delivery within the facility's immediate area. Existing sources subject to the 316(b) rule are required to comply with the impingement requirements as soon as practicable after the entrainment requirements are determined. They must comply with applicable site-specific entrainment reduction controls based on the schedule of requirements established by the permitting authority.
4. Disposal of Coal Combustion Residuals From Electric Utilities (CCR Rule)
On December 19, 2014, the EPA issued the final rule for the disposal of coal combustion residuals from electric utilities. The rule provides a comprehensive set of requirements for the safe disposal of coal combustion residuals (CCRs), commonly known as coal ash, from coal-fired power plants. The CCR rule is the culmination of extensive study on the effects of coal ash on the environment and public health. The CCR rule establishes technical requirements for existing and
( printed page 64922)
new CCR landfills and surface impoundments under the Resource Conservation and Recovery Act, Subtitle D (42 U.S.C. 6941-6949a), the nation's primary law for regulating solid waste.
These regulations address the risks from coal ash disposal—leaking of contaminants into ground water, blowing of contaminants into the air as dust, and the catastrophic failure of coal ash surface impoundments by establishing requirements for where CCR landfills and surface impoundments may be located, how they must be designed, operated and monitored, when they must be inspected, and how they must be closed and cared for after closure. Additionally, the CCR rule sets out recordkeeping and reporting requirements, as well as the requirement for each facility to establish and post specific information to a publicly-accessible Web site. The final rule also supports the responsible recycling of CCRs by distinguishing safe, beneficial use from disposal.
5. Steam Electric Effluent Limitation Guidelines and Standards (SE ELG Rule)
The EPA is reviewing public comments and working to finalize the proposed SE ELG rule which will impact existing fossil fuel-fired EGUs. In 2013, the EPA proposed the SE ELG rule (78 FR 34432; June 7, 2013) to strengthen the controls on discharges from certain steam electric power plants by revising technology-based effluent limitations guidelines and standards for the steam electric power generating point source category. The current regulations, which were last updated in 1982, do not adequately address the toxic pollutants discharged from the electric power industry, nor have they kept pace with process changes that have occurred over the last three decades. Existing steam electric power plants currently contribute 50-60 percent of all toxic pollutants discharged to surface waters by all industrial categories regulated in the U.S. under the CWA. Furthermore, power plant discharges to surface waters are expected to increase as pollutants are increasingly captured by air pollution controls and transferred to wastewater discharges. The proposed regulation, which includes new requirements for both existing and new generating units, would reduce impacts to human health and the environment by reducing the amount of toxic metals and other pollutants currently discharged to surface waters from power plants. The EPA intends to take final action on the proposed rule by September 30, 2015.
The EPA is endeavoring to enable EGUs to comply with applicable obligations under other power sector rules as efficiently as possible (
e.g.,
by facilitating their ability to coordinate planning and investment decisions with respect to those rules) and, where possible, implement integrated compliance strategies. For example, in the proposed SE ELG rule, the EPA describes its thinking on how it might effectively harmonize the potential requirements of that rule with the requirements of the final CCR rule. Because these two rules affect similar units and may be met with similar compliance strategies, common-sense implementation timeframes were established in the CCR final rule so that utilities would not be required to make major decisions about CCR units without first understanding the implications that such decisions would have for meeting the surface water protection requirements of the final ELG rule. The EPA is taking into account these new CCR requirements for coal ash as it develops the final SE ELG rule. The EPA's goal in harmonizing the SE ELG and CCR rules is to minimize the overall complexity of the two regulatory structures and avoid creating unnecessary burden.
6. Other EPA Rules
In addition to the power sector rules discussed above, the development of SIPs for criteria pollutants (ozone, PM2.5, and SO2) and regional haze may also have implications for existing fossil-fired EGUs.
Regarding ozone, the proposal included a discussion of the June 6, 2013, proposed implementation rule for the 2008 ozone National Ambient Air Quality Standards (NAAQS), addressing the statutory requirements for areas EPA has designated as nonattainment for the 2008 ozone NAAQS. The final implementation rule for the 2008 ozone NAAQS was signed on February 13, 2015, and published on March 6, 2015, with an effective date of April 6, 2015. In general, the 2008 ozone NAAQS implementation rule interprets applicable statutory requirements and provides flexibility to states to minimize administrative burdens associated with developing and implementing plans to meet and maintain the NAAQS. The rule establishes due dates for attainment plans and clarifies attainment dates for each ozone nonattainment area according to its classification based on air quality thresholds, with attainment dates starting in July 2015 through July 2032 depending on an area's classification.
On November 25, 2014, the EPA Administrator signed the proposed rulemaking for the 2015 revisions to the ozone NAAQS. The proposal was published in the
Federal Register
on December 17, 2014 (79 FR 75234). The Administrator proposed to revise the primary ozone standard to a level in the range of 0.065 to 0.070 ppm and took comment on lower levels including 0.060 ppm and on retaining the current standard of 0.075 ppm. Among other things, the ozone NAAQS proposal also proposed to retain the current indicator, averaging time, and form of the standard and included a proposed secondary ozone NAAQS in the 0.065 to 0.070 ppm range.
The proposal also outlined the key implementation milestones requiring revised SIPs, with due dates starting in October 2018 for infrastructure and interstate transport SIPs, attainment plans due 2020-21, and attainment dates of 2020-37. The EPA is under a court order to finalize its review of the ozone NAAQS by October 1, 2015.
Some commenters expressed concern with the potential impact proposed revisions to the ozone NAAQS could have on state planning efforts and affected entities' ability to comply with any potentially new requirements associated with a revised ozone NAAQS and those related to the 111(d) emission guidelines. In particular, commenters raised issues with a potentially more stringent ozone standard and the permitting and state planning implications this may create. While there was no discussion of the proposed revisions to the ozone NAAQS in the 111(d) emission guidelines proposal, commenters expressed a desire for the EPA to coordinate promulgation of the final 111(d) emission guidelines (and any other climate regulations) with the potential revision to the ozone standard to provide certainty and flexibility for states and affected sources.
While it is premature to speculate about the outcome of the ozone NAAQS review and how a more stringent ozone NAAQS may impact sources of ozone precursor emissions, including EGUs, we believe the planning and compliance timeframes that would follow from a revised ozone NAAQS and the timeframes we are finalizing today for submittal of the CAA section 111(d) state plans will allow considerable time for coordination by states in the development of their respective plans, as needed. As stated in the proposal, the EPA is prepared to work with states to assist them in coordinating their efforts across these planning processes.
Regarding PM2.5
NAAQS implementation, the proposal stated that
( printed page 64923)
the EPA was developing a proposed implementation rule to provide guidance to states on the development of SIPs for the 2012 PM2.5
NAAQS. The proposed PM2.5
SIP requirements rule was signed on March 10, 2015, and published on March 23, 2015 (80 FR 15340). The proposal addresses a number of requirements including attainment plan due dates, attainment dates and attainment date extension criteria for Moderate and Serious nonattainment areas; determination criteria for Reasonably Available Control Measures (RACM) for Moderate areas and Best Available Control Measures (BACM) for Serious areas; plans for demonstrating reasonable further progress and for meeting periodic quantitative milestones; and criteria for reclassifying a Moderate nonattainment area to Serious. The EPA is planning to finalize the PM2.5
implementation rule in early 2016.
There are currently only 9 areas designated nonattainment for the 2012 PM2.5
NAAQS, with an effective date of April 15, 2015. Since the attainment plans for these areas must be completed and submitted to the EPA in September 2016, we expect that the four states with such areas should have already decided on their approach to implementing the 2012 PM2.5
NAAQS when they begin to develop their plans for implementing the 111(d) guidelines, and will be able to coordinate the two.
Related to the SO2
NAAQS, and as stated in the proposal, the SO2
NAAQS was revised in June 2010 to protect public health from the short-term effects of SO2
exposure. In July 2013, the EPA designated 29 areas in 16 states as nonattainment for the SO2
NAAQS. The EPA based these nonattainment designations on the most recent set of certified air quality monitoring data as well as an assessment of nearby emission sources and weather patterns that contribute to the monitored levels. The date for attainment plans for these areas to be completed and submitted to the EPA was April 2015. As such, we expect states with such areas to have already decided on their approach to implementing the SO2
NAAQS as they start planning for implementation of the 111(d) guidelines, which should allow for coordination and consideration of SO2
related air quality measures into their 111(d) planning. The EPA intends to address the designations for all other areas in three separate actions in the future.[1035]
These designations must be completed by no later than July 2, 2016, December 31, 2017, and December 31, 2020 with attainment plans due between 2018 and 2022.
Regarding requirements under the regional haze program, several affected EGUs have deadlines in the 2016-2021 timeframe to install controls to comply with the Best Available Retrofit Technology (BART) and reasonable progress requirements of the Regional Haze Rule. Soon after these deadlines, some of the same affected EGUs may be required to reduce their utilization, convert into natural gas-fired facilities, or shut down entirely as a result of state 111(d) plans. Some commenters have expressed concern that for these affected EGUs, specifically those that choose to retire, the capital equipment installed to comply with the Regional Haze Rule would likely become stranded assets.
While the EPA is providing considerable flexibility for states and sources under the final 111(d) emission guidelines, the EPA acknowledges the possibility that some sources could ultimately be faced with the potential for stranded assets as a result of state 111(d) plans. For these sources, however, states have the option of developing BART alternatives that replace control requirements that would otherwise result in stranded assets at a particular EGU with the aggregate emission reductions that will result from retirements, fuel switching, reduced utilization, or lesser controls at multiple EGUs.
In fact, the EPA already has experience working with states to account for these very types of changed circumstances.[1036]
The EPA will continue to work with states to explore options for integrating compliance requirements across multiple regulatory programs, as warranted.
The EPA believes that CAA section 111(d) efforts and actions will tend to contribute to overall air quality improvements and thus should be complementary to criteria pollutant and regional haze SIP efforts.
7. Final Rule Flexibilities
As discussed in Section VIII of this preamble, the EPA is providing states flexibility in developing approvable plans under CAA section 111(d), including the ability to impose source-by-source limitations reflecting the BSER performance rates to each affected EGU or to adopt rate-based or mass-based emission performance goals, and to rely on a wide range of CO2
emission reduction measures, including measures that are not part of the BSER. The EPA is also providing states considerable flexibility with respect to the timeframes for plan development and implementation, with up to 3 years permitted for final plans to be submitted after the GHG emission guidelines are finalized, and up to 15 years for all emission reduction measures to be fully implemented. The EPA is establishing an 8-year interim period over which to achieve the full required reductions to meet the CO2
performance rates, and this begins in 2022, more than seven years from the June 18, 2014 date of proposal of the rulemaking. The 8-year interim period from 2022 through 2029, is separated into three steps, 2022-2024, 2025-2027, and 2028-2029, each associated with its own interim CO2
emission performance rates.
In light of these broad flexibilities, we believe that states will have ample opportunity, when developing and implementing their CAA section 111(d) plans, to coordinate their response to this requirement with source and state responses to any obligations that may be applicable to affected EGUs as a result of the MATS, CSAPR, 316(b), SE ELG and CCR rules, all of which are or soon will be final rules. In addition, we believe that states will be able to design CAA section 111(d) plans that use innovative, cost-effective regulatory strategies, that spark investment and innovation across a wide variety of clean energy technologies, and that will help reduce cost and ensure reliability, while also ensuring that all applicable environmental requirements are met.[1037]
We also believe that the broad
( printed page 64924)
flexibilities in this action will enable states and affected EGUs to build on their longstanding, successful records of complying with multiple CAA, CWA, and other environmental requirements, while assuring an adequate, affordable, and reliable supply of electricity.
The EPA anticipates significant emission reductions under the final guidelines for the utility power sector. In the final emission guidelines, the EPA has translated the source category-specific CO2
emission performance rates into equivalent state-level rate-based and mass-based CO2
goals in order to maximize the range of choices that states will have in developing their plans. Because of the range of choices available to states and the lack of
a priori
knowledge about the specific choices states will make in response to the final goals, the Regulatory Impact Analysis (RIA) for this final action presents two scenarios designed to achieve these goals, which we term the “rate-based” illustrative plan approach and the “mass-based” illustrative plan approach.[1039]
Under the rate-based approach, when compared to 2005, CO2
emissions are projected to be reduced by approximately 22 percent in 2020, 28 percent in 2025, and 32 percent in 2030. Under the mass-based approach, when compared to 2005, CO2
emissions are projected to be reduced by approximately 23 percent in 2020, 29 percent in 2025, and 32 percent in 2030. The final guidelines are projected to result in substantial co-benefits through reductions of SO2, NOX
and PM2.5
that will have direct public health benefits by lowering ambient levels of these pollutants and ozone. Tables 15 and 16 show expected CO2
and other air pollutant emissions in the base case and reductions under the final guidelines for 2020, 2025, and 2030 for the rate-based and mass-based approaches, respectively.
Table 15—Summary of CO
2
and Other Air Pollutant Emission Reductions From the Base Case Under Rate-Based Illustrative Plan Approach
CO
2
(millions short tons)
SO
2
(thousand short tons)
NO
X
(thousand short tons)
2020 Final Guidelines:
Base Case
2,155
1,311
1,333
Final Guidelines
2,085
1,297
1,282
Emissions Reductions
69
14
50
2025 Final Guidelines:
Base Case
2,165
1,275
1,302
Final Guidelines
1,933
1,097
1,138
Emissions Reductions
232
178
165
2030 Final Guidelines:
Base Case
2,227
1,314
1,293
Final Guidelines
1,812
996
1,011
Emissions Reductions
415
318
282
Source: Integrated Planning Model, 2015.
Note:
Emissions may not sum due to rounding.
Table 16—Summary of CO
2
and Other Air Pollutant Emission Reductions From the Base Case Under Mass-Based Illustrative Plan Approach
CO
2
(million short tons)
SO
2
(thousand short tons)
NO
X
(thousand short tons)
2020 Final Guidelines:
Base Case
2,155
1,311
1,333
Final Guidelines
2,073
1,257
1,272
Emissions Reductions
81
54
60
2025 Final Guidelines:
Base Case
2,165
1,275
1,302
Final Guidelines
1,901
1,090
1,100
Emissions Reductions
265
185
203
2030 Final Guidelines:
Base Case
2,227
1,314
1,293
Final Guidelines
1,814
1,034
1,015
Emissions Reductions
413
280
278
Source: Integrated Planning Model, 2015.
Note:
Emissions may not sum due to rounding.
( printed page 64925)
The reductions in Tables 15 and 16 do not account for reductions in hazardous air pollutants (HAPs) that may occur as a result of this rule. For instance, the fine particulate reductions presented above do not reflect all of the reductions in many heavy metal particulates.
B. Endangered Species Act
As explained in the preamble to the proposed rule (79 FR at 34933-934), the EPA has carefully considered the requirements of section 7(a)(2) of the Endangered Species Act (ESA) and applicable ESA regulations, and reviewed relevant ESA case law and guidance, to determine whether consultation with the U.S. Fish and Wildlife Service (FWS) and/or National Marine Fisheries Service (together, the Services) is required by the ESA. The EPA proposed to conclude that the requirements of ESA section 7(a)(2) would not be triggered by promulgation of the rule, and we now finalize that determination.
Section 7(a)(2) of the ESA requires federal agencies, in consultation with one or both of the Services (depending on the species at issue), to ensure that actions they authorize, fund, or carry out are not likely to jeopardize the continued existence of federally listed endangered or threatened species or result in the destruction or adverse modification of designated critical habitat of such species. 16 U.S.C. 1536(a)(2). Under relevant implementing regulations, section 7(a)(2) applies only to actions where there is discretionary federal involvement or control. 50 CFR 402.03. Further, under the regulations consultation is required only for actions that “may affect” listed species or designated critical habitat. 50 CFR 402.14. Consultation is not required where the action has no effect on such species or habitat. Under this standard, it is the federal agency taking the action that evaluates the action and determines whether consultation is required.
See51 FR 19926, 19949 (June 3, 1986). Effects of an action include both the direct and indirect effects that will be added to the environmental baseline. 50 CFR 402.02. Direct effects are the direct or immediate effects of an action on a listed species or its habitat.[1040]
Indirect effects are those that are “caused by the proposed action and are later in time, but still are reasonably certain to occur.”
Id.
To trigger the consultation requirement, there must thus be a causal connection between the federal action, the effect in question, and the listed species, and if the effect is indirect, it must be reasonably certain to occur.
The EPA notes that the projected environmental effects of this rule are positive: Reductions in overall GHG emissions, and reductions in PM and ozone-precursor emissions (SO2
and NOX). The EPA recognizes that beneficial effects to listed species can, as a general matter, result in a “may affect” determination under the ESA. However, the EPA's assessment that the rule will have an overall net positive environmental effect by virtue of reducing emissions of certain air pollutants does not address whether the rule may affect any listed species or designated critical habitat for ESA section 7(a)(2) purposes and does not constitute any finding of effects for that purpose. The fact that the rule will have overall positive effects on the national and global environment does not mean that the rule may affect any listed species in its habitat or the designated critical habitat of such species within the meaning of ESA section 7(a)(2) or the implementing regulations or require ESA consultation. The EPA has considered various types of potential effects in reaching the conclusion that ESA consultation is not required for this rule.
With respect to the projected GHG emission reductions, the EPA considered in detail in the proposal why such reductions do not trigger ESA consultation requirements under section 7(a)(2). As explained in the proposal, in reaching this conclusion the EPA was mindful of significant legal and technical analysis undertaken by FWS and the U.S. Department of the Interior (DOI) in the context of listing the polar bear as a threatened species under the ESA. In that context, in 2008, FWS and DOI expressed the view that the best scientific data available were insufficient to draw a causal connection between GHG emissions and effects on the species in its habitat.[1041]
The DOI Solicitor concluded that where the effect at issue is climate change, proposed actions involving GHG emissions cannot pass the “may affect” test of the section 7 regulations and thus are not subject to ESA consultation.
As described in the proposal, the EPA has also previously considered issues relating to GHG emissions in connection with the requirements of ESA section 7(a)(2) and has supplemented DOI's analysis with additional consideration of GHG modeling tools and data regarding listed species. Although the GHG emission reductions projected for this final rule are large (estimated reductions of about 415 million short tons of CO2
in 2030 relative to the base case under the rate-based illustrative plan approach—see Table 14 above), the EPA evaluated larger reductions in assessing this same issue in the context of the light-duty vehicle GHG emission standards for model years 2012-2016 and 2017-2025. There the agency projected emission reductions over the lifetimes of the model years in question [1042]
which are roughly five to six times those projected above and, based on air quality modeling of potential environmental effects, concluded that “EPA knows of no modeling tool which can link these small, time-attenuated changes in global metrics to particular effects on listed species in particular areas. Extrapolating from global metric to local effect with such small numbers, and accounting for further links in a causative chain, remain beyond current modeling capabilities.” [1043]
The EPA reached this conclusion after evaluating issues relating to potential improvements relevant to both temperature and oceanographic pH outputs. The EPA's ultimate finding was that “any potential for a specific impact on listed species in their habitats associated with these very small changes in average global temperature and ocean pH is too remote to trigger the threshold for ESA section 7(a)(2).”
Id.
The EPA believes that the same conclusion applies to the present rule.
See, e.g., Ground Zero Center for Non-Violent Action
v.
U.S. Dept. of Navy,
383 F. 3d 1082, 1091-92 (9th Cir. 2004) (where the likelihood of jeopardy to a species from a federal action is extremely remote, ESA does not require consultation). The EPA's conclusion is entirely consistent with DOI's analysis regarding ESA requirements in the
( printed page 64926)
context of federal actions involving GHG emissions.[1044]
With regard to non-GHG air emissions, the EPA also projects substantial reductions of SO2
and NOX
as a collateral consequence of this final action. However, CAA section 111(d)(1) standards cannot directly control emissions of criteria pollutants. See CAA section 111(d)(1)(i). Consequently, CAA section 111(d) provides no discretion to adjust the standard based on potential impacts to endangered species of reduced criteria pollutant emissions. Section 7(a)(2) consultation thus is not required with respect to the projected reductions of criteria pollutant emissions.
See50 CFR 402.03;
see also, WildEarth Guardians
v.
U.S. Envt'l Protection Agency,
759 F.3d 1196, 1207-10 (10th Cir. 2014) (EPA has no duty to consult under section 7(a)(2) of the ESA regarding hazardous air pollutant controls that it did not require—and likely lacked authority to require—in a federal implementation plan for regional haze controls under section 169A of the CAA).
Finally, the EPA has also considered other potential effects of the rule (beyond reductions in air pollutants) and whether any such effects are “caused by” the rule and “reasonably certain to occur” within the meaning of the ESA regulatory definition of the effects of an action. 50 CFR 402.02. As the EPA noted in the proposal, there are substantial questions as to whether any potential for relevant effects results from any element of the rule or would result instead from separate decisions and actions made in connection with the development, implementation, and enforcement of a plan to implement the standards established in the rule.
Cf. American Trucking Assn's
v.
EPA,
175 F. 3d 1027, 1043-45 (D.C. Cir. 1999),
rev'd on different grounds sub nom., Whitman
v.
American Trucking Assn's,
531 U.S. 457 (2000) (National Ambient Air Quality Standards have no economic impact, for purposes of Regulatory Flexibility Act, because impacts result from the actions of states through their development, implementation and enforcement of SIPs).[1045]
The EPA recognized, for instance, that questions may exist whether decisions such as increased utilization of solar or wind power could have effects on listed species. The EPA received comments on the proposal asserting that because potential increased reliance on wind or solar power may be an element of building block 3, and because wind and solar facilities may in some cases have effects on listed species, the EPA must consult under the ESA on this aspect of the rule. The EPA is also aware of certain questions regarding potential effects of the rule on the Big Bend Power Station located in Florida, which discharges effluent that provides a warm water refuge for manatees. The Big Bend Power Station and another coal-fired facility located in Florida—the Crystal River Plant—are, for example, referenced in the June 11, 2015, and June 15, 2015, congressional letters to EPA cited above.
The EPA has carefully considered the comments and the correspondence from Congress as well as the case law and other materials cited in those documents. The EPA does not believe that the effects of potential future changes in the energy sector—including increased reliance on wind or solar power as a result of future potential actions by states or other implementing entities—or any potential alterations in the operations of any particular facility are caused by the current rule or sufficiently certain to occur so as to require ESA consultation on the rule. The EPA appreciates that the ESA regulations call for consultation where actions authorized, funded, or carried out by federal agencies may have indirect effects on listed species or designated critical habitat. However, as noted above, indirect effects must be caused by the action at issue and must be reasonably certain to occur. At this point, there is no reasonable certainty regarding implementation of any planning measures in any location, let alone in any location occupied by a listed species or its designated critical habitat. The EPA cannot predict with reasonable certainty where such measures may take effect or which measures may be adopted. It is not clear, for instance, whether a particular implementation plan will call, if at all, for increased reliance on wind power, as opposed to solar power, or on some other form of low or zero carbon emitting generation. It is also entirely uncertain how a future implementation plan for a particular state might affect, if at all, operations at a specific facility.[1046]
The precise steps included in an implementation plan cannot be determined or ordered by this federal action, and they are not sufficiently certain to be attributable to this final rule for ESA purposes. These steps will flow from a series of later in time decisions generally made by other entities—usually states—in their
( printed page 64927)
distinct planning processes. These later decisions cannot now be required by the rule, are not caused by the rule, and are not reasonably certain to occur. The EPA also notes that the plans adopted for particular states may themselves provide wide degrees of implementation flexibility, thus further increasing the uncertainty that any species-impacting activity will occur in any particular location, if at all. The Services have explained that section 7(a)(2) was not intended to preclude federal actions based on potential future speculative effects.[1047]
These are precisely the types of speculative future activities and effects at issue here.[1048]
For this additional reason, the EPA concludes that the rule does not have effects on listed species that trigger the section 7(a)(2) consultation requirement.[1049]
C. What are the energy impacts?
The final guidelines have important energy market implications. Table 17 presents a variety of important energy market impacts for 2020, 2025, and 2030 under both the rate-based and mass-based illustrative plan approaches.
Table 17—Summary Table of Important Energy Market Impacts for Rate-Based and Mass-Based Illustrative Plan Approaches
[Percent change from base case]
Rate-based
Mass-based
2020
2025
2030
2020
2025
2030
Retail electricity prices
3
1
1
3
2
0
Price of coal at minemouth
−1
−5
−4
−1
−5
−3
Coal production for power sector use
−5
−14
−25
−7
−17
−24
Price of natural gas delivered to power sector
5
−8
2
4
−3
−2
Natural gas use for electricity generation
3
−1
−1
5
0
−4
These figures reflect the EPA's illustrative modeling that presumes policies that lead to generation shifts and growing use of demand-side EE and renewable electricity generation out to 2029. If states make different policy choices, impacts could be different. For instance, if states implement renewable and/or demand-side EE policies on a more aggressive time-frame, impacts on natural gas and electricity prices would likely be less. Implementation of other measures not included in the BSER calculation or compliance modeling, such as nuclear uprates, transmission system improvements, use of energy storage technologies or retrofit CCS, could also mitigate gas price and/or electricity price impacts.
Energy market impacts from the guidelines are discussed more extensively in the RIA found in the docket for this rulemaking.
D. What are the compliance costs?
The compliance costs of this final action are represented in this analysis as the change in electric power generation costs between the base case and the final rule in which states pursue a distinct set of strategies beyond the strategies taken in the base case to meet the terms of the final guidelines. The compliance costs estimates include cost estimates for demand-side EE. The compliance assumptions—and, therefore, the projected compliance costs—set forth in this analysis are illustrative in nature and do not represent the full suite of compliance flexibilities states may ultimately pursue. The illustrative analysis is designed to reflect, to the extent possible, the scope and the nature of the final guidelines. However, there is considerable uncertainty with regards to the precise measures that states will adopt to meet the final requirements, because there are considerable flexibilities afforded to the states in developing their state plans.
The incremental cost is the projected additional cost of complying with the guidelines in the year analyzed and includes the amortized cost of capital investment, needed new capacity, shifts between or amongst various fuels, deployment of demand-side EE programs, and other actions associated with compliance. These important
( printed page 64928)
dynamics are discussed in more detail in the RIA in the rulemaking docket.
The EPA estimates the annual incremental compliance cost for the rate-based approach for final emission guidelines to be $2.5 billion in 2020, $1.0 billion in 2025 and $8.4 billion in 2030, including the costs associated with monitoring, reporting, and recordkeeping (MR&R).[1050]
The EPA estimates the annual incremental compliance cost for the mass-based approach for final emission guidelines to be $1.4 billion in 2020, $3.0 billion in 2025 and $5.1 billion in 2030, including the costs associated with MR&R.
More detailed cost estimates are available in the RIA included in the rulemaking docket.
E. What are the economic and employment impacts?
The final standards are projected to result in certain changes to power system operation as a compliance with the standards. See Table 16 above for a variety of important energy market impacts for 2020, 2025, and 2030 under both the rate-based and mass-based illustrative plan approaches.
It is important to note that the EPA's modeling does not necessarily account for all of the factors that may influence business decisions regarding future coal-fired capacity. Many power companies already factor a potential financial liability associated with carbon emissions into their long term capacity planning that would further influence business decisions to replace these aging assets with modern, and significantly cleaner, generation.
The compliance modeling done to support the final rule assumes that overall electric demand will decrease as states ramp up programs that result in lower overall demand. Demand-side EE levels are expected to increase such that they achieve about a 7.8 percent reduction on overall electricity demand levels in 2030 under the final guidelines.
Changes in price or demand for electricity, natural gas, and coal can impact markets for goods and services produced by sectors that use these energy inputs in the production process or supply those sectors. Changes in the cost of production may result in changes in prices, quantities produced, and profitability of affected firms. The EPA recognizes that these guidelines provide significant flexibilities and states implementing the guidelines may choose to mitigate impacts to some markets outside the utility power sector. Similarly, demand for new generation or demand-side EE as a result of states implementing the guidelines can result in shifts in production and profitability for firms that supply those goods and services.
Executive Order 13563 directs federal agencies to consider the effect of regulations on job creation and employment. According to the Executive Order, “our regulatory system must protect public health, welfare, safety, and our environment while promoting economic growth, innovation, competitiveness, and job creation. It must be based on the best available science.” (Executive Order 13563, 2011) Although standard benefit-cost analyses have not typically included a separate analysis of regulation-induced employment impacts, we typically conduct employment analyses. While the economy continues moving toward full-employment, employment impacts are of particular concern and questions may arise about their existence and magnitude.
States have the responsibility and flexibility to implement policies and practices for compliance with the final guidelines. Quantifying the associated employment impacts is complicated by the wide range of approaches that states may use. As such, the EPA's employment analysis includes projected employment impacts associated with illustrative plan approaches for these guidelines for the electric power industry, coal and natural gas production, and demand-side EE activities. These projections are derived, in part, from a detailed model of the utility power sector used for this regulatory analysis, and U.S government data on employment and labor productivity. In the electricity, coal, and natural gas sectors, the EPA estimates that these guidelines could result in a net decrease of approximately 25,000 job-years in 2025 for the final guidelines under the rate-based illustrative plan approach and approximately 26,000 job-years in 2025 under the mass-based approach. For 2030, the estimates of the net decrease in job-years are 31,000 under the rate-based approach and 34,000 under the mass-based approach. The agency is also offering an illustrative calculation of potential employment effects due to demand-side EE programs. Employment impacts from demand-side energy EE programs in 2030 could range from approximately 52,000 to 83,000 jobs under the final guidelines.
By its nature, demand-side EE reduces overall demand for electric power. The EPA recognizes as more efficiency is built into the U.S. power system over time, lower fuel requirements may lead to fewer jobs in the coal and natural gas extraction sectors, as well as in fossil-fuel fired EGU construction and operation than would otherwise have been expected. The EPA also recognizes the fact that, in many cases, employment gains and losses that might be attributable to this rule would be expected to affect different sets of people. Moreover, workers who lose jobs in these sectors may find employment elsewhere just as workers employed in new jobs in these sectors may have been previously employed elsewhere. Therefore, the employment estimates reported in these sectors may include workers previously employed elsewhere. This analysis also does not capture potential economy-wide impacts due to changes in prices (of fuel, electricity, labor, for example) or other factors such as improved labor productivity and reduced health care expenditures resulting from cleaner air. For these reasons, the numbers reported here should not be interpreted as a net national employment impact.
F. What are the benefits of the final goals?
Implementing the final standards will generate benefits by reducing emissions of CO2
and criteria pollutant precursors, including SO2, NOX, and directly-emitted particles. SO2
and NOX
are precursors to PM2.5
(particles smaller than 2.5 microns), and NOX
is a precursor to ozone. The estimated benefits associated with these emission reductions are beyond those achieved by previous EPA rulemakings including the Mercury and Air Toxics Standards rule. The health and welfare benefits from reducing air pollution are considered co-benefits for these standards. For this rulemaking, we were only able to quantify the climate benefits from reduced emissions of CO2
and the health co-benefits associated with reduced exposure to PM2.5
and ozone. There are many additional benefits which we are not able to quantify, leading to an underestimate of monetized benefits. In summary, we estimate the total combined climate benefits and health co-benefits for the rate-based approach to be $3.5 to $4.6 billion in 2020, $18 to $28 billion in 2025, and $34 to $54 billion in 2030 (3 percent discount rate, 2011$). Total combined climate benefits and health co-benefits for the mass-based approach are estimated to be $5.3 to $8.1 billion in 2020, $19 to $29 billion in 2025, and
( printed page 64929)
$32 to $48 billion in 2030 (3 percent discount rate, 2011$). A summary of the emission reductions and monetized benefits estimated for this rule at all discount rates is provided in Tables 15 through 22 of this preamble.
Table 18—Summary of the Monetized Global Climate Benefits for the Final Guidelines
[Billions of 2011$] a
Year
Discount rate
(statistic)
Monetized climate benefits
2020
2025
2030
Rate-based Approach
CO2
Reductions (million short tons)
69
232
415
5 percent (average SC-CO2)
$0.80
$3.1
$6.4
3 percent (average SC-CO2)
$2.8
$10
$20
2.5 percent (average SC-CO2)
$4.1
$15
$29
3 percent (95th percentile SC-CO2)
$8.2
$31
$61
Mass-based Approach
CO2
Reductions (million short tons)
81
265
413
5 percent (average SC-CO2)
$0.94
$3.6
$6.4
3 percent (average SC-CO2)
$3.3
$12
$20
2.5 percent (average SC-CO2)
$4.9
$17
$29
3 percent (95th percentile SC-CO2)
$9.7
$35
$60
a
Climate benefit estimates reflect impacts from CO2
emission changes in the analysis years presented in the table and do not account for changes in non-CO2
GHG emissions. These estimates are based on the global social cost of carbon (SC-CO2) estimates for the analysis years and are rounded to two significant figures.
Table 19—Summary of the Monetized Health Co-Benefits in the U.S. for the Final Guidelines, Rate-based Approach
[Billions of 2011$] a
Pollutant
National
emission
reductions
(thousands of short tons)
Monetized health
co-benefits
(3 percent
discount)
Monetized Health
Co-benefits
(7 percent
discount)
Final Guidelines, Rate-based Approach, 2020
PM2.5
precursors: b
SO2
14
$0.44 to $0.99
$0.39 to $0.89
NOX
50
$0.14 to $0.33
$0.13 to $0.30
Ozone precursor: c
NOX
(ozone season only)
19
$0.12 to $0.52
$0.12 to $0.52
Total Monetized Health Co-benefits
$0.70 to $1.8
$0.64 to $1.7
Total Monetized Health Co-benefits combined with Monetized Climate Benefits d
$3.5 to $4.6
$3.5 to $4.5
Final Guidelines, Rate-based Approach, 2025
PM2.5
precursors: b
SO2
178
$6.4 to $14
$5.7 to $13
NOX
165
$0.56 to $1.3
$0.50 to $1.1
Ozone precursor: c
NOX
(ozone season only)
70
$0.49 to $2.1
$0.49 to $2.1
Total Monetized Health Co-benefits
$7.4 to $18
$6.7 to $16
Total Monetized Health Co-benefits combined with Monetized Climate Benefits d
$18 to $28
$17 to $26
Final Guidelines, Rate-based Approach, 2030
PM2.5
precursors: b
SO2
318
$12 to $28
$11 to $25
NOX
282
$1.0 to $2.3
$0.93 to $2.1
Ozone precursor: c
NOX
(ozone season only)
118
$0.86 to $3.7
$0.86 to $3.7
Total Monetized Health Co-benefits
$14 to $34
$13 to $31
Total Monetized Health Co-benefits combined with Monetized Climate Benefits. d
$34 to $54
$33 to $51
a
All estimates are rounded to two significant figures, so estimates may not sum. It is important to note that the monetized co-benefits do not include reduced health effects from direct exposure to SO2, direct exposure to NO2, exposure to mercury, ecosystem effects or visibility impairment. Air pollution health co-benefits are estimated using regional benefit-per-ton estimates for the contiguous U.S.
( printed page 64930)
b
The monetized PM2.5
co-benefits reflect the human health benefits associated with reducing exposure to PM2.5
through reductions of PM2.5
precursors, such as SO2
and NOX
. The co-benefits do not include the benefits of reductions in directly emitted PM2.5. These additional benefits would increase overall benefits by a few percent based on the analyses conducted for the proposed rule. PM co-benefits are shown as a range reflecting the use of two concentration-response functions, with the lower end of the range based on a function from Krewski et al. (2009) and the upper end based on a function from Lepeule et al. (2012). These models assume that all fine particles, regardless of their chemical composition, are equally potent in causing premature mortality because the scientific evidence is not yet sufficient to allow differentiation of effect estimates by particle type.
c
The monetized ozone co-benefits reflect the human health benefits associated with reducing exposure to ozone through reductions of NOX
during the ozone season. Ozone co-benefits are shown as a range reflecting the use of several different concentration-response functions, with the lower end of the range based on a function from Bell, et al. (2004) and the upper end based on a function from Levy, et al. (2005). Ozone co-benefits occur in the analysis year, so they are the same for all discount rates.
d
We estimate climate benefits associated with four different values of a one ton CO2
reduction (model average at 2.5 percent discount rate, 3 percent, and 5 percent; 95th percentile at 3 percent). Referred to as the social cost of carbon, each value increases over time. For the purposes of this table, we show the benefits associated with the model average at 3 percent discount rate, however we emphasize the importance and value of considering the full range of social cost of carbon values. We provide combined climate and health estimates based on additional discount rates in the RIA.
Table 20—Summary of the Monetized Health Co-Benefits in the U.S. for the Final Guidelines, Mass-based Approach
[Billions of 2011$] a
Pollutant
National
emission
reductions
(thousands of short tons)
Monetized health
co-benefits
(3 percent
discount)
Monetized health
co-benefits
(7 percent
discount)
Final Guidelines, Mass-based Approach, 2020
PM2.5
precursors: b
SO2
54
$1.7 to $3.8
$1.5 to $3.4
NOX
60
$0.17 to $0.39
$0.16 to $0.36
Ozone precursor: c
NOX
(ozone season only)
23
$0.14 to $0.61
$0.14 to $0.61
Total Monetized Health Co-benefits
$2.0 to $4.8
$1.8 to $4.4
Total Monetized Health Co-benefits combined with Monetized Climate Benefits d
$5.3 to $8.1
$5.1 to $7.7
Final Guidelines, Mass-based Approach, 2025
PM2.5
precursors: b
SO2
185
$6.0 to $13
$5.4 to $12
NOX
203
$0.58 to $1.3
$0.52 to $1.2
Ozone precursor: c
NOX
(ozone season only)
88
$0.56 to $2.4
$0.56 to $2.4
Total Monetized Health Co-benefits
$7.1 to $17
$6.5 to $16
Total Monetized Health Co-benefits combined with Monetized Climate Benefits d
$19 to $29
$18 to $27
Final Guidelines, Mass-based Approach, 2030
PM2.5
precursors: b
SO2
280
$10 to $23
$9.0 to $20
NOX
278
$0.87 to $2.0
$0.79 to $1.8
Ozone precursor: c
NOX
(ozone season only)
121
$0.82 to $3.5
$0.82 to $3.5
Total Monetized Health Co-benefits
$12 to $28
$11 to $26
Total Monetized Health Co-benefits combined with Monetized Climate Benefits d
$32 to $48
$31 to $46
a
All estimates are rounded to two significant figures, so estimates may not sum. It is important to note that the monetized co-benefits do not include reduced health effects from direct exposure to SO2, direct exposure to NO2, exposure to mercury, ecosystem effects or visibility impairment. Air pollution health co-benefits are estimated using regional benefit-per-ton estimates for the contiguous U.S.
b
The monetized PM2.5
co-benefits reflect the human health benefits associated with reducing exposure to PM2.5
through reductions of PM2.5
precursors, such as SO2
and NOX
. The co-benefits do not include the benefits of reductions in directly emitted PM2.5. These additional benefits would increase overall benefits by a few percent based on the analyses conducted for the proposed rule. PM co-benefits are shown as a range reflecting the use of two concentration-response functions, with the lower end of the range based on a function from Krewski et al. (2009) and the upper end based on a function from Lepeule et al. (2012). These models assume that all fine particles, regardless of their chemical composition, are equally potent in causing premature mortality because the scientific evidence is not yet sufficient to allow differentiation of effect estimates by particle type.
c
The monetized ozone co-benefits reflect the human health benefits associated with reducing exposure to ozone through reductions of NOX
during the ozone season. Ozone co-benefits are shown as a range reflecting the use of several different concentration-response functions, with the lower end of the range based on a function from Bell, et al. (2004) and the upper end based on a function from Levy, et al. (2005). Ozone co-benefits occur in the analysis year, so they are the same for all discount rates.
d
We estimate climate benefits associated with four different values of a one ton CO2
reduction (model average at 2.5 percent discount rate, 3 percent, and 5 percent; 95th percentile at 3 percent). Referred to as the social cost of carbon, each value increases over time. For the purposes of this table, we show the benefits associated with the model average at 3 percent discount rate, however we emphasize the importance and value of considering the full range of social cost of carbon values. We provide combined climate and health estimates based on additional discount rates in the RIA.
( printed page 64931)
The EPA has used the social cost of carbon (SC-CO2) estimates presented in the
Technical Support Document: Technical Update of the Social Cost of Carbon for Regulatory Impact Analysis Under Executive Order 12866 (May 2013, Revised June 2015)
(“current TSD”) to analyze CO2
climate impacts of this rulemaking.[1051]
We refer to these estimates, which were developed by the U.S. Government, as “SC-CO2
estimates.” The SC-CO2
is a metric that estimates the monetary value of impacts associated with marginal changes in CO2
emissions in a given year. It includes a wide range of anticipated climate impacts, such as net changes in agricultural productivity and human health, property damage from increased flood risk, and changes in energy system costs, such as reduced costs for heating and increased costs for air conditioning. It is typically used to assess the avoided damages as a result of regulatory actions (
i.e.,
benefits of rulemakings that lead to an incremental reduction in cumulative global CO2
emissions).
The SC-CO2
estimates used in this analysis were developed over many years, using the best science available, and with input from the public. Specifically, an interagency working group (IWG) that included the EPA and other executive branch agencies and offices used three integrated assessment models (IAMs) to develop the SC-CO2
estimates and recommended four global values for use in regulatory analyses. The SC-CO2
estimates were first released in February 2010 and updated in 2013 using new versions of each IAM. The 2010 SC-CO2
Technical Support Document (2010 TSD) [1052]
provides a complete discussion of the methods used to develop these estimates and the current TSD presents and discusses the 2013 update (including two recent minor corrections to the estimates).[1053]
The EPA received numerous comments on the SC-CO2
estimates as part of this rulemaking. The comments covered a wide range of topics including the technical details of the modeling conducted to develop the SC-CO2
estimates, the aggregation and presentation of the SC-CO2
estimates, and the process by which the SC-CO2
estimates were derived. Many but not all commenters were supportive of the SC-CO2
and its application to this rulemaking. Commenters also provided constructive recommendations for potential opportunities to improve the SC-CO2
estimates in future updates. Many of these comments were similar to those that OMB's Office of Information and Regulatory Affairs received in response to a separate request for public comment on the approach used to develop the estimates. After careful evaluation of the full range of comments submitted to OMB, the IWG continues to recommend the use of the SC-CO2
estimates in regulatory impact analysis.[1054]
With the release of the response to comments, the IWG announced plans to obtain expert independent advice from the National Academies of Sciences, Engineering, and Medicine (Academies) to ensure that the SC-CO2
estimates continue to reflect the best available scientific and economic information on climate change. The Academies review will be informed by the public comments received and focus on the technical merits and challenges of potential approaches to improving the SC-CO2
estimates in future updates. See the EPA Response to Comments document for the complete response to comments received on SC-CO2
as part of this rulemaking.
Concurrent with OMB's publication of the response to comments on SC-CO2
and announcement of the Academies process, OMB posted a revised TSD that includes two minor technical corrections to the current estimates. One technical correction addressed an inadvertent omission of climate change damages in the last year of analysis (2300) in one model and the second addressed a minor indexing error in another model. On average the revised SC-CO2
estimates are one dollar less than the mean SC-CO2
estimates reported in the November 2013 revision to the May 2013 TSD. The change in the estimates associated with the 95th percentile estimates when using a 3 percent discount rate is slightly larger, as those estimates are heavily influenced by the results from the model that was affected by the indexing error.
The EPA, as a member of the IWG on the SC-CO2, has carefully examined and evaluated the minor technical corrections in the revised TSD and the public comments submitted to OMB's separate SC-CO2
comment process. Additionally, the EPA has carefully examined and evaluated all comments received regarding the SC-CO2
through this rulemaking process. The EPA concurs with the IWG's conclusion that it is reasonable, and scientifically appropriate, to use the current SC-CO2
estimates for purposes of regulatory impact analysis, including for this proceeding.
The four SC-CO2
estimates are as follows: $12, $40, $60, and $120 per short ton of CO2
emissions in the year 2020 (2011$).[1055]
The first three values are based on the average SC-CO2
from the three IAMs, at discount rates of 5, 3, and 2.5 percent, respectively. The SC-CO2
value at several discount rates are included because the literature shows that the SC-CO2
is quite sensitive to assumptions about the discount rate, and because no consensus exists on the appropriate rate to use in an intergenerational context (where costs and benefits are incurred by different generations). The fourth value is the 95th percentile of the SC-CO2
from all three models at a 3 percent discount
( printed page 64932)
rate. It is included to represent higher-than-expected impacts from temperature change further out in the tails of the SC-CO2
distribution (representing less likely, but potentially catastrophic, outcomes).
There are limitations in the estimates of the benefits from the final emission guidelines, including the omission of climate and other CO2
related benefits that could not be monetized. The 2010 TSD discusses a number of limitations to the SC-CO2
analysis, including the incomplete way in which the IAMs capture catastrophic and non-catastrophic impacts, their incomplete treatment of adaptation and technological change, uncertainty in the extrapolation of damages to high temperatures, and assumptions regarding risk aversion. Currently, IAMs do not assign value to all of the important impacts of CO2
recognized in the literature, such as ocean acidification or potential tipping points, for various reasons, including the inherent difficulties in valuing non-market impacts and the fact that the science incorporated into these models understandably lags behind the most recent research. Nonetheless, these estimates and the discussion of their limitations represent the best available information about the social benefits of CO2
emission reductions to inform the benefit-cost analysis. As previously noted, the IWG plans to seek independent expert advice on technical opportunities to improve the SC-CO2
estimates from the Academies. The Academies process will help to ensure that the SC-CO2
estimates used by the federal government continue to reflect the best available science and methodologies. Additional details are provided in the TSDs.
The health co-benefits estimates represent the total monetized human health benefits for populations exposed to reduced PM2.5
and ozone resulting from emission reductions from the illustrative compliance strategy for the final standards. Unlike the global SC-CO2
estimates, the air pollution health co-benefits are estimated for the contiguous U.S. only. We used a “benefit-per-ton” approach to estimate the benefits of this rulemaking. To create the PM2.5
benefit-per-ton estimates, we conducted air quality modeling for an illustrative scenario reflecting the proposed standards to convert precursor emissions into changes in ambient PM2.5
and ozone concentrations. We then used these air quality modeling results in BenMAP [1056]
to calculate average regional benefit-per-ton estimates using the health impact assumptions used in the PM NAAQS RIA [1057]
and Ozone NAAQS RIAs.[1058 1059]
The three regions were the Eastern U.S., Western U.S., and California. To calculate the co-benefits for the final standards, we multiplied the regional benefit-per-ton estimates generated from modeling of the proposed standards by the corresponding regional emission reductions for the final standards.[1060]
All benefit-per-ton estimates reflect the geographic distribution of the modeled emissions for the proposed standards, which may not exactly match the emission reductions in this final rulemaking, and thus they may not reflect the local variability in population density, meteorology, exposure, baseline health incidence rates, or other local factors for any specific location. More information regarding the derivation of the benefit-per-ton estimates is available in the RIA.
PM benefit-per-ton values are generated using two concentration-response functions, Krewski et al. (2009) [1061]
and Lepeule et al. (2012).[1062]
These models assume that all fine particles, regardless of their chemical composition, are equally potent in causing premature mortality because the scientific evidence is not yet sufficient to allow differentiation of effect estimates by particle type. Even though we assume that all fine particles have equivalent health effects, the benefit-per-ton estimates vary between PM2.5
precursors depending on the location and magnitude of their impact on PM2.5
concentrations, which drive population exposure.
It is important to note that the magnitude of the PM2.5
and ozone co-benefits is largely driven by the concentration response functions for premature mortality and the value of a statistical life used to value reductions in premature mortality. For PM2.5, we use two key empirical studies, one based on the American Cancer Society cohort study (Krewski et al., 2009) and one based on the extended Six Cities cohort study (Lepuele et al., 2012). We present the PM2.5
co-benefits results as a range based on benefit-per-ton estimates calculated using the concentration-response functions from these two epidemiology studies, but this range does not capture the full range of uncertainty inherent in the co-benefits estimates. In the RIA for this rule, which is available in the docket, we also include PM2.5
co-benefits estimates using benefit-per-ton estimates based on expert judgments of the effect of PM2.5
on premature mortality (Roman et al., 2008) [1063]
as a characterization of uncertainty regarding the PM2.5
-mortality relationship.
For the ozone co-benefits, we present the results as a range reflecting benefit-per-ton estimates which use several different concentration-response functions for mortality, with the lower end of the range based on a benefit-per-ton estimate using the function from Bell et al. (2004) [1064]
and the upper end based on a benefit-per-ton estimate using the function from Levy et al. (2005).[1065]
Similar to PM2.5, the range of ozone co-benefits does not capture the full range of inherent uncertainty.
In this analysis, in estimating the benefits-per-ton for PM2.5
precursors,
( printed page 64933)
the EPA assumes that the health impact function for fine particles is without a threshold. This is based on the conclusions of EPA's
Integrated Science Assessment for Particulate Matter,[1066]
which evaluated the substantial body of published scientific literature, reflecting thousands of epidemiology, toxicology, and clinical studies that documents the association between elevated PM2.5
concentrations and adverse health effects, including increased premature mortality. This assessment, which was twice reviewed by the EPA's independent Science Advisory Board, concluded that the scientific literature consistently finds that a no-threshold model most adequately portrays the PM-mortality concentration-response relationship.
In general, we are more confident in the magnitude of the risks we estimate from simulated PM2.5
concentrations that coincide with the bulk of the observed PM concentrations in the epidemiological studies that are used to estimate the benefits. Likewise, we are less confident in the risk we estimate from simulated PM2.5
concentrations that fall below the bulk of the observed data in these studies.
For this analysis, policy-specific air quality data are not available,[1067]
and thus, we are unable to estimate the percentage of premature mortality associated with this specific rule that is above the lowest measured PM2.5
levels (LML) for the two PM2.5
mortality epidemiology studies that form the basis for our analysis. As a surrogate measure of mortality impacts above the LML, we provide the percentage of the population exposed above the lowest measured PM2.5
level (LML) in each of the two studies, using the estimates of baseline projected PM2.5
from the air quality modeling for the proposed guidelines used to calculate the benefit-per-ton estimates for the EGU sector. Using the Krewski et al. (2009) study, 88 percent of the population is exposed to annual mean PM2.5
levels at or above the LML of 5.8 micrograms per cubic meter (μg/m3
). Using the Lepeule et al. (2012) study, 46 percent of the population is exposed above the LML of 8 μg/m3
. It is important to note that baseline exposure is only one parameter in the health impact function, along with baseline incidence rates, population, and change in air quality.
Every benefit analysis examining the potential effects of a change in environmental protection requirements is limited, to some extent, by data gaps, model capabilities (such as geographic coverage) and uncertainties in the underlying scientific and economic studies used to configure the benefit and cost models. Despite these uncertainties, we believe the air quality co-benefit analysis for this rule provides a reasonable indication of the expected health benefits of the air pollution emission reductions for the illustrative analysis of the final standards under a set of reasonable assumptions. This analysis does not include the type of detailed uncertainty assessment found in the 2012 PM2.5
National Ambient Air Quality Standard (NAAQS) RIA (U.S. EPA, 2012) because we lack the necessary air quality input and monitoring data to conduct a complete benefits assessment. In addition, using a benefit-per-ton approach adds another important source of uncertainty to the benefits estimates. The 2012 PM2.5
NAAQS benefits analysis provides an indication of the sensitivity of our results to various assumptions.
We note that the monetized co-benefits estimates shown here do not include several important benefit categories, including exposure to SO2, NOX, and hazardous air pollutants (
e.g.,
mercury and hydrogen chloride), as well as ecosystem effects and visibility impairment. Although we do not have sufficient information or modeling available to provide monetized estimates for this rule, we include a qualitative assessment of these unquantified benefits in the RIA for the final guidelines. In addition, in the RIA for the final standards, we did not estimate changes in emissions of directly emitted particles. As a result, quantified PM2.5
related benefits are underestimated by a relatively small amount. In the RIA for the proposed guidelines, the benefits from reductions in directly emitted PM2.5
were less than 10 percent of total monetized health co-benefits across all scenarios and years.
For more information on the benefits analysis, please refer to the RIA for this rule, which is available in the rulemaking docket.
This final action is an economically significant regulatory action that was submitted to the OMB for review. Any changes made in response to OMB recommendations have been documented in the docket. The EPA prepared an analysis of the potential costs and benefits associated with this action. This analysis, which is contained in the “Regulatory Impact Analysis for Clean Power Plan Final Rule” (EPA-452/R-15-003, July 2015), is available in the docket and is briefly summarized in section XI of this preamble.
Consistent with Executive Order 12866 and Executive Order 13563, the EPA estimated the costs and benefits for illustrative compliance approaches of implementing the guidelines. The final rule establishes: (1) Carbon dioxide (CO2) emission performance rates for two source categories of existing fossil fuel-fired EGUs, fossil fuel-fired electric utility steam generating units and stationary combustion turbines, and (2) guidelines for the development, submittal and implementation of state plans that implement the CO2
emission performance rates. Actions taken to comply with the guidelines will also reduce the emissions of directly-emitted PM2.5, SO2
and NOX
. The benefits associated with these PM2.5, SO2
and NOX
reductions are referred to as co-benefits, as these reductions are not the primary objective of this rule.
The EPA has used the social cost of carbon estimates presented in the
Technical Support Document: Technical Update of the Social Cost of Carbon for Regulatory Impact Analysis Under Executive Order 12866 (May 2013, Revised July 2015)
(“current TSD”) to analyze CO2
climate impacts of this rulemaking. We refer to these estimates, which were developed by the U.S. government, as “SC-CO2
estimates.” The SC-CO2
is an estimate of the monetary value of impacts associated with a marginal change in CO2
emissions in a given year. The four SC-CO2
estimates are associated with different discount rates (model average at 2.5 percent discount rate, 3 percent, and 5 percent; 95th percentile at 3 percent), and each increases over time. In this summary, the EPA provides the estimate of climate benefits associated with the SC-CO2
value deemed to be central in the current TSD: The model average at 3 percent discount rate.
In the final emission guidelines, the EPA has translated the source category-
( printed page 64934)
specific CO2
emission performance rates into equivalent state-level rate-based and mass-based CO2
goals in order to maximize the range of choices that states will have in developing their plans. Because of the range of choices available to states and the lack of
a priori
knowledge about the specific choices states will make in response to the final goals, the Regulatory Impact Analysis (RIA) for this rule analyzed two implementation scenarios designed to achieve these goals, which we term the “rate-based” illustrative plan approach and the “mass-based” illustrative plan approach.
It is very important to note that the differences between the analytical results for the rate-based and mass-based illustrative plan approaches presented in the RIA may not be indicative of likely differences between the approaches if implemented by states and affected EGUs in response to the final guidelines. Rather, the two sets of analyses are intended to illustrate two different approaches to accomplish the emission performance rates finalized in the Clean Power Plan Final Rule. In other words, if one approach performs differently than the other on a given metric during a given time period, this does not imply this will apply in all instances in all time periods in all places.
The EPA estimates that, in 2020, the final guidelines will yield monetized climate benefits (in 2011$) of approximately $2.8 billion for the rate-based approach and $3.3 billion for the mass-based approach (3 percent model average). For the rate-based approach, the air pollution health co-benefits in 2020 are estimated to be $0.7 billion to $1.8 billion (2011$) for a 3 percent discount rate and $0.64 billion to $1.7 billion (2011$) for a 7 percent discount rate. For the mass-based approach, the air pollution health co-benefits in 2020 are estimated to be $2.0 billion to $4.8 billion (2011$) for a 3 percent discount rate and $1.8 billion to $4.4 billion (2011$) for a 7 percent discount rate. The annual, illustrative compliance costs estimated by IPM and inclusive of demand-side EE program and participant costs and MRR costs in 2020, are approximately $2.5 billion for the rate-based approach and $1.4 billion for the mass-based approach (2011$). The quantified net benefits (the difference between monetized benefits and compliance costs) in 2020 are estimated to range from $1.0 billion to $2.1 billion (2011$) for the rate-based approach and from $3.9 billion to 6.7 billion (2011$) for the mass-based approach, using a 3 percent discount rate (model average).
The EPA estimates that, in 2025, the final guidelines will yield monetized climate benefits (in 2011$) of approximately $10 billion for the rate-based approach and $12 billion for the mass-based approach (3 percent model average). For the rate-based approach, the air pollution health co-benefits in 2025 are estimated to be $7.4 billion to $18 billion (2011$) for a 3 percent discount rate and $6.7 billion to $16 billion (2011$) for a 7 percent discount rate. For the mass-based approach, the air pollution health co-benefits in 2025 are estimated to be $7.1 billion to $17 billion (2011$) for a 3 percent discount rate and $6.5 billion to $16 billion (2011$) for a 7 percent discount rate. The annual, illustrative compliance costs estimated by IPM and inclusive of demand-side EE program and participant costs and MRR costs in 2025, are approximately $1.0 billion for the rate-based approach and $3.0 billion for the mass-based approach (2011$). The quantified net benefits (the difference between monetized benefits and compliance costs) in 2025 are estimated to range from $17 billion to $27 billion (2011$) for the rate-based approach and $16 billion to $26 billion (2011$) for the mass-based approach, using a 3 percent discount rate (model average).
The EPA estimates that, in 2030, the final guidelines will yield monetized climate benefits (in 2011$) of approximately $20 billion for the rate-based approach and $20 billion for the mass-based approach (3 percent model average). For the rate-based approach, the air pollution health co-benefits in 2030 are estimated to be $14 billion to $34 billion (2011$) for a 3 percent discount rate and $13 billion to $31 billion (2011$) for a 7 percent discount rate. For the mass-based approach, the air pollution health co-benefits in 2030 are estimated to be $12 billion to $28 billion (2011$) for a 3 percent discount rate and $11 billion to $26 billion (2011$) for a 7 percent discount rate. The annual, illustrative compliance costs estimated by IPM and inclusive of demand-side EE program and participant costs and MRR costs in 2030, are approximately $8.4 billion for the rate-based approach and $5.1 billion for the mass-based approach (2011$). The quantified net benefits (the difference between monetized benefits and compliance costs) in 2030 are estimated to range from $26 billion to $45 billion (2011$) for the rate-based approach and from $26 billion to $43 billion (2011$) for the mass-based approach, using a 3 percent discount rate (model average).
Tables 20 and 21 provide the estimates of the climate benefits, health co-benefits, compliance costs and net benefits of the final emission guidelines for rate-based and mass-based illustrative plan approaches, respectively.
Table 21—Summary of the Monetized Benefits, Compliance Costs, and Net Benefits for the Final Guidelines in 2020, 2025 and 2030 Under the Rate-Based Illustrative Plan Approach
[Billions of 2011$] a
Rate-based approach
2020
2025
2030
Climate Benefits b
5% discount rate
$0.80
$3.1
$6.4
3% discount rate
$2.8
$10
$20
2.5% discount rate
$4.1
$15
$29
95th percentile at 3% discount rate
$8.2
$31
$61
Air Quality Co-benefits Discount Rate
3%
7%
3%
7%
3%
7%
Air Quality Health Co-benefits c
$0.70 to $1.8
$0.64 to $1.7
$7.4 to $18
$6.7 to $16
$14 to $34
$13 to $31
Compliance Costs d
$2.5
$1.0
$8.4
( printed page 64935)
Net Benefits e
$1.0 to $2.1
$1.0 to $2.0
$17 to $27
$16 to $25
$26 to $45
$25 to $43
Non-Monetized Benefits
Non-monetized climate benefits.
Reductions in exposure to ambient NO2
and SO2.
Reductions in mercury deposition.
Ecosystem benefits associated with reductions in emissions of NOX, SO2, PM, and mercury.
Visibility impairment.
a
All are rounded to two significant figures, so figures may not sum.
b
The climate benefit estimate in this summary table reflects global impacts from CO2
emission changes and does not account for changes in non-CO2
GHG emissions. Also, different discount rates are applied to SC-CO2
than to the other estimates because CO2
emissions are long-lived and subsequent damages occur over many years. The benefit estimates in this table are based on the average SC-CO2
estimated for a 3 percent discount rate. However, we emphasize the importance and value of considering the full range of SC-CO2
values. As shown in the RIA, climate benefits are also estimated using the other three SC-CO2
estimates (model average at 2.5 percent discount rate, 3 percent, and 5 percent; 95th percentile at 3 percent). The SC-CO2
estimates are year-specific and increase over time.
c
The air pollution health co-benefits reflect reduced exposure to PM2.5
and ozone associated with emission reductions of SO2
and NOX
. The range reflects the use of concentration-response functions from different epidemiology studies. The co-benefits do not include the benefits of reductions in directly emitted PM2.5
. These additional benefits would increase overall benefits by a few percent based on the analyses conducted for the proposed rule. The reduction in premature fatalities each year accounts for over 98 percent of total monetized co-benefits from PM2.5
and ozone. These models assume that all fine particles, regardless of their chemical composition, are equally potent in causing premature mortality because the scientific evidence is not yet sufficient to allow differentiation of effect estimates by particle type.
d
Total costs are approximated by the illustrative compliance costs estimated using the Integrated Planning Model for the final guidelines and a discount rate of approximately 5 percent. This estimate includes monitoring, recordkeeping, and reporting costs and demand-side EE program and participant costs.
e
The estimates of net benefits in this summary table are calculated using the global SC-CO2
at a 3 percent discount rate (model average). The RIA includes combined climate and health estimates based on additional discount rates.
Table 22—Summary of the Monetized Benefits, Compliance Costs, and Net Benefits for the Final Guidelines in 2020, 2025 and 2030 Under the Mass-Based Illustrative Plan Approach
[Billions of 2011$] a
Mass-based approach
2020
2025
2030
Climate Benefits b
5% discount rate
$0.9
$3.6
$6.4
3% discount rate
$3.3
$12
$20
2.5% discount rate
$4.9
$17
$29
95th percentile at 3% discount rate
$9.7
$35
$60
Air Quality Co-benefits Discount Rate
3%
7%
3%
7%
3%
7%
Air Quality Health Co-benefits c
$2.0 to $4.8
$1.8 to $4.4
$7.1 to $17
$6.5 to $16
$12 to $28
$11 to $26
Compliance Costs d
$1.4
$3.0
$5.1
Net Benefits e
$3.9 to $6.7
$3.7 to $6.3
$16 to $26
$15 to $24
$26 to $43
$25 to $40
Non-Monetized Benefits
Non-monetized climate benefits.
Reductions in exposure to ambient NO2
and SO2.
Reductions in mercury deposition.
Ecosystem benefits associated with reductions in emissions of NOX, SO2, PM, and mercury.
Visibility improvement.
a
All are rounded to two significant figures, so figures may not sum.
b
The climate benefit estimate in this summary table reflects global impacts from CO2
emission changes and does not account for changes in non-CO2
GHG emissions. Also, different discount rates are applied to SC-CO2
than to the other estimates because CO2
emissions are long-lived and subsequent damages occur over many years. The benefit estimates in this table are based on the average SC-CO2
estimated for a 3 percent discount rate. However, we emphasize the importance and value of considering the full range of SC-CO2
values. As shown in the RIA, climate benefits are also estimated using the other three SC-CO2
estimates (model average at 2.5 percent discount rate, 3 percent, and 5 percent; 95th percentile at 3 percent). The SC-CO2
estimates are year-specific and increase over time.
c
The air pollution health co-benefits reflect reduced exposure to PM2.5
and ozone associated with emission reductions of SO2
and NOX
. The co-benefits do not include the benefits of reductions in directly emitted PM2.5
. These additional benefits would increase overall benefits by a few percent based on the analyses conducted for the proposed rule. The range reflects the use of concentration-response functions from different epidemiology studies. The reduction in premature fatalities each year accounts for over 98 percent of total monetized co-benefits from PM2.5
and ozone. These models assume that all fine particles, regardless of their chemical composition, are equally potent in causing premature mortality because the scientific evidence is not yet sufficient to allow differentiation of effect estimates by particle type.
d
Total costs are approximated by the illustrative compliance costs estimated using the Integrated Planning Model for the final guidelines and a discount rate of approximately 5 percent. This estimate includes monitoring, recordkeeping, and reporting costs and demand-side EE program and participant costs.
e
The estimates of net benefits in this summary table are calculated using the global SC-CO2
at a 3 percent discount rate (model average). The RIA includes combined climate and health estimates based on additional discount rates.
There are additional important benefits that the EPA could not monetize. Due to current data and modeling limitations, our estimates of the benefits from reducing CO2
emissions do not include important impacts like ocean acidification or potential tipping points in natural or managed ecosystems. Unquantified
( printed page 64936)
benefits also include climate benefits from reducing emissions of non-CO2
GHGs (
e.g.,
nitrous oxide and methane) and co-benefits from reducing direct exposure to SO2, NOX
and hazardous air pollutants (
e.g.,
mercury), as well as from reducing ecosystem effects and visibility impairment. Based upon the foregoing discussion, it remains clear that the benefits of this final action are substantial, and far exceed the costs. Additional details on benefits, costs, and net benefits estimates are provided in this RIA.
B. Paperwork Reduction Act (PRA)
The information collection requirements in this rule have been submitted for approval to OMB under the PRA. The Information Collection Request (ICR) document prepared by the EPA has been assigned the EPA ICR number 2503.02. You can find a copy of the ICR in the docket for this rule, and it is briefly summarized here. The information collection requirements are not enforceable until OMB approves them.
This rule does not directly impose specific requirements on EGUs located in states or areas of Indian country. The rule also does not impose specific requirements on tribal governments that have affected EGUs located in their area of Indian country. For areas of Indian country, the rule establishes CO2
emission performance goals that could be addressed through either tribal or federal plans. A tribe would have the opportunity under the Tribal Authority Rule (TAR), but not the obligation, to apply to the EPA for Treatment as State (TAS) for purposes of a CAA section 111(d) plan and, if approved by the EPA, to establish a CAA section 111(d) plan for its area of Indian country. To date, no tribe has requested or obtained TAS eligibility for purposes of a CAA section 111(d) plan. For areas of Indian country with affected EGUs where a tribe has not applied for TAS and submitted any needed plan, if the EPA determines that a CAA section 111(d) plan is necessary or appropriate, the EPA would have the responsibility to establish the plans. Because tribes are not required to implement section 111(d) plans and because no tribe has yet sought TAS eligibility for this purpose, this action is not anticipated to impose any information collection burden on tribal governments over the 3-year period covered by this ICR.
This rule does impose specific requirements on state governments with affected EGUs. The information collection requirements are based on the recordkeeping and reporting burden associated with developing, implementing, and enforcing a plan to limit CO2
emissions from existing sources in the utility power sector. These recordkeeping and reporting requirements are specifically authorized by CAA section 114 (42 U.S.C. 7414). All information submitted to the EPA pursuant to the recordkeeping and reporting requirements for which a claim of confidentiality is made is safeguarded according to agency policies set forth in 40 CFR part 2, subpart B.
The annual burden for this collection of information for the states (averaged over the first 3 years following promulgation) is estimated to be a range of 505,000 to 821,000 hours at a total annual labor cost of $35.8 to $58.1 million. The lower bound estimate reflects the assumption that some states already have EE and RE programs in place. The higher bound estimate reflects the overly-conservative assumption that no states have EE and RE programs in place.
The total annual burden for the federal government associated with the state collection of information (averaged over the first 3 years following promulgation) is estimated to be 54,000 hours at a total annual labor cost of $3.00 million. Burden is defined at 5 CFR 1320.3(b).
An agency may not conduct or sponsor, and a person is not required to respond to, a collection of information unless it displays a currently valid OMB control number. The OMB control numbers for the EPA's regulations in 40 CFR are listed in 40 CFR part 9. When OMB approves this ICR, the agency will announce that approval in the
Federal Register
and publish a technical amendment to 40 CFR part 9 to display the OMB control number for the approved information collection activities contained in this final rule.
C. Regulatory Flexibility Act (RFA)
I certify that this action will not have a significant economic impact on a substantial number of small entities under the RFA. This action will not impose any requirements on small entities. Specifically, emission guidelines established under CAA section 111(d) do not impose any requirements on regulated entities and, thus, will not have a significant economic impact upon a substantial number of small entities. After emission guidelines are promulgated, states establish emission standards on existing sources, and it is those requirements that could potentially impact small entities.
Our analysis here is consistent with the analysis of the analogous situation arising when the EPA establishes NAAQS, which do not impose any requirements on regulated entities. As here, any impact of a NAAQS on small entities would only arise when states take subsequent action to maintain and/or achieve the NAAQS through their SIPs. See
American Trucking Assoc.
v.
EPA,
175 F.3d 1029, 1043-45 (D.C. Cir. 1999) (NAAQS do not have significant impacts upon small entities because NAAQS themselves impose no regulations upon small entities).
Nevertheless, the EPA is aware that there is substantial interest in the rule among small entities and, as detailed in section III.A of the preamble to the proposed carbon pollution emission guidelines for existing EGUs (79 FR 34845-34847; June 18, 2014) and in section II.D of the preamble to the proposed carbon pollution emission guidelines for existing EGUs in Indian Country and U.S. Territories (79 FR 65489; November 4, 2014), has conducted an unprecedented amount of stakeholder outreach. As part of that outreach, agency officials participated in many meetings with individual utilities and electric utility associations, as well as industry leaders and trade association representatives from various industries. While formulating the provisions of the rule, the EPA considered the input provided over the course of the stakeholder outreach as well as the input provided in the many public comments.
D. Unfunded Mandates Reform Act (UMRA)
This action does not contain an unfunded mandate of $100 million or more as described in UMRA, 2 U.S.C. 1531-1538, and does not significantly or uniquely affect small governments. The emission guidelines do not impose any direct compliance requirements on EGUs located in states or areas of Indian country. As explained in section XII.B above, the rule also does not impose specific requirements on tribal governments that have affected EGUs located in their area of Indian country. The rule does impose specific requirements on state governments that have affected EGUs. Specifically, states are required to develop plans to implement the guidelines under CAA section 111(d) for affected EGUs. The burden for states to develop CAA section 111(d) plans in the 3-year period following promulgation of the rule was estimated and is listed in section XII.B above, but this burden is estimated to be below $100 million in any one year. Thus, this rule is not subject to the requirements of section 202 or section 205 of the UMRA.
( printed page 64937)
This rule is also not subject to the requirements of section 203 of UMRA because it contains no regulatory requirements that might significantly or uniquely affect small governments. Specifically, the state governments to which rule requirements apply are not considered small governments.
In light of the interest among governmental entities, the EPA conducted outreach with national organizations representing state and local elected officials and tribal governmental entities while formulating the provisions of this rule. Sections III.A and XI.F of the preamble to the proposed carbon pollution emission guidelines for existing EGUs (79 FR 34845-34847; June 18, 2014) and sections II.D and VI.F of the preamble to the proposed carbon pollution emission guidelines for existing EGUs in areas of Indian Country and U.S. Territories (79 FR 65489; November 4, 2014) describes the extensive stakeholder outreach the EPA has conducted on setting emission guidelines for existing EGUs. The EPA considered the input provided over the course of the stakeholder outreach as well as the input provided in the many public comments when developing the provisions of these emission guidelines.
The EPA has concluded that this action may have federalism implications, pursuant to agency policy for implementing the Order, because it imposes substantial direct compliance costs on state or local governments, and the federal government will not provide the funds necessary to pay those costs. As discussed in the Supporting Statement found in the docket for this rulemaking, the development of state plans will entail many hours of staff time to develop and coordinate programs for compliance with the rule, as well as time to work with state legislatures as appropriate, to develop a plan submittal. Consistent with this determination, the EPA provides the following federalism summary impact statement.
The EPA consulted with state and local officials early in the process of developing the proposed action to permit them to have meaningful and timely input into its development. As described in the Federalism discussion in the preamble to the proposed standards of performance for GHG emissions from new EGUs (79 FR 1501; January 8, 2014), the EPA consulted with state and local officials in the process of developing the proposed standards for newly constructed EGUs. This outreach addressed planned actions for new, reconstructed, modified and existing sources. The EPA invited the following 10 national organizations representing state and local elected officials to a meeting on April 12, 2011, in Washington, DC: (1) National Governors Association; (2) National Conference of State Legislatures, (3) Council of State Governments, (4) National League of Cities, (5) U.S. Conference of Mayors, (6) National Association of Counties, (7) International City/County Management Association, (8) National Association of Towns and Townships, (9) County Executives of America, and (10) Environmental Council of States. The National Association of Clean Air Agencies also participated. On February 26, 2014, the EPA re-engaged with those governmental entities to provide a pre-proposal update on the emission guidelines for existing EGUs and emission standards for modified and reconstructed EGUs. In addition, as described in section III.A of the preamble to the proposed carbon pollution emission guidelines for existing EGUs (79 FR 34845-34847; June 18, 2014), extensive stakeholder outreach conducted by the EPA allowed state leaders, including governors, state attorneys general, environmental commissioners, energy officers, public utility commissioners, and air directors, opportunities to engage with EPA officials and provide input regarding reducing carbon pollution from power plants.
In the spirit of Executive Order 13132, and consistent with the EPA's policy to promote communications between the EPA and state and local governments, the EPA specifically solicited comment on the proposed action from state and local officials. The EPA received comments from over 400 entities representing state and local governments.
Several themes emerged from state and local government comments. Commenters raised concerns with the building blocks that comprise the best system of emission reduction (BSER), including the stringency of the building blocks, and the timing of achieving interim CO2
levels. They also identified the potential for electric system reliability issues and stranded assets due to the proposed timeframe for plan submittals and CO2
emission reductions. In addition, states commented on state plan development and implementation topics, including state plan approaches, early actions, trading programs, interstate crediting for RE, and EPA guidance and outreach.
Commenters identified overarching concerns regarding the stringency of the CO2
goals and the timeframe for achieving reductions that encompassed the building blocks, the BSER, and associated timing for achievement of interim CO2
levels. State commenters, in particular, identified changes to the stringency of the building blocks, concerns with the timeframe over which reductions must be achieved, and concerns with the approaches and measures used for the BSER. For the final rule, in response to stakeholder comments, the EPA has made refinements to the building blocks, the period of time over which measures are deployed, and the stringency of emission limitations that those measures can achieve in a practical and reasonable cost way. The final BSER reflects those refinements.
To many commenters, the proposal's 2020 compliance date, together with the stringency of the interim CO2
goal, bore significant reliability implications. In this final rule, the agency is addressing those concerns via adjustments to the compliance timeframe (an 8-year interim period that begins in 2022) and to the approach for meeting interim CO2
emission performance rates (a glide path separated into three steps, 2022-2024, 2025-2027, and 2028-2029), as well as a more gradual phase in of the emission reduction expectations. These adjustments provide more time for planning, consultation and decision making in the formulation of state plans and in EGUs' choices of compliance strategies. The final rule also retains flexibilities presented in the proposal and offers additional opportunities, including opportunities for trading within and between states, and other multi-state compliance approaches that will further support electric system reliability. The EPA is also requiring each state to demonstrate in its final state that it has considered electric system reliability issues in developing its plan—and is providing the time to do so. Even with this foundation of flexibility in place, these final guidelines further provide states with the option of proposing amendments to approved plans in the event that unanticipated and significant reliability challenges arise.
Commenters provided compelling information indicating that it will take longer than the agency initially anticipated to for states to complete the tasks necessary to finalize a state plan, including administrative and potential legislative processes. Recognizing this, as well as the urgent need for actions to reduce GHG emissions, the EPA is requiring states to make an initial submittal by September 6, 2016, and is allowing states two additional years to
( printed page 64938)
submit a final plan, if justified (to be submitted by September 6, 2018).
States commented on state plan development and implementation topics that included state plan approaches, early actions being taken into account, trading programs being allowed, interstate crediting for RE being allowed, and guidance and outreach being provided by the EPA. For the state plan approaches, commenters expressed concerns with the proposed “portfolio approach” for state plans, including concerns with enforceability of requirements, and identified a “state commitment approach” with backstop measures as an option for state plans. In this final rule, in response to stakeholder comments on the portfolio approach and alternative approaches, the EPA is finalizing a “state measures” approach that includes a requirement for the inclusion of backstop measures.
State commenters supported providing incentives for states and utilities to deploy CO2
-reducing investments, such as RE and demand-side EE measures, as early as possible. The EPA recognizes the value of such early actions, and in this final rule is establishing the CEIP to provide opportunities for investment in RE and demand-side EE projects that deliver results in 2020 and/or 2021.
Many state commenters supported the use of mass-based and rate-based emission trading programs in state plans, including interstate emission trading programs. The EPA also received a number of comments from states and stakeholders about the value of EPA support in developing and/or administering tracking systems to support state administration of rate-based and mass-based emission trading programs. In this final rule, states may use trading or averaging approaches and technologies or strategies that are not explicitly mentioned in any of the three building blocks as part of their overall plans, as long as they achieve the required emission reductions from affected fossil-fuel-fired EGUs. In addition, in response to concerns from states and power companies that the need for up-front interstate cooperation in developing multi-state plans could inhibit the development of interstate programs that could lower cost, the final rule provides additional options to allow individual EGUs to use creditable out-of-state reductions to achieve required CO2
reductions, without the need for up-front interstate agreements. The EPA is committed to working with states to provide support for tracking of emissions and allowances or credits, to help implement multi-state trading or averaging approaches.
In their comments, many states identified the need for the EPA to provide guidance, including guidance on RE and EE emission measurement and verification (EM&V), and to maintain regular contact/forums with states throughout the implementation process. To provide state and local governments and other stakeholders with an understanding of the rule requirements, and to provide efficiencies where possible and reduce the cost and administrative burden, the EPA will continue outreach throughout the plan development and submittal process. Outreach will include opportunities for states to participate in briefings, teleconferences, and meetings about the final rule. The EPA's 10 regional offices will continue to be the entry point for states and tribes to ask technical and policy questions. The agency will host (or partner with appropriate groups to co-host) a number of webinars about various components of the final rule during the first two months after the final rule is issued. The EPA will use information from this outreach process to inform the training and other tools that will be of most use to the states and tribes that are implementing the final rule. The EPA expects to issue guidance on specific topics, including evaluation, measurement and verification (EM&V) for RE and demand-side EE, state-community engagement, and resources and financial assistance for RE and demand-side EE. As guidance documents, tools, templates and other resources become available, the EPA, in consultation with the U.S. Department of Energy and other federal agencies, will continue to make these resources available via a dedicated Web site.
A list of the state and local government commenters has been provided to OMB and has been placed in the docket for this rulemaking. In addition, the detailed response to comments from these entities is contained in the EPA's response to comments document on this final rulemaking, which has also been placed in the docket for this rulemaking.
As required by section 8(a) of Executive Order 13132, the EPA included a certification from its Federalism Official stating that the EPA had met the Executive Order's requirements in a meaningful and timely manner when it sent the draft of this final action to OMB for review pursuant to Executive Order 12866. A copy of the certification is included in the public version of the official record for this final action.
F. Executive Order 13175: Consultation and Coordination With Indian Tribal Governments
This action has tribal implications. However, it will neither impose substantial direct compliance costs on federally recognized tribal governments, nor preempt tribal law. Tribes are not required to develop or adopt CAA programs, but they may apply to the EPA for treatment in a manner similar to states (TAS) and, if approved, do so. As a result, tribes are not required to develop plans to implement the guidelines under CAA section 111(d) for affected EGUs in their areas of Indian country. To the extent that a tribal government seeks and attains TAS status for that purpose, these emission guidelines would require that planning requirements be met and emission management implementation plans be executed by the tribes. The EPA notes that this rule does not directly impose specific requirements on affected EGUs, including those located in areas of Indian country, but provides guidance to any tribe approved by the EPA to address CO2
emissions from EGUs subject to section 111(d) of the CAA. The EPA also notes that none of the affected EGUs are owned or operated by tribal governments.
As described in sections III.A and XI.F of the preamble to the proposed carbon pollution emission guidelines for existing EGUs (79 FR 34845-34847; June 18, 2014) and sections II.D and VI.F of the preamble to the proposed carbon pollution emission guidelines for existing EGUs in Indian Country and U.S. Territories (79 FR 65489; November 4, 2014), the rule was developed after extensive and vigorous outreach to tribal governments. These tribes expressed varied points of view. Some tribes raised concerns about the impacts of the regulations on EGUs located in their areas of Indian country and the subsequent impact on jobs and revenue for their tribes. Other tribes expressed concern about the impact the regulations would have on the cost of water covered under treaty to their communities as a result of increased costs to the EGU that provide energy to transport the water to the tribes. Other tribes raised concerns about the impacts of climate change on their communities, resources, ways of life and hunting and treaty rights. The tribes were also interested in the scope of the guidelines being considered by the agency (
e.g.,
over what time period, relationship to state and multi-state plans) and how tribes will participate in these planning activities.
( printed page 64939)
The EPA consulted with tribal officials under the EPA Policy on Consultation and Coordination with Indian Tribes early in the process of developing this action to permit them to have meaningful and timely input into its development. A summary of that consultation follows.
Prior to issuing the supplemental proposal on November 4, 2014, the EPA consulted with tribes as follows. The EPA held a consultation with the Ute Tribe, the Crow Nation, and the Mandan, Hidatsa, Arikara (MHA) Nation on July 18, 2014. On August 22, 2014, the EPA held a consultation with the Fort Mojave Tribe. On September 15, 2014, the EPA held a consultation with the Navajo Nation. The Navajo Nation sent a letter to the EPA on September 18, 2014, summarizing the information presented at the consultation and the Navajo Nation's position on the supplemental proposal. One issue raised by tribal officials was the potential impacts of the June 18, 2014 proposal and the supplemental proposal on tribes with budgets that are dependent on revenue from coal mines and power plants, as well as employment at the mines and power plants. The tribes noted the high unemployment rates and lack of access to basic services on their lands. Tribal officials also asked whether the rules will have any impact on a tribe's ability to seek TAS. Tribal officials also expressed interest in agency actions with regard to facilitating power plant compliance with regulatory requirements. The Navajo Nation made the following recommendations in their letter of September 18, 2014: The Navajo Nation supports a mass-based CO2
emission standard based on the highest historical CO2
emissions since 1996; the Navajo Nation requests that the EPA grant the Navajo Nation carbon credits and that the Navajo Nation retains ownership and control of such credits; building block 2 is not appropriate for the Navajo Nation because there are no NGCC plants located on the Navajo Nation; building block 3 is not appropriate for the Navajo Nation because the Navajo people already receive virtually all of their electricity from carbon-free sources (mostly hydroelectric power) and their use of electricity is negligible compared to the generation at the power plants; building block 4 is not appropriate for the Navajo Nation because of the inadequate access to electricity, and the goal should allow for an increase in energy consumption on the Navajo Nation; the supplemental proposal should consider the useful life of the power plants located on the Navajo Nation; and the supplemental proposal should clarify that RE projects located within the Navajo Nation that provide electricity outside the Navajo Nation should be counted toward meeting the relevant state's RE goals under the Clean Power Plan.
After issuing the supplemental proposal, the EPA held additional consultation with tribes. On November 18, 2014, the EPA held consultations with the following tribes: Fort McDowell Yavapai Nation, Fort Mojave Tribe, Hopi Tribe, Navajo Nation, and Ak-Chin Indian Community. A consultation with the Ute Indian Tribe of the Uintah and Ouray Reservation was held on December 16, 2014 and with the Gila River Indian Community on January 15, 2015. The Navajo Nation reiterated the concerns raised during the previous consultation. Several tribes also again indicated that they wanted to ensure they would be included in the development of any tribal or federal plans for areas of Indian country. The Fort Mojave Tribe and the Navajo Nation expressed concern with using data from 2012 as the basis for the goal for their areas of Indian country; in their view, that year was not representative for the affected EGU. On April 28, 2015, the EPA held an additional consultation with the Navajo Nation. The issues raised by the Navajo Nation during the consultation included whether the EPA has the authority to set less stringent standards on a case-by-case basis, and a suggested “parity glide path” that would account and adjust for the very low electricity usage by the Navajo Nation and promote Navajo Nation economic growth and demand. Furthermore, on July 7, 2015 the EPA conducted an additional consultation with the Navajo Nation. One of the goals of the consultation was for the new government of the Navajo Nation to deepen their understanding of the rulemaking. The questions raised by the nation had to do with goal setting and carbon credits, the timing of the rulemaking, and the proposed federal plan. Additionally, on July 14, 2015 the EPA conducted an additional consultation with the Fort Mojave Tribe. The Fort Mojave tribes expressed concerns that 2012 is not a representative year, that natural gas-fired combined cycle power plants should be treated differently from coal-fired power plants, and that the proposed goal for Fort Mojave was not appropriate. Additionally, they also expressed interest in being engaged in the federal plan process. Responses to these comments and others received are available in the Response to Comment Document that is in the docket for this rulemaking. As required by section 7(a), the EPA's Tribal Consultation Official has certified that the requirements of the executive order have been met in a meaningful and timely manner. A copy of the certification is included in the docket for this action.
G. Executive Order 13045: Protection of Children From Environmental Health Risks and Safety Risks
This action is subject to Executive Order 13045 (62 FR 19885, April 23, 1997) because it is an economically significant regulatory action as defined by Executive Order 12866, and the EPA believes that the environmental health or safety risk addressed by this action has a disproportionate effect on children. Accordingly, the agency has evaluated the environmental health and welfare effects of climate change on children.
CO2
is a potent GHG that contributes to climate change and is emitted in significant quantities by fossil fuel-fired power plants. The EPA believes that the CO2
emission reductions resulting from implementation of these final guidelines, as well as substantial ozone and PM2.5
emission reductions as a co-benefit, will further improve children's health.
The assessment literature cited in the EPA's 2009 Endangerment Finding concluded that certain populations and lifestages, including children, the elderly, and the poor, are most vulnerable to climate-related health effects. The assessment literature since 2009 strengthens these conclusions by providing more detailed findings regarding these groups' vulnerabilities and the projected impacts they may experience.
These assessments describe how children's unique physiological and developmental factors contribute to making them particularly vulnerable to climate change. Impacts to children are expected from heat waves, air pollution, infectious and waterborne illnesses, and mental health effects resulting from extreme weather events. In addition, children are among those especially susceptible to most allergic diseases, as well as health effects associated with heat waves, storms, and floods. Additional health concerns may arise in low income households, especially those with children, if climate change reduces food availability and increases prices, leading to food insecurity within households.
More detailed information on the impacts of climate change to human health and welfare is provided in section II.A of this preamble.
( printed page 64940)
H. Executive Order 13211: Actions Concerning Regulations That Significantly Affect Energy Supply, Distribution, or Use
This action, which is a significant regulatory action under EO 12866, is likely to have a significant effect on the supply, distribution, or use of energy. The EPA has prepared a Statement of Energy Effects for this action as follows. We estimate a 1 to 2 percent change in retail electricity prices on average across the contiguous U.S. in 2025, and a 22 to 23 percent reduction in coal-fired electricity generation as a result of this rule. The EPA projects that utility power sector delivered natural gas prices will increase by up to 2.5 percent in 2030. For more information on the estimated energy effects, please refer to the economic impact analysis for this proposal. The analysis is available in the RIA, which is in the public docket.
I. National Technology Transfer and Advancement Act (NTTAA)
This rulemaking does not involve technical standards.
J. Executive Order 12898: Federal Actions To Address Environmental Justice in Minority Populations and Low-Income Populations
Executive Order 12898 (59 FR 7629; February 16, 1994) establishes federal executive policy on environmental justice. Its main provision directs federal agencies, to the greatest extent practicable and permitted by law, to make environmental justice part of their mission by identifying and addressing, as appropriate, disproportionately high and adverse human health or environmental effects of their programs, policies, and activities on minority populations and low-income populations in the U.S. The EPA defines environmental justice as the fair treatment and meaningful involvement of all people regardless of race, color, national origin, or income with respect to the development, implementation, and enforcement of environmental laws, regulations, and policies. The EPA has this goal for all communities and persons across this Nation. It will be achieved when everyone enjoys the same degree of protection from environmental and health hazards and equal access to the decision-making process to have a healthy environment in which to live, learn, and work.
Leading up to this rulemaking the EPA summarized the public health and welfare effects of GHG emissions in its 2009 Endangerment Finding. See, section VIII.A of this preamble where the EPA summarizes the public health and welfare impacts from GHG emissions that were detailed in the 2009 Endangerment Finding under CAA section 202(a)(1).[1068]
As part of the Endangerment Finding, the Administrator considered climate change risks to minority populations and low-income populations, finding that certain parts of the population may be especially vulnerable based on their characteristics or circumstances. Populations that were found to be particularly vulnerable to climate change risks include the poor, the elderly, the very young, those already in poor health, the disabled, those living alone, and/or indigenous populations dependent on one or a few resources. See sections XII.F and XII.G, above, where the EPA discusses Consultation and Coordination with Tribal Governments and Protection of Children. The Administrator placed weight on the fact that certain groups, including children, the elderly, and the poor, are most vulnerable to climate-related health effects.
The record for the 2009 Endangerment Finding summarizes the strong scientific evidence in the major assessment reports by the U.S. Global Change Research Program (USGCRP), the Intergovernmental Panel on Climate Change (IPCC), and the National Research Council (NRC) of the National Academies that the potential impacts of climate change raise environmental justice issues. These reports concluded that poor communities can be especially vulnerable to climate change impacts because they tend to have more limited adaptive capacities and are more dependent on climate-sensitive resources such as local water and food supplies. In addition, Native American tribal communities possess unique vulnerabilities to climate change, particularly those impacted by degradation of natural and cultural resources within established reservation boundaries and threats to traditional subsistence lifestyles. Tribal communities whose health, economic well-being, and cultural traditions that depend upon the natural environment will likely be affected by the degradation of ecosystem goods and services associated with climate change. The 2009 Endangerment Finding record also specifically noted that Southwest native cultures are especially vulnerable to water quality and availability impacts. Native Alaskan communities are already experiencing disruptive impacts, including coastal erosion and shifts in the range or abundance of wild species crucial to their livelihoods and well-being.
The most recent assessments continue to strengthen scientific understanding of climate change risks to minority populations and low-income populations in the U.S.[1069]
The new assessment literature provides more detailed findings regarding these populations' vulnerabilities and projected impacts they may experience. In addition, the most recent assessment reports provide new information on how some communities of color (more specifically, populations defined jointly by ethnic/racial characteristics and geographic location) may be uniquely vulnerable to climate change health impacts in the U.S. These reports find that certain climate change related impacts—including heat waves, degraded air quality, and extreme weather events—have disproportionate effects on low-income populations and some communities of color, raising environmental justice concerns. Existing health disparities and other inequities in these communities increase their vulnerability to the health effects of climate change. In addition, assessment reports also find that climate change poses particular threats to health, well-being, and ways of life of indigenous peoples in the U.S.
As the scientific literature presented above and as the 2009 Endangerment Finding illustrates, low income populations and some communities of color are especially vulnerable to the health and other adverse impacts of climate change. The EPA believes that communities will benefit from this final rulemaking because this action directly addresses the impacts of climate change
( printed page 64941)
by limiting GHG emissions through the establishment of CO2
emission guidelines for existing affected fossil fuel-fired EGUs.
In addition to reducing CO2
emissions, the guidelines finalized in this rulemaking would reduce other emissions from affected EGUs that reduce generation due to higher adoption of EE and RE. These emission reductions will include SO2
and NOX, which form ambient PM2.5
and ozone in the atmosphere, and HAP, such as mercury and hydrochloric acid. In the final rule revising the annual PM2.5
NAAQS,[1070]
the EPA identified low-income populations as being a vulnerable population for experiencing adverse health effects related to PM exposures. Low-income populations have been generally found to have a higher prevalence of pre-existing diseases, limited access to medical treatment, and increased nutritional deficiencies, which can increase this population's susceptibility to PM-related effects.[1071]
In areas where this rulemaking reduces exposure to PM2.5, ozone, and methylmercury, low-income populations will also benefit from such emissions reductions. The RIA for this rulemaking, included in the docket for this rulemaking, provides additional information regarding the health and ecosystem effects associated with these emission reductions.
Additionally, as outlined in the community and environmental justice considerations section IX of this preamble, the EPA has taken a number of actions to help ensure that this action will not have potential disproportionately high and adverse human health or environmental effects on overburdened communities. The EPA consulted its May 2015,
Guidance on Considering Environmental Justice During the Development of Regulatory Actions,
when determining what actions to take.[1072]
As described in the community and environmental justice considerations section of this preamble the EPA also conducted a proximity analysis, which is available in the docket of this rulemaking and is discussed in section IX. Additionally, as outlined in sections I and IX of this preamble, the EPA has engaged with communities throughout this rulemaking and has devised a robust outreach strategy for continual engagement throughout the implementation phase of this rulemaking.
K. Congressional Review Act (CRA)
This final action is subject to the CRA, and the EPA will submit a rule report to each House of the Congress and to the Comptroller General of the United States. This action is a “major rule” as defined by 5 U.S.C. 804(2).
XIII. Statutory Authority
The statutory authority for this action is provided by sections 111, 301, 302, and 307(d)(1)(C) of the CAA as amended (42 U.S.C. 7411, 7601, 7602, 7607(d)(1)(C)). This action is also subject to section 307(d) of the CAA (42 U.S.C. 7607(d)).
This subpart establishes emission guidelines and approval criteria for State or multi-State plans that establish emission standards limiting greenhouse gas (GHG) emissions from an affected steam generating unit, integrated gasification combined cycle (IGCC), or stationary combustion turbine. An affected steam generating unit, IGCC, or stationary combustion turbine shall, for the purposes of this subpart, be referred to as an affected EGU. These emission guidelines are developed in accordance with section 111(d) of the Clean Air Act and subpart B of this part. To the extent any requirement of this subpart is inconsistent with the requirements of subparts A or B of this part, the requirements of this subpart will apply.
(a) The pollutants regulated by this subpart are greenhouse gases. The emission guidelines for greenhouse gases established in this subpart are expressed as carbon dioxide (CO2) emission performance rates and equivalent statewide CO2
emission goals.
(b) PSD and Title V Thresholds for Greenhouse Gases.
(1) For the purposes of § 51.166(b)(49)(ii), with respect to GHG emissions from facilities, the “pollutant that is subject to the standard promulgated under section 111 of the Act” shall be considered to be the pollutant that otherwise is subject to regulation under the Act as defined in § 51.166(b)(48) and in any State Implementation Plan (SIP) approved by the EPA that is interpreted to incorporate, or specifically incorporates, § 51.166(b)(48) of this chapter.
(2) For the purposes of § 52.21(b)(50)(ii), with respect to GHG emissions from facilities regulated in the plan, the “pollutant that is subject to the standard promulgated under section 111 of the Act” shall be considered to be the pollutant that otherwise is subject to regulation under the Act as defined in § 52.21(b)(49) of this chapter.
(3) For the purposes of § 70.2 of this chapter, with respect to greenhouse gas emissions from facilities regulated in the plan, the “pollutant that is subject to any standard promulgated under section 111 of the Act” shall be considered to be the pollutant that otherwise is “subject to regulation” as defined in § 70.2 of this chapter.
(4) For the purposes of § 71.2, with respect to greenhouse gas emissions from facilities regulated in the plan, the “pollutant that is subject to any standard promulgated under section 111 of the Act” shall be considered to be the pollutant that otherwise is “subject to regulation” as defined in § 71.2 of this chapter.
If you are the Governor of a State in the contiguous United States with one or more affected EGUs that commenced construction on or before January 8, 2014, you must submit a State or multi-State plan to the U.S. Environmental Protection Agency (EPA) that implements the emission guidelines contained in this subpart. If you are the Governor of a State in the contiguous United States with no affected EGUs for which construction commenced on or before January 8, 2014, in your State, you must submit a negative declaration letter in place of the State plan.
What is the review and approval process for my plan?
The EPA will review your plan according to § 60.27 except that under § 60.27(b) the Administrator will have 12 months after the date the final plan or plan revision (as allowed under § 60.5785) is submitted, to approve or disapprove such plan or revision or each portion thereof. If you submit an initial submittal under § 60.5765(a) in lieu of a final plan submittal the EPA will follow the procedure in § 60.5765(b).
What if I do not submit a plan or my plan is not approvable?
(a) If you do not submit an approvable plan the EPA will develop a Federal plan for your State according to § 60.27. The Federal plan will implement the emission guidelines contained in this subpart. Owners and operators of affected EGUs not covered by an approved plan must comply with a Federal plan implemented by the EPA for the State.
(b) After a Federal plan has been implemented in your State, it will be withdrawn when your State submits, and the EPA approves, a final plan.
In lieu of a State plan submittal, are there other acceptable option(s) for a State to meet its CAA section 111(d) obligations?
A State may meet its CAA section 111(d) obligations only by submitting a final State or multi-State plan submittal or a negative declaration letter (if applicable).
Is there an approval process for a negative declaration letter?
No. The EPA has no formal review process for negative declaration letters. Once your negative declaration letter has been received, the EPA will place a copy in the public docket and publish a notice in the
Federal Register
. If, at a later date, an affected EGU for which construction commenced on or before January 8, 2014 is found in your State, you will be found to have failed to submit a final plan as required, and a Federal plan implementing the emission guidelines contained in this subpart, when promulgated by the EPA, will apply to that affected EGU until you submit, and the EPA approves, a final State plan.
What authorities will not be delegated to State, local, or tribal agencies?
The authorities that will not be delegated to State, local, or tribal agencies are specified in paragraphs (a) and (b) of this section.
(a) Approval of alternatives, not already approved by this subpart, to the CO2
emission performance rates in Table 1 to this subpart established under § 60.5855.
(b) Approval of alternatives, not already approved by this subpart, to the CO2
emissions goals in Tables 2, 3 and 4 to this subpart established under § 60.5855.
No. The EPA will not withhold any existing federal funds from a State on account of a State's failure to submit, implement, or enforce an approvable plan or plan revision, or to meet any other requirements under this subpart or subpart B of this part.
What is the Clean Energy Incentive Program and how do I participate?
(a) This subpart establishes the Clean Energy Incentive Program (CEIP). Participation in this program is optional. The program enables States to award early action emission rate credits (ERCs) and allowances to eligible renewable energy (RE) or demand-side energy efficiency (EE) projects that generate megawatt hours (MWh) or reduce end-use energy demand during 2020 and/or 2021. Eligible projects are those that:
(1) Are located in or benefit a state that has submitted a final state plan that includes requirements establishing its participation in the CEIP; and
(2) Commence construction in the case of RE, or commence operation in the case of demand-side EE, following the submission of a final state plan to the EPA, or after September 6, 2018 for a state that chooses not to submit a final state plan by that date; and either
(3) Generate metered MWh from any type of wind or solar resources; or
(4) Result in quantified and verified electricity savings (MWh) through demand-side EE implemented in low-income communities.
(b) The EPA will award matching ERCs or allowances to States that award early action ERCs or allowances, up to a match limit equivalent to 300 million tons of CO2
emissions. The awards will be executed as follows:
(1) For RE projects that generate metered MWh from wind or solar resources: For every two MWh generated, the project will receive one early action ERC (or the equivalent number of allowances) from the State, and the EPA will provide one matching ERC (or the equivalent number of allowances) to the State to award to the project.
(2) For EE projects implemented in low-income communities: For every two MWh in end-use demand savings achieved, the project will receive two early action ERCs (or the equivalent number of allowances) from the State, and the EPA will provide two matching ERCs (or the equivalent number of allowances) to the State to award to the project.
(c) You may participate in this program by including in your State plan a mechanism that enables issuance of early action ERCs or allowances by the State to parties effectuating reductions in the calendar years 2020 and/or 2021 in a manner that would have no impact on the emission performance of affected EGUs required to meet rate-based or mass-based emission standards during the performance periods. This mechanism is not required to account for matching ERCs or allowances that may be issued to the State by the EPA.
(d) If you are submitting an initial submittal by September 6, 2016, and you intend to participate in the CEIP, you must include a non-binding statement of intent to participate in the program. If you are submitting a final plan by September 6, 2016, and you intend to participate in the CEIP, your State plan must either include requirements establishing the necessary infrastructure to implement such a program and authorizing your affected EGUs to use early action allowances or ERCs as appropriate, or you must include a non-binding statement of intent as part of your supporting documentation and revise your plan to include the appropriate requirements at a later date.
(e) If you intend to participate in the CEIP, your final State plan, or plan revision if applicable, must require that projects eligible under this program be evaluated, monitored, and verified, and that resulting ERCs or allowances be issued, per applicable requirements of the State plan approved by the EPA as meeting § 60.5805 through § 60.5835.
What must I include in my federally enforceable State or multi State plan?
(a) You must include the components described in paragraphs (a)(1) through (5) of this section in your plan submittal. The final plan must meet the requirements and include the information required under § 60.5745.
(1)
Identification of affected EGUs.
Consistent with § 60.25(a), you must identify the affected EGUs covered by your plan and all affected EGUs in your State that meet the applicability criteria in § 60.5845. In addition, you must include an inventory of CO2
emissions from the affected EGUs during the most recent calendar year for which data is available prior to the submission of the plan.
(2)
Emission standards.
You must include an identification of all emission standards for each affected EGU according to § 60.5775, compliance periods for each emission standard according to § 60.5770, and a demonstration that the emission standards, when taken together, achieve the applicable CO2
emission performance rates or CO2
emission goals described in § 60.5855. Allowance systems are an acceptable form of emission standards under this subpart.
(i) Your plan does not need to include corrective measures specified in paragraph (a)(2)(ii) of this section if your plan:
(A) Imposes emission standards on all affected EGUs that, assuming full compliance by all affected EGUs, mathematically assure achievement of the CO2
emission performance rates in the plan for each plan period;
(B) Imposes emission standards on all affected EGUS that, assuming full compliance by all affected EGUs, mathematically assure achievement of the CO2
emission goals; or
(C) Imposes emission standards on all affected EGUs that, assuming full compliance by all affected EGUs, in conjunction with applicable requirements under state law for EGUs subject to subpart TTTT of this subpart, assuming the applicable requirements under state law are met by all EGUs subject to subpart TTTT of this subpart, achieve the applicable mass-based CO2
emission goals plus new source CO2
emission complement allowed for in § 60.5790(b)(5).
(ii) If your plan does not meet the requirements of (a)(2)(i) or (iii) of this section, your plan must include the requirement for corrective measures to be implemented if triggered. Upon triggering corrective measures, if you do not already have them included in your approved State plan, you must submit corrective measures to EPA for approval as a plan revision per the requirements of § 60.5785(c). These corrective measures must ensure that the interim period and final period CO2
emission performance rates or CO2
emission goals are achieved by your affected EGUs, as applicable, and must achieve additional emission reductions to offset any emission performance shortfall. Your plan must include the requirement that corrective measures be triggered and implemented according to paragraphs (a)(2)(ii)(A) through (H) of this section.
(A) Your plan must include a trigger for an exceedance of an interim step 1 or interim step 2 CO2
emission performance rate or CO2
emission goal by 10 percent or greater, either on average or cumulatively (if applicable).
(B) Your plan must include a trigger for an exceedance of an interim step 1 goal or interim step 2 goal of 10 percent or greater based on either reported CO2
emissions with applied plus or minus net allowance export or import adjustments (if applicable), or based on the adjusted CO2
emission rate (if applicable).
(C) Your plan must include a trigger for a failure to meet an interim period goal based on reported CO2
emissions with applied plus or minus net allowance export or import adjustments
( printed page 64944)
(if applicable), or based on the adjusted CO2
emission rate (if applicable).
(D) Your plan must include a trigger for a failure to meet the interim period or any final reporting period CO2
emission performance rate or CO2
emission goal, either on average or cumulatively (as applicable).
(E) Your plan must include a trigger for a failure to meet any final reporting period goal based on reported CO2
emissions with applied plus or minus net allowance export or import adjustments (if applicable).
(F) Your plan must include a trigger for a failure to meet the interim period CO2
emission performance rate or CO2
emission goal based on the adjusted CO2
emission rate (if applicable).
(G) Your plan must include a trigger for a failure to meet any final reporting period CO2
emission performance rate or CO2
emission goal based on the adjusted CO2
emission rate (if applicable).
(H) A net allowance import adjustment represents the CO2
emissions (in tons) equal to the number of net imported CO2
allowances. This adjustment is subtracted from reported CO2
emissions. Under this adjustment, such allowances must be issued by a state with an emission budget trading program that only applies to affected EGUs (or affected EGUs plus EGUs covered by subpart TTTT of this part as applicable). A net allowance export adjustment represents the CO2
emissions (in tons) equal to the number of net exported CO2
allowances. This adjustment is added to reported CO2
emissions.
(iii) If your plan relies upon State measures, in addition to or in lieu of emission standards on your affected EGUs, then the final State plan must include the requirements in paragraph (a)(3) of this section and the submittal must include the information listed in § 60.5745(a)(6).
(iv) If your plan requires emission standards in addition to relying upon State measures, then you must demonstrate that the emission standards and State measures, when taken together, result in the achievement of the applicable mass-based CO2
emission goal described in § 60.5855 by your State's affected EGUs.
(3)
State measures backstop.
If your plan relies upon State measures, you must submit, as part of the plan in lieu of the requirements in paragraph (a)(2)(i) and (ii) of this section, a federally enforceable backstop that includes emission standards for affected EGUs that will be put into place, if there is a triggering event listed in paragraph (a)(3)(i) of this section, within 18 months of the due date of the report required in § 60.5870(b). The emission standards on the affected EGUs as part of the backstop must be able to meet either the CO2
emission performance rates or mass-based or rate-based CO2
emission goal for your State during the interim and final periods. You must either submit, along with the backstop emission standards, provisions to adjust the emission standards to make up for the prior emission performance shortfall, such that no later plan revision to modify the emission standards is necessary in order to address the emission performance shortfall, or you must submit, as part of the final plan, backstop emission standards that assure affected EGUs would achieve your State's CO2
emission performance rates or emission goals during the interim and final periods, and then later submit appropriate revisions to the backstop emission standards adjusting for the shortfall through the State plan revision process described in § 60.5785. The backstop must also include the requirements in paragraphs (a)(3)(i) through (iii) of this section, as applicable.
(i) You must include a trigger for the backstop to go into effect upon:
(A) A failure to meet a programmatic milestone;
(B) An exceedance of 10 percent or greater of an interim step 1 goal or interim step 2 goal based on reported CO2
emissions, with applied plus or minus net allowance export or import adjustments (if applicable);
(C) A failure to meet the interim period goal based on reported CO2
emissions, with applied plus or minus net allowance export or import adjustments (if applicable); or
(D) A failure to meet any final reporting period goal based on reported CO2
emissions, with applied plus or minus net allowance export or import adjustments (if applicable).
(ii) You may include in your plan any additional triggers so long as they do not reduce the stringency of the triggers required under paragraph (a)(3)(i) of this section.
(iii) You must include a schedule for implementation of the backstop once triggered, and you must identify all necessary State administrative and technical procedures for implementing the backstop.
(4)
Identification of applicable monitoring, reporting, and recordkeeping requirements for each affected EGU.
You must include in your plan all applicable monitoring, reporting and recordkeeping requirements for each affected EGU and the requirements must be consistent with or no less stringent than the requirements specified in § 60.5860.
(5)
State reporting.
You must include in your plan a description of the process, contents, and schedule for State reporting to the EPA about plan implementation and progress, including information required under § 60.5870.
(i) You must include in your plan a requirement for a report to be submitted by July 1, 2021, that demonstrates that the State has met, or is on track to meet, the programmatic milestone steps indicated in the timeline required in § 60.5770.
(b) You must follow the requirements of subpart B of this part and demonstrate that they were met in your State plan. However, the provisions of § 60.24(f) shall not apply.
(a) In addition to the components of the plan listed in § 60.5740, a final plan submittal to the EPA must include the information in paragraphs (a)(1) through (13) of this section. This information must be submitted to the EPA as part of your final plan submittal but will not be codified as part of the federally enforceable plan upon approval by EPA.
(1) You must include a description of your plan approach and the geographic scope of the plan (
i.e.,
State or multi-State, geographic boundaries related to the plan elements), including, if applicable, identification of multi-State plan participants.
(2) You must identify CO2
emission performance rates or equivalent statewide CO2
emission goals that your affected EGUs will achieve. If the geographic scope of your plan is a single State, then you must identify CO2
emission performance rates or emission goals according to § 60.5855. If your plan includes multiple States and you elect to set CO2
emission goals, you must identify CO2
emission goals calculated according to § 60.5750.
(i) You must specify in the plan submittal the CO2
emission performance rates or emission goals that affected EGUs will meet for the interim period, each interim step, and the final period (including each final reporting period) pursuant to § 60.5770.
(ii) [Reserved]
(3) You must include a demonstration that the affected EGUs covered by the plan are projected to achieve the CO2
emission performance rates or CO2
emission goals described in § 60.5855.
(4) You must include a demonstration that each affected EGU's emission standard is quantifiable, non-
( printed page 64945)
duplicative, permanent, verifiable, and enforceable according to § 60.5775.
(5) If your plan includes emission standards on your affected EGUs sufficient to meet either the CO2
emission performance rates or CO2
emission goals, you must include in your plan submittal the information in paragraphs (a)(5)(i) through (v) of this section as applicable.
(i) If your plan applies separate rate-based CO2
emission standards for affected EGUs (in lbs CO2
/MWh) that are equal to or lower than the CO2
emission performance rates listed in Table 1 of this subpart or uniform rate-based CO2
emission standards equal to or lower than the rate-based CO2
emission goals listed in Table 2 of this subpart, then no additional demonstration is required beyond inclusion of the emission standards in the plan.
(ii) If a plan applies rate-based emission standards to individual affected EGUs at a lbs CO2
/MWh rate that differs from the CO2
emission performance rates in Table 1 of this subpart or the State's rate-based CO2
emission goal in Table 2 of this subpart, then a further demonstration is required that the application of the CO2
emission standards will achieve the CO2
emission performance rates or State rate-based CO2
emission goal. You must demonstrate through a projection that the adjusted weighted average CO2
emission rate of affected EGUs, when weighted by generation (in MWh), will be equal to or less than the CO2
emission performance rates or the rate-based CO2
emission goal. This projection must address the interim period and the final period. The projection in the plan submittal must include the information listed in paragraph (a)(5)(v) of this section and in addition the following:
(A) An analysis of the change in generation of affected EGUs given the compliance costs and incentives under the application of different emission rate standards across affected EGUs in a State;
(B) A projection showing how generation is expected to shift between affected EGUs and across affected EGUs and non-affected EGUs over time;
(C) Assumptions regarding the availability and anticipated use of the MWh of electricity generation or electricity savings from eligible resources that can be issued ERCs;
(D) The specific calculation (or assumption) of how eligible resource MWh of electricity generation or savings are being used in the projection to adjust the reported CO2
emission rate of affected EGUs;
(E) If a state plan provides for the ability of renewable energy resources located in states with mass-based plans to be issued ERCs, consideration in the projection that such resources must meet geographic eligibility requirements, consistent with § 60.5800(a); and
(F) Any other applicable assumptions used in the projection.
(iii) If a plan establishes mass-based emission standards for affected EGUs that cumulatively do not exceed the State's EPA-specified mass CO2
emission goal, then no additional demonstration is required beyond inclusion of the emission standards in the plan.
(iv) If a plan applies mass-based emission standards to individual affected EGUs that cumulatively exceed the State's EPA-specified mass CO2
emission goal, then you must include a demonstration that your mass-based emission program will be designed such that compliance by affected EGUs would achieve the State mass-based CO2
emission goals. This demonstration includes the information listed in paragraph (a)(5)(v) of this section.
(v) Your plan demonstration to be included in your plan submittal, if applicable, must include the information listed in paragraphs (a)(5)(v)(A) through (L) of this section.
(A) A summary of each affected EGU's anticipated future operation characteristics, including:
(
4) Fixed and variable operations and maintenance costs (when applicable);
(
5) Heat rates; and
(
6) Electric generation capacity and capacity factors.
(B) An identification of any planned new electric generating capacity.
(C) Analytic treatment of the potential for building unplanned new electric generating capacity.
(D) A timeline for implementation of EGU-specific actions (if applicable).
(E) All wholesale electricity prices.
(F) A geographic representation appropriate for capturing impacts and/or changes in the electric system.
(G) A time period of analysis, which must extend through at least 2031.
(H) An anticipated electricity demand forecast (MWh load and MW peak demand) at the State and regional level, including the source and basis for these estimates, and, if appropriate, justification and documentation of underlying assumptions that inform the development of the demand forecast (
e.g.,
annual economic and demand growth rate or population growth rate).
(I) A demonstration that each emission standard included in your plan meets the requirements of § 60.5775.
(J) Any ERC or emission allowance prices, when applicable.
(K) An identification of planning reserve margins.
(L) Any other applicable assumptions used in the projection.
(6) If your plan relies upon State measures, in addition to or in lieu of the emission standards required by paragraph § 60.5740(a)(2), the final State plan submittal must include the information under paragraphs (a)(5)(v) and (a)(6)(i) through (v) of this section.
(i) You must include a description of all the State measures the State will rely upon to achieve the applicable CO2
emission goals required under § 60.5855(e), the projected impacts of the State measures over time, the applicable State laws or regulations related to such measures, and identification of parties or entities subject to or implementing such State measures.
(ii) You must include the schedule and milestones for the implementation of the State measures. If the State measures in your plan submittal rely upon measures that do not have a direct effect on the CO2
emissions measured at an affected EGU's stack, you must also demonstrate how the minimum emission, monitoring and verification (EM&V) requirements listed under § 60.5795 that apply to those programs and projects will be met.
(iii) You must demonstrate that federally enforceable emission standards for affected EGUs in conjunction with any State measures relied upon for your plan, are sufficient to achieve the mass-based CO2
emission goal for the interim period, each interim step in that interim period, the final period, and each final reporting period. In addition, you must demonstrate that each emission standard included in your plan meets the requirements of § 60.5775 and each State measure included in your plan submittal meets the requirements of § 60.5780.
(iv) You must include a CO2
performance projection of your State measures that shows how the measures, whether alone or in conjunction with any federally enforceable CO2
emission standards for affected EGUs, will result in the achievement of the future CO2
performance at affected EGUs. Elements of this projection must include those specified in paragraph (a)(5)(v) of this section, as applicable, and the following for the interim period and the final period:
( printed page 64946)
(A) A baseline demand and supply forecast as well as the underlying assumptions and data sources of each forecast;
(B) The magnitude of energy and emission impacts from all measures included in the plan and applicable assumptions;
(C) An identification of State-enforceable measures with electricity savings and RE generation, in MWh, expected for individual and collective measures and any assumptions related to the quantification of the MWh, as applicable.
(7) Your plan submittal must include a demonstration that the reliability of the electrical grid has been considered in the development of your plan.
(8) Your plan submittal must include a timeline with all the programmatic milestone steps the State intends to take between the time of the State plan submittal and January 1, 2022 to ensure the plan is effective as of January 1, 2022.
(9) Your plan submittal must adequately demonstrate that your State has the legal authority (
e.g.,
through regulations or legislation) and funding to implement and enforce each component of the State plan submittal, including federally enforceable emission standards for affected EGUs, and State measures as applicable.
(10) Your State plan submittal must demonstrate that each interim step goal required under § 60.5855(c), will be met and include in its supporting documentation, if applicable, a description of the analytic process, tools, methods, and assumptions used to make this demonstration.
(11) Your plan submittal must include certification that a hearing required under § 60.23(c)(1) on the State plan was held, a list of witnesses and their organizational affiliations, if any, appearing at the hearing, and a brief written summary of each presentation or written submission, pursuant to the requirements of § 60.23(d) and (f).
(12) Your plan submittal must include documentation of any conducted community outreach and community involvement, including engagement with vulnerable communities.
(13) Your plan submittal must include supporting material for your plan including:
(i) Materials demonstrating the State's legal authority and funding to implement and enforce each component of its plan, including emissions standards and/or State measures that the plan relies upon;
(ii) Materials supporting that the CO2
emission performance rates or CO2
emission goals will be achieved by affected EGUs identified under the plan, according to paragraph (a)(3) of this section;
(iii) Materials supporting any calculations for CO2
emission goals calculated according to § 60.5855, if applicable; and
(iv) Any other materials necessary to support evaluation of the plan by the EPA.
(b) You must submit your final plan to the EPA electronically according to § 60.5875.
Can I work with other States to develop a multi-State plan?
A multi-State plan must include all the required elements for a plan specified in § 60.5740(a). A multi-State plan must meet the requirements of paragraphs (a) and (b) of this section.
(a) The multi-State plan must demonstrate that all affected EGUs in all participating States will meet the CO2
emission performance rates listed in Table 1 of this subpart or an equivalent CO2
emission goal according to paragraphs (a)(1) or (2) of this section. States may only follow the procedures in (a)(1) or (2) if they have functionally equivalent requirements meeting § 60.5775 and § 60.5790 included in their plans.
(1) For States electing to demonstrate performance with a CO2
emission rate-based goal, the CO2
emission goals identified in the plan according to § 60.5855 will be an adjusted weighted (by net energy output) average lbs CO2
/MWh emission rate to be achieved by all affected EGUs in the multi-State area during the plan periods; or
(2) For States electing to demonstrate performance with a CO2
emission mass-based goal, the CO2
emission goals identified in the multi-State plan according to § 60.5855 will be total mass CO2
emissions by all affected EGUs in the multi-State area during the plan periods, representing the sum of all individual mass CO2
goals for states participating in the multi-state plan.
(b) Options for submitting a multi-State plan include the following:
(1) States participating in a multi-State plan may submit one multi-State plan submittal on behalf of all participating States. The joint submittal must be signed electronically, according to § 60.5875, by authorized officials for each of the States participating in the multi-State plan. In this instance, the joint submittal will have the same legal effect as an individual submittal for each participating State. The joint submittal must address plan components that apply jointly for all participating States and components that apply for each individual State in the multi-State plan, including necessary State legal authority to implement the plan, such as State regulations and statutes.
(2) States participating in a multi-State plan may submit a single plan submittal, signed by authorized officials from each participating State, which addresses common plan elements. Each participating State must, in addition, provide individual plan submittals that address State-specific elements of the multi-State plan.
(3) States participating in a multi-State plan may separately make individual submittals that address all elements of the multi-State plan. The plan submittals must be materially consistent for all common plan elements that apply to all participating States, and also must address individual State-specific aspects of the multi-State plan. Each individual State plan submittal must address all required plan components in § 60.5740.
(c) A State may elect to participate in more than one multi-State plan. If your State elects to participate in more than one multi-State plan then you must identify in the State plan submittal required under § 60.5745, the subset of affected EGUs that are subject to the specific multi-State plan or your State's individual plan. An affected EGU can only be subject to one plan.
(d) A State may elect to allow its affected EGUs to interact with affected EGUs in other States through mass-based trading programs or a rate-based trading program without entering into a formal multi-State plan allowed for under this section, so long as such programs are part of an EPA-approved state plan and meet the requirements of paragraphs (d)(1) and (2) of this section, as applicable.
(1) For States that elect to do mass-based trading under this option the State must indicate in its plan that its emission budget trading program will be administered using an EPA-approved (or EPA-administered) emission and allowance tracking system.
(2) For States that elect to use a rate-based trading program which allows the affected EGUs to use ERCs from other State rate-based trading programs, the plan must require affected EGUs within their State to comply with emission standards equal to the sub-category CO2
emission performance rates in Table 1 of this subpart.
What are the timing requirements for submitting my plan?
(a) You must submit a final plan with the information required under § 60.5745 by September 6, 2016, unless you are submitting an initial submittal,
( printed page 64947)
allowed under § 60.5765, in lieu of a final State plan submittal, according to paragraph (b) of this section.
(b) For States seeking a two year extension for a final plan submittal, you must include the information in § 60.5765(a) in an initial submittal by September 6, 2016, to receive an extension to submit your final State plan submittal by September 6, 2018.
(c) You must submit all information required under paragraphs (a) and (b) of this section according to the electronic reporting requirements in § 60.5875.
What must I include in an initial submittal if requesting an extension for a final plan submittal?
(a) You must sufficiently demonstrate that your State is able to undertake steps and processes necessary to timely submit a final plan by the extended date of September 6, 2018, by addressing the following required components in an initial submittal by September 6, 2016, if requesting an extension for a final plan submittal:
(1) An identification of final plan approach or approaches under consideration and a description of progress made to date on the final plan components;
(2) An appropriate explanation of why the State requires additional time to submit a final plan by September 6, 2018; and
(3) A demonstration or description of the opportunity for public comment on the initial submittal and meaningful engagement with stakeholders, including vulnerable communities, during the time in preparation of the initial submittal and the plans for engagement during development of the final plan.
(b) You must submit an initial submittal allowed in paragraph (a) of this section, information required under paragraph (c) of this section (only if a State elects to submit an initial submittal to request an extension for a final plan submittal), and a final State plan submittal according to § 60.5870. If a State submits an initial submittal, an extension for a final State plan submittal is considered granted and a final State plan submittal is due according to § 60.5760(b) unless a State is notified within 90 days of the EPA receiving the initial submittal that the EPA finds the initial submittal does not meet the requirements listed in paragraph (a) of this section. If the EPA notifies the State that the initial submittal does not meet such requirements, the EPA will also notify the State that it has failed to submit the final plan required by September 6, 2016.
(c) If an extension for submission of a final plan has been granted, you must submit a progress report by September 6, 2017. The 2017 report must include the following:
(1) A summary of the status of each component of the final plan, including an update from the 2016 initial submittal and a list of which final plan components are not complete.
(2) A commitment to a plan approach (
e.g.,
single or multi-State, rate-based or mass-based emission performance level, rate-based or mass-based emission standards), including draft or proposed legislation and/or regulations.
(3) An updated comprehensive roadmap with a schedule and milestones for completing the final plan, including any updates to community engagement undertaken and planned.
What schedules, performance periods, and compliance periods must I include in my plan?
(a) The affected EGUs covered by your plan must meet the CO2
emission requirements required under § 60.5855 for the interim period, interim steps, and the final reporting periods according to paragraph (b) of this section. You must also include in your plan compliance periods for each affected EGU regulated under the plan according to paragraphs (c) and (d) of this section.
(b) Your plan must require your affected EGUs to achieve each CO2
emission performance rate or CO2
emission goal, as applicable, required under § 60.5855 over the periods according to paragraphs (b)(1) through (3) of this section.
(1) The interim period.
(2) Each interim step.
(3) Each final reporting period.
(c) The emission standards for affected EGUs regulated under the plan must include the following compliance periods:
(1) For the interim period, affected EGUs must have emission standards that have compliance periods that are no longer than each interim step and are imposed for the entirety of the interim step either alone or in combination.
(2) For the final period, affected EGUs must have emission standards that have compliance periods that are no longer than each final reporting period and are imposed for the entirety of the final reporting period either alone or in combination.
(3) Compliance periods for each interim step and each final reporting period may take forms shorter than specified in this regulation, provided the schedules of compliance collectively end on the same schedule as each interim step and final reporting period.
(d) If your plan relies upon State measures in lieu of or in addition to emission standards for affected EGUs regulated under the plan, then the performance periods must be identical to the compliance periods for affected EGUs listed in paragraphs (c)(1) through (3) of this section.
What emission standards must I include in my plan?
(a) Emission standard(s) for affected EGUs included under your plan must be demonstrated to be quantifiable, verifiable, non-duplicative, permanent, and enforceable with respect to each affected EGU. The plan submittal must include the methods by which each emission standard meets each of the following requirements in paragraphs (b) through (f) of this section.
(b) An affected EGU's emission standard is quantifiable if it can be reliably measured in a manner that can be replicated.
(c) An affected EGU's emission standard is verifiable if adequate monitoring, recordkeeping and reporting requirements are in place to enable the State and the Administrator to independently evaluate, measure, and verify compliance with the emission standard.
(d) An affected EGU's emission standard is non-duplicative with respect to a State plan if it is not already incorporated as an emission standard in another State plan unless incorporated in multi-State plan.
(e) An affected EGU's emission standard is permanent if the emission standard must be met for each compliance period, unless it is replaced by another emission standard in an approved plan revision, or the State demonstrates in an approvable plan revision that the emission reductions from the emission standard are no longer necessary for the State to meet its State level of performance.
(f) An affected EGU's emission standard is enforceable if:
(1) A technically accurate limitation or requirement and the time period for the limitation or requirement are specified;
(2) Compliance requirements are clearly defined;
(3) The affected EGUs responsible for compliance and liable for violations can be identified;
(4) Each compliance activity or measure is enforceable as a practical matter; and
(5) The Administrator, the State, and third parties maintain the ability to enforce against violations (including if an affected EGU does not meet its emission standard based on its
( printed page 64948)
emissions, its allowances if it is subject to a mass-based emission standard, or its ERCs if it is subject to a rate-based emission standard) and secure appropriate corrective actions, in the case of the Administrator pursuant to CAA sections 113(a)-(h), in the case of a State, pursuant to its plan, State law or CAA section 304, as applicable, and in the case of third parties, pursuant to CAA section 304.
What State measures may I rely upon in support of my plan?
You may rely upon State measures in support of your plan that are not emission standard(s) on affected EGUs, provided those State measures meet the requirements in paragraph (a) of this section.
(a) Each State measure is quantifiable, verifiable, non-duplicative, permanent, and enforceable with respect to each affected entity (
e.g.,
entities other than affected EGUs with no federally enforceable obligations under a State plan), and your plan supporting materials include the methods by which each State measure meets each of the following requirements in paragraphs (a)(1) through (5) of this section.
(1) A State measure is quantifiable with respect to an affected entity if it can be reliably measured in a manner that can be replicated.
(2) A State measure is verifiable with respect to an affected entity if adequate monitoring, recordkeeping and reporting requirements are in place to enable the State to independently evaluate, measure, and verify compliance with the State measure.
(3) A State measure is non-duplicative with respect to an affected entity if it is not already incorporated as a State measure or an emission standard in another State plan or State plan supporting material unless incorporated in a multi-State plan.
(4) A State measure is permanent with respect to an affected entity if the State measure must be met for at least each compliance period, or unless either it is replaced by another State measure in an approved plan revision, or the State demonstrates in an approved plan revision that the emission reductions from the State measure are no longer necessary for the State's affected EGUs to meet their mass-based CO2
emission goal.
(5) A State measure is enforceable against an affected entity if:
(i) A technically accurate limitation or requirement and the time period for the limitation or requirement are specified;
(ii) Compliance requirements are clearly defined;
(iii) The affected entities responsible for compliance and liable for violations can be identified;
(iv) Each compliance activity or measure is enforceable as a practical matter; and
(v) The State maintains the ability to enforce violations and secure appropriate corrective actions.
(a) EPA-approved plans can be revised only with approval by the Administrator. The Administrator will approve a plan revision if it is satisfactory with respect to the applicable requirements of this subpart and any applicable requirements of subpart B of this part, including the requirement in § 60.5745(a)(3) to demonstrate achievement of the CO2
emission performance rates or CO2
emission goals in § 60.5855. If one (or more) of the elements of the plan set in § 60.5740 require revision with respect to achieving the CO2
emission performance rates or CO2
emission goals in § 60.5855, a request must be submitted to the Administrator indicating the proposed revisions to the plan to ensure the CO2
emission performance rates or CO2
emission goals are met. In addition, the following provisions in paragraphs (b) through (d) of this section may apply.
(b) You may submit revisions to a plan to adjust CO2
emission goals according to § 60.5855(d).
(c) If your State is required to submit a notification according to § 60.5870(d) indicating a triggering of corrective measures as described in § 60.5740(a)(2)(i) and your plan does not already include corrective measures to be implemented if triggered, you must revise your State plan to include corrective measures to be implemented. The corrective measures must ensure achievement of the CO2
emission performance rates or State CO2
emission goal. Additionally, the corrective measures must achieve additional CO2
emission reductions to offset any CO2
emission performance shortfall relative to the overall interim period or final period CO2
emission performance rate or State CO2
emission goal. The State plan revision submission must explain how the corrective measures both make up for the shortfall and address the State plan deficiency that caused the shortfall. The State must submit the revised plan and explanation to the EPA within 24 months after submitting the State report required in § 60.5870(a) indicating the CO2
emission performance deficiency in lieu of the requirements of § 60.28(a). The State must implement corrective measures within 6 months of the EPA's approval of a plan revision adding them. The shortfall must be made up as expeditiously as practicable.
(d) If your plan relies upon State measures, your backstop is triggered under § 60.5740(a)(3)(i), and your State measures plan backstop does not include a mechanism to make up the shortfall, you must revise your backstop emission standards to make up the shortfall. The shortfall must be made up as expeditiously as practicable.
(e) Reliability Safety Valve:
(1) In order to trigger a reliability safety valve, you must notify the EPA within 48 hours of an unforeseen, emergency situation that threatens reliability, such that your State will need a short-term modification of emission standards under a State plan for a specified affected EGU or EGUs. The EPA will consider the notification in § 60.5870(g)(1) to be an approved short-term modification to the State plan without needing to go through the full State plan revision process if the State provides a second notification to the EPA within seven days of the first notification. The short-term modification under a reliability safety valve allows modification to emission standards under the State plan for an affected EGU or EGUs for an initial period of up to 90 days. During that period of time, the affected EGU or EGUs will need to comply with the modified emission standards identified in the initial notification required under § 60.5870(g)(1) or amended in the second notification required under § 60.5870(g)(2). For the duration of the up to 90-day short-term modification, the CO2
emissions of the affected EGU or EGUs that exceed their obligations under the originally approved State plan will not be counted against the State's CO2
emission performance rate or CO2
emission goal. The EPA reserves the right to review any such notification required under § 60.5870(g), and, in the event that the EPA finds such notification is improper, the EPA may disallow the short-term modification and affected EGUs must continue to operate under the approved State plan emission standards. As described more fully in § 60.5870(g)(3), at least seven days before the end of the initial 90-day reliability safety valve period, the State must notify the appropriate EPA regional office whether the reliability concern has been addressed and the affected EGU or EGUs can resume meeting the original emission standards established in the State plan prior to the short-term modification or whether a
( printed page 64949)
serious, ongoing reliability issue necessitates the affected EGU or EGUs emitting beyond the amount allowed under the State plan.
(2) Plan revisions submitted pursuant to § 60.5870(g)(3) must meet the requirements for State plan revisions under § 60.5785(a).
(a) To meet your plan obligations, you must demonstrate that your affected EGUs are complying with their emission standards as specified in § 60.5740, and you must demonstrate that the emission standards on affected EGUs, alone or in conjunction with any State measures, are resulting in achievement of the CO2
emission performance rates or statewide CO2
emission goals by affected EGUs using the procedures in paragraphs (b) through (d) of this section. If your plan requires the use of allowances for your affected EGUs to comply with their mass-based emission standards, you must follow the requirements under paragraph (b) of this section and § 60.5830. If your plan requires the use of ERCs for your affected EGUs to comply with their rate-based emission standards, you must follow the requirements under paragraphs (c) and (d) of this section and §§ 60.5795 through 60.5805.
(b) If you submit a plan that sets a mass-based emission trading program for your affected EGUs, the State plan must include emission standards and requirements that specify the allowance system, related compliance requirements and mechanisms, and the emission budget as appropriate. These requirements must include those listed in paragraphs (b)(1) through (5) of this section.
(1) CO2
emission monitoring, reporting, and recordkeeping requirements for affected EGUs.
(2) Requirements for State allocation of allowances consistent with § 60.5815.
(3) Requirements for tracking of allowances, from issuance through submission for compliance, consistent with § 60.5820.
(4) The process for affected EGUs to demonstrate compliance (allowance “true-up” with reported CO2
emissions) consistent with § 60.5825.
(5) Requirements that address potential increased CO2
emissions from new sources, beyond the emissions expected from new sources if affected EGUs were given emission standards in the form of the subcategory-specific CO2
emission performance rates. You may meet this requirement by requiring one of the options under paragraphs (b)(5)(i) through (iii) of this section.
(i) You may include, as part of your plan's supporting documentation, requirements enforceable as a matter of State law regulating CO2
emissions from EGUs covered by subpart TTTT of this part under the mass-based CO2
goal plus new source CO2
emission complement applicable to your State in Table 4 of this subpart. If you choose this option, the term “mass-based CO2
goal plus new source CO2
emission complement” shall apply rather than “CO2
mass-based goal” and the term “CO2
emission goal” shall include “mass-based CO2
goal plus new source CO2
emission complement” in these emission guidelines.
(ii) You may include requirements in your State plan for emission budget allowance allocation methods that align incentives to generate to affected EGUs or EGUs covered by subpart TTTT of this part that result in the affected EGUs meeting the mass-based CO2
emission goal;
(iii) You may submit for the EPA's approval, an equivalent method which requires affected EGUs to meet the mass-based CO2
emission goal. The EPA will evaluate the approvability of such an alternative method on a case by case basis.
(c) If you submit a plan that sets rate-based emission standards on your affected EGUs, to meet the requirements of § 60.5775, you must follow the requirements in paragraphs (c)(1) through (4) of this section.
(1) You must require the owner or operator of each affected EGU covered by your plan to calculate an adjusted CO2
emission rate to demonstrate compliance with its emission standard by factoring stack emissions and any ERCs into the following equation:
Where:
CO2
emission rate = An affected EGU's adjusted CO2
emission rate that will be used to determine compliance with the applicable CO2
emission standard.
MCO2
= Measured CO2
mass in units of pounds (lbs) summed over the compliance period for an affected EGU.
MWhop
= Total net energy output over the compliance period for an affected EGU in units of MWh.
MWhERC
= ERC replacement generation for an affected EGU in units of MWh (ERCs are denominated in whole integers as specified in paragraph (d) of this section).
(2) Your plan must specify that an ERC qualifies for the compliance demonstration specified in paragraph (c)(1) of this section if the ERC meets the requirements of paragraphs (c)(2)(i) through (iv) of this section.
(i) An ERC must have a unique serial number.
(ii) An ERC must represent one MWh of actual energy generated or saved with zero associated CO2
emissions.
(iii) An ERC must only be issued to an eligible resource that meets the requirements of § 60.5800 or to an affected EGU that meets the requirements of § 60.5795 and must only be issued by a State or its State agent through an EPA-approved ERC tracking system that meets the requirements of § 60.5810, or by the EPA through an EPA-administered tracking system.
(iv) An ERC must be surrendered and retired only once for purpose of compliance with this regulation through an EPA-approved ERC tracking system that meets the requirements of § 60.5810, or by the EPA through an EPA-administered tracking system.
(3) Your plan must specify that an ERC does not qualify for the compliance demonstration specified in paragraph (c)(1) of this section if it does not meet the requirements of paragraph (c)(2) of this section or if any State has used that same ERC for purposes of demonstrating achievement of a CO2
emission performance rate or CO2
emission goal. The plan must additionally include provisions that address requirements for revocation or adjustment that apply if an ERC issued by the State is subsequently found to have been improperly issued.
(4) Your plan must include provisions either allowing for or restricting banking of ERCs between compliance periods for affected EGUs, and provisions not allowing any borrowing of any ERCs from future compliance periods by affected EGUs or eligible resources.
( printed page 64950)
What affected EGUs qualify for generation of ERCs?
(a) For issuance of ERCs to the affected EGUs that generate them, the plan must specify the accounting method and process for ERC issuance. For plans that require that affected EGUs meet a rate-based CO2
emission goal, where all affected EGUs have identical emission standards, you must specify the accounting method listed in paragraph (a)(1) of this section for generating ERCs. For plans that require affected EGUs to meet the CO2
emission performance rates or CO2
emission goals where affected EGUs have emission standards that are not equal for all affected EGUs, you must specify the accounting methods listed in paragraphs (a)(1) and (2) of this section for generating ERCs.
(1) You must include the calculation method for determining the number of ERCs, denominated in MWh, that may be generated by and issued to an affected EGU that is in compliance with its emission standard, based on the difference between its emission standard and its reported CO2
emission rate for the compliance period; and
(2) You must include the calculation method for determining the number of ERCs, denominated in MWh, that may be issued to affected EGUs that meet the definition of a stationary combustion turbine based on the displaced emissions from affected EGUs not meeting the definition of a stationary combustion turbine, resulting from the difference between its annualized net energy output in MWh for the calendar year(s) in the compliance period and its net energy output in MWh for the 2012 calendar year (January 1, 2012, through December 31, 2012).
(b) Any ERCs generated through the method described as required by paragraph (a)(2) of this section must not be used by any affected EGUs other than steam generating units or IGCCs to demonstrate compliance as prescribed under § 60.5790(c)(1).
(c) Any states in a multi-State plan that requires the use of ERCs for affected EGUs to comply with their emission standards must have functionally equivalent requirements pursuant to paragraphs (a)(1) and (2) of this section for generating ERCs.
What other resources qualify for issuance of ERCs?
(a) ERCs may only be issued for generation or savings produced on or after January 1, 2022, to a resource that qualifies as an eligible resource because it meets each of the requirements in paragraphs (a)(1) through (4) of this section.
(1) Resources qualifying for eligibility only include resources that increased installed electrical generation nameplate capacity, or implemented new electrical savings measures, on or after January 1, 2013. If a resource had a nameplate capacity uprate, ERCs may be issued only for the difference in generation between its uprated nameplate capacity and its nameplate capacity prior to the uprate. ERCs must not be issued for generation for an uprate that followed a derate that occurred on or after January 1, 2013. A resource that is relicensed or receives a license extension is considered existing capacity and is not an eligible resource, unless it receives a capacity uprate as a result of the relicensing process that is reflected in its relicensed permit. In such a case, only the difference in nameplate capacity between its relicensed permit and its prior permit is eligible to be issued ERCs.
(2) The resource must be connected to, and deliver energy to or save electricity on, the electric grid in the contiguous United States.
(3) The resource must be located in either:
(i) A State whose affected EGUs are subject to rate-based emission standards pursuant to this regulation; or
(ii) A State with a mass-based CO2
emission goal, and the resource can demonstrate (
e.g.,
through a power purchase agreement or contract for delivery) that the electricity generated is delivered with the intention to meet load in a State with affected EGUs which are subject to rate-based emission standards pursuant to this regulation, and was treated as a generation resource used to serve regional load that included the State whose affected EGUs are subject to rate-based emission standards. Notwithstanding any other provision of paragraph (a)(4) of this section, the only type of eligible resource in the State with mass-based emission standards is renewable generating technologies listed in (a)(4)(i) of this section.
(4) The resource falls into one of the following categories of resources:
(i) Renewable electric generating technologies using one of the following renewable energy resources: Wind, solar, geothermal, hydro, wave, tidal;
(ii) Qualified biomass;
(iii) Waste-to-energy (biogenic portion only);
(iv) Nuclear power;
(v) A non-affected combined heat and power (CHP) unit, including waste heat power;
(vi) A demand-side EE or demand-side management measure that saves electricity and is calculated on the basis of quantified ex post savings, not “projected” or “claimed” savings; or
(vii) A category identified in a State plan and approved by the EPA to generate ERCs.
(b) Any resource that does not meet the requirements of this subpart or an approved State plan cannot be issued ERCs for use by an affected EGU with its compliance demonstration required under § 60.5790(c).
(c) ERCs may not be issued to or for any of the following:
(1) New, modified, or reconstructed EGUs that are subject to subpart TTTT of this part, except CHP units that meet the requirements of a CHP unit under paragraph (a);
(2) EGUs that do not meet the applicability requirements of §§ 60.5845 and 60.5850, except CHP units that meet the requirements of a CHP unit under paragraph (a);
(3) Measures that reduce CO2
emissions outside the electric power sector, including, for example, GHG offset projects representing emission reductions that occur in the forestry and agriculture sectors, direct air capture, and crediting of CO2
emission reductions that occur in the transportation sector as a result of vehicle electrification; and
(4) Any measure not approved by the EPA for issuance of ERCs in connection with a specific State plan.
(d) You must include the appropriate requirements in paragraphs (d)(1) through (3) of this section for an applicable eligible resource in your plan.
(1) If qualified biomass is an eligible resource, the plan must include a description of why the proposed feedstocks or feedstock categories should qualify as an approach for controlling increases of CO2
levels in the atmosphere as well as the proposed valuation of biogenic CO2
emissions. In addition, for sustainably-derived agricultural and forest biomass feedstocks, the state plan must adequately demonstrate that such feedstocks appropriately control increases of CO2
levels in the atmosphere and methods for adequately monitoring and verifying these feedstock sources and related sustainability practices. For all qualified biomass feedstocks, plans must specify how biogenic CO2
emissions will be monitored and reported, and identify specific EM&V, tracking and auditing approaches.
(2) If waste-to-energy is an eligible resource, the plan must assess both the
( printed page 64951)
capacity to strengthen existing or implement new waste reduction, reuse, recycling and composting programs, and measures to minimize any potential negative impacts of waste-to-energy operations on such programs. Additionally the plan must include a method for determining the proportion of total MWh generation from a waste-to-energy facility that is eligible for use in adjusting a CO2
emission rate (
i.e.,
that which is generated from biogenic materials).
(3) If carbon capture and utilization (CCU) is an eligible resource in a plan, the plan must include analysis supporting how the proposed qualifying CCU technology results in CO2
emission mitigation from affected EGUs and provide monitoring, reporting, and verification requirements to demonstrate the reductions.
(e) States and areas of Indian country that do not have any affected EGUs, and other countries, may provide ERCs to adjust CO2
emissions provided they are connected to the contiguous U.S. grid and meet the other requirements for eligibility and eligible resources and the issuance of ERCs included in these emission guidelines, except that such States and other countries may not provide ERCs from resources described in § 60.5800(a)(4)(vi).
If your plan uses ERCs your plan must include the process and requirements for issuance of ERCs to affected EGUs and eligible resources set forth in paragraphs (a) through (f) of this section.
(a)
Eligibility application.
Your plan must require that, to receive ERCs, the owner or operator must submit an eligibility application to you that demonstrates that the requirements of your State plan as approved by the EPA as meeting § 60.5795 (for an affected EGU) or § 60.5800 (for an eligible resource) are met, and, in the case of an eligible resource, includes at a minimum:
(1) Documentation that the eligibility application has only been submitted to you, or pursuant to an EPA-approved multi-State collaborative approach;
(2) An EM&V plan that meets the requirements of the State plan as approved by the EPA as meeting § 60.5830; and
(3) A verification report from an independent verifier that verifies the eligibility of the eligible resource to be issued an ERC and that the EM&V plan meets the requirements of the State plan as approved by the EPA of meeting § 60.5805.
(b)
Registration.
Your plan must require that any affected EGU or eligible resource register with an ERC tracking system that meets the requirements of § 60.5810 prior to the issuance of ERCs, and your plan must specify that you will only register an affected EGU or eligible resource after you approve its eligibility application and determine that the requirements of paragraph (a) of this section are met.
(c)
M&V reports.
For an eligible resource registered pursuant to paragraph (b) of this section, your plan must require that, prior to issuance of ERCs by you, the owner or operator must submit the following:
(1) An M&V report that meets the requirements of your State plan as approved by the EPA as meeting § 60.5835; and
(2) A verification report from an independent verifier that verifies that the requirements for the M&V report are met.
(e)
Issuance of ERCs.
Your plan must specify your procedure for issuance of ERCs based on your review of an M&V report and verification report, and must require that ERCs be issued only on the basis of energy actually generated or saved, and that only one ERC is issued for each verified MWh.
(f)
Tracking system.
Your plan must require that ERCs may only be issued through an ERC tracking system approved as part of the State plan.
(g)
Error adjustment.
Your plan must include a mechanism to adjust the number of ERCs issued if any are issued based on error (clerical, formula input error, etc.).
(h)
Qualification status of an eligible resource.
Your plan must include a mechanism to temporarily or permanently revoke the qualification status of an eligible resource, such that it can no longer be issued ERCs for at least the duration that it does not meet the requirements for being issued ERCs in your State plan.
(i)
Qualification status of an independent verifier—
(1)
Eligibility.
To be an independent verifier, a person must be approved by the State as:
(A) An independent verifier, as defined by this regulation; and
(B) Eligible to verify eligibility applications, EM&V plans, and/or M&V reports per the requirements of the approved State plan as meeting §§ 60.5830 and 60.5835 respectively.
(2)
Revocation of qualification.
Your plan must include a mechanism to temporarily or permanently revoke the qualification status of an independent verifier, such that it can no longer verify eligibility applications, EM&V plans or M&V reports for at least the duration of the period it does not meet the requirements of your State plan.
What applicable requirements are there for an ERC tracking system?
(a) Your plan must include provisions for an ERC tracking system, if applicable, that meets the following requirements:
(1) It electronically records the issuance of ERCs, transfers of ERCs among accounts, surrender of ERCs by affected EGUs as part of a compliance demonstration, and retirement or cancellation of ERCs; and
(2) It documents and provides electronic, internet-based public access to all information that supports the eligibility of eligible resources and issuance of ERCs and functionality to generate reports based on such information, which must include, for each ERC, an eligibility application, EM&V plan, M&V reports, and independent verifier verification reports.
(b) If approved in a State plan, an ERC tracking system may provide for transfers of ERCs to or from another ERC tracking system approved in a State plan, or provide for transfers of ERCs to or from an EPA-administered ERC tracking system used to administer a Federal plan.
What are the requirements for State allocation of allowances in a mass-based program?
(a) For a mass-based trading program, a State plan must include requirements for CO2
allowance allocations according to paragraphs (b) through (f) of this section.
(b) Provisions for allocation of allowances for each compliance period prior to the beginning of the compliance period.
(c) Provisions for allocation of set-aside allowance, if applicable, must be established to ensure that the eligible resources must meet the same requirements for the ERC eligible resource requirements of § 60.5800, and the State must include eligibility application and verification provisions equivalent to those for ERCs in § 60.5805 and EM&V plan and M&V report provisions that meet the requirements of § 60.5830 and § 60.5835.
(d) Provisions for adjusting allocations if the affected EGUs or eligible resources are incorrectly allocated CO2
allowances.
(e) Provisions allowing for or restricting banking of allowances between compliance periods for affected EGUs.
( printed page 64952)
(f) Provisions not allowing any borrowing of allowances from future compliance periods by affected EGUs.
(a) Your plan must include provisions for an allowance tracking system, if applicable, that meets the following requirements:
(1) It electronically records the issuance of allowances, transfers of allowances among accounts, surrender of allowances by affected EGUs as part of a compliance demonstration, and retirement of allowances; and
(2) It documents and provides electronic, internet-based public access to all information that supports the eligibility of eligible resources and issuance of set aside allowances, if applicable, and functionality to generate reports based on such information, which must include, for each set aside allowance, an eligibility application, EM&V plan, M&V reports, and independent verifier verification reports.
(b) If approved in a State plan, an allowance tracking system may provide for transfers of allowances to or from another allowance tracking system approved in a State plan, or provide for transfers of allowances to or from an EPA-administered allowance tracking system used to administer a Federal plan.
What is the process for affected EGUs to demonstrate compliance in a mass-based program?
(a) A plan must require an affected EGU's owners or operators to demonstrate compliance with emission standards in a mass based program by holding an amount of allowances not less than the tons of total CO2
emissions for such compliance period from the affected EGUs in the account for the affected EGU's emissions in the allowance tracking system required under § 60.5820 during the applicable compliance period.
(b) In a mass-based trading program a plan may allow multiple affected EGUs co-located at the same facility to demonstrate that they are meeting the applicable emission standards on a facility-wide basis by the owner or operator holding enough allowances to cover the CO2
emissions of all the affected EGUs at the facility.
(1) If there are not enough allowances to cover the facility's affected EGUs' CO2
emissions then there must be provisions for determining the compliance status of each affected EGU located at that facility.
(2) [Reserved]
Evaluation Measurement and Verification Plans and Monitoring and Verification Reports
What are the requirements for EM&V plans for eligible resources?
(a) If your plan requires your affected EGUs to meet their emission standards in accordance with § 60.5790, your plan must include requirements that any EM&V plan that is submitted in accordance with the requirements of § 60.5805, in support of the issuance of an ERC or set-aside allowance that can be used in accordance with § 60.5790, must meet the EM&V criteria approved as part of your State plan.
(b) Your plan must require each EM&V plan to include identification of the eligible resource.
(c) Your plan must require that an EM&V plan must contain specific criteria, as applicable to the specific eligible resource.
(1) For RE resources, your plan must include requirements discussing how the generation data will be physically measured on a continuous basis using, for example, a revenue-quality meter.
(2) For demand-side EE, your plan must require that each EM&V plan quantify and verify electricity savings on a retrospective (ex-post) basis using industry best-practice EM&V protocols and methods that yield accurate and reliable measurements of electricity savings. Your plan must also require each EM&V plan to include an assessment of the independent factors that influence the electricity savings, the expected life of the savings (in years), and a baseline that represents what would have happened in the absence of the demand-side EE activity. Additionally, your plan must require that each EM&V plan include a demonstration of how the industry best-practices protocol and methods were applied to the specific activity, project, measure, or program covered in the EM&V plan, and include an explanation of why these protocols or methods were selected. EM&V plans must require eligible resources to demonstrate how all such best-practice approaches will be applied for the purposes of quantifying and verifying MWh results. Subsequent reporting of demand-side EE savings values must demonstrate and explain how the EM&V plan was followed.
What are the requirements for M&V reports for eligible resources?
(a) If your plan requires your affected EGUs to meet their emission standards in accordance with § 60.5790, your plan must include requirements that any M&V report that is submitted in accordance with the requirements of § 60.5805, in support of the issuance of an ERC or set-aside allocation that can be used in accordance with § 60.5790, must meet the requirements of this section.
(b) Your plan must require that each M&V report include the following:
(1) For the first M&V report submitted, documentation that the energy-generating resources, energy-saving measures, or practices were installed or implemented consistent with the description in the approved eligibility application required in § 60.5805(a).
(2) Each M&V report submitted must include the following:
(i) Identification of the time period covered by the M&V report;
(ii) A description of how relevant quantification methods, protocols, guidelines, and guidance specified in the EM&V plan were applied during the reporting period to generate the quantified MWh of generation or MWh of energy savings;
(iii) Documentation (including data) of the energy generation and/or energy savings from any activity, project, measure, resource, or program addressed in the EM&V plan, quantified and verified in MWh for the period covered by the M&V report, in accordance with its EM&V plan, and based on ex-post energy generation or savings; and
(iv) Documentation of any change in the energy generation or savings capability of the eligible resource from the description of the resource in the approved eligibility application during the period covered by the M&V report and the date on which the change occurred, and/or demonstration that the eligible resource continued to meet the requirements of § 60.5800.
Does this subpart directly affect EGU owners or operators in my State?
(a) This subpart does not directly affect EGU owners or operators in your State. However, affected EGU owners or operators must comply with the plan that a State or States develop to implement the emission guidelines contained in this subpart.
(b) If a State does not submit a final plan to implement and enforce the emission guidelines contained in this subpart, or an initial submittal for which an extension to submit a final plan can be granted, by September 6, 2016, or the EPA disapproves a final plan, the EPA will implement and enforce a Federal plan, as provided in § 60.5720, applicable to each affected EGU within the State that commenced
( printed page 64953)
construction on or before January 8, 2014.
What affected EGUs must I address in my State plan?
(a) The EGUs that must be addressed by your plan are any affected steam generating unit, IGCC, or stationary combustion turbine that commenced construction on or before January 8, 2014.
(b) An affected EGU is a steam generating unit, IGCC, or stationary combustion turbine that meets the relevant applicability conditions specified in paragraph (b)(1) through (3) of this section, as applicable, except as provided in § 60.5850.
(1) Serves a generator or generators connected to a utility power distribution system with a nameplate capacity greater than 25 MW-net (
i.e.,
capable of selling greater than 25 MW of electricity);
(2) Has a base load rating (
i.e.,
design heat input capacity) greater than 260 GJ/hr (250 MMBtu/hr) heat input of fossil fuel (either alone or in combination with any other fuel); and
(3) Stationary combustion turbines that meet the definition of either a combined cycle or combined heat and power combustion turbine.
EGUs that are excluded from being affected EGUs are:
(a) EGUs that are subject to subpart TTTT of this part as a result of commencing construction after the subpart TTTT applicability date;
(b) Steam generating units and IGCCs that are, and always have been, subject to a federally enforceable permit limiting annual net-electric sales to one-third or less of its potential electric output, or 219,000 MWh or less;
(c) Non-fossil units (
i.e.,
units that are capable of combusting 50 percent or more non-fossil fuel) that have always historically limited the use of fossil fuels to 10 percent or less of the annual capacity factor or are subject to a federally enforceable permit limiting fossil fuel use to 10 percent or less of the annual capacity factor;
(d) Stationary combustion turbines not capable of combusting natural gas (
e.g.,
not connected to a natural gas pipeline);
(e) EGUs that are combined heat and power units that have always historically limited, or are subject to a federally enforceable permit limiting, annual net-electric sales to a utility distribution system to no more than the greater of either 219,000 MWh or the product of the design efficiency and the potential electric output;
(f) EGUs that serve a generator along with other steam generating unit(s), IGCC(s), or stationary combustion turbine(s) where the effective generation capacity (determined based on a prorated output of the base load rating of each steam generating unit, IGCC, or stationary combustion turbine) is 25 MW or less;
(g) EGUs that are a municipal waste combustor unit that is subject to subpart Eb of this part; and
(h) EGUs that are a commercial or industrial solid waste incineration unit that is subject to subpart CCCC of this part.
What are the CO2
emission performance rates for affected EGUs?
(a) You must require, in your plan, emission standards on affected EGUs to meet the CO2
emission performance rates listed in Table 1 of this subpart except as provided in paragraph (b) of this section. In addition, you must set CO2
emission performance rates for the interim steps, according to paragraph (a)(1) of this section, except as provided in paragraph (b) of this section.
(1) You must set CO2
emission performance rates for your affected EGUs to meet during the interim step periods on average and as applicable for the two subcategories of affected EGUs.
(2) [Reserved]
(b) You may elect to require your affected EGUs to meet emission standards that differ from the CO2
emission performance rates listed in Table 1 of this subpart, provided that you demonstrate that the affected EGUs in your State will collectively meet their CO2
emission performance rate by achieving statewide emission goals that are equivalent and no less stringent than the CO2
emission performance rates listed in Table 1, and provided that your equivalent statewide CO2
emission goals take one of the following forms:
(1) Average statewide rate-based CO2
emission goals listed in Table 2 of this subpart, except as provided in paragraphs (c) and (d); or
(2) Cumulative statewide mass-based CO2
emission goals listed in Table 3 of this subpart, except as provided in paragraphs (c) and (d) of this section.
(c) If your plan meets CO2
emission goals listed in paragraphs (b)(1) or (2) of this section you must develop your own interim step goals and final reporting period goal for your affected EGUs to meet either on average (in the case of rate-based goals) or cumulatively (in the case of mass-based goals). Additionally the following applies if you develop your own goals:
(1) The interim period and interim steps CO2
emission goals must be in the same form, either both rate (in units of pounds per net MWh) or both mass (in tons); and
(2) You must set interim step goals that will either on average or cumulatively meet the State's interim period goal, as applicable to a rate-based or mass-based CO2
emission goal.
(d) Your plan's interim period and final period CO2
emission goals required to be met pursuant to paragraph (b)(1) or (2) of this section, may be changed in the plan only according to situations listed in paragraphs (d)(1) through (3) of this section. If a situation requires a plan revision, you must follow the procedures in § 60.5785 to submit a plan revision.
(1) If your plan implements CO2
emission goals, you may submit a plan or plan revision, allowed in § 60.5785, to make corrections to them, subject to EPA's approval, as a result of changes in the inventory of affected EGUs; and
(2) If you elect to require your affected EGUs to meet emission standards to meet mass-based CO2
emission goals in your plan, you may elect to incorporate, as a matter of state law, the mass emissions from EGUs that are subject to subpart TTTT of this part that are considered new affected EGUs under subpart TTTT of this part.
(e) If your plan relies upon State measures in addition to or in lieu of emission standards, you must only use the mass-based goals allowed for in paragraph (b)(2) of this section to demonstrate that your affected EGUs are meeting the required emissions performance.
(f) Nothing in this subpart precludes an affected EGU from complying with its emission standard or you from meeting your obligations under the State plan.
What applicable monitoring, recordkeeping, and reporting requirements do I need to include in my plan for affected EGUs?
(a) Your plan must include monitoring for affected EGUs that is no less stringent than what is described in (a)(1) through (8) of this section.
(1) The owner or operator of an affected EGU (or group of affected EGUs that share a monitored common stack) that is required to meet rate-based or mass-based emission standards must prepare a monitoring plan in accordance with the applicable provisions in § 75.53(g) and (h) of this chapter, unless such a plan is already in place under another program that requires CO2
mass emissions to be monitored and reported according to part 75 of this chapter.
(2) For rate-based emission standards, each compliance period shall include
( printed page 64954)
only “valid operating hours” in the compliance period,
i.e.,
full or partial unit (or stack) operating hours for which:
(i) “Valid data” (as defined in § 60.5880) are obtained for all of the parameters used to determine the hourly CO2
mass emissions (lbs). For the purposes of this subpart, substitute data recorded under part 75 of this chapter are not considered to be valid data; and
(ii) The corresponding hourly net energy output value is also valid data (
Note:
For operating hours with no useful output, zero is considered to be a valid value).
(3) For rate-based emission standards, the owner or operator of an affected EGU must measure and report the hourly CO2
mass emissions (lbs) from each affected unit using the procedures in paragraphs (a)(3)(i) through (vi) of this section, except as otherwise provided in paragraph (a)(4) of this section.
(i) The owner or operator of an affected EGU must install, certify, operate, maintain, and calibrate a CO2
continuous emissions monitoring system (CEMS) to directly measure and record CO2
concentrations in the affected EGU exhaust gases emitted to the atmosphere and an exhaust gas flow rate monitoring system according to § 75.10(a)(3)(i) of this chapter. As an alternative to direct measurement of CO2
concentration, provided that the affected EGU does not use carbon separation (
e.g.,
carbon capture and storage), the owner or operator of an affected EGU may use data from a certified oxygen (O2) monitor to calculate hourly average CO2
concentrations, in accordance with § 75.10(a)(3)(iii) of this chapter. However, when an O2
monitor is used this way, it only quantifies the combustion CO2; therefore, if the EGU is equipped with emission controls that produce non-combustion CO2
(
e.g.,
from sorbent injection), this additional CO2
must be accounted for, in accordance with section 3 of appendix G to part 75 of this chapter. If CO2
concentration is measured on a dry basis, the owner or operator of the affected EGU must also install, certify, operate, maintain, and calibrate a continuous moisture monitoring system, according to § 75.11(b) of this chapter. Alternatively, the owner or operator of an affected EGU may either use an appropriate fuel-specific default moisture value from § 75.11(b) or submit a petition to the Administrator under § 75.66 of this chapter for a site-specific default moisture value.
(ii) For each “valid operating hour” (as defined in paragraph (a)(2) of this section), calculate the hourly CO2
mass emission rate (tons/hr), either from Equation F-11 in Appendix F to part 75 of this chapter (if CO2
concentration is measured on a wet basis), or by following the procedure in section 4.2 of Appendix F to part 75 of this chapter (if CO2
concentration is measured on a dry basis).
(iii) Next, multiply each hourly CO2
mass emission rate by the EGU or stack operating time in hours (as defined in § 72.2 of this chapter), to convert it to tons of CO2.
Multiply the result by 2,000 lbs/ton to convert it to lbs.
(iv) The hourly CO2
tons/hr values and EGU (or stack) operating times used to calculate CO2
mass emissions are required to be recorded under § 75.57(e) of this chapter and must be reported electronically under § 75.64(a)(6), if required by a plan. The owner or operator must use these data, or equivalent data, to calculate the hourly CO2
mass emissions.
(v) Sum all of the hourly CO2
mass emissions values from paragraph (a)(3)(ii) of this section over the entire compliance period.
(vi) For each continuous monitoring system used to determine the CO2
mass emissions from an affected EGU, the monitoring system must meet the applicable certification and quality assurance procedures in § 75.20 of this chapter and Appendices A and B to part 75 of this chapter.
(4) The owner or operator of an affected EGU that exclusively combusts liquid fuel and/or gaseous fuel may, as an alternative to complying with paragraph (a)(3) of this section, determine the hourly CO2
mass emissions according to paragraphs (a)(4)(i) through (a)(4)(vi) of this section.
(i) Implement the applicable procedures in appendix D to part 75 of this chapter to determine hourly EGU heat input rates (MMBtu/hr), based on hourly measurements of fuel flow rate and periodic determinations of the gross calorific value (GCV) of each fuel combusted. The fuel flow meter(s) used to measure the hourly fuel flow rates must meet the applicable certification and quality-assurance requirements in sections 2.1.5 and 2.1.6 of appendix D to part 75 (except for qualifying commercial billing meters). The fuel GCV must be determined in accordance with section 2.2 or 2.3 of appendix D, as applicable.
(ii) For each measured hourly heat input rate, use Equation G-4 in Appendix G to part 75 of this chapter to calculate the hourly CO2
mass emission rate (tons/hr).
(iii) For each “valid operating hour” (as defined in paragraph (a)(2) of this section), multiply the hourly tons/hr CO2
mass emission rate from paragraph (a)(4)(ii) of this section by the EGU or stack operating time in hours (as defined in § 72.2 of this chapter), to convert it to tons of CO2. Then, multiply the result by 2,000 lbs/ton to convert it to lbs.
(iv) The hourly CO2
tons/hr values and EGU (or stack) operating times used to calculate CO2
mass emissions are required to be recorded under § 75.57(e) of this chapter and must be reported electronically under § 75.64(a)(6), if required by a plan. You must use these data, or equivalent data, to calculate the hourly CO2
mass emissions.
(v) Sum all of the hourly CO2
mass emissions values (lb) from paragraph (a)(4)(iii) of this section over the entire compliance period.
(vi) The owner or operator of an affected EGU may determine site-specific carbon-based F-factors (Fc) using Equation F-7b in section 3.3.6 of appendix F to part 75 of this chapter, and may use these Fc
values in the emissions calculations instead of using the default Fc
values in the Equation G-4 nomenclature.
(5) For both rate-based and mass-based standards, the owner or operator of an affected EGU (or group of affected units that share a monitored common stack) must install, calibrate, maintain, and operate a sufficient number of watt meters to continuously measure and record on an hourly basis net electric output. Measurements must be performed using 0.2 accuracy class electricity metering instrumentation and calibration procedures as specified under ANSI Standards No. C12.20. Further, the owner or operator of an affected EGU that is a combined heat and power facility must install, calibrate, maintain and operate equipment to continuously measure and record on an hourly basis useful thermal output and, if applicable, mechanical output, which are used with net electric output to determine net energy output. The owner or operator must use the following procedures to calculate net energy output, as appropriate for the type of affected EGU(s).
(i) Determine Pnet
the hourly net energy output in MWh. For rate-based standards, perform this calculation only for valid operating hours (as defined in paragraph (a)(2) of this section). For mass-based standards, perform this calculation for all unit (or stack) operating hours,
i.e.,
full or partial hours in which any fuel is combusted.
(ii) If there is no net electrical output, but there is mechanical or useful thermal output, either for a particular valid operating hour (for rate-based
( printed page 64955)
applications), or for a particular operating hour (for mass-based applications), the owner or operator of the affected EGU must still determine the net energy output for that hour.
(iii) For rate-based applications, if there is no (
i.e.,
zero) gross electrical, mechanical, or useful thermal output for a particular valid operating hour, that hour must be used in the compliance determination. For hours or partial hours where the gross electric output is equal to or less than the auxiliary loads, net electric output shall be counted as zero for this calculation.
(iv) Calculate Pnet
for your affected EGU (or group of affected EGUs that share a monitored common stack) using the following equation. All terms in the equation must be expressed in units of MWh. To convert each hourly net energy output value reported under part 75 of this chapter to MWh, multiply by the corresponding EGU or stack operating time.
Where:
Pnet
= Net energy output of your affected EGU for each valid operating hour (as defined in 60.5860(a)(2)) in MWh.
(Pe)ST
= Electric energy output plus mechanical energy output (if any) of steam turbines in MWh.
(Pe)CT
= Electric energy output plus mechanical energy output (if any) of stationary combustion turbine(s) in MWh.
(Pe)IE
= Electric energy output plus mechanical energy output (if any) of your affected EGU's integrated equipment that provides electricity or mechanical energy to the affected EGU or auxiliary equipment in MWh.
(Pe)A
= Electric energy used for any auxiliary loads in MWh.
(Pt)PS
= Useful thermal output of steam (measured relative to SATP conditions, as applicable) that is used for applications that do not generate additional electricity, produce mechanical energy output, or enhance the performance of the affected EGU. This is calculated using the equation specified in paragraph (a)(5)(v) of this section in MWh.
(Pt)HR
= Non-steam useful thermal output (measured relative to SATP conditions, as applicable) from heat recovery that is used for applications other than steam generation or performance enhancement of the affected EGU in MWh.
(Pt)IE
= Useful thermal output (relative to SATP conditions, as applicable) from any integrated equipment is used for applications that do not generate additional steam, electricity, produce mechanical energy output, or enhance the performance of the affected EGU in MWh.
TDF = Electric Transmission and Distribution Factor of 0.95 for a combined heat and power affected EGU where at least on an annual basis 20.0 percent of the total gross or net energy output consists of electric or direct mechanical output and 20.0 percent of the total net energy output consist of useful thermal output on a 12-operating month rolling average basis, or 1.0 for all other affected EGUs.
(v) If applicable to your affected EGU (for example, for combined heat and power), you must calculate (Pt)PS
using the following equation:
Where:
Qm
= Measured steam flow in kilograms (kg) (or pounds (lbs)) for the operating hour.
H = Enthalpy of the steam at measured temperature and pressure (relative to SATP conditions or the energy in the condensate return line, as applicable) in Joules per kilogram (J/kg) (or Btu/lb).
CF = Conversion factor of 3.6 x 10⁹
J/MWh or 3.413 x 10⁶
Btu/MWh.
(vi) For rate-based standards, sum all of the values of Pnet
for the valid operating hours (as defined in paragraph (a)(2) of this section), over the entire compliance period. Then, divide the total CO2
mass emissions for the valid operating hours from paragraph (a)(3)(v) or (a)(4)(v) of this section, as applicable, by the sum of the Pnet
values for the valid operating hours plus any ERC replacement generation (as shown in § 60.5790(c)), to determine the CO2
emissions rate (lb/net MWh) for the compliance period.
(vii) For mass-based standards, sum all of the values of Pnet
for all operating hours, over the entire compliance period.
(6) In accordance with § 60.13(g), if two or more affected EGUs implementing the continuous emissions monitoring provisions in paragraph (a)(2) of this section share a common exhaust gas stack and are subject to the same emissions standard, the owner or operator may monitor the hourly CO2
mass emissions at the common stack in lieu of monitoring each EGU separately. If an owner or operator of an affected EGU chooses this option, the hourly net electric output for the common stack must be the sum of the hourly net electric output of the individual affected EGUs and the operating time must be expressed as “stack operating hours” (as defined in § 72.2 of this chapter).
(7) In accordance with § 60.13(g), if the exhaust gases from an affected EGU implementing the continuous emissions monitoring provisions in paragraph (a)(2) of this section are emitted to the atmosphere through multiple stacks (or if the exhaust gases are routed to a common stack through multiple ducts and you elect to monitor in the ducts), the hourly CO2
mass emissions and the “stack operating time” (as defined in § 72.2 of this chapter) at each stack or duct must be monitored separately. In this case, the owner or operator of an affected EGU must determine compliance with an applicable emissions standard by summing the CO2
mass emissions measured at the individual stacks or ducts and dividing by the net energy output for the affected EGU.
(8) Consistent with § 60.5775 or § 60.5780, if two or more affected EGUs serve a common electric generator, you must apportion the combined hourly net energy output to the individual affected EGUs according to the fraction of the total steam load contributed by each EGU. Alternatively, if the EGUs are identical, you may apportion the combined hourly net electrical load to the individual EGUs according to the fraction of the total heat input contributed by each EGU.
(b) For mass-based standards, the owner or operator of an affected EGU must determine the CO2
mass emissions (tons) for the compliance period as follows:
(1) For each operating hour, calculate the hourly CO2
mass (tons) according to paragraph (a)(3) or (4) of this section, except that a complete data record is required,
i.e.,
CO2
mass emissions must be reported for each operating hour. Therefore, substitute data values recorded under part 75 of this chapter for CO2
concentration, stack gas flow rate, stack gas moisture content, fuel flow rate and/or GCV shall be used in the calculations; and
(2) Sum all of the hourly CO2
mass emissions values over the entire compliance period.
(3) The owner or operator of an affected EGU must install, calibrate, maintain, and operate a sufficient number of watt meters to continuously
( printed page 64956)
measure and record on an hourly basis net electric output. Measurements must be performed using 0.2 accuracy class electricity metering instrumentation and calibration procedures as specified under ANSI Standards No. C12.20. Further, the owner or operator of an affected EGU that is a combined heat and power facility must install, calibrate, maintain and operate equipment to continuously measure and record on an hourly basis useful thermal output and, if applicable, mechanical output, which are used with net electric output to determine net energy output (Pnet). The owner or operator must calculate net energy output according to paragraphs (a)(5)(i)(A) and (B) of this section.
(c) Your plan must require the owner or operator of each affected EGU covered by your plan to maintain the records, as described in paragraphs (b)(1) and (2) of this section, for at least 5 years following the date of each compliance period, occurrence, measurement, maintenance, corrective action, report, or record.
(1) The owner or operator of an affected EGU must maintain each record on site for at least 2 years after the date of each compliance period, occurrence, measurement, maintenance, corrective action, report, or record, whichever is latest, according to § 60.7. The owner or operator of an affected EGU may maintain the records off site and electronically for the remaining year(s).
(2) The owner or operator of an affected EGU must keep all of the following records, in a form suitable and readily available for expeditious review:
(i) All documents, data files, and calculations and methods used to demonstrate compliance with an affected EGU's emission standard under § 60.5775.
(ii) Copies of all reports submitted to the State under paragraph (c) of this section.
(iv) Data with respect to any ERCs generated by the affected EGU or used by the affected EGU in its compliance demonstration including the information in paragraphs (c)(2)(iv)(A) and (B) of this section.
(A) All documents related to any ERCs used in a compliance demonstration, including each eligibility application, EM&V plan, M&V report, and independent verifier verification report associated with the issuance of each specific ERC.
(B) All records and reports relating to the surrender and retirement of ERCs for compliance with this regulation, including the date each individual ERC with a unique serial identification number was surrendered and/or retired.
(d) Your plan must require the owner or operator of an affected EGU covered by your plan to include in a report submitted to you at the end of each compliance period the information in paragraphs (d)(1) through (5) of this section.
(1) Owners or operators of an affected EGU must include in the report all hourly CO2
emissions, for each affected EGU (or group of affected EGUs that share a monitored common stack).
(2) For rate-based standards, each report must include:
(i) The hourly CO2
mass emission rate values (tons/hr) and unit (or stack) operating times, (as monitored and reported according to part 75 of this chapter), for each valid operating hour in the compliance period;
(ii) The net electric output and the net energy output (Pnet) values for each valid operating hour in the compliance period;
(iii) The calculated CO2
mass emissions (lb) for each valid operating hour in the compliance period;
(iv) The sum of the hourly net energy output values and the sum of the hourly CO2
mass emissions values, for all of the valid operating hours in the compliance period;
(v) ERC replacement generation (if any), properly justified (see paragraph (c)(5) of this section); and
(vi) The calculated CO2
mass emission rate for the compliance period (lbs/net MWh).
(3) For mass-based standards, each report must include:
(i) The hourly CO2
mass emission rate value (tons/hr) and unit (or stack) operating time, as monitored and reported according to part 75 of this chapter, for each unit or stack operating hour in the compliance period;
(ii) The calculated CO2
mass emissions (tons) for each unit or stack operating hour in the compliance period;
(iii) The sum of the CO2
mass emissions (tons) for all of the unit or stack operating hours in the compliance period;
(iv) The net electric output and the net energy output (Pnet) values for each unit or stack operating hour in the compliance period; and
(v) The sum of the hourly net energy output values for all of the unit or stack operating hours in the compliance period.
(vi) Notwithstanding the requirements in paragraphs (c)(3)(i) through (c)(3)(iii) of this section, if the compliance period is a discrete number of calendar years (
e.g.,
one year, three years), in lieu of reporting the information specified in those paragraphs, the owner or operator may report:
(A) The cumulative annual CO2
mass emissions (tons) for each year of the compliance period, derived from the electronic emissions report for the fourth calendar quarter of that year, submitted to EPA under § 75.64(a) of this chapter; and
(B) The sum of the cumulative annual CO2
mass emissions values from paragraph (c)(3)(v)(A) of this section, if the compliance period includes multiple years.
(4) For each affected EGU's compliance period, the report must also include the applicable emission standard and demonstration that it met the emission standard. An owner or operator must also include in the report the affected EGU's calculated emission performance as a CO2
emission rate or cumulative mass in units of the emission standard required in §§ 60.5790(b) through (c) and 60.5855, as applicable.
(5) If the owner or operator of an affected EGU is complying with an emission standard by using ERCs, they must include in the report a list of all unique ERC serial numbers that were retired in the compliance period, and, for each ERC, the date an ERC was surrendered and retired and eligible resource identification information sufficient to demonstrate that it meets the requirements of § 60.5800 and qualifies to be issued ERCs (including location, type of qualifying generation or savings, date commenced generating or saving, and date of generation or savings for which the ERC was issued).
(6) If the owner or operator of an affected EGU is complying with an emission standard by using allowances, they must include in the report a list of all unique allowance serial numbers that were retired in the compliance period, and, for each allowance, the date an allowance was surrendered and retired and if the allowance was a set-aside allowance the eligible resource identification information sufficient to demonstrate that it meets the requirements of § 60.5815(c) and qualifies to be issued set-aside allowances (including location, type of qualifying generation or savings, date commenced generating or saving, and date of generation or savings for which the allowance was issued).
(e) The owner or operator of an affected EGU must follow any additional requirements for monitoring, recordkeeping and reporting in a plan that are required under § 60.5745(a)(4), if applicable.
( printed page 64957)
(f) If an affected EGU captures CO2
to meet the applicable emission limit, the owner or operator must report in accordance with the requirements of 40 CFR part 98 subpart PP and either:
(1) Report in accordance with the requirements of 40 CFR part 98 subpart RR, if injection occurs on-site;
(2) Transfer the captured CO2
to an EGU or facility that reports in accordance with the requirements of 40 CFR part 98 subpart RR, if injection occurs off-site; or
(3) Transfer the captured CO2
to a facility that has received an innovative technology waiver from EPA pursuant to paragraph (g) of this section.
(g) Any person may request the Administrator to issue a waiver of the requirement that captured CO2
from an affected EGU be transferred to a facility reporting under 40 CFR part 98 subpart RR. To receive a waiver, the applicant must demonstrate to the Administrator that its technology will store captured CO2
as effectively as geologic sequestration, and that the proposed technology will not cause or contribute to an unreasonable risk to public health, welfare, or safety. In making this determination, the Administrator shall consider (among other factors) operating history of the technology, whether the technology will increase emissions or other releases of any pollutant other than CO2, and permanence of the CO2
storage. The Administrator may test the system itself, or require the applicant to perform any tests considered by the Administrator to be necessary to show the technology's effectiveness, safety, and ability to store captured CO2
without release. The Administrator may grant conditional approval of a technology, the approval conditioned on monitoring and reporting of operations. The Administrator may also withdraw approval of the waiver on evidence of releases of CO2
or other pollutants. The Administrator will provide notice to the public of any application under this provision, and provide public notice of any proposed action on a petition before the Administrator takes final action.
(a) You must keep records of all information relied upon in support of any demonstration of plan components, plan requirements, supporting documentation, State measures, and the status of meeting the plan requirements defined in the plan for each interim step and the interim period. After 2029, States must keep records of all information relied upon in support of any continued demonstration that the final CO2
emission performance rates or CO2
emissions goals are being achieved.
(b) You must keep records of all data submitted by the owner or operator of each affected EGU that is used to determine compliance with each affected EGU emissions standard or requirements in an approved State plan, consistent with the affected EGU requirements listed in § 60.5860.
(c) If your State has a requirement for all hourly CO2
emissions and net generation information to be used to calculate compliance with an annual emissions standard for affected EGUs, any information that is submitted by the owners or operators of affected EGUs to the EPA electronically pursuant to requirements in Part 75 meets the recordkeeping requirement of this section and you are not required to keep records of information that would be in duplicate of paragraph (b) of this section.
(d) You must keep records at a minimum for 10 years, for the interim period, and 5 years, for the final period, from the date the record is used to determine compliance with an emissions standard, plan requirement, CO2
emission performance rate or CO2
emissions goal. Each record must be in a form suitable and readily available for expeditious review.
What are my reporting and notification requirements?
(a) In lieu of the annual report required under § 60.25(e) and (f) of this part, you must report the information in paragraphs (b) through (f) of this section.
(b) You must submit a report covering each interim step within the interim period and each of the final 2-calendar year periods due no later than July 1 of the year following the end of the period. The interim period reporting starts with a report covering interim step 1 due no later than July 1, 2025. The final period reports start with a biennial report covering the first final reporting period (which is due by July 1, 2032), a 2-calendar year average of emissions or cumulative sum of emissions used to determine compliance with the final CO2
emission performance rate or CO2
emission goal (as applicable). The report must include the information in paragraphs (b)(1) through (4) of this section.
(1) The report must include the emissions performance achieved by all affected EGUs during the reporting period, consistent with the plan approach according to § 60.5745(a), and identification of whether each affected EGU is in compliance with its emission standard and whether the collective of all affected EGUs covered by the State are on schedule to meet the applicable CO2
emission performance rate or emission goal during the performance periods and compliance periods, as specified in the plan.
(2) The report must include a comparison of the CO2
emission performance rate or CO2
emission goal identified in the State plan for the applicable interim step period versus the actual average, cumulative, or adjusted CO2
emission performance (as applicable) achieved by all affected EGUs.
(i) For interim step 3, you do not need to include a comparison between the applicable interim step 3 CO2
emission performance rate or emission goal; you must only submit the average, cumulative or adjusted CO2
emission performance (as applicable) of your affected EGUs during that period in units of your applicable CO2
emission performance rate or emission goal.
(3) The report must include all other required information, as specified in your State plan according to § 60.5740(a)(5).
(4) If applicable, the report must include a program review that your State has conducted that addresses all aspects of the administration of the State plan and overall program, including State evaluations and regulatory decisions regarding eligibility applications for ERC resources and M&V reports (and associated EM&V activities), and State issuance of ERCs. The program review must assess whether the program is being administered properly in accordance with the approved plan, whether reported annual MWh of generation and savings from qualified ERC resources are being properly quantified, verified, and reported in accordance with approved EM&V plans, and whether appropriate records are being maintained. The program review must also address determination of the eligibility of verifiers by the State and the conduct of independent verifiers, including the quality of verifier reviews.
(c) If your plan relies upon State measures, in lieu of or in addition to emission standards, then you must submit an annual report to the EPA in addition to the reports required under paragraph (b) of this section for the interim period. In the final period, you must submit biennial reports consistent with those required under paragraph (b) of this section. The annual reports in the interim period must be submitted no later than July 1 following the end of each calendar year starting with 2022.
( printed page 64958)
The annual and biennial reports must include the information in paragraphs (c)(1) and (2) of this section for the preceding year or two years, as applicable.
(1) You must include in your report the status of implementation of federally enforceable emission standards (if applicable) and State measures.
(2) You must include information regarding the status of the periodic programmatic milestones to show progress in program implementation. The programmatic milestones with specific dates for achievement must be consistent with the State measures included in the State plan submittal.
(d) If your plan includes the requirement for emission standards on your affected EGUs, then you must submit a notification, if applicable, in the report required under paragraph (b) of this section to the EPA if your affected EGUs trigger corrective measures as described in § 60.5740(a)(2)(i). If corrective measures are required and were not previously submitted with your state plan, you must follow the requirements in § 60.5785 for revising your plan to implement the corrective measures.
(e) If your plan relies upon State measures, in lieu of or in addition to emission standards, than you must submit a notification as required under paragraphs (e)(1) and (2) of this section.
(1) You must submit a notification in the report required under paragraph (c) of this section to the EPA if at the end of the calendar year your State did not meet a programmatic milestone included in your plan submittal. This notification must detail the implementation of the backstop required in your plan to be fully in place within 18 months of the due date of the report required in paragraph (b) of this section. In addition, the notification must describe the steps taken by the State to inform the affected EGUs in its State that the backstop has been triggered.
(2) You must submit a notification in the report required under paragraph (b) of this section to the EPA if you trigger the backstop as described in § 60.5740(a)(3)(i). This notification must detail the steps that will be taken by you to implement the backstop so that it is fully in place within 18 months of the due date of the report required in paragraph (b) of this section. In addition, the notification must describe the steps taken by the State to inform the affected EGUs that the backstop has been triggered.
(f) You must include in your 2029 report (which is due by July 1, 2030) the calculation of average CO2
emissions rate, cumulative sum of CO2
emissions, or adjusted CO2
emissions rate (as applicable) over the interim period and a comparison of those values to your interim CO2
emission performance rate or emission goal. The calculated value must be in units consistent with the approach you set in your plan for the interim period.
(g) The notifications listed in paragraphs (g)(1) through (3) of this section are required for the reliability safety valve allowed in § 60.5785(e).
(1) As required under § 60.5785(e), you must submit an initial notification to the appropriate EPA regional office within 48 hours of an unforeseen, emergency situation. The initial notification must:
(i) Include a full description, to the extent that it is known, of the emergency situation that is being addressed;
(ii) Identify the affected EGU or EGUs that are required to run to assure reliability; and
(iii) Specify the modified emission standards at which the identified EGU or EGUs will operate.
(2) Within 7 days of the initial notification in § 60.5870(g)(1), the State must submit a second notification to the appropriate EPA regional office that documents the initial notification. If the State fails to submit this documentation on a timely basis, the EPA will notify the State, which must then notify the affected EGU(s) that they must operate or resume operations under the original approved State plan emission standards. This notification must include the following:
(i) A full description of the reliability concern and why an unforeseen, emergency situation that threatens reliability requires the affected EGU or EGUs to operate under modified emission standards from those originally required in the State plan including discussion of why the flexibilities provided under the state's plan are insufficient to address the concern;
(ii) A description of how the State is coordinating or will coordinate with relevant reliability coordinators and planning authorities to alleviate the problem in an expedited manner;
(iii) An indication of the maximum time that the State anticipates the affected EGU or EGUs will need to operate in a manner inconsistent with its or their obligations under the State's approved plan;
(iv) A written concurrence from the relevant reliability coordinator and/or planning authority confirming the existence of the imminent reliability threat and supporting the temporary modification request or an explanation of why this kind of concurrence cannot be provided;
(v) The modified emission standards or levels that the affected EGU or EGU will be operating at for the remainder of the 90-day period if it has changed from the initial notification; and
(vi) Information regarding any system-wide or other analysis of the reliability concern conducted by the relevant planning authority, if any.
(3) At least 7 days before the end of the 90-day reliability safety valve period, the State must notify the appropriate EPA regional office that either:
(i) The reliability concern has been addressed and the affected EGU or EGUs can resume meeting the original emission standards in the State plan approved prior to the short-term modification; or
(ii) There still is a serious, ongoing reliability issue that necessitates the affected EGU or EGUs to emit beyond the amount allowed under the State plan. In this case, the State must provide a notification to the EPA that it will be submitting a State plan revision according to paragraph § 60.5785(a) of this section to address the reliability issue. The notification must provide the date by which a revised State plan will be submitted to EPA and documentation of the ongoing emergency with a written concurrence from the relevant reliability coordinator and/or planning authority confirming the continuing urgent need for the affected EGU or EGUs to operate beyond the requirements of the State plan and that there is no other reasonable way of addressing the ongoing reliability emergency but for the affected EGU or EGUs to operate under an alternative emission standard than originally approved under the State plan. After the initial 90-day period, any excess emissions beyond what is authorized in the original approved State plan will count against the State's overall CO2
emission goal or emission performance rate for affected EGUs.
How do I submit information required by these Emission Guidelines to the EPA?
(a) You must submit to the EPA the information required by these emission guidelines following the procedures in paragraphs (b) through (e) of this section.
(b) All negative declarations, State plan submittals, supporting materials that are part of a State plan submittal, any plan revisions, and all State reports required to be submitted to the EPA by the State plan must be reported through EPA's State Plan Electronic Collection
( printed page 64959)
System (SPeCS). SPeCS is a web accessible electronic system accessed at the EPA's Central Data Exchange (CDX) (
https://www.epa.gov/cdx/). States who claim that a State plan submittal or supporting documentation includes confidential business information (CBI) must submit that information on a compact disc, flash drive, or other commonly used electronic storage media to the EPA. The electronic media must be clearly marked as CBI and mailed to U.S. EPA/OAQPS/CORE CBI Office, Attention: State and Local Programs Group, MD C539-01, 4930 Old Page Rd., Durham, NC 27703.
(c) Only a submittal by the Governor or the Governor's designee by an electronic submission through SPeCS shall be considered an official submittal to the EPA under this subpart. If the Governor wishes to designate another responsible official the authority to submit a State plan, the EPA must be notified via letter from the Governor prior to the September 6, 2016, deadline for plan submittal so that the official will have the ability to submit the initial or final plan submittal in the SPeCS. If the Governor has previously delegated authority to make CAA submittals on the Governor's behalf, a State may submit documentation of the delegation in lieu of a letter from the Governor. The letter or documentation must identify the designee to whom authority is being designated and must include the name and contact information for the designee and also identify the State plan preparers who will need access to SPeCS. A State may also submit the names of the State plan preparers via a separate letter prior to the designation letter from the Governor in order to expedite the State plan administrative process. Required contact information for the designee and preparers includes the person's title, organization and email address.
(d) The submission of the information by the authorized official must be in a non-editable format. In addition to the non-editable version all plan components designated as federally enforceable must also be submitted in an editable version. Following initial plan approval, States must provide the EPA with an editable copy of any submitted revision to existing approved federally enforceable plan components, including State plan backstop measures. The editable copy of any such submitted plan revision must indicate the changes made at the State level, if any, to the existing approved federally enforceable plan components, using a mechanism such as redline/strikethrough. These changes are not part of the State plan until formal approval by EPA.
(e) You must provide the EPA with non-editable and editable copies of any submitted revision to existing approved federally enforceable plan components, including State plan backstop measures. The editable copy of any such submitted plan revision must indicate the changes made at the State level, if any, to the existing approved federally enforceable plan components, using a mechanism such as redline/strikethrough. These changes are not part of the State plan until formal approval by EPA.
As used in this subpart, all terms not defined herein will have the meaning given them in the Clean Air Act and in subparts A, B, and TTTT, of this part.
Adjusted CO2
Emission Rate Means
(1) For an affected EGU, the reported CO2
emission rate of an affected EGU, adjusted as described in § 60.5790(c)(1) to reflect any ERCs used by an affected EGU to demonstrate compliance with its CO2
emission standards; or
(2) For a State (or states in a multi-state plan) calculating a collective CO2
emission rate achieved under the plan, the actual CO2
emission rate during a plan reporting period of the affected EGUs subject to the rate specified in the plan, adjusted by the ERCs used for compliance by those EGUs (total CO2
mass divided by the sum of the total MWh and ERCs).
Affected electric generating unit
or
Affected EGU
means a steam generating unit, integrated gasification combined cycle (IGCC), or stationary combustion turbine that meets the relevant applicability conditions in section § 60.5845.
Allowance
means an authorization for each specified unit of actual CO2
emitted from an affected EGU or a facility during a specified period.
Allowance system
means a control program under which the owner or operator of each affected EGU is required to hold an allowance for each specified unit of CO2
emitted from that affected EGU or facility during a specified period and which limits the total amount of such allowances for a specified period and allows the transfer of such allowances.
Annual capacity factor
means the ratio between the actual heat input to an EGU during a calendar year and the potential heat input to the EGU had it been operated for 8,760 hours during a calendar year at the base load rating.
Base load rating
means the maximum amount of heat input (fuel) that an EGU can combust on a steady-state basis, as determined by the physical design and characteristics of the EGU at ISO conditions. For a stationary combustion turbine,
base load rating
includes the heat input from duct burners.
Biomass
means biologically based material that is living or dead (
e.g.,
trees, crops, grasses, tree litter, roots) above and below ground, and available on a renewable or recurring basis. Materials that are biologically based include non-fossilized, biodegradable organic material originating from modern or contemporarily grown plants, animals, or microorganisms (including plants, products, byproducts and residues from agriculture, forestry, and related activities and industries, as well as the non-fossilized and biodegradable organic fractions of industrial and municipal wastes, including gases and liquids recovered from the decomposition of non-fossilized and biodegradable organic material).
CO2emission goal
means a statewide rate-based CO2
emission goal or mass-based CO2
emission goal specified in § 60.5855.
Combined cycle unit
means an electric generating unit that uses a stationary combustion turbine from which the heat from the turbine exhaust gases is recovered by a heat recovery steam generating unit to generate additional electricity.
Combined heat and power unit
or
CHP unit, (
also known as “cogeneration”) means an electric generating unit that uses a steam-generating unit or stationary combustion turbine to simultaneously produce both electric (or mechanical) and useful thermal output from the same primary energy source.
Compliance period
means a discrete time period for an affected EGU to comply with either an emission standard or State measure.
Demand-side energy efficiency project
means an installed piece of equipment or system, a modification of an existing piece of equipment or system, or a strategy intended to affect consumer electricity-use behavior, that results in a reduction in electricity use (in MWh) at an end-use facility, premises, or equipment connected to the electricity grid.
Derate
means a decrease in the available capacity of an electric generating unit, due to a system or equipment modification or to discounting a portion of a generating unit's capacity for planning purposes.
Eligible resource
means a resource that meets the requirements of § 60.5800(a).
( printed page 64960)
Emission Rate Credit or ERC
means a tradable compliance instrument that meets the requirements of § 60.5790(c).
EM&V plan
means a plan that meets the requirements of § 60.5830.
ERC tracking system
means a system for the issuance, surrender and retirement of ERCs that meets the requirements of § 60.5810.
Final period
means the period that begins on January 1, 2030, and continues thereafter. The final period is comprised of final reporting periods, each of which may be no longer than two calendar years (with a calendar year beginning on January 1 and ending on December 31).
Final reporting period
means an increment of plan performance within the final period, with each final reporting period being no longer than two calendar years (with a calendar year beginning on January 1 and ending on December 31), with the first final reporting period in the final period beginning on January 1, 2030, and ending no later than December 31, 2031.
Fossil fuel
means natural gas, petroleum, coal, and any form of solid fuel, liquid fuel, or gaseous fuel derived from such material for the purpose of creating useful heat.
Heat recovery steam generating unit
(HRSG) means a unit in which hot exhaust gases from the combustion turbine engine are routed in order to extract heat from the gases and generate useful output. Heat recovery steam generating units can be used with or without duct burners.
Independent verifier
means a person (including any individual, corporation, partnership, or association) who has the appropriate technical and other qualifications to provide verification reports. The independent verifier must not have, or have had, any direct or indirect financial or other interest in the subject of its verification report or ERCs that could impact their impartiality in performing verification services.
Integrated gasification combined cycle facility
or
IGCC
means a combined cycle facility that is designed to burn fuels containing 50 percent (by heat input) or more solid-derived fuel not meeting the definition of natural gas plus any integrated equipment that provides electricity or useful thermal output to either the affected facility or auxiliary equipment. The Administrator may waive the 50 percent solid-derived fuel requirement during periods of the gasification system construction, startup and commissioning, shutdown, or repair. No solid fuel is directly burned in the unit during operation.
Interim period
means the period of eight calendar years from January 1, 2022, to December 31, 2029. The interim period is composed three interim steps, interim step 1, interim step 2, and interim step 3.
Interim step
means an increment of plan performance within the interim period.
Interim step 1
means the period of three calendar years from January 1, 2022, to December 31, 2024.
Interim step 2
means the period of three calendar years from January 1, 2025, to December 31, 2027.
Interim step 3
means the period of two calendar years from January 1, 2028, to December 31, 2029.
ISO conditions
means 288 Kelvin (15 °C), 60 percent relative humidity and 101.3 kilopascals pressure.
M&V report
means a report that meets the requirements of § 60.5835.
Mechanical output
means the useful mechanical energy that is not used to operate the affected facility, generate electricity and/or thermal output, or to enhance the performance of the affected facility. Mechanical energy measured in horsepower hour must be converted into MWh by multiplying it by 745.7 then dividing by 1,000,000.
Nameplate capacity
means, starting from the initial installation, the maximum electrical generating output that a generator, prime mover, or other electric power production equipment under specific conditions designated by the manufacturer is capable of producing (in MWe, rounded to the nearest tenth) on a steady-state basis and during continuous operation (when not restricted by seasonal or other deratings) as of such installation as specified by the manufacturer of the equipment, or starting from the completion of any subsequent physical change resulting in an increase in the maximum electrical generating output that the equipment is capable of producing on a steady-state basis and during continuous operation (when not restricted by seasonal or other deratings), such increased maximum amount (in MWe, rounded to the nearest tenth) as of such completion as specified by the person conducting the physical change.
Natural gas
means a fluid mixture of hydrocarbons (
e.g.,
methane, ethane, or propane), composed of at least 70 percent methane by volume or that has a gross calorific value between 35 and 41 megajoules (MJ) per dry standard cubic meter (950 and 1,100 Btu per dry standard cubic foot), that maintains a gaseous State under ISO conditions. In addition, natural gas contains 20.0 grains or less of total sulfur per 100 standard cubic feet. Finally, natural gas does not include the following gaseous fuels: Landfill gas, digester gas, refinery gas, sour gas, blast furnace gas, coal-derived gas, producer gas, coke oven gas, or any gaseous fuel produced in a process which might result in highly variable sulfur content or heating value.
Net allowance export/import
means a net transfer of CO2
allowances during an interim step, the interim period, or a final reporting period which represents the net number of CO2
allowances (issued by a State) that are transferred from the compliance accounts of affected EGUs in that state to the compliance accounts of affected EGUs in another State. This net transfer is determined based on compliance account holdings at the end of the plan performance period. Compliance account holdings, as used here, refer to the number of CO2
allowances surrendered for compliance during a plan performance period, as well as any remaining CO2
allowances held in a compliance account as of the end of a plan performance period.
Net electric output
means the amount of gross generation the generator(s) produce (including, but not limited to, output from steam turbine(s), combustion turbine(s), and gas expander(s)), as measured at the generator terminals, less the electricity used to operate the plant (
i.e.,
auxiliary loads); such uses include fuel handling equipment, pumps, fans, pollution control equipment, other electricity needs, and transformer losses as measured at the transmission side of the step up transformer (
e.g.,
the point of sale).
Net energy output
means:
(1) The net electric or mechanical output from the affected facility, plus 100 percent of the useful thermal output measured relative to SATP conditions that is not used to generate additional electric or mechanical output or to enhance the performance of the unit (
e.g.,
steam delivered to an industrial process for a heating application).
(2) For combined heat and power facilities where at least 20.0 percent of the total gross or net energy output consists of electric or direct mechanical output and at least 20.0 percent of the total gross or net energy output consists of useful thermal output on a 12-operating month rolling average basis, the net electric or mechanical output from the affected EGU divided by 0.95, plus 100 percent of the useful thermal output; (
e.g.,
steam delivered to an industrial process for a heating application).
Programmatic milestone
means the implementation of measures necessary for plan progress, including specific dates associated with such
( printed page 64961)
implementation. Prior to January 1, 2022, programmatic milestones are applicable to all state plan approaches and measures. Subsequent to January 1, 2022, programmatic milestones are applicable to state measures.
Qualified biomass
means a biomass feedstock that is demonstrated as a method to control increases of CO2
levels in the atmosphere.
Standard ambient temperature
and pressure (SATP) conditions means 298.15 Kelvin (25 °C, 77 °F)) and 100.0 kilopascals (14.504 psi, 0.987 atm) pressure. The enthalpy of water at SATP conditions is 50 Btu/lb.
State agent
means an entity acting on behalf of the State, with the legal authority of the State.
State measures
means measures that are adopted, implemented, and enforced as a matter of State law. Such measures are enforceable only per State law, and are not included in and codified as part of the federally enforceable State plan.
Stationary combustion turbine
means all equipment, including but not limited to the turbine engine, the fuel, air, lubrication and exhaust gas systems, control systems (except emissions control equipment), heat recovery system, fuel compressor, heater, and/or pump, post-combustion emissions control technology, and any ancillary components and sub-components comprising any simple cycle stationary combustion turbine, any combined cycle combustion turbine, and any combined heat and power combustion turbine based system plus any integrated equipment that provides electricity or useful thermal output to the combustion turbine engine, heat recovery system or auxiliary equipment. Stationary means that the combustion turbine is not self-propelled or intended to be propelled while performing its function. It may, however, be mounted on a vehicle for portability. If a stationary combustion turbine burns any solid fuel directly it is considered a steam generating unit.
Steam generating unit
means any furnace, boiler, or other device used for combusting fuel and producing steam (nuclear steam generators are not included) plus any integrated equipment that provides electricity or useful thermal output to the affected facility or auxiliary equipment.
Uprate
means an increase in available electric generating unit power capacity due to a system or equipment modification.
Useful thermal output
means the thermal energy made available for use in any heating application (
e.g.,
steam delivered to an industrial process for a heating application, including thermal cooling applications) that is not used for electric generation, mechanical output at the affected EGU, to directly enhance the performance of the affected EGU (
e.g.,
economizer output is not useful thermal output, but thermal energy used to reduce fuel moisture is considered useful thermal output), or to supply energy to a pollution control device at the affected EGU. Useful thermal output for affected EGU(s) with no condensate return (or other thermal energy input to the affected EGU(s)) or where measuring the energy in the condensate (or other thermal energy input to the affected EGU(s)) would not meaningfully impact the emission rate calculation is measured against the energy in the thermal output at SATP conditions. Affected EGU(s) with meaningful energy in the condensate return (or other thermal energy input to the affected EGU) must measure the energy in the condensate and subtract that energy relative to SATP conditions from the measured thermal output.
Valid data
means quality-assured data generated by continuous monitoring systems that are installed, operated, and maintained according to part 75 of this chapter. For CEMS, the initial certification requirements in § 75.20 of this chapter and appendix A to part 75 of this chapter must be met before quality-assured data are reported under this subpart; for on-going quality assurance, the daily, quarterly, and semiannual/annual test requirements in sections 2.1, 2.2, and 2.3 of appendix B to part 75 of this chapter must be met and the data validation criteria in sections 2.1.5, 2.2.3, and 2.3.2 of appendix B to part 75 of this chapter apply. For fuel flow meters, the initial certification requirements in section 2.1.5 of appendix D to part 75 of this chapter must be met before quality-assured data are reported under this subpart (except for qualifying commercial billing meters under section 2.1.4.2 of appendix D), and for on-going quality assurance, the provisions in section 2.1.6 of appendix D to part 75 of this chapter apply (except for qualifying commercial billing meters).
Waste-to-Energy
means a process or unit (
e.g.,
solid waste incineration unit) that recovers energy from the conversion or combustion of waste stream materials, such as municipal solid waste, to generate electricity and/or heat.
Table 1 to Subpart UUUU of Part 60—CO2
Emission Performance Rates
[Pounds of CO2
per net MWh]
Affected EGU
Interim rate
Final rate
Steam generating unit or integrated gasification combined cycle (IGCC)
1,534
1,305
Stationary combustion turbine
832
771
Table 2 to Subpart UUUU of Part 60—Statewide Rate-Based CO2
Emission Goals
[Pounds of CO2
per net MWh]
State
Interim emission goal
Final emission goal
Alabama
1,157
1,018
Arizona
1,173
1,031
Arkansas
1,304
1,130
California
907
828
Colorado
1,362
1,174
Connecticut
852
786
Delaware
1,023
916
Florida
1,026
919
Georgia
1,198
1,049
Idaho
832
771
Illinois
1,456
1,245
( printed page 64962)
Indiana
1,451
1,242
Iowa
1,505
1,283
Kansas
1,519
1,293
Kentucky
1,509
1,286
Lands of the Fort Mojave Tribe
832
771
Lands of the Navajo Nation
1,534
1,305
Lands of the Uintah and Ouray Reservation
1,534
1,305
Louisiana
1,293
1,121
Maine
842
779
Maryland
1,510
1,287
Massachusetts
902
824
Michigan
1,355
1,169
Minnesota
1,414
1,213
Mississippi
1,061
945
Missouri
1,490
1,272
Montana
1,534
1,305
Nebraska
1,522
1,296
Nevada
942
855
New Hampshire
947
858
New Jersey
885
812
New Mexico
1,325
1,146
New York
1,025
918
North Carolina
1,311
1,136
North Dakota
1,534
1,305
Ohio
1,383
1,190
Oklahoma
1,223
1,068
Oregon
964
871
Pennsylvania
1,258
1,095
Rhode Island
832
771
South Carolina
1,338
1,156
South Dakota
1,352
1,167
Tennessee
1,411
1,211
Texas
1,188
1,042
Utah
1,368
1,179
Virginia
1,047
934
Washington
1,111
983
West Virginia
1,534
1,305
Wisconsin
1,364
1,176
Wyoming
1,526
1,299
Table 3 to Subpart UUUU of Part 60—Statewide Mass-Based CO2
Emission Goals
[Short tons of CO2]
State
Interim emission goal (2022-2029)
Final emission goals
(2 year blocks starting with 2030-2031)
Alabama
497,682,304
113,760,948
Arizona
264,495,976
60,341,500
Arkansas
269,466,064
60,645,264
California
408,216,600
96,820,240
Colorado
267,103,064
59,800,794
Connecticut
57,902,920
13,883,046
Delaware
40,502,952
9,423,650
Florida
903,877,832
210,189,408
Georgia
407,408,672
92,693,692
Idaho
12,401,136
2,985,712
Illinois
598,407,008
132,954,314
Indiana
684,936,520
152,227,670
Iowa
226,035,288
50,036,272
Kansas
198,874,664
43,981,652
Kentucky
570,502,416
126,252,242
Lands of the Fort Mojave Tribe
4,888,824
1,177,038
Lands of the Navajo Nation
196,462,344
43,401,174
Lands of the Uintah and Ouray Reservation
20,491,560
4,526,862
Louisiana
314,482,512
70,854,046
Maine
17,265,472
4,147,884
Maryland
129,675,168
28,695,256
Massachusetts
101,981,416
24,209,494
Michigan
424,457,200
95,088,128
( printed page 64963)
Minnesota
203,468,736
45,356,736
Missouri
500,555,464
110,925,768
Mississippi
218,706,504
50,608,674
Montana
102,330,640
22,606,214
Nebraska
165,292,128
36,545,478
Nevada
114,752,736
27,047,168
New Hampshire
33,947,936
7,995,158
New Jersey
139,411,048
33,199,490
New Mexico
110,524,488
24,825,204
New York
268,762,632
62,514,858
North Carolina
455,888,200
102,532,468
North Dakota
189,062,568
41,766,464
Ohio
660,212,104
147,539,612
Oklahoma
356,882,656
80,976,398
Oregon
69,145,312
16,237,308
Pennsylvania
794,646,616
179,644,616
Rhode Island
29,259,080
7,044,450
South Carolina
231,756,984
51,997,936
South Dakota
31,591,600
7,078,962
Tennessee
254,278,880
56,696,792
Texas
1,664,726,728
379,177,684
Utah
212,531,040
47,556,386
Virginia
236,640,576
54,866,222
Washington
93,437,656
21,478,344
West Virginia
464,664,712
102,650,684
Wisconsin
250,066,848
55,973,976
Wyoming
286,240,416
63,268,824
Table 4 to Subpart UUUU of Part 60— Statewide Mass-based CO2
Goals plus New Source CO2
Emission Complement
[Short tons of CO2]
State
Interim emission goal (2022-2029)
Final emission goals
(2 year blocks starting with 2030-2031)
Alabama
504,534,496
115,272,348
Arizona
275,895,952
64,760,392
Arkansas
272,756,576
61,371,058
California
430,988,824
105,647,270
Colorado
277,022,392
63,645,748
Connecticut
58,986,192
14,121,986
Delaware
41,133,688
9,562,772
Florida
917,904,040
213,283,190
Georgia
412,826,944
93,888,808
Idaho
13,155,256
3,278,026
Illinois
604,953,792
134,398,348
Indiana
692,451,256
153,885,208
Iowa
228,426,760
50,563,762
Kansas
200,960,120
44,441,644
Kentucky
576,522,048
127,580,002
Lands of the Fort Mojave Tribe
5,186,112
1,292,276
Lands of the Navajo Nation
202,938,832
45,911,608
Lands of the Uintah and Ouray Reservation
21,167,080
4,788,708
Louisiana
318,356,976
71,708,642
Maine
17,592,128
4,219,936
Maryland
131,042,600
28,996,872
Massachusetts
103,782,424
24,606,744
Michigan
429,446,408
96,188,604
Minnesota
205,761,008
45,862,346
Mississippi
221,990,024
51,332,926
Missouri
505,904,560
112,105,626
Montana
105,704,024
23,913,816
Nebraska
167,021,320
36,926,888
Nevada
120,916,064
29,436,214
New Hampshire
34,519,280
8,121,182
New Jersey
141,919,248
33,752,728
New Mexico
114,741,592
26,459,850
( printed page 64964)
New York
272,940,440
63,436,364
North Carolina
461,424,928
103,753,712
North Dakota
191,025,152
42,199,354
Ohio
667,812,080
149,215,950
Oklahoma
361,531,056
82,001,704
Oregon
72,774,608
17,644,106
Pennsylvania
804,705,296
181,863,274
Rhode Island
29,819,360
7,168,032
South Carolina
234,516,064
52,606,510
South Dakota
31,963,696
7,161,036
Tennessee
257,149,584
57,329,988
Texas
1,707,356,792
396,210,498
Utah
220,386,616
50,601,386
Virginia
240,240,880
55,660,348
Washington
97,691,736
23,127,324
West Virginia
469,488,232
103,714,614
Wisconsin
252,985,576
56,617,764
Wyoming
295,724,848
66,945,204
Footnotes
1.
Under CAA section 111(d), pursuant to 40 CFR 60.22(b)(5), states must establish, in their state plans, emission standards that reflect the degree of emission limitation achievable through the application of the “best system of emission reduction” that, taking into account the cost of achieving such reduction and any non-air quality health and environmental impacts and energy requirements, the Administrator determines has been adequately demonstrated (
i.e.,
the BSER). Under CAA section 111(a)(1) and (d), the EPA is authorized to determine the BSER and to calculate the amount of emission reduction achievable through applying the BSER. The state is authorized to identify the emission standard or standards that reflect that amount of emission reduction.
2.
In the case of a tribe that has one or more affected EGUs in its area of Indian country, the tribe has the opportunity, but not the obligation, to establish a CO2
emission standard for each affected EGU located in its area of Indian country and a CAA section 111(d) plan for its area of Indian country. If the tribe chooses to establish its own plan, it must seek and obtain authority from the EPA to do so pursuant to 40 CFR 49.9. If it chooses not to seek this authority, the EPA has the responsibility to determine whether it is necessary or appropriate, in order to protect air quality, to establish a CAA section 111(d) plan for an area of Indian country where affected EGUs are located.
4.
The EPA's proposed CAA section 111(d) federal plan and model rules for existing fossil fuel-fired EGUs are being published concurrently with this final rule.
5.
The final emission guidelines for landfill gas emissions from municipal solid waste landfills, published on March 12, 1996, and amended on June 16, 1998 (61 FR 9905 and 63 FR 32743, respectively), provide an example, as the guidelines allow either of two approaches for controlling landfill gas—by recovering the gas as a fuel, for sale, and removing from the premises, or by destroying the organic content of the gas on the premises using a control device. Recovering the gas as a fuel source was a practice already being used by some affected sources prior to promulgation of the rulemaking.
6.
The EPA notes that, in quantifying the emission reductions that are achievable through application of the BSER, some building blocks will apply to some, but not all, affected EGUs. Specifically, building block 1 will apply to affected coal-fired steam EGUs, building block 2 will apply to all affected steam EGUs (both coal-fired and oil/gas-fired), and building block 3 will apply to all affected EGUs.
7.
The CAA section 111(d) emission guidelines apply to the 50 states, the District of Columbia, U.S. territories, and any Indian tribe that has been approved by the EPA pursuant to 40 CFR 49.9 as eligible to develop and implement a CAA section 111(d) plan. In this preamble, in instances where these governments are not specifically listed, the term “state” is used to represent them. Because Vermont and the District of Columbia do not have affected EGUs, they will not be required to submit a state plan. Because the EPA does not possess all of the information or analytical tools needed to quantify the BSER for the two non-contiguous states with affected EGUs (Alaska and Hawaii) and the two U.S. territories with affected EGUs (Guam and Puerto Rico), we are not finalizing emission performance rates in those areas at this time, and those areas will not be required to submit state plans until we do.
11.
A state that chooses to set emission standards that are identical to the emission performance rates for both the interim period and in 2030 and beyond need not identify interim state goals nor include a separate demonstration that its plan will achieve the state goals.
17.
Intergovernmental Panel on Climate Change (IPCC) report, “Contribution of Working Group I to the Fourth Assessment Report of the Intergovernmental Panel on Climate Change,” 2007. Available at
https://epa.gov/climatechange/ghgemissions/global.html.
19.
U.S. Global Change Research Program, Climate Change Impacts in the United States: The Third National Climate Assessment, May 2014. Available at
https://nca2014.globalchange.gov/.
24.
Federal Power Comm'n
v.
Florida Power & Light Co.,
404 U.S. 453, at 460 (1972) (quoting a Federal Power Commission hearing examiner, “ `If a housewife in Atlanta on the Georgia system turns on a light, every generator on Florida's system almost instantly is caused to produce some quantity of additional electric energy which serves to maintain the balance in the interconnected system between generation and load.' ”) (citation omitted).
See also New York
v.
FERC,
535 U.S. 1, at 7-8 (2002) (stating that “any electricity that enters the grid immediately becomes a part of a vast pool of energy that is constantly moving in interstate commerce.”) (citation omitted). In
Federal Power Comm'n
v.
Southern California Edison Co.,
376 U.S. 205 (1964), the Supreme Court found that a sale for resale of electricity from Southern California Edison to the City of Colton, which took place solely in California, was under Federal Power Commission jurisdiction because some of the electricity that Southern California Edison marketed came from out of state. The Supreme Court stated that, “ `federal jurisdiction was to follow the flow of electric energy, an engineering and scientific, rather than a legalistic or governmental, test.' ”
Id.
at 210,
quoting Connecticut Light & Power Co.
v.
Federal Power Commission,
324 U.S. 515, 529 (1945) (emphasis omitted).
26.
Although CO2
is the predominant greenhouse gas released by the power sector, electricity generating units also emit small amounts of nitrous oxide and methane. For more detail about power sector emissions, see RIA Chapter 2 and the U.S. Greenhouse Gas Reporting Program's power sector summary,
https://www.epa.gov/ghgreporting/ghgdata/reported/powerplants.html.
27.
A job-year is not an individual job; rather, a job-year is the amount of work performed by the equivalent of one full-time individual for one year. For example, 20 job-years in 2025 may represent 20 full-time jobs or 40 half-time jobs.
28.
The EPA also published in the
Federal Register
a notice of data availability (79 FR 64543; November 8, 2014) and a notice on the translation of emission rate-based CO2
goals to mass-based equivalents (79 FR 67406; November 13, 2014).
30.
“Endangerment and Cause or Contribute Findings for Greenhouse Gases Under Section 202(a) of the Clean Air Act,” 74 FR 66496 (Dec. 15, 2009) (“Endangerment Finding”).
31.
IPCC, 2014:
Climate Change 2014: Impacts, Adaptation, and Vulnerability. Part B: Regional Aspects.
Contribution of Working Group II to the Fifth Assessment Report of the Intergovernmental Panel on Climate Change [Barros, V.R., C.B. Field, D.J. Dokken, M.D. Mastrandrea, K.J. Mach, T.E. Bilir, M. Chatterjee, K.L. Ebi, Y.O. Estrada, R.C. Genova, B. Girma, E.S. Kissel, A.N. Levy, S. MacCracken, P.R. Mastrandrea, and L.L. White (eds.)]. Cambridge University Press, Cambridge, p. 1581.
https://www.ipcc.ch/report/ar5/wg2/.
35.
Melillo, Jerry M., Terese (T.C.) Richmond, and Gary W. Yohe, Eds., 2014:
Climate Change Impacts in the United States: The Third National Climate Assessment.
U.S. Global Change Research Program, p. 9.
36.
Melillo, Jerry M., Terese (T.C.) Richmond, and Gary W. Yohe, Eds., 2014:
Climate Change Impacts in the United States: The Third National Climate Assessment.
U.S. Global Change Research Program, p. 17.
37.
IPCC, 2014:
Climate Change 2014: Impacts, Adaptation, and Vulnerability. Part A: Global and Sectoral Aspects.
Contribution of Working Group II to the Fifth Assessment Report of the Intergovernmental Panel on Climate Change [Field, C.B., V.R. Barros, D.J. Dokken, K.J. Mach, M.D. Mastrandrea, T.E. Bilir, M. Chatterjee, K.L. Ebi, Y.O. Estrada, R.C. Genova, B. Girma, E.S. Kissel, A.N. Levy, S. MacCracken, P.R. Mastrandrea, and L.L. White (eds.)]. Cambridge University Press, p. 796.
https://www.ipcc.ch/report/ar5/wg2/.
45.
The emission data presented in this section of the preamble (Section II.B) are in metric tons, in keeping with reporting requirements for the GHGRP and the U.S. GHG Inventory. Note that the mass-based state goals presented in section VII of this preamble, and discussed elsewhere in this preamble, are presented in short tons.
50.
The energy sector includes all greenhouse gases resulting from stationary and mobile energy activities, including fuel combustion and fugitive fuel emissions.
56.
This includes NAAQS and HAPs, based on the following table: (see table above).
It should be noted that PM2.5
is included in the amounts for PM10
. Lead, another NAAQS pollutant, is emitted in the amounts of approximately 1,000 tons per year, and, in light of that relatively small quantity, was excluded from this analysis. Ammonia (NH3) is included because it is a precursor to PM2.5
secondary formation. Note that one short ton is equivalent to 0.907185 metric ton.
57.
In addition, emissions of non-CO2
GHGs totaled 1.168 billion metric tons of carbon-dioxide equivalents (CO2
e) in 2013. See Table ES-2, Executive Summary, 1990-2013 Inventory of U.S. Greenhouse Gas Emissions and Sinks.
https://www.epa.gov/climatechange/Downloads/ghgemissions/US-GHG-Inventory-2015-Chapter-Executive-Summary.pdf.
This includes emissions of methane, nitrous oxide, and fluorinated GHGs (hydrofluorocarbons, perfluorocarbons, sulfur hexafluoride, and nitrogen trifluoride). In the total, the emissions of each non-CO2
GHG have been translated from metric tons of that gas into metric tons of CO2
e by multiplying the metric tons of the gas by the global warming potential (GWP) of the gas. (The GWP of a gas is a measure of the ability of one kilogram of that gas to trap heat in earth's atmosphere compared to one kilogram of CO2.)
60.
As another point of comparison, except for carbon dioxide, SO2
and NOX
are the largest air pollutant emissions from coal-fired power plants. Over the past decade, U.S. power plants have emitted more than 200 times as much CO2
as they have emitted SO2
and NOX.
See
de Gouw et al., “Reduced emissions of CO2,
NOX, and SO2
from U.S. power plants owing to switch from coal to natural gas with combined cycle technology,” Earth's Future (2014).
62.
Seinfeld J. and Pandis S., Atmospheric Chemistry and Physics: From Air Pollution to Climate Change (1998).
63.
The fact that CO2
is unreactive means that it is primarily removed from the atmosphere by dissolving in oceans or by being converted into biomass by plants. Herzog, H., “Scaling up carbon dioxide capture and storage: From megatons to gigatons”, Energy Economics (2011).
66.
Casazza, J. and Delea, F.,
Understanding Electric Power Systems,
IEEE Press, at 5-6 (2d ed. 2010). Investment in electric generation is extremely capital intensive, with generation potentially accounting for 65 percent of customer costs. If these costs can be spread to more customers, then this can reduce the amount that each individual customer pays. Federal Energy Regulatory Commission,
Energy Primer: A Handbook of Energy Market Basics,
at 38 (2012),
available at https://www.ferc.gov/market-oversight/guide/energy-primer.pdf.
83.
Maryland Department of Natural Resources,
Maryland Power Plants and the Environment: A Review of the Impacts of Power Plants and Transmission Lines on Maryland's Natural Resources,
at 2-5 (2006),
available at https://esm.versar.com/pprp/ceir13/toc.htm.
86.
For example, in 1978, Congress passed the Public Utilities Regulatory Policies Act (PURPA) which allowed non-utility owned power plants to sell electricity. Burn, An Energy Journal,
The Electricity Grid: A History, available at https://burnanenergyjournal.com/the-electric-grid-a-history/
(last visited Mar. 9, 2015). PURPA, the Energy Policy Act of 1992 (EPAct 1992), and the Energy Policy Act of 2005 (EPAct 2005) “promoted competition by lowering entry barriers and increasing transmission access.” The Electric Energy Market Competition Task Force,
Report to Congress on Competition in Wholesale and Retail Markets for Electric Energy,
at 2,
available at https://www.ferc.gov/legal/fed-sta/ene-pol-act/epact-final-rpt.pdf
(last visited Mar. 20, 2015).
91.
Investor-owned utilities are private companies that are financed by a combination of shareholder equity and bondholder debt. Regulatory Assistance Project (RAP),
Electricity Regulation in the US: A Guide,
at 9 (2011),
available at https://www.raponline.org/document/download/id/645.
92.
Consumer-owned utilities include municipal utilities, public utility districts, cooperatives, and a variety of other entities such as irrigation districts. Regulatory Assistance Project (RAP),
Electricity Regulation in the US: A Guide,
at 9-10 (2011),
available athttps://www.raponline.org/document/download/id/645.
93.
Peter Fox-Penner,
Electric Utility Restructuring: A Guide to the Competitive Era,
Public Utility Reports, Inc., at 5, 34 (1997). “The extent of the power system's short-run physical interdependence is remarkable, if not entirely unique. No other large, multi-stage industry is required to keep every single producer in a region—whether or not owned by the same company—in immediate synchronization with all other producers.”
Id.
at 34. “At an early date, those providing electric power recognized that peak use for one system often occurred at a different time from peak use in other systems. They also recognized that equipment failures occurred at different times in various systems. Analyses showed significant economic benefits from interconnecting systems to provide mutual assistance; the investment required for generating capacity could be reduced and reliability could be improved. This lead [sic] to the development of local, then regional, and subsequently three transmission grids that covered the U.S. and parts of Canada.” Casazza, J. and Delea, F.,
Understanding Electric Power Systems,
IEEE Press, at 5-6 (2d ed. 2010).
94.
Burn, An Energy Journal,
The Electricity Grid: A History, available athttps://burnanenergyjournal.com/the-electric-grid-a-history/
(last visited Mar. 9, 2015). Because of the ease and low cost of converting voltages in an alternating current (AC) system from one level to another, the bulk power system is predominantly an AC system rather than a direct current (DC) system. In an AC system, electricity cannot be controlled like a gas or liquid by utilizing a valve in a pipe. Instead, absent the presence of expensive control devices, electricity flows freely along all available paths, according to the laws of physics. U.S.-Canada Power System Outage Task Force,
Final Report on the August 14, 2003 Blackout in the United States and Canada: Causes and Recommendations,
at 6 (Apr. 2004),
available at https://www.ferc.gov/industries/electric/indus-act/reliability/blackout/ch1-3.pdf.
98.
Casazza, J. and Delea, F.,
Understanding Electric Power Systems,
IEEE Press, at 159 (2d ed. 2010). In an amicus brief to the Supreme Court, a group of electrical engineers, economists, and physicists specializing in electricity explained, “
Energy
is transmitted, not electrons. Energy transmission is accomplished through the propagation of an electromagnetic wave. The electrons merely oscillate in place, but the
energy
—the
electromagnetic wave
—moves at the speed of light. The energized electrons making the lightbulb in a house glow are not the same electrons that were induced to oscillate in the generator back at the power plant. . . . Energy flowing onto a power network or grid
energizes the entire grid,
and consumers then draw undifferentiated energy from that grid. A networked grid flexes, and electric current flows, in conformity with physical laws, and those laws do not notice, let alone conform to, political boundaries. . . . The path taken by electric energy is the path of least resistance . . . or, more accurately, the
paths
of least resistance. . . . If a generator on the grid increases its output, the current flowing from the generator on all paths on the grid increases. These increases affect the energy flowing
into
each point in the network, which in turn leads to compensating and corresponding changes in the energy flows
out
of each point.” Brief Amicus Curiae of Electrical Engineers, Energy Economists and Physicists in Support of Respondents at 2, 8-9, 11, New York v. FERC, 535 U.S. 1 (2001) (No. 00-568).
99.
“Measures using demand-side resources comprise actions taken on the customer's side of the meter to change the amount and/or timing of electricity use in ways that will provide benefits to the electricity supply system.” David Crossley, Regulatory Assistance Project (RAP),
Effective Mechanisms to Increase the Use of Demand-Side Resources,
at 9 (2013),
available atwww.raponline.org.
100.
Energy efficiency is using less energy to provide the same or greater level of service. Demand-side energy efficiency refers to an extensive array of technologies, practices and measures that are applied throughout all sectors of the economy to reduce energy demand while providing the same, and sometimes better, level and quality of service.
101.
Demand response involves “[c]hanges in electric usage by demand-side resources from their normal consumption patterns in response to changes in the price of electricity over time, or to incentive payments designed to induce lower electricity use at times of high wholesale market prices or when system reliability is jeopardized.” Federal Energy Regulatory Commission,
Reports on Demand Response & Advanced Metering,
(Dec. 23, 2014),
available athttps://www.ferc.gov/industries/electric/indus-act/demand-response/dem-res-adv-metering.asp.
104.
Federal Power Comm'n
v.
Florida Power & Light Co.,
404 U.S. 453, at 460 (1972) (quoting a Federal Power Commission hearing examiner, “`If a housewife in Atlanta on the Georgia system turns on a light, every generator on Florida's system almost instantly is caused to produce some quantity of additional electric energy which serves to maintain the balance in the interconnected system between generation and load.'”) (citation omitted).
See also New York
v.
FERC,
535 U.S. 1, at 7 (2002) (stating that “any electricity that enters the grid immediately becomes a part of a vast pool of energy that is constantly moving in interstate commerce.”) (citation omitted). In
Federal Power Comm'n
v.
Southern California Edison Co.,
376 U.S. 205 (1964), the Supreme Court found that a sale for resale of electricity from Southern California Edison to the City of Colton, which took place solely in California, was under Federal Power Commission jurisdiction because some of the electricity that Southern California Edison marketed came from out of state. The Supreme Court stated that, “`federal jurisdiction was to follow the flow of electric energy, an engineering and scientific, rather than a legalistic or governmental, test.'”
Id.
at 210 (quoting
Connecticut Light & Power Co.
v.
Federal Power Commission,
324 U.S. 515, 529 (1945) (emphasis omitted)).
111.
Federal Energy Regulatory Commission,
Security Constrained Economic Dispatch: Definitions, Practices, Issues and Recommendations: A Report to Congress
(July 31, 2006). The Energy Policy Act of 2005 defined economic dispatch as “the operation of generation facilities to produce energy at the lowest cost to reliably serve consumers, recognizing any operational limits of generation and transmission facilities.” Energy Policy Act of 2005, Pub. L. 109-58, 119 Stat. 594 (2005), section 1234(b),
available athttps://www.ferc.gov/industries/electric/indus-act/joint-boards/final-cong-rpt.pdf.
112.
Variable costs also include costs associated with operation and maintenance and costs of operating a pollution control and/or emission allowance charges.
115.
The Federal Power Commission, a precursor to FERC, recommended “the formation of a council on power coordination made up of representatives from each of the nation's regional coordinating organizations, to exchange and disseminate information and to review, discuss and assist in resolving interregional coordination matters.” North American Electric Reliability Corporation,
History of NERC,
at 1 (2013),
available athttps://www.nerc.com/AboutNERC/Documents/History%20AUG13.pdf.
119.
U.S.-Canada Power System Outage Task Force,
Final Report on the August 14, 2003 Blackout in the United States and Canada: Causes and Recommendations,
at 1 (Apr. 2004),
available at https://www.ferc.gov/industries/electric/indus-act/reliability/blackout/ch1-3.pdf.
The outage impacted areas within Ohio, Michigan, Pennsylvania, New York, Vermont, Massachusetts, Connecticut, New Jersey, and the Canadian province of Ontario.
Id.
122.
Rules Concerning Certification of the Electric Reliability Organization; and Procedures for the Establishment, Approval, and Enforcement of Electric Reliability Standards,
Order No. 672, 114 FERC ¶ 61,104 (2006).
126.
North American Electric Reliability Corporation,
Key Players, available at https://www.nerc.com/AboutNERC/keyplayers/Pages/default.aspx
(last visited Mar. 12, 2015). “The members of the regional entities come from all segments of the electric industry: investor-owned utilities; federal power agencies; rural electric cooperatives; state, municipal and provincial utilities; independent power producers; power marketers; and end-use customers.”
Id.
127.
North American Electric Reliability Corporation,
Frequently Asked Questions,
at 5 (2013),
available at https://www.nerc.com/AboutNERC/Documents/NERC%20FAQs%20AUG13.pdf.
For example, a regional entity may propose reliability standards, including regional variances or regional reliability standards required to maintain and enhance electric service reliability, adequacy, and security in the region.
See, e.g., Amended and Restated Delegation Agreement Between North American Reliability Corporation and Midwest Reliability Organization, Bylaws of the Midwest Reliability Organization, Inc.,
Section 2.2 (2012),
available athttps://www.nerc.com/FilingsOrders/us/Regional%20Delegation%20Agreements%20DL/MRO_RDA_Effective_20130612.pdf.
129.
ISOs/RTOs plan for system needs by “effectively managing the load forecasting, transmission planning, and system and resource planning functions.” For example, the New York Independent System Operator (NYISO) conducts reliability planning studies, which “are used to assess current reliability needs based on user trends and historical energy use.” NYISO,
Planning Studies, available at https://www.nyiso.com/public/markets_operations/services/planning/planning_studies/index.jsp. See also
PJM,
Reliability Assessments, available at https://www.pjm.com/planning/rtep-development/reliability-assessments.aspx
(stating that the PJM “Regional Transmission Expansion Planning (RTEP) process includes the development of periodic reliability assessments to address specific system reliability issues in addition to the ongoing expansion planning process for the interconnection process of generation and merchant transmission.”).
131.
U.S. Energy Information Administration, “Table 7.2b Electricity Net Generation: Electric Power Sector” data from Monthly Energy Review May 2015, release data April 25, 2014,
available at https://www.eia.gov/totalenergy/data/monthly/pdf/sec7_6.pdf
(last visited May 26, 2015).
132.
U.S. Energy Information Administration, “Table 7.2b Electricity Net Generation: Electric Power Sector” data from Monthly Energy Review May 2015, release data April 25, 2014,
available at https://www.eia.gov/totalenergy/data/monthly/pdf/sec7_6.pdf
(last visited May 26, 2015).
133.
Based on Table 6.3 (New Utility Scale Generating Units by Operating Company, Plant, Month, and Year) of the U.S. Energy Information Administration (EIA) Electric Power Monthly, data for December 2013, for the following RE sources: solar, wind, hydro, geothermal, landfill gas, and biomass. Available at
https://www.eia.gov/electricity/monthly/epm_table_grapher.cfm?t=epmt_6_03.
135.
Bloomberg New Energy Finance and the Business Council for Sustainable Energy,
2015 Factbook: Sustainable Energy in America,
at 16 (2015),
available at https://www.bcse.org/images/2015%20Sustainable%20Energy%20in%20America%20Factbook.pdf.
Bloomberg gave projections for 2014 values, accounting for seasonality, based on latest monthly values from EIA (data available through October 2014).
137.
EIA,
Annual Energy Outlook for 2015 with Projections to 2040, Final Release, available at https://www.eia.gov/forecasts/AEO/pdf/0383(2015).pdf.
The AEO numbers include projects that are under development and model-projected nuclear, coal, and NGCC projects.
138.
American Society for Civil Engineers,
2013 Report Card for America's Infrastructure
(2013),
available at https://www.infrastructurereportcard .org/energy/.
139.
American Society for Civil Engineers,
2013 Report Card for America's Infrastructure
(2013),
available at https://www.infrastructurereportcard .org/energy/.
142.
U.S. Energy Information Administration (EIA),
Annual Energy Outlook 2015 with Projections to 2040,
at 24-25 (2015),
available at https://www.eia.gov/forecasts/aeo/pdf/0383(2015).pdf. According to the EIA, the reference case assumes, “Real gross domestic product (GDP) grows at an average annual rate of 2.4% from 2013 to 2040, under the assumption that current laws and regulations remain generally unchanged throughout the projection period. North Sea Brent crude oil prices rise to $141/barrel (bbl) (2013 dollars) in 2040.”
Id.
at 1. The EIA provides complete projection tables for the reference case in Appendix A of its report.
144.
Cogeneration facilities utilize a single source of fuel to produce both electricity and another form of energy such as heat or steam. Casazza, J. and Delea, F.,
Understanding Electric Power Systems,
IEEE Press, at 220-221 (2d ed. 2010).
147.
Energy Information Administration, Annual Energy Outlook 2015 with Projections to 2040, at ES-6 (2014) and Energy Information Administration, Monthly Energy Review, May 2015, Table 7.2b,
available at https://www.eia.gov/totalenergy/data/monthly/pdf/sec7_6.pdf.
148.
Non-hydro RE capacity for the total electric power industry was more than 16,000 megawatts (MW) in 1998. Energy Information Administration, 1990-2013 Existing Nameplate and Net Summer Capacity by Energy Source Producer Type and State (EIA-860),
available at https://www.eia.gov/electricity/data/state/.
154.
Edison Electric Institute,
Making a Business of Energy Efficiency: Sustainable Business Models for Utilities,
at 1 (2007),
available athttps://www.eei.org/whatwedo/PublicPolicyAdvocacy/StateRegulation/Documents/Making_Business_Energy_Efficiency.pdf.
Congress passed legislation in the 1970s that jumpstarted energy efficiency in the U.S. For example, President Ford signed the Energy Policy and Conservation Act (EPCA) of 1975—the first law on the issue. EPCA authorized the Federal Energy Administration (FEA) to “develop energy conservation contingency plans, established vehicle fuel economy standards, and authorized the creation of efficiency standards for major household appliances.” Alliance to Save Energy,
History of Energy Efficiency,
at 6 (2013) (citing Anders,
“The Federal Energy Administration,”
5; Energy Policy and Conservation Act, S. 622, 94th Cong. (1975-1976)),
available at https://www.ase.org/sites/ase.org/files/resources/Media%20browser/ee_commission_history_report_2-1-13.pdf.
155.
American Council for an Energy-Efficient Economy,
State Energy Efficiency Resource Standards (EERS)
(2014),
available at https://aceee.org/files/pdf/policy-brief/eers-04-2014.pdf.
ACEEE did not include Indiana (EERS eliminated), Delaware (EERS pending), Florida (programs funded at levels far below what is necessary to meet targets), Utah, or Virginia (voluntary standards) in its calculation.
162.
U.S. Dept. of Energy, Energy Information Administration, “The Effects of Title IV of the Clean Air Act Amendments of 1990 on Electric Utilities: An Update,” p. vii. (March 1997).
166.
Such plans may simply state that the owner or operator expects to hold sufficient allowances or, in the case of alternative compliance methods, must provide a “comprehensive description of the schedule and means by which the unit will rely on one or more alternative methods of compliance in the manner and time authorized under [Title IV].” 42 U.S.C. 7651g(b).
173.
63 FR at 57377-78. In addition to EGUs, the NOX
SIP Call also set budgets based on highly cost-effective emission reductions from certain other large sources.
Id.
178.
76 FR at 48270. The EPA adopted this approach in part to comport with the D.C. Circuit's opinion in
North Carolina
v.
EPA
remanding CAIR.
Id.
at 48270-71.
183.
70 FR 28606, at 28617. The EPA's projections under CAIR showed a significant number of affected sources would install scrubbers for SO2
and selective catalytic reduction for NOX
on coal-fired power plants, which had the co-benefit of capturing mercury emissions.
Id.
at 28619.
199.
The following discussion is not meant to be exhaustive. There are many other instances outside the context of the CAA, before and after 1970, when Congress discussed or was presented with evidence on climate change.
201.
Council on Environmental Quality, “The First Annual Report of the Council on Environmental Quality,” p. 110 (Aug. 1970) (recognizing also that “[man] can increase the carbon dioxide content of the atmosphere by burning fossil fuels” and postulating that an increase in the earth's average temperature by about 2° to 3° F “could in a period of decades, lead to the start of substantial melting of ice caps and flooding of coastal regions.”).
203.
Testimony of Charles Johnson, Jr., Administrator of the Consumer Protection and Environmental Health Service (Administration Testimony), Hearing of the House Subcommittee on Public Health and Welfare (Mar. 16, 1970), 1970 CAA Legis. Hist. at 1381.
204.
Testimony of Charles Johnson, Jr., Administrator of the Consumer Protection and Environmental Health Service (Administration Testimony), Hearing of the House Subcommittee on Public Health and Welfare (Mar. 16, 1970), 1970 CAA Legis. Hist. at 1381.
205.
Testimony of Charles Johnson, Jr., Administrator of the Consumer Protection and Environmental Health Service (Administration Testimony), Hearing of the House Subcommittee on Public Health and Welfare (Mar. 16, 1970), 1970 CAA Legis. Hist. at 1381.
206.
For instance, while scientists, such as Stephen Schneider of the National Center for Atmospheric Research, testified that “manmade pollutants will affect the climate,” they believed that we would “see a general cooling of the Earth's atmosphere.” Rep. Scheuer, H. Debates on H.R. 10498 (Sept. 15, 1976), 1977 CAA Legis. Hist. at 6477. Additionally, the Department of Transportation's climatic impact assessment program and the Climatic Impact Committee of the National Research Council, National Academies of Science and Engineering both reported that “warming or cooling” could occur.
Id.
at 6476.
See also
Sen. Bumpers, S. Debates on S. 3219 (August 3, 1976), 1977 CAA Legis. Hist. at 5368 (inserting “Summary of Statements Received [in the Subcommittee on the Environment and the Atmosphere] from Professional Societies for the Hearings on Effects of Chronic Pollution” into the record, which noted that “there is near unamity [sic] that carbon dioxide concentrations in the atmosphere are increasing rapidly.”).
208.
Peterson, Thomas C., William M. Connolley, and John Fleck, “The Myth of the 1970s Global Cooling Scientific Consensus,” Bulletin of the American Meteorological Society, p. 1326 (September 2008),
available at https://journals.ametsoc.org/doi/pdf/10.1175/2008BAMS2370.1.
213.
Article 2, Objective, The ultimate objective of this Convention and any related legal instruments that the Conference of the Parties may adopt is to achieve, in accordance with the relevant provisions of the Convention, stabilization of greenhouse gas concentrations in the atmosphere at a level that would prevent dangerous anthropogenic interference with the climate system. Such a level should be achieved within a time frame sufficient to allow ecosystems to adapt naturally to climate change, to ensure that food production is not threatened and to enable economic development to proceed in a sustainable manner.
https://unfccc.int/files/essential_background/convention/background/application/pdf/convention_text_with_annexes_english_for_posting.pdf
218.
President Obama stated, in announcing the Climate Action Plan:
“The actions I've announced today should send a strong signal to the world that America intends to take bold action to reduce carbon pollution. We will continue to lead by the power of our example, because that's what the United States of America has always done.” President Obama, Climate Action Plan speech, Georgetown University, 2013. Available at
https://www.whitehouse.gov/the-press-office/2013/06/25/remarks-president-climate-change.
221.
Sen. Muskie, S. Debate on S. 4358 (Sept. 21, 1970), 1970 CAA Legis. Hist. at 224. These pollutants fell into five main classes of pollutants: Carbon monoxide, particulates, sulfur oxides, hydrocarbons, and nitrogen oxides.
See
Sen. Boggs,
id.
at 244.
223.
“Clean Air Act Amendments of 1970,” Pub. L. 91-604, § 4, 84 Stat. 1676, 1678 (Dec. 31, 1970). The “adverse effect” criterion was later amended to refer to pollutants “which may reasonably be anticipated to endanger public health or welfare”.
See 42 U.S.C. 7408(a)(1)(A). Similar language is also used under the current CAA section 111.
See 42 U.S.C. 7411(b)(1)(A).
232.
“Clean Air Act Amendments of 1990,” Pub. L. 101-549, § 403, 104 Stat. 2399, 2631 (Nov. 15, 1990) (retaining only the obligation to account for “any nonair quality health and environmental impact and energy requirements” that was added in 1977).
233.
As CAA section 111(d) was originally adopted, state plans would have established “emission standards” instead of “standards of performance.” This distinction was later abandoned in 1977 and the same term is used in both CAA sections 111(b) and (d).
236.
S. 4358, 91st Cong. § 6 (1970) (emphasis added). The breadth of the Senate bill is further emphasized in the conference report, which explains that a standard of performance “refers to the degree of emission control which can be achieved through process changes, operation changes, direct emission control, or other methods” and also includes “other means of preventing or controlling air pollution.” S. Rep. No. 91-1196, at 15-16 (Sept. 17, 1970).
240.
S. Rep. No. 91-1196, at 20 (Sept. 17, 1970) (discussing the relationship between sections 114 (addressing emission standards for “selected air pollution agents”) and 115 (addressing hazardous air pollutants) of the Senate bill).
243.
“Standards of Performance for New Stationary Sources: Proposed Standards for Five Categories,” 36 FR 15704 (Aug. 17, 1971).
See
“Clean Air Act Amendments of 1970,” § 4, 84 Stat. at 1684 (requiring the Administrator to publish a list of categories of stationary sources within 90 days of the enactment of the 1970 CAA Amendments).
248.
For example, Congress recognized that many air pollutants had not been regulated despite “mounting evidence” that these pollutants “are associated with serious health hazards”. H.R. Rep. No. 94-1175, 22 (May, 15, 1976). Because EPA “failed to promulgate regulations to institute adequate control measures,” Congress ordered EPA to regulate four specific pollutants that had “been found to be cancer-causing or cancer-promoting”.
Id.
at 23. This directive, reflected in CAA section 122, specifically added radioactive pollutants, cadmium, arsenic, and polycyclic organic matter “under the various provisions of the Clean Air Act and allows their regulation as criteria pollutants under ambient air quality standards, as hazardous air pollutants, or under new source performance standards, as appropriate.” H.R. Conf. Rep. No. 95-564, 142 (Aug. 3, 1977), 1977 CAA Legis. Hist. at 522. At the same time, Congress made sure that these commands would have no effect on the Administrator's discretion to address “any substance (whether or not enumerated [under CAA section 122(a))” under CAA sections 108, 112, or 111. 42 U.S.C. 7422(b).
249.
See
Statement of EPA Administrator Costle, S. Hearings on S. 272, S. 273, S. 977, and S. 1469 (Apr. 5, 7, May 25, June 24 and 30, 1977), 1977 CAA Legis. Hist. at 3532.
252.
H.R. Rep. No. 95-294, at 192 (May 12, 1977). Congress separately defined “technological system of continuous emission reduction” as “(A) a technological process for production or operation by any source which is inherently low-polluting or nonpolluting, or (B) technological system for continuous reduction of the pollution generated by a source before such pollution is emitted into the ambient air, including precombustion cleaning or treatment of fuels.” “Clean Air Act Amendments of 1977,” § 109, 91 Stat. at 700;
see also42 U.S.C. 7411(a)(7).
257.
This concept was already reflected in the EPA's CAA section 111(d) implementing regulations under 40 CFR 60.24(f).
See 40 FR 53340, 53347 (Nov. 17, 1975).
260.
Congress also updated the regulatory schedule that was added in the 1977 CAA Amendments to reflect the newly enacted 1990 CAA Amendments.
See
“Clean Air Act Amendments of 1990,” § 108, 104 Stat. 2467.
268.
The EPA is aware of at least four affected sources located in Indian Country: Two on Navajo lands—the Navajo Generating Station and the Four Corners Generating Station; one on Ute lands—the Bonanza Generating Station; and one on Fort Mojave lands, the South Point Energy Center. The affected EGUs at the first three plants are coal-fired EGUs. The fourth affected EGU is an NGCC facility.
271.
40 CFR 60.22. In the 1975 rulemaking, the EPA explained that it used the term “emission guidelines”—instead of emissions limitations—to make clear that guidelines would not be binding requirements applicable to the sources, but instead are “criteria for judging the adequacy of State plans.” 40 FR at 53343.
275.
See
“Phosphate Fertilizer Plants; Final Guideline Document Availability,” 42 FR 12022 (Mar. 1, 1977); “Standards of Performance for New Stationary Sources; Emission Guideline for Sulfuric Acid Mist,” 42 FR 55796 (Oct. 18, 1977); “Kraft Pulp Mills, Notice of Availability of Final Guideline Document,” 44 FR 29828 (May 22, 1979); “Primary Aluminum Plants; Availability of Final Guideline Document,” 45 FR 26294 (Apr. 17, 1980); “Standards of Performance for New Stationary Sources and Guidelines for Control of Existing Sources: Municipal Solid Waste Landfills, Final Rule,” 61 FR 9905 (Mar. 12, 1996).
276.
See, e.g.,
“Standards of Performance for New Stationary Sources and Emission Guidelines for Existing Sources: Sewage Sludge Incineration Units, Final Rule,” 76 FR 15372 (Mar. 21, 2011).
277.
See
“Phosphate Fertilizer Plants; Final Guideline Document Availability,” 42 FR 12022 (Mar. 1, 1977); “Standards of Performance for New Stationary Sources; Emission Guideline for Sulfuric Acid Mist,” 42 FR 55796 (Oct. 18, 1977); “Kraft Pulp Mills, Notice of Availability of Final Guideline Document,” 44 FR 29828 (May 22, 1979); “Primary Aluminum Plants; Availability of Final Guideline Document,” 45 FR 26294 (Apr. 17, 1980); “Standards of Performance for New Stationary Sources and Guidelines for Control of Existing Sources: Municipal Solid Waste Landfills, Final Rule,” 61 FR 9905 (Mar. 12, 1996).
279.
The EPA received more than 2,000 emails offering input into the development of these guidelines through email and a Web-based form. These emails and other materials provided to the EPA are posted on line as part of a non-regulatory docket, EPA Docket ID No. EPA-HQ-OAR-2014-0020, at
www.regulations.gov.
281.
In the case of a tribe that has one or more affected EGUs in its area of Indian country, the tribe has the opportunity, but not the obligation, to establish a CO2
emission standard for each affected EGU located in its area of Indian country and a CAA section 111(d) plan for its area of Indian country. If the tribe chooses to establish its own plan, it must seek and obtain authority from the EPA to do so pursuant to 40 CFR 49.9. If it chooses not to seek this authority, the EPA has the responsibility to determine whether it is necessary or appropriate, in order to protect air quality, to establish a CAA section 111(d) plan for an area of Indian country where affected EGUs are located.
282.
A state that chooses to set emission standards that are identical to the emission performance rates for both the interim period and in 2030 and beyond need not identify interim state goals nor include a separate demonstration that its plan will achieve the state goals.
283.
The EPA is aware of at least four affected EGUs located in Indian country: Two on Navajo lands, the Navajo Generating Station and the Four Corners Power Plant; one on Ute lands, the Bonanza Power Plant; and one on Fort Mojave lands, the South Point Energy Center. The affected EGUs at the first three plants are coal-fired EGUs. The fourth affected EGU is an NGCC facility.
284.
Under CAA section 111(d), there is no requirement that the EPA make a finding that the emissions from existing sources that are the subject of regulation cause or contribute significantly to air pollution which may reasonably be anticipated to endanger public health or welfare. As predicates to promulgating regulations under CAA section 111(d) for existing sources, the EPA must make endangerment and cause-or-contribute-significantly findings for emissions from the source category, and the EPA must promulgate regulations for new sources in the source category. In the CAA section 111(b) rule for CO2
emissions for new affected EGUs that the EPA is promulgating concurrently with this rule, the EPA discusses the endangerment and cause-or-contribute-significantly findings and explains why the EPA has already made them for the affected EGU source categories so that the EPA is not required to make them for CO2
emissions from affected EGUs, and, in the alternative, why, if the EPA were required to make those findings, it was making them in that rulemaking.
286.
Section 111(d) might be read to apply to HAP under certain circumstances. However, because carbon dioxide is not a HAP, this issue does not need to be resolved in the context of this rule.
287.
For example, in the CAMR litigation (
State of New Jersey
v.
EPA,
No. 05-1097 (D.C. Cir.), the joint brief filed by a group of intervenors and an amicus (including six states and the West Virginia Department of Environmental Protection, and Utility Air Regulatory Group and nine other industry entities) stated that the EPA had interpreted section 111(d) in light of the two different amendments and that the EPA's interpretation was “a reasoned way to reconcile the conflicting language and the Court should defer to the EPA's interpretation.” Joint Brief of State Respondent-Intervenors, Industry Respondent-Intervernors, and State Amicus, filed May 18, 2007, at 25.
288.
In subsequent CAA amendments, Congress has maintained this three-part scheme, but supplemented it with the Preservation of Significant Deterioration (PSD) program, the Acid Rain Program and the Regional Haze program.
289.
Originally, when the House bill to amend the CAA was introduced in January 1989, it focused on amendments to control HAP. Of particular note, the amendments to section 112 included a provision that excluded regulation under section 112 of “[a]ny air pollutant which is included on the list under section 108(a), or which is regulated for a source category under section 111(d).” H.R. 4, § 2 (Jan. 3, 1989), 1990 CAA Legist. Hist. at 4046. In other words, the Section 112 Exclusion in section 111(d) that was ultimately contained in the House amendment was originally crafted as what might be called a “Section 111(d) Exclusion” in section 112. This is significant because the “source category” phrasing in the original January 1989 text with respect to section 111(d) makes sense, whereas the “source category” phrasing in the 1990 House amendment does not. When referring to the scope of what is regulated under section 111(d), it makes sense to frame that scope with respect to source
categories, because section 111 regulation begins with the identification of source categories under section 111(b)(1)(A). By contrast, regulation under section 112 begins with the identification of HAP under section 112(b); the listing of source categories under section 112(c) is secondary to the listing of HAP. From this history, and in light of this difference between the scope of what is regulated in sections 111 and 112, it is reasonable to conclude that the “source category” phrasing is a legacy from the original 1989 bill—that is, when converting the 1989 text into the Section 112 Exclusion that we see in the 1990 House amendment, the legislative drafters continued to use phrasing based on “source category” notwithstanding that this phrasing created a mismatch with the way that the scope of section 112 regulation is determined.
290.
“A source category” could also be interpreted to mean “any source category.” Under this interpretation, CAA 111(d) regulation would be limited to air pollutants that are not emitted by any source category for which the EPA has issued standards for HAP under CAA section 112. This interpretation is not reasonable because it would effectively read CAA 111(d) out of the statute. Given the extensive list of source categories regulated under CAA 112 and the breadth of pollutants emitted by those categories collectively, literally all air pollutants would be barred from CAA 111(d) regulation under this interpretation.
291.
In assessing any interpretation of section 111(d), EPA must consider how the three main programs set forth in the CAA work together.
See UARG,
134 S. Ct. at 2442 (a “reasonable statutory interpretation must account for . . . the broader context of the statute as a whole”) (quotation omitted).
292.
Supporters of this interpretation have noted that the EPA could regulate power plants under both CAA section 111(d) and CAA section 112 if it regulated under section 111(d) first, before the Section 112 Exclusion is triggered. But that argument actually further demonstrates another reason why this interpretation is unreasonable. There is no basis for concluding that Congress intended to mandate that section 111(d) regulation occur first, nor is there any logical reason why the need to regulate under section 111(d) should be dependent on the timing of such regulation in relation to CAA 112 regulation of that source category.
293.
Some commenters have stated that EPA could choose to regulate both HAP and non-HAP under section 111(d), and thus could regulate HAP without creating a gap. But this presumes that Congress intended EPA to have the choice of declining to regulate a section 112-listed source category for HAP under section 112, which is inconsistent with the mandatory language in section 112. See,
e.g.,
section 112(d)(1)(“The Administrator shall promulgate regulations establishing emissions standards for each category or subcategory of major sources and area sources of hazardous air pollutants listed for regulation pursuant to subsection (c) of this section in accordance with the schedules provided in subsections (c) and (e) of this section.”). Moreover, given the prescriptive language that Congress added into section 112 concerning how to set standards for HAP, see section 112(d)(2) and (d)(3), it is unreasonable to conclude that Congress intended that the EPA could simply choose to ignore the provisions in section 112 and instead regulate HAP for a section 112 listed source category under section 111(d).
Further, some supporters of this interpretation have suggested that EPA could regulate CO2
under section 112. But this suggestion fails to consider that sources emitting HAP are major sources if they emit 10 tons of any HAP. See CAA section 112(a)(1). Thus, if CO2
were regulated as a HAP, and because emissions of CO2
tend to be many times greater than emissions of other pollutants, a huge number of smaller sources would become regulated for the first time under the CAA.
294.
Even if one were to determine that this interpretation were the proper reading of the House amendment that would not be the end of the analysis. Instead, that reading would create a conflict between the Senate amendment and the House amendment that would need to be resolved. In that event, the proper resolution of a conflict between the two amendments would be the analysis and conclusion discussed in the Proposed Rule's legal memorandum (discussing EPA's analysis in the CAMR rule at 70 FR 15994, 16029-32): The two amendments must be read together so as to give some effect to each amendment and they are properly read together to provide that, where a source category is regulated under section 112, the EPA may not establish regulations covering the HAP emissions from that source category under section 111(d).
295.
See
S. Rep. No. 101-228 at 133 (“There is now a broad consensus that the program to regulate hazardous air pollutants . . . should be restructured to provide the EPA with authority to regulate industrial and area sources of air pollution . . . in the near term”), reprinted in 5
A Legislative History of the Clean Air Act Amendments of 1990
(“Legis. Hist.”) 8338, 8473 (Comm. Print 1993); S. Rep. No. 101-228 at 14 (“The bill gives significant authority to the Administrator in order to overcome the deficiencies in [the NAAQS program]”) & 123 (“Experience with the mobile source provisions in Title II of the Act has shown that the enforcement authorities . . . need to be strengthened and broadened . . .”), reprinted in 5
Legis. Hist.
at 8354, 8463; H.R. Rep. No. 101-952 at 336-36, 340, 345 & 347 (discussing enhancements to Act's motor vehicle provisions, the EPA's new authority to promulgate chemical accident prevention regulations, the enactment of the Title V permit program, and enhancements to the EPA's enforcement authority), reprinted in 5
Legis. Hist.
at 1786, 1790, 1795, & 1997.
296.
In the past, the EPA has issued standards of performance under section 111(b) and emission guidelines under section 111(d) simultaneously.
See
“Standards of Performance for new Stationary Sources and Guidelines for Control of Existing Sources: Municipal Solid Waste Landfills—Final Rule,” 61 FR 9905 (March 12, 1996).
297.
Under Section 111(a) of the CAA, determination of affected sources is based on the date that the EPA proposes action on such sources. January 8, 2014 is the date the proposed GHG standards of performance for new fossil fuel-fired EGUs were published in the
Federal Register
(79 FR 1430).
300.
We also discuss our interpretation of the requirements for standards of performance and the BSER under section 111(b), for new sources, in the section 111(b) rulemaking that the EPA is finalizing simultaneously with this rule and in the Legal Memorandum for this rule. Our interpretations of
these requirements in the two rules are generally consistent except to the extent that they reflect distinctions between new and existing sources. For example, as discussed in the section 111(b) rule, the legislative history indicates that Congress intended that the BSER for new industrial facilities, which were expected to have lengthy useful lives, would include the most advanced pollution controls available, but Congress had a broader conception of the BSER for existing facilities.
301.
Our interpretation of the CAA provisions at issue is guided by
Chevron U.S.A. Inc.
v.
NRDC,
467 U.S. 837, 842-43 (1984). In
Chevron,
the U.S. Supreme Court set out a two-step process for agency interpretation of statutory requirements: the agency must, at step 1, determine whether Congress's intent as to the specific matter at issue is clear, and, if so, the agency must give effect to that intent. If congressional intent is not clear, then, at step 2, the agency has discretion to fashion an interpretation that is a reasonable construction of the statute..
302.
40 CFR 60.21(e). This definition was promulgated as part of the EPA's CAA 111(d) implementing regulations and was not updated to reflect the textual changes adopted by Congress in 1977. That said, Congress recognized that those changes “merely make[] explicit what was implicit in the previous language.” H.R. Rep. No. 95-294, at 190 (May 12, 1977).
304.
The EPA's regulations, promulgated prior to enactment of the “remaining useful life” provision of section 111(d)(1), provide: “Unless otherwise specified in the applicable subpart on a case-by-case basis for particular designated facilities, or classes of facilities, States may provide for the application of less stringent emission standards or longer compliance schedules than those otherwise required” by the corresponding emission guideline. 40 CFR 60.24(f). Some of the factors that a state may consider for this case-by-case analysis include the “cost of control resulting from plant age, location, or basic process design” and the “physical impossibility of installing necessary control equipment,” among other factors “that make application of a less stringent standard or final compliance time significantly more reasonable.”
Id.
305.
In addition, CAA section 116 authorizes the state to set standards of performance for all of its sources that, together, are more stringent than the EPA's emission guidelines.
307.
In the 1970 CAAA, Congress defined “standard of performance,” under § 111(a)(1), as:
a standard for emissions of air pollutants which reflects the degree of emission limitation achievable through the application of the best system of emission reduction which (taking into account the cost of achieving such reduction) the Administrator determines has been adequately demonstrated.
In the 1977 CAAA, Congress revised the definition to distinguish among different types of sources, and to require that for fossil fuel-fired sources, the standard (i) be based on, in lieu of the “best system of emission reduction . . . adequately demonstrated,” the “best technological system of continuous emission reduction . . . adequately demonstrated;” and (ii) require a percentage reduction in emissions. In addition, in the 1977 CAAA, Congress expanded the parenthetical requirement that the Administrator consider the cost of achieving the reduction to also require the Administrator to consider “any nonair quality health and environmental impact and energy requirements.”
In the 1990 CAAA, Congress again revised the definition, this time repealing the requirements that the standard of performance be based on the best technological system and achieve a percentage reduction in emissions, and replacing those provisions with the terms used in the 1970 CAAA version of § 111(a)(1) that the standard of performance be based on the “best system of emission reduction . . . adequately demonstrated.” This 1990 CAAA version is the current definition, which is applicable at present. Even so, because parts of the definition as it read under the 1977 CAAA were retained in the 1990 CAAA, the explanation in the 1977 CAAA legislative history, and the interpretation, in the case law, of those parts of the definition remain relevant to the definition as it reads today.
311.
See Lignite Energy Council
v.
EPA,
198 F.3d 930, 933 (D.C. Cir. 1999).
312.
Although CAA section 111(a)(1) may be read to state that the factors enumerated in the parenthetical are part of the “adequately demonstrated” determination, the D.C. Circuit's case law appears to treat them as part of the “best” determination.
See Sierra Club
v.
Costle,
657 F.2d at 330 (recognizing that CAA section 111 gives the EPA authority “when determining the best technological system to weigh cost, energy, and environmental impacts”). Nevertheless, it does not appear that those two approaches would lead to different outcomes.
See, e.g., Lignite Energy Council
v.
EPA,
198 F.3d at 933 (rejecting challenge to the EPA's cost assessment of the “best demonstrated system”). In this rule, the EPA treats the factors as part of the “best” determination, but, as noted, even if the factors were part of the “adequately demonstrated” determination, our analysis and outcome would be the same.
313.
See, e.g.,
Oil and Natural Gas Sector: New Source Performance Standards and National Emission Standards for Hazardous Air pollutants Reviews, 77 FR 49490, 49494 (Aug. 16, 2012) (describing the three-step analysis in setting a standard of performance).
316.
Portland Cement Ass'n
v.
Ruckelshaus,
486 F.2d 375, 391 (D.C. Cir. 1973) (citations omitted) (discussing the Senate and House bills and reports from which the language in CAA section 111 grew).
325.
These cost formulations are consistent with the legislative history of section 111. The 1977 House Committee Report noted:
In the [1970] Congress [
sic:
Congress's] view, it was only right that the costs of applying best practicable control technology be considered by the owner of a large new source of pollution as a normal and proper expense of doing business.
1977 House Committee Report at 184. Similarly, the 1970 Senate Committee Report stated:
The implicit consideration of economic factors in determining whether technology is “available” should not affect the usefulness of this section. The overriding purpose of this section would be to prevent new air pollution problems, and toward that end, maximum feasible control of new sources at the time of their construction is seen by the committee as the most effective and, in the long run, the least expensive approach.
S. Comm. Rep. No. 91-1196 at 16.
326.
We received comments that we do not have authority to revise the cost standard as established in the case law,
e.g.,
“exorbitant,” “excessive,” etc., to a “reasonableness” standard that the commenters considered less protective of the environment. We agree that we do not have authority to revise the cost standard as established in the case law, and we are not attempting to do so here. Rather, our description of the cost standard as “reasonableness” is intended to be a convenient term for referring to the cost standard as established in the case law.
329.
Indeed, in upholding the EPA's consideration of costs under other provisions requiring consideration of cost, courts have also noted the substantial discretion delegated to the EPA to weigh cost considerations with other factors.
Chemical Mfr's Ass'n
v.
EPA,
870 F. 2d 177, 251 (5th Cir. 1989); Am. Iron &
Steel Inst.
v.
EPA,
526 F. 2d 1027, 1054 (3d Cir. 1975);
Ass'n of Pacific Fisheries
v.
EPA,
615 F. 2d 794, 808 (9th Cir. 1980).
330.
Portland Cement
v.
EPA,
486 F. 2d at 384;
Sierra Club
v.
Costle,
657 F. 2d at 331;
see also Essex Chemical Corp.
v.
Ruckelshaus,
486 F. 2d at 439 (remanding standard to consider solid waste disposal implications of the BSER determination).
331.
Sierra Club
v.
Costle,
657 F.2d 298 (D.C. Cir. 1981) was governed by the 1977 CAAA version of the definition of “standard of performance,” which revised the phrase “best system of emission reduction” to read, “best technological system of continuous emission reduction.” As noted above, the 1990 CAAA deleted “technological” and “continuous” and thereby returned the phrase to how it read under the 1970 CAAA. The court's interpretation of the 1977 CAAA phrase in
Sierra Club
v.
Costle
to require consideration of the amount of air emissions remains valid for the 1990 CAAA phrase “best system of emission reduction.”
334.
Sierra Club
v.
Costle,
657 F.2d at 327-28 (quoting 44 FR at 33583/3-33584/1). In the January 2014 proposal, we explained that although the D.C. Circuit decided
Sierra Club
v.
Costle
before the
Chevron
case was decided in 1984, the D.C. Circuit's decision could be justified under either
Chevron
step 1 or 2. 79 FR 1430, 1466 (January 8, 2014).
338.
Sierra Club
v.
Costle,
657 F.2d 298, 377 (D.C. Cir. 1981) (citing
Nat'l Lime Ass'n
v.
EPA,
627 F.2d 416 (D.C. Cir. 1980). In considering the representativeness of the source tested, the EPA may consider such variables as the “`feedstock, operation, size and age' of the source.”
Nat'l Lime Ass'n
v.
EPA,
627 F.2d 416, 433 (D.C. Cir. 1980). Moreover, it may be sufficient to “generalize from a sample of one when one is the only available sample, or when that one is shown to be representative of the regulated industry along relevant parameters.”
Nat'l Lime Ass'n
v.
EPA,
627 F.2d 416, 434, n.52 (D.C. Cir. 1980).
340.
Sierra Club
v.
Costle,
657 F. 2d at 346 (“Our interpretation of section 111(a) is that the mandated balancing of cost, energy, and nonair quality health and environmental factors embraces consideration of technological innovation as part of that balance. The statutory factors which EPA must weigh are broadly defined and include within their ambit subfactors such as technological innovation.”).
341.
See
S. Rep. No. 91-1196 at 16 (1970) (“Standards of performance should provide an incentive for industries to work toward constant improvement in techniques for preventing and controlling emissions from stationary sources”); S. Rep. No. 95-127 at 17 (1977) (cited in
Sierra Club
v.
Costle,
657 F.2d at 346 n. 174) (“The section 111 Standards of Performance . . . sought to assure the use of available technology and to stimulate the development of new technology”).
342.
See Portland Cement Ass'n
v.
Ruckelshaus,
486 F.2d 375, 391 (D.C. Cir. 1973) (the best system of emission reduction must “look[ ] toward what may fairly be projected for the regulated future, rather than the state of the art at present”).
343.
See
1970 Senate Committee Report No. 91-1196 at 15 (“The maximum use of available means of preventing and controlling air pollution is essential to the elimination of new pollution problems”).
346.
Sierra Club
v.
Costle,
657 F.2d at 321;
see also New York
v.
Reilly,
969 F. 2d at 1150 (because Congress did not assign the specific weight the Administrator should assign to the statutory elements, “the Administrator is free to exercise [her] discretion” in promulgating an NSPS).
347.
Lignite Energy Council
v.
EPA,
198 F.3d 930, 933 (D.C. Cir. 1999) (paragraphing revised for convenience).
See New York
v.
Reilly,
969 F.2d 1147, 1150 (D.C. Cir. 1992) (“Because Congress did not assign the specific weight the Administrator should accord each of these factors, the Administrator is free to exercise his discretion in this area.”);
see also NRDC
v.
EPA,
25 F.3d 1063, 1071 (D.C. Cir. 1994) (EPA did not err in its final balancing because “neither RCRA nor EPA's regulations purports to assign any particular weight to the factors listed in subsection (a)(3). That being the case, the Administrator was free to emphasize or deemphasize particular factors, constrained only by the requirements of reasoned agency decisionmaking.”).
349.
In this rulemaking, our determination that the costs are reasonable means that the costs meet the cost standard in the case law no matter how that standard is articulated, that is, whether the cost standard is articulated through the terms that the case law uses,
e.g.,
“exorbitant,” “excessive,” etc., or through the term we use for convenience, “reasonableness”.
352.
The building block measures are not designed to reduce electricity generation overall; they are focused on maintaining the same level of electricity generation, but through less polluting processes.
355.
The need for new standards was due in part to findings that in 1976, steam electric generating units were responsible for “65 percent of the SO2. . . emissions on a national basis.” 44 FR 33580, 33587 (June 11, 1979). The EPA explained that [u]nder the current performance standards for power plants, national SO2
emissions are projected to increase approximately 17 percent between 1975 and 1995. Impacts will be more dramatic on a regional basis.”
Id.
Thus, “[o]n January 27, 1977, EPA announced that it had initiated a study to review the technological, economic, and other factors needed to determine to what extent the SO2
standard for fossil-fuel-fired steam generators should be revised.”
Id.
at 33587-33588.
357.
44 FR 33580, 33593. The EPA considered an investigation by the U.S. Department of the Interior regarding the amount of sulfur that could be removed from various coals by physical coal cleaning.
Id.
at 33593.
358.
See 44 FR 33580, 33597-33600 (taking into account “the amount of power that could be purchased from neighboring interconnected utility companies” and noting that “[a]lmost all electric utility generating units in the United States are electrically interconnected through power transmission lines and switching stations” and that “load can usually be shifted to other electric generating units”).
359.
61 FR 9905, 9905 (March 12, 1996). In the rule, the EPA referred to the BSER for both new and existing MSW landfills as “the best demonstrated system of continuous emission reduction,” as well as the “BDT”—short for “best demonstrated technology.”
See, e.g., id.
at 9905-07, 9913-14.
360.
61 FR 9905, 9908;
see56 FR 24468, 24478 (May 30, 1991) (explaining at proposal that because landfill-gas emission rates “gradually increase” from zero after the landfill opens, and “gradually decrease” from peak emissions after closure, the EPA's identification of the BSER for landfills inherently requires a determination of “when controls systems must be installed and when they may be removed”).
361.
See
U.S. EPA,
Municipal Solid Waste Landfills, Volume 1: Summary of the Requirements for the New Source Performance Standards and Emission Guidelines for Municipal Solid Waste Landfills,
Docket No. EPA-453R/96-004 at 1-3 (February 1999).
364.
S. Massoud Amin, “Securing the Electricity Grid,” The Bridge, Spring 2010, at 13, 14; Phillip F. Schewe, The Grid: A Journey Through the Heart of Our Electrified World 1 (2007).
370.
As further discussed below, if heat rate improvements at coal-fired steam EGUs were implemented in isolation, without other measures to reduce CO2
emissions, the heat rate improvements could lead to increases in competitiveness and utilization of the coal-fired EGUs—a so-called “rebound effect”—causing increases in CO2
emissions that could partially or even entirely offset the CO2
emission reductions achieved through the reductions in the amount of CO2
emissions per MWh of generation.
374.
Specifically, the annual CO2
emission performance rates applicable to steam EGUs in all three interconnections are the annual emission rates achievable by that subcategory in the Eastern Interconnection through application of the building blocks. Similarly, the annual CO2
emission performance rates applicable to stationary combustion turbines in all three interconnections are the annual emission rates achievable by that subcategory in the Texas Interconnection for years from 2022 to 2026, and in the Eastern Interconnection for years from 2027 to 2030, through application of the building blocks. Additional information is provided in the CO2
Emission Performance Rate and State Goal Computation TSD in the docket.
376.
The emergence of markets under the Acid Rain Program and other environmental programs where trading has been permitted, as well as state and industry support for the development of markets under states' section 111(d) plans, is discussed in a recent report by the Advanced Energy Economy Institute. AEE Institute,
Markets Drive Innovation—Why History Shows that the Clean Power Plan Will Stimulate a Robust Industry Response
(July 2015), available at
https://www.aee.net/aeei/initiatives/epa-111d.html#epa-reports-and-white-papers.
377.
There is a theoretical possibility—which we view as extremely unlikely—that the affected EGUs in a given state or group of states that has chosen to pursue a technology-specific rate-based approach could have insufficient access to ERCs because of the choices of certain other states to pursue mass-based or blended-rate approaches. We view this as very unlikely in part because of the conservative assumptions used in calculating the emission reductions available through the building blocks and the broad availability of non-BSER emission reduction opportunities, such as energy efficiency, that will generate ERCs. If such a situation arises, and the state or states implementing the technology-specific rates does not have, within the state or states, sufficient ERC-generation potential to match their compliance requirements, the EPA will work with the state or states to ensure that there is a mechanism that the state or states can include in their state plans to allow the affected EGUs in the state or states to generate additional ERCs where the state or states can demonstrate that the ERCs do not represent double-counting under other state programs. One potential mechanism would be to assume for purposes of demonstrating compliance with their standards of performance that the generation replacing any reductions in generation at those affected EGUs that was not paired with verified ERCs came from existing NGCC units in other states from which ERCs were not accessible. In other words, any reductions in fossil steam generation from 2012 levels in a state or states that was implementing technology-specific rates that could not be matched by increases in NGCC generation or by ERCs from zero-emitting sources, and for which it could be demonstrated that no further ERCs can be procured, could generate building block 2 ERCs as if that level of displaced generation were NGCC generation. A demonstration that no further ERCs are procurable would have to include demonstrations that the capacity factor of all NGCC generation in the state or states was expected to be greater than 75 percent and that further deployment of RE would go beyond the amounts found available in the BSER. States could distribute these additional ERCs to ensure compliance by affected EGUs. Before such ERCs could be created by a state or states, a framework would have to be submitted to the EPA for approval including documentation of the levels of fossil steam and NGCC generation in the state or states, a demonstration that no further ERCs are accessible, and the total amount of building block 2 ERCs to be created.
378.
For purposes of this discussion, we assume that coal-fired steam generators also implement building block 1 measures so that they will implement the full set of measures needed to achieve their emission limit.
379.
As an alternative to authorizing trading that would still provide a degree of multi-unit flexibility, a state could choose in its state plan to give an owner of multiple affected EGUs flexibility regarding how the owner distributes any credits or allowances it acquires among its affected EGUs.
380.
Numerous states submitted comments urging the EPA to allow states to develop trading programs, as suggested in the proposal, including interstate trading programs. They include, for example, Alabama (EPA should develop and issue guidelines that allow options for multi‐state plans and interstate credit trading programs, comment 23584), California (EPA should provide flexibility for allowance trading programs to be integrated into state plans, comment 23433), Hawaii (supports use of emission credit trading with other entities to achieve compliance, comment 23121), Massachusetts (EPA should explore possibility of hosting a third‐party emissions trading bank that can allow states interested in allowance trading to plug and play in to a wider, more cost‐effective market, comment 31910), Michigan (supports emissions trading programs, comment 23987), Minnesota (develop model trading rule that states could incorporate by reference as part of plan and automatically be included in multi-state mass trading program, comment 23987), North Carolina (EPA should examine a system of banking and trading for energy efficiency, comment 23542), Oregon (EPA should expand the explicit options for multi‐state plans beyond cap‐and-trade, comment 20678), Washington (supporting trading, comment 22764), Wisconsin (requesting EPA to develop a national trading program, Post‐111(d) Proposal Questions to EPA WI Questions for 7/16 Hub call).
In addition, several groups of states supported trading programs: Georgetown Climate Center (a group of state environmental agency leaders, energy agency leaders, and public utility commissioners from California, Colorado, Connecticut, Delaware, Illinois, Maine, Maryland, Massachusetts, Minnesota, New Hampshire, New York, Oregon, Rhode Island, Vermont, and Washington) (“We believe states should have maximum flexibility to determine what kinds of collaborations might work for them. These could include submission of joint plans, standardized approaches to trading renewable or energy efficiency credits. . . . We also encourage EPA to help facilitate such interstate agreements or multi-state collaborations by working with states to either identify or provide a platform or framework that states may elect to use for the tracking and trading of avoided generation or emissions credits due to interstate efficiency or renewable energy.” comment 23597, at 39-40); RGGI (including Connecticut, Delaware, Maine, Maryland, Massachusetts, New Hampshire, New York, Rhode Island, Vermont) (“[E]very serious proposal to reduce carbon emissions from EGUs, from proposed US legislation to programs in place in California and Europe, has identified allowance trading as the best approach.” Comment 22395 at 7-8); Western States Center for New Energy Economy (including Arizona, California, Colorado, Idaho, Montana, Nevada, Oregon, South Dakota, Utah, Washington) (“Some degree of RE and EE credit trading among states may support compliance, even in the absence of a comprehensive regional plan. Therefore, EPA should support approaches which allow states flexibility to allocate credit for these zero-carbon resources, along with approaches which allow states to reach agreements on the allocation of carbon liabilities. This includes ensuring that existing tracking mechanisms for renewable energy in the West, such as the Western Renewable Energy Generation Information System (WREGIS), are compatible with the final proposal.” Comment 21787 at 5); Midcontinent States Environmental and Energy Regulators (including Arkansas, Illinois, Michigan, Minnesota Missouri, Wisconsin) (EPA should also provide states with optional . . . systems (or system) for tracking emissions, allowances, reduction credits, and/or generation attributes that states may choose to use in their 111(d) plans,” comment 22535 at 3).
In addition, trading programs were supported by, among others, a group of Attorneys General from 11 states and the District of Columbia. Comment 25433 (Attorneys General from New York, California, Connecticut, Maine, Maryland, Massachusetts, New Mexico, Oregon, Rhode Island, Vermont, Washington, District of Columbia, and New York City Corporation Counsel).
Numerous industry commenters also supported trading, including Alliant Energy Corporate Services, Inc. (comment 22934), Calpine (comment 23167), DTE Energy (comment 24061), Exelon (comment 23428 and 23155), Michigan Municipal Electric Association (MMEA) (comment 23297), National Climate Coalition (comment 22910), Pacific Gas and Electric Company (comment 23198), Western Power Trading Forum (WPTF) (comment 22860). Environmental advocates also supported trading, including Clean Air Task Force (comment 22612), Environmental Defense Fund (comment 23140), Institute for Policy Integrity, New York University School of Law (comment 23418).
381.
As discussed in the Legal Memorandum, the EPA has promulgated other rulemakings, including the transport rulemakings—the NOX
SIP Call and CAIR, which required states to submit SIPs, and CSAPR, which allows SIPs—on the premise of interstate emission trading.
382.
For example, in CSAPR, which covered the states in the eastern half of the U.S., the EPA assumed the existence of trading across those states in the rule's cost estimates contained in the RIA. “Regulatory Impact Analysis for the Federal Implementation Plans to Reduce Interstate Transport of Fine Particulate Matter and Ozone in 27 States; Correction of SIP Approvals for 22 States” 32 (June 2011),
https://www.epa.gov/airtransport/CSAPR/pdfs/FinalRIA.pdf.
In addition, the rule is being implemented either through federal implementation plans (FIPs) that authorize interstate emission trading or SIPs that authorize interstate emissions trading.
383.
Although the CAMR trading program never took effect because the rule was vacated on other grounds, it consisted of a nationwide trading program that the EPA adopted under CAA section 111(d). Some states declined to allow their sources to participate in the trading program on the grounds that nationwide trading was not appropriate for the air pollutant at issue, mercury, a HAP that caused adverse local impacts.
384.
For the proposed rule, the EPA projected total CO2
emission reductions from 2005 levels of 29% in 2025 and 30% in 2030. For the final rule, the EPA projects total CO2
emissions reductions from 2005 levels of 28% in 2025 and 32% in 2030. See Regulatory Impact Analysis for the CPP Proposed Rule, Table 3-6, and Regulatory Impact Analysis for the CPP Final Rule, Table 3-6, available in the docket.
385.
The June 2014 proposal in part referenced proposed interpretations of section 111(a)(1) that the EPA explained in the January 2014 proposal to address CO2
emissions from new fossil fuel-fired EGUs under section 111(b).
386.
Of course, a source in one state may face different requirements than similar sources in other states, depending on whether the state adopts the state measures approach or, if it adopts the emission standards approach, whether it imposes a mass limit or an emission rate and, if the latter, at what level.
387.
Generation from existing RE capacity will continue to make compliance with mass-based standards easier to achieve by making the overall amount of fossil fuel-fired generation that is required to meet the demand for energy services lower than it would otherwise be, thereby keeping CO2
emissions lower than they would otherwise be.
388.
As with generation from existing RE capacity, generation from existing nuclear capacity will continue to make compliance with mass-based standards easier to achieve by making the overall amount of fossil fuel-fired generation that is required to meet the demand for energy services lower than it would otherwise be, thereby keeping CO2
emissions lower than they would otherwise be.
390.
The Texas Interconnection encompasses the portion of the Texas electricity system commonly known as ERCOT (for the Electric Reliability Council of Texas). The state of Texas has areas within the Eastern and Western Interconnections as well as the Texas Interconnection.
392.
For example, the Eastern Interconnection has Reliability Standard IRO-006-EAST-1, Transmission Loading Relief Procedure for the Eastern Interconnection,
available athttps://www.nerc.com/files/IRO-006-EAST-1.pdf
(providing an “Interconnection-wide transmission loading relief procedure (TLR) for the Eastern Interconnection that can be used to prevent and/or mitigate potential or actual System Operating Limit (SOL) and Interconnection Reliability Operating Limit (IROL) exceedances to maintain reliability of the Bulk Electric System (BES).”).
398.
Transmission Planning and Cost Allocation by Transmission Owning and Operating Public Utilities,
Order No. 1000, FERC Stats. & Regs. ¶ 31,323 (2011),
order on reh'g,
Order No. 1000-A, 139 FERC ¶ 61,132,
order on reh'g,
Order No. 1000-B, 141 FERC ¶ 61,044 (2012),
aff'd sub nom. S.C. Pub. Ser
v.
Auth.
v.
FERC,
762 F.3d 41 (D.C. Cir. 2014).
403.
The NERC glossary defines the Reliability Coordinator Information System as the “system that Reliability Coordinators use to post messages and share operating information in real time.” NERC,
Glossary of Terms Used in Reliability Standards
(Apr. 20, 2009),
available athttps://www.eia.gov/electricity/data/eia411/nerc_glossary_2009.pdf.
407.
NERC previously included Entergy and its six operating areas as part of the SERC Assessment Areas. NERC,
2014 Summer Reliability Assessment
(May 2014),
available athttps://www.nerc.com/pa/RAPA/ra/Reliability%20Assessments%20DL/2014SRA.pdf. “MISO now coordinates all RTO activities in the newly combined footprint, consisting of all or parts of 15 states with the integration of Entergy and other MISO South entities. This transition has led to substantial changes to MISO's market dispatch, creating the potential for unanticipated flows across the following systems: Tennessee Valley Authority (TVA), Associated Electric Cooperative Inc. (AECI), and Southern Balancing Authority.”
Id. at 7.
412.
The Eastern, Western, and Texas Interconnections each encompass large and diverse populations of EGUs with numerous and diverse opportunities to reduce CO2
emissions through application of the measures in each of the three building blocks. Based on these considerations of scale and diversity, we conclude that each of the interconnections is sufficiently representative of the source subcategories and emission reduction opportunities encompassed in the BSER to potentially serve as the basis for CO2
emission performance rates applicable to the respective source subcategories on a nationwide basis.
413.
As discussed in section VI and the CO2
Emission Performance Rate and State Goal Computation TSD, the emission performance rates for each technology subcategory are computed by region for each year from 2022 through 2030, and the region with the least stringent emission rate for a particular subcategory, whose rate therefore is used for all three regions, can differ across years. In the case of the steam EGU subcategory, the nationwide rate for all years is the rate computed for the Eastern Interconnection. In the case of the NGCC subcategory, the nationwide rate is the rate computed for the Texas Interconnection for the years from 2022 through 2026 and the rate computed for the Eastern Interconnection for the years from 2027 through 2030.
414.
As explained in section III.A. above, an Indian tribe whose area of Indian country has affected EGUs will have the opportunity but not the obligation to seek authority to develop and implement a section 111(d) plan. If no tribal plan is approved, the EPA has the responsibility to establish a plan if it determines that such a plan is necessary or appropriate.
416.
Alabama Power Co., “Petition for a Certificate of Convenience and Necessity,” submitted to the Alabama Public Service Commission (June 25, 2015) (petition requests “a certificate of convenience and necessity for the construction or acquisition of renewable energy and environmentally specialized generating resources and the acquisition of rights and the assumption of payment obligations under power purchase arrangements pertaining to renewable energy and environmentally specialized generating resources, together with all transmission facilities, fuel supply and transportation arrangements, appliances, appurtenances, equipment, acquisitions and commitments necessary for or incident thereto”) (included in the docket for this rulemaking).
See
Swartz, Kristi, “Alabama Power plan would dramatically boost its renewables portfolio,” E&E Publishing, July 16, 2015.
418.
The determinations of stringency for each source subcategory were made independently for each year from 2022 through 2030, and in the case of the NGCC category, the limiting region changed over time. Thus, for the NGCC category, the uniform CO2
emission performance rate is based on the stringency achievable in the Texas Interconnection for the years from 2022 through 2026 and the stringency achievable in the Eastern Interconnection for the years from 2027 through 2030. For the steam EGU subcategory, the uniform CO2
emission performance rate is based on the stringency achievable in the Eastern Interconnection in all years.
419.
For the reasons discussed in the proposal, the EPA is not determining that heat rate improvements at other types of affected EGUs, such as NGCC units and oil-fired and natural gas-fired steam EGUs, are components of the BSER. However, all types of affected EGUs would be able to employ heat rate improvements as measures to help achieve compliance with their assigned standards of performance.
420.
For example, according to a DOE/NETL study, the relative amount of water consumption for a new pulverized coal plant is 2.5 times the consumption for a new NGCC unit of similar size. “Cost and Performance Baseline for Fossil Energy Plants: Volume 1: Bituminous Coal and Natural Gas to Electricity,” Rev 2a, September 2013, National Energy Technology Laboratory Report DOE/NETL-2010/1397. EPA believes the difference would on average be even more pronounced when comparing existing coal and NGCC units.
421.
For purposes of this rulemaking, “existing” EGUs include units under construction as of January 8, 2014, the date of publication in the
Federal Register
of the proposed carbon pollution standards for new fossil fuel-fired EGUs.
422.
If an EGU produces less generation output, then an improvement in that EGU's heat rate and rate of CO2
emissions per unit of generation produces a smaller reduction in CO2
emissions. If the investment required to achieve the improvement in heat rate and emission rate is the same regardless of the EGU's generation output, then the cost per unit of CO2
emission reduction will be higher when the EGU's generation output is lower. Commenters have also stated that operating at lower capacity factors may cause units to experience deterioration in heat rates.
425.
Notwithstanding the interactive dynamics that improve the cost effectiveness of emission reductions when building blocks 2 and 3 are implemented together, we also consider each of these building blocks to be independently of reasonable cost, so that either building block 2 or
3 alone, or combinations of the building blocks that include either but not both of these two building blocks, could be the BSER if a court were to strike down the other building block, as discussed in section V.A.7. below. (We also note in section V.A.7. that a combination of building blocks 2 and 3 without building block 1 could be the BSER if a court were to strike down building block 1.)
426.
Specifically, at proposal the EPA quantified the average cost, in dollar per ton of CO2
reduced, of building blocks 1, 2, and 3 ($22.5 per ton) to be less than the cost of either building block 2 ($28.9 per ton) or building block 3 ($23.4 per ton) alone.
431.
The EPA's regulatory impact analysis for this rule, which appropriately includes a representation of the flexibility available under the rule to comply using a combination of BSER and non-BSER measures (such as demand-side energy efficiency) is discussed in section XI of the preamble.
433.
Estimates are presented in the
Technical Support Document: Technical Update of the Social Cost of Carbon for Regulatory Impact Analysis Under Executive Order 12866 (May 2013, Revised July 2015),
Interagency Working Group on Social Cost of Carbon, with participation by Council of Economic Advisers, Council on Environmental Quality, Department of Agriculture, Department of Commerce, Department of Energy, Department of Transportation, Environmental Protection Agency, National Economic Council, Office of Energy and Climate Change, Office of Management and Budget, Office of Science and Technology Policy, and Department of Treasury (May 2013, Revised July 2015). Available at:
https://www.whitehouse.gov/sites/default/files/omb/inforeg/scc-tsd-final-july-2015.pdf
> Accessed 7/11/2015.
434.
The SC-CO2
estimates do not include all important damages because of current modeling and data limitations. The 2014 IPCC report observed that SC-CO2
estimates omit various impacts that would likely increase damages.
See
IPCC, 2014:
Climate Change 2014: Impacts, Adaptation, and Vulnerability.
Contribution of Working Group II to the Fifth Assessment Report of the Intergovernmental Panel on Climate Change. Cambridge University Press, Cambridge.
https://www.ipcc.ch/report/ar5/wg2/.
435.
The 2010 and 2013 TSDs present SC-CO2
in 2007$ per metric ton. The unrounded estimates from the current TSD were adjusted to (1) 2011$ using GDP Implicit Price Deflator (1.061374),
https://www.bea.gov/iTable/index_nipa.cfm
and (2) short tons using the conversion factor of 0.90718474 metric tons in a short ton. These estimates were rounded to two significant digits.
437.
We discuss the ability of affected EGUs to implement the building blocks in more detail in sections V.C., V.D., and V.E. and the accompanying support documents.
438.
Each of these methods of implementing building block 2 meets the criteria for the BSER in that (i) as we discuss in section V.D. and supporting documents, each of these methods is adequately demonstrated;(ii) the costs of each of these methods on a source-by-source basis are reasonable, as discussed above; and (iii) none of these methods causes adverse energy impacts or non-quality environmental impacts.
439.
As with building block 2, each of these methods of implementing building block 3 meets the criteria for the BSER in that (i) as we discuss in section V.E. and supporting documents, each of these methods is adequately demonstrated; (ii) the costs of each of these methods on a source-by-source basis are reasonable, as discussed above; and (iii) none of these methods causes adverse energy impacts or non-quality environmental impacts.
440.
The possible use of types of RE generating capacity that are not included in the BSER is discussed in section V.A.6. and section VIII of the preamble.
441.
However, the EPA notes that a state could establish a mechanism for encouraging affected EGUs to apply CHP technology under a mass-based plan, for example, through awards of emission allowances to CHP projects.
442.
The EPA and many states have recognized the importance of integrated waste materials management strategies that emphasize a hierarchy of waste prevention and all other productive uses of waste materials to reduce the volume of disposed waste materials (see section VIII for more discussion of waste-to-energy strategies).
443.
The heat rate improvement measures included in building block 1 are capable of being implemented independently of the measures in the other building blocks but, as discussed earlier, unless at least one other building block is also implemented, a “rebound effect” arising from improved competitiveness and increased generation at the EGUs implementing heat rate improvements could weaken or potentially even eliminate the ability of building block 1 to achieve CO2
emission reductions.
444.
This conclusion would not extend to a BSER comprising solely building block 1, in part because of the possibility of rebound effects discussed earlier.
446.
See
1970 CAA Amendments, § 4, 84 Stat. at 1683-84. Subsequently, in 1977, Congress replaced the term “emission standard” with “standards of performance.”
See
1977 CAA Amendments, § 109, 91 Stat. at 699.
449.
As we made clear in the proposed rulemaking, we are not re-opening these regulations (on the
issue of the authority to determine the BSER or any other issue, unless specifically indicated otherwise) in this rulemaking, and our discussion of these regulations in responding to comments does not constitute a re-opening.
457.
Scalia, Antonin,
Judicial Deference to Administrative Interpretations of Law,
1989 Duke L.J. 511, 518; see
Riverkeeper
v.
Entergy,
556 U.S. 208, 235 (2009).
462.
Compare
“Revision of Standards of Performance for Nitrogen Oxide Emissions From New Fossil-Fuel Fired Steam Generating Units; Revisions to Reporting Requirements for Standards of Performance for New Fossil-Fuel Fired Steam Generating Units: Final Rule,” 63 FR 49442 (Sept. 16, 1998)
and
“Proposed Revision of Standards of Performance for Nitrogen Oxide Emissions From New Fossil-Fuel Fired Steam Generating Units: Proposed Revisions,” 62 FR 36948, 36943 (July 9, 1997) (establishing a single NOX
emission limit for new fossil-fuel fired steam generating units, and not subcategorizing, because the affected units could implement the BSER of SCR and achieve the promulgated emission limits)
with
“National Emission Standards for Hazardous Air Pollutants From Coal and Oil-Fired Electric Utility Steam Generating Units and Standards of Performance for Fossil-Fuel-Fired Electric Utility, Industrial-Commercial-Institutional, and Small Industrial-Commercial-Institutional Steam Generating Units: Final Rule,” 77 FR 9304 (Feb. 16, 2012) (MATS rule)
and
“National Emission Standards for Hazardous Air Pollutants From Coal and Oil-Fired Electric Utility Steam Generating Units and Standards of performance for Fossil-Fuel-Fired Electric Utility, Industrial-Commercial-Institutional, and Small Industrial-Commercial-Institutional Steam Generating Units: Proposed Rule,” 76 FR 24976, 25036-37 (May 3, 2011) (subcategorizing coal fired units designed to burn coal with greater than or equal to 8,300 Btu/lb (for Hg emissions only), coal-fired units designed to burn coal with less than 8,300 Btu/lb (for Hg emissions only), IGCC units, liquid oil units, and solid oil-derived units; evaluating “subcategorization of lignite coal vs. other coal ranks; subcategorization of Fort Union lignite coal vs. Gulf Coast lignite coal vs. other coal ranks; subcategorization by EGU size (
i.e.,
MWe); subcategorization of base load vs. peaking units (
e.g.,
low capacity utilization units); subcategorization of wall-fired vs. tangentially-fired units; and subcategorization of small, non-profit-owned units vs. other units;” but deciding not to adopt those latter subcategorizations).
463.
See, e.g.,
comments by UARG at 6-7 (“Standards promulgated under section 111 must be source-based and reflect measures that the source's owner can integrate into the design or operation of the source itself. A standard cannot be based on actions taken beyond the source itself that somehow reduce the source's utilization.”); comments by UARG at 31 (the building blocks other than building block 1 take a “ `beyond-the-source' approach” and “impermissibly rely on measures that go beyond the boundaries of individual affected EGUs and that are not within the control of individual EGU owners and operators”); comments by UARG at 33 (the “system” of emission reduction “can refer only to reductions resulting from measures that are incorporated into the source itself;” section 111 is “designed to improve the emissions performance of new and existing sources in specific categories based on the application of achievable measures implemented in the design or production process of the source at reasonable cost.”); comments by American Chemistry Council et al. (“Associations”) at 60-61 (EPA's proposed BSER analysis is unlawful because it “looks beyond the fence line of the fossil fuel-fired EGUs that are the subject of this rulemaking;” “the standard of performance must . . . be limited to the types of actions that can be implemented directly by an existing source within [the appropriate] class or category.”).
464.
Because it is designed to apply to a range of air pollutants not regulated under other provisions, CAA section 111(d) may be described as a “catch-all” or “gap-filler.” As such, a “system of emission reduction” as applied under CAA section 111(d) should be interpreted flexibly to accommodate this role.
465.
This rule was vacated by the D.C. Circuit on other grounds.
New Jersey
v.
EPA,
517 F.3d 574, 583-84 (D.C. Cir. 2008),
cert. denied sub nom. Util. Air Reg. Group
v.
New Jersey,
555 U.S. 1169 (2009).
466.
As noted in the Legal Memorandum, in several of these rulemakings and in the course of litigation, the fossil fuel-fired electric power sector has taken positions that are consistent with the EPA's interpretation that the BSER may include building blocks 2 and 3.
468.
As we note in section V.A., this rulemaking presents a unique set of circumstances, including the global nature of CO2
and the emission control challenges that CO2
presents (which limit the availability and effectiveness of control measures), combined with the facts that the electric power industry (including fossil fuel-fired steam generators and combustion turbines) is highly integrated, electricity is fungible, and generation is substitutable (which all facilitate the generation shifting measures encompassed in building blocks 2 and 3). Our interpretation of section 111 as focusing on limiting emissions without limiting aggregate production must take into account those unique circumstances.
469.
See
CAA section 111(d)(1) (applying a standard of performance to any existing source); (a)(6) (defining the term “existing source” as any stationary source other than a new source); and (a)(3) (defining the term “stationary source” as “any building, structure, facility, or installation which emits or may emit any air pollutant,” however, explaining that “[n]othing in subchapter II [
i.e.,
Title II] of this chapter relating to nonroad engines shall be construed to apply to stationary internal combustion engines.”)
471.
While this section provides for enforcement in the context of new sources, a CAA section 111(d) plan must provide for the enforcement of a standard of performance for existing sources.
472.
Some commenters read the proposed rulemaking as taking the position that the phrase “system of emission reduction” includes anything whatsoever that reduces emissions, and criticized that interpretation as too broad.
See
UARG comment, at 3-4. We are not taking that interpretation here. In this final rule, we agree that the phrase should be limited to exclude,
inter alia,
actions beyond the ability of the owners/operators to control.
474.
See
S. Rep. No. 91-1196, at 20 (Sept. 17, 1970), 1970 CAA Legis. Hist. at 420 (“It should be noted that the emission standards for pollutants which cannot be considered hazardous (as defined in section 115 [
i.e.,
the bill's version of CAA section 112] could be established under section 114 [
i.e.,
the bill's version CAA section 111]. Thus, there should be no gaps in control activities pertaining to stationary source emissions that pose any significant danger to public health or welfare.”).
476.
See
S. Rep. No. 91-1196, at 9; 18-20, 1970 CAA Legis. Hist. at 418-20. The Senate Committee Report identified 14 substances as subject to the provision that became section 111(d), four substances as hazardous air pollutants that would be regulated under the provision that became section 112, and 5 substances as criteria pollutants that would be regulated under the provisions that became sections 109-110 (and more “as knowledge increases”). In particular, the Report recognized that in particular, relatively few air pollutants may qualify as hazardous air pollutants, but that other air pollutants that did not qualify as hazardous air pollutants would be regulated under what became section 111(d).
477.
See, e.g.,
Standards of Performance for New Stationary Sources and Emission Guidelines for Existing Sources: Hospital/Medical/Infectious Waste Incinerators, 62 FR 48348, 48359 (Sept. 15, 1997); Standards of Performance for New Stationary Sources and Emission Guidelines for Existing Sources: Commercial and Industrial Solid Waste Incineration Units, 65 FR 75338, 75341 (Dec. 1, 2000).
478.
Although not defined under CAA section 111, the term was used in other provisions and defined in some of them. The term was defined under the CAA's citizen suit provision.
See
1970 CAA Amendments, Pub. L. 91-604, § 12, 84 Stat. 1676, 1706 (Dec. 31, 1970) (defined as “(1) a schedule or timetable of compliance, emission limitation, standard of performance or emission standard, or (2) a control or prohibition respecting a motor vehicle fuel or fuel additive . . . . .”). Congress also used it in the CAA's NAAQS provisions and in CAA section 112. Under the CAA's NAAQS provisions (
i.e.,
the “Ambient Air Quality and Emission Standards” provisions), Congress directed the EPA to issue information on “air pollution control techniques,” and include data on “available technology and alternative methods of prevention and control of air pollution” as well as on “alternative fuels, processes, and operating methods which will result in elimination or significant reduction of emissions.”
Id.,
§ 4, 84 Stat. at 1679. Similarly, under CAA section 112, the Administrator was required to “from time to time, issue information on pollution control techniques for air pollutants” subject to emission standards.
Id.,
84 Stat. at 1685. These statements provide additional context for the term's broad intent.
479.
H.R. 17255, § 5, 1970 CAA Legis. Hist. at 921-22. The reference to “Secretary” was to the Secretary of Health Education and Welfare, which, at the time, was the agency with responsibility for air pollution regulations.
483.
Notably, the Senate report identifies pollution control
and
pollution prevention as objectives of the Senate provision. Pollution prevention is discussed more generally below as a “primary purpose” of the CAA, however, the report makes clear that pollution prevention measures—which the EPA understands to include such measures as building blocks 2 and 3—are appropriate under CAA section 111.
492.
H.R. Rep. No. 95-294 (May 12, 1977), 1977 CAA Legis. Hist. at 2662 (emphasis added). Congress also endorsed the EPA's practice of establishing “emission guidelines” under CAA section 111(d).
See
H.R. Rep. No. 95-294 (May 12, 1977), 1977 CAA Legis. Hist. at 2662 (“The Administrator would establish guidelines as to what the best system for each such category of existing sources is. However, the state would be responsible for determining the applicability of such guidelines to any particular source or sources.”).
493.
Sen. Muskie, S. Consideration of the H.R. Conf. Rep. No. 95-564 (Aug. 4, 1977), 1977 CAA Legis. Hist. at 353.
494.
In 1977, Congress added a new substantive definition for “emission standard” generally applicable throughout the CAA. 1977 CAA Amendments, Public Law 95-95, § 301, 91 Stat. 685, 770 (Aug. 7, 1977) (defining “emission limitation” and “emission standard” as “a requirement established by the State or the Administrator which limits the quantity, rate, or concentration of emissions of air pollutants on a continuous basis, including any requirement relating to the operation or maintenance of a source to assure continuous emission reduction.”). Congress also added a generally applicable definition of standard of performance, defined as “a requirement of continuous emission reduction, including any requirement relating to the operation or maintenance of a source to assure continuous emission reduction.”
Id.
495.
We note that the general definition of a standard of performance at CAA section 302(l) still uses “continuous.” Even if this provision applies to section 111, it does not affect our analysis in this rule, including our interpretation that BSER includes building blocks 2 and 3.
496.
There are numerous reasons to find that particular CAA section 111(b) standards of performance should be based on controls installed at the source at the time of new construction. This is due in part to the recognition that new sources have long operating lives over which initial capital costs can be amortized, as recognized in the legislative history for section 111. Thus, new construction is the preferred time to drive capital investment in emission controls.
See, e.g.,
S. Rep. No. 91-1196, at 15-16, 1970 CAA Legis. Hist. at 416 (“[t]he overriding purpose of this section [concerning new source performance standards] would be to prevent new air pollution problems, and toward that end, maximum feasible control of new sources at the time of their construction is seen by the committee as the most effective and, in the long run, the least expensive approach.”);
see also
1977 CAA Amendments, § 109, 91 Stat. at 700, (redefining, with respect to new sources, CAA section 111(a)(1) to reflect the best “technological system of continuous emission reduction” and adding CAA section 111(a)(7) to define this new term). However, as a result of the 1990 revisions to CAA section 111(a)(1), which replaced the phrase “technological system of continuous emission reduction” with “system of emission reduction,” new source standards would not be restricted to being based on technological control measures.
497.
See, e.g.,
comments by UARG at 31 (the building blocks other than building block 1 take a “ `beyond-the-source' approach” and “impermissibly rely on measures that go beyond the boundaries of individual affected EGUs and that are not within the control of individual EGU owners and operators”); comments by American Chemistry Council
et al.
(“Associations”) at 60-61 (EPA's proposed BSER analysis is unlawful because it “looks beyond the fence line of the fossil fuel-fired EGUs that are the subject of this rulemaking;” “the standard of performance must . . . be limited to the types of actions that can be implemented directly by an existing source within [the appropriate] class or category.”).
499.
H.R. Rep. No. 95-294 (May 12, 1977), 1977 CAA Legis. Hist. at 2655 (emphasis added). Generally speaking, coal cleaning activities also are conducted by third parties. For instance, EPA
recognized in a regulatory analysis of new source performance standards for industrial-commercial-institutional steam generating units that the technology “requires too much space and is too expensive to be employed at individual industrial-commercial-institutional steam generating units.” U.S. EPA,
Summary of Regulatory Analysis for New Source Performance Standards: Industrial-Commercial-Institutional Steam Generating Units of Greater than 100 Million Btu/hr Heat Input,
EPA-450/3-86-005, p. 4-4 (June 1986).
500.
See
U.S. EPA,
Background Information for Proposed New-Source Performance Standards: Steam Generators, Incinerators, Portland Cement Plants, Nitric Acid Plants, Sulfuric Acid Plants,
Office of Air Programs Tech. Rep. No. APTD-0711, p. 7 (Aug. 1971) (indicating the “desirability of setting sulfur dioxide standards that would allow the use of low-sulfur fuels
as well as fuel cleaning,
stack-gas cleaning, and equipment modifications” (emphasis added)).
501.
40 CFR 60.49b(n)(4); see also
Amendments to New Source Performance Standards (NSPS) for Electric Utility Steam Generating Units and Industrial-Commercial-Institutional Steam Generating Units; Final Rule,72 FR 32742 (June 13, 2007).
502.
By comparison, under the 1990 CAA Amendments, Congress substantially transformed CAA section 112 to be significantly more prescriptive in directing EPA rulemaking, which reflected Congress's increased knowledge of hazardous air pollutants and impatience with the EPA's progress in regulating.
503.
In the 1977 CAA Amendments, Congress applied the same broad drafting approach to the stratospheric ozone provisions it adopted in CAA sections 150-159. There, Congress authorized the EPA to determine whether, “in the Administrator's judgment, any substance, practice, process, or activity may reasonably be anticipated to affect the stratosphere, especially ozone in the stratosphere, and such effect may reasonably be anticipated to endanger public health or welfare,” and then directed the EPA, if it made such a determination, to “promulgate regulations respecting the control of such process practice, process, or activity. . . .” CAA section 157(a). This provision does not further specify requirements for the regulations.
504.
On the other hand, in those instances in which Congress had a clear idea as to the emission limitations that it thought should be imposed, it mandated those emission limits,
e.g.,
in Title II concerning motor vehicles.
506.
Even under BART, the EPA is authorized to allow emissions trading between sources.
See, e.g.,40 CFR 51.308(e)(1) & (2);
Util. Air Reg. Group
v.
EPA,
471 F.3d 1333 (D.C. Cir. 2006);
Ctr. for Econ. Dev.
v.
EPA,
398 F.3d 653 (D.C. Cir. 2005); and
Cent. Ariz. Water Dist.
v.
EPA,
990 F.2d 1531 (9th Cir. 1993).
507.
Industry commenters also acknowledged that it is the owner or operator that implements the control requirements. See UARG comment at 19 (section 111(d) “provides for the regulation of individual emission sources through performance standards that are based on what design or process changes an individual source's owner can integrate into its facility”).
508.
CAA section 111(e) provides: (“[I]t shall be unlawful for any owner or operator of any new source to operate such source in violation of any [applicable] standard of performance.”)
509.
For this same reason, the fact that CAA section 111(h) authorizes the EPA to impose certain types of standards—such as, among others, work practice or operational standards—only in limited circumstances not present in this rulemaking, does not mean that the EPA cannot consider those same measures as the BSER in promulgating a standard of performance.
510.
It should also be noted that Title IV is limited to particular pollutants (
i.e.,
SO2
and NOX) and particular sources—fossil fuel-fired EGUs—and as a result, lends itself to greater specificity about the types of control measures. Section 111(d), in contrast, applies to a wide range of source types, which, as discussed above, supports reading it to authorize a broad range of control measures.
511.
EPA
v.
EME Homer City Generation, L.P.,
134 S. Ct. 1584, 1603 (2014) (“We routinely accord dispositive effect to an agency's reasonable interpretation of ambiguous statutory language.”).
513.
S. Massoud Amin, “Securing the Electricity Grid,” The Bridge, Spring 2010, at 13, 14; Phillip F. Schewe, The Grid: A Journey Through the Heart of Our Electrified World 1 (2007).
514.
See
CAA section 404(f)(2)(B)(iii)(I) (conditioning a utility's eligibility for certain allowances on implementing an energy conservation and electric power plan that evaluates a range of resources to meet expected future demand at least cost);
see also
S. Rep. No. 101-228, at 319-20 (Dec. 20, 1989) (recognizing that “utilities already engage in power-pooling arrangements to ensure maximum flexibility and efficiency in supplying power” to support the establishment of an allowance system under Title IV).
519.
See King
v.
Burwell,
No. 14-114 (2015) (slip op., at 21) (“But in every case we must respect the role of the Legislature, and take care not to undo what it has done.”).
521.
See, e.g.,
Shepard, Donald S.,
A Load Shifting Model for Air Pollution Control in the Electric Power Industry,
Journal of the Air Pollution Control Association, Vol. 20:11, pp. 756-761 (November 1970).
522.
1990 CAA Amendments, § 403, 104 Stat. at 2631 (requiring repeal of amendments to CAA section 111(a)(1) upon any cessation of effectiveness of CAA section 403(e), which requires new units to hold allowances for each ton of SO2
emitted). Congress believed that mandating a technological standard through the percentage reduction requirement in section 111(a)(1) would ensure the continued availability of low sulfur coal for existing sources. In other words, the percentage reduction requirement discouraged compliance with new source performance standards based solely on fuel shifting because it was much more costly to achieve the percentage reduction with lower sulfur coal. This belief was expressed during the 1977 CAA Amendments and is discussed above as part of the legislative history of section 111.
523.
1990 CAA Amendments, § 406, 104 Stat. at 2632-33;
see also
S. Rep. No. 101-228, at 282 (industrial source emissions totaled 5.6 million tons of SO2
in 1985).
525.
To reiterate, ordinarily, standards of performance cannot be used to regulate SO2
emissions from existing sources because of the pollutant exclusions in CAA section 111(d).
530.
S. Debates on Conf. Rep. to accompany S. 1630, H.R. Rep. No. 101-952 (Oct. 27, 1990), 1990 CAA Legis. Hist. at 1033-35 (statement of Senator Baucus, inserting “the Clean Air Conference Report” into the record).
531.
H.R. Rep. No. 101-490, at 368-69; 674-76 (May 17, 1990) (additional views of Reps. Markey and Moorhead) (“We believe that H.R. 3030, as amended, will create a strong and effective incentive for utilities to immediately pursue energy conservation and renewable energy sources as key components of their acid rain control strategies.”);
see also
Rep. Collins, H. Debates on H.R. Conf. Rep. No. 101-952 (Oct. 26, 1990), 1990 CAA Legis. Hist. at 1307 (“The bottom line is that our Nation's utilities and production facilities must reach beyond coal, oil, and fossil fuels. The focus must shift instead toward conservation and renewables such as hydropower, solar thermal, photovoltaics, geothermal, and wind. These clean sources and energy, available in virtually limitless supply, are the way of the future.”).
532.
“Special Message to the Congress on Conservation and Restoration of Natural Beauty (Feb. 8, 1965).
https://www.presidency.ucsb.edu/ws/?pid=27285
(“This generation has altered the composition of the atmosphere on a global scale through radioactive materials and a steady increase in carbon dioxide from the burning of fossil fuels.”).
533.
Testimony of Charles Johnson, Jr., Administrator of the Consumer Protection and Environmental Health Service (Administration Testimony), Hearing of the House Subcommittee on Public Health and Welfare (Mar. 16, 1970), 1970 CAA Legis. Hist. at 1381 (stating that “the carbon dioxide balance might result in the heating up of the atmosphere whereas the reduction of the radiant energy through particulate matter released to the atmosphere might cause reduction in radiation that reaches the earth”).
534.
1970 CAA Legis. Hist. at 244, 257 S. Debate on S. 4358 (Sept. 21, 1970) (statement of Sen. Boggs) (replicating Chapter IV of the Council on Environmental Quality's first annual report, which states, “the addition of particulates and carbon dioxide in the atmosphere could have dramatic and long-term effects on world climate.”).
535.
122 Cong. Rec. S25194 (daily ed. Aug. 3, 1976) (statement of Sen. Bumpers) (inserting into the record, “Summary of Statements Received from Professional Societies for the Hearings on Effects of Chronic Pollution (in the Subcommittee on the Environment and the Atmosphere),” which stated, “there is near unanimity that carbon dioxide concentrations in the atmosphere are increasing rapidly. Though even the direction (warming or cooling) of the climate change to be caused by this is unknown, very profound changes in the balance of climate factors that determine temperature and rainfall on the earth are almost certain within 100 years”).
536.
National Academy of Sciences, “Energy and Climate: Studies in Geophysics” viii (1977),
https://www.nap.edu/openbook.php?record_id=12024
(noting that a fourfold to eightfold increase in carbon dioxide by the latter part of the twenty-second century would increase average world temperature by more than 6 degrees Celsius).
537.
S. Rep. No. 101-228, at 322 (Dec. 20, 1989), at 1990 Legis. Hist. at 8662 (“In the last several years, the Committee has received extensive scientific testimony that increases in the human-caused emissions of carbon dioxide and other GHGs will lead to catastrophic shocks in the global climate system.”); History, Jurisdiction, and a Summary of Activities of the Committee on Energy and Natural Resources During the 100th Congress, S. Rep. No. 101-138, at 5 (Sept. 1989); “Global Warming Has Begun, Expert Tells Senate,” New York Times, June 24, 1988,
https://www.nytimes.com/1988/06/24/us/global-warming-has-begun-expert-tells-senate.html.
541.
70 FR 28606, 28619 (May 18, 2005) (“Under the CAMR scenario modeled by EPA, units [were] projected to meet their SO2
and NOX
requirements and take additional steps to address the remaining [mercury] reduction requirements under CAA section 111, including adding [mercury]-specific control technologies (model applies [activated carbon injection]), additional scrubbers and [selective catalytic reduction],
dispatch changes,
and coal switching.”).
545.
76 FR at 48279-80. The exact mix of controls varied for different air pollutants and different time periods, but in all cases, shifting generation from higher to lower emitting units was one of the expected control strategies for the fossil fuel-fired power plants. Prior to CSAPR, the EPA promulgated two other transport rules, the NOX
SIP Call (1998) and the Clean Air Interstate Rule (CAIR) (2005), which similarly established standards based on analysis of the availability and cost of emission reductions achievable through the use of add-on controls and generation shifting, and also authorized and encouraged the implementation of RE and demand-side EE measures. CAIR: 70 FR 25162, 25165, 25256, 25279 (May 12, 2005) (allowing use of allowance set-asides for renewables and energy efficiency); NOX
SIP Call: 63 FR 57356, 57362, 57436, 57438, 57449 (Oct. 27, 1998) (authorizing and encouraging SIPs to rely on renewables and energy efficiency to meet the state budgets).
552.
For example, in the enacting the acid rain program under CAA Title IV, Congress explicitly recognized that some sources would comply by purchasing allowances instead of implementing controls. S. Rep. No. 101-228, at 303 (Dec. 20, 1989). Similarly, in promulgating the NOX
SIP Call in 1998, the EPA stated, “Since EPA's determination for the core group of sources is
based on the adoption of a broad-based trading program,
average cost-effectiveness serves as an adequate measure across sources because sources with high marginal costs will be able to take advantage of this program to lower their costs.” 63 FR at 57399 (emphasis added). By the same token, in promulgating the Cross State Air Pollution Rule, the EPA stated, “the preferred trading remedy will allow source owners to choose among several compliance options to achieve required emission reductions in the most cost effective manner, such as installing controls, changing fuels, reducing utilization,
buying allowances,
or any combination of these actions.” 76 FR at 48272 (emphasis added).
553.
See 44 FR 33580, 33597-33600 (taking into account “the amount of power that could be purchased from neighboring interconnected utility companies” and noting that “[a]lmost all electric utility generating units in the United States are electrically interconnected through power transmission lines and switching stations” and that “load can usually be shifted to other electric generating units”).
555.
H.R. Rep. No. 95-294, at 42 (May 12, 1977), 1977 CAA Legis. Hist. at 2509 (discussing a provision in the House Committee bill that became CAA section 122, requiring the EPA to study and regulate radioactive air pollutants and three other air pollutants).
556.
S. Rep. No. 91-1196, at 20 (Sept. 17, 1970), 1970 CAA Legis. Hist. at 420 (discussing section 114 of the Senate Committee bill, which was the basis for CAA section 111(d)).
558.
1970 was a significant year in environmental legislation, but it was also marked as “a year of environmental concern.” Sen. Muskie, S. Debate on S. 4358 (Sept. 21, 1970), 1970 CAA Legis. Hist. at 223. By mid-1970, Congress recognized that “[o]ver 200 million tons of contaminants [were] spilled into the air each year in America . . . . And each year these 200 million tons of pollutants endanger the health of [the American] people.”
Id.
at 224. “Cities up and down the east coast were living under clouds of smog and daily air pollution alerts.” Sen. Muskie, S. Consideration of the Conference Rep. (Dec. 18, 1970), 1970 CAA Legis. Hist. at 124. Put simply, America faced an “environmental crisis.” Sen. Muskie, S. Debate on S. 4358 (Sept. 21, 1970), 1970 CAA Legis. Hist. at 224. The conference agreement, it was reported, “faces the air pollution crisis with urgency and in candor. It makes hard choices, provides just remedies, requires stiff penalties.” Sen. Muskie, S. Consideration of the Conference Rep. (Dec. 18, 1970), 1970 CAA Legis. Hist. at 123. “[I]t represents [Congress'] best efforts to act with the knowledge available . . . in an affirmative but constructive manner.”
Id.
at 150.
559.
See
Dewey, Scott Hamilton,
Don't Breathe the Air: Air Pollution and U.S. Environmental Politics, 1945-1970
(Texas A&M University Press 2000) at 230 (“By the mid-1960s, top federal officials showed an increasing sense of alarm regarding the health effects of polluted air. In June, 1966, Secretary of Health, Education, and Welfare John W. Gardner testified before the Muskie subcommittee: “We believe that air pollution at concentrations which are routinely sustained in urban areas of the United States is a health hazard to many, if not all, people.”).
561.
S. Rep. No. 91-1196, at 20 (Sept. 17, 1970), 1970 CAA Legis. Hist. at 420 (discussing section 114 of the Senate Committee bill, which was the basis for CAA section 111(d)). Note that in the 1977 CAA Amendments, the House Committee Report made a similar statement. H.R. Rep. No. 95-294, at 42 (May 12, 1977), 1977 CAA Legis. Hist. at 2509 (discussing a provision in the House Committee bill that became CAA section 122, requiring EPA to study and then take action to regulate radioactive air pollutants and three other air pollutants).
562.
Statement of Administrator Costle, Hearings before the Subcommittee on Energy Production and Supply of the Senate Committee on Energy and Natural Resources (Apr. 5, 7, May 25, June 24 and 30, 1977), 1977 CAA Legis. Hist. at 3532 (discussing the relationship between the National Energy Plan and the Administration's proposed CAA amendments). Some of the specific changes to the CAA include the addition of the PSD program, visibility protections, requirements for nonattainment areas, and stratospheric ozone provisions.
564.
H.R. Rep. No. 101-490, at 144 (May 17, 1990). Some of the changes adopted in 1990 include revisions to the NAAQS nonattainment program, a more aggressive and substantially revised CAA section 112, the new acid rain program, an operating permits program, and a program for phasing out of certain ozone depleting substances.
565.
In addition, as we have noted, in designing the 1970 CAA Amendments, Congress was aware that carbon dioxide increased atmospheric temperatures. In 1970, when Congress learned that “the carbon dioxide balance might result in the heating up of the atmosphere” and that particulate matter “might cause reduction in radiation,” the Nixon Administration assured Congress that “[w]hat we are trying to do, however, in terms of our air pollution effort should have a very salutary effect on either of these.” Testimony of Charles Johnson, Jr., Administrator of the Consumer Protection and Environmental Health Service (Administration Testimony), Hearing of the House Subcommittee on Public Health and Welfare (Mar. 16, 1970), 1970 CAA Legis. Hist. at 1381. Many years later, scientific consensus has formed around the particular causes and effects of climate change; and the tools put in place in 1970 can be read fairly to address these concerns.
566.
This final rule is also consistent with the CAA's purpose of protecting health and welfare. For example, the CAA authorizes the EPA to regulate air pollutants as soon as the EPA can determine that those pollutants pose a risk of harm, and not to wait until the EPA can prove that those pollutants actually cause harm.
See
H.R. Rep. No. 95-294, at 49 (May 12, 1977), 1977 CAA Legis. Hist. at 2516 (describing the CAA as being designed . . . to assure that regulatory action can effectively prevent harm before it occurs; to emphasize the predominant value of protection of public health”). The protective spirit of the CAA extends to the present rule, in which the EPA regulates on the basis of building blocks 2 and 3 because the range of available and cost-effective measures in those building blocks achieves more pollution reduction than building block 1 alone. Indeed, add-on controls that are technically capable of reducing CO2
emissions at the scale necessitated by the severity of the environmental risk—for example, CCS technology—are not as cost-effective as building blocks 2 and 3 on an industry-wide basis, and while the costs of the add-on controls can be expected to be reduced over time, it is not consonant with the protective spirit of the CAA to wait.
567.
See
Air Quality Act of 1967, Pub. L. 90-148, § 2, 81 Stat. 485 (Nov. 21, 1967) (adding “Title I—Air Pollution Prevention and Control” to the CAA, along with Congress' initial findings and purposes under CAA section 101).
568.
Section 101 emphasizes the importance of air pollution prevention in two other provisions: CAA section 101(b)(4) states that one of “the purposes of [title I of the CAA, which includes section 111] are . . . (b) to encourage and assist the development and operation of regional air pollution prevention and control programs.” CAA section 101(a)(3) adds: “The Congress finds—. . . (3) that air pollution prevention . . . and air pollution control at its source is the primary responsibility of states and local governments.” In fact, section 101 mentions pollution prevention no less than 6 times.
569.
See Portland Cement Ass'n
v.
Ruckelshaus,
486 F.2d 375, 391 (D.C. Cir. 1973) (the best system of emission reduction must “look[] toward what may fairly be projected for the regulated future, rather than the state of the art at present”).
570.
See
S. Rep. No. 91-1196, at 15 (“The maximum use of available means of preventing and controlling air pollution is essential to the elimination of new pollution problems”).
572.
Sen. Muskie, S. Debates on S. 4358 (Sept. 21, 1970), 1970 CAA Legis. Hist. at 227 (“At the beginning of World War II industry told President Roosevelt that his goal of 100,000 planes each year could not be met. The goal was met, and the war was won. And in 1960, President Kennedy said that America would land a man on the moon by 1970. And American industry did what had to be done. Our responsibility in Congress is to say that the requirements of this bill are what the health of the Nation requires, and to challenge polluters to meet them.”).
See
Blaime, A.J.,
The Arsenal of Democracy: FDR, Detroit, and an Epic Quest to Arm an America at War
(Houghton Mifflin Harcourt 2014); Carew, Michael G.,
Becoming the Arsenal: The American Industrial Mobilization for World War II, 1938-1942
(University Press of America, Inc. 2010).
573.
UARG comment at 31.
See id.
at 18, 29, 49. This comment appears to be a reference to the Supreme Court's statement in
UARG. See Util. Air Reg. Group
v.
EPA,
134 S. Ct. 2427, 2444 (2014).
574.
Commenters offered hypothetical examples to illustrate their concerns over precedential effects, discussed below. Some commenters objected that our proposed interpretation of the BSER failed to include limiting principles. In the Legal Memorandum, we note that the statutory constraints discussed in this section of the preamble constitute limits on the type of the BSER that the EPA is authorized to determine.
576.
In any event, it is questionable whether measures such as those hypothesized by the commenters would be consistent with the provisions of Title II.
578.
See, e.g.,44 FR 33580, at 33599 (June 11, 1979). In this rulemaking, the EPA recognized the ability of the integrated grid to minimize power disruptions: “When electric load is shifted from a
new steam-electric generating unit to another electric generating unit, there would be no net change in reserves within the power system. Thus, the emergency condition provisions prevent a failed FGD system from impacting upon the utility company's ability to generate electric power and prevents an impact upon reserves needed by the power system to maintain reliable electric service.”
Id.
579.
The EPA's 1982 revised new source performance standards for certain stationary gas turbines provide another example of a rulemaking that focused controls on reducing emissions, as well as reliance on the integrated grid to avoid power disruptions. 44 FR 33580 (June 11, 1979). In response to comments that requested a NOX
emission limit exemption for base load utility gas turbines, the EPA explained that “for utility turbines . . . since other electric generators on the grid can restore lost capacity caused by turbine down time” the NOX
emission limit of 1150 ppm for such turbines would not be rescinded. 44 FR 33580, at 33597-98.
580.
See
“Phosphate Fertilizer Plants; Final Guideline Document Availability,” 42 FR 12022 (Mar. 1, 1977); “Standards of Performance for New Stationary Sources; Emission Guideline for Sulfuric Acid Mist,” 42 FR 55796 (Oct. 18, 1977); “Kraft Pulp Mills, Notice of Availability of Final Guideline Document,” 44 FR 29828 (May 22, 1979); “Primary Aluminum Plants; Availability of Final Guideline Document,” 45 FR 26294 (Apr. 17, 1980); “Standards of Performance for New Stationary Sources and Guidelines for Control of Existing Sources: Municipal Solid Waste Landfills, Final Rule,” 61 FR 9905 (Mar. 12, 1996).
583.
S. Rep. No. 91-1196, at 15-16 (Sept. 17, 1970), 1970 CAA Legis. Hist. at 415-16 (explaining that the “[Administrator] should determine the achievable limits and let the owner or operator determine the most economic, acceptable technique to apply.”).
589.
As discussed below, however, reduced generation remains important to this rule in that it is one of the methods for implementing the building blocks.
590.
An affected EGU that is subject to an emission rate,
e.g.,
pounds of CO2
per MWh generated, cannot achieve that rate simply by reducing its generation (unless it shuts down, in which case it would achieve a zero emission rate). This is because although reducing generation results in fewer emissions, it does not, by itself, result in fewer emissions per MWh generated.
595.
See, e.g.,
Memorandum from Terrell Hunt, Assoc. Enforcement Counsel, U.S. EPA, & John Seitz, Director, Stationary Source Compliance Div., U.S. EPA,
Guidance on Limiting Potential to Emit in New Source Permitting,
at 1-2, 6 (June 13, 1989), available at
https://www.epa.gov/region07/air/nsr/nsrmemos/lmitpotl.pdf
(“Restrictions on production or operation that will limit potential to emit include limitations on quantities of raw materials consumed, fuel combusted,
hours of operation,
or conditions which specify that the source must install and maintain controls that reduce emissions to a specified emission rate or to a specified efficiency level.”) (emphasis added).
597.
John Seitz, Director, Office of Air Quality Planning and Standards, and Robert Van Heuvelen, Director, Office of Regulatory Enforcement,
Release of Interim Policy on Federal Enforceability of Limitations on Potential to Emit,
at 3 (Jan. 22, 1996), available at
https://www.epa.gov/region07/air/nsr/nsrmemos/pottoemi.pdf.
600.
See
Final Operation Permit No. 436123380-P10 for Manitowoc Public Utilities—Custer Street (Wis. Dept. Nat. Res., 8/19/2013), Condition ZZZ.1.a(1) at p. 9 (Limiting potential to emit) and n. 11 (“These conditions are established so that the potential emissions for volatile organic compounds will not exceed 99 tons per year and potential emissions for carbon monoxide, nitrogen oxides and sulfur dioxide emissions from the facility will not exceed 249 tons per year.”).
See also
Analysis and Preliminary Determination for the Renewal of Operation Permit 436123380-P01 (Wis. Dept. Nat. Res., 5/21/2013) at p. 5 (noting that the “existing facility is a major source under Part 70 because potential emissions of sulfur dioxide, nitrogen oxides and carbon monoxide exceed 100 tons per year. The existing facility is a minor source under PSD and an area source of federal HAP” and further noting that after renewal, “the facility will continue to be a major source under Part 70 because potential emissions of sulfur dioxide, nitrogen oxides and carbon monoxide exceed 100 tons per year. The facility will also continue to be a minor source under PSD and an area source of federal HAP.”).
601.
See
Plan Approval No. 55-00001E for Sunbury Generation LP (Pa. Dept. Env. Protection, 4/1/2013), Conditions #016 on pp. 24, 32 and 40 (limiting turbine units to operating no more than 7955, 6920, or 8275 hours in any 12 consecutive month period depending on which of three turbine options was selected); Memorandum from J. Piktel to M. Zaman,
Addendum to Application Review Memo for the Repowering Project
(Pa. Dept. Env. Protection, 4/1/2013) at p. 2 of 10 (noting that source had “calculated a maximum hours per year (12 consecutive month period) of operation for the sources proposed for each of the turbine options in order to remain below the significance threshold for GHGs.”).
602.
Although, as discussed in the text in this section of the preamble, we are not treating reduced overall generation of electricity as the BSER (because it does not meet our historical and current approach of defining the BSER to include methods that allow the same amount of production but with a lower-emitting process) we note that reduced generation by individual higher-emitting EGUs to implement building blocks 2 and 3 meets the following criteria for the BSER: As the examples in the text and in the Legal Memorandum make clear, reduced generation is “adequately demonstrated” as a method of reducing emissions (because Congress and the EPA have recognized it and on numerous occasions, power plants have relied on it); it is of reasonable cost; it does not have adverse effects on energy requirements at the level of the individual affected source (because it does not require additional energy usage by the source) or the source category or the U.S.; and it does not create adverse environmental problems.
604.
Indeed, load shifting—as substitute generation is sometimes called—is an “easy and fairly inexpensive strategy” that “may be used in conjunction with other control measures” for “emission reduction.” Donald S. Shepard, “A Load Shifting Model for Air Pollution Control in the Electric Power Industry,” Journal of the Air Pollution Control Association, Vol. 20, No. 11, p. 760 (Nov. 1970). In fact, load shifting has been recognized as a pollution control technique as early as 1968, when it was included in the “Chicago Air Pollution System Model” for controlling incidents of extremely high pollution. E.J. Croke, et al., “Chicago Air Pollution System Model, Third Quarterly Progress Report,” Chicago Department of Air Pollution Control, p. 186 (1968) (discussing the feasibility of “Control by Load Reduction” in combination with load shifting as applied to the Commonwealth Edison Company),
available athttps://www.osti.gov/scitech/servlets/purl/4827809. The report also considered “combining fuel switching and load reduction” as a possible air pollution abatement technique.
See id.
at 188. The report recognized, as an initial matter, that the Commonwealth Edison Company (CECO) was “constrained to meet the total load demand” but that “load reduction at one plant or even a number of plants is usually feasible by shifting the power demand to other plants in the system.”
Id.
As a result, the report noted, “load shifting within the physical limits of the CECO system . . . may be a highly desirable control mechanism.”
Id.
The report also predicted that “[i]n the future, it may be possible to form reciprocal agreements to obtain `pollution abatement' power from neighbor companies during a pollution incident and return this borrowed power at some later date.”
Id.
at 187.
605.
The EPA notes that affected EGUs are not actually required to collectively reduce generation by the amount represented in the BSER, and may collectively reduce generation by more or less than that amount. Individual affected EGUs are free to choose reduced generation or other means of reducing emissions, as permitted by their state plans, in order to achieve the standards of performance established for them by their states.
608.
In fact, the EPA is expressly precluded from mandating specific controls except in certain limited circumstances.
See 42 U.S.C. 7411(b)(5). For instance, the EPA is authorized to mandate a particular “design, equipment, work practice, or operational standard, or combination thereof,” when it is “not feasible to prescribe or enforce a standard of performance” for new sources. 42 U.S.C. 7411(h)(1). CAA section 111(h) also highlights for us that while “design, equipment, work practice, or operational standards” may be directly mandated by the EPA, CAA section 111(a)(1) encompasses a broader suite of measures for consideration as the BSER.
609.
NACAA, “Implementing EPA's Clean Power Plan: A Menu of Options (May 2015),
https://www.4cleanair.org/NACAA_Menu_of_Options. NACAA describes itself as “the national, non-partisan, non-profit association of air pollution control agencies in 41 states, the District of Columbia, four territories and 116 metropolitan areas.”
Id.
612.
The D.C. Circuit acknowledged this legislative history in
Sierra Club
v.
EPA,
657 F.2d 298, 331 (D.C. Cir. 1981). There, the Court stated:
[T]he Reports from both Houses on the Senate and House bills illustrate very clearly that Congress itself was using a long-term lens with a broad focus on future costs, environmental and energy effects of different technological systems when it discussed section 111. [Citing S. Rep. No. 95-127, 95th Cong., 1st Sess. (1977), 3 Legis. Hist. 1371; H.R. Rep. No. 95-294, 95th Cong., 1st Sess. 188 (1977), 4 Legis. Hist. 2465.]
615.
Sierra Club
v.
EPA,
657 F.2d 298, 406 (D.C. Cir. 1981). The Court supported this statement with a lengthy quotation from a scholarly article, which stated, in part:
Consider for a moment the chain of collective decisions and their effects just in the case of electric utilities. Petroleum imports can be conserved by switching from oil-fired to coal-fired generation. But barring other measures, burning high-sulfur Eastern coal substantially increases pollution. Sulfur can be “scrubbed” from coal smoke in the stack, but at a heavy cost, with devices that turn out huge volumes of sulfur wastes that must be disposed of and about whose reliability there is some question. Intermittent control techniques (installing high smokestacks and switching off burners when meteorological conditions are adverse) can, at lower cost, reduce local concentrations of sulfur oxides in the air, but cannot cope with the growing problem of sulfates and widespread acid rainfall. Use of low-sulfur Western coal would avoid many of these problems, but this coal is obtained by strip mining. Strip-mining reclamation is possible, but substantially hindered in large areas of the West by lack of rainfall. Moreover, in some coal-rich areas the coal beds form the underground aquifer and their removal could wreck adjacent farming or ranching economies. Large coal-burning plants might be located in remote areas far from highly populated urban centers in order to minimize the human effects of pollution. But such areas are among the few left that are unspoiled by pollution and both environmentalists and the residents (relatively few in number compared with those in metropolitan localities but large among the voting population in the particular states) strongly object to this policy.
Id.
at 406 n. 526.
616.
For the reasons explained, we did not finalize those measures because significantly less expensive control measures—building blocks 2 and 3—are available for these affected EGUs.
617.
See the proposal for this rule, 79 FR at 34888 (“during the public outreach sessions, stakeholders generally recommended that state plans be authorized to rely on, and that affected sources be authorized to implement, re-dispatch, renewable energy measures, and demand-side energy efficiency measures in order to meet states' and sources' emission reduction obligations.”).
621.
A state that chooses to allow its sources to remain uncontrolled through 2023 would still be able to meet its interim goal by 2029, although it would need to impose more stringent requirements on its sources over the 2024-2029 period than it would if it had imposed requirements beginning in 2022. It should also be noted that in fact, most states could allow their sources to remain uncontrolled for 2022 and 2023, and require controls beginning in 2024, and still be able to meet their interim goal.
622.
In addition, because the section 111(d) requirements are phased in, states may choose to apply a gradual phase-in of the reductions. This means that the nominal emission rates for section 111(d) sources would be significantly less stringent for the first several years of the compliance period. We estimate that if states choose to impose the section 111(d) requirements in a proportional amount each year, beginning in 2022, the requirements for steam generators by 2022 would result in an average emission performance rate of 1,741 lb. CO2
/MWh net and by 2023, an average emission rate of 1,681 lb. CO2
/MWh net (In 2030, the rate falls to 1,305 lb. CO2
/MWh net.) For existing NGCC units, if states choose to implement the section 111(d) requirements proportionally, in 2022, the average rate would be 898 lb. CO2
/MWh net, and in 2023 it would be 877 lb. CO2
/MWh net. (In 2030, this rate falls to 771 lb. CO2
/MWh net.)
623.
See, e.g.,
EPA, “Improving Air Quality with Economic Incentive Programs,” EPA-452/R-01-001, at 82 (2001) (requiring that Economic Incentive Programs show an environmental benefit, such as “reducing emission reductions generated by program participants by at least 10 percent”),
available athttps://www.epa.gov/airquality/advance/pdfs/eipfin.pdf; “Economic Incentive Program Rules: Final Rule,” 59 FR 16690 (April 7, 1994) (same); “Certification Programs for Banking and Trading of NOX
and PM Credits for Heavy-Duty Engines: Final Rule,” 55 FR 30584 (July 26, 1990) (requiring that for programs for banking and trading of NOX
and PM credits for gasoline, diesel and methanol powered engines, all trading and banking of credits must be subject to a 20 percent discount “as an added assurance that the incentives created by the program will not only have no adverse environmental impact but also provide an environmental benefit.”).
624.
As explained in the 111(b) preamble, any attempt to subcategorize and assign a lower emission limit to larger, non-rapid start NGCC units could cause market distortions.
625.
The section 111(b) standards for modified and reconstructed steam generation units are generally lower than the emission rates of existing stream generation units, but for the reasons explained earlier, those standards cannot be compared to the section 111(d) standards for existing steam generation units.
626.
Typically, the units of measure used for heat rate (
e.g.,
Btu/kWh-net) indicate whether a given value is based on the gross output or net output. Net heat rate is always higher than gross heat rate; in coal-steam units, net heat rate can be 5-10% higher than gross heat rate.
627.
Similarly, within each interconnection, the generation-weighted average annual heat rates for those coal-fired EGUs in our study population were 9,700 Btu per gross kWh (Eastern); 9,888 Btu per gross kWh (Western); and 9,789 Btu per gross kWh (Texas).
630.
The geographic area within the Texas Interconnection generally corresponds to the portion of the state of Texas covered by ERCOT (the Electric Reliability Council of Texas). Additional portions of the state of Texas are located within the Eastern and Western Interconnections.
631.
Because an EGU's rated nameplate capacity is based on a maximum continuous rating, EGUs may operate for periods of time “over” 100 percent of their capacity factor. The EPA's dataset of hourly operating data reflected some such instances.
632.
As described below, we also conducted this regionalized approach using a benchmark based on the best hourly gross heat rate accounting for outliers during any one-year period. See the GHG Mitigation Measures TSD supporting the final CPP for more details.
633.
In the proposal, we used heat input values rather than gross heat rate values. See the GHG Mitigation Measures TSD supporting the final CPP for more details.
634.
For the Eastern Interconnection, the consistency factor is 38.1 percent. For the Western Interconnection, the consistency factor is 38.4 percent. For the Texas Interconnection, the consistency factor is 37.1 percent. Conducting this analysis on a nationwide basis would have resulted in application of a consistency factor of 38.2 percent. As described below, we also conducted this regionalized approach using consistency factors determined based on one-year figures. See the GHG Mitigation Measures TSD supporting the final CPP for more details.
635.
Conducting this analysis on a nationwide basis would have resulted in a finding that EGUs nationwide are capable on average of reducing their CO2
emissions by improving heat rate 4.0 percent. See the table in this section and the GHG Mitigation Measures TSD for the results of this approach using benchmarks and consistency factors based on one-year averages.
636.
As described below, we also conducted this regionalized approach using each EGU's best one-year rolling average. See the GHG Mitigation Measures TSD supporting the final CPP for more details.
637.
Conducting this approach on a nationwide basis would have resulted in a finding that EGUs nationwide are capable on average of reducing their CO2
emissions by improving heat rate 4.6 percent. As described below, we also conducted this regionalized approach using one-year averages. See the GHG Mitigation Measures TSD supporting the final CPP for more details.
638.
As described below, we also conducted this approach using one-year averages for each EGU instead of two-year averages. See the GHG Mitigation Measures TSD supporting the final CPP for more details.
639.
Conducting this approach on a nationwide basis would have resulted in a finding that EGUs nationwide are capable on average of reducing their CO2
emissions by improving heat rate 5.0 percent.
640.
The GHG Mitigation Measures TSD describes in more detail our rationale for using one- and two-year averaging periods in our analytical approaches and methodology as a whole.
641.
To give an illustrative example, imagine a population of sources that emit Pollutant X. Half of the sources emit Pollutant X at 2500 lbs/hour, while the other half of the sources have scrubbers installed that reduce their emission rates to 1500 lbs/hour. Because the sources are evenly divided between those with and without scrubbers, the average emission rate for the population as a whole is 2000 lbs/hour. In this hypothetical, EPA decides to base requirements on the emission rate achievable through use of a scrubber, meaning that all sources will have to meet an emission rate of 1500 lbs/hour. Because the fleet as a whole has an average emission rate of 2000 lbs/hour, it would be accurate for EPA to say that the fleet as a whole can reduce its emission rate by 25 percent—from 2000 lbs/hour on average (only half the sources with scrubbers), to 1500 lbs/hour on average (all the sources with scrubbers). This description of what is possible
for the fleet as a whole
—a 25-percent reduction in emission rate—should not be misinterpreted as a statement that every
individual
source is capable of further reducing its emissions by 25 percent. The sources that have already installed scrubbers, and which are thus already operating at 1500 lbs/hour, would not be required to further improve their emission rate.
642.
Examples of the many types of best practices and equipment upgrades available to coal-fired EGUs include adopting sliding pressure operation to reduce turbine throttling losses; installing intelligent sootblowing system software; upgrading the combustion control/optimization system; installing heat rate optimization software; installing a production cost optimization program that benchmarks plant thermal performance using historical plant data; establishing centralized remote monitoring centers with thermal performance software for monitoring heat rates systemwide; repairing steam and water leaks; automating steam system drains; performing an on-site performance appraisal to identify potential areas for improved performance; developing heat rate improvement procedures and training O&M staff on their use; aligning the cycle to isolate or capture high-energy fluid leakage from the steam cycle; repairing utility boiler air in-leakage; performing utility boiler chemical cleaning; installing condenser tube cleaning system; retubing condenser; repairing/upgrading flue gas desulfurization systems; cleaning air preheater coils; adjusting/replacing worn air heater seals; replacing corroded air heater baskets; replacing feed pump turbine steam seals; overhauling high pressure feedwater pumps; installing fan and pump variable speed/frequency drives; upgrading turbine steam seals; upgrading all turbine internals; and installing coal drying systems. These and additional heat rate improvement measures are discussed further in the GHG Mitigation Measures TSD for the CPP Final Rule.
643.
Had the EPA maintained a nationwide approach to analyzing the potential reductions under building block 1, the result would have been 4.0 percent.
644.
The $100/kW cost figure from the proposal is now particularly conservative because it included the cost of significant equipment upgrades that improve heat rate, whereas building block 1 is now largely quantified based on low- or no-cost best practices, with a smaller portion of the remainder comprised of equipment upgrades.
646.
When considered on a regional basis, we expect these controls to impact heat rate by approximately 0.3 percent in both the Eastern and Western Interconnections, and by less than 0.1 percent in the Texas Interconnection.
647.
Furthermore, on a fundamental level, our methodology accounts for a certain amount of any residual inexactness because we have conservatively adopted the lowest value identified by any of our reasonable approaches—all three of which are themselves conservative because they do not account for the full extent of heat rate improvements achievable through equipment upgrades.
649.
“Economic Dispatch: Concepts, Practices and Issues”, FERC Staff Presentation to the Joint Board for the Study of Economic Dispatch”, Palm Springs, California, November 13, 2005. A copy of this presentation is available in the docket for this rule.
650.
“Security Constrained Economic Dispatch: Definitions, Practices, Issues and Recommendations: A Report to Congress”, Federal Energy Regulatory Commission, July 31, 2006.
657.
Some owners or operators of steam generators may have electricity supply obligations to which they may be applying power from those steam generators. However, such parties may fulfil those supply obligations using the wholesale power market in the exact same way described here that enables any other generator with economically attractive electricity to offer such supply. In other words, the ability of a steam generator to reduce its generation is not contingent on an associated purchase to replace that power, notwithstanding the possibility that the owner or operator of that steam unit may choose to make such a purchase to meet an electricity supply obligation.
665.
For a given amount of net generation, a net summer capacity factor appears higher compared to a corresponding nameplate capacity factor because net summer capacity reflects a lower amount of total generation potential achievable by the unit in practice.
666.
Net summer capacity is defined as: “The maximum output, commonly expressed in megawatts (MW), that generating equipment can supply to system load, as demonstrated by a multi-hour test, at the time of summer peak demand (period of June 1 through September 30.) This output reflects a reduction in capacity due to electricity use for station service or auxiliaries.” (EIA,
https://www.eia.gov/tools/glossary).
673.
Pipeline and Storage Infrastructure Requirements for a 30 Tcf Market, INGAA Foundation, 1999 (Updated July, 2004); U.S. gas groups confident of 30-tcf market, Oil and Gas Journal, 1999.
674.
For example, between 2010 and April 2014, 118 pipeline projects with 44,107 MMcf/day of capacity (4,699 miles of pipe) were placed in service, and between April 2014 and 2016 an additional 47 pipeline projects with 20,505 MMcf/day of capacity (1,567 miles of pipe) are scheduled for completion. Energy Information Administration,
https://www.eia.gov/naturalgas/data.cfm.
676.
According to the Edison Electric Institute, member companies are planning over 170 projects through 2024, with costs totaling approximately $60.6 billion (this is only a portion of the total transmission investment anticipated). Approximately 75 percent of the reported projects (over 13,000 line miles) are high voltage (345 kV and higher). Construction of transmission lines of 345KV and above are generally major projects that are particularly effective at carrying power of large distances.
https://www.eei.org/issuesandpolicy/transmission/Documents/Trans_Project_lowres_bookmarked.pdf.
683.
American Wind Energy Association. AWEA Comments on EPA's Proposed Carbon Pollution Emission Guidelines for Existing Stationary Sources and Supplemental Proposed Rule. p. 107.
685.
Non-hydro RE capacity for the total electric power industry was more than 16,000 megawatts in 1998. Energy Information Administration, 1990-2013 Existing Nameplate and Net Summer Capacity by Energy Source Producer Type and State (EIA-860). Available at:
https://www.eia.gov/electricity/data/state/.
707.
American Wind Energy Association. AWEA Comments on EPA's Proposed Carbon Pollution Emission Guidelines for Existing Stationary Sources and Supplemental Proposed Rule. pp. 88-91.
708.
Solar Energy Industries Association. Comments to the EPA and States on the Proposed Clean Power Plan Regulating Existing Power Plants Under Section 111(d) of the Clean Air Act. pp. 98-147.
709.
American Wind Energy Association. U.S. Wind Industry Annual Market Report (2014 data). Accessed July 2015. Available at
https://www.awea.org/AnnualMarketReport.aspx?ItemNumber=7422&RDtoken=64560&userID=. The ten largest electric utilities with wind power capacity on the system (owner or under contract) includes: Xcel Energy; Berkshire Hathaway Energy; Southern California Edison; American Electric Power; Pacific Gas & Electric; Tennessee Valley Authority; San Diego Gas & Electric; CPS Energy; Los Angeles Department of Water & Power; and Alliant Energy.
716.
FERC Docket No. EL03-133-000, Petition for Declaratory Order and Request for Expedited Consideration, American Ref-Fuel Company, Covanta Energy Group, Montenay Power Corporation, and Wheelabrator Technologies, Inc. June 16, 2003,
Order Granting Petition for Declaratory Ruling,
October 1, 2003.
American Ref-Fuel Co. et al.,
105 FERC ¶ 61,004 (2003); and
Order Denying Rehearing.
April 15, 2004. 107 FERC ¶ 61,016 (2004). Available online at:
https://www.ferc.gov/whats-new/comm-meet/041404/E-28.pdf
(accessed 11/7/2014).
718.
Consistent with the October 2014 NODA, the final goal-setting methodology assumes replacement of affected EGU generation by incremental building block 3 generation in calculating source-specific CO2
emission performance rates. For additional information on the goal-setting methodology, refer to Section VI.
719.
For additional information on the updated RE cost and performance assumptions used to quantify building block 3 generation, refer to the GHG Mitigation Measures TSD.
720.
The technical potential limiter was a nationally uniform, technology-specific limit on cost-effective RE deployment based on the amount of 2012 generation in a state as a share of that state's total technical potential.
722.
Capacity values for utility-scale solar PV are expressed in terms of MWDC. The assumed future capacity factor for this utility-scale solar PV includes a DC-to-AC conversion, enabling the generation totals to be combined across all RE technologies.
The Western Wind and Solar Integration Study Phase 2. NREL. Lew et al., 2013. Available at
https://www.nrel.gov/docs/fy13osti/55588.pdf. Refer to GHG Mitigation Measures TSD for further analysis.
730.
For additional discussion on how this concept impacts building block 3 generation levels, refer to the GHG Mitigation Measures TSD and the CO2
Emission Performance Rate and Goal Computation TSD for Final CPP.
731.
The only natural gas fired EGUs currently considered affected units under the 111(d) applicability criteria are NGCC units capable of supplying more than 25 MW of electrical output to the grid. The data and rates for these units represent all emissions and MWh output associated with both the combustion turbines as well as all associated heat recovery steam generating units. The remainder of the section will use the term “NGCC” to collectively refer to these natural gas fired EGUs.
732.
As described below, the emission performance rates include adjustments to incorporate the potential effects of emission reduction measures that address power sector CO2
emissions primarily by reducing the amount of electricity produced at a state's affected EGUs (associated with, for example, increasing the amount of new low- or zero-carbon generation rather than by reducing their CO2
emission rates per unit of energy output produced).
733.
As discussed below in Section VIII on state plans, we are similarly determining that states choosing a rate-based form of emission performance level for their plans should establish a requirement for affected EGUs to report hourly net energy output.
734.
Specifically, commenters noted that while net generation is not reported to the EPA under 40 CFR part 75, affected EGUs are generally required to report gross and net generation on a monthly basis to EIA through form 923 submittal.
735.
However, as discussed in the next section, in order to provide maximum flexibility to states, the EPA averages these two emission rates together for each state using their adjusted 2012 baseline generation share to arrive at a single statewide emission performance goal. The state has the option to comply with this statewide goal through a compliance pathway of its choice. This compliance pathway may or may not involve requiring its affected units to meet the emission performance rates.
736.
The EPA's responsibility is to determine the BSER for all affected EGUs. Some of these under construction units may not enter operation until 2015 or later, but they are likely affected units and therefore appropriate to reflect in the baseline and corresponding subcategory-specific emission performance rates and state goals.
737.
The EPA notes that in some cases, it may not yet be possible to determine the status of an EGU as affected or unaffected without additional data. There are potentially some units excluded or included in the baseline that will ultimately have a different status following an applicability determination. However, these cases are limited, and the effect of any collective changes to the affected fleet inventory will not yield a bias in the BSER computation at the regional level.
738.
The NEEDS database was also updated to reflect the latest data and commenter input on under construction units.
739.
For purposes of determining emission performance rates, the EPA classifies any unit that had begun construction prior to Jan. 8, 2014, but had not commenced operation by Dec. 31, 2011 as “under construction”. Many of these “under construction” units have commenced operation at some point during 2012 or prior to signature of this final rule.
740.
“Commence” and “construction” are defined in 40 CFR 60.2.
741.
The baseline inventory relies on historical data and does not incorporate anticipated future retirements. Most commenters supported this treatment as they viewed those scheduled retirements (and corresponding emission reductions) as an alternative compliance flexibility.
742.
The EPA recognizes that more recent emissions and generation data have become available since 2012, but 2012 data constituted the most recent year for which full data was available at the time the EPA began its analysis for proposal.
744.
While solar and wind generation may vary on an hourly or daily basis, their annual generation profiles are subject to notably less variation compared to hydropower. The EPA's calculation of the BSER relies on annual generation data, not on hourly or daily generation data.
745.
Updated unit-level data reflecting corrections identified by commenters to the underlying 2012 file are provided in Appendix 1 of the CO2
Emission Performance Rate and Goal Computation TSD for CPP Final Rule. The adjustments made to the aggregate data to address representativeness concerns are provided in Appendix 3.
746.
EGUs whose capacity or fossil fuel combustion were insufficient to qualify them as likely affected EGUs were not included in the subcategory-specific rate and goal computations. Most simple cycle combustion turbines (CTs) were excluded on this basis at proposal, and all simple cycle CTs were excluded at final reflecting changes to the applicability language. IGCC's were designated as “other” generation at proposal, but they are grouped with coal units for purposes the final rule category-specific rates. Useful thermal output (UTO) was also translated to a MWh equivalent and included in state goals at proposal, resulting in more stringent rates for states with more cogeneration sources, but UTO is not included in this final rule emission performance rate or state goal calculations as a result of comments regarding potentially adverse impacts on cogeneration units and uncertainty of thermal load outputs. As described in the state plan section of the preamble, units may still quantify and convert UTO (
i.e.,
taking credit for waste heat capture) when demonstrating compliance. See the applicability criteria described in Section IV.D above.
747.
The EPA notes that we did not identify any under construction coal units at proposal, but we are using a methodology in this final rule for newly categorized under construction coal units similar to our under construction assessment of NGCC at proposal.
748.
The EPA received comment on the assumed 55 percent capacity factor for under construction NGCC EGUs. Some comments suggested the value was too large of an estimation for incremental generation as some of that 55 percent utilization would have a replacement impact on 2012 operating generation. Others suggested it should be larger as a particular planned under construction unit was anticipated to have a higher utilization rate. The EPA reviewed operating patterns of EGUs that came online, and determined a 55 percent and 60 percent capacity factor assumption for under construction NGCC and coal EGUs respectively are a reasonable estimate for informing the incremental emissions and generation from under construction units. It recognizes that some of these units may indeed operate at a higher utilization level, but also recognizes that some of the generation may have a replacement effect instead of an incremental one.
749.
The EPA received some comments suggesting that under construction units should not be included in the quantification of BSER and/or rate calculations, and other comments supporting their inclusion. The EPA determined that including it was consistent with our responsibility under the 111(d) statute to define a Best System of Emission Reduction for existing units.
750.
Building block 1 analysis acknowledges some variation in heat rate improvement potential at different units. The implementation of this building block reflects a heat rate improvement on average across a region's coal fleet, not necessarily a heat rate improvement at every unit.
751.
Baseline OG steam emissions are added to adjusted coal emissions and divided by baseline OG steam generation and baseline coal generation.
752.
The EPA took comment on a pro-rata or an intensity-based replacement approach. In this final rule, the EPA agrees with commenters that a pro-rata approach is a better reflection of the BSER. Incremental RE generation has, and is likely to continue, to replace both steam and gas turbine generation and the BSER captures this through a pro-rata distribution of identified building block 3 potential.
753.
For example, if 100 MWh of incremental zero emitting generation is available in a given region and that region had 70 percent of its affected fossil generation coming from fossil steam units in the baseline and 30 percent from NGCC units—then 70 MWhs of the incremental zero-emitting generation are applied to baseline fossil steam generation and 30 MWhs are applied to baseline NGCC generation.
755.
The EPA recognizes that real world market dynamics will necessarily differ from the BSER assumptions, and has designed the emission guidelines to provide flexibility beyond the emission reduction opportunities identified in the BSER. The essential criteria, however, are that the emission rates and crediting framework are consistent with the BSER and provide the incentives needed to facilitate the emission
reduction measures reflected in the BSER and together produce an achievable compliance framework for sources.
756.
See CO2
Emission Performance Rate and Goal Computation TSD for CPP Final Rule for an illustration of this step. The EPA defined the “incremental NGCC generation” in this step in a manner consistent with its measurement and use described in section VIII of this preamble.
757.
See CO2
Emission Performance Rate and Goal Computation TSD for CPP Final Rule for an illustration of this step. We note that the entire NGCC generation level (inclusive of the amount assigned to the fossil steam rate) expected post building block application is included in the NGCC rate calculation. Including the entire NGCC generation in the NGCC rate recognizes the simultaneous compliance responsibility of affected NGCC units while the fossil steam rate recognizes its mitigation potential through incorporation of the incremental NGCC generation component. Failing to do so would result in a NGCC rate lower than that expected after full implementation of the building blocks and create a compliance inconsistency when reporting all generation.
758.
At proposal, the EPA repeated this step over a 10 year period. The building blocks and corresponding BSER emission rates increased for ten consecutive years (2020-2029) in the EPA's rate calculation. In this final rule, the EPA has maintained the same 2030 compliance period for final rates but adjusted the start date to 2022 based on comments. Therefore, the deployment of building blocks is spread over a nine year period (2022-2030) instead of the proposed 10 year period.
761.
For more detail on this methodology, please refer to the CO2
Emission Performance Rate and Goal Computation TSD for CPP Final Rule, which is available in the docket.
762.
The final rule includes state plan conditions to prevent perverse incentives that could otherwise result in greater overall emissions when generation shifts across affected EGUs. For example, states that wish to engage in rate-based trading through an emission standards plan type must adopt plans designed to achieve either a common rate-based state goal or the subcategory-specific emission performance rates (see section VIII.L). Such a state plan condition avoids encouraging generation to shift from a state with a relatively lower state goal to a state with a relatively higher state goal solely as a response to the form of CPP implementation.
764.
The EPA has not developed statewide rate-based or mass-based CO2
emission performance goals for Vermont and the District of Columbia because current information indicates those jurisdictions have no affected EGUs.
766.
See, e.g., Grand Canyon Air Tour Coalition
v.
F.A.A.,
154 F.3d 455, 471 (D.C. Cir. 1998) (ordinarily, agencies have wide latitude to attack a regulatory problem in phases and that a phased attack often has substantial benefits);
National Association of Broadcasters
v.
FCC,
740 F.2d 1190, 121-11 (D.C. Cir. 1984) (“We have therefore recognized the reasonableness of [an agency's] decision to engage in incremental rulemaking and to defer resolution of issues raised in a rulemaking. . . .”).
767.
As stated previously, states with one or more affected EGUs will be required to develop and implement plans that set emission standards for affected EGUs. The CAA section 111(d) emission guidelines that the EPA is promulgating in this action apply to only the 48 contiguous states and any Indian tribe that has been approved by the EPA pursuant to 40 CFR 49.9 as eligible to develop and implement a CAA section 111(d) plan. Because Vermont and the District of Columbia do not have affected EGUs, they will not be required to submit a state plan.
769.
A federal plan may be withdrawn if the state submits, and the EPA approves, a state plan that meets the requirements of this final rule and section 111(d) of the CAA. More details regarding the federal plan are addressed in the EPA's proposed federal plan rulemaking.
770.
States are free to establish different interim step performance rates or interim step state goals than those the EPA has specified in this final rule. If states choose to determine their own interim step performance rates or state goals, the state must demonstrate that the plan will still meet the interim performance rates or state goal for 2022-2029 finalized in this action.
772.
U.S. Energy Information Administration Electric Power Annual 2013.
https://www.eia.gov/electricity/annual. Table 4.6: Capacity additions, retirements and changes by energy source. March 2015.
773.
U.S. Energy Information Administration Electric Power Monthly.
https://www.eia.gov/electricity/monthly. Table 6.3: New Utility Scale Generating Units by Operating Company, Plant, Month, and Year.
776.
For example, under a mass-based implementation, the state plan could include a set-aside of early action allowances from an emissions budget that itself reflects the state goals. Allocation of those early action allowances to parties effectuating reductions in 2020 and 2021 would have no impact on the total emissions budget, which sets the total allowable emissions in the compliance periods. Alternatively, under a rate-based implementation, the state plan could require that early action ERCs issued to parties effectuating reductions in 2020 and 2021 would be “borrowed” from a pool of ERCs created by the state during the interim plan performance period. States could limit the size of the “borrowed” pool of ERCs to be equivalent to the size of the federal matching pool, or could take into consideration the potential for each state's federal matching pool to expand after a redistribution of unused credits. For every early action ERC awarded for actions in 2020 and 2021, the state would retire one ERC from the pool of ERCs created as a result of reductions achieved from 2022 onward.
777.
In addition to the CEIP, states may also offer credit for early investments in RE and demand-side EE according to the provisions of section VIII.K.1 of this final rule: A state may award ERCs to qualified providers that implement projects from 2013 onward that realize quantified and verified MWh results in 2022 and subsequent years.
778.
Several of these programs are discussed in section IX of this preamble, including, for example, Maryland's EmPOWER Low Income Energy Efficiency Program (LIEEP) and New York's EmPower New York program.
779.
For a state plan incorporating the use of ERCs or allowances to be approvable by the EPA, such a plan must use an EPA-approved or EPA-administered tracking system for ERCs or allowances. The EPA received a number of comments from states and stakeholders about the value of the EPA's support in developing and/or administering tracking systems to support state administration of rate-based emission trading programs. The EPA is exploring options for providing such support and is conducting an initial scoping assessment of tracking system support needs and functionality.
780.
The CEIP is expected to provide states and affected EGUs additional flexibility in meeting the guidelines, and bears similarity in both design and purpose to the Compliance Supplement Pool, which the agency established as a part of the NOX
SIP Call.
See 63 FR 57356, 57428-30 (Oct. 27, 1998). Certain aspects of the Compliance Supplement Pool were challenged in litigation and upheld by the D.C. Circuit Court of Appeals.
See Michigan
v.
EPA,
213 F.3d 663, 694 (D.C. Cir. 2000).
781.
40 CFR 60.21(f) defines “emission standard” as “a legally enforceable regulation setting forth an allowable rate of emissions into the atmosphere, establishing an allowance system, or prescribing equipment specifications for control of air pollution emissions.” This definition is promulgated and effective, and we note that it authorizes the use of allowance systems as a form of emission standard. To resolve any doubt that allowance systems are an acceptable form of emission standard in the final rule, we are including regulatory text in the final subpart UUUU regulations authorizing the use of allowance systems as a form of emission standard under section 111(d). Section 60.21(f) was originally amended in 2005 to include recognition of allowance systems as a form of emission standard in the Clean Air Mercury Rule (CAMR) (70 FR 28606, 28649; May 18, 2005). CAMR was vacated in its entirety in
New Jersey
v.
EPA,
517 F.3d 574 (D.C. Cir. 2008). However, the reason for vacatur was wholly unrelated to the question of whether an allowance system could be a form of emission standard. In response to the
New Jersey
decision, the agency removed CAMR provisions from the Code of Federal Regulations. The agency chose to retain the language of 60.21(f) and 60.24(b)(1) generally recognizing allowance systems. This language is broader than CAMR and unrelated to the reasons for its vacatur. The EPA re-promulgated these provisions in February of 2012 (77 FR 9304, 9447; Feb. 16, 2012). Even if this were not the case, the agency would not concede that simply because “allowance systems” were not provided for in the framework regulations of subpart B, they could not be relied upon in specific emission guidelines, such as these for CO2.
The implementing regulations generally serve a gap-filling role where there are not more specific provisions laid out in the relevant emission guidelines. In order to resolve any question whether allowance systems are authorized under the final rule, we are including regulatory text in subpart UUUU to make this authorization explicit.
782.
“State measures” refer to measures that are adopted, implemented, and enforced as a matter of state law. Such measures are enforceable only per state law, and are not included in and codified as part of the federally enforceable state plan.
783.
New source CO2
emission complements are discussed in section VIII.J.2.b, which also provides EPA-derived new source CO2
emission complements for states.
784.
Mass-based trading-ready plans are addressed in section VIII.J.3. Multi-state plans, where a group of states are meeting a joint CO2
goal for affected EGUs, are addressed in section VIII.C.5.
785.
This plan approach would meet a state mass-based CO2
goal for affected EGUs, or a joint multi-state mass-based CO2
goal for affected EGUs. These plan approaches are discussed in sections VIII.J.2 and VIII.C.5, respectively.
786.
Submission of a state plan based on the EPA's finalized model rule for a mass-based emission trading program could be considered presumptively approvable. The EPA would evaluate the approvability of such submission through an independent notice and comment rulemaking.
791.
The weighted average CO2
emission rate that will be achieved by the fleet of affected EGUs in a
state that applies different rate-based emission standards to individual affected EGUs or groups of affected EGUs will depend upon the mix of electric generation from affected EGUs subject to different emission standards. For example, if a state applies higher emission standards for affected steam generating units and lower emission standards for affected NGCC units, the greater the projected amount of electric generation from steam generating units, the higher the projected weighted average emission rate that will be achieved for all affected EGUs.
792.
A demonstration of how a plan will achieve a state's rate-based or mass-based CO2
emission goal is one of the required plan components, as described in section VIII.D.2.
793.
For example, a state plan designed to meet a state mass-based CO2
goal for affected EGUs plus a new source complement could involve a mass-based emission budget trading program that, under state law, applies to both affected EGUs, as well as new fossil fuel-fired EGUs. The program requirements for affected EGUs would be federally enforceable, while the program requirements for other fossil fuel-fired EGUs would be state-enforceable. This approach is described further in section VIII.J.2.
795.
This includes the level of emission performance during the interim plan periods 2022-2024, 2025-2027 and 2028-2029, as well as the performance level that would be achieved during every subsequent 2-year final plan performance period (2030-2031, and subsequent 2-year periods).
796.
States may choose to establish an effective date for backstop emission standards that is sooner than 18 months.
797.
In the event a state does not implement the backstop as required if actual emission performance triggers the backstop, the EPA will take appropriate action. The EPA notes that as part of the proposed federal plan rulemaking, it is proposing a regulatory mechanism to call plans in the instances of substantial inadequacy to meet applicable requirements or failure to implement an approved plan.
798.
In this example, states could elect to implement different combinations of mass-based standards during the remaining interim step 2 and 3 plan performance periods, provided that cumulative CO2
emissions during the full interim plan performance period (2022-2029) do not exceed 270 million tons.
800.
The EPA notes that in addition to these approved approaches, other types of multi-state approaches may be acceptable in an approvable plan, provided the obligations of each state under the multi-state plan are clear and the submitted plan(s) meets applicable emission guideline requirements.
801.
The concept of a new source CO2
emission complement is addressed in section VIII.J.2.b. Table 14 provides individual state new source CO2
emission complements. For a multi-state plan, a joint new source CO2
emission complement would be the sum of the individual new source CO2
emission complements in Table 14 for the states participating in the multi-state plan.
803.
States may submit individual plans with such linkages, or if they choose, provide a joint submittal. Forms of joint submittals are described at section VIII.E.
804.
As a conceptual and legal matter, the relationship between states coordinating to meet a joint CO2
emission goal under this rule is similar to the relationship between states coordinating SIP submissions to attain the NAAQS in an interstate nonattainment area. In both cases, the states coordinate their actions in a way that, cumulatively, the measures applicable in each state will lead to achievement of a common interstate goal (with the EPA evaluating the sufficiency and success of the plans on a holistic, interstate basis). Despite the shared goal, in both cases, the mere fact of coordination has no effect on each state's sovereign legal authority. For example, the legally applicable rules in a given state are adopted by that state individually, not by a joint entity or other interstate mechanism. Similarly, the fact that the states coordinate their rules does not grant them the authority to directly enforce each other's rules, or to take direct legal action against a state that is failing to implement its own rules. Although some states may jointly submit their coordinated rules to the EPA as a matter of administrative convenience, the state rules within such a plan are nothing more than reciprocal laws of the sort that states routinely enact in voluntary coordination with each other.
805.
This is necessary because if the joint goal is not achieved during a plan performance period, different remedies would apply under an emission standards plan and a state measures plan. Under an emission standards plan, corrective measures would be triggered. Under a state measures plan, the federally enforceable backstop emission standards would be triggered. See section VIII.F.3.
806.
Where a multi-state plan is designed to meet a joint mass-based CO2
goal plus a joint new source CO2
emission complement, the joint new source CO2
emission complement would be the sum of the individual new source CO2
emission complements in section VIII.J.2.b, Table 14, for the states participating in the multi-state plan.
807.
A potential example of this approach is the method by which the states participating in RGGI have implemented individual CO2
Budget Trading Program regulations in a linked manner using a shared emission and allowance tracking system. Each state's regulations implementing RGGI stand alone on a legal basis, but provide for the use of CO2
allowances issued in other participating states for compliance under the state regulations. These states are not listed by name in state regulations, which instead refer to participating states that have established a corresponding CO2
Budget Trading Program regulation. More information is available at
https://www.rggi.org.
808.
Under this approach, a state measure could include, if a state chose, a multi-state emission trading program that is enforceable at the state level.
809.
ERCs may only be transferred among states implementing rate-based emission limits. Likewise, emission allowances may only be transferred among states implementing mass-based emission limits.
811.
The EPA received a number of comments from states and stakeholders about the value of the EPA's support in developing and/or administering tracking systems to support state administration of rate-based emission trading programs. The EPA is exploring options for providing such support and is conducting an initial scoping assessment of tracking system support needs and functionality.
812.
Note that for mass-based plans, the approvability requirements for a state plan would differ, depending on the structure of the emission budget trading program included in the state plan. For example, approvability requirements and basic accounting with regard to whether a plan achieves a state's mass CO2
goal would differ for emission budget trading programs that cover only affected EGUs subject to CAA section 111(d) vs. programs that apply to a broader set of emission sources. These considerations are addressed in section VIII.J.
813.
E.g., “Something that is set up and established by authority as a rule for the measure of quantity, weight, value, or quality.” Webster's Third New International Dictionary 2223 (1967); see also The American College Dictionary (C.L. Barnhart, ed. 1970) (“an authoritative model or measure”).
817.
The existing guidance documents referenced were: (1) September 23, 1987 memorandum and accompanying implementing guidance, “Review of State Implementation Plans and Revisions for Enforceability and Legal Sufficiency,” (2) August 5, 2004 “Guidance on SIP Credits for Emission Reductions from Electric-Sector Energy Efficiency and Renewable Energy Measures,” and (3) July 2012 “Roadmap for Incorporating Energy Efficiency/Renewable Energy Policies and Programs into State and Tribal Implementation Plans, Appendix F.”
818.
If applicable, this plan component must also identify if the plan is being submitted as a “ready-for-interstate-trading” plan, as discussed in section VIII.J.3 and VIII.K.4.
819.
State plans may meet the CO2
emission performance rates in the emission guidelines during the interim plan performance step periods, or assign different interim step CO2
emission performance rates, provided the CO2
emission performance rates in the emission guidelines are achieved during the full interim period. Likewise, a state plan may meet the interim step state CO2
emission goals in the emission guidelines or establish different interim step CO2
emission levels, provided the state interim CO2
goal is achieved during the full interim period.
820.
For simplicity, the EPA refers here to state measures under a state measures plan as being included “in the state plan” although such state-enforceable measures are not codified as part of the federally enforceable approved state plan. However, the approval of a state measures plan is dependent on a demonstration in the state plan submittal that those state-enforceable measures meet the requirements in the emission guidelines and that those state measures, alone or in combination with federally enforceable emission standards for affected EGUs, will meet the mass-based CO2
goal.
821.
A state's EPA-specified mass CO2
emission budget is the state's mass-based CO2
goal for affected EGUs plus the EPA-specified new source CO2
emission complement. See section VIII.J.2.b.
822.
While we specifically encourage state environmental agencies and utility regulators to consult here, we note that, under CAA programs, state agencies have a history of consultation with one another as appropriate.
823.
USGCRP 2014: Melillo, Jerry M., Terese (T.C.) Richmond, and Gary W. Yohe, Eds., 2014:
Climate Change Impacts in the United States: The Third National Climate Assessment.
U.S. Global Change Research Program, 841 pp.
824.
In this action, the EPA is providing interim state goals in the form of a CO2
emission rate (emission rate-based goal) and in the form of tonnage CO2
emissions (mass-based goal).
825.
A CO2
continuous emissions monitoring system (CEMS) is the most technically reliable method of emission measurement for EGUs. A CEMS provides a measurement method that is performance based rather than equipment specific and is verified based on NIST traceable standards. A CEMS provides a continuous measurement stream that can account for variability in the fuels and the combustion process. Reference methods have been developed to ensure that all CEMS meet the same performance criteria, which helps to ensure a level playing field and consistent, accurate data.
826.
For example, an ERC that is issued by a state under its rate-based emission standards may be used only once by an affected EGU to adjust its reported CO2
emission rate when demonstrating compliance with the emission standards. However, an ERC issued in one state could be used by an affected EGU to demonstrate compliance with its emission standard in another state, where states are collaborating in the implementation of their individual emission trading programs through interstate transfer of ERCs, or participating in a multi-state plan with a rate-based emission trading program. These coordinated multi-state approaches are addressed in sections VIII.C.5, VIII.J.3, and VIII.K.4.
827.
The EPA guidance on enforceability includes: (1) September 23, 1987, memorandum and accompanying implementing guidance, “Review of State Implementation Plans and Revisions for Enforceability and Legal Sufficiency,” (2) August 5, 2004, “Guidance on SIP Credits for Emission Reductions from Electric-Sector Energy Efficiency and Renewable Energy Measures,” and (3) July 2012 “Roadmap for Incorporating Energy Efficiency/Renewable Energy Policies and Programs into State and Tribal Implementation Plans, Appendix F.”
830.
In this action, the EPA is providing interim state goals in the form of a CO2
emission rate (emission rate-based goal) and in the form of tonnage CO2
emissions (mass-based goal).
831.
As explained in section VIII.C.3.b, state plans subject to the backstop requirement must require the backstop to take effect if actual CO2
emission performance by affected EGUs fails to meet the level of emission performance specified in the plan over the 8-year interim performance period (2022-2029), or for any 2-year final goal performance period. The plan also must require the backstop to take effect if actual emission performance is deficient by 10 percent or more relative to the performance levels that the state has chosen to specify in its plan for the interim step 1 period (2022-2024) or the interim step 2 period (2025-2027).
833.
The EPA's prior guidance on enforceability serves as the foundation for the types of measures that the EPA has found can be, as a practical matter, enforced. The EPA's guidance on enforceability includes: (1) September 23, 1987, memorandum and accompanying implementing guidance, “Review of State Implementation Plans and Revisions for Enforceability and Legal Sufficiency,” (2) August 5, 2004, “Guidance on SIP Credits for Emission Reductions from Electric-Sector Energy Efficiency and Renewable Energy Measures,” and (3) July 2012 “Roadmap for Incorporating Energy Efficiency/Renewable Energy Policies and Programs into State and Tribal Implementation Plans,” Appendix F.
834.
On the other hand, there are specific requirements in 110(a)(2) that are fundamental for SIPs, but would not make sense in the 111(d) context. For example, the specific requirement for an ambient air quality monitoring network in 110(a)(2)(B) is irrelevant in the 111(d) context.
835.
In particular, a state may include in its 111(d) state plan an emission standard that is reflective of the CO2
performance resulting from operational standards the state imposes on an affected EGU.
840.
As stated previously, in the case of a state electing to participate in the CEIP, this 2016 submittal must include a non-binding statement of intent to participate in the program.
841.
Such stakeholders may include labor unions and workers that have an interest in the state plan, and communities whose economies are dependent on coal.
842.
For example, 13 states were required to submit SIP revisions sufficient to regulate GHGs under the Prevention of Significant Deterioration (PSD) permitting requirements of the CAA within either 3 weeks or 12 months in response to the EPA's SIP call.
See “
Action To Ensure Authority To Issue Permits Under the Prevention of Significant Deterioration Program to Sources of Greenhouse Gas Emissions: Finding of Substantial Inadequacy and SIP Call”, 75 FR 77698, (December 13, 2010).
846.
The EPA proposed 12 months after the date required for submission of a plan or plan revision to approve or disapprove such plan or revision or each portion thereof.
848.
For EGUs that produce both electric energy output and other useful energy output, there would also be a credit for non-electric output, expressed in MWh.
849.
Emission budget trading programs in such plans establish CO2
emission budgets equal to or less than the state mass CO2
goal, as specified for the interim plan performance period (including specified levels in interim steps 1 through 3) and the final 2-year plan performance periods.
850.
To be specific, corrective measures requirements apply to all emission standard plan designs that do not mathematically assure that the plan performance level will be achieved when all affected EGUs are in compliance with their emission standards, regardless of electricity production and electricity mix. Corrective measures requirements apply, for example, to emission standards plans that include standards on affected EGUs that differ from the emission performance rates in the guidelines. Backstop requirements apply to state measures plans.
851.
The EPA notes that as part of the proposed federal plan rulemaking, it is proposing a regulatory mechanism to call plans in the instances of substantial inadequacy to meet applicable requirements or failure to implement an approved plan.
852.
As explained in section VIII.C.3.b., state measures plans must require the backstop to take effect if actual CO2
emission performance fails to meet the level of emission performance specified in the plan over the 8-year interim performance period (2022-2029), or for any 2-year final goal performance period. The plan also must require the backstop to take effect if actual emission performance is deficient by 10 percent or more relative to the performance levels that the state has chosen to specify in its plan for the interim step 1 period (2022-2024) or the interim step 2 period (2025-2027).
853.
The EPA notes that as part of the proposed federal plan rulemaking, it is proposing a regulatory mechanism to call plans in the instances of substantial inadequacy to meet applicable requirements or failure to implement an approved plan.
856.
See “Phosphate Fertilizer Plants; Final Guideline Document Availability,” 42 FR 12022 (Mar. 1, 1977); “Standards of Performance for New Stationary Sources; Emission Guideline for Sulfuric Acid Mist,” 42 FR 55796 (Oct. 18, 1977); “Kraft Pulp Mills, Notice of Availability of Final Guideline Document,” 44 FR 29828 (May 22, 1979); “Primary Aluminum Plants; Availability of Final Guideline Document,” 45 FR 26294 (Apr. 17, 1980); “Standards of Performance for New Stationary Sources and Guidelines for Control of Existing Sources: Municipal Solid Waste Landfills, Final Rule,” 61 FR 9905 (Mar. 12, 1996).
857.
Trading of course has other benefits beyond helping to address remaining useful life concerns. For example, trading can lower costs of achieving a given level of emission reduction and can provide economic incentives for innovation and development of cleaner technologies.
859.
The EPA expects that states that choose to adopt the national CO2
emission performance rates for all of their EGUs would permit ERC trading, rather than requiring each facility to meet the applicable rate without trading. In effect, the presence of trading means that the EGU performance rates can be achieved by each EGU involved in trading.
860.
Heat rate improvement methods and related capital costs are discussed in the GHG Mitigation Measures TSD; SO2
scrubber capital costs are from the documentation for the EPA's IPM Base Case v5.13, Chapter 5, Table 5-3, available at
https://www.epa.gov/airmarkets/documents/ipm/Chapter_5.pdf.
861.
Casazza, J. and Delea, F.,
Understanding Electric Power Systems: An Overview of the Technology, the Marketplace, and Government Regulations,
IEEE Press, at 160 (2010).
864.
Centralized Capacity Markets in Regional Transmission Organizations and Independent System Operators,
149 FERC ¶ 61,145 (2014). FERC generally defines fuel assurance as “generator access to sufficient fuel supplies and the firmness of generator fuel arrangements”.
Id.
P 5.
865.
For example, ISO-NE and PJM each filed “pay-for-performance” proposals to address fuel assurance in their regions. FERC recently acted on ISO-NE market rule changes providing increased market incentives in capacity, energy, and ancillary services markets for generators to be available to meet their obligations during reserve shortages.
ISO New England Inc.,
147 FERC ¶ 61,172 (2014). Additionally, FERC conditionally approved a PJM “pay-for-performance” proposal that creates a new capacity product to provide greater assurance of delivery of energy and reserves during emergency conditions, establishing credits for superior performance and charges for poor performance.
PJM Interconnection, L.L.C.,
151 FERC ¶ 61,208 (2015).
866.
For example, Andrew Ott, then Executive Vice President-Markets and current President of PJM, an RTO with a substantial amount of coal-fired capacity and generation, discussed the success of PJM's market design in assuring that PJM met and exceeded target reserve margins while MATS was being implemented.
See
Statement of Andrew Ott, PJM Executive Vice President-Markets, FERC Technical Conference on Centralized Capacity Markets in Regional Transmission Organizations and Independent System Operators, AD13-7-000, at 3, 7 (Sept. 25, 2013),
available at https://www.ferc.gov/EventCalendar/EventDetails.aspx?ID=6944&CalType=&CalendarID=116&Date=09/25/2013&View=Listview. At the FERC national Clean Power Plan Technical Conference, Michael J. Kormos, PJM Executive Vice President-Operations, said that PJM's markets have proven, “resilient enough to respond to different policy initiatives . . . Whether it is the Sulfur Dioxide Trading Program of the 1990s, the MATS rule or individual state RPS initiatives, the markets have been able to send the appropriate price signals that produce competitive outcomes.”
See
Michael J. Kormos, PJM Executive Vice President, Statement at FERC Technical Conference on EPA's Clean Power Plan, AD15-4-000, at 3 (Feb. 19, 2015),
available athttps://www.ferc.gov/CalendarFiles/20150213081650-Kormos,%20PJM.pdf.
867.
On May 15, 2015, the five FERC Commissioners sent a letter to Acting Assistant Administrator Janet McCabe regarding the EPA's Clean Power Plan proposal.
See
FERC letter,
available athttps://ferc.gov/media/headlines/2015/ferc-letter-epa.pdf.
868.
While the EPA is requiring that the states demonstrate that they have considered reliability in developing their plans, state plan submissions will not be evaluated substantively regarding reliability impacts.
869.
The EPA will still undertake notice and comment rulemaking per the requirements of the Administrative Procedures Act when acting on such state plan revision, but intends to prioritize review of plan revisions needed to address reliability concerns.
870.
The EPA reserves the right to review such notification, and in the event that the EPA finds such notification is improper, the EPA may disallow the short-term modification and affected EGUs must continue to operate under the original approved state plan emission standards.
871.
M.J. Bradley & Associates,
Guiding Principles for Reliability Assessments Under EPA's Clean Power Plan
(June 3, 2015),
available athttps://www.mjbradley.com/node/295.
891.
Among other things, a federal plan will implement standards of performance subject to specific statutory requirements.
See 42 U.S.C. 7411(a)(1). The APA and CAA would prohibit the imposition of any federal plan that is “arbitrary, capricious, an abuse of discretion, or otherwise not in accordance with law.” 5 U.S.C. 706(2)(a). Particularly given these independent constraints on the EPA's authority with respect to any potential federal plan, the prospect of any such plan would not commandeer states or coerce them into submitting their own state plans.
892.
See, e.g., Hodel
v.
Va. Surface Mining & Reclamation Ass'n, Inc.,
452 U.S. 264, 283-93 (1981);
Texas
v.
EPA,
726 F.3d 180, 196-97 (D.C. Cir. 2013) (noting that “Supreme Court precedent repeatedly affirm[s] the constitutionality of federal statutes that allow States to administer federal programs but provide for direct federal administration if a State chooses not to administer it”).
893.
Other commenters point to CAA section 179 as a possible direct source of this sanctions authority. However, the mandatory sanctions outlined in section 179 clearly apply only in the contexts of nonattainment SIPs and responses to SIP Calls made under CAA section 110(k)(5).
See 42 U.S.C. 7509(a).
896.
“Integrated RE” refers to RE that is directly incorporated into the mechanical systems and operation of the EGU. An example is a solar thermal energy system used to preheat boiler feedwater. Such approaches reduce the amount of fossil fuel heat input per unit of useful energy output.
897.
The emission reduction potential from CHP stems from the unit using less fuel for producing useful electrical and thermal outputs than would be required to run separate electrical and thermal units. The emission reduction would depend on the type of affected EGU and available steam hosts in the vicinity of the affected EGU. A conventional combustion turbine generator, for example, converted into a CHP unit could effectively result in a reduction of 25 percent or more in the reported CO2
emission rate. The potential retrofitte EGU CHP market consists of converted simple cycle turbines, older steam plants in urban areas, and combined cycle units near beneficial thermal loads.
898.
Addition of retrofit CCS technology should not trigger CAA section 111(b) applicability for modified or reconstructed sources. Pollution control projects do not trigger NSPS modifications and addition of CCS technology does not count toward the capital costs of reconstruction for NSPS.
899.
Standards of Performance for Greenhouse Gas Emissions from New, Modified, and Reconstructed Stationary Sources: Electric Utility Generating Units.
900.
The final CAA section 111(b) rule finalizes amendments to subpart PP reporting requirements, specifically requiring that the following pieces of information be reported: (1) The electronic GHG Reporting Tool identification (e-GGRT ID) of the EGU facility from which CO2
was captured, and (2) the e-GGRT ID(s) for, and mass of CO2
transferred to, each GS site reporting under subpart RR. As noted, the final 111(b) rule also requires that any affected EGU unit that captures CO2
to meet the applicable emission limit must transfer the captured CO2
to a facility that reports under 40 CFR part 98 subpart RR.
901.
Under final requirements in the CAA 111(b) NSPS, any well receiving CO2
captured from an affected EGU, be it a Class VI or Class II well, must report under subpart RR. A UIC Class II well's regulatory status does not change because it receives such CO2, nor does it change by virtue of reporting under subpart RR.
907.
Specifically, the SAB found that “There are circumstances in which biomass is grown, harvested and combusted in a carbon neutral fashion but carbon neutrality is not an appropriate a priori assumption; it is a conclusion that should be reached only after considering a particular feedstock's production and consumption cycle. There is considerable heterogeneity in feedstock types, sources and production methods and thus net biogenic carbon emissions will vary considerably.”
www.epa.gov/climatechange/ghgemissions/biogenic-emissions.html.
908.
Types of waste-derived biogenic feedstocks may include: Landfill gas generated through the decomposition of MSW in a landfill; biogas generated from the decomposition of livestock waste, biogenic MSW, and/or other food waste in an anaerobic digester; biogas generated through the treatment of waste water, due to the anaerobic decomposition of biological materials; livestock waste; and the biogenic fraction of MSW at waste-to-energy facilities.
913.
For such an EGU to be considered non-affected, the EGU must be subject to a federally enforceable or practically enforceable condition, expressed in (for example) a construction permit or otherwise, that limits the amount of fossil fuel that may be used to 10 percent or less.
915.
In Table 14, we have provided a mass budget for each state that includes the state mass-based CO2
goal and a projection for a new source CO2
emission complement.
917.
As specified for the interim plan performance period (including specified levels in interim steps 1 through 3) and the final two-year plan performance periods.
918.
Section VIII.J.2.a describes how state plan submittals must include as requirements, or describe as part of supporting documentation, relevant aspects of such emission budget trading programs.
919.
This approach for establishing federally enforceable emission standards based on requirements for affected EGUs subject to a broader emission budget trading program that also covers non-affected emission sources is addressed in section VIII.J.2.d. above.
920.
For example, both the California and RGGI programs allow for the use of allowances awarded to GHG offset projects to be used to meet a specified portion of an affected emission source's compliance obligation. The RGGI program contains a cost containment allowance reserve that makes available additional allowances up to a certain amount, at specified allowance price triggers.
921.
A demonstration of how a plan will achieve a state's rate-based or mass-based CO2
goal (or mass-based CO2
goal plus new source CO2
emission complement) is one of the required plan components, as described in section VIII.D.2.
922.
Achievement of the state mass-based CO2
goal would be determined based solely on stack CO2
emissions from affected EGUs. Where a state program includes the ability of an affected emission
source to use GHG offsets to meet a portion of its allowance compliance obligation, no “credit” is applied to reported CO2
emissions by the affected EGU. The use of offset allowances or credits in such programs merely allows an affected EGU to emit a ton of CO2
in the amount of submitted offset allowances or credits. In all cases, there is no adjustment applied to reported stack emissions of CO2
from an affected EGU when determining compliance with its emission limit.
923.
Allowance allocation refers to the methods used to distribute CO2
allowances to the owners or operators of affected EGUs and/or other market participants.
924.
The emission standards in each individual state plan must include requirements that address the issuance of CO2
allowances and tracking of CO2
allowances from issuance through use for compliance. The description here addresses how those requirements will be implemented through the use of a joint tracking system, interoperable tracking systems, or an EPA-administered tracking system.
925.
The EPA would designate tracking systems that it has determined adequately address the integrity elements necessary for the issuance and tracking of emission allowances. Under this approach, a state could include in its plan such a designated tracking system, which has already been reviewed by the EPA.
926.
Depending on the specific regulatory provisions in the emission standards in their approved state plans, participating states may also need to revise their implementing regulations (and by extension their state plans) to accept CO2
emission allowances issued by new partner states as usable for compliance with their mass-based emission standards.
927.
Compliance by an affected EGU with the emission standard is demonstrated based on surrender to the state of a number of CO2
allowances equal to its reported CO2
emissions.
928.
This approach is warranted because under such linked programs, CO2
emissions from affected EGUs in one state that exceed a state's mass CO2
goal (or mass-based CO2
goal plus new source CO2
emission complement) would be accompanied by CO2
emissions from affected EGUs in another linked state that are below that state's mass CO2
goal (or mass-based CO2
goal plus new source CO2
emission complement).
929.
This may apply under both an emission standards plan and a state measures plan. Section VIII.J.2.a describes how state plan submissions must include as requirements, or describe as part of supporting documentation, relevant aspects of such emission budget trading programs.
930.
Under a program that applies to affected EGUs and other emission sources, compliance by affected EGUs with the emission standard—a requirement to surrender emission allowances equal to reported emissions—will not assure that a state's CO2
mass goal (or mass-based CO2
goal plus new source CO2
emission complement) is achieved. As a result, a further demonstration is required in the plan that compliance by affected EGUs with the program will result in CO2
emissions from affected EGUs that are at or below a state's CO2
mass goal (or mass-based CO2
goal plus new source CO2
emission complement).
931.
Section VIII.J.2.a describes how state plan submittals must include as requirements, or describe as part of supporting documentation, relevant aspects of such emission budget trading programs.
932.
A net transfer metric is applied as of the end of the plan performance period. This net accounting as of a specified date is necessary because multiple individual allowance transfers may occur among accounts during a plan performance period, representing normal trading activity. In addition, net transfers are based on compliance account holdings, because these represent the CO2
allowances directly available at that point in time for use by an affected EGU for complying with its emission limit. Emission budget trading programs typically allow non-affected entities to hold allowances in general accounts. These parties are free to hold and trade CO2
allowances, providing market liquidity. General account holdings are not assessed as part of a periodic state net transfer accounting, as these allowances may subsequently be transferred to other accounts in multiple states and do not represent allowances currently held by an affected EGU that can be used for complying with its emission limit.
933.
Compliance account holdings, as used here, refer to the number of CO2
allowances surrendered for compliance during a plan performance period, as well as any remaining CO2
allowances held in a compliance account as of the end of a plan performance period.
934.
ERCs may be issued for the measures presented in this section, as well as to affected EGUs that emit at a CO2
emission rate below their assigned emission rate limit. ERC issuance and trading is discussed in detail in section VIII.K.2. That section addresses the accounting method for ERC issuance to affected EGUs that perform below their assigned CO2
emission rate.
936.
Requirements for the issuance of ERCs and a further discussion of how ERCs are used in compliance with rate-based emission limits are addressed in section VIII.K.2.
939.
For example, eligibility requirements include installation dates for eligible RE measures that may be used in a state plan. These dates generally align with the dates used for broadly defining incremental RE resources that were considered in establishing the BSER.
941.
As used here, a measure is “tied to a state plan” if it is issued an ERC under approved procedures in a rate-based emission standards plan or represents quantified and verified MWh energy generation or energy savings achieved by an approved state measure in a state measures plan.
942.
For example, under a rate-based emission standard with credit trading, ERCs may be issued for qualifying actions that occur both inside and outside the state, provided the measures meet requirements of EPA-approved state regulations and the provider applies to the state for the issuance of ERCs. Similarly, under a state measures plan, a state might include state requirements such as an RPS, where compliance with the RPS can be met through out-of-state RE generation.
943.
Where such measures substitute for generation from affected EGUs subject to a mass CO2
emission limit, such measures reduce the cost of meeting those mass emission limits, but do not result in incremental CO2
emission reductions.
944.
As used here, incremental emission reductions refers to emission reductions that are above and beyond what would be achieved solely through compliance with the emission standards in the mass-based state.
945.
This does not need to necessarily be the state where the MWh of energy generation from the measure is used to adjust the CO2
emission rate of an affected EGU.
947.
This does not need to necessarily be the state where the MWh of energy generation from the measure is used to adjust the CO2
emission rate of an affected EGU.
948.
All state plans must demonstrate that measures included in the plan are quantifiable and verifiable. See section VIII.K.2 for discussion of requirements for the issuance of ERCs, and section VIII.K.3 for discussion of EM&V requirements for use of RE relied on in a state plan.
949.
For example, the overall generation from the uprated hydroelectric power plant may be higher or lower than generation levels that occurred at the plant prior to the capacity uprate.
957.
An example is a utility direct load control program, such as those where customer air conditioning units are cycled during periods of peak electricity demand. Actions that shift electricity demand from one time of day to another, without reducing net electricity use, are not eligible, as these measures do not avoid electricity use from the grid. Use of emitting generators as a DSM measure is also not eligible.
958.
Energy storage depends on a generation source, either from a utility-scale EGU (
e.g.,
a fossil EGU, a wind turbine, etc.) or a distributed generation source at an electricity end-user (
e.g.,
a PV system installed at a building).
959.
This approach focuses on counting the qualifying electric generation, which may be an input to an energy storage unit. Counting both the generation input to energy storage and the output from the energy storage unit would be a form of double counting. The electric generation that is stored may be counted; the subsequent output from the storage unit may not.
960.
For example, battery storage at a building with solar PV can enable the PV system to meet the building's entire electrical load, by storing energy during times of peak PV system output for later use when the sun is not shining.
961.
T&D system losses (or “line losses”) are typically defined as the difference between electricity generation to the grid and electricity sales. These losses are the fraction of electricity lost to resistance along the T&D lines, which varies depending on the specific conductors, the current, and the length of the lines. The Energy Information Administration (EIA) estimates that national electricity T&D losses average about 6 percent of the electricity that is transmitted and distributed in the U.S. each year.
962.
Volt/VAR optimization (VVO) refers to coordinated efforts by utilities to manage and improve the delivery of power in order to increase the efficiency of electricity distribution. VVO is accomplished primarily through the implementation of smart grid technologies that improve the real-time response to the demand for power. Technologies for VVO include load tap changers and voltage regulators, which can help manage voltage levels, as well as capacitor banks that achieve reductions in transmission line loss. VVO efforts are often closely related to CVR, which are actions taken to reduce initial delivered voltage levels in feeder transmission lines while remaining within the 114 volt to 126 volt range (for normal 120-volt service) required at the customer meter, per the ANSI C84.1 standards.
963.
All state plans must demonstrate that measures included in the plan are quantifiable and verifiable. See section VIII.K.2 for discussion of requirements for the issuance of ERCs, and section VIII.K.3 for discussion of EM&V requirements for use of demand-side EE relied on in a state plan.
964.
EE programs may also be implemented by other entities. Eligible EE measures that are deployed through EE programs are not limited to those EE measures deployed through EE programs administered by the types of entities listed here.
965.
The accounting considerations described in this section are for a “topping cycle” CHP unit. A topping cycle CHP unit refers to a configuration where fuel is first used to generate electricity and then heat is recovered from the electric generation process to provide additional useful thermal and/or mechanical energy. A CHP unit can also be configured as a “bottoming cycle” unit. In a bottoming cycle CHP unit, fuel is first used to provide thermal energy for an industrial process and the waste heat from that process is then used to generate electricity. Some waste heat power (WHP) units are also bottoming cycle units and the accounting treatment for bottoming cycle CHP units is provided with the WHP description below.
967.
This only applies where no additional fossil fuel is used to supplement the use of waste heat in a WHP facility. Where fossil fuel is used to supplement waste heat in a WHP application, MWh of electrical generation that can be used to adjust the CO2
emission rate of an affected EGU must be prorated based on the proportion of fossil fuel heat input to total heat input that is used by the WHP unit to generate electricity.
968.
This limitation prevents oversizing the thermal output of a WHP unit to exceed the useful industrial or other thermal load it is meeting, prior to generation of electricity.
969.
We note, however, that the final emission guidelines allow state measures like emission
budget trading programs to include out-of-sector GHG offsets. For example, both the California and RGGI programs allow for the use of allowances awarded to GHG offset projects to be used to meet a specified portion of an affected emission source's compliance obligation. The RGGI program contains a cost containment allowance reserve that makes available additional allowances up to a certain amount, at specified allowance price triggers.
972.
As described below, these requirements would likely be provided in a state plan in the form of state regulations, but could potentially be provided in another form.
973.
By “integrity of a rate-based emission trading program”, the EPA is referring to elements in the design and administration of a program necessary to assure that emission standards implemented using a rate-based emission trading approach are quantifiable, verifiable, enforceable, non-duplicative, and permanent.
975.
As used in this section, the term “EE program” refers to an EE deployment program. An EE program involves deployment of multiple EE measures or EE projects, such as utility- or state-administered EE incentive programs that accelerate the deployment of EE technologies and practices. As used in this section, the term “EE/RE project” refers to a discrete EE project (
e.g.,
an EE upgrade to a commercial building or set of buildings) or a RE generator (
e.g.,
a single wind turbine or group of turbines).
984.
Qualifying measures that can be used to adjust the CO2
emission rate of an affected EGU are discussed at section VIII.K.1, and include incremental NGCC, RE, demand-side EE, and other measures, such as DSM, CHP and incremental nuclear generation.
985.
For example, for an EE/RE program or project, as described in this section for illustrative purposes. The requirements described in this section for EE/RE programs and projects also apply for all other eligible qualifying measures discussed in section VIII.K.1.
986.
As used here, an agent is a party acting on behalf of the state, based on authority vested in it by the state, pursuant to the legal authority of the state. A state could designate an agent to provide certain limited administrative services, or could choose to vest an agent with greater authority. Where an agent issues an ERC on behalf of the state, such issuance would have the same legal effect as issuance of an ERC by the state.
987.
The entity implementing the EE/RE program or project (referred to in the preamble as a “provider”) would submit the application. This is the identified entity to which ERCs would ultimately be issued, to a tracking system account held by the entity. Such entities could include a wide variety of parties that implement EE/RE programs and projects, including owners or operators of affected EGUs, electric distribution companies, independent power producers, energy service companies, administrators of state EE programs, and administrators of industrial EE programs, among others.
988.
The verification process includes confirmation that quantified MWh are non-duplicative and permanent (
i.e.,
are not being used in any other state plan to demonstrate compliance with an emission standard or achievement of an emission performance rate or state CO2
emission goal).
990.
This includes ensuring that multiple parties do not submit an eligibility application for the same EE program or project, or for the same RE generator.
992.
State rate-based emission trading program regulations must specify the frequency for submission of M&V reports for approved qualified measures that have been deemed eligible to generate ERCs. These reporting periods should be annual, but a state could consider shorter or longer periods, depending on the type of ERC resource.
993.
EE/RE programs and projects, and other eligible measures, with an approved eligibility application would be designated in a tracking system as qualified programs or projects. Qualified programs and projects may be issued ERCs, based on approved M&V reports.
995.
“Compliance true-up” refers to ERC submission by an owner or operator of an affected EGU to adjust a reported CO2
emission rate, and determination of whether the adjusted rate is equal to or lower than the applicable rate-based emission standard.
996.
States also have the option to participate in the CEIP, under which they can issue ERCs for MWh generation or savings that occur in 2020-2021 for measures implemented following submission of a final state plan, and receive matching ERCs from a federal pool. See section VIII.B.2 for a detailed discussion. The ERCs issued under this program can also be banked during and between the interim and final compliance period.
998.
The absence of banking creates an incentive to defer both relatively low-cost and higher-cost CO2
emission reduction actions until a later period when emission rate limits become more stringent, rather than incentives to undertake the low-cost activities sooner in order to further delay the high cost actions. Under a rate-based emission trading program, banking will encourage ERC providers to generate larger numbers of ERCs in early years of a plan performance period, in anticipation of rising ERC prices over time, when demand for ERCs is expected to increase as rate-based CO2
emission standards become more stringent.
999.
EM&V is defined to mean the set of procedures, methods, and analytic approaches used to quantify the MWh from demand-side EE and RE and other measures, and thereby ensure that the resulting savings and generation are quantifiable and verifiable.
1000.
The EPA recognizes that EM&V best practices are routinely evolving to reflect changes in markets, technologies and data availability. Therefore the agency is providing draft EM&V guidance with the proposed model rule, which can be updated over time to address any such changes to best practices. The guidance can also identify and describe alternative quantification approaches that may be approved for use, provided that such approaches meet the requirements of the finalized EM&V requirements.
1001.
In the context of demand-side EE, “measure” refers to an installed piece of equipment or system at an end-use energy consumer facility, a strategy intended to affect consumer energy use behaviors, or a modification of equipment, systems or operations that reduces the amount of electricity that would have delivered an equivalent or improved level of end-use service in the absence of EE.
1003.
The emission standards in each individual state plan must include regulatory provisions that address the issuance of ERCs and tracking of ERCs from issuance through use for compliance, as described in section VIII.K.2. The description here addresses how those regulatory provisions will be implemented through the use of a joint tracking system, interoperable tracking systems, or an EPA-administered tracking system.
1004.
States also have the option of implementing a multi-state plan with a single rate-based emission standard that applies to all affected EGUs in the participating states. This approach would also allow for interstate transfers of ERCs. Under this approach, a rate-based multi-state plan would include emission standards for affected EGUs based on a weighted average rate-based emission goal, derived by calculating a weighted average CO2
emission rate based on the individual rate-based goals for each of the participating states and 2012 generation from affected EGUs.
1005.
This could be done by reference to data in the tracking system used to implement a state's rate-based emission trading program that identifies the origin of each ERC (
e.g.,
by serial identifier).
1006.
The EPA would designate tracking systems that it has determined adequately address the integrity elements necessary for the issuance and tracking of ERCs, as described in section VIII.K.2. Under this approach, a state could include in its plan such a designated tracking system, which has already been reviewed by the EPA.
1007.
The EPA notes that it is proposing a model rule for a rate-based emission trading program that could be used by states interested in implementing a ready-for-interstate-trading plan approach. A state plan that included the finalized rate-based model rule could be presumptively approvable as meeting the requirements of CAA section 111(d) and the emission guidelines. If a state plan also met the requirements described in this section for ready-for-interstate-trading plans, it could be approved as ready-for-interstate trading.
1008.
This refers to eligibility applications and M&V reports, which are required submittals for non-affected EGU entities seeking the issuance of ERCs. Where affected EGUs are issued ERCs for emission performance below a specified CO2
emission rate, these ERCs are issued by the individual state in which they are subject to a rate-based emission standard. Requirements for ERC issuance are discussed in section VIII.K.2.
1009.
The EPA also notes that individual state plans may utilize RE and demand-side EE (and other eligible measures), that occur in other states, as described in section VIII.L addressing interstate effects. Under an individual state plan, ERCs could be issued for RE and demand-side EE measures that occur in other states, provided the EE/RE provider submits the measures to the state and the measures meet requirements in the state plan's rate-based emission trading program requirements. The multi-state approaches described above provide additional flexibility for states to informally and formally coordinate their implementation of rate-based plans across states while retaining individual rate-based state goals.
1010.
This section does not discuss emission leakage and how it is addressed by this final rule. See section VII.D for a discussion of emission leakage and its impact on state goal equivalence. See section VIII.J for a discussion of requirements for mass-based plans to address leakage.
1011.
This does not need to necessarily be the state where the MWh of energy generation from the RE measure is used to adjust the CO2
emission rate of an affected EGU.
1012.
In this preamble, the EPA discusses environmental justice in two sections. Section XI.J specifically addresses how the agency has met the directives under Executive Order 12898. The EPA defines environmental justice as the fair treatment and meaningful involvement of all people regardless of race, color, national origin or income with respect to the development, implementation, and enforcement of environmental laws, regulations, and policies. This section of the preamble addresses actions that the agency is taking related to environmental justice and other issues (
e.g.,
increased electricity costs) that may affect communities covered by Executive Order 12898 as well as other communities.
1029.
“Cost and Performance Baseline for Fossil Energy Plants Volume 1: Bituminous Coal and Natural Gas to Electricity” Rev 2a, September 2013 Revision 2, November 2010 DOE/NETL-2010/1397.
1032.
Certain stationary sources that emit or have the potential to emit a pollutant at a level that is equal to or greater than specified thresholds are subject to major source requirements.
See, e.g.,
CAA sections 165(a)(1), 169(1), 501(2), 502(a). A synthetic minor limitation is a legally and practicably enforceable restriction that has the effect of limiting emissions below the relevant level and that a source voluntarily obtains to avoid major stationary source requirements, such as the PSD or Title V permitting programs.
See, e.g.,40 CFR 52.21(b)(4), 51.166(b)(4), 70.2 (definition of “potential to emit”).
1033.
We discuss other rulemakings solely for background purposes. The effort to coordinate rulemakings is not a defense to a violation of the CAA. Sources cannot defer compliance with existing requirements because of other upcoming regulations.
1034.
CWA section 316(b) provides that standards applicable to point sources under sections 301 and 306 of the Act must require that the location, design, construction and capacity of cooling water intake structures reflect the best technology available for minimizing adverse environmental impacts.
1036.
For example, Oregon replaced its BART determination for the Boardman Coal Plant with a new requirement that accounted for a planned shutdown before the EPA took action on the state's SIP submission (76 FR 12661). Washington similarly replaced its BART determination for the TransAlta Centralia Power Plant before the EPA took action on the state's SIP submission (77 FR 72742). Oklahoma submitted a SIP revision with a new BART determination for the AEP/PSO Northeastern Power Station, which included enforceable requirements for reduced utilization and early unit retirements, to replace a FIP that had been promulgated by the EPA (79 FR 12944). Finally, the EPA finalized a BART determination for Unit 3 at the Dave Johnston Power Plant in Wyoming that included two compliance options, one of which included a federally enforceable retirement date and less costly controls.
1037.
It should be noted that regulatory obligations imposed upon states and sources operate independently under different statutes and sections of statutes; the EPA expects that states and sources will take advantage of available flexibilities as
appropriate, but will comply with all relevant legal requirements.
1038.
The impacts presented in this section of the preamble represent an illustrative implementation of the guidelines. As states implement the final guidelines, they have sufficient flexibility to adopt different state-level or regional approaches that may yield different costs, benefits, and environmental impacts. For example, states may use the flexibilities described in these guidelines to find approaches that are more cost-effective for their particular state or choose approaches that shift the balance of co-benefits and impacts to match broader state priorities.
1039.
It is important to note that the differences between the analytical results for the rate-based and mass-based illustrative plan approaches presented in the RIA may not be indicative of likely differences between the approaches if implemented by states and affected EGUs in response to the final guidelines. If one approach performs differently than the other on a given metric during a given time period, this does not imply this will apply in all instances.
1040.
See
Endangered Species Consultation Handbook, U.S. Fish & Wildlife Service and National Marine Fisheries Service at 4-25 (March 1998) (providing examples of direct effects:
e.g.,
driving an off road vehicle through the nesting habitat of a listed species of bird and destroying a ground nest; building a housing unit and destroying the habitat of a listed species). Available at
https://www.fws.gov/ENDANGERED/esa-library/pdf/esa_section7_handbook.pdf.
1041.
See, e.g.,73 FR 28212, 28300 (May 15, 2008); Memorandum from David Longly Bernhardt, Solicitor, U.S. Department of the Interior re: “Guidance on the Applicability of the Endangered Species Act's Consultation Requirements to Proposed Actions Involving the Emission of Greenhouse Gases” (Oct. 3, 2008). Available at
https://www.doi.gov/solicitor/opinions/M-37017.pdf.
1043.
EPA, Light-Duty Vehicle Greenhouse Gas Emission Standards and Corporate Average Fuel Economy Standards, Response to Comment Document for Joint Rulemaking at 4-102 (Docket ID EPA-OAR-HQ-2010-0799). Available at
https://www.epa.gov/otaq/climate/regulations/420r10012a.pdf.
1044.
The EPA has received correspondence from a U.S. Senator and a Member of the U.S. House of Representatives noting that the Services have identified several listed species affected by global climate change.
See
Letter from Rob Bishop, Chairman, House Committee on Natural Resources, to Gina McCarthy, Administrator, U.S. Environmental Protection Agency, dated June 11, 2015; Letter from Rob Bishop, Chairman, House Committee on Natural Resources, and James M. Inhofe, Chairman, Senate Committee on Environment and Public Works, to Gina McCarthy, Administrator, U.S. Environmental Protection Agency, dated June 15, 2015. EPA's assessment of ESA requirements in connection with the present rule does not address whether global climate change may, as a general matter, be a relevant consideration in the status of certain listed species. Rather, the requirements of ESA section 7(a)(2) must be considered and applied to the specific action at issue. As explained above, EPA's conclusion that ESA section 7(a)(2) consultation is not required here is premised on the specific facts and circumstances of the present rule and is fully consistent with prior relevant analyses conducted by DOI, FWS, and EPA.
1045.
One commenter questioned the EPA's citation to
American Trucking Assn's.
As stated by the commenter, the statute at issue in that case—the Regulatory Flexibility Act (RFA)—is distinguishable from the ESA in that it addresses only direct effects and does not consider indirect effects. The commenter misreads the EPA's citation to this case. The EPA cites this case simply to reference a decision considering the impacts of an EPA action—the revision of a NAAQS under the CAA—that in certain respects provides a useful analogy to the present rule. A NAAQS is implemented through a series of subsequent planning decisions generally taken by states by means of adoption of SIPs. States can choose to impose or avoid the types of impacts at issue in the D.C. Circuit case through their planning decisions; thus such impacts were not viewed as having been caused—for purposes of the RFA—by the EPA's promulgation of the revised NAAQS in the first instance. The standard setting and implementation mechanisms under section 111(d) are very similar. Under section 111(d), the EPA is required to establish “a procedure similar to that provided by section 7410”—the provision establishing the SIP mechanism for implementing NAAQS. Thus, the D.C. Circuit's discussion provides a useful analogy to the present rule and the various types of potential effects that may be attributable to future implementation planning decisions by states and other entities as they exercise their discretion in determining how to implement the federal guidelines, but not to promulgation of the rule itself. The EPA's citation to this case was not intended to address any comparison of the scope of effects covered by the RFA and the effects cognizable under section 7(a)(2) of the ESA. The EPA is aware that the ESA addresses both direct and indirect effects as defined by the applicable ESA regulations. The discussion supporting the EPA's ESA conclusion expressly acknowledges the relevance of indirect effects to the ESA analysis and explains why such effects are not present here.
1046.
A congressional letter of June 11, 2015, referenced above asserts that EPA's modeling suggests that the Big Bend Power Station and Crystal River Energy Complex in Florida will be prematurely retired as a result of the rule. EPA notes that any such facility-level projections associated with the rule cannot be stated with sufficient certainty to qualify as potential indirect effects under the ESA. These projections are based on numerous assumptions regarding a variety of planning and business decisions yet to be made by the implementing governments (usually states) and facility owners. Given the wide degrees of discretion and flexibility and the numerous options available for such decision making, the potential for such outcomes to be realized as currently projected is at this point too uncertain to qualify as an effect under the ESA.
1047.
See
51 FR at 19933 (describing effects that are “reasonably certain to occur” in the context of consideration of cumulative effects and distinguishing broader consideration that may be appropriate in applying a procedural statute such as the National Environmental Policy Act, as opposed to a substantive provision such as ESA section 7(a)(2) that may prohibit certain federal actions); Endangered Species Consultation Handbook, U.S. Fish & Wildlife Service and National Marine Fisheries Service at 4-30 (March 1998) (in the same context, describing indicators that an activity is reasonably certain to occur as including governmental approvals of the action or indications that such approval is imminent, project sponsors' assurance that the action will proceed, obligation of venture capital, or initiation of contracts; and noting that the more governmental administrative discretion remains to be exercised, the less there is reasonable certainty the action will proceed). Available at
https://www.fws.gov/ENDANGERED/esa-library/pdf/esa_section7_handbook.pdf.
1048.
EPA also notes that some of the future implementing activities may involve federal actions that are subject to ESA consultation, thus providing consideration of any impacts on listed species at the appropriate point when particular activities have become reasonably certain. Several commenters on the proposal specifically noted that such future activities—
e.g.,
development of additional RE facilities such as wind farms—may call for ESA consultation. Further, EPA notes that section 9 of the ESA, which prohibits the take of individuals of most listed species, provides an additional protection for listed species as future implementing activities become reasonably certain.
1049.
The commenters cite certain cases that they assert support consulting under ESA section 7(a)(2). The EPA has considered these cases, each of which is distinguishable from the present rule. By way of example, a commenter cites two cases involving EPA actions:
Defenders of Wildlife
v.
EPA,
420 F.3d 946 (9th Cir. 2005),
rev'd, National Association of Homebuilders
v.
Defenders of Wildlife,
551 U.S. 644 (2007); and
Washington Toxics Coalition
v.
EPA,
413 F.3d 1024 (9th Cir. 2005). In
Defenders of Wildlife
(a decision that was reversed by the U.S. Supreme Court), a principal relevant impact of the federal action at issue—the EPA's approval of a state's permitting program under the Clean Water Act—was that following the action, the relevant permitted activities would no longer be subject to consultation under the ESA. By contrast, promulgation of the present rule will result in no change to any ESA requirements applicable to any future activities directed by plans (either state or federal) implementing the rule. The action at issue in
Washington Toxics Coalition
involved the EPA's registration of certain pesticide active ingredients under the Federal Insecticide, Fungicide, and Rodenticide Act. Such actions provide authorization for the sale and distribution of those products, consistent with applicable labelling requirements. The EPA also notes that under the EPA's regulations, registered pesticide labels must, among other things, specify the product ingredients and the methods and sites of product application. 40 CFR 156.10. By contrast, the present rule only sets goals and describes potential pathways to meeting those goals, all of which are subject to future considerations and decisions involved in the implementation of plans (generally by states). The rule neither authorizes, nor directs, any of the future measures to meet the rule's goals. Those activities remain subject to the full range of future decision making addressing which types of measures to implement, what emitting entities will be affected, how much, and when.
1050.
The MR&R costs estimates are $65 million in 2020, $15 million in 2025 and $15 million in 2030 and are assumed to be the same for both rate-based and mass-based illustrative plan approaches.
1051.
Docket ID EPA-HQ-OAR-2013-0495, Technical Support Document: Technical Update of the Social Cost of Carbon for Regulatory Impact Analysis Under Executive Order 12866, Interagency Working Group on Social Cost of Carbon, with participation by Council of Economic Advisers, Council on Environmental Quality, Department of Agriculture, Department of Commerce, Department of Energy, Department of Transportation, Domestic Policy Council, Environmental Protection Agency, National Economic Council, Office of Management and Budget, Office of Science and Technology Policy, and Department of the Treasury (May 2013, Revised July 2015). Available at:
https://www.whitehouse.gov/sites/default/files/omb/inforeg/scc-tsd-final-july-2015.pdf.
1052.
Docket ID EPA-HQ-OAR-2009-0472-114577,
Technical Support Document: Social Cost of Carbon for Regulatory Impact Analysis Under Executive Order 12866, Interagency Working Group on Social Cost of Carbon,
with participation by the Council of Economic Advisers, Council on Environmental Quality, Department of Agriculture, Department of Commerce, Department of Energy, Department of Transportation, Environmental Protection Agency, National Economic Council, Office of Energy and Climate Change, Office of Management and Budget, Office of Science and Technology Policy, and Department of Treasury (February 2010). Also available at:
https://www.whitehouse.gov/sites/default/files/omb/inforeg/for-agencies/Social-Cost-of-Carbon-for-RIA.pdf.
1053.
The current version of the TSD is available at:
https://www.whitehouse.gov/sites/default/files/omb/inforeg/scc-response-to-comments-final-july-2015.pdf, Docket ID EPA-HQ-OAR-2013-0495,
Technical Support Document: Technical Update of the Social Cost of Carbon for Regulatory Impact Analysis Under Executive Order 12866,
Interagency Working Group on Social Cost of Carbon, with participation by Council of Economic Advisers, Council on Environmental Quality, Department of Agriculture, Department of Commerce, Department of Energy, Department of Transportation, Domestic Policy Council, Environmental Protection Agency, National Economic Council, Office of Management and Budget, Office of Science and Technology Policy, and Department of Treasury (May 2013, Revised July 2015).
1057.
U.S. Environmental Protection Agency (U.S. EPA). 2012.
Regulatory Impact Analysis for the Final Revisions to the National Ambient Air Quality Standards for Particulate Matter.
Research Triangle Park, NC: Office of Air Quality Planning and Standards, Health and Environmental Impacts Division. (EPA document number EPA-452/R-12-003, December). Available at: <
https://www.epa.gov/pm/2012/finalria.pdf
>.
1058.
U.S. Environmental Protection Agency (U.S. EPA). 2008b. Final Ozone NAAQS Regulatory Impact Analysis. Research Triangle Park, NC: Office of Air Quality Planning and Standards, Health and Environmental Impacts Division, Air Benefit and Cost Group Research. (EPA document number EPA-452/R-08-003, March). Available at: <
https://cfpub.epa.gov/ncea/cfm/recordisplay.cfm?deid=194645
>.
1060.
U.S. Environmental Protection Agency. 2013.
Technical support document: Estimating the benefit per ton of reducing PM2.5precursors from 17 sectors.
Research Triangle Park, NC: Office of Air and Radiation, Office of Air Quality Planning and Standards, January. Available at: <
https://www.epa.gov/airquality/benmap/models/Source_Apportionment_BPT_TSD_1_31_13.pdf
>.
1061.
Krewski D.; M. Jerrett; R.T. Burnett; R. Ma; E. Hughes; Y. Shi, et al. 2009.
Extended Follow-up and Spatial Analysis of the American Cancer Society Study Linking Particulate Air Pollution and Mortality.
Health Effects Institute. (HEI Research Report number 140). Boston, MA: Health Effects Institute. Available at
https://www.healtheffects.org/Pubs/RR140-Krewski.pdf.
1062.
Lepeule, J.; F. Laden; D. Dockery; J. Schwartz. 2012. “Chronic Exposure to Fine Particles and Mortality: An Extended Follow-Up of the Harvard Six Cities Study from 1974 to 2009.”
Environmental Health Perspective,
120(7), July, pp. 965-970.
1063.
Roman, H., et al. 2008. “Expert Judgment Assessment of the Mortality Impact of Changes in Ambient Fine Particulate Matter in the U.S.”
Environmental Science & Technology,
Vol. 42, No. 7, February, pp. 2268-2274.
1064.
Bell, M.L., et al. 2004. “Ozone and Short-Term Mortality in 95 U.S. Urban Communities, 1987-2000.”
Journal of the American Medical Association,
292(19), pp. 2372-8.
1065.
Levy, J.I., S.M. Chemerynski, and J.A. Sarnat. 2005. “Ozone exposure and mortality: An empiric Bayes metaregression analysis.”
Epidemiology.
16(4): p. 458-68.
1066.
U.S. Environmental Protection Agency. 2009.
Integrated Science Assessment for Particulate Matter (Final Report).
Research Triangle Park, NC: National Center for Environmental Assessment, RTP Division. (EPA document number EPA-600-R-08-139F, December). Available at:
https://cfpub.epa.gov/ncea/cfm/recordisplay.cfm?deid=216546.
1068.
“Endangerment and Cause or Contribute Findings for Greenhouse Gases Under Section 202(a) of the Clean Air Act,” 74 FR 66496 (Dec. 15, 2009) (“Endangerment Finding”).
1069.
Melillo, Jerry M., Terese (T.C.) Richmond, and Gary W. Yohe, Eds., 2014:
Climate Change Impacts in the United States: The Third National Climate Assessment.
U.S. Global Change Research Program, 841 pp.
IPCC, 2014:
Climate Change 2014: Impacts, Adaptation, and Vulnerability. Part A: Global and Sectoral Aspects.
Contribution of Working Group II to the Fifth Assessment Report of the Intergovernmental Panel on Climate Change [Field, C.B., V.R. Barros, D.J. Dokken, K.J. Mach, M.D. Mastrandrea, T.E. Bilir, M. Chatterjee, K.L. Ebi, Y.O. Estrada, R.C. Genova, B. Girma, E.S. Kissel, A.N. Levy, S. MacCracken, P.R. Mastrandrea, and L.L. White (eds.)]. Cambridge University Press, 1132 pp.
https://www.ipcc.ch/report/ar5/wg2/.
IPCC, 2014:
Climate Change 2014: Impacts, Adaptation, and Vulnerability. Part B: Regional Aspects.
Contribution of Working Group II to the Fifth Assessment Report of the Intergovernmental Panel on Climate Change [Barros, V.R., C.B. Field, D.J. Dokken, M.D. Mastrandrea, K.J. Mach, T.E. Bilir, M. Chatterjee, K.L. Ebi, Y.O. Estrada, R.C. Genova, B. Girma, E.S. Kissel, A.N. Levy, S. MacCracken, P.R. Mastrandrea, and L.L. White (eds.)]. Cambridge University Press, 688 pp.
https://www.ipcc.ch/report/ar5/wg2/.
1071.
U.S. Environmental Protection Agency (U.S. EPA). 2009.
Integrated Science Assessment for Particulate Matter (Final Report).
EPA-600-R-08-139F. National Center for Environmental Assessment—RTP Division. December. Available on the Internet at <
https://cfpub.epa.gov/ncea/cfm/recordisplay.cfm?deid=216546
>.