Federal Reserve System
- [Docket No. OP-1636]
AGENCY:
Board of Governors of the Federal Reserve System.
ACTION:
Notice.
SUMMARY:
The Board of Governors of the Federal Reserve System (Board) has approved the private sector adjustment factor (PSAF) for 2019 of $17.8 million and the 2019 fee schedules for Federal Reserve priced services and electronic access. These actions were taken in accordance with the Monetary Control Act of 1980, which requires that, over the long run, fees for Federal Reserve priced services be established on the basis of all direct and indirect costs, including the PSAF.
DATES:
The new fee schedules become effective January 2, 2019.
FOR FURTHER INFORMATION CONTACT:
For questions regarding the fee schedules: David C. Mills, Deputy Associate Director, (202) 530-6265; Amanda Holcombe, Financial Institution Policy Analyst, (202) 912-4625; Emily Massaro, Financial Institution Policy Analyst, (202) 452-2493, Division of Reserve Bank Operations and Payment Systems. For questions regarding the PSAF: Lawrence Mize, Deputy Associate Director, (202) 452-5232; Max Sinthorntham, Senior Financial Institution Policy Analyst, (202) 452-2864, Division of Reserve Bank Operations and Payment Systems. For users of Telecommunications Device for the Deaf (TDD) only, please call (202) 263-4869. Copies of the 2019 fee schedules for the check service are available from the Board, the Federal Reserve Banks, or the Reserve Banks' financial services website at www.frbservices.org.
I. Supplementary Information
Private Sector Adjustment Factor, Priced Services Cost Recovery, and Overview of 2019 Price Changes
A. Overview—Each year, as required by the Monetary Control Act of 1980, the Reserve Banks set fees for priced services provided to depository institutions. These fees are set to recover, over the long run, all direct and indirect costs and imputed costs, including financing costs, taxes, and certain other expenses, as well as the return on equity (profit) that will have been earned if a private business firm provided the services. The imputed costs and imputed profit are collectively referred to as the private-sector adjustment factor (PSAF). From 2008 through 2017, the Reserve Banks recovered 101.9 percent of their total expenses (including imputed costs) and targeted after-tax profits or return on equity (ROE) for providing priced services.[1]
Table 1 summarizes 2017 actual, 2018 estimated, and 2019 budgeted cost-recovery rates for all priced services. Cost recovery is estimated to be 101.0 percent in 2018 and budgeted to be 100.9 percent in 2019.
| Year | Revenue | Total expense | Net income (ROE) | Targeted ROE | Recovery rate after targeted ROE (%) |
|---|---|---|---|---|---|
| 1 b | 2 c | 3 [1−2] | 4 d | 5 e f [1/(2 + 4)] | |
| 2017 (actual) | 441.6 | 419.4 | 22.2 | 4.6 | 104.1 |
| 2018 (estimate) | 441.7 | 432.0 | 9.7 | 5.2 | 101.0 |
| 2019 (budget) | 440.2 | 430.8 | 9.4 | 5.4 | 100.9 |
| a Calculations in this table and subsequent pro forma cost and revenue tables may be affected by rounding. | |||||
| b Revenue includes imputed income on investments when equity is imputed at a level that meets minimum capital requirements and, when combined with liabilities, exceeds total assets (attachment 1). For 2018, the projected revenue assumes implementation of the proposed fee changes. | |||||
| c The calculation of total expense includes operating, imputed, and other expenses. Imputed and other expenses include taxes, Board of Governors' priced services expenses, the cost of float, and interest on imputed debt, if any. Credits or debits related to the accounting for pension plans under ASC 715 are also included. | |||||
| d Targeted ROE is the after-tax ROE included in the PSAF. | |||||
| e The recovery rates in this and subsequent tables do not reflect the unamortized gains or losses that must be recognized in accordance with ASC 715. Future gains or losses, and their effect on cost recovery, cannot be projected. ( printed page 1127) | |||||
| f For 2019, credits or debits related to the accounting for pension plans under ASC 715 include service cost only with the adoption of ASU 2017-07 Improving the Presentation of Net Periodic Pension Cost and Net Periodic Postretirement Benefit Cost (Topic 715). | |||||
Table 2 provides an overview of cost-recovery budgets, estimates, and performance for the 10-year period from 2008 to 2017, 2017 actual, 2018 budget, 2018 estimate, and 2019 budget by priced service.
| Priced service | 2008-2017 | 2017 actual | 2018 budget a | 2018 estimate | 2019 budget b |
|---|---|---|---|---|---|
| All services | 101.9 | 104.1 | 100.1 | 101.0 | 100.9 |
| Check | 103.5 | 107.0 | 101.6 | 101.7 | 101.5 |
| FedACH | 98.5 | 99.8 | 96.1 | 98.0 | 101.8 |
| Fedwire Funds and NSS | 101.5 | 106.2 | 103.9 | 105.0 | 100.7 |
| Fedwire Securities | 102.2 | 103.6 | 97.6 | 96.5 | 94.7 |
| a The 2018 budget figures reflect the final budgets as approved by the Board in December 2017. | |||||
| b The 2019 budget figures reflect preliminary budget information from the Reserve Banks. The Reserve Banks will submit final budget data to the Board in November 2018, for Board consideration in December 2018. | |||||
1. 2018 Estimated Performance —The Reserve Banks estimate that they will recover 101.0 percent of the costs of providing priced services in 2018, including total expense and targeted ROE, compared with a 2018 budgeted recovery rate of 100.1 percent, as shown in table 2. Overall, the Reserve Banks estimate that they will fully recover actual and imputed costs and earn net income of $9.7 million, compared with the targeted ROE of $5.2 million. The Reserve Banks estimate that the check service and the Fedwire® Funds and National Settlement Services will achieve full cost recovery; however, the Reserve Banks continue to estimate that the FedACH® Service and the Fedwire Securities Service will not achieve full cost recovery. Consistent with recent years, the FedACH Service will not achieve full cost recovery because of investment costs associated with the multiyear technology initiative to modernize its processing platform.[2] This investment is expected to enhance efficiency, the overall quality of operations, and the Reserve Banks' ability to offer additional services to depository institutions. The Reserve Banks estimate that the Fedwire Securities Service will not achieve full cost recovery because of ongoing market structure changes and investment costs associated with initiatives to promote operational resiliency.
2. 2019 Private-Sector Adjustment Factor —The 2019 PSAF for Reserve Bank priced services is $17.8 million. This amount represents a decrease of $1.1 million from the 2018 PSAF of $18.9 million. This decrease is primarily the result of a decrease in the total cost of debt and partially offset by an increase in Board of Governors expenses.
3. 2019 Projected Performance —The Reserve Banks project a priced services cost recovery rate of 100.9 percent in 2019, with a net income of $9.4 million and targeted ROE of $5.4 million. The Reserve Banks project that the price changes will result in a 2.5 percent average price increase for customers. The Reserve Banks project that each of the individual service lines, other than the Fedwire Securities Service, will fully recover their costs. The Reserve Banks anticipate that the FedACH technology modernization initiative will conclude in 2019, allowing for a projected return to cost recovery for the FedACH Service. Although the Fedwire Securities Service is not budgeted to fully cover its costs in 2019 because of volume declines driven by market changes, the service is projected to recover costs over the long run.[3]
The primary risks to the Reserve Banks' ability to achieve their targeted cost-recovery rates are unanticipated volume and revenue reductions and the potential for cost overruns from new and ongoing improvement initiatives. In light of these risks, the Reserve Banks will continue to refine their business and operational strategies to manage operating costs, to increase product revenue, and to capitalize on efficiencies gained from technology initiatives.
4. 2019 Pricing —The following summarizes the Reserve Banks' changes in fee schedules for priced services in 2019:
Check
- The Reserve Banks will reassign the tier placement of 1,116 forward and 240 return endpoints in the FedForward® and FedReturn® products, respectively.[4]
- The Reserve Banks will lower the average daily forward receipt and return tier volume thresholds approximately 6.0 percent for tiers 1, 2, 3, and 4 for FedForward® and FedReturn® image cash letter and daily fee deposit options based on the 2019 tier assignments to account for the anticipated continued decline in check deposit volumes.
- The Reserve Banks will increase per-item fees for the FedForward® Premium Daily Fee A, B, and C deposit options by $0.001 for Tier 3 and $0.003 for Tier 4. The Reserve Banks will also increase the Premium Daily Fee C daily fixed fee by $200, from $3,500 to $3,700.
- The Reserve Banks will increase cash letter fees by $0.50 for all deadlines on FedForward® Standard, Deferred, Dollar-Culled, and Endpoint-Culled image cash letters and FedReturn® Standard image cash letters.
- The Reserve Banks will increase the per-item fee for the FedReceipt® Premium Delivery 8:00 a.m. EST target by $0.006 and per item fees for the Premium Delivery 10:00 a.m. target and Premium Delivery 12:00 noon target by $0.002.[5]
- The Reserve Banks will increase FedReceipt® Electronic Reject Repair fees by $0.05, increasing the Basic repair ( printed page 1128) from $0.15 per-item to $0.20 per-item and increasing the Premium repair from $0.25 per-item to $0.30 per-item.
- The Reserve Banks will increase all fees for the FedImage® product and certain truncation fees 10.0 percent (rounded to the nearest increment based upon the number of decimal places of the current fee).
- The Reserve Banks will introduce two new fees intended to improve the quality of check deposit processing and reduce errors in adjustment case submissions. The Reserve Banks will introduce a $0.50 fee for encoding error and duplicate-payment adjustment cases caused by the depositary bank's incorrect encoding or duplicate deposit of an item. The Reserve Banks will also introduce a $2.50 fee for automated adjustment case types that require manual intervention by Reserve Bank staff due to error on the part of the adjusting bank.
FedACH
- The Reserve Banks will offer a new ACH Exception Resolution Service® that will provide an automated means for customers to resolve ACH exceptions. The fee structure will contain fixed and variable elements, as outlined in the ACH fee schedule.
- The Reserve Banks will keep prices at existing levels for all existing priced FedACH products.
Fedwire Funds
- The Reserve Banks will increase the offline send surcharge and offline receive surcharge from $60.00 to $65.00.
National Settlement Service (NSS)
- The Reserve Banks will keep prices at existing levels for the priced NSS products.
Fedwire Securities
- The Reserve Banks will increase the agency online transfer fee from $0.77 to $0.98.
- The Reserve Banks will increase the automated claims adjustment process (ACAP) fee from $0.80 to $1.00.
FedLine® Access Solutions
- The Reserve Banks will discontinue offering new FedMail Fax subscriptions.
- The Reserve Banks will discontinue offering the Accounting Totals by Service (ACTS) report.
- The Reserve Banks will discontinue charging à la carte fees for additional FedLine Command server certificates. The Reserve Banks will provide FedLine Command server certificates as part of FedLine Command packages at no additional cost.
- The Reserve Banks will offer upgraded FedLine Direct® Plus and Premier packages, with monthly fees of $5,500 and $10,500 respectively, to reflect the incorporation of the Check 21 Large File Delivery service with the FedLine Direct solution. Existing customers may continue to use the legacy FedLine Direct Plus and Premier packages until they migrate to the upgraded packages. The Reserve Banks will also increase the monthly fee for the legacy FedLine Direct Plus package by $350, from $3,650 to $4,000.
- The Reserve Banks will increase the monthly à la carte fee for Network Diversity by $500, from $2,000 to $2,500.
5. 2019 Price Index —Figure 1 compares indexes of fees for the Reserve Banks' priced services with the GDP price index.[6] The price index for Reserve Bank priced services is projected to remain relatively flat, with a decrease of less than 1 percent in 2019 from the 2018 level. The price index for Check 21 services is projected to increase approximately 3 percent. The price indexes for the FedACH Service, the Fedwire Funds and National Settlement Services, and the Fedwire Securities Service are projected to decrease approximately 1 percent, 2 percent, and 3 percent, respectively. For the period 2009 to 2019, the price index for total priced services is expected to decrease nearly 7 percent.
( printed page 1129)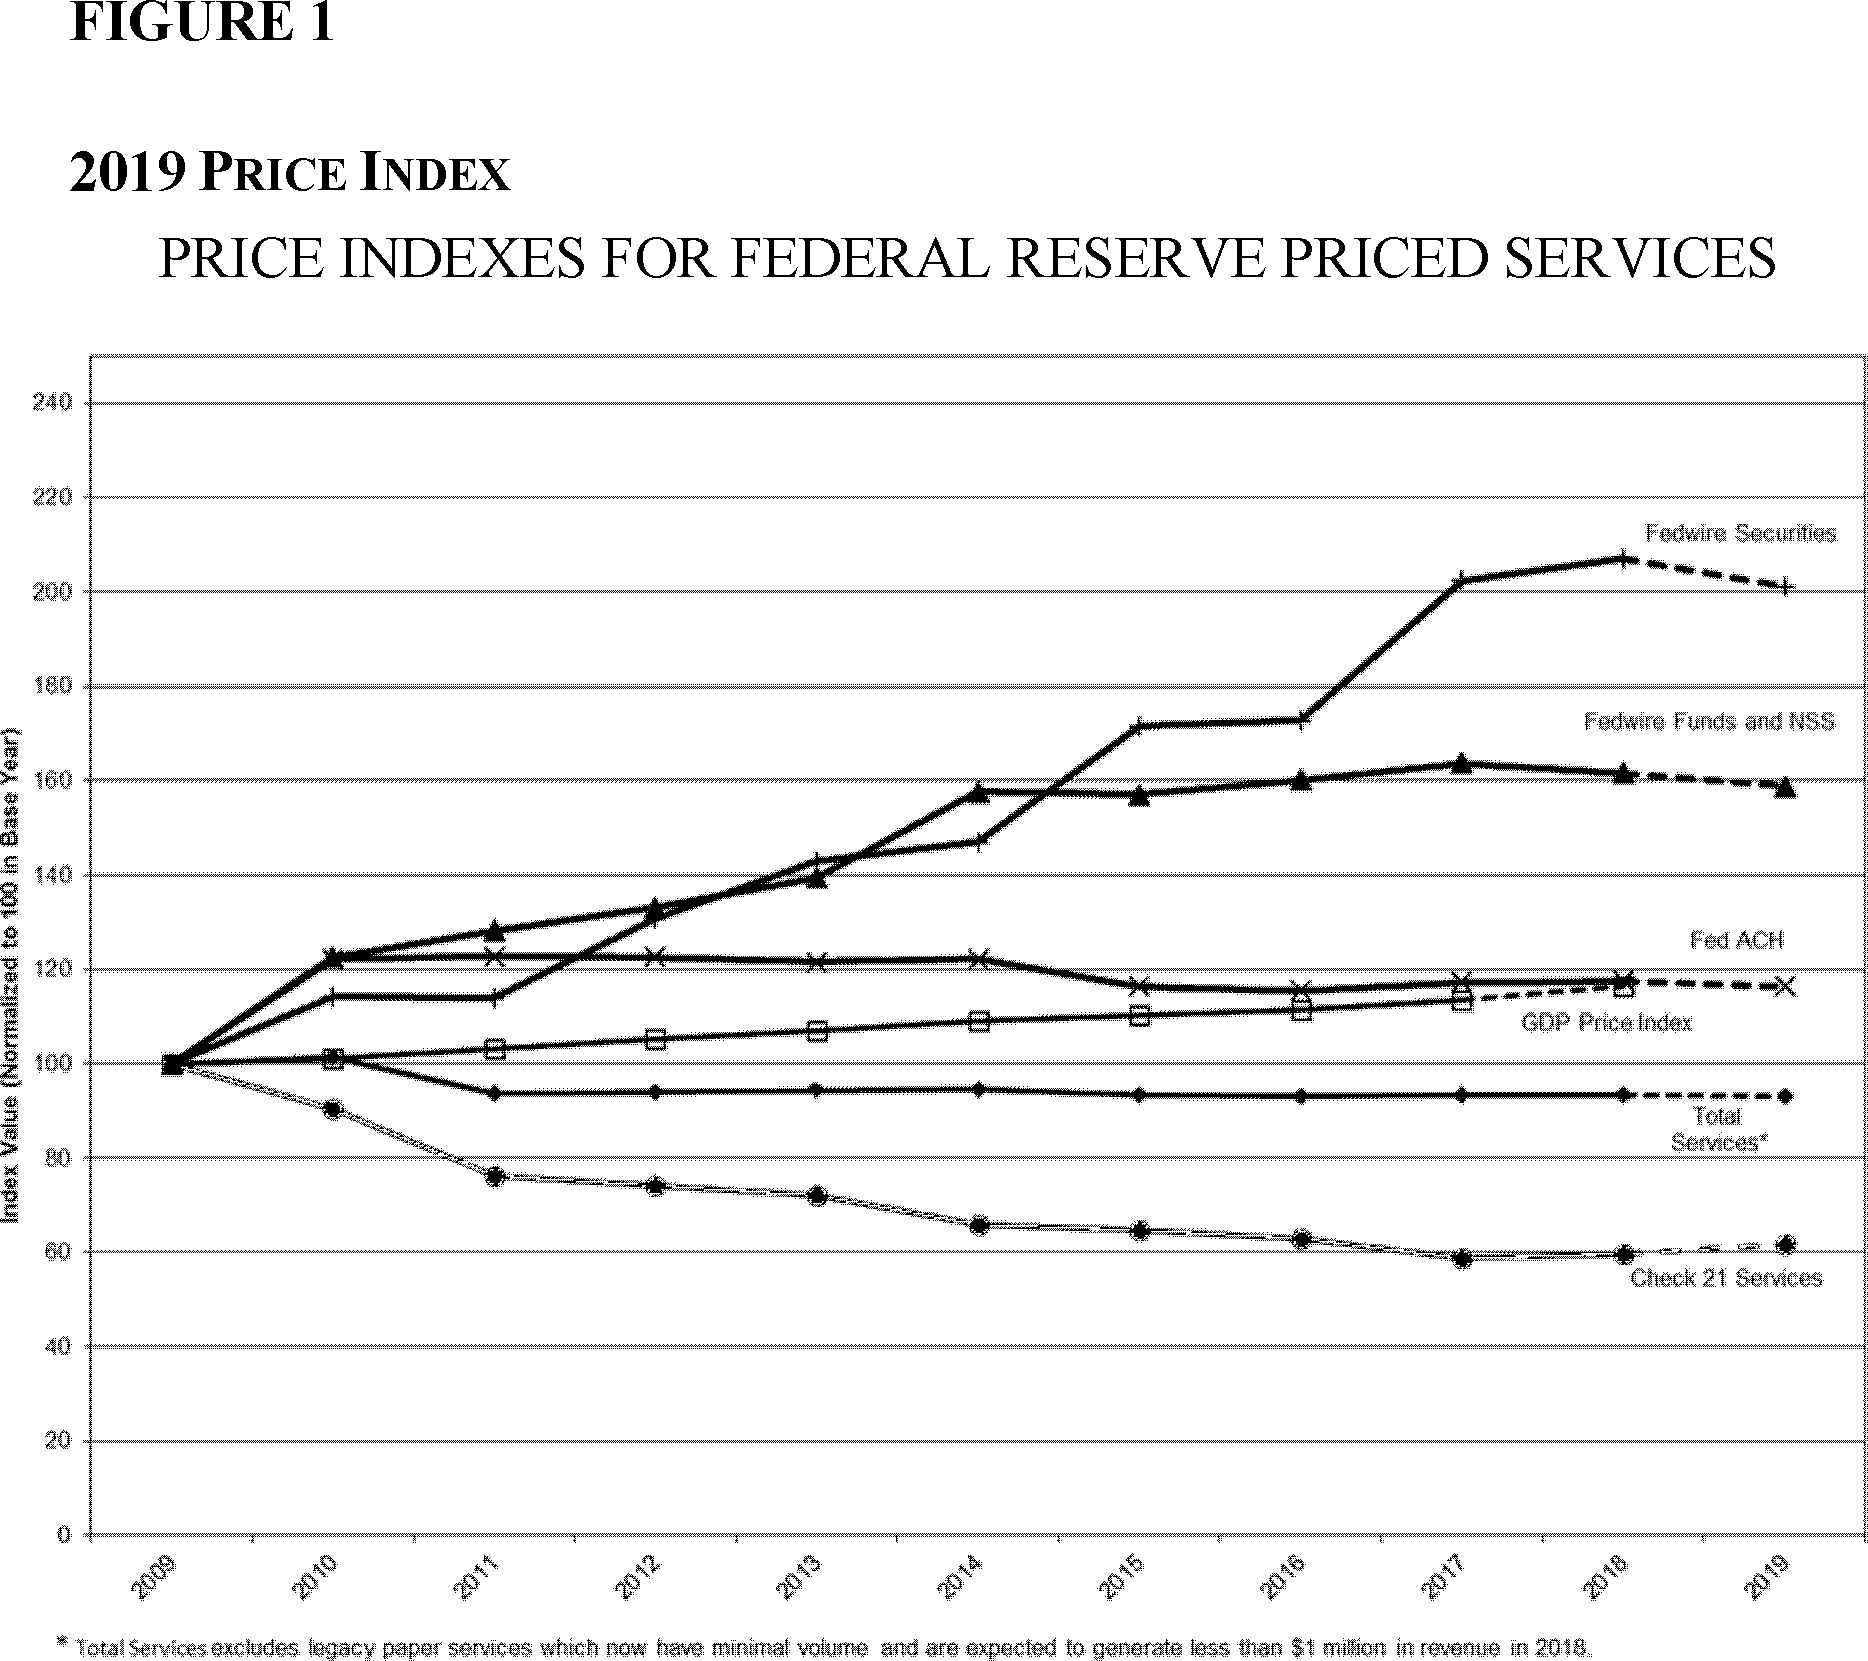
B. Private Sector Adjustment Factor —The imputed debt financing costs, targeted ROE, and effective tax rate are based on a U.S. publicly traded firm market model.[7] The method for calculating the financing costs in the PSAF requires determining the appropriate imputed levels of debt and equity and then applying the applicable financing rates. In this process, a pro forma balance sheet using estimated assets and liabilities associated with the Reserve Banks' priced services is developed, and the remaining elements that would exist are imputed as if these priced services were provided by a private business firm. The same generally accepted accounting principles that apply to commercial-entity financial statements apply to the relevant elements in the priced services pro forma financial statements.
The portion of Federal Reserve assets that will be used to provide priced services during the coming year is determined using information about actual assets and projected disposals and acquisitions. The priced portion of these assets is determined based on the allocation of depreciation and amortization expenses of each asset class. The priced portion of actual Federal Reserve liabilities consists of postemployment and postretirement benefits, accounts payable, and other liabilities. The priced portion of the actual net pension asset or liability is also included on the balance sheet.[8]
The equity financing rate is the targeted ROE produced by the capital asset pricing model (CAPM). In the CAPM, the required rate of return on a firm's equity is equal to the return on a risk-free asset plus a market risk premium. The risk-free rate is based on the three-month Treasury bill; the beta is assumed to be equal to 1.0, which approximates the risk of the market as a whole; and the market risk premium is based on the monthly returns in excess of the risk-free rate over the most recent 40 years. The resulting ROE reflects the return a shareholder would expect when investing in a private business firm.
For simplicity, given that federal corporate income tax rates are graduated, state income tax rates vary, and various credits and deductions can apply, an actual income tax expense is not explicitly calculated for Reserve Bank priced services. Instead, the Board targets a pretax ROE that would provide sufficient income to fulfill the priced services' imputed income tax obligations. To the extent that performance results are greater or less ( printed page 1130) than the targeted ROE, income taxes are adjusted using the effective tax rate.
Capital structure. The capital structure is imputed based on the imputed funding need (assets less liabilities), subject to minimum equity constraints. Short-term debt is imputed to fund the imputed short-term funding need. Long-term debt and equity are imputed to meet the priced services long-term funding need at a ratio based on the capital structure of the U.S. publicly traded firm market. The level of equity must meet the minimum equity constraints, which follow the FDIC requirements for a well-capitalized institution. The priced services must maintain equity of at least 5 percent of total assets and 10 percent of risk-weighted assets.[9] Any equity imputed that exceeds the amount needed to fund the priced services' assets and meet the minimum equity constraints is offset by a reduction in imputed long-term debt. When imputed equity is larger than what can be offset by imputed debt, the excess is imputed as investments in Treasury securities; income imputed on these investments reduces the PSAF.
Application of the Payment System Risk (PSR) Policy to the Fedwire Services. The Board's PSR policy incorporates the international standards for financial market infrastructures (FMIs) developed by the Committee on Payment and Settlement Systems and the Technical Committee of the International Organization of Securities Commissions in the Principles for Financial Market Infrastructures. The revised policy retains the expectation that the Fedwire Services meet or exceed the applicable risk-management standards. Principle 15 states that an FMI should identify, monitor, and manage general business risk and hold sufficient liquid net assets funded by equity to cover potential general business losses so that it can continue operations and services as a going concern if those losses materialize. Further, liquid net assets should at all times be sufficient to ensure a recovery or orderly wind-down of critical operations and services. The Fedwire Services do not face the risk that a business shock would cause the service to wind down in a disorderly manner and disrupt the stability of the financial system. In order to foster competition with private-sector FMIs, however, the Reserve Banks' priced services will hold an amount equivalent to six months of the Fedwire Funds Service's current operating expenses as liquid financial assets and equity on the pro forma balance sheet.[10] Current operating expenses are defined as normal business operating expenses on the income statement, less depreciation, amortization, taxes, and interest on debt. Using the Fedwire Funds Service's preliminary 2019 budget, six months of current operating expenses would be $50.5 million. In 2019, $38.8 million of equity was imputed to meet the FDIC capital requirements, resulting in an ending equity balance of $51.8 million. No additional imputed equity was necessary to meet the PSR policy requirement.
Effective tax rate. Like the imputed capital structure, the effective tax rate is calculated based on data from U.S. publicly traded firms. The tax rate is the mean of the weighted average rates of the U.S. publicly traded firm market over the past 5 years.
Debt and equity financing. The imputed short- and long-term debt financing rates are derived from the nonfinancial commercial paper rates from the Federal Reserve Board's H.15 Selected Interest Rates release (AA and A2/P2) and the annual Merrill Lynch Corporate & High Yield Index rate, respectively. The equity financing rate is described above. The rates for debt and equity financing are applied to the priced services estimated imputed short-term debt, long-term debt, and equity needed to finance short- and long-term assets and meet equity requirements.
The 2019 PSAF is $17.8 million, compared with $18.9 million in 2018. The decrease of $1.1 million is attributable to a $2.8 million decrease in the cost of debt and a $0.3 million decrease in sales tax, offset by a $1.9 million increase in the Board's costs and a $0.1 million increase in the return on equity. The net $2.7 million decrease in cost of capital ($2.8 million less $0.1 million) resulted from lower funding needs driven by lower long-term assets. The increase in Board costs are attributed to a shift from policy to priced services oversight activities.
The PSAF expense of $17.8 million, detailed in table 5, reflects $7.1 million for capital funding, $7.0 million for BOG expense and $3.7 million in sales tax expense.
As shown in table 3, 2019 total assets of $846.6 million increased by $29.4 million from 2018. The net increase in total assets reflects a $105 million increase in short-term assets and imputed investments offset by a $75.6 million decrease in long-term assets.
The increase in the short-term assets is primarily driven by the imputed investments in Treasury securities and Federal Funds. These increases in short-term assets are largely offset by increases in short-term liabilities in the form of deferred credits. There were larger averages for check items in process of collection, and higher average ACH Pre-Fund account balances in the first several months of 2018. The 2019 balances are estimated based on the current account balance average for the first part of 2018.
The net long-term asset decrease of $75.6 million primarily consists of a $53.0 million decrease in the net pension asset and a combined $18.6 million decrease in Furniture and equipment and Leasehold improvements and long-term prepayments. The net pension asset decrease reflects lower plan contributions over the past two years, down from $720 million to $240 million in 2018 and from $480 million to $180 million in 2019. The decrease in furniture and equipment and Leasehold improvements and long-term prepayments are mainly due to a lower allocation of Reserve Bank assets to the Federal Reserve's priced services.
The capital structure of the 2019 pro forma balance sheet, provided in table 4, is composed of equity of $51.8 million, or 10 percent of the 2019 risk weighted assets detailed in table 6, and no long-term debt. The 2019 capital structure differs from that of 2018, which was composed of $57.8 million of equity and $76.9 million of long-term debt. The 2019 imputed equity required to fund assets and meet the publicly traded firm model capital requirements is $31.3 million. Long-term debt of $18.2 million was imputed at the observed market ratio of 58.3 percent. To meet the FDIC capital requirements for a well-capitalized institution, the $18.2 million of imputed long-term debt was substituted for equity, and additional $20.5 million equity was imputed. The resulting $51.8 million total level of equity satisfies the PSR policy requirements for 2019.
The net Accumulated Other Comprehensive Income loss is $624.3 ( printed page 1131) million, compared with $637.2 million in 2018. The slight decrease is primarily attributable to the actuarial gains as a result of higher than expected returns on pension assets and a lower discount rate. AOCI is in a net loss position and does not reduce the total imputed equity required to fund priced services assets or fulfill the FDIC equity requirements for a well-capitalized institution.
| 2019 | 2018 | Change | |
|---|---|---|---|
| Short-term assets: | |||
| Receivables | $36.7 | $36.6 | $0.0 |
| Materials and supplies | 0.6 | 0.5 | 0.1 |
| Prepaid expenses | 11.1 | 13.0 | (1.9) |
| Items in process of collection 11 | 95.0 | 87.0 | 8.0 |
| Total short-term assets | 143.4 | 137.1 | 6.3 |
| Imputed investments: 12 | |||
| Imputed investment in Treasury Securities | 20.5 | 20.5 | |
| Imputed investment in Fed Funds | 253.0 | 174.8 | 78.2 |
| Total imputed investments | 273.5 | 174.8 | 98.7 |
| Long-term assets: | |||
| Premises 13 | 104.2 | 103.7 | 0.2 |
| Furniture and equipment | 32.8 | 38.9 | (6.0) |
| Leasehold improvements and long-term prepayments | 87.7 | 100.3 | (12.6) |
| Net pension asset | 23.6 | 76.6 | (53.0) |
| Deferred tax asset | 181.4 | 185.6 | (4.1) |
| Total long-term assets | 429.7 | 505.3 | (75.6) |
| Total assets | 846.6 | 817.2 | 29.4 |
| Short-term liabilities: | |||
| Deferred credit items | 348.0 | 261.8 | 86.2 |
| Short-term debt | 13.5 | 14.5 | (1.0) |
| Short-term payables | 34.9 | 35.6 | (0.7) |
| Total short-term liabilities | 396.4 | 311.9 | 84.5 |
| Long-term liabilities: | |||
| Long-term debt | 76.9 | (76.9) | |
| Postemployment/postretirement benefits and net pension liabilities 14 | 398.4 | 370.5 | 27.9 |
| Total liabilities | 794.8 | 759.3 | 35.4 |
| Equity 15 | 51.8 | 57.8 | (6.0) |
| Total liabilities and equity | 846.6 | 817.2 | 29.4 |
| 2019 | 2018 | |
|---|---|---|
| A. Short-term asset financing: | ||
| Short-term assets to be financed: | ||
| Receivables | $36.7 | $36.6 |
| Materials and supplies | 0.6 | 0.5 |
| Prepaid expenses | 11.1 | 13.0 |
| Total short-term assets to be financed | 48.4 | 50.1 |
| Short-term payables | 34.9 | 35.6 |
| Net short-term assets to be financed | 13.5 | 14.5 |
| ( printed page 1132) | ||
| Imputed short-term debt financing: 16 | 13.5 | 14.5 |
| B. Long-term asset financing: | ||
| Long-term assets to be financed: | ||
| Premises | 104.2 | 103.9 |
| Furniture and equipment | 32.8 | 38.9 |
| Leasehold improvements and long-term prepayments | 87.7 | 100.3 |
| Net pension asset | 23.6 | 76.6 |
| Deferred tax asset | 181.4 | 185.6 |
| Total long-term assets to be financed | 429.7 | 505.3 |
| Postemployment/postretirement benefits and net pension liabilities | 398.4 | 370.5 |
| Net long-term assets to be financed | 31.3 | 134.8 |
| Imputed long-term debt 23 | 76.9 | |
| Imputed equity 23 | 51.8 | 57.8 |
| Total long-term financing | 51.8 | 134.8 |
| 2019 | 2018 | |||
|---|---|---|---|---|
| Debt | Equity | Debt | Equity | |
| A. Imputed long-term debt and equity: | ||||
| Net long-term assets to finance | $31.3 | $31.3 | $134.8 | $134.8 |
| Capital structure observed in market | 58.3% | 41.7% | 58.2% | 41.8% |
| Pre-adjusted long-term debt and equity | $18.2 | $13.1 | $78.4 | $56.4 |
| Equity adjustments: 17 | ||||
| Equity to meet capital requirements | 51.8 | 57.8 | ||
| Adjustment to debt and equity funding given capital requirements 18 | (18.2) | 18.2 | (1.5) | 1.5 |
| Adjusted equity balance | 31.3 | 57.8 | ||
| Equity to meet capital requirements 19 | 20.5 | |||
| Total imputed long-term debt and equity | $51.8 | $76.9 | $57.8 | |
| B. Cost of capital: | ||||
| Elements of capital costs: | ||||
| Short-term debt 20 | $13.5 × 2.3% = | $0.3 | $14.5 × 1.3% = | $0.2 |
| Long-term debt 23 | 3.9% = | 76.9 × 3.8% = | 3.0 | |
| Equity 21 | 51.8 × 13.3% = | 6.8 | 57.8 × 11.7% = | 6.7 |
| $7.1 | $9.9 | |||
| C. Incremental cost of PSR policy: | ||||
| Equity to meet policy | 13.3% = | 11.7% = | ||
| D. Other required PSAF costs: | ||||
| Sales taxes | $3.7 | $3.9 | ||
| ( printed page 1133) | ||||
| Board of Governors expenses | 7.0 | 5.1 | ||
| 10.7 | 9.0 | |||
| $17.8 | $18.9 | |||
| E. Total PSAF: | ||||
| As a percent of assets | 2.1% | 2.3% | ||
| As a percent of expenses | 3.3% | 4.1% | ||
| F. Tax rates | 22.2% | 22.7% | ||
| Assets | Risk weight | Weighted assets | |
|---|---|---|---|
| Imputed investments: | |||
| 1-Year Treasury securities 22 | $20.5 | ||
| Federal funds 23 | 253.0 | 0.2 | $50.6 |
| Total imputed investments | 273.5 | 50.6 | |
| Receivables | 36.7 | 0.2 | 7.3 |
| Materials and supplies | 0.6 | 1.0 | 0.6 |
| Prepaid expenses | 11.1 | 1.0 | 11.1 |
| Items in process of collection | 95.0 | 0.2 | 19.0 |
| Premises | 104.2 | 1.0 | 104.2 |
| Furniture and equipment | 32.8 | 1.0 | 32.8 |
| Leasehold improvements and long-term prepayments | 87.7 | 1.0 | 87.7 |
| Net pension asset | 23.6 | 1.0 | 23.6 |
| Deferred tax asset | 181.4 | 1.0 | 181.4 |
| Total | 846.6 | 518.3 | |
| Imputed equity: | |||
| Capital to risk-weighted assets | 10.0% | ||
| Capital to total assets | 6.1% |
C. Check Service —Table 7 shows the 2017 actual, 2018 estimated, and 2019 budgeted cost-recovery performance for the commercial check service.
| Year | Revenue | Total expense | Net income (ROE) | Targeted ROE | Recovery rate after targeted ROE (%) |
|---|---|---|---|---|---|
| 1 | 2 | 3 [1 - 2] | 4 | 5 [1/(2 + 4)] | |
| 2017 (actual) | 142.0 | 131.3 | 10.7 | 1.4 | 107.0 |
| 2018 (estimate) | 133.2 | 129.5 | 3.8 | 1.5 | 101.7 |
| 2019 (budget) | 128.3 | 124.8 | 3.4 | 1.5 | 101.5 |
1. 2018 Estimate —The Reserve Banks estimate that the check service will recover 101.7 percent of total expenses and targeted ROE, compared with a 2018 budgeted recovery rate of 101.6 percent. The expected decline in check volumes processed by the Reserve Banks continues to influence the check service's cost recovery.
Through August, total commercial forward and total commercial return check volumes were 7.6 percent and 7.2 percent lower, respectively, than they were during the same period last year. Consistent with anticipated fourth-quarter declines, for full-year 2018, the Reserve Banks estimate that their total forward check volume will decline 7.6 percent (compared with a budgeted decline of 4.7 percent) and their total return check volume will decline 7.7 ( printed page 1134) percent (compared with a budgeted decline of 3.5 percent) from 2017 levels.[24] While these volume declines will affect budgeted total revenue, the Reserve Banks estimate that total expenses will also be lower given the decline in those expenses directly correlated with volumes as well as the continued recognition of operational efficiencies. This has allowed for close alignment between budgeted and estimated 2018 cost recovery.
2. 2019 Pricing —The Reserve Banks expect the check service to recover 101.5 percent of total expenses and targeted ROE in 2019. The Reserve Banks project revenue to be $128.3 million, a decline of 3.7 percent from the 2018 estimate. This decline is driven in part by anticipated accelerating decline in the overall number of checks written, as well as by competition from correspondent banks, aggregators, and direct exchanges.[25] Total expenses for the check service are projected to be $124.8 million, a decrease of $4.7 million, or 3.6 percent, from 2018 expenses, primarily because of reduced operating costs, including cost savings associated with the Reserve Banks' customer support services.
The Reserve Banks evaluate and set tier assignments annually based on changes in the volume of items received by endpoints. In 2019, the Reserve Banks will reassign the tier placement of 1,116 forward and 240 return endpoints in the FedForward and FedReturn products, respectively.[26] Based on these 2019 tier assignments, the Reserve Banks will increase the FedForward Premium Daily Fee A, B, and C per item fees by $0.001 for Tier 3 and $0.003 for Tier 4, while also increasing to the Premium Daily Fee C daily fixed fee by $200, from $3,500 to $3,700. These price increases are intended to better align pricing between premium daily and standard deposit options.
The Reserve Banks will also lower the average daily forward receipt and return volume thresholds by approximately 6.0 percent for tiers 1, 2, 3, and 4 for FedForward® and FedReturn® image cash letter and daily fee deposit options based on the 2019 tier assignments.[27] These changes are intended to account for the anticipated continued decline in check deposit volumes. Tables 8, 9, 10, and 11 show the 2018 volume thresholds and the 2019 thresholds for the four tiered pricing structures.
| Tier | 2018 Average daily forward receipt volume items/day | 2019 Average daily forward receipt volume items/day |
|---|---|---|
| 1 | Over 65,000 | Over 61,000. |
| 2 | 10,001-65,000 | 9,401-61,000. |
| 3 | 750-10,000 | 700-9,400. |
| 4 | Less than 750 | Less than 700. |
| Tier | 2018 Average daily forward receipt volume items/day | 2019 Average daily forward receipt volume items/day |
|---|---|---|
| 0 | See explanation below * | See explanation below.* |
| 1 | Over 25,000 | Over 23,500. |
| 2 | 3,301-25,000 | 3,101-23,500. |
| 3 | 750-3,300 | 700-3,100. |
| 4 | Less than 750 | Less than 700. |
| * Tier 0 consists of financial institutions that meet both of the following criteria: | ||
| 1. Less than 10 percent of their Reserve Bank forward receipt volume was deposited with the Reserve Banks by Premium Daily Fee depositors during the sample period, and | ||
| 2. Their average daily Reserve Bank forward receipt volume exceeded 150 items per day during the sample period. | ||
| Tier 0 is intended to be a transitional tier: Once a financial institution is assigned to tier 1-4 or the substitute check tier, it cannot be assigned to tier 0. | ||
| Tier | 2018 Average daily return receipt volume items/day | 2019 Average daily return receipt volume items/day |
|---|---|---|
| 1 | Over 3,000 | Over 2,820. |
| 2 | 1,001-3,000 | 941-2,820. |
| 3 | 100-1,000 | 94-940. |
| 4 | Less than 100 | Less than 94. |
| Tier | 2018 Average daily return receipt volume items/day | 2019 Average daily return receipt volume items/day |
|---|---|---|
| 0 | See explanation below * | See explanation below.* |
| 1 | Over 1,500 | Over 1,410. |
| 2 | 501-1,500 | 471-1,410. |
| 3 | 100-500 | 94-470. |
| 4 | Less than 100 | Less than 94. |
| * Tier 0 consists of financial institutions with less than 10 percent of their Reserve Bank return receipt volume deposited with the Reserve Banks by Premium Daily Fee depositors during the sample period. | ||
| Tier 0 is intended to be a transitional tier: once a financial institution is assigned to tier 1-4 or the substitute check tier, it cannot be assigned to tier 0. | ||
The Reserve Banks will increase cash letter fees by $0.50 for all deadlines on the FedForward Standard, Deferred, Dollar-Culled, and Endpoint-Culled image cash letters and FedReturn Standard image cash letters. The Reserve Banks will also increase the FedReceipt Premium Delivery 8:00 a.m. EST target per-item fee by $0.006 and the Premium Delivery 10:00 a.m. target and 12:00 noon target per-item fees by $0.002.[28] Further, the Reserve Banks will increase FedReceipt Electronic Reject Repair fees by $0.05, increasing the Basic repair fee from $0.15 per item to $0.20 per item and increasing the Premium repair fee from $0.25 per item to $0.30 per item. Together, these changes are intended to facilitate longer-term cost recovery for the check service by increasing the proportion of fixed revenue while still providing price stability for customers in light of the anticipated continued decline in check volumes.
The Reserve Banks will continue increasing fees to encourage depositors to shift volume away from legacy paper-related products in light of today's electronic check-processing environment. Specifically, the Reserve Banks will increase all fees for the FedImage product and certain truncation fees by approximately 10.0 percent.[29] Table 12 shows the 2019 FedImage and Electronic Check Services fees.
| Fixed fee | Per item fee | |
|---|---|---|
| Image Archive: | ||
| Image Capture + 7 business day archive | $6.00 | $0.0090 |
| Image Capture On-Us Surcharge | 0.0212 | |
| 30 business day archive | 0.0011 | |
| 60 business day archive | 0.0013 | |
| 7-year archive/11-year archive | 0.0020 | |
| Dual archive (Transition period up to 120 days) | 0.0012 | |
| Extended dual archive (More than 120 days) | 0.0121 | |
| Back File Conversion | $4.25 | 0.0121 |
| Electronic On-Us Service | $4.25 | 0.0121 |
| Extended RAID Storage | ||
| 61 days to 6 months | 0.0010 | |
| 61 days to 12 months | 0.0024 | |
| 61 days to 24 months | 0.0061 | |
| Image Retrievals: | ||
| Retrievals to view via FedLine Web® inquiry | 0.4300 | |
| Retrievals to email via FedLine Web: | ||
| Request via FedLine Web inquiry | 0.4300 | |
| Recurring request | 0.4300 | |
| Image Access and Retrievals through a Gateway | 0.4300 | |
| Subscription Retrievals | 0.0026 | |
| Manual FedImage Requests (requests performed by FRB staff) | 7.2500 | |
| Image Delivery: | ||
| Physical Media: | ||
| CD-ROM Select Accounts Service—RAID | $18.15/CD-ROM | 0.0190 |
| CD-ROM—Tape | $18.15/CD-ROM | 0.1200 |
| Truncation: | ||
| Image Enhanced Truncation | $6.60 | 0.0110 |
| Return Item Retrieval—Fedline | 1.2700 |
Finally, the Reserve Banks will introduce two new fees as incentives to financial institutions to reduce errors in adjustment case submissions. The Reserve Banks will introduce a $0.50 fee for encoding error and duplicate payment adjustment cases caused by the depositary bank's incorrect encoding or duplicate deposit of an item. The ( printed page 1136) Reserve Banks will also introduce a $2.50 fee for automated adjustment case types that require manual intervention by Reserve Bank staff because of error on the part of the adjusting bank.[30] These new fees are intended to help drive efficiencies throughout the industry's check collection process by providing an incentive to financial institutions to improve the quality of their check deposit processing. In addition, the $2.50 fee will cover the staffing costs associated with manually handling cases that should have been automatically resolved. Table 13 shows the 2019 fees under Quality Improvement Initiatives for Electronic Check Collection.
| Product | Per case/ item fee |
|---|---|
| Check Adjustments—Deposit Quality Issues | $0.50 |
| Check Adjustments—Incorrect/Incomplete Case Opening | 2.50 |
| Return Deposit Exceptions—Items Qualified to the Federal Reserve as BOFD 31 | 15.00 |
The Reserve Banks estimate that the announced price changes will result in a 4.0 percent average price increase for check customers.
The primary risks to the Reserve Banks' ability to achieve budgeted 2019 cost recovery for the check service include greater-than-expected declines in check volume due to the general reduction in check writing and increased competition from correspondent banks, aggregators, and direct exchanges, which would result in lower-than-anticipated revenue.
D. FedACH Service —Table 14 shows the 2017 actual, 2018 estimate, and 2019 budgeted cost-recovery performance for the commercial FedACH service.
| Year | Revenue | Total expense | Net income (ROE) | Targeted ROE | Recovery rate after targeted ROE (%) |
|---|---|---|---|---|---|
| 1 | 2 | 3 [1 - 2] | 4 | 5 [1/(2 + 4)] | |
| 2017 (actual) | 141.3 | 140.0 | 1.3 | 1.6 | 99.8 |
| 2018 (estimate) | 149.2 | 150.4 | −1.2 | 1.9 | 98.0 |
| 2019 (budget) | 152.0 | 147.4 | 4.6 | 1.9 | 101.8 |
1. 2018 Estimate —The Reserve Banks estimate that the FedACH service will recover 98.0 percent of total expenses and targeted ROE, compared with a 2018 budgeted recovery rate of 96.1 percent. Through August, FedACH commercial origination and receipt volume was 7.5 percent higher than it was during the same period last year. For full-year 2018, the Reserve Banks estimate that FedACH commercial origination and receipt volume will increase 6.1 percent from 2017 levels, in line with the budgeted increase of 5.2 percent. However, investment costs associated with the multiyear technology initiative to modernize the FedACH processing platform are driving the overall under recovery rate.
2. 2019 Pricing —The Reserve Banks expect the FedACH service to recover 101.8 percent of total expenses and targeted ROE in 2019. FedACH commercial origination and receipt volume is projected to grow 3.3 percent, which, combined with anticipated incremental revenue from new services, is expected to contribute to an increase of $2.8 million in total revenue from the 2018 estimate. Total expenses are projected to decrease $3.0 million from 2018 expenses, primarily because of the reduction in costs associated with the development and expected completion in 2019 of the new FedACH technology platform.
The Reserve Banks will introduce a new Exception Resolution Service that provides an automated means for participants to manage ACH exceptions for entries settled through FedACH.[32] The Reserve Banks expect that automation of exception cases will improve efficiency of FedACH payments by streamlining existing time-consuming manual processes that banks use to manage exception cases. The Service is optional; customers will be able to originate an exception case directly through FedLine, through a third-party agent on their behalf, or through a Federal Reserve Bank on their behalf.
The Reserve Banks will not change fees for existing FedACH priced services.
The primary risks to the Reserve Banks' ability to achieve budgeted 2019 cost recovery for the FedACH service are unanticipated cost overruns associated with the FedACH technology modernization project and unanticipated volume reductions. ( printed page 1137)
E. Fedwire Funds and National Settlement Services —Table 15 shows the 2017 actual, 2018 estimate, and 2019 budgeted cost-recovery performance for the Fedwire Funds and National Settlement Services.
| Year | Revenue | Total expense | Net income (ROE) | Targeted ROE | Recovery rate after targeted ROE (%) |
|---|---|---|---|---|---|
| 1 | 2 | 3 [1 - 2] | 4 | 5 [1/(2 + 4)] | |
| 2017 (actual) | 129.7 | 120.8 | 8.9 | 1.3 | 106.2 |
| 2018 (estimate) | 132.2 | 124.4 | 7.8 | 1.5 | 105.0 |
| 2019 (budget) | 133.6 | 131.1 | 2.5 | 1.6 | 100.7 |
1. 2018 Estimate —The Reserve Banks estimate that the Fedwire Funds and National Settlement Services will recover 105.0 percent of total expenses and targeted ROE, compared with a 2018 budgeted recovery rate of 103.9 percent. Through August, Fedwire Funds Service online volume was 5.1 percent higher than it was during the same period last year. For full-year 2018, the Reserve Banks estimate that Fedwire Funds Services online volume will increase 3.2 percent from 2017 levels, compared with the 0.8 percent volume decrease that had been budgeted. Through August, the National Settlement Service (NSS) settlement file volume was 3.6 percent higher than it was during the same period last year, and settlement entry volume was 1.1 percent higher. For the full year, the Reserve Banks estimate that settlement file volume will increase 1.5 percent (in line with a budgeted increase of 1.3 percent) and settlement entry volume will decrease 2.3 percent from 2017 levels (compared with a budgeted 0.7 percent increase).
2. 2019 Pricing —The Reserve Banks expect the Fedwire Funds and National Settlement Services to recover 100.7 percent of total expenses and targeted ROE. Revenue is projected to be $133.6 million, an increase of 1.1 percent from the 2018 estimate. The Reserve Banks project total expenses to be roughly $6.7 million higher than 2018 expenses, primarily reflecting investments in new initiatives to improve resiliency and operational functionality.
The Reserve Banks will increase the offline send surcharge and offline receive surcharge for the Fedwire Funds Service from $60.00 to $65.00 in order to offset project costs related to the automation of Office of Foreign Asset Control (OFAC) screening within the offline process. The Reserve Banks estimate that the price changes, along with an expected increase in incentive discount-eligible volume, will ultimately result in an overall 2.0 percent average price increase for Fedwire Funds customers.
The Reserve Banks will not change NSS fees for 2019.
The primary risk to the Reserve Banks' ability to achieve budgeted 2019 cost recovery for these services is an overrun in costs from new initiatives to improve resiliency and operational functionality. Unanticipated decreases in volume may also negatively impact cost recovery.
F. Fedwire Securities Service —Table 16 shows the 2017 actual, 2018 estimate, and 2019 budgeted cost-recovery performance for the Fedwire Securities Service.[33]
| Year | Revenue | Total expense | Net income (ROE) | Targeted ROE | Recovery rate after targeted ROE (%) |
|---|---|---|---|---|---|
| 1 | 2 | 3 [1 - 2] | 4 | 5 [1/(2 + 4)] | |
| 2017 (actual) | 28.6 | 27.3 | 1.3 | 0.3 | 103.6 |
| 2018 (estimate) | 27.1 | 27.7 | −0.7 | 0.3 | 96.5 |
| 2019 (budget) | 26.4 | 27.5 | −1.1 | 0.3 | 94.7 |
1. 2018 Estimate —The Reserve Banks estimate that the Fedwire Securities Service will recover 96.5 percent of total expenses and targeted ROE, compared with a 2018 budgeted recovery rate of 97.6 percent. The Reserve Banks estimate revenue to be $27.1 million, a decrease of 5.3 percent from the 2018 budget. Total expenses are projected to be $27.7 million for full-year 2018, an increase of 1.7 percent from the 2018 budget.
Through August, Fedwire Securities Service online agency transfer volume was 2.3 percent lower than it was during the same period last year. For full-year 2018, the Reserve Banks estimate that Fedwire Securities Service online agency transfer volume will decline 4.8 percent from 2017 levels, compared with a budgeted decline of ( printed page 1138) 15.4 percent. This decrease in online agency transfer volume primarily reflects two market trends. First, a continuation of interest rate increases in 2018 has led to a decrease in mortgage refinance volume and issuance, which in turn has led to a decrease in settlement activity for agency mortgage-backed securities over Fedwire Securities. Second, JP Morgan Chase (JPMC) has recently completed its exit from the broker-dealer services business, resulting in Bank of New York Mellon generally serving as the sole clearing bank for government securities. As a result of this market shift, online agency transfer volume is expected to decrease through year-end 2018. These structural changes within the government securities clearing and settlement market are expected to continue to affect online transfer volumes through 2019.
For full-year 2018, volumes for the Fedwire Securities' two largest revenue-generating services—account maintenance and issue maintenance—are expected to decline from 2017 levels. Through August, account maintenance volume was 5.3 percent lower than it was during the same period last year. For full-year 2018, the Reserve Banks estimate that account maintenance volume will decline 5.0 percent from 2017 levels, compared with a budgeted decline of 3.2 percent. The higher-than-expected account maintenance volume decline is largely the result of joint custody account closures. Through August, the number of agency issues maintained was 3.9 percent lower than it was during the same period last year. For full-year 2018, the Reserve Banks estimate that the number of agency issues maintained will decline 4.7 percent from 2017 levels, compared with a budgeted decline of 1.4 percent.
2. 2019 Pricing —The Reserve Banks expect the Fedwire Securities Service to recover 94.7 percent of total expenses and targeted ROE in 2019. Revenue is projected to be $26.4 million, a decrease of 2.6 percent from the 2018 estimate. The Reserve Banks also project that 2019 expenses will remain relatively flat, decreasing by $0.2 million from the 2018 estimate. Significant drivers of 2019 operating costs include investments to advance new initiatives to improve resiliency and operational functionality.
As JPMC finalizes its reallocation of holdings and ongoing market changes reach steady state, the Reserve Banks project that online agency transfer volume will remain relatively flat, with a slight increase of 0.8 percent in 2019. Additionally, the volume of accounts maintained will likely decrease 5.6 percent, and the volume of agency issues maintained will likely decrease 15.5 percent.[34] Account maintenance volume is expected to continue to decline in 2019 because of ongoing joint custody account closures driven by state-level collateral program changes. Issue maintenance volume is expected to decline because of cost allocation adjustments necessitated by the completion of the Fedwire Modernization Program, and new securities related to the Federal Home Loan Mortgage Corporation's securities exchange program in advance of the Federal Housing Finance Agency's Single Security Initiative.
The Reserve Banks will increase the online agency transfer fee from $0.77 to $0.98. Processing costs for online agency transfers and online Treasury transfers are nearly identical, yet the corresponding fees are different; therefore, the fee change is intended to bring the two fees into better alignment.[35] Additionally, the Reserve Banks will increase the automated claims adjustment processing fee from $0.80 to $1.00. This fee increase will offset costs associated with the automated claims adjustment processing expansion project, which is scheduled to go live at year-end 2019. The Reserve Banks estimate that the combined price changes will result in a 6.0 percent average price increase for Fedwire Securities customers.
The primary risks to the Reserve Banks' ability to achieve budgeted 2019 cost recovery for these services are lower-than-expected volume resulting from the pace of structural changes in government securities clearing and settlement, and higher-than-expected costs from new initiatives to improve resiliency and operational functionality.
G. FedLine Access —The Reserve Banks charge fees for the electronic connections that depository institutions use to access priced services and allocate the costs and revenue associated with this electronic access to the various priced services. There are currently six FedLine channels through which customers can access the Reserve Banks' priced services: FedMail, FedLine Exchange, FedLine Web, FedLine Advantage, FedLine Command, and FedLine Direct.[36] The Reserve Banks bundle these channels into eleven FedLine packages, described below, that are supplemented by a number of premium (or à la carte) access and accounting information options. In addition, the Reserve Banks offer FedComplete packages, which are bundled offerings of FedLine connections and a fixed number of FedACH, Fedwire Funds, and Check 21-enabled transactions.
Eight attended access packages offer manual access to critical payment and information services via a web-based interface. The FedMail package provides access to basic information services via email, while the two FedLine Exchange packages are designed to provide certain services, such as the E-Payments Routing Directory, to customers that otherwise do not use FedLine for any payment services. The two FedLine Web packages offer online attended access to a range of services, including cash services, FedACH information services, and Check services. Three FedLine Advantage packages expand upon the FedLine Web packages and offer attended access to critical transactional services: FedACH, Fedwire Funds, and Fedwire Securities.
Three unattended access packages are computer-to-computer, IP-based interfaces. The FedLine Command package offers an unattended connection to FedACH as well as to most accounting information services. The two remaining options are FedLine Direct packages, which allow for unattended connections at one of two connection speeds to FedACH, Fedwire Funds, and Fedwire Securities transactional and information services and to most accounting information services.[37]
In 2019, the Reserve Banks will offer upgraded FedLine Direct Plus and FedLine Direct Premier packages, at monthly fees of $5,500 and $10,500 respectively, in order to reflect improved network resiliency, efficiency in supporting all payments traffic, and availability of higher network speeds.[38] Historically, the Reserve Banks' FedLine ( printed page 1139) Direct connections were not able to support all payment traffic including Check Services because of limitations in network speed and ability to manage bandwidth.
The Reserve Banks will also increase the monthly fee for the current (legacy) FedLine Direct Plus solution by $350, from $3,650 to $4,000. Existing customers can use the current (legacy) FedLine Plus and Premier solutions and Check 21 Large File Delivery but will eventually need to convert to the enhanced FedLine Direct Solutions. Existing users should expect the legacy solutions to be retired and plan migration efforts to the new service packages beginning in late 2018. The Reserve Banks will also increase the à la carte Network Diversity monthly fee by $500, from $2,000 to $2,500.[39]
Table 17 provides a summary of the attributes and 2019 pricing for legacy and upgraded FedLine Direct packages:
| Legacy 40 | 2019 41 | |
|---|---|---|
| FedLine Direct Plus: | ||
| Connection Speed | 256 Kbps | 2 Mbps. |
| Dual Vendors | N/A | Included. |
| Check 21 Services | Available à la carte | Included. |
| Server Certificates | Two included | Included. |
| Network Diversity | None included | None included. |
| Contingency Solution | Available à la carte | Included. |
| Additional WANs | None included | None included. |
| VPNs | One included | One included. |
| Bundled FedLine Channels | Web, Advantage, Command | Web, Advantage, Command. |
| Price | $4,000.00 | $5,500.00. |
| FedLine Direct Premier: | ||
| Connection Speed | 1.5 Mbps | 2 Mbps. |
| Dual Vendors | N/A | Included. |
| Check 21 Services | Available à la carte | Included. |
| Server Certificates | Two included | Included. |
| Network Diversity | None included | One included. |
| Contingency Solution | Available à la carte | Included. |
| Additional WANs | None included | One included. |
| VPNs | Two included | Two included. |
| Bundled FedLine Channels | Web, Advantage, Command | Web, Advantage, Command. |
| Price | $6,800.00 | $10,500.00. |
In addition, the Reserve Banks will eliminate specific à la carte fees and services for current FedLine packages. The Reserve Banks will discontinue offering FedLine Command server certificates as a separate monthly fee. FedLine Command server certificates will be included in FedLine Command packages for no additional cost. Including these certificates in FedLine Command packages is similar to current practices for upgraded FedLine Direct packages and will result in a consistent customer experience across both product lines. The Reserve Banks will also discontinue offering the Accounting Totals by Service (ACTS) report as an Accounting Service option for customers, because of low usage. In addition, the Reserve Banks will discontinue offering new FedMail Fax subscriptions to customers, in order to encourage them to move to more modern and secure technology that meets industry standards and enhances their experience.
The Reserve Banks estimate that the price changes will result in a 7.5 percent average price increase for FedLine customers. This increase is primarily driven by the changes to FedLine Direct Plus and Premier packages that provide enhanced network options.
II. Analysis of Competitive Effect
All operational and legal changes considered by the Board that have a substantial effect on payment system participants are subject to the competitive impact analysis described in the March 1990 policy “The Federal Reserve in the Payments System.” [42] Under this policy, the Board assesses whether proposed changes would have a direct and material adverse effect on the ability of other service providers to compete effectively with the Federal Reserve in providing similar services because of differing legal powers or constraints or because of a dominant market position deriving from such legal differences. If any proposed changes create such an effect, the Board must further evaluate the changes to assess whether the benefits associated with the changes—such as contributions to payment system efficiency, payment system integrity, or other Board objectives—can be achieved while minimizing the adverse effect on competition.
The 2019 fees, fee structures, and changes in service will not have a direct and material adverse effect on the ability of other service providers to compete effectively with the Reserve Banks in providing similar services. The changes should permit the Reserve Banks to earn a ROE that is comparable to overall market returns and provide for full cost recovery over the long run.
III. 2019 Fee Schedules ( printed page 1140)
| Fee | |
|---|---|
| FedACH minimum monthly fee: | |
| Originating Depository Financial Institution (ODFI) 43 | $50.00. |
| Receiving Depository Financial Institution (RDFI) 44 | $40.00. |
| Origination (per item or record): | |
| Forward or return items | $0.0035. |
| SameDay Service—forward item 45 | $0.0010 surcharge. |
| Addenda record | $0.0015. |
| FedLine Web-originated returns and notification of change (NOC) 46 | $0.35. |
| Facsimile Exception Return/NOC 47 | $45.00. |
| SameDay Exception Return | $45.00. |
| Automated NOC | $0.20. |
| Volume-based discounts (based on monthly billed origination volume) 48 per item when origination volume is: | |
| 750,001 to 1,500,000 items per month | $0.0008 discount. |
| more than 1,500,000 items per month | $0.0010 discount. |
| Volume-based discounts (based on monthly billed receipt volume) 49 per item when receipt volume is: | |
| 10,000,001 to 15,000,000 items per month | $0.0002 discount. |
| more than 15,000,000 items per month | $0.0003 discount. |
| Receipt (per item or record): | |
| Forward Item | $0.0035. |
| Return Item | $0.0075. |
| Addenda record | $0.0015. |
| Volume-based discounts: | |
| Non-Premium Receivers 50 per item when volume is: | |
| 750,001 to 12,500,000 items per month 51 | $0.0017 discount. |
| more than 12,500,000 items per month 52 | $0.0019 discount. |
| Premium Receivers, Level One 53 per item when volume is: | |
| 750,001 to 1,500,000 items per month 51 | $0.0017 discount. |
| 1,500,001 to 2,500,000 items per month 52 | $0.0017 discount. |
| 2,500,001 to 12,500,000 items per month 52 | $0.0018 discount. |
| more than 12,500,000 items per month 52 | $0.0020 discount. |
| Premium Receivers, Level Two 54 per item when volume is: | |
| 750,001 to 1,500,000 items per month 51 | $0.0017 discount. |
| 1,500,001 to 2,500,000 items per month 52 | $0.0017 discount. |
| 2,500,001 to 12,500,000 items per month 52 | $0.0019 discount. |
| more than 12,500,000 items per month 52 | $0.0021 discount. |
| FedACH Bundled Package Pricing Discount: | |
| Monthly Bundled Service Package Discount 55 | $20.00 discount. |
| Monthly FedACH Risk® Management fees: 56 | |
| For up to 5 criteria sets | $35.00. |
| For 6 through 11 criteria sets | $70.00. |
| For 12 through 23 criteria sets | $125.00. |
| For 24 through 47 criteria sets | $150.00. |
| For 48 through 95 criteria sets | $250.00. |
| For 96 through 191 criteria sets | $425.00. |
| For 192 through 383 criteria sets | $675.00. |
| For 384 through 584 criteria sets | $850.00. |
| For more than 584 criteria sets | $1,100.00. |
| Risk origination monitoring batch (based on total monthly volume): | |
| For 1 through 100,000 batches (per batch) | $0.007. |
| For more than 100,000 batches (per batch) | $0.0035. |
| Monthly FedPayments® Reporter Service: | |
| FedPayments Reporter Service package pricing includes: | |
| ACH Received Entries Detail—Customer and Depository Financial Institution | |
| ACH Return Reason Report—Customer and Depository Financial Institution | |
| ACH Volume Summary by SEC Code—Customer | |
| Customer Transaction Activity | |
| Death Notification | |
| International (IAT) | |
| Notification of Change | |
| Payment Data Information File | |
| Remittance Advice Detail | |
| Remittance Advice Summary | |
| Return Item Return Ratio | |
| Social Security Beneficiary | |
| Originator Setup | |
| Report Delivery via FedLine Access Solution | |
| On Demand Surcharge | $1.00. |
| Fee | |
|---|---|
| Report delivery via FedLine file access solution (monthly fee): | |
| For up to 50 reports | $40.00. |
| For 51 through 150 reports | $60.00. |
| For 151 through 500 reports | $110.00. |
| For 501 through 1,000 reports | $200.00. |
| For 1,001 through 1,500 reports | $285.00. |
| For 1,501 through 2,500 reports | $460.00. |
| For 2,501 through 3,500 reports | $640.00. |
| For 3,501 through 4,500 reports | $820.00. |
| For 4,501 through 5,500 reports | $995.00. |
| For 5,501 through 7,000 reports | $1,225.00. |
| For 7,001 through 8,500 reports | $1,440.00. |
| For 8,501 through 10,000 reports | $1,650.00. |
| For more than 10,000 reports | $1,800.00. |
| Premier reports (per report generated): 57 | |
| ACH Volume Summary by SEC Code Report—Depository Financial Institution: | |
| For 1 through 5 reports | $10.00. |
| For 6 through 10 reports | $6.00. |
| For 11 or more reports | $1.00. |
| On Demand Surcharge | $1.00. |
| ACH Routing Number Activity Report: | |
| For 1 through 5 reports | $10.00. |
| For 6 through 10 reports | $6.00. |
| For 11 or more reports | $1.00. |
| On Demand Surcharge | $1.00. |
| ACH Originated Batch Report (monthly): | |
| For 1 through 5 reports | $10.00. |
| For 6 through 10 reports | $6.00. |
| For 11 or more reports | $1.00. |
| On Demand Surcharge | $1.00. |
| ACH Originated Batch Report (daily): | |
| Scheduled Report | $0.65. |
| On Demand Surcharge | $1.00. |
| On-us inclusion: | |
| Participation (monthly fee per RTN) | $10.00. |
| Per-item | $0.0030. |
| Per-addenda | $0.0015. |
| Report delivery via encrypted email (per email) | $0.20. |
| Other Fees and Discounts: | |
| Monthly fee (per RTN): | |
| FedACH Participation Fee 58 | $65.00. |
| SameDay Service Origination Participation Fee 59 | $10.00. |
| FedACH Settlement Fee 60 | $55.00. |
| FedACH Information File Extract Fee | $150.00. |
| IAT Output File Sort Fee | $75.00. |
| Fixed Participation Fee—Automated NOCs 61 | $5.00. |
| Non-Electronic Input/Output fee: 62 | |
| CD/DVD (CD or DVD) | $50.00. |
| Paper (file or report) | $50.00. |
| Fees and Credits Established by NACHA: 63 | |
| NACHA Same Day Entry fee (per item) | $0.052. |
| NACHA Same Day Entry credit (per item) | $0.052 (credit). |
| NACHA Unauthorized Entry fee (per item) | $4.50. |
| NACHA Unauthorized Entry credit (per item) | $4.50 (credit). |
| NACHA Admin Network fee (monthly fee per RTN) | $22.00. |
| NACHA Admin Network fee (per entry) | $0.000185. |
| FedGlobal® ACH Payments: 64 | |
| Fixed Monthly Fee (per RTN): 65 | |
| Monthly origination volume more than 500 items | $185.00. |
| Monthly origination volume between 161 and 500 items | $60.00. |
| Monthly origination volume less than 161 items | $20.00. |
| Per-item Origination Fee for Monthly Volume more than 500 Items (surcharge): 66 | |
| Canada service | $0.50. |
| Mexico service | $0.55. |
| Panama service | $0.60. |
| Europe service | $1.13. |
| Per-item Origination Fee for Monthly Volume between 161 and 500 items (surcharge): 66 | |
| Canada service | $0.75. |
| Canada service | $1.00. |
| Mexico service | $1.05. |
| Panama service | $1.10. |
| Fee | |
|---|---|
| Europe service | $1.63. |
| Other FedGlobal ACH Payments Fees: | |
| Canada service: | |
| Return received from Canada 67 | $0.99 (surcharge). |
| Trace of item at receiving gateway | $5.50. |
| Trace of item not at receiving gateway | $7.00. |
| Mexico service: | |
| Return received from Mexico 67 | $0.91 (surcharge). |
| Item trace | $13.50. |
| Foreign currency to foreign currency (F3X) item originated to Mexico 66 | $0.67 (surcharge). |
| Panama service: | |
| Return received from Panama 67 | $1.00 (surcharge). |
| Item trace | $7.00. |
| NOC | $0.72. |
| Europe service: | |
| F3X item originated to Europe 66 | $1.25 (surcharge). |
| Return received from Europe 67 | $1.35 (surcharge). |
| Item trace | $7.00. |
| Exception Resolution Service: 68 | |
| Fixed Fee per RTN: 69 | |
| Self-Managed Cases | $10.00 . |
| Agent-Managed Cases | $10.00 . |
| Federal Reserve Bank-Managed Cases | $60.00 . |
| Federal Reserve Bank-Managed Cases | |
| Case Open Fee | $5.00 . |
| Case Response Fee | $5.00 . |
| Variable Case Open Fees (applies to self-managed and agent-managed cases only at the parent RTN): 70 | |
| 1-50 cases | $1.25 . |
| 51-100 cases | $1.00 . |
| 101-500 cases | $0.75 . |
| 501-1,000 cases | $0.50 . |
| 1,001-5,000 cases | $0.25 . |
| 5,001-10,000 cases | $0.20 . |
| 10,001-99,999,999 cases | $0.10 . |
| Fee | |
|---|---|
| Fedwire Funds Service | |
| Monthly Participation Fee | $95.00 |
| Basic volume-based pre-incentive transfer fee (originations and receipts)—per transfer for the first 14,000 transfers per month | 0.820 |
| additional transfers up to 90,000 per month | 0.245 |
| every transfer over 90,000 per month | 0.160 |
| Volume-based transfer fee with the incentive discount (originations and receipts)—per eligible transfer for: 71 | |
| the first 14,000 transfers per month | 0.164 |
| additional transfers up to 90,000 per month | 0.049 |
| every transfer over 90,000 per month | 0.032 |
| Surcharge for Offline Transfers (Originations and Receipts) | 65.00 |
| Surcharge for End-of-Day Transfer Originations 72 | 0.26 |
| Monthly FedPayments Manager import/export fee 73 | 50.00 |
| Surcharge for high-value payments: | |
| >$10 million | 0.14 |
| >$100 million | 0.36 |
| Surcharge for Payment Notification: | |
| Origination Surcharge 74 | 0.01 |
| Receipt Volume 75 | N/A |
| Delivery of Reports—Hard Copy Reports to On-Line Customers | 50.00 |
| Special Settlement Arrangements (charge per settlement day) 76 | 150.00 |
| National Settlement Service | |
| Basic: | |
| Settlement Entry Fee | 1.50 |
| Settlement File Fee | 30.00 |
| Surcharge for Offline File Origination 77 | 45.00 |
| Minimum Monthly Fee 78 | 60.00 |
| Fee | |
|---|---|
| Basic Transfer Fee: | |
| Transfer or reversal originated or received | $0.98 |
| Surcharge: 79 | |
| Offline origination & receipt surcharge | 80.00 |
| Monthly Maintenance Fees: | |
| Account maintenance (per account) | 57.50 |
| Issue maintenance (per issue/per account) | 0.77 |
| Claims Adjustment Fee 80 | 1.00 |
| GNMA Serial Note Stripping or Reconstitution Fee 81 | 9.00 |
| Joint Custody Origination Surcharge 82 | 46.00 |
| Delivery of Reports—Hard Copy Reports to On-Line Customers | 50.00 |
| Fee | |
|---|---|
| FedComplete Packages (monthly) 83 84 85 | |
| FedComplete 100A Plus | $825.00. |
| includes: | |
| FedLine Advantage Plus package | |
| FedLine subscriber 5-pack | |
| 7,500 FedForward transactions | |
| 46 FedForward Cash Letter items | |
| 70 FedReturn transactions | |
| 14,000 FedReceipt® transactions | |
| 35 Fedwire Funds origination transfers | |
| 35 Fedwire Funds receipt transfers | |
| Fedwire participation fee | |
| 1,000 FedACH origination items | |
| FedACH minimum fee—Forward Origination | |
| 7,500 FedACH receipt items | |
| FedACH receipt minimum fee | |
| 10 FedACH web return/NOC | |
| 500 FedACH addenda originated | |
| 1,000 FedACH addenda received | |
| 100 FedACH Same-Day origination items | |
| FedACH account servicing | |
| FedACH settlement | |
| FedACH Same-Day origination participation fee | |
| FedComplete 100A Premier | $900.00. |
| includes: | |
| FedLine Advantage Premier package | |
| Volumes included in the FedComplete 100A Plus package | |
| FedComplete 100C Plus | $1,375.00. |
| includes: | |
| FedLine Command Plus package | |
| Volumes included in the FedComplete 100A Plus package | |
| FedComplete 200A Plus | $1,350.00. |
| includes: | |
| FedLine Advantage Plus package | |
| FedLine subscriber 5-pack | |
| 25,000 FedForward transactions | |
| 46 FedForward Cash Letter items | |
| 225 FedReturn transactions | |
| 25,000 FedReceipt transactions | |
| 100 Fedwire Funds origination transfers | |
| 100 Fedwire Funds receipt transfers | |
| Fedwire participation fee | |
| 2,000 FedACH origination items | |
| FedACH minimum fee—forward origination | |
| 25,000 FedACH receipt items | |
| FedACH receipt minimum fee | |
| 20 FedACH web return/NOC | |
| 750 FedACH addenda originated | |
| 1,500 FedACH addenda received | |
| 200 FedACH Same-Day origination items | |
| FedACH account servicing | |
| FedACH settlement | |
| FedACH Same-Day origination participation fee | |
| FedComplete 200A Premier | $1,425.00. |
| includes: | |
| FedLine Advantage Premier package | |
| Volumes included in the FedComplete 200A Plus package | |
| FedComplete 200C Plus | $1,900.00. |
| includes: | |
| FedLine Command Plus package | |
| Volumes included in the FedComplete 200A Plus package | |
| FedComplete Excess Volume and Receipt Surcharge: 86 | |
| FedForward 87 | $0.037/item. |
| FedReturn | $0.8200/item. |
| FedReceipt | $0.00005/item. |
| Fedwire Funds Origination | $0.8200/item. |
| Fedwire Funds Receipt | $0.082/item. |
| FedACH Origination | $0.0035/item. |
| FedACH Receipt | $0.00035/item. |
| FedComplete credit adjustment | various. |
| FedComplete debit adjustment | various. |
| FedLine Customer Access Solutions (monthly) | |
| FedMail 88 | $85.00. |
| includes: | |
| FedMail access channel | |
| Check FedFoward, Fed Return and FedReceipt Services | |
| FedACH Download Advice and Settlement Information | |
| ( printed page 1145) | |
| Fedwire Funds Offline Advices | |
| Check 21 Duplicate Notification Service | |
| Check Adjustments | |
| Funds Offline Advices | |
| Daily Statement of Account (Text) | |
| Daylight Overdraft Reports | |
| Monthly Statement of Service Charges (Text) | |
| Electronic Cash Difference Advices | |
| FedLine Exchange 88 | $40.00. |
| includes: | |
| E-Payments Directory (via manual download) | |
| FedLine Exchange Premier 88 | $125.00. |
| includes: | |
| FedLine Exchange package | |
| E-Payments Routing Directory (via auto download) | |
| FedLine Web 89 | $110.00. |
| includes: | |
| FedLine Web access channel | |
| Services included in the FedLine Exchange package | |
| Check FedForward, FedReturn and FedReceipt services | |
| Check 21 Duplicate Notification Service | |
| Check Adjustments | |
| FedACH Derived Returns and NOCs | |
| FedACH File, Batch and Item Detail Information | |
| FedACH Customer Profile Information | |
| FedACH Returns Activity Statistics | |
| FedACH Risk RDFI Alert Service | |
| FedACH Risk Returns Reporting Service | |
| FedCash® Services | |
| FedLine Web Plus 89 | $160.00. |
| includes: | |
| FedLine Web package | |
| FedACH Risk Origination Monitoring Service | |
| FedACH FedPayments Reporter Service | |
| Check Large Dollar Return | |
| Check FedImage Services | |
| Account Management Information (AMI) | |
| Daily Statement of Account (PDF, Text) | |
| Monthly Account Services (SCRD File, Monthly Statement of Service Charges | |
| (PDF), Monthly Statement of Service Charges (Text)) | |
| E-Payments Routing Directory (auto download) | |
| FedLine Advantage 89 | $415.00. |
| includes: | |
| FedLine Advantage access channel | |
| One VPN device | |
| Services included in the FedLine Web package | |
| FedACH transactions | |
| Fedwire Originate and Receive Funds Transfer | |
| Fedwire Originate and Receive Securities Transfer | |
| National Settlement Service transactions | |
| Check Large Dollar Return | |
| Check FedImage Services | |
| Account Management Information with Intra-Day Download Search File | |
| Daily Statement of Account (PDF, Text) | |
| Monthly Account Services (SCRD File, Monthly Statement of Service Charges | |
| (PDF), Monthly Statement of Service Charges (Text)) | |
| FedLine Advantage Plus 89 | $460.00. |
| includes: | |
| FedLine Advantage package | |
| One VPN device | |
| FedACH Risk Origination Monitoring Service | |
| FedACH FedPayments Reporter Service | |
| Fedwire Funds FedPayments Manager Import/Export (less than or equal to 250 | |
| Fedwire transactions and one routing number per month) | |
| FedTransaction Analyzer® (less than 250 or equal to Fedwire transactions and one routing number per month) | |
| E-Payments Routing Directory (via auto download) | |
| FedLine Advantage Premier 89 | $570.00. |
| includes: | |
| FedLine Advantage Plus package | |
| Two VPN devices | |
| Fedwire Funds FedPayments Manager Import/Export (more than 250 Fedwire transactions or more than one routing number in a given month) | |
| FedTransaction Analyzer (more than 250 Fedwire transactions or more than one routing number per month) | |
| FedLine Command Plus | $1,035.00. |
| includes: | |
| FedLine Command access channel | |
| Services included in the FedLine Advantage Plus package | |
| One VPN device | |
| FedLine Command server certificates | |
| Fedwire Statement Services | |
| ( printed page 1146) | |
| Fedwire Funds FedPayments Manager Import/Export | |
| FedTransaction Analyzer | |
| Intra-Day File (I-Day CI File) | |
| Statement of Account Spreadsheet File (SASF) | |
| Financial Institution Reconcilement Data File (FIRD) | |
| Billing Data Format File (BDFF) | |
| FedLine Direct Plus (Legacy) 90 | $4,000.00. |
| includes: | |
| FedLine Direct access channel | |
| One VPN device | |
| 256K Dedicated WAN Connection | |
| Services included in the FedLine Command Plus package | |
| Two FedLine Direct server certificates | |
| Daily Overdraft Reports | |
| Treasury Check Information System (TCIS) | |
| FedLine Direct Plus | $5,500.00. |
| includes: | |
| FedLine Direct access channel | |
| One VPN device | |
| 2 Mbps Dedicated WAN Connection | |
| Services included in the FedLine Command Plus package | |
| FedLine Direct server certificates | |
| Treasury Check Information System (TCIS) | |
| Dual Vendors | |
| FedLine Direct Contingency Solution (ACH) | |
| Check 21 Services | |
| FedLine Direct Premier (Legacy) 90 | $6,800.00. |
| includes: | |
| FedLine Direct Plus package (legacy) | |
| T1 dedicated WAN connection | |
| Two VPN devices | |
| FedLine Direct Premier | $10,500.00. |
| includes: | |
| FedLine Direct Plus package (new) | |
| One additional dedicated WAN connection | |
| One Network Diversity | |
| Two VPN devices | |
| A la carte options (monthly) 91 | |
| Electronic Access: | |
| FedMail—FedLine Exchange Subscriber 5-pack | $15.00. |
| FedLine Subscriber 5-pack (access to Web and Advantage) | $80.00. |
| Additional FedLine Direct Certificate 92 | $100.00. |
| Additional VPNs 93 | $100.00. |
| Additional WAN connections | |
| 256K(Legacy) 90 | $2,500.00. |
| T1 (Legacy) 90 | $3,200.00. |
| 2 Mbps | $3,000.00. |
| WAN Connection Upgrade: | |
| 10 Mbps 94 | $1,700.00. |
| 30 Mbps 94 | $3,000.00. |
| 50 Mbps 94 | $4,000.00. |
| 100 Mbps 94 | $7,000.00. |
| 200 Mbps 94 | $11,000.00. |
| FedLine International Setup (one-time fee) | $5,000.00. |
| FedLine Custom Implementation Fee 95 | various. |
| Network Diversity | $2,500.00. |
| FedLine Direct Contingency Solution 96 | $1,000.00. |
| Check 21 Large File Delivery 97 | various. |
| FedMail Email (for customers with FedLine Web and above) 98 | $20.00. |
| FedMail Fax 99 | $100.00. |
| VPN Device Modification | $200.00. |
| VPN Device Missed Activation Appointment | $175.00. |
| VPN Device Expedited Hardware Surcharge | $100.00. |
| VPN Device Replacement or Move | $300.00. |
| E-Payments Automated Download (1-5 Add'l Codes) | $75.00. |
| E-Payments Automated Download (6-20 Add'l Codes) | $150.00. |
| E-Payments Automated Download (21-50 Add'l Codes) | $300.00. |
| E-Payments Automated Download (51-100 Add'l Codes) | $500.00. |
| E-Payments Automated Download (101-250 Add'l Codes) | $1,000.00. |
| E-Payments Automated Download (>250 Add'l Codes) | $2,000.00. |
| Accounting Information Services (monthly): | |
| Cash Management System (CMS) Plus—Own report—up to six files with: 100 | |
| no respondent/sub-account activity | $60.00. |
| less than 9 respondent and/or sub-accounts | $125.00. |
| 10-50 respondent and/or sub-accounts | $250.00. |
| Fee | |
|---|---|
| 51-100 respondents and/or sub-accounts | $500.00. |
| 101-500 respondents and/or sub-accounts | $750.00. |
| >500 respondents and/or sub-accounts | $1,000.00. |
| End-of-Day Financial Institution Reconcilement Data (FIRD) File 101 | $150.00. |
| Statement of Account Spreadsheet File 102 | $150.00. |
| Intra-day Download Search File (with AMI) 103 | $150.00. |
| Other | |
| Software Certification | $0.00 to $8,000.00. |
| Vendor Pass-Through Fee | various. |
| Electronic Access Credit Adjustment | various. |
| Electronic Access Debit Adjustment | various. |
By order of the Board of Governors of the Federal Reserve System, November 15, 2018.
Ann Misback,
Secretary of the Board.