Energy Conservation Program: Energy Conservation Standards for Circulator Pumps
The Energy Policy and Conservation Act, as amended ("EPCA"), prescribes energy conservation standards for various consumer products and certain commercial and industrial equipme...
Office of Energy Efficiency and Renewable Energy, Department of Energy.
ACTION:
Final rule.
SUMMARY:
The Energy Policy and Conservation Act, as amended (“EPCA”), prescribes energy conservation standards for various consumer products and certain commercial and industrial equipment, including circulator pumps. EPCA also requires the U.S. Department of Energy (“DOE”) to periodically determine whether more-stringent, standards would be technologically feasible and economically justified, and would result in significant energy savings. In this final rule, DOE is adopting new energy conservation standards for circulator pumps. It has determined that the energy conservation standards for this equipment would result in significant conservation of energy, and are technologically feasible and economically justified.
DATES:
The effective date of this rule is August 5, 2024. Compliance with the standards established for circulator pumps in this final rule is required on and after May 22, 2028.
ADDRESSES:
The docket for this rulemaking, which includes
Federal Register
notices, public meeting attendee lists and transcripts, comments, and other supporting documents/materials, is available for review at
www.regulations.gov.
All documents in the docket are listed in the
www.regulations.gov
index. However, not all documents listed in the index may be publicly available, such as information that is exempt from public disclosure.
The docket web page can be found at
www.regulations.gov/docket/EERE-2016-BT-STD-0004.
The docket web page contains instructions on how to access all documents, including public comments, in the docket.
For further information on how to review the docket, contact the Appliance and Equipment Standards Program staff at (202) 287-1445 or by email:
ApplianceStandardsQuestions@ee.doe.gov.
FOR FURTHER INFORMATION CONTACT:
Mr. Jeremy Dommu, U.S. Department of Energy, Office of Energy Efficiency and Renewable Energy, Building Technologies Office, EE-5B, 1000 Independence Avenue SW, Washington, DC 20585-0121. Telephone: (202) 586-9870. Email:
ApplianceStandardsQuestions@ee.doe.gov.
Mr. Uchechukwu “Emeka” Eze, U.S. Department of Energy, Office of the General Counsel, GC-33, 1000 Independence Avenue SW, Washington, DC 20585-0121. Telephone: (240) 961-8879. Email:
uchechukwu.eze@hq.doe.gov.
SUPPLEMENTARY INFORMATION:
Table of Contents
I. Synopsis of the Final Rule
A. Benefits and Costs to Consumers
B. Impact on Manufacturers
C. National Benefits and Costs
D. Conclusion
II. Introduction
A. Authority
B. Background
III. General Discussion
A. November 2016 CPWG Recommendations
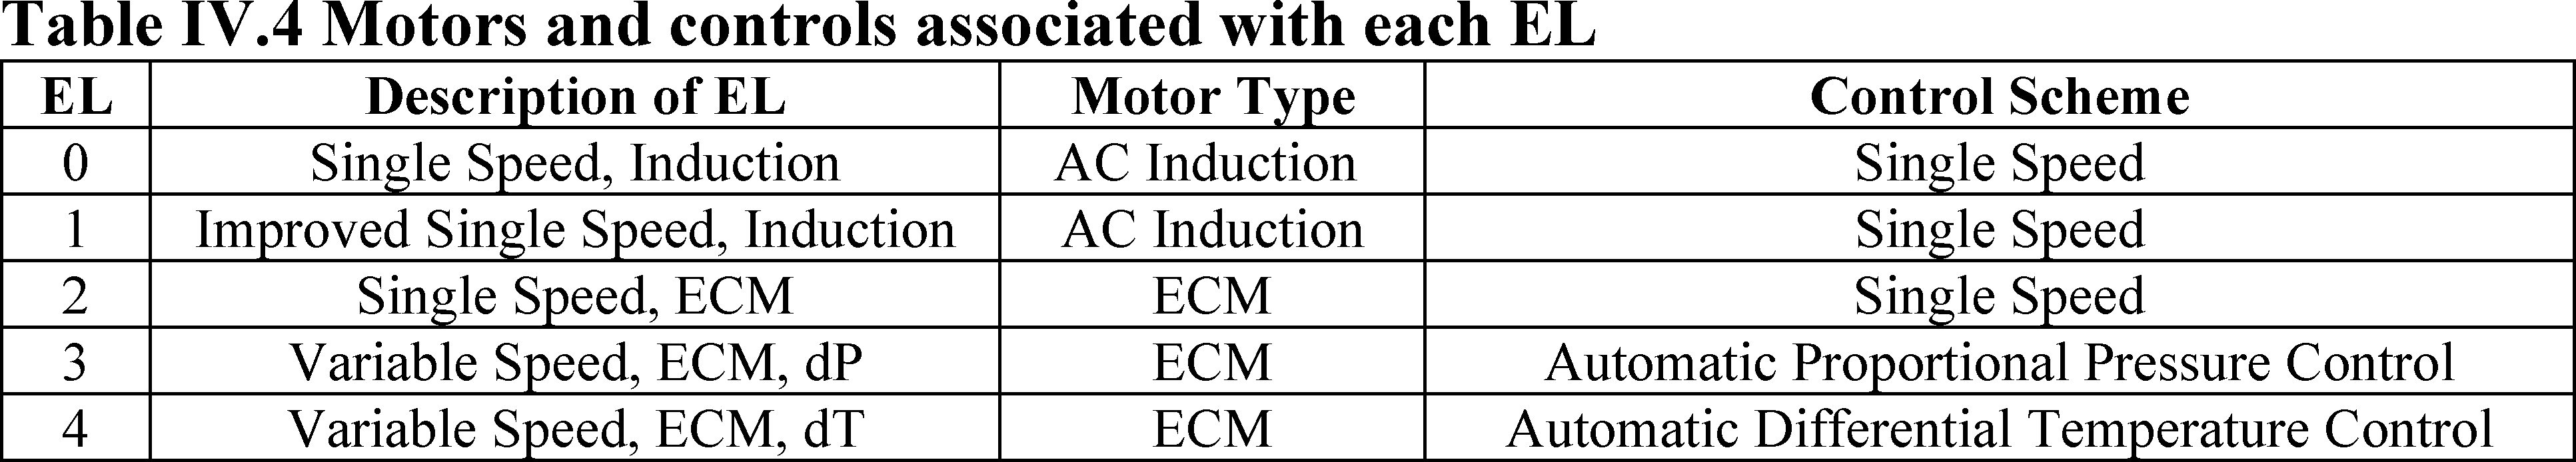
1. Energy Conservation Standard Level
2. Labeling Requirements
3. Certification Reports
B. General Comments
C. Equipment Classes and Scope of Coverage
1. CPWG Recommendations
a. Scope
b. Definitions
c. Equipment Classes
d. Small Vertical In-Line Pumps
D. Test Procedure
1. Control Mode
E. Technological Feasibility
1. General
2. Maximum Technologically Feasible Levels
F. Energy Savings
1. Determination of Savings
2. Significance of Savings
G. Economic Justification
1. Specific Criteria
a. Economic Impact on Manufacturers and Consumers
b. Savings in Operating Costs Compared To Increase in Price (LCC and PBP)
c. Energy Savings
d. Lessening of Utility or Performance of Equipment
e. Impact of Any Lessening of Competition
f. Need for National Energy Conservation
g. Other Factors
2. Rebuttable Presumption
H. Compliance Date
IV. Methodology and Discussion of Related Comments
A. Market and Technology Assessment
1. Scope of Coverage and Equipment Classes
a. Scope
b. Equipment Classes
2. Technology Options
a. Hydraulic Design
b. More Efficient Motors
c. Speed Reduction
B. Screening Analysis
1. Screened-Out Technologies
2. Remaining Technologies
C. Engineering Analysis
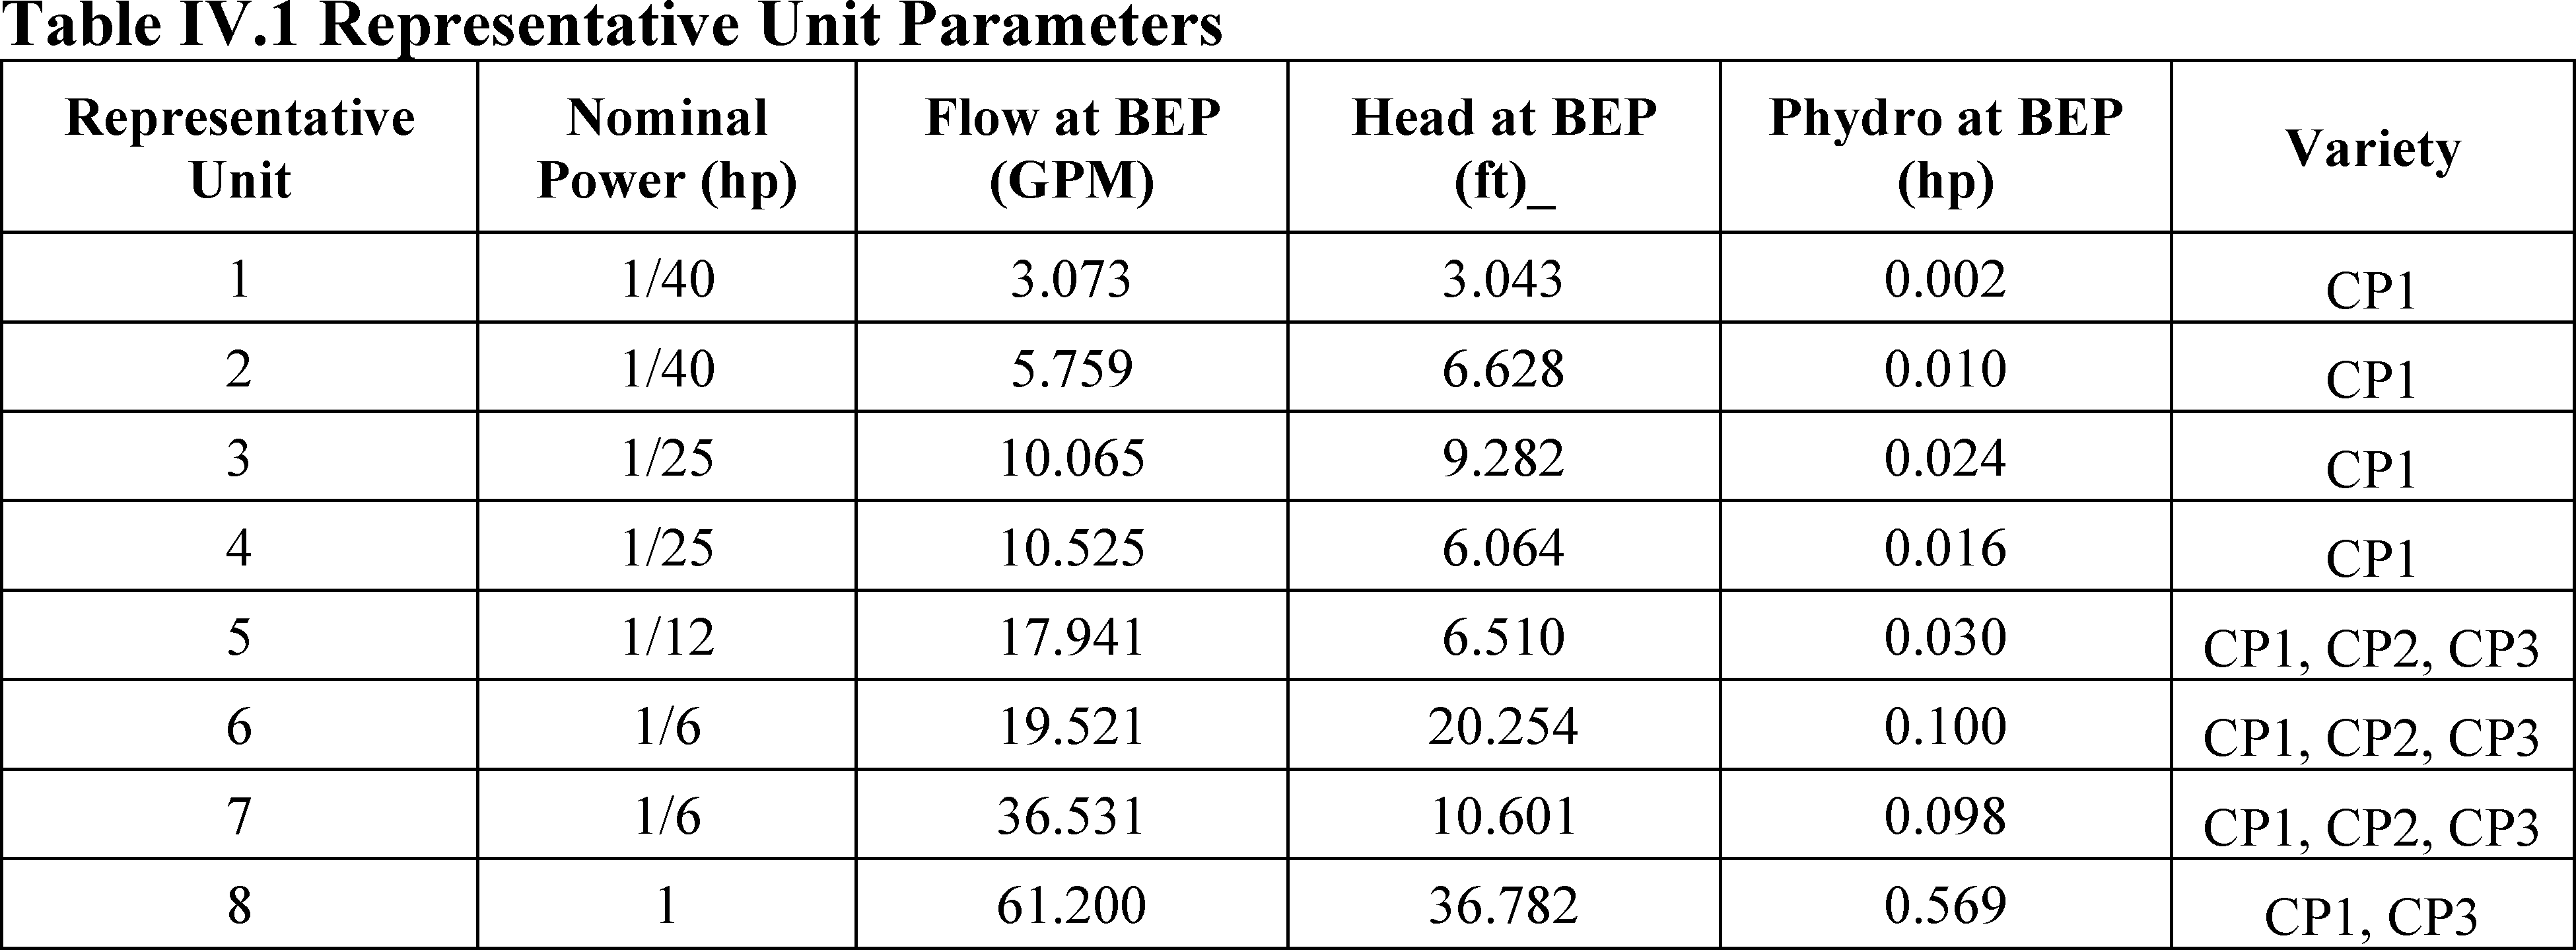
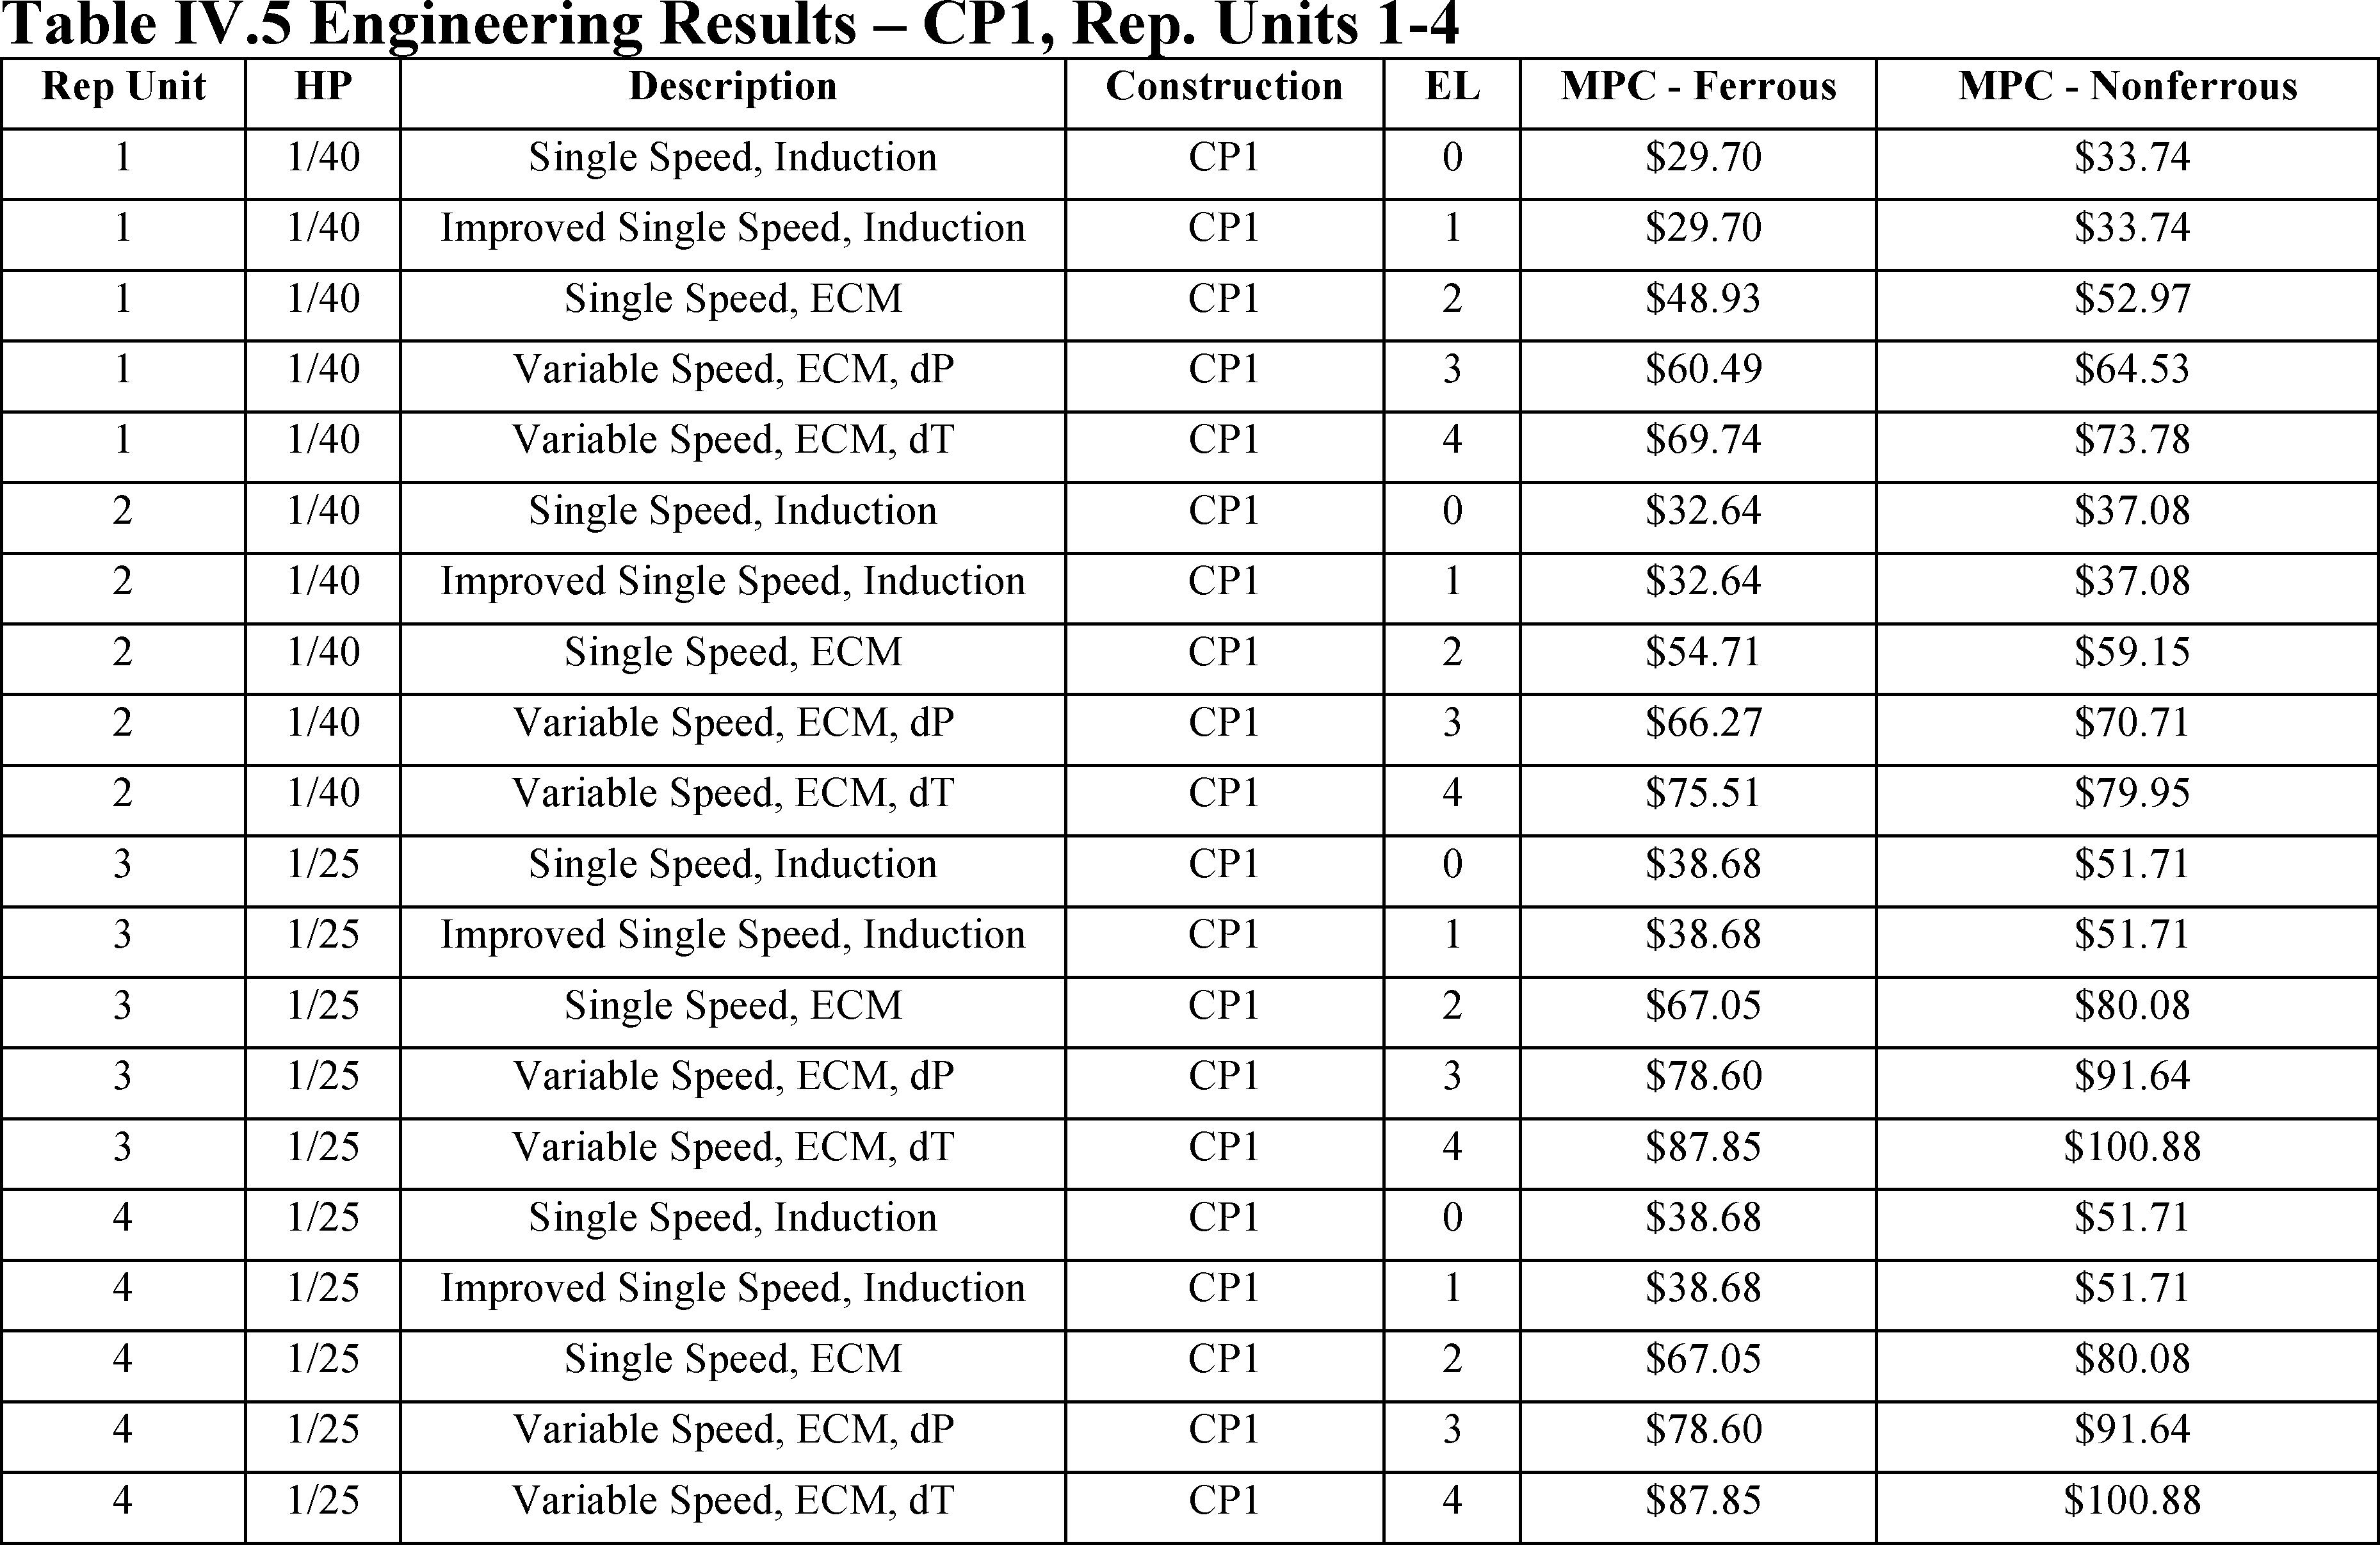
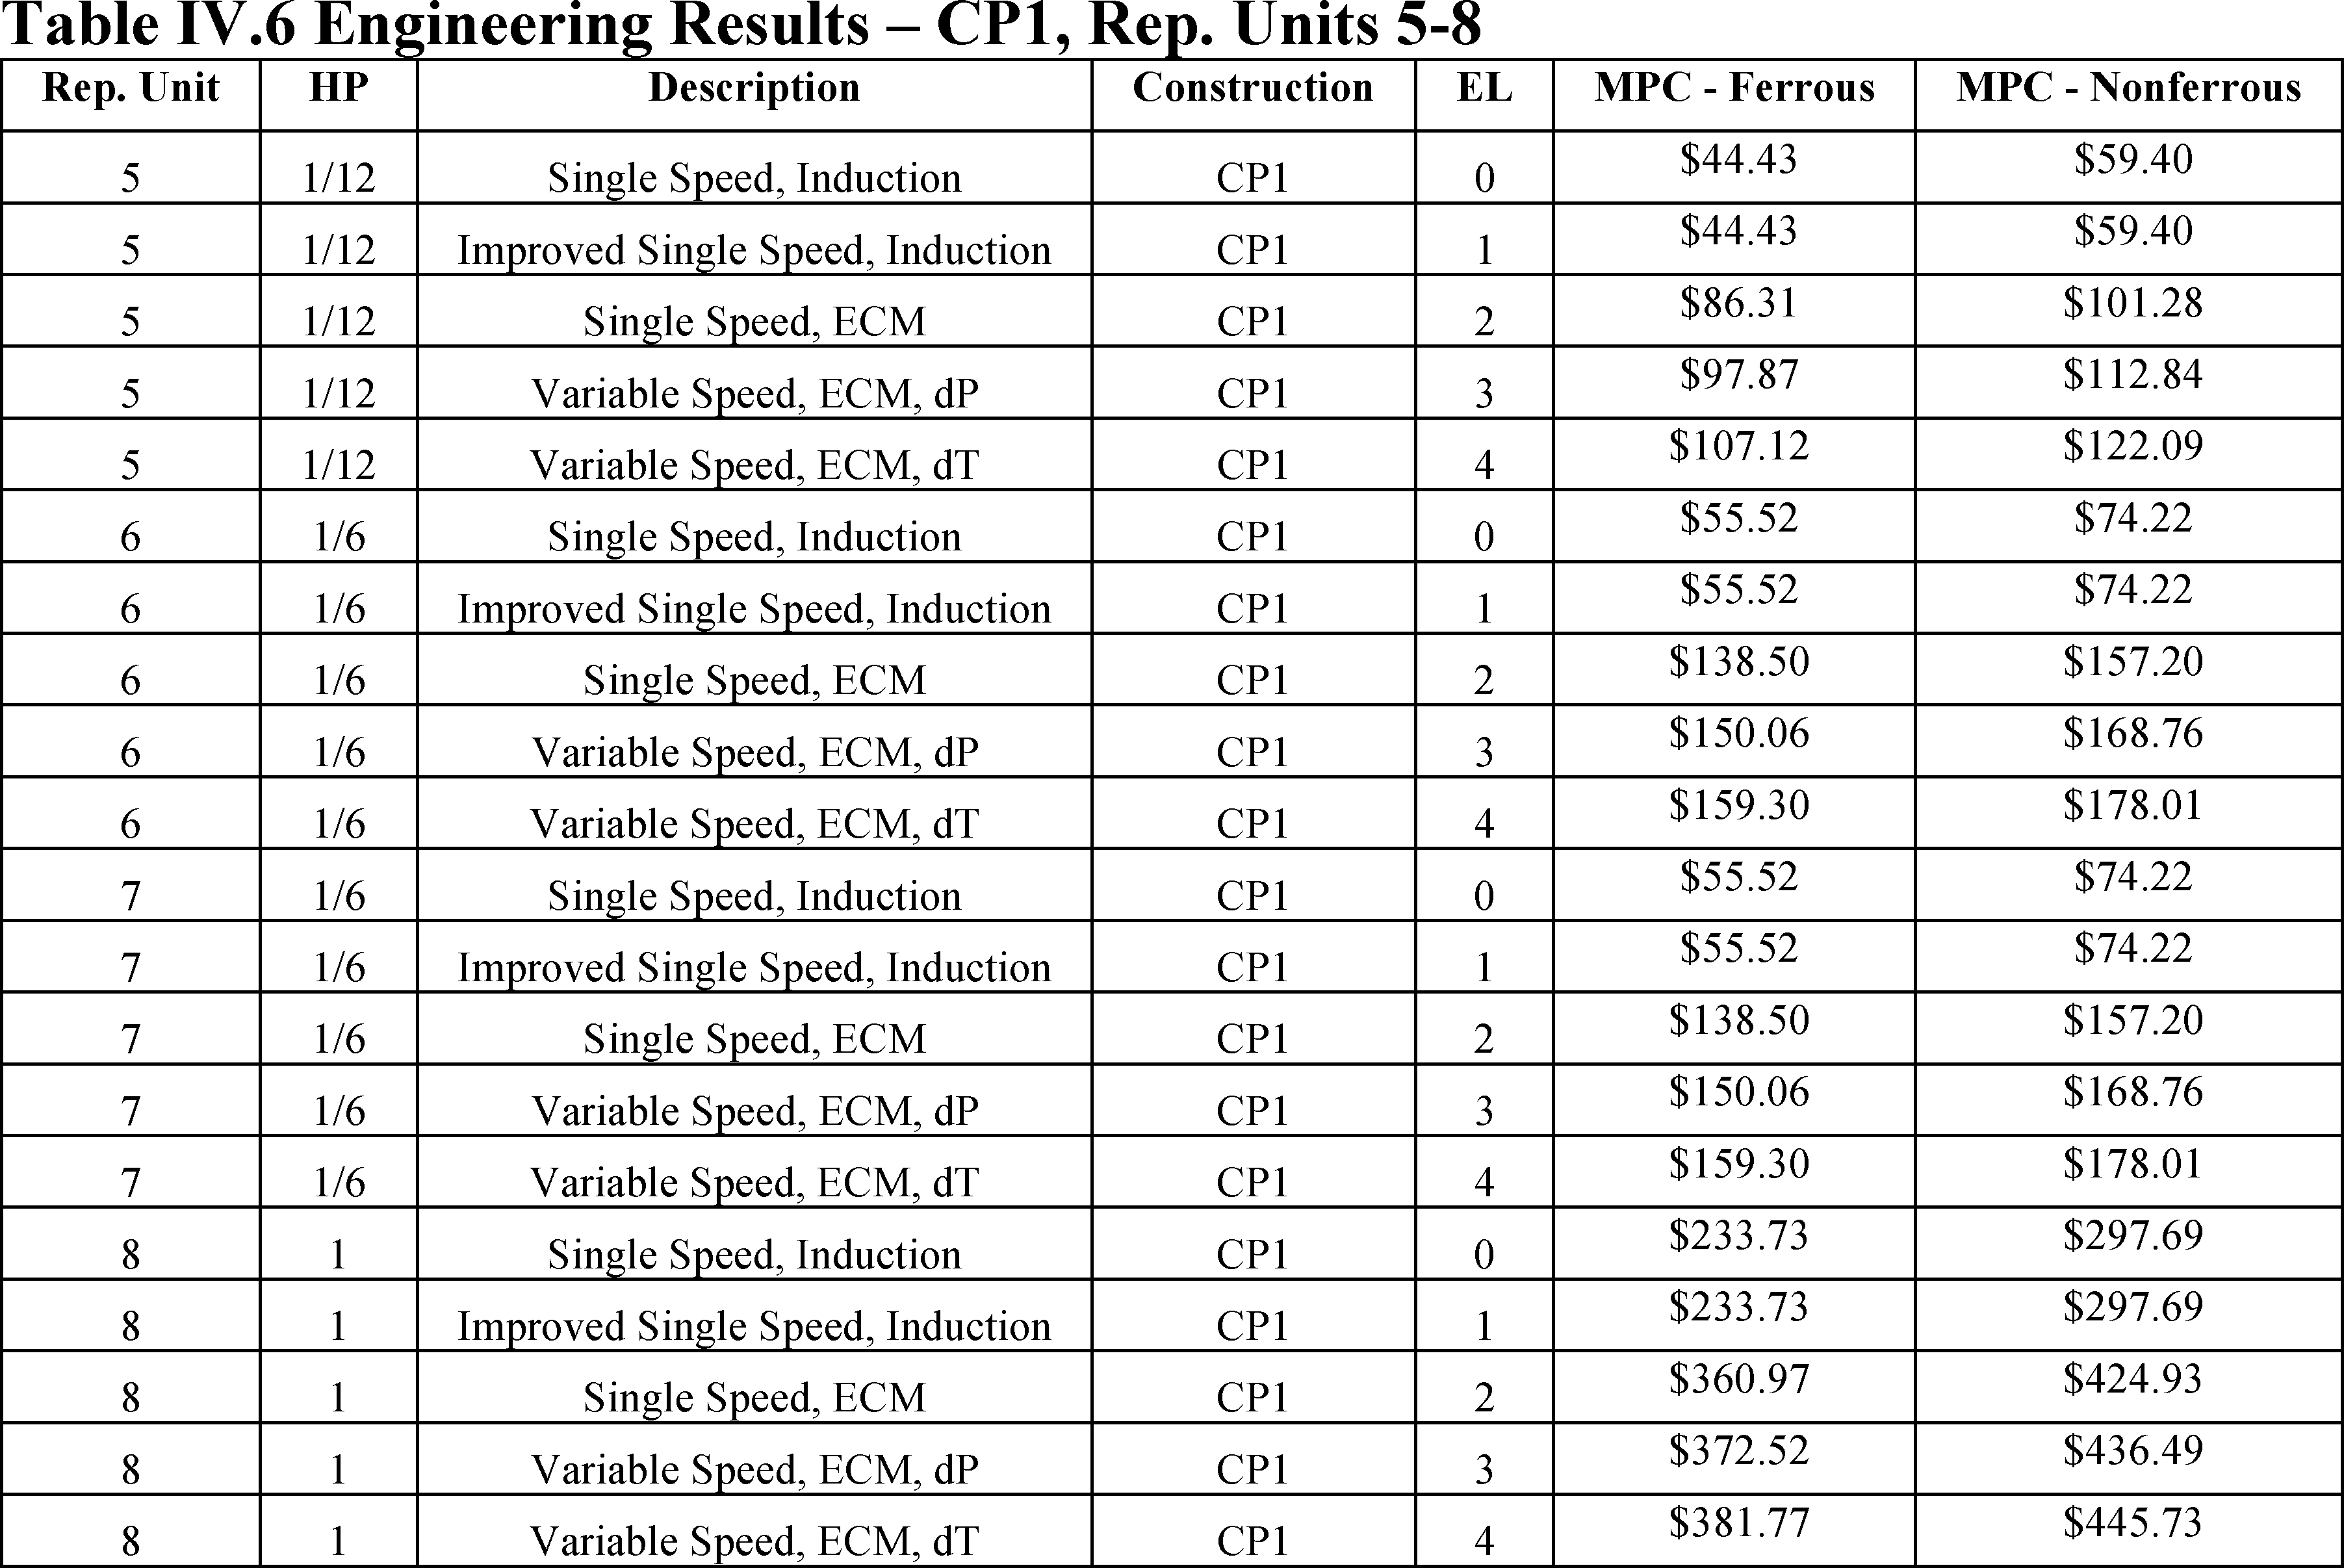
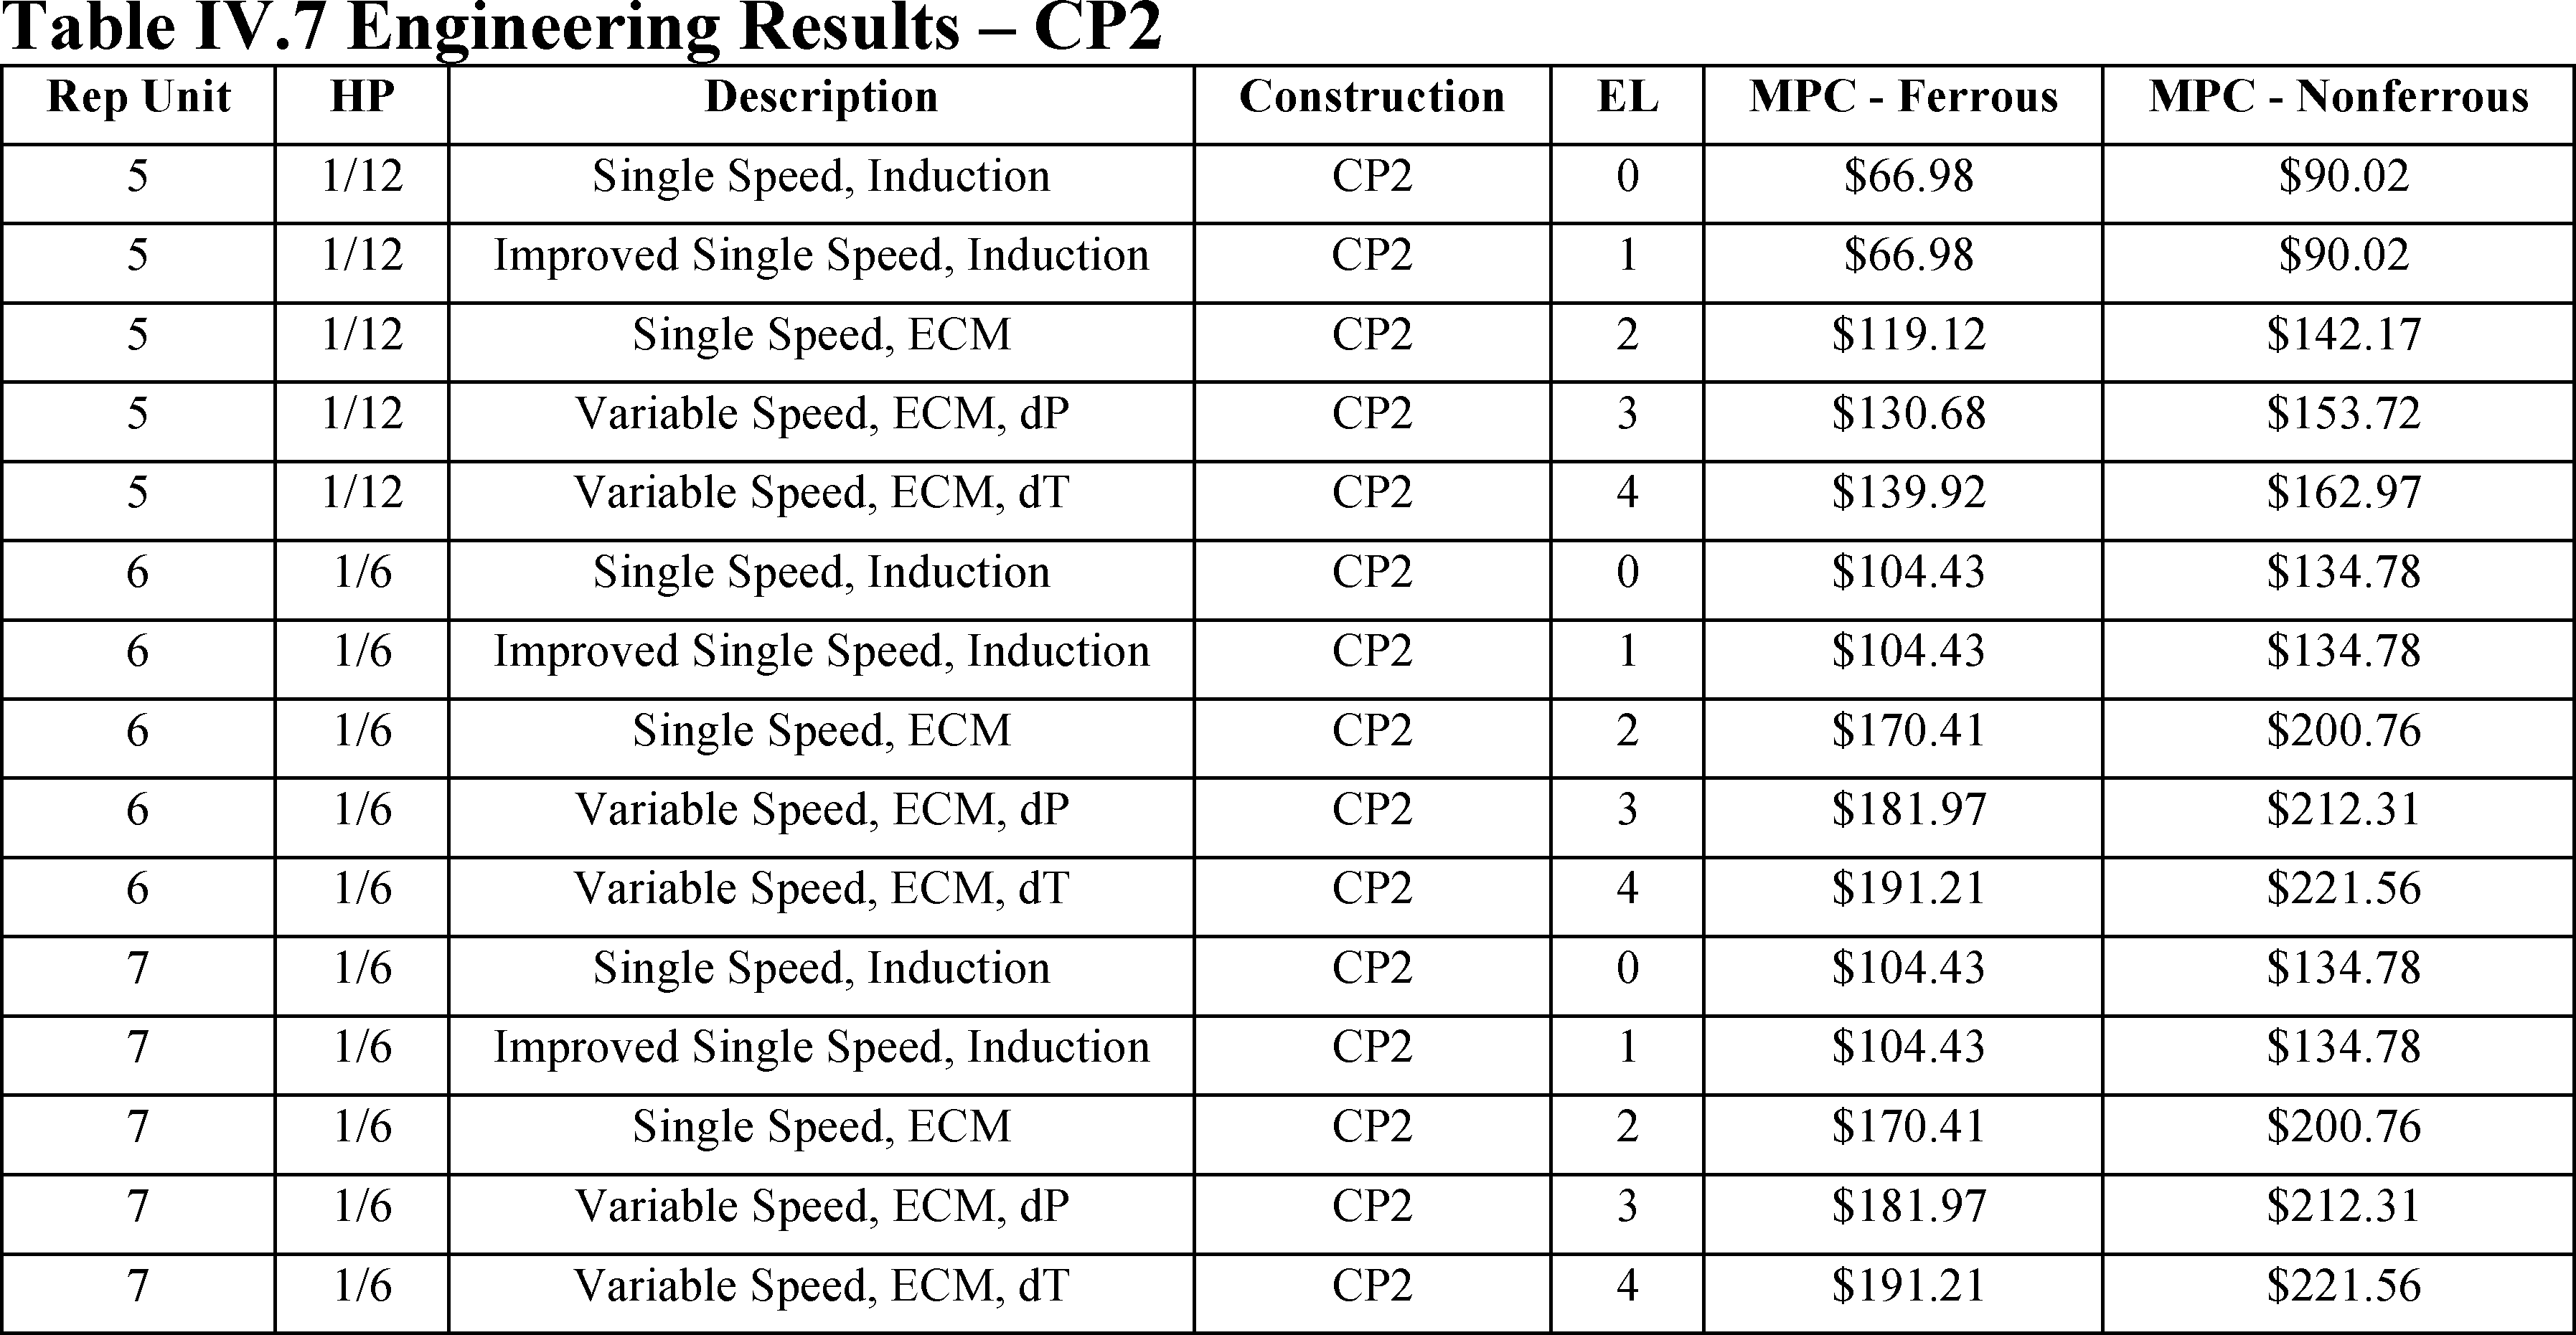
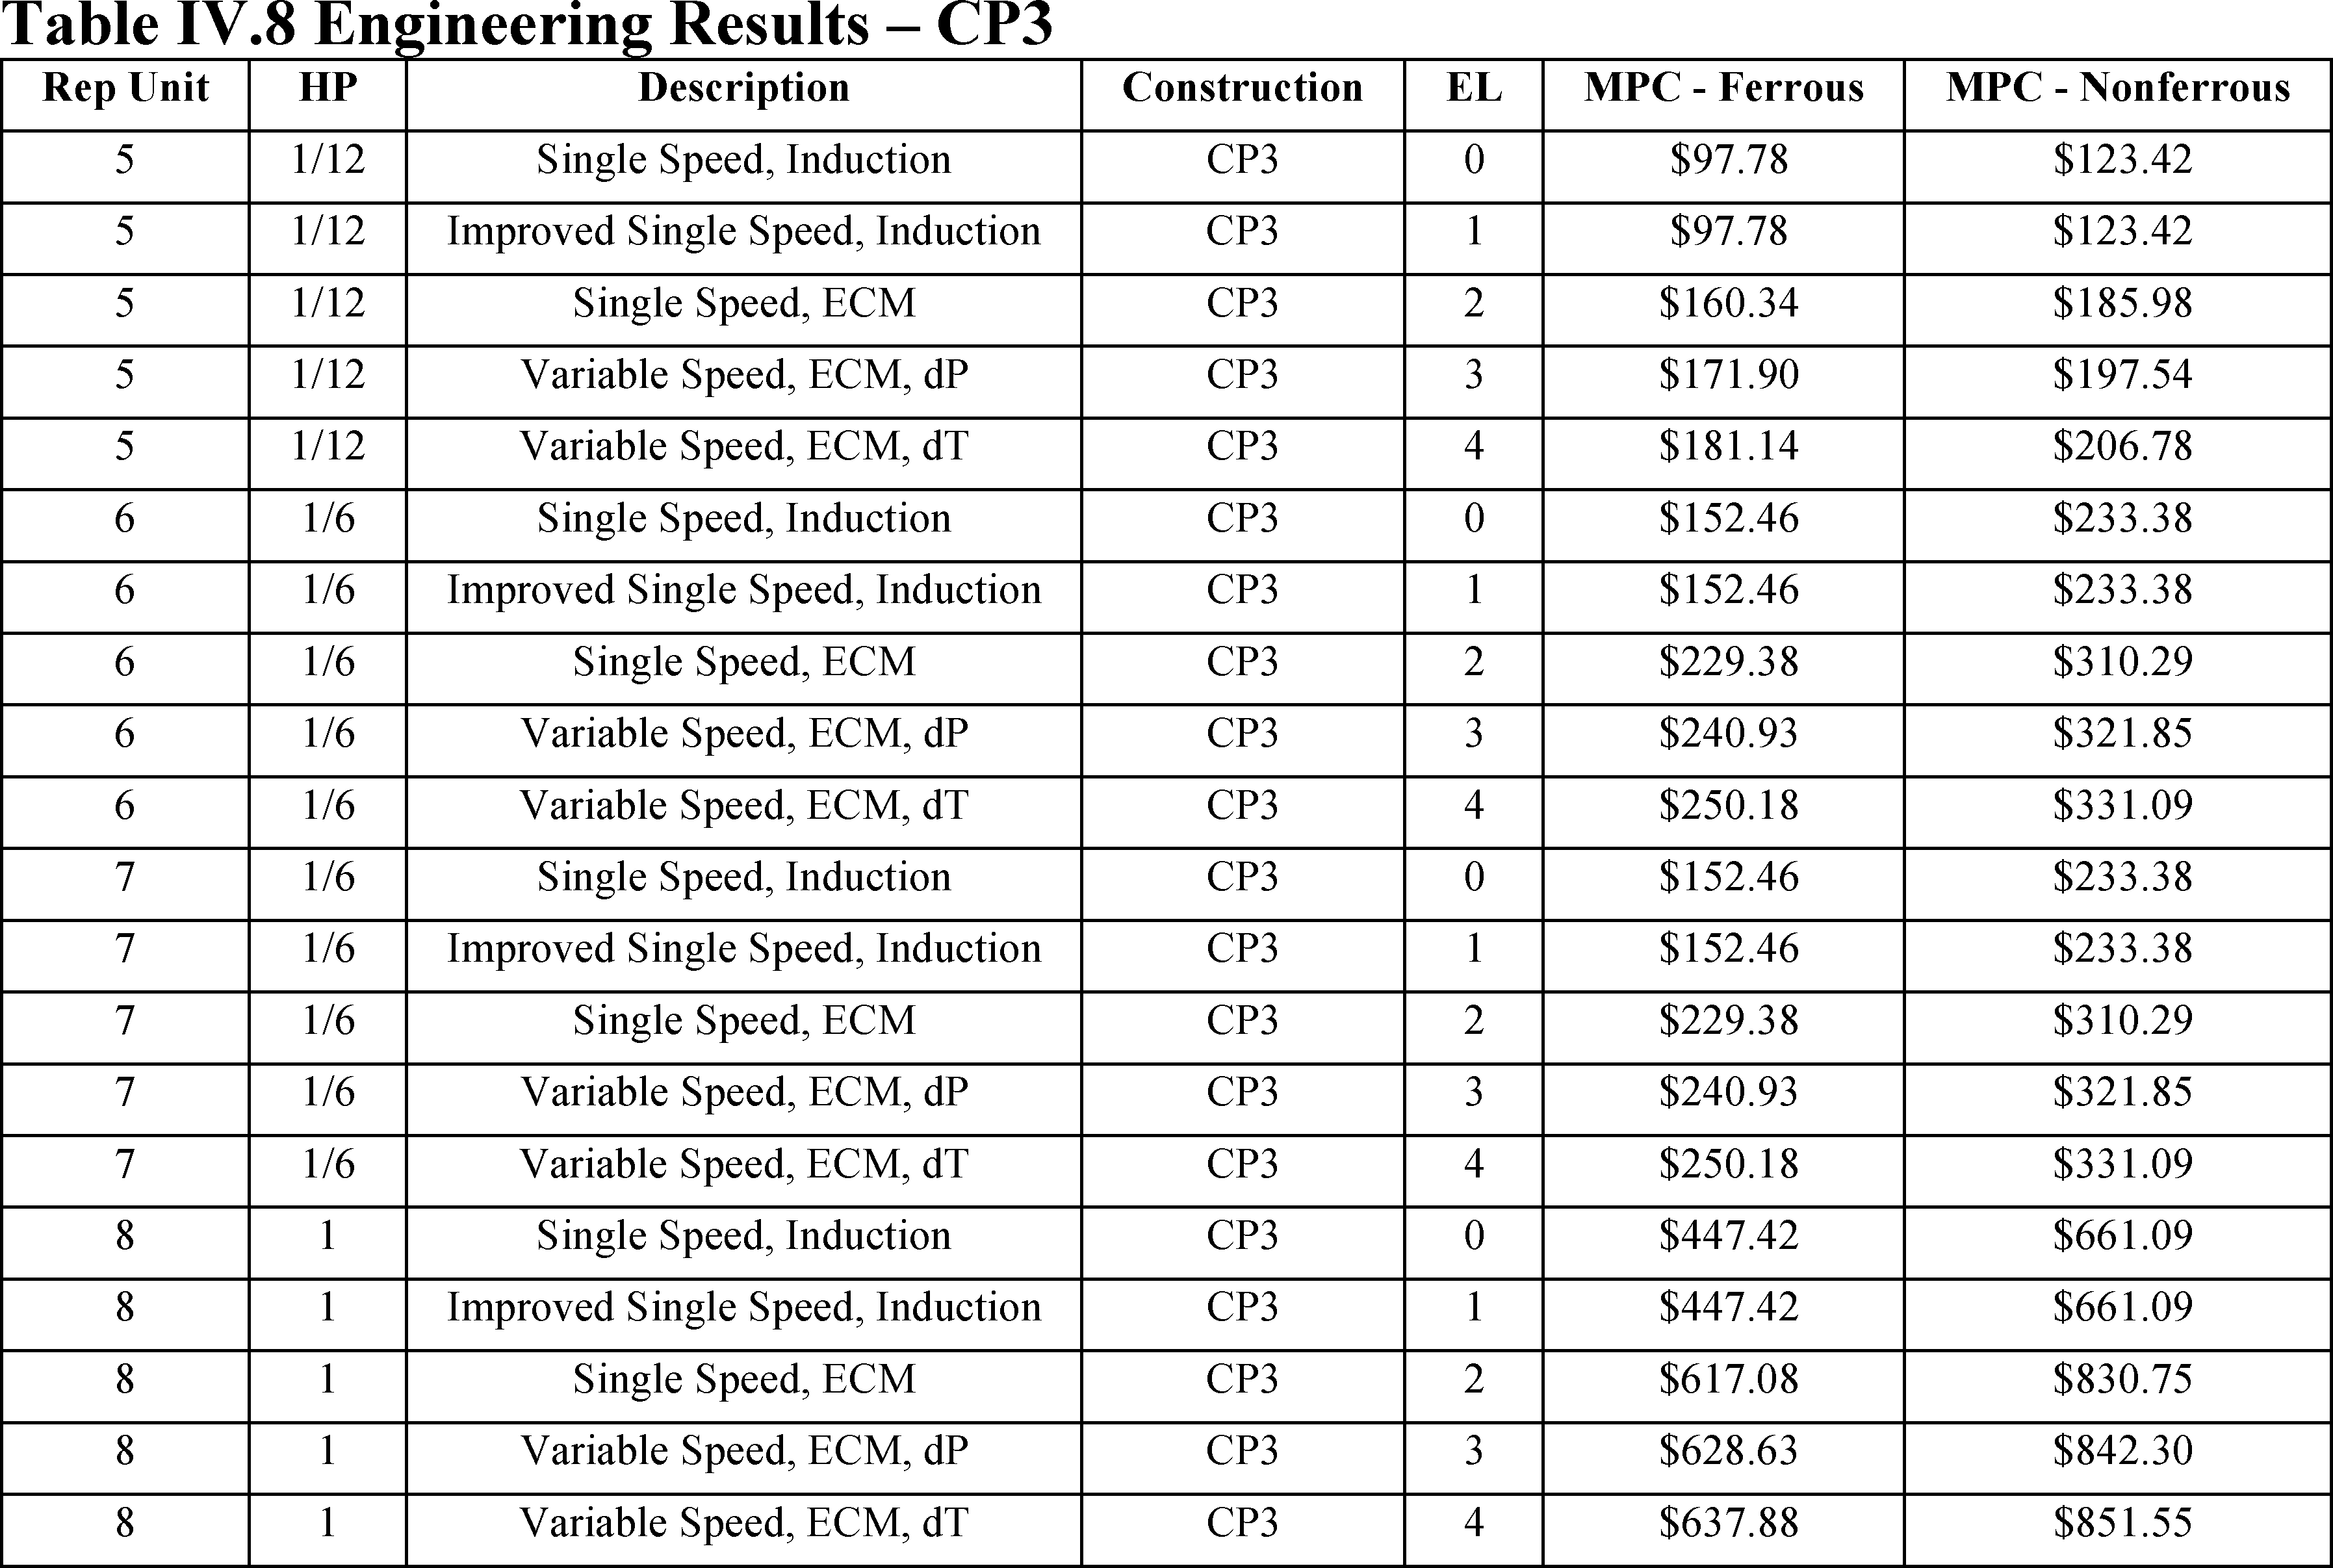
1. Representative Equipment
a. Circulator Pump Varieties
2. Efficiency Analysis
a. Baseline Efficiency
b. Higher Efficiency Levels
c. EL Analysis
3. Cost Analysis
4. Cost-Efficiency Results
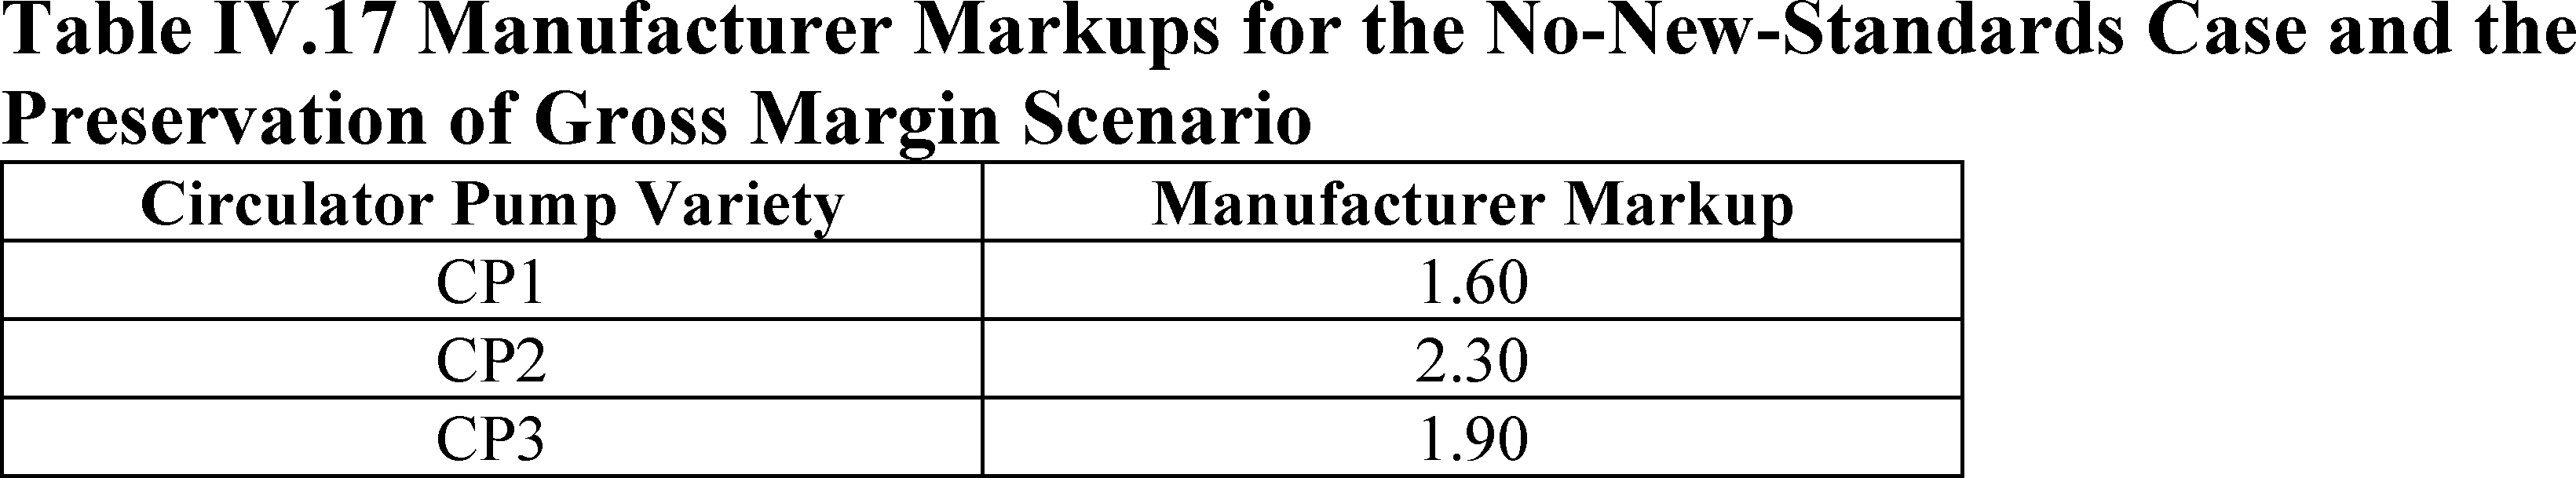
5. Manufacturer Markup and Manufacturer Selling Price
D. Markups Analysis
E. Energy Use Analysis
1. Circulator Pump Applications
2. Consumer Samples
3. Operating Hours
4. Load Profiles
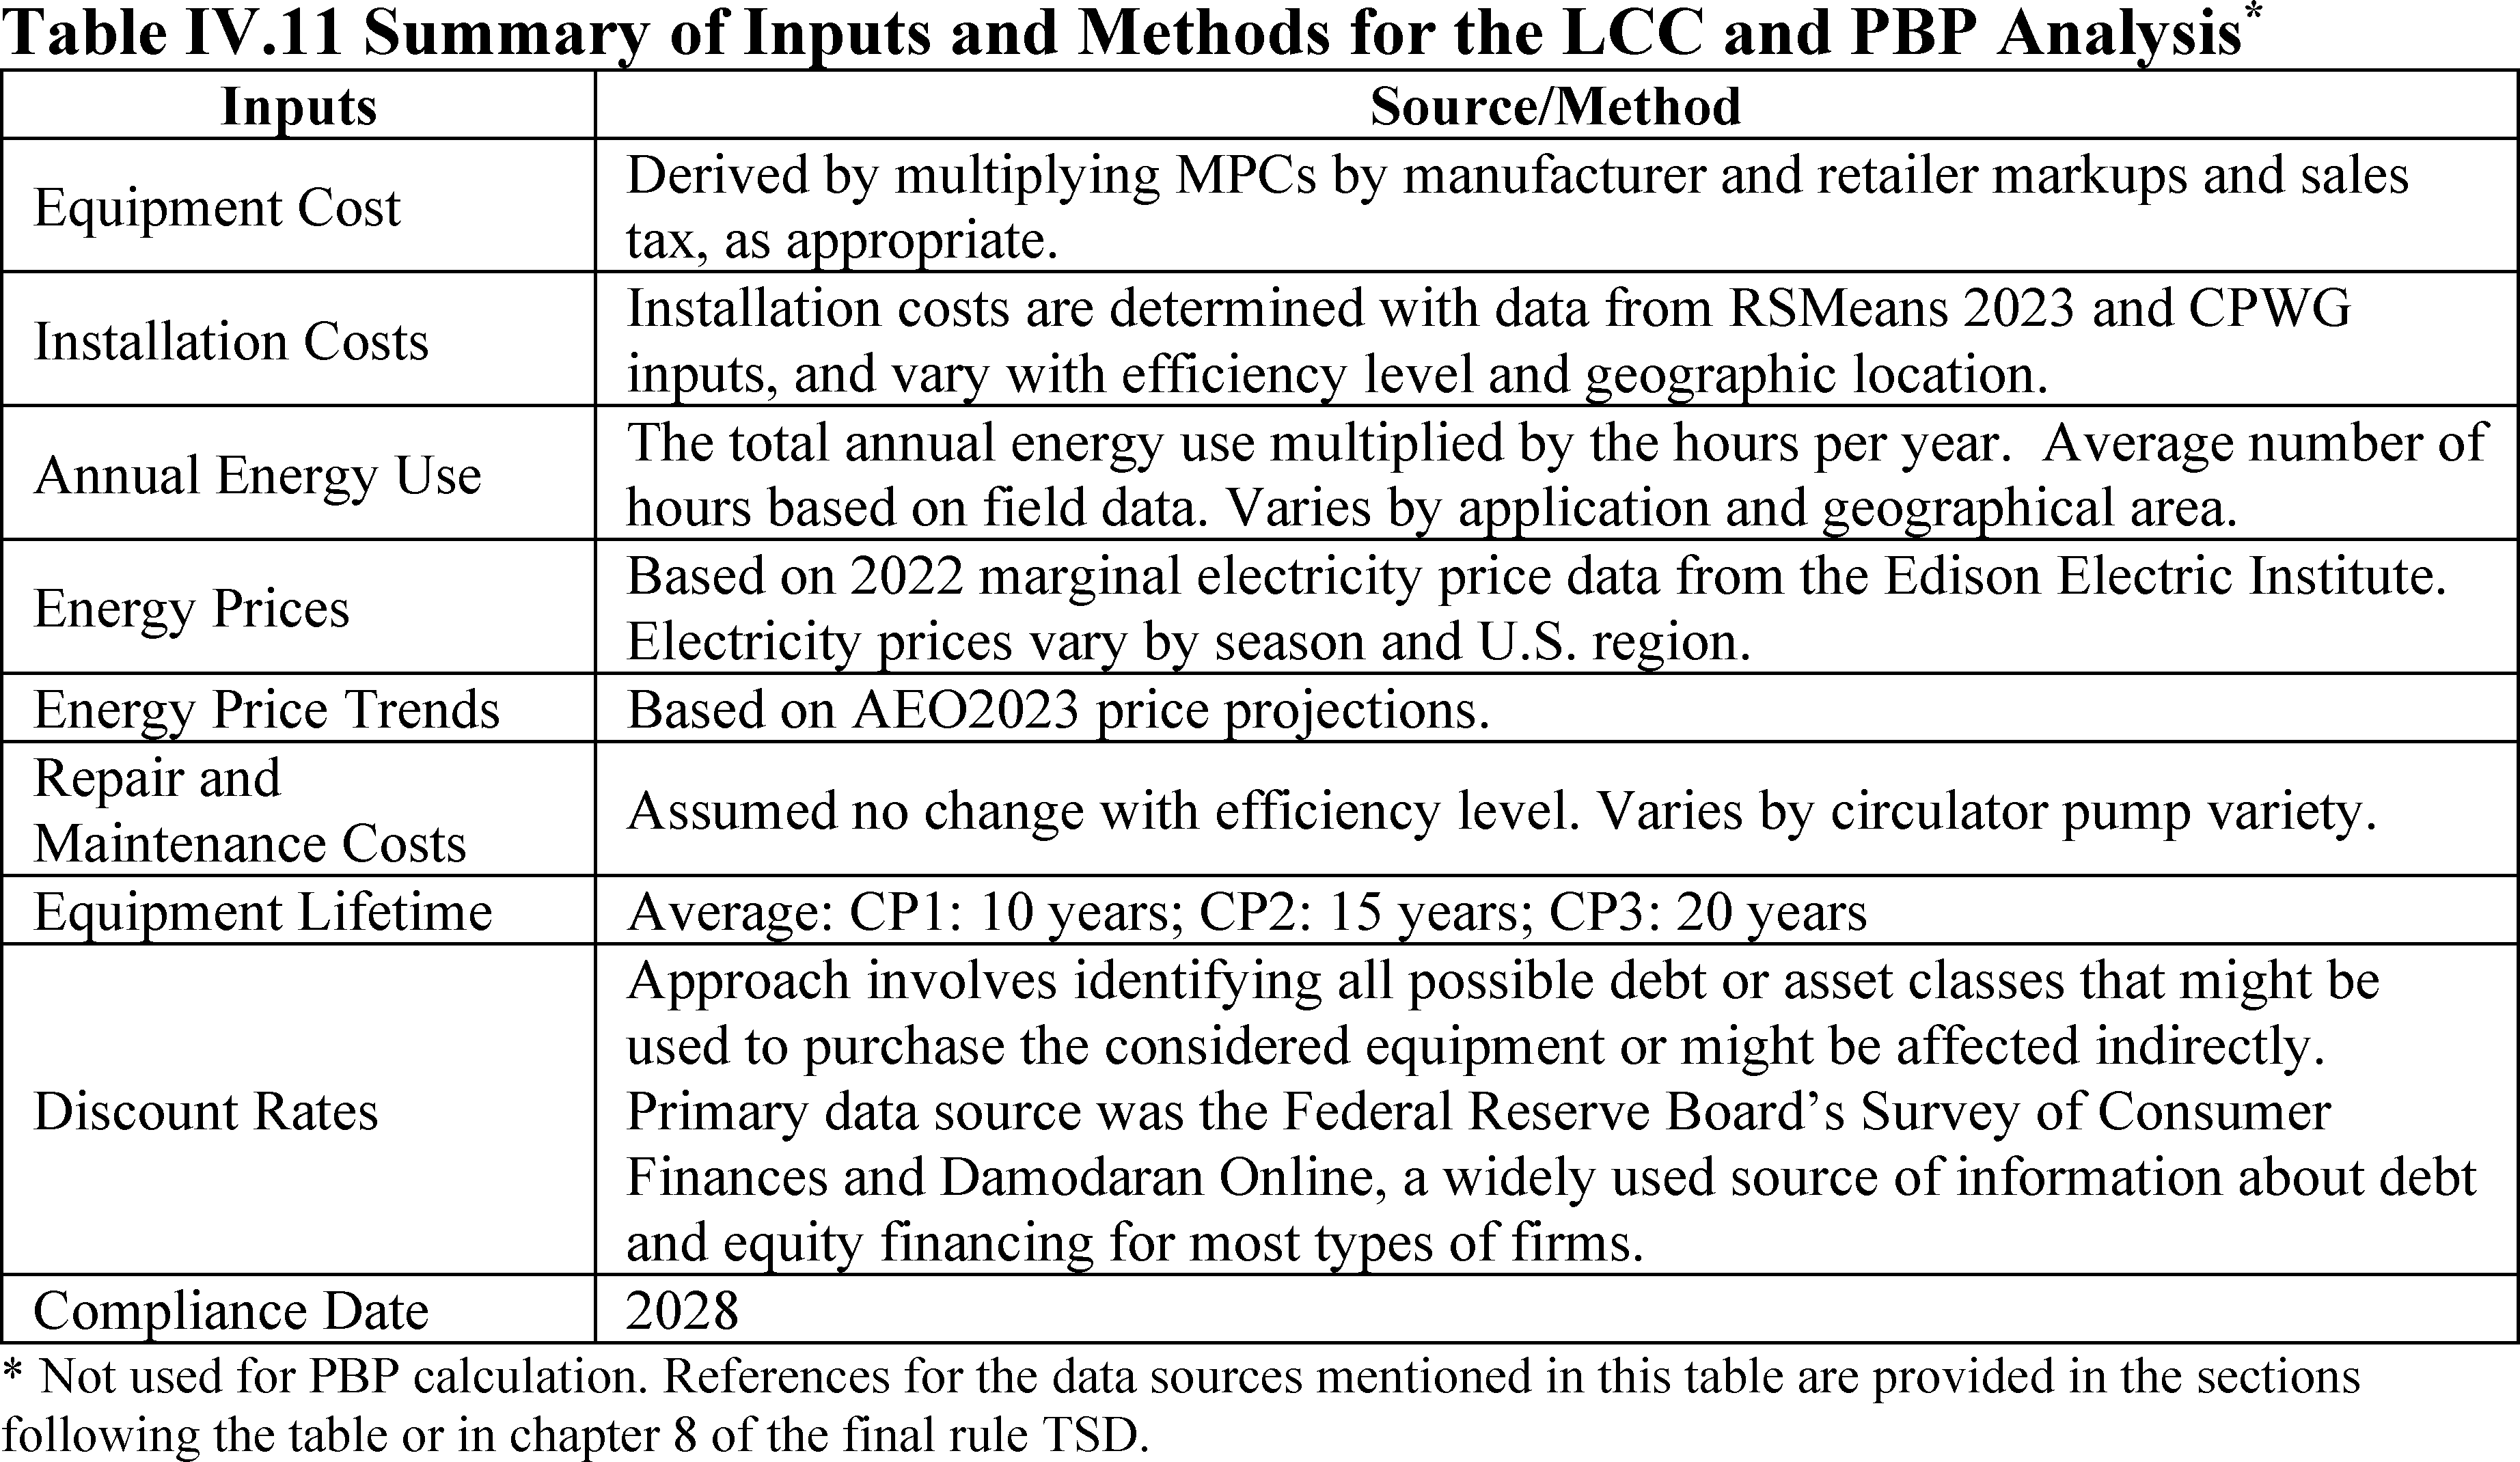
F. Life-Cycle Cost and Payback Period Analysis
1. Equipment Cost
2. Installation Cost
3. Annual Energy Consumption
4. Energy Prices
5. Maintenance and Repair Costs
6. Equipment Lifetime
7. Discount Rates
a. Residential
b. Commercial
8. Energy Efficiency Distribution in the No-New-Standards Case
9. Payback Period Analysis
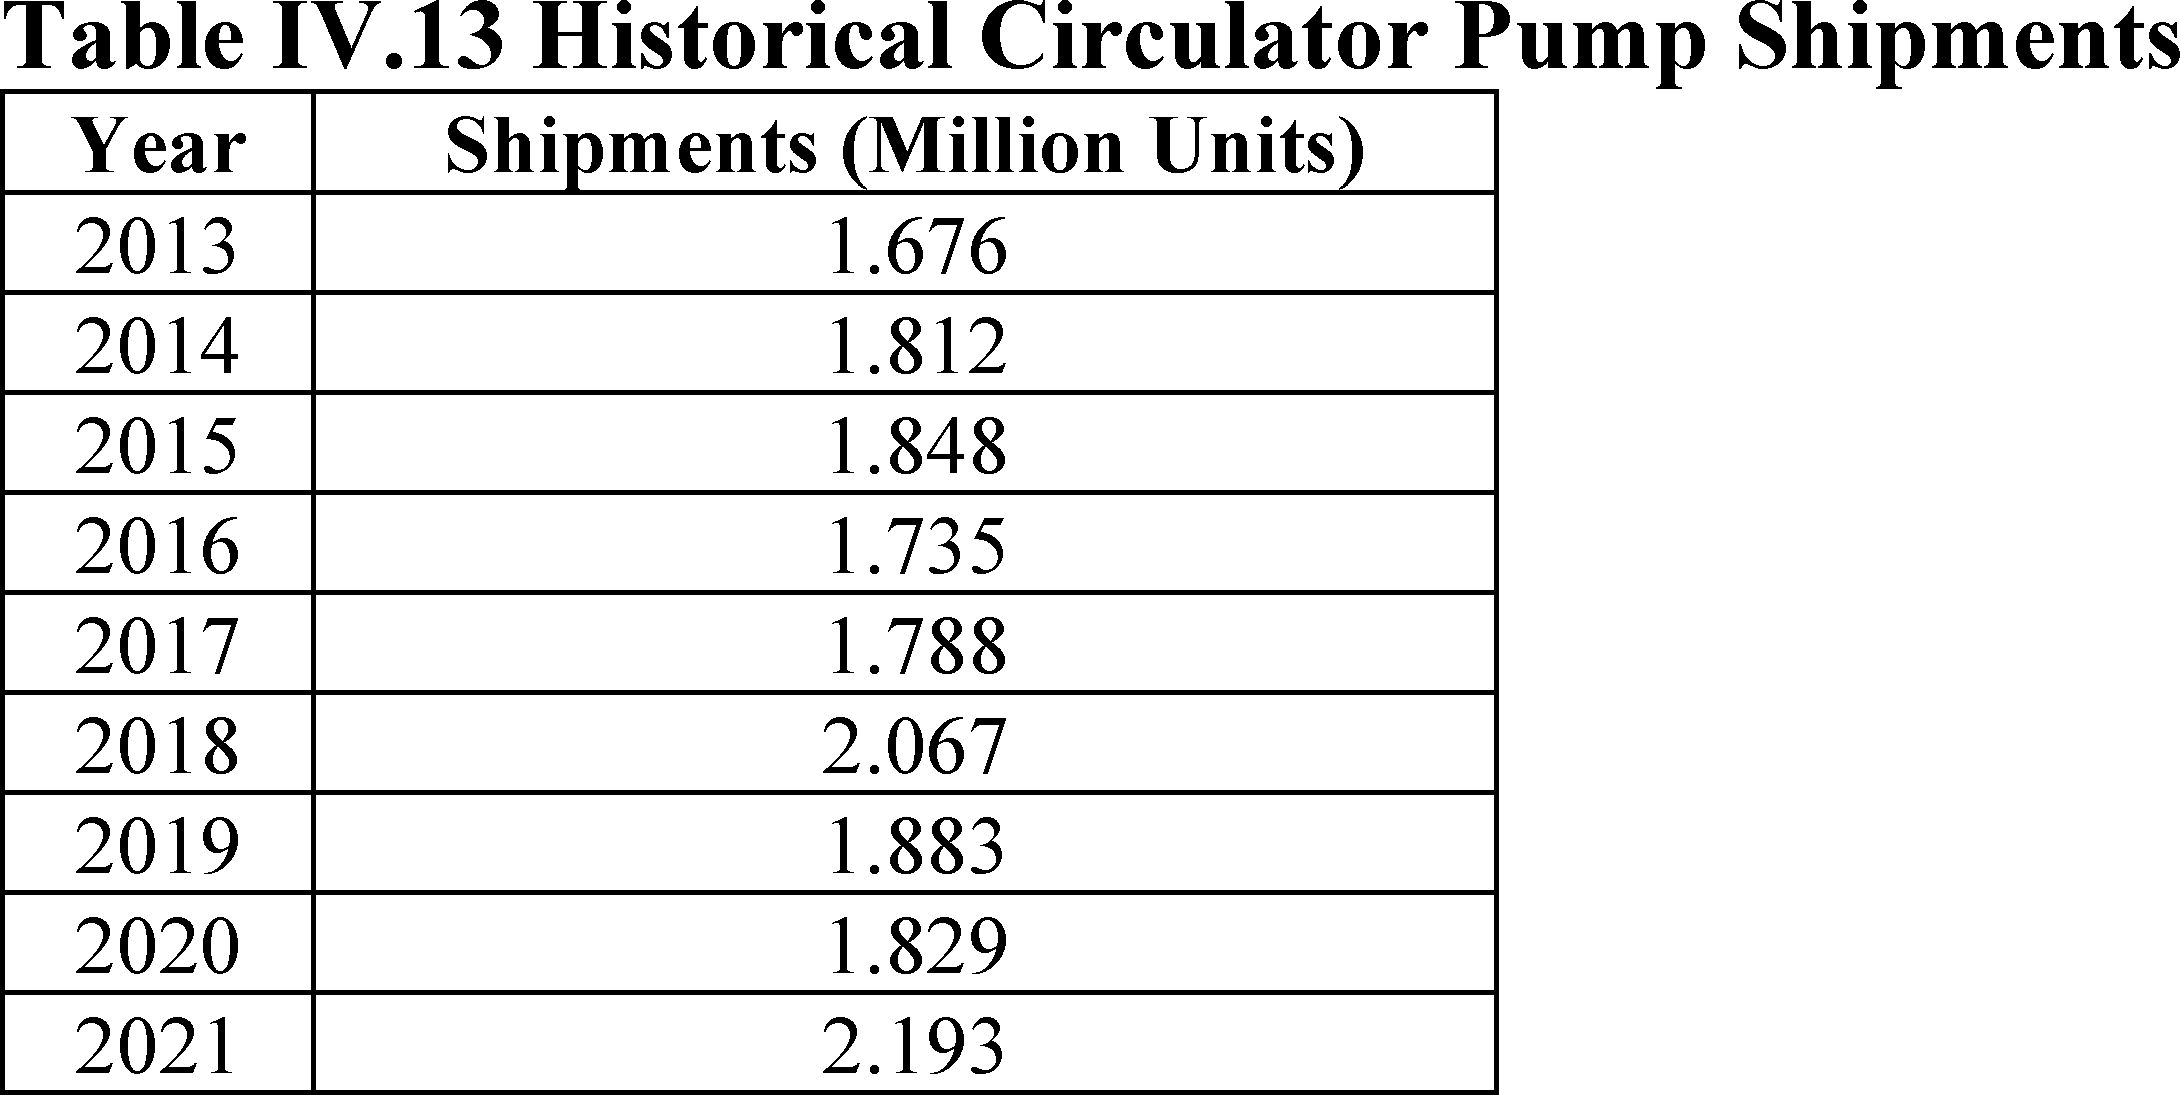
G. Shipments Analysis
1. No-New-Standards Case Shipments Projections
2. Standards-Case Shipment Projections
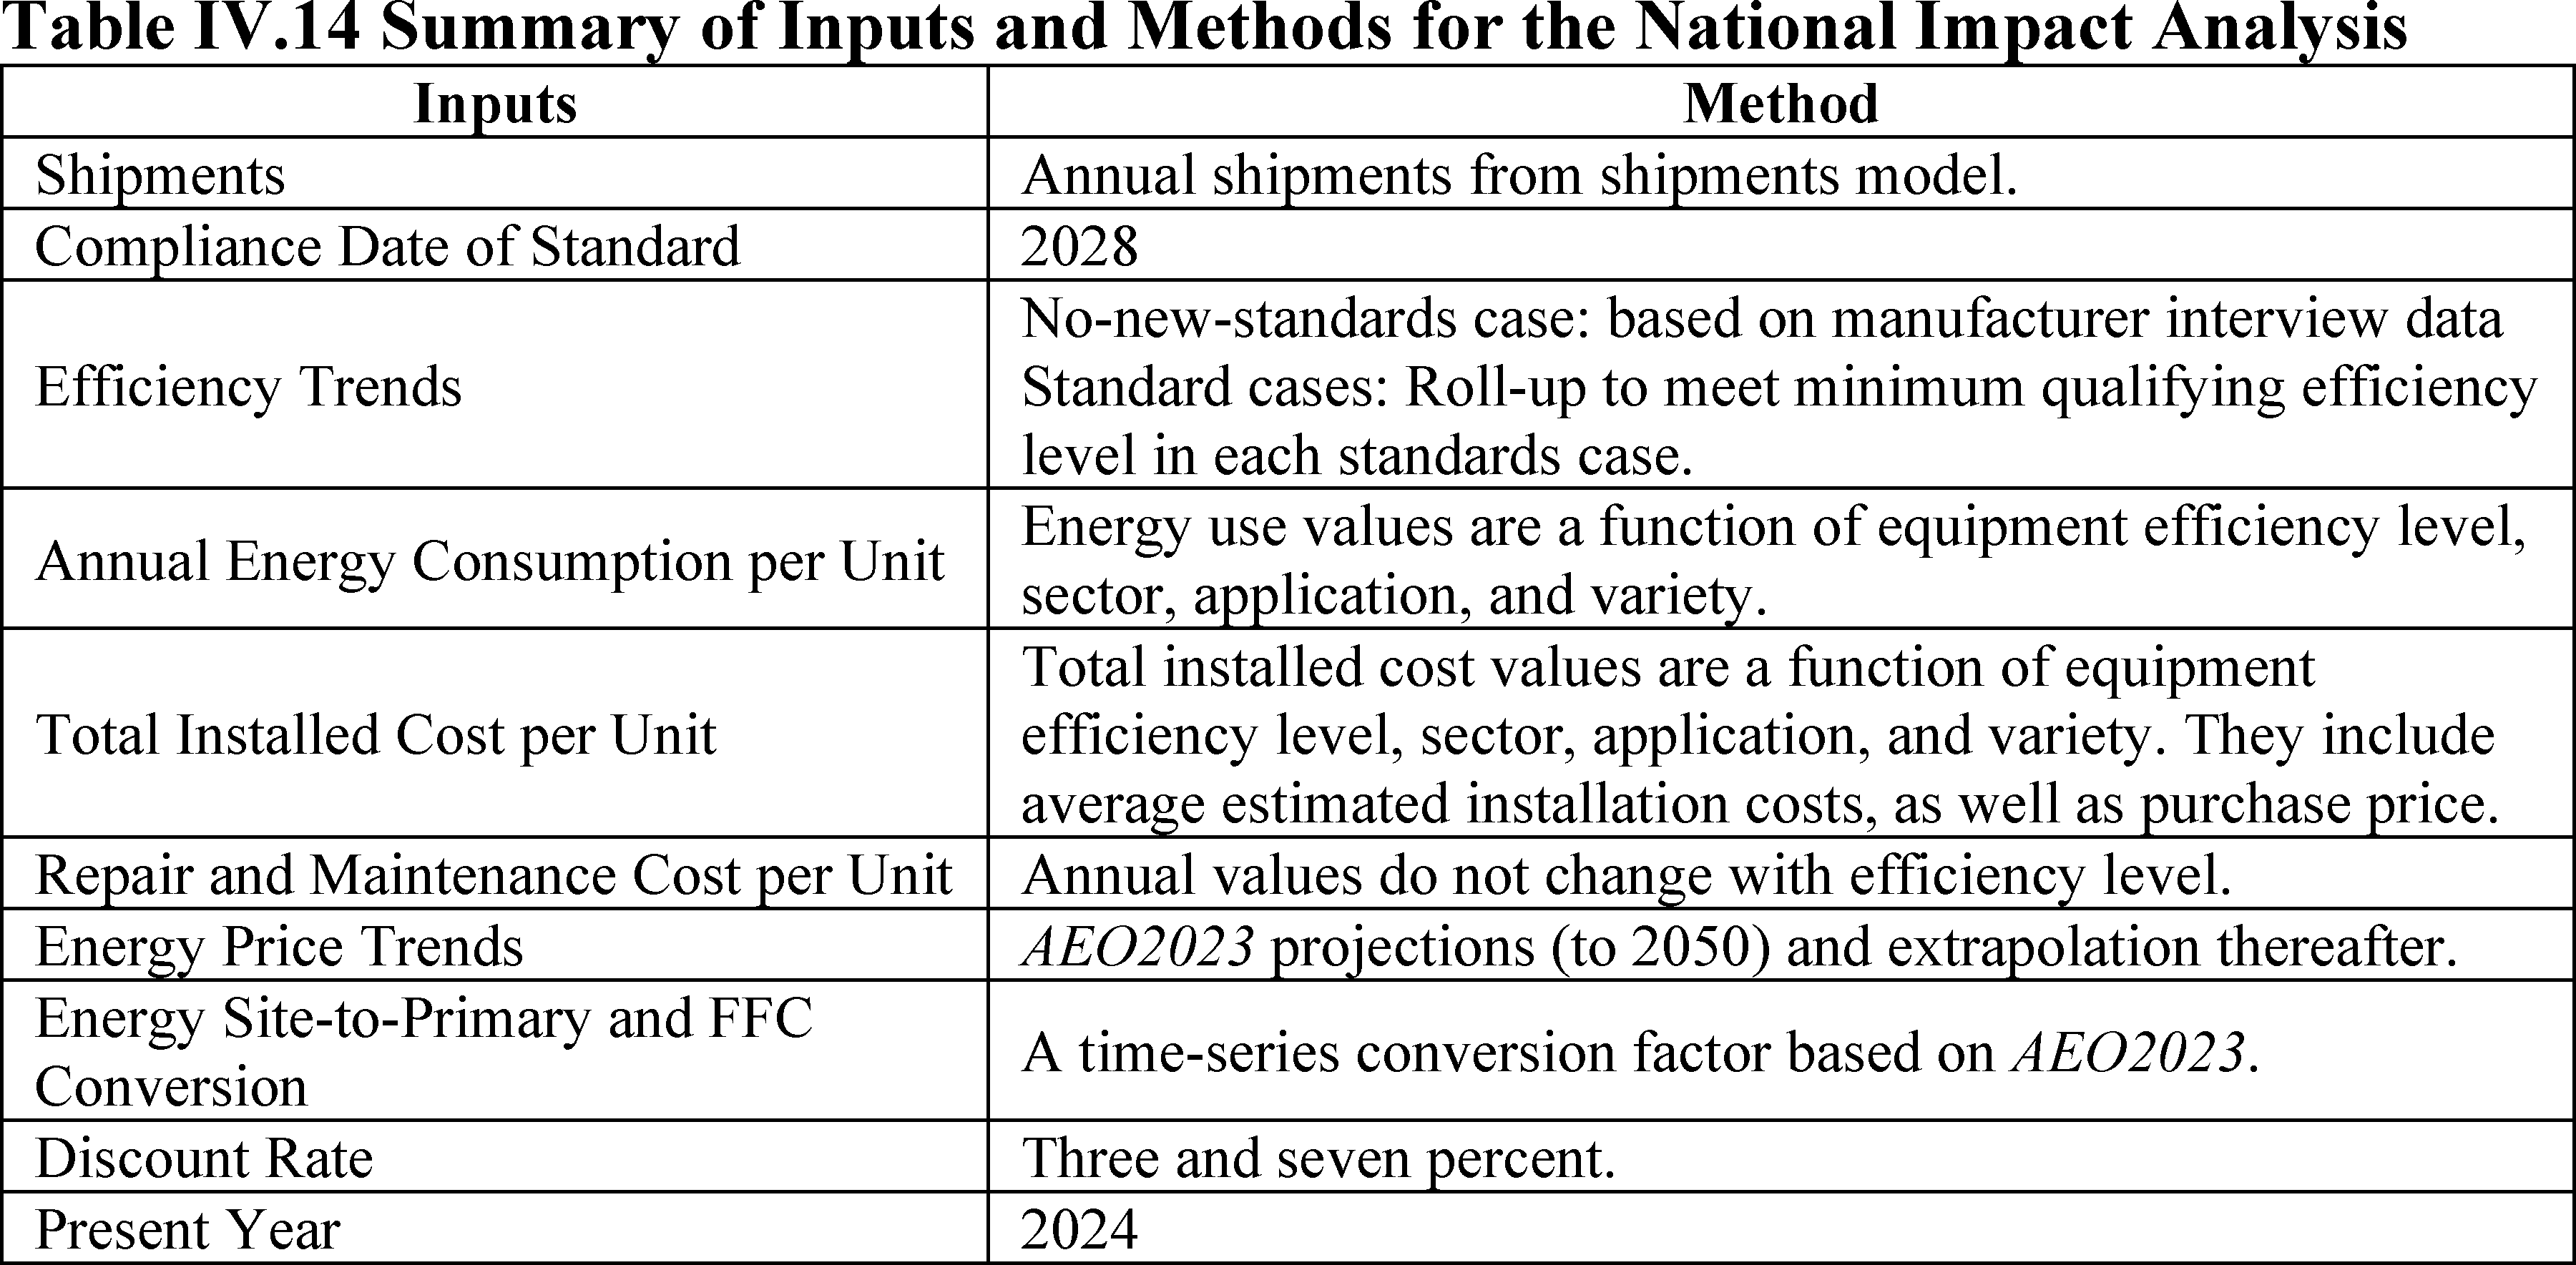
H. National Impact Analysis
1. Equipment Efficiency Trends
2. National Energy Savings
3. Net Present Value Analysis
I. Consumer Subgroup Analysis
J. Manufacturer Impact Analysis
1. Overview
2. Government Regulatory Impact Model and Key Inputs
a. Manufacturer Production Costs
b. Shipments Projections
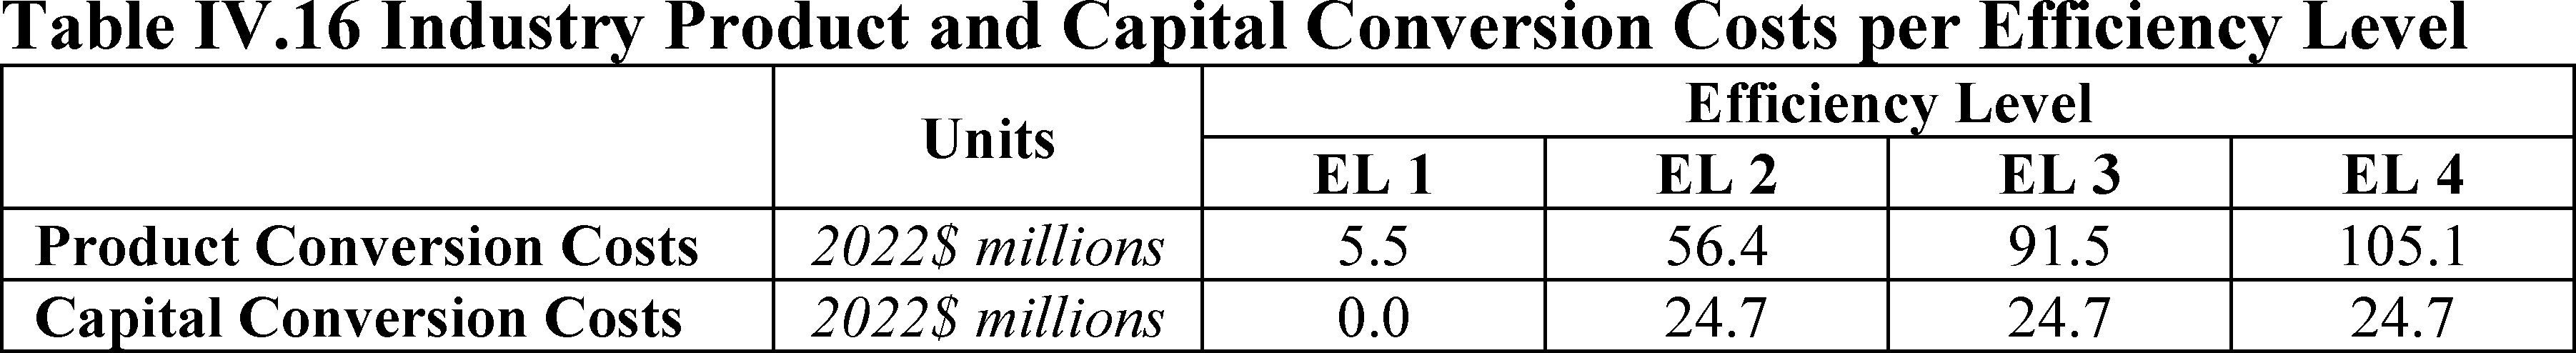
c. Product and Capital Conversion Costs
d. Manufacturer Markup Scenarios
K. Emissions Analysis
1. Air Quality Regulations Incorporated in DOE's Analysis
L. Monetizing Emissions Impacts
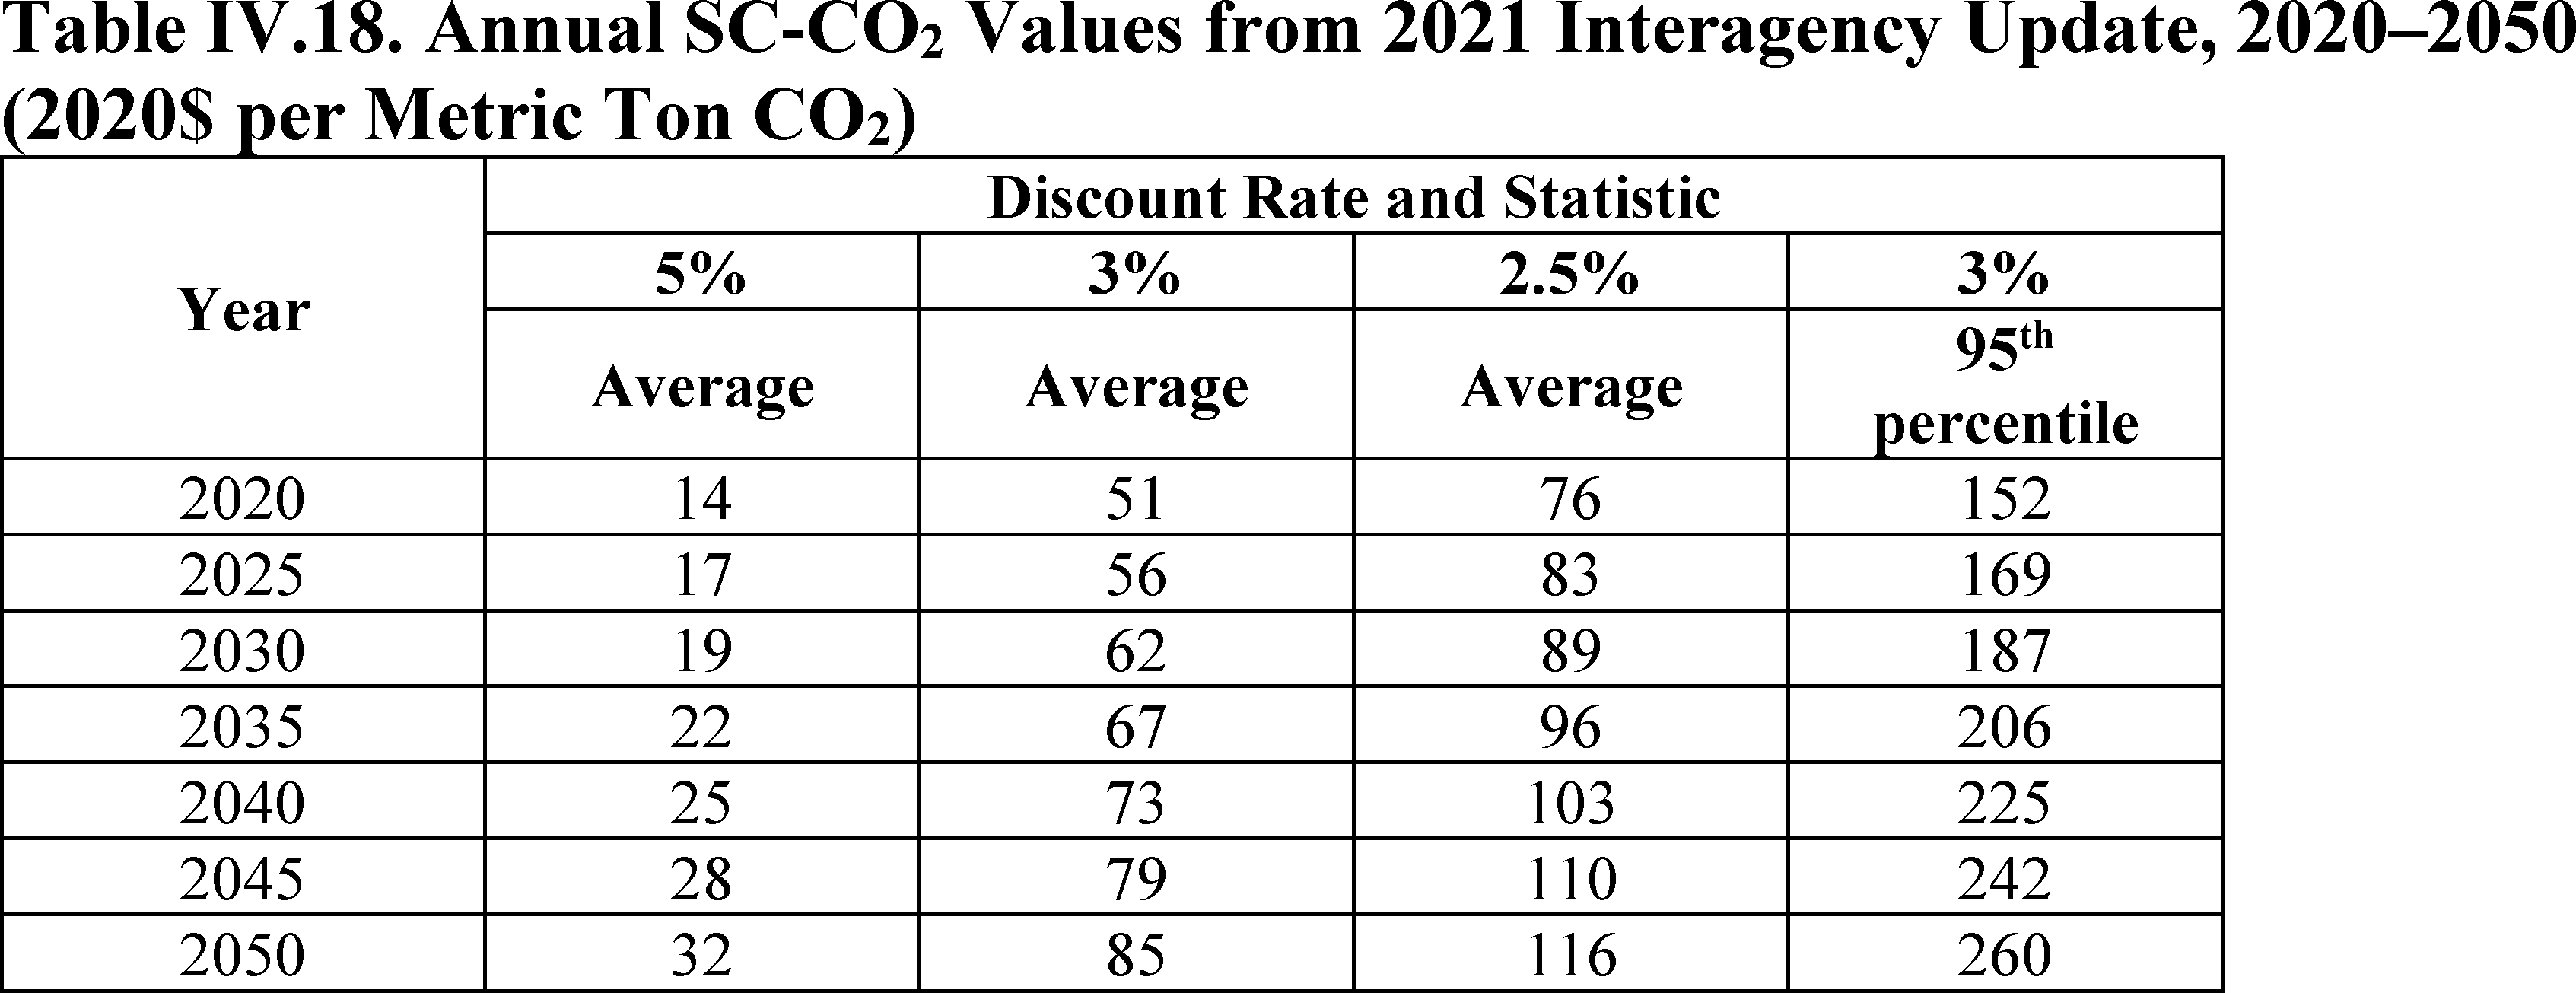
1. Monetization of Greenhouse Gas Emissions
a. Social Cost of Carbon
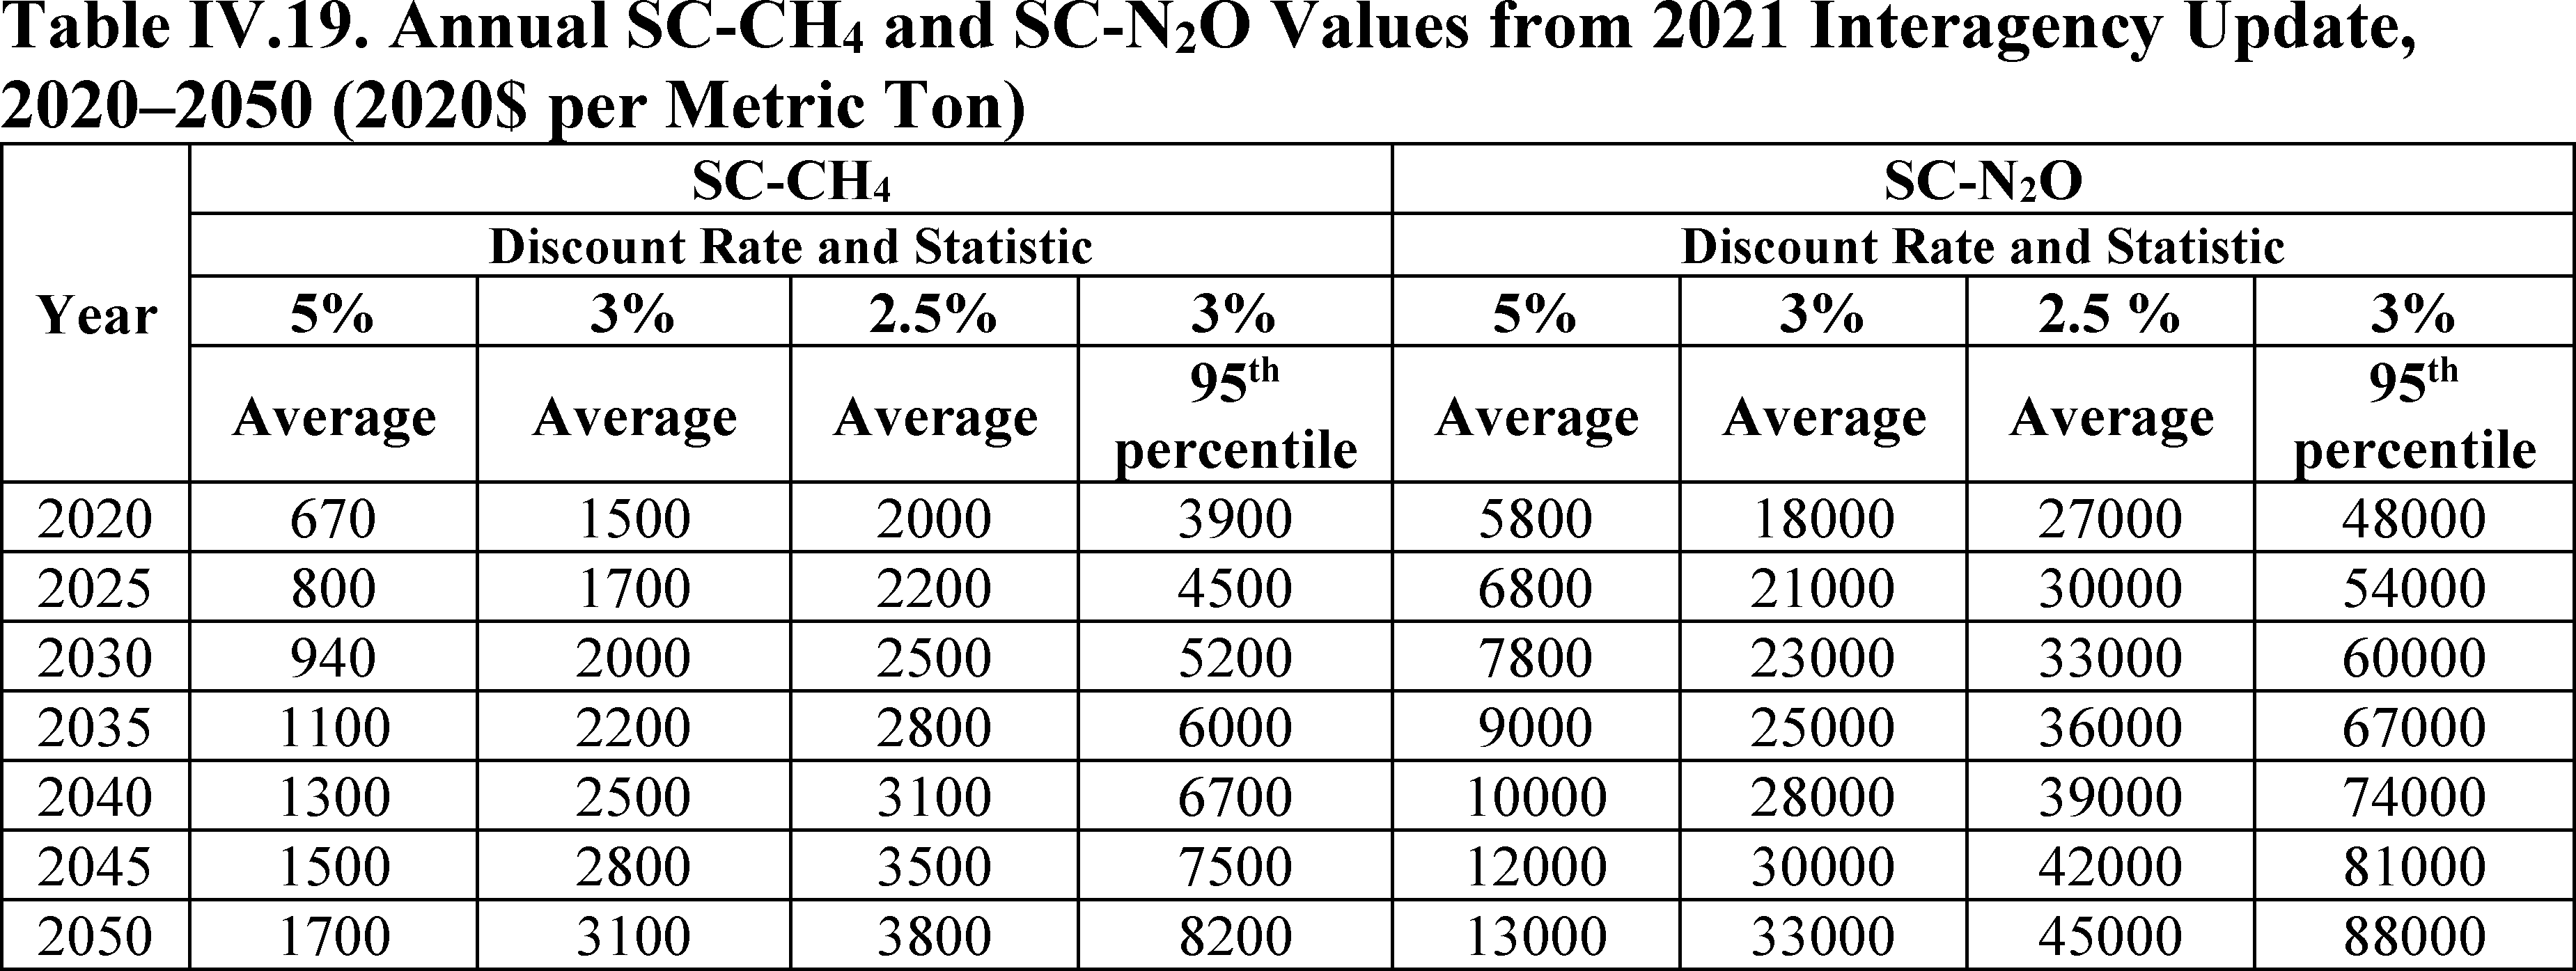
b. Social Cost of Methane and Nitrous Oxide
2. Monetization of Other Emissions Impacts
M. Utility Impact Analysis
N. Employment Impact Analysis
V. Analytical Results and Conclusions
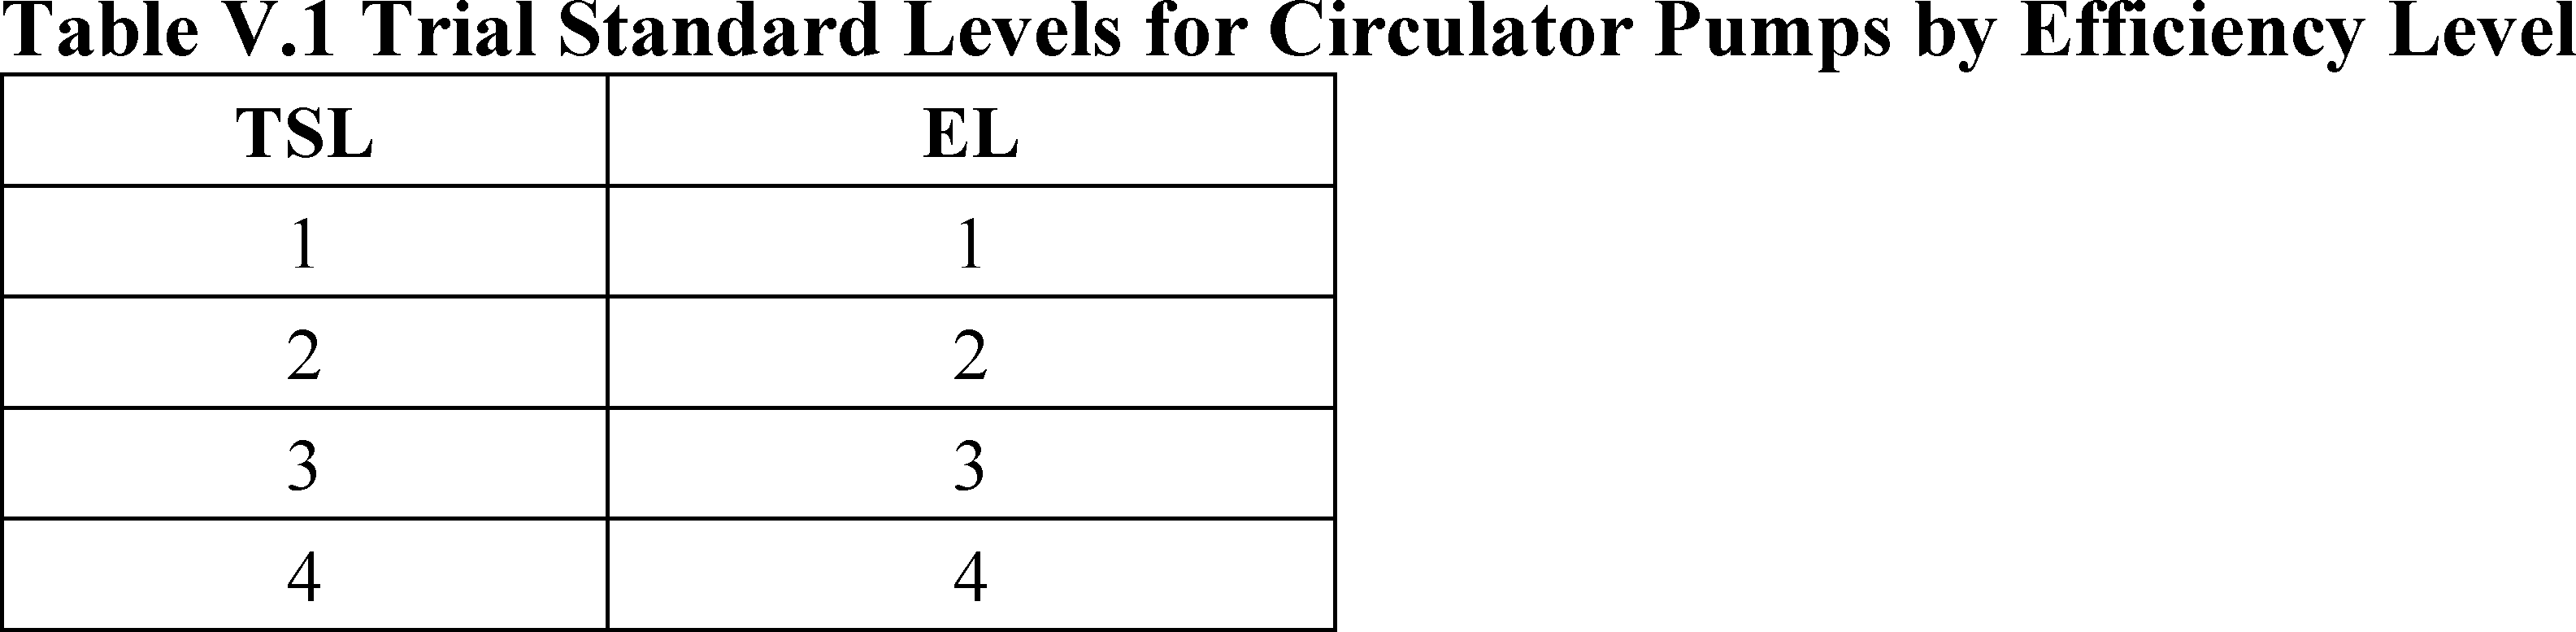
A. Trial Standard Levels
B. Economic Justification and Energy Savings
1. Economic Impacts on Individual Consumers
a. Life-Cycle Cost and Payback Period
b. Consumer Subgroup Analysis
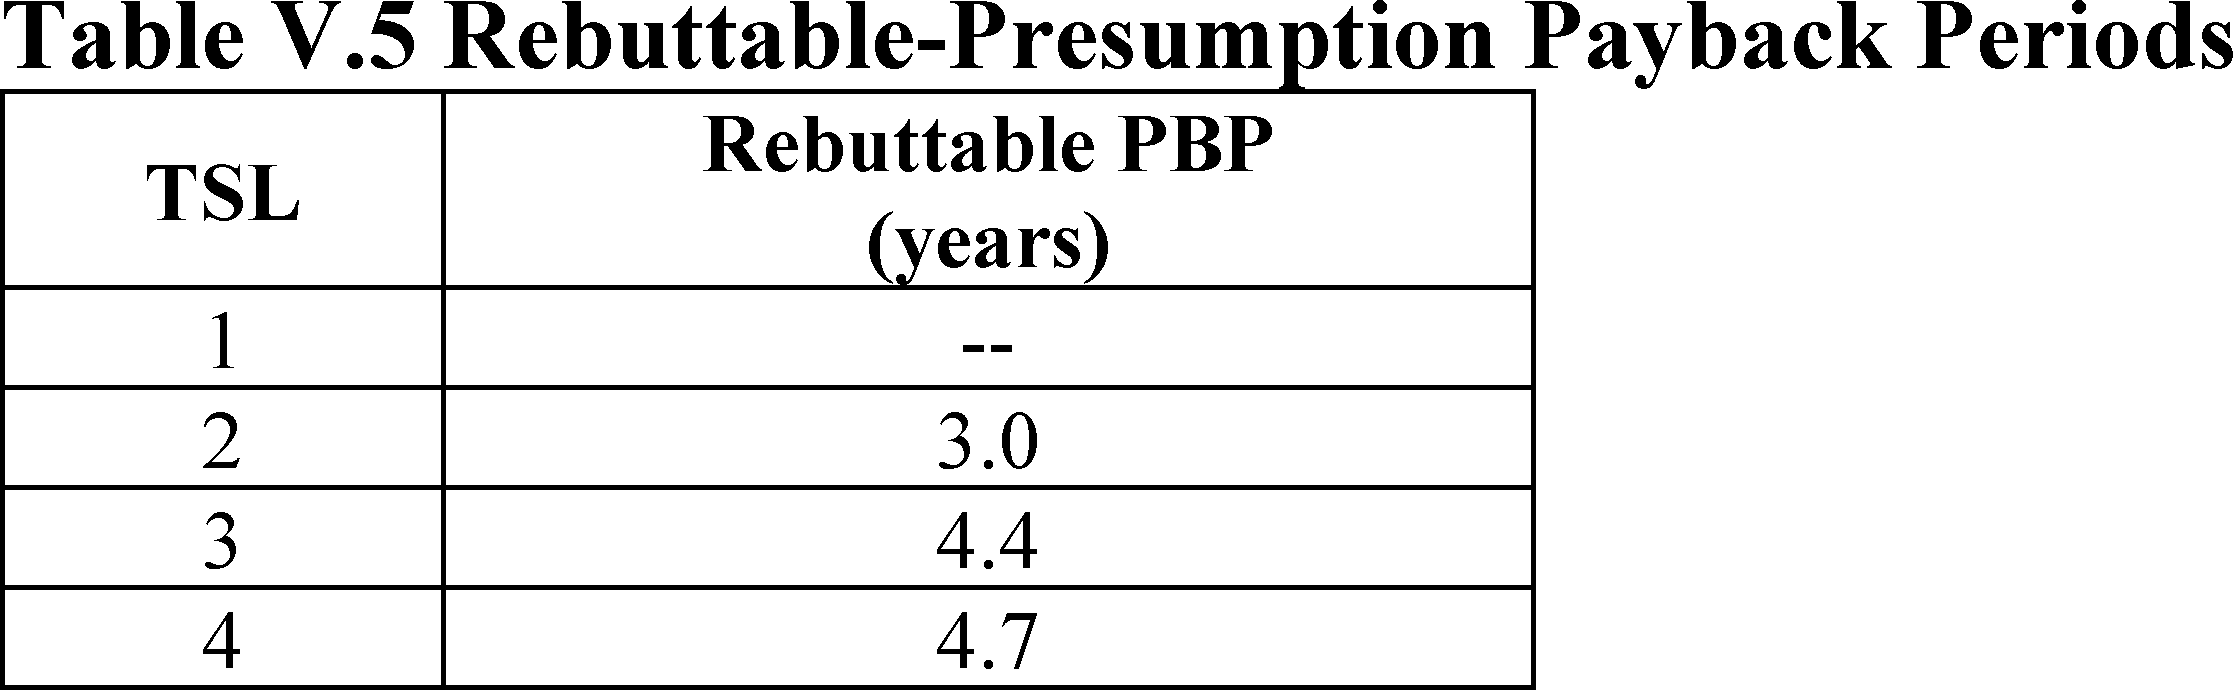
c. Rebuttable Presumption Payback
2. Economic Impacts on Manufacturers
a. Industry Cash Flow Analysis Results
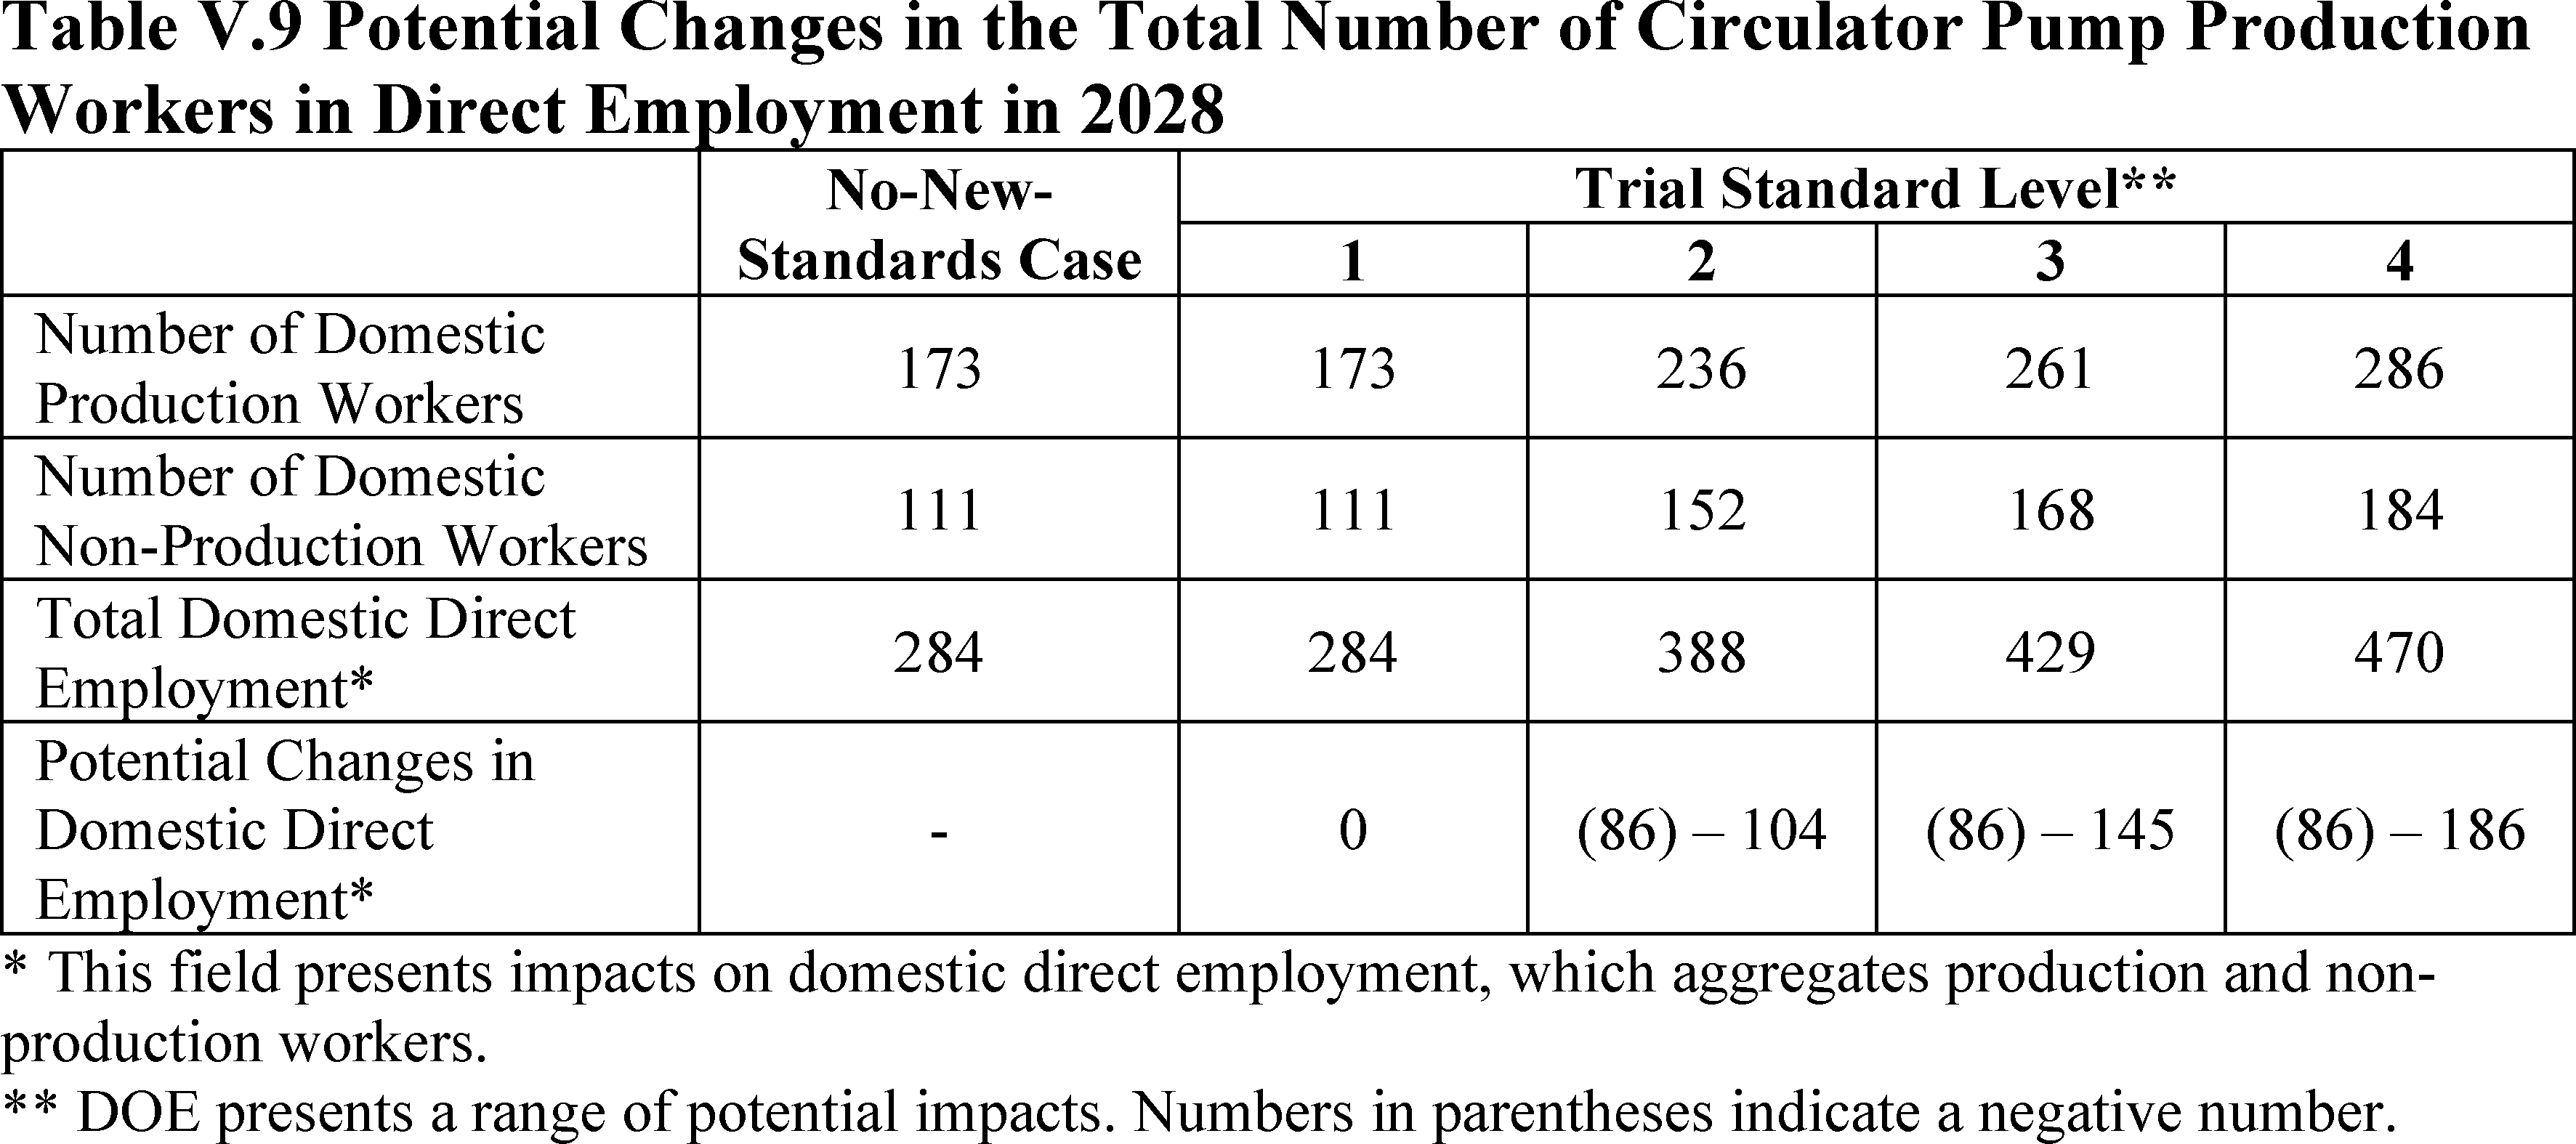
b. Direct Impacts on Employment
( printed page 44465)
c. Impacts on Manufacturing Capacity
d. Impacts on Subgroups of Manufacturers
e. Cumulative Regulatory Burden
3. National Impact Analysis
a. Significance of Energy Savings
b. Net Present Value of Consumer Costs and Benefits
c. Indirect Impacts on Employment
4. Impact on Utility or Performance of Equipment
5. Impact of Any Lessening of Competition
6. Need of the Nation To Conserve Energy
7. Other Factors
8. Summary of Economic Impacts
C. Conclusion
1. Benefits and Burdens of TSLs Considered for Circulator Pump Standards
2. Annualized Benefits and Costs of the Adopted Standards
VI. Procedural Issues and Regulatory Review
A. Review Under Executive Orders 12866, 13563, and 14094
B. Review Under the Regulatory Flexibility Act
1. Need for, and Objectives of, Rule
2. Significant Issues Raised by Public Comments in Response to the IRFA
3. Description and Estimated Number of Small Entities Affected
4. Description of Reporting, Recordkeeping, and Other Compliance Requirements
5. Significant Alternatives Considered and Steps Taken To Minimize Significant Economic Impacts on Small Entities
C. Review Under the Paperwork Reduction Act
D. Review Under the National Environmental Policy Act of 1969
The Energy Policy and Conservation Act, Public Law 94-163, as amended (“EPCA”),[1]
authorizes DOE to regulate the energy efficiency of a number of consumer products and certain industrial equipment. (42 U.S.C. 6291-6317) Title III, Part C of the Energy Policy and Conservation Act, as amended (EPCA), established the Energy Conservation Program for Certain Industrial Equipment. (42 U.S.C. 6311-6317) Such equipment includes pumps. Circulator pumps, which are the subject of this rulemaking, are a category of pumps.
Pursuant to EPCA, any new energy conservation standard must be designed to achieve the maximum improvement in energy efficiency that DOE determines is technologically feasible and economically justified. (42 U.S.C. 6316(a); 42 U.S.C. 6295(o)(2)(A)) Furthermore, the new standard must result in significant conservation of energy. (42 U.S.C. 6295(o)(3)(B)) EPCA also provides that not later than 6 years after issuance of any final rule establishing or amending a standard, DOE must publish either a notice of determination that standards for the equipment do not need to be amended, or a notice of proposed rulemaking including new proposed energy conservation standards (proceeding to a final rule, as appropriate). (42 U.S.C. 6295(m))
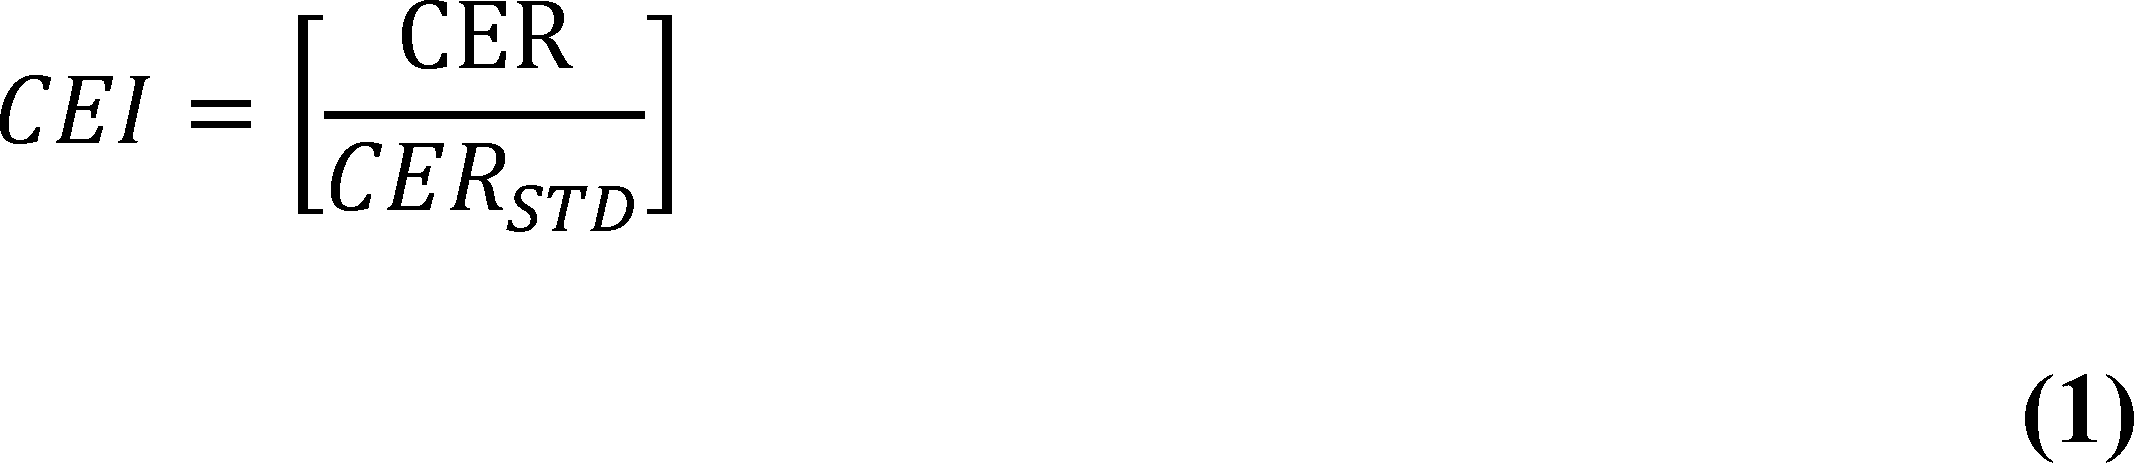
In accordance with these and other statutory provisions discussed in this document, DOE analyzed the benefits and burdens of four trial standard levels (“TSLs”) for circulator pumps. The TSLs and their associated benefits and burdens are discussed in detail in sections V.A through V.C of this document. As discussed in section V.C of this document, DOE has determined that TSL 2 represents the maximum improvement in energy efficiency that is technologically feasible and economically justified. The adopted standards, which are expressed in in terms of a maximum circulator energy index (“CEI”), are shown in Table I.1. These standards apply to all equipment listed in Table I.1 and manufactured in, or imported into, the United States starting on May 22, 2028.
As stated in section III.D.1 of this document, the established standards apply to circulator pumps when operated using the least consumptive control variety with which they are equipped.
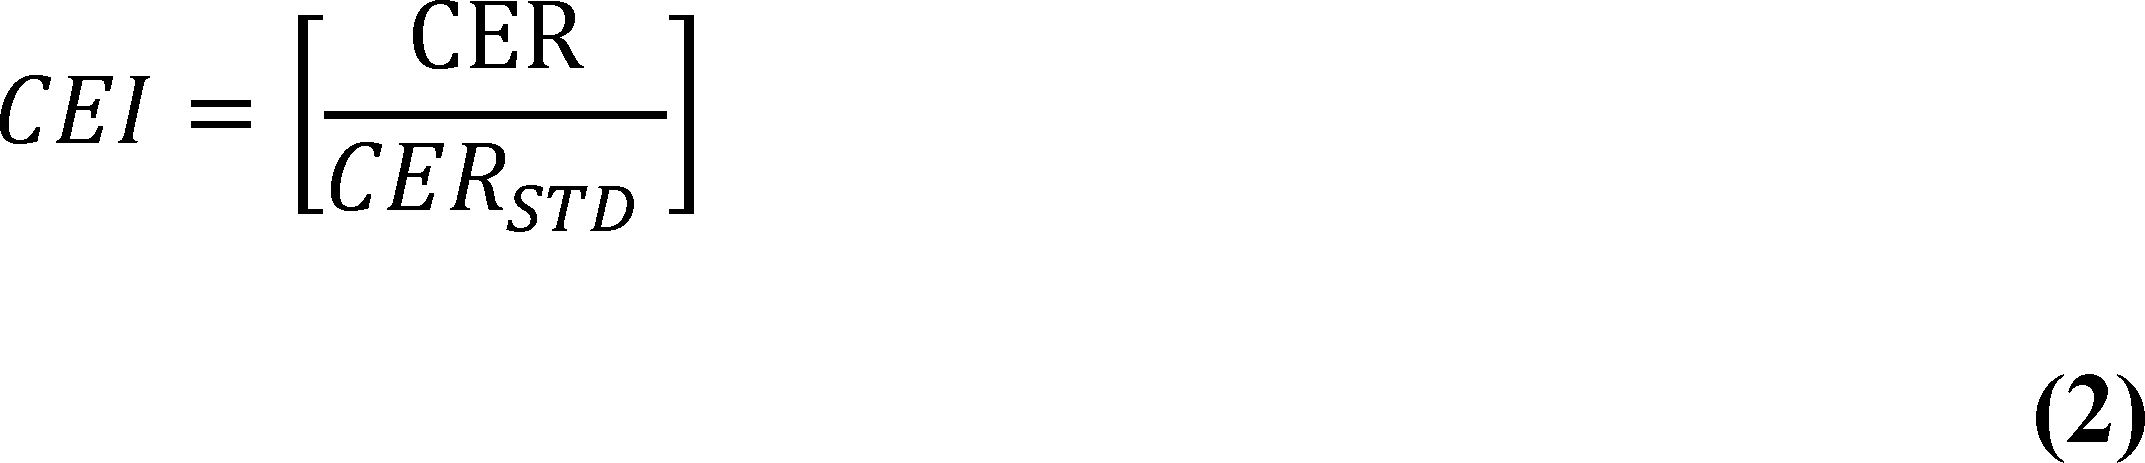
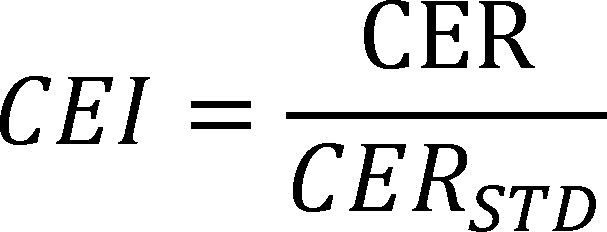
CEI is defined as shown in equation (1), and consistent [2]
with section 41.5.3.2 of HI 41.5-2022, “Hydraulic Institute Program Guideline for Circulator Pump Energy Rating Program.” [3] 87 FR 57264.
Where:
CEI = the circulator energy index (dimensionless);
CER = circulator energy rating (hp); and
CERSTD
= for a circulator pump that is minimally compliant with DOE's energy conservation standards with the same hydraulic horsepower as the tested pump.
The value of CER varies according to the circulator pump control variety of the tested pump, but in all cases is a function of measured pump input power when operated under certain conditions, as described in the
( printed page 44466)
September 2022 TP Final Rule. 87 FR 57264.
Relatedly, CERSTD
represents CER for a circulator pump that is minimally compliant with DOE's energy conservation standards with the same hydraulic horsepower as the tested pump, as determined in accordance with the specifications at paragraph (i) of 10 CFR 431.465. 87 FR 57264.
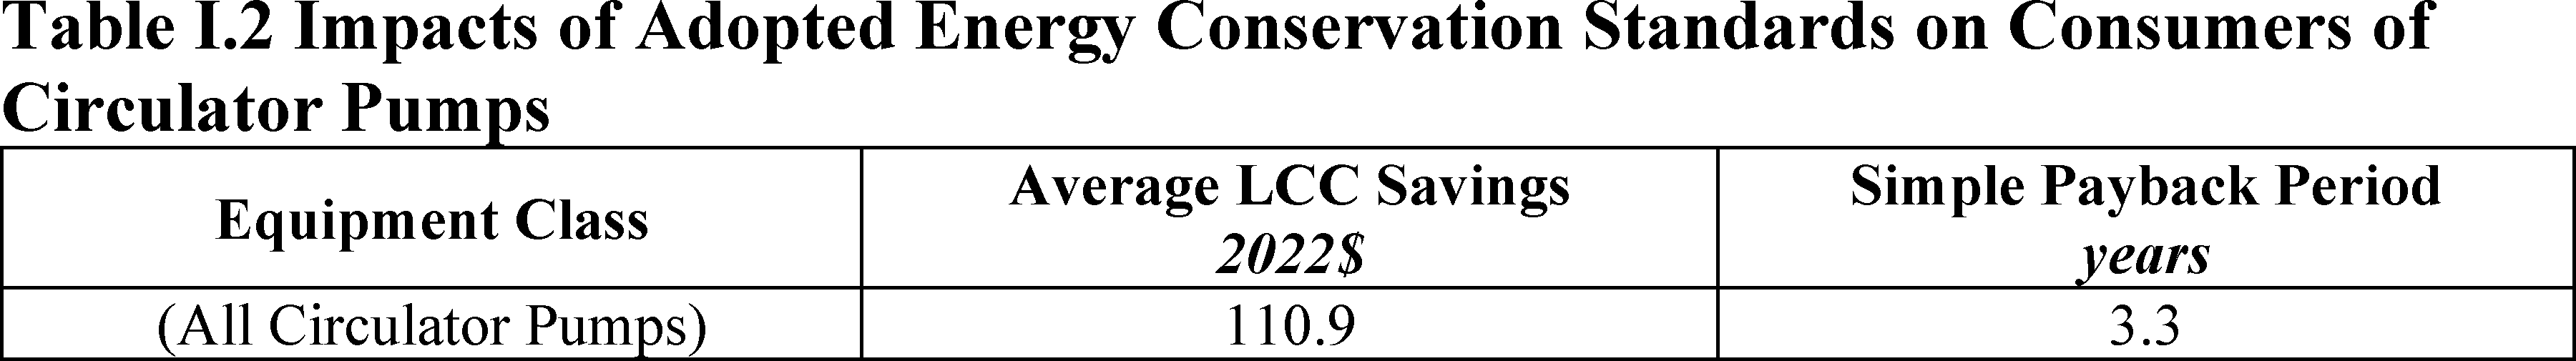
A. Benefits and Costs to Consumers
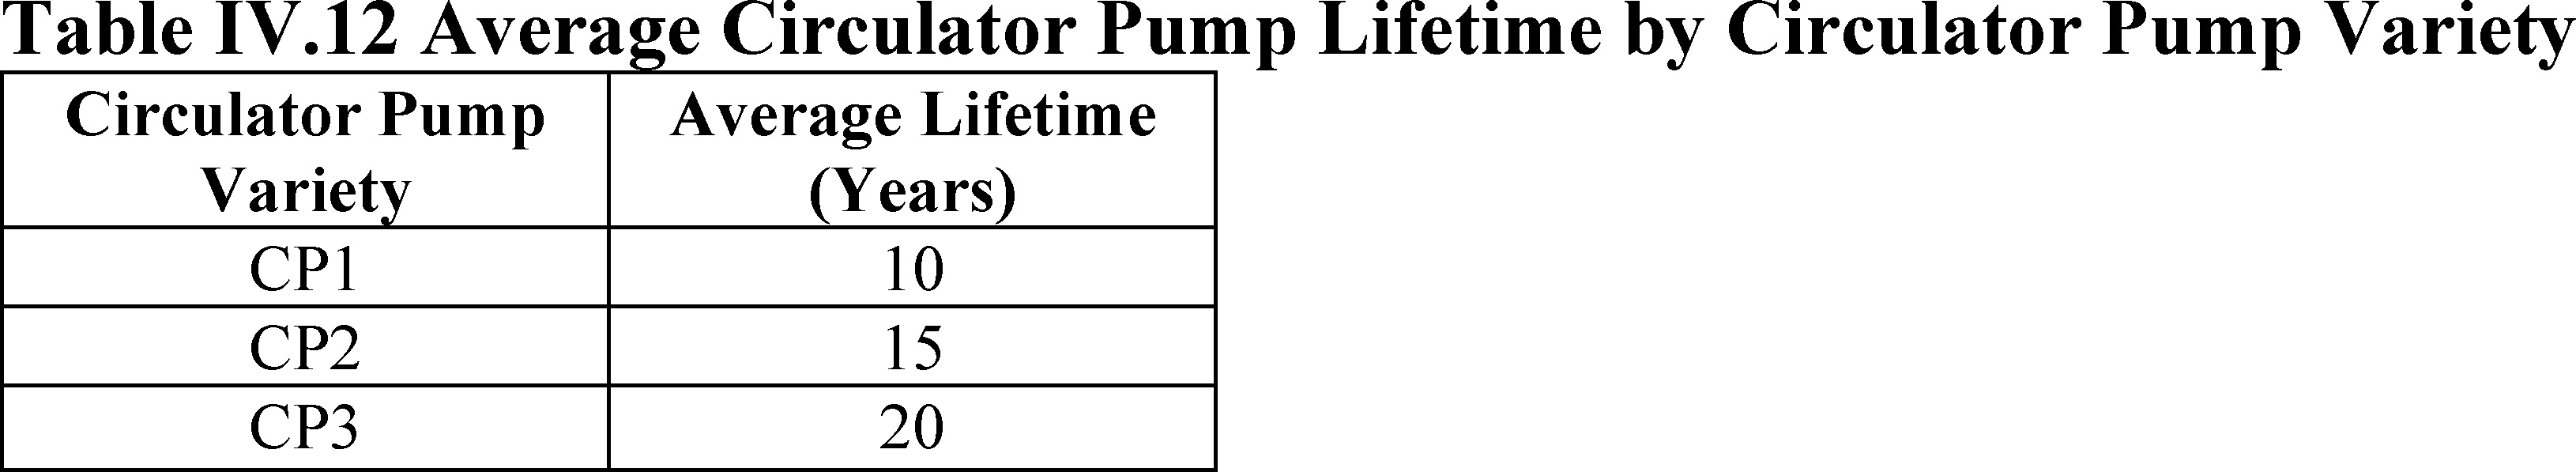
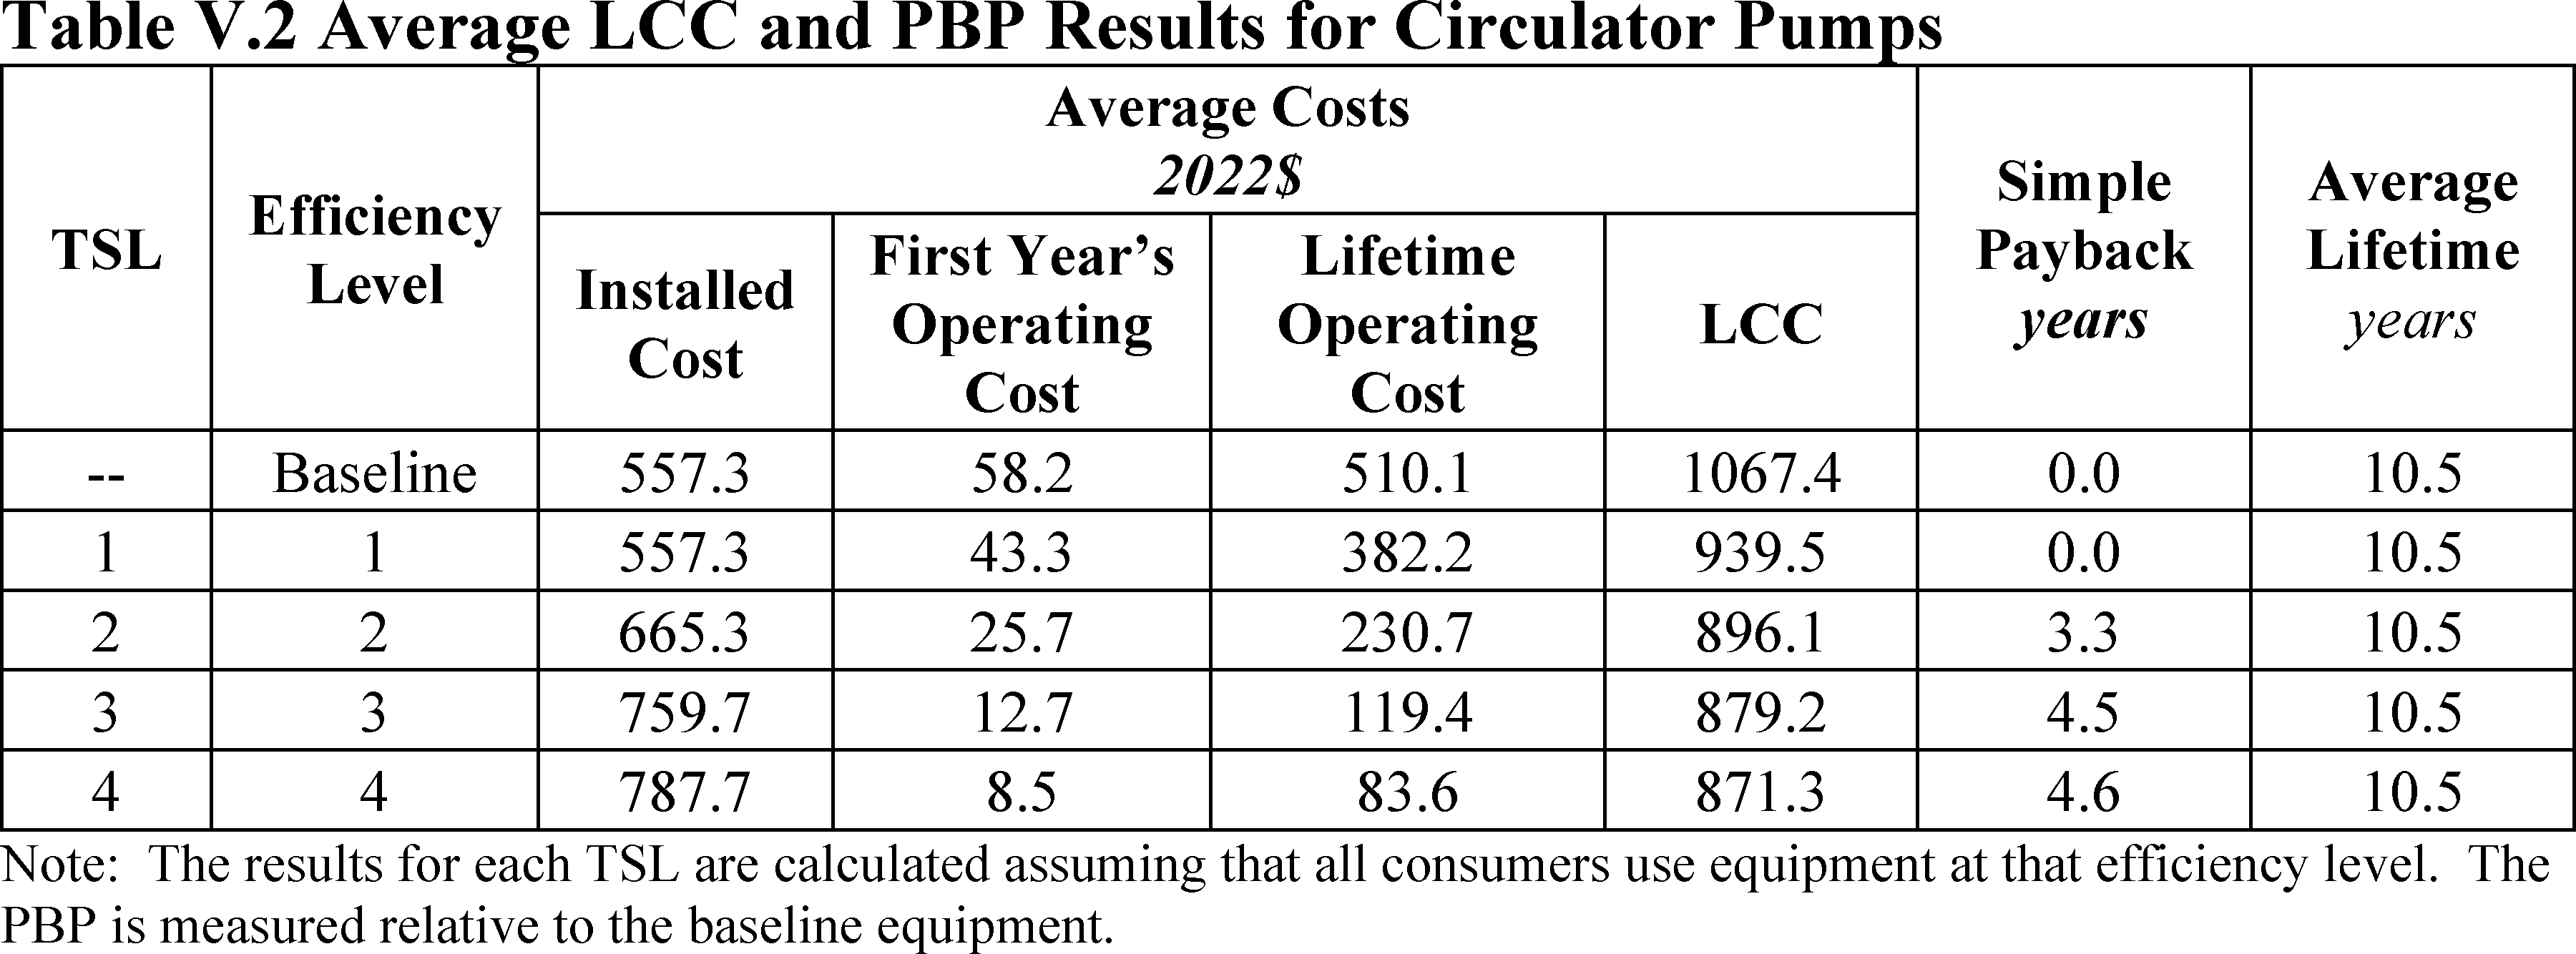
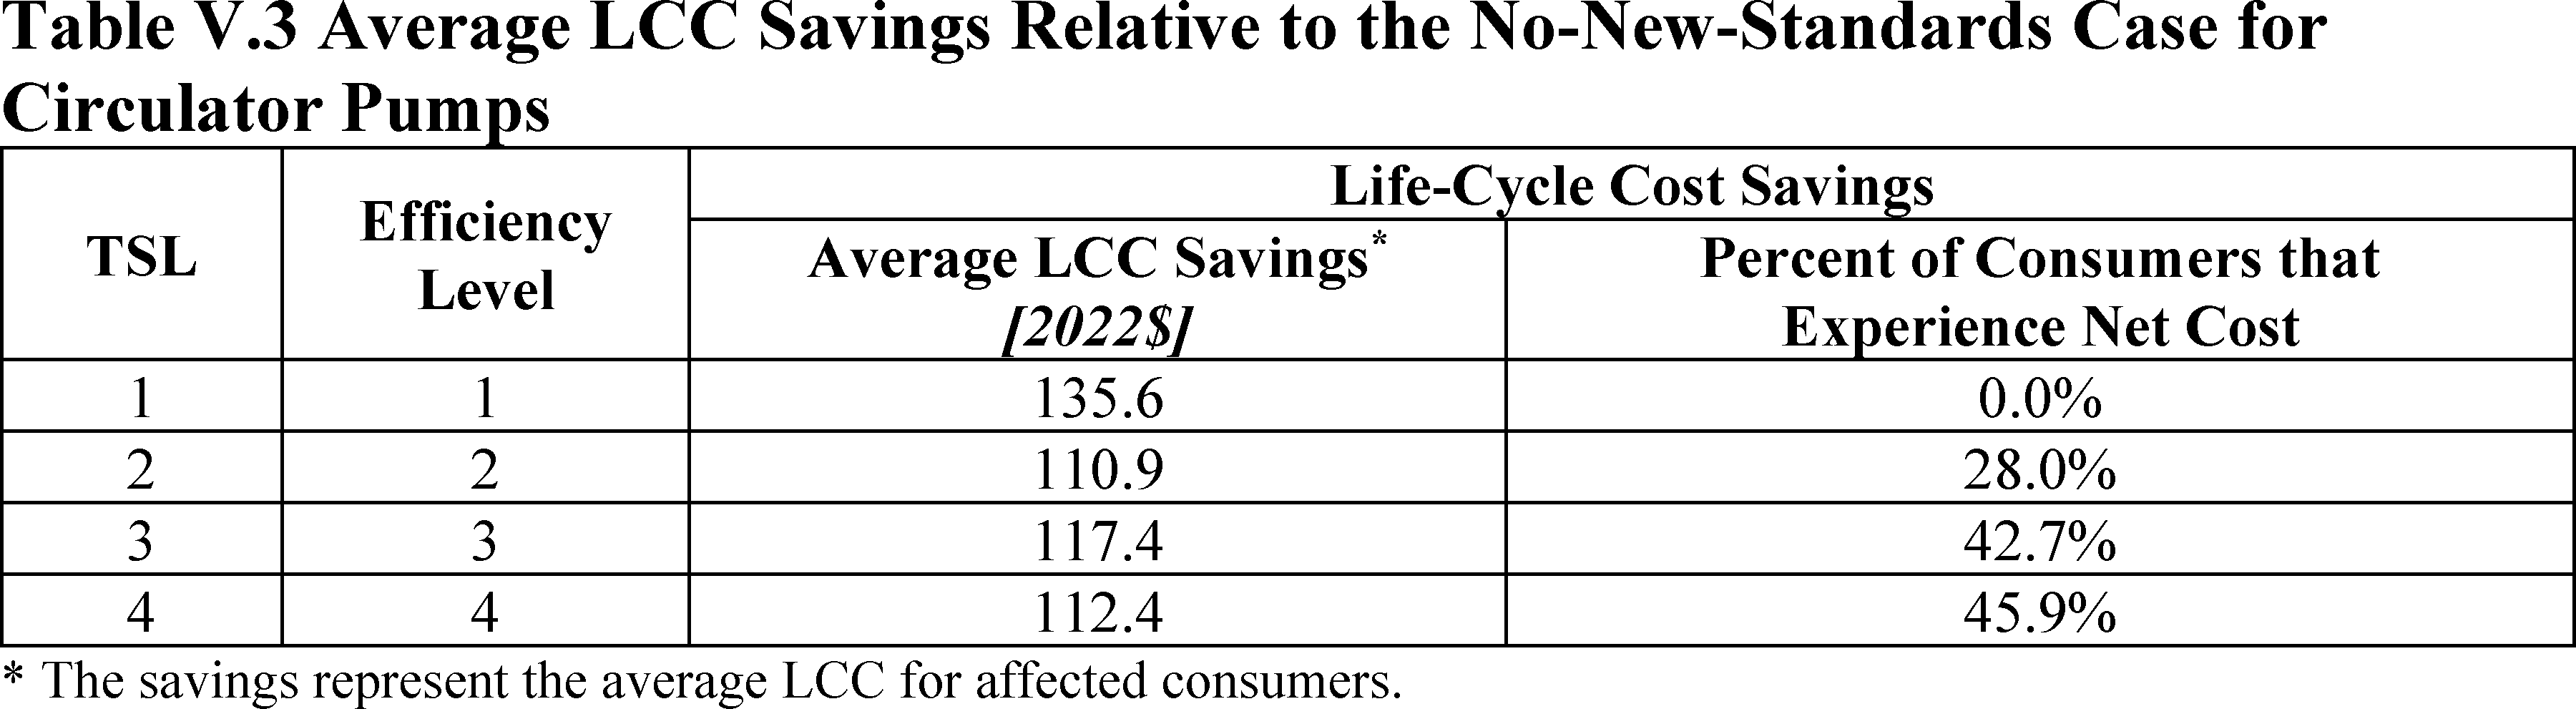
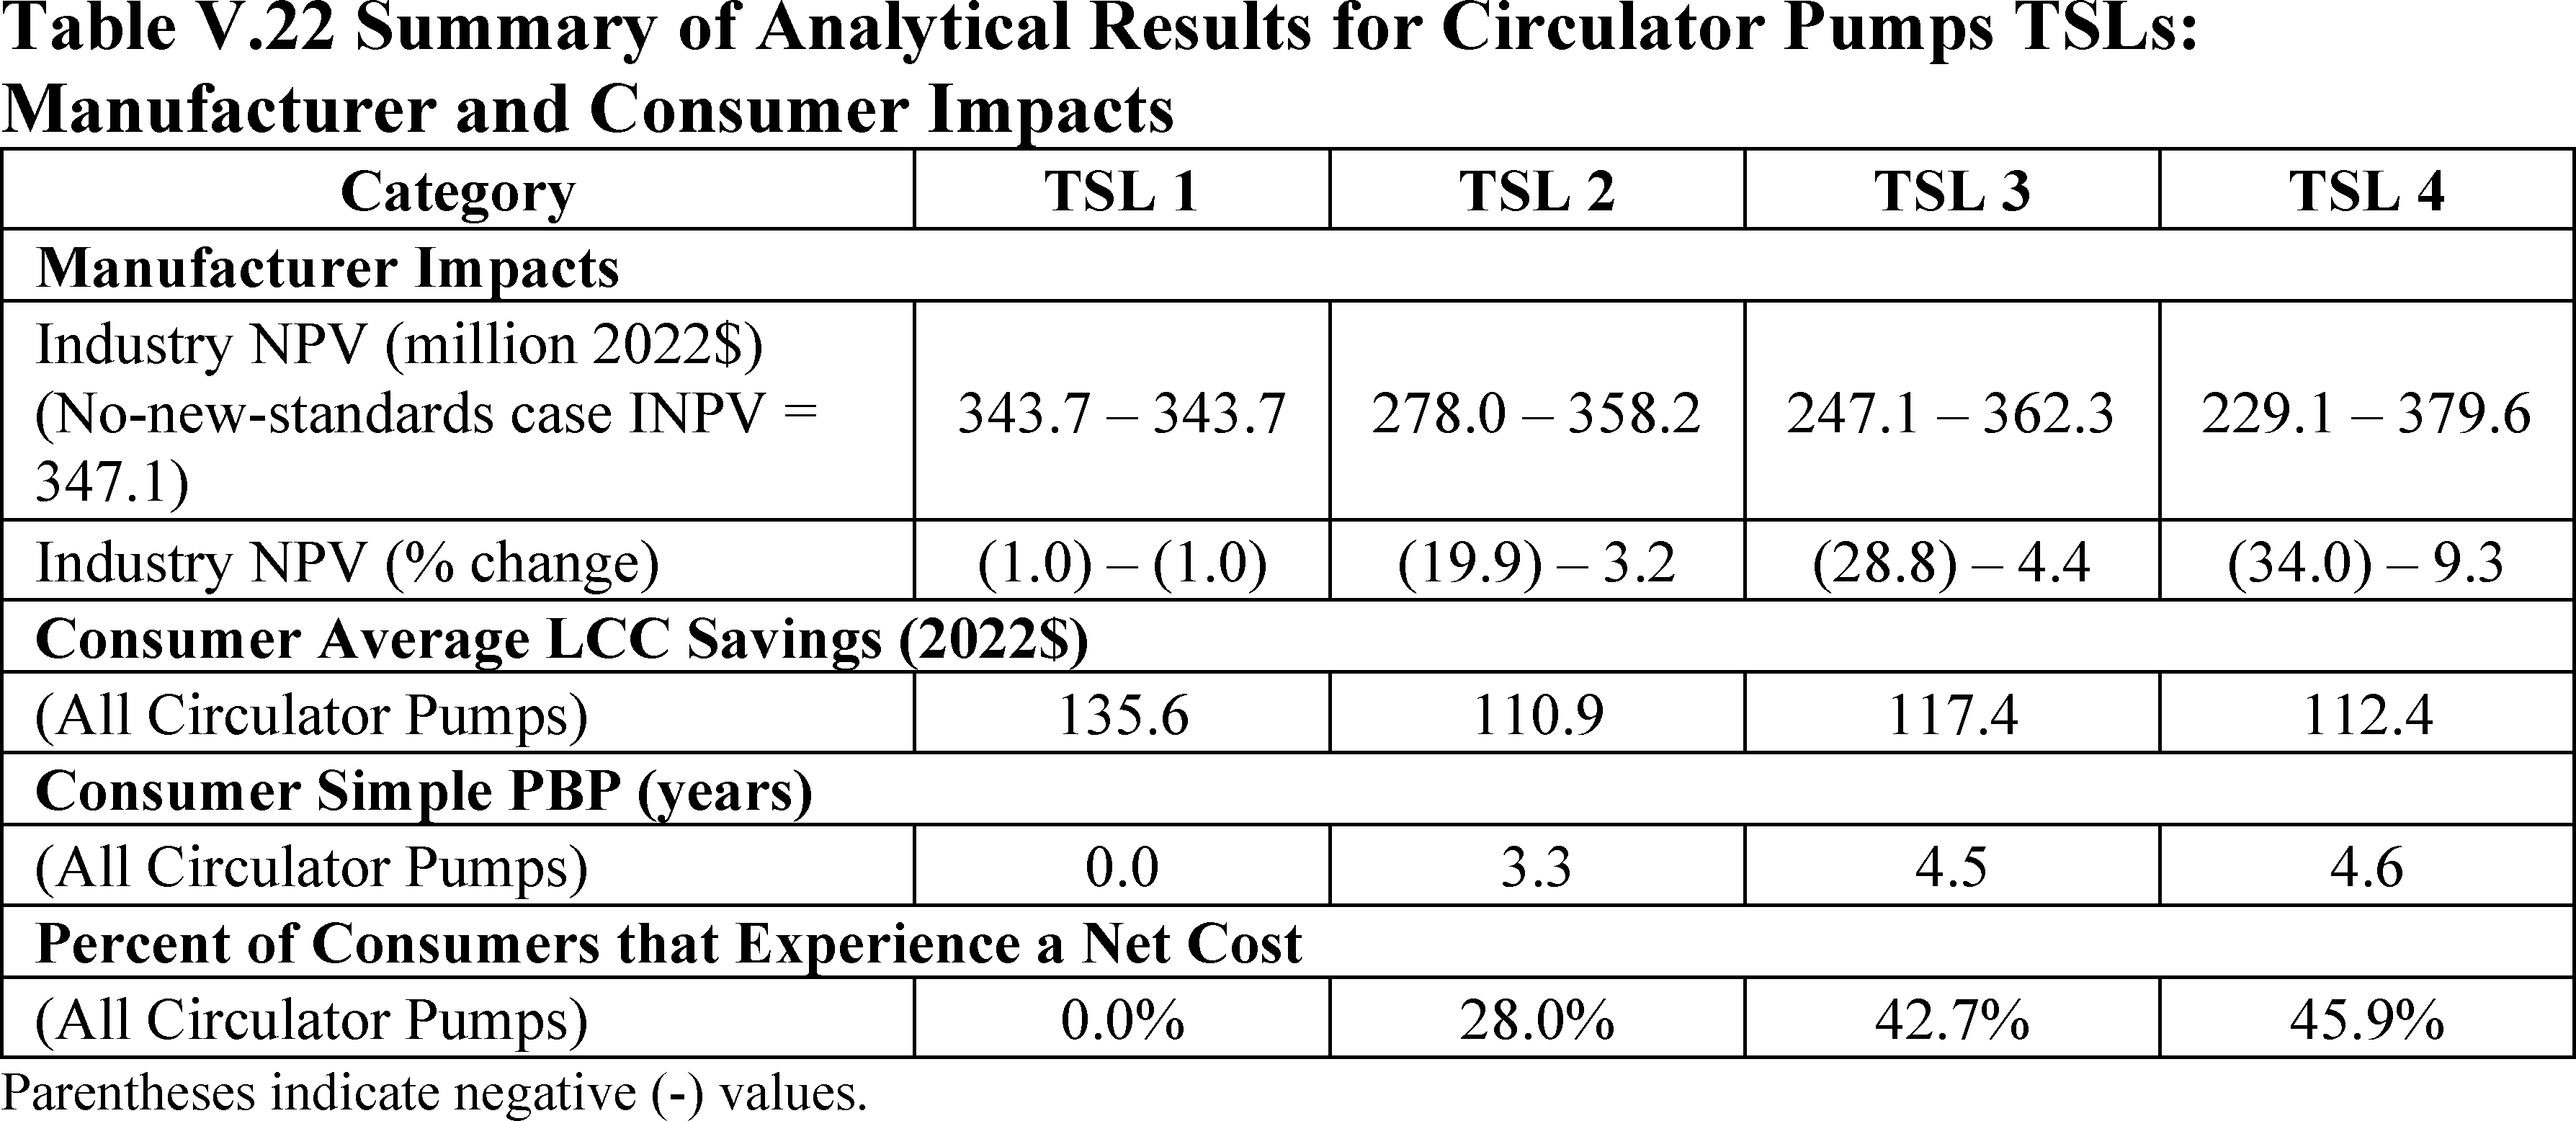
Table I.2 summarizes DOE's evaluation of the economic impacts of the adopted standards on consumers of circulator pumps, as measured by the average life-cycle cost (“LCC”) savings and the simple payback period (“PBP”).[4]
The average LCC savings are positive for all equipment classes, and the PBP is less than the average lifetime of circulator pumps, which is estimated to be 10.5 years (
see
section IV.F.6 of this document).
DOE's analysis of the impacts of the adopted standards on consumers is described in section IV.F of this document.
B. Impact on Manufacturers
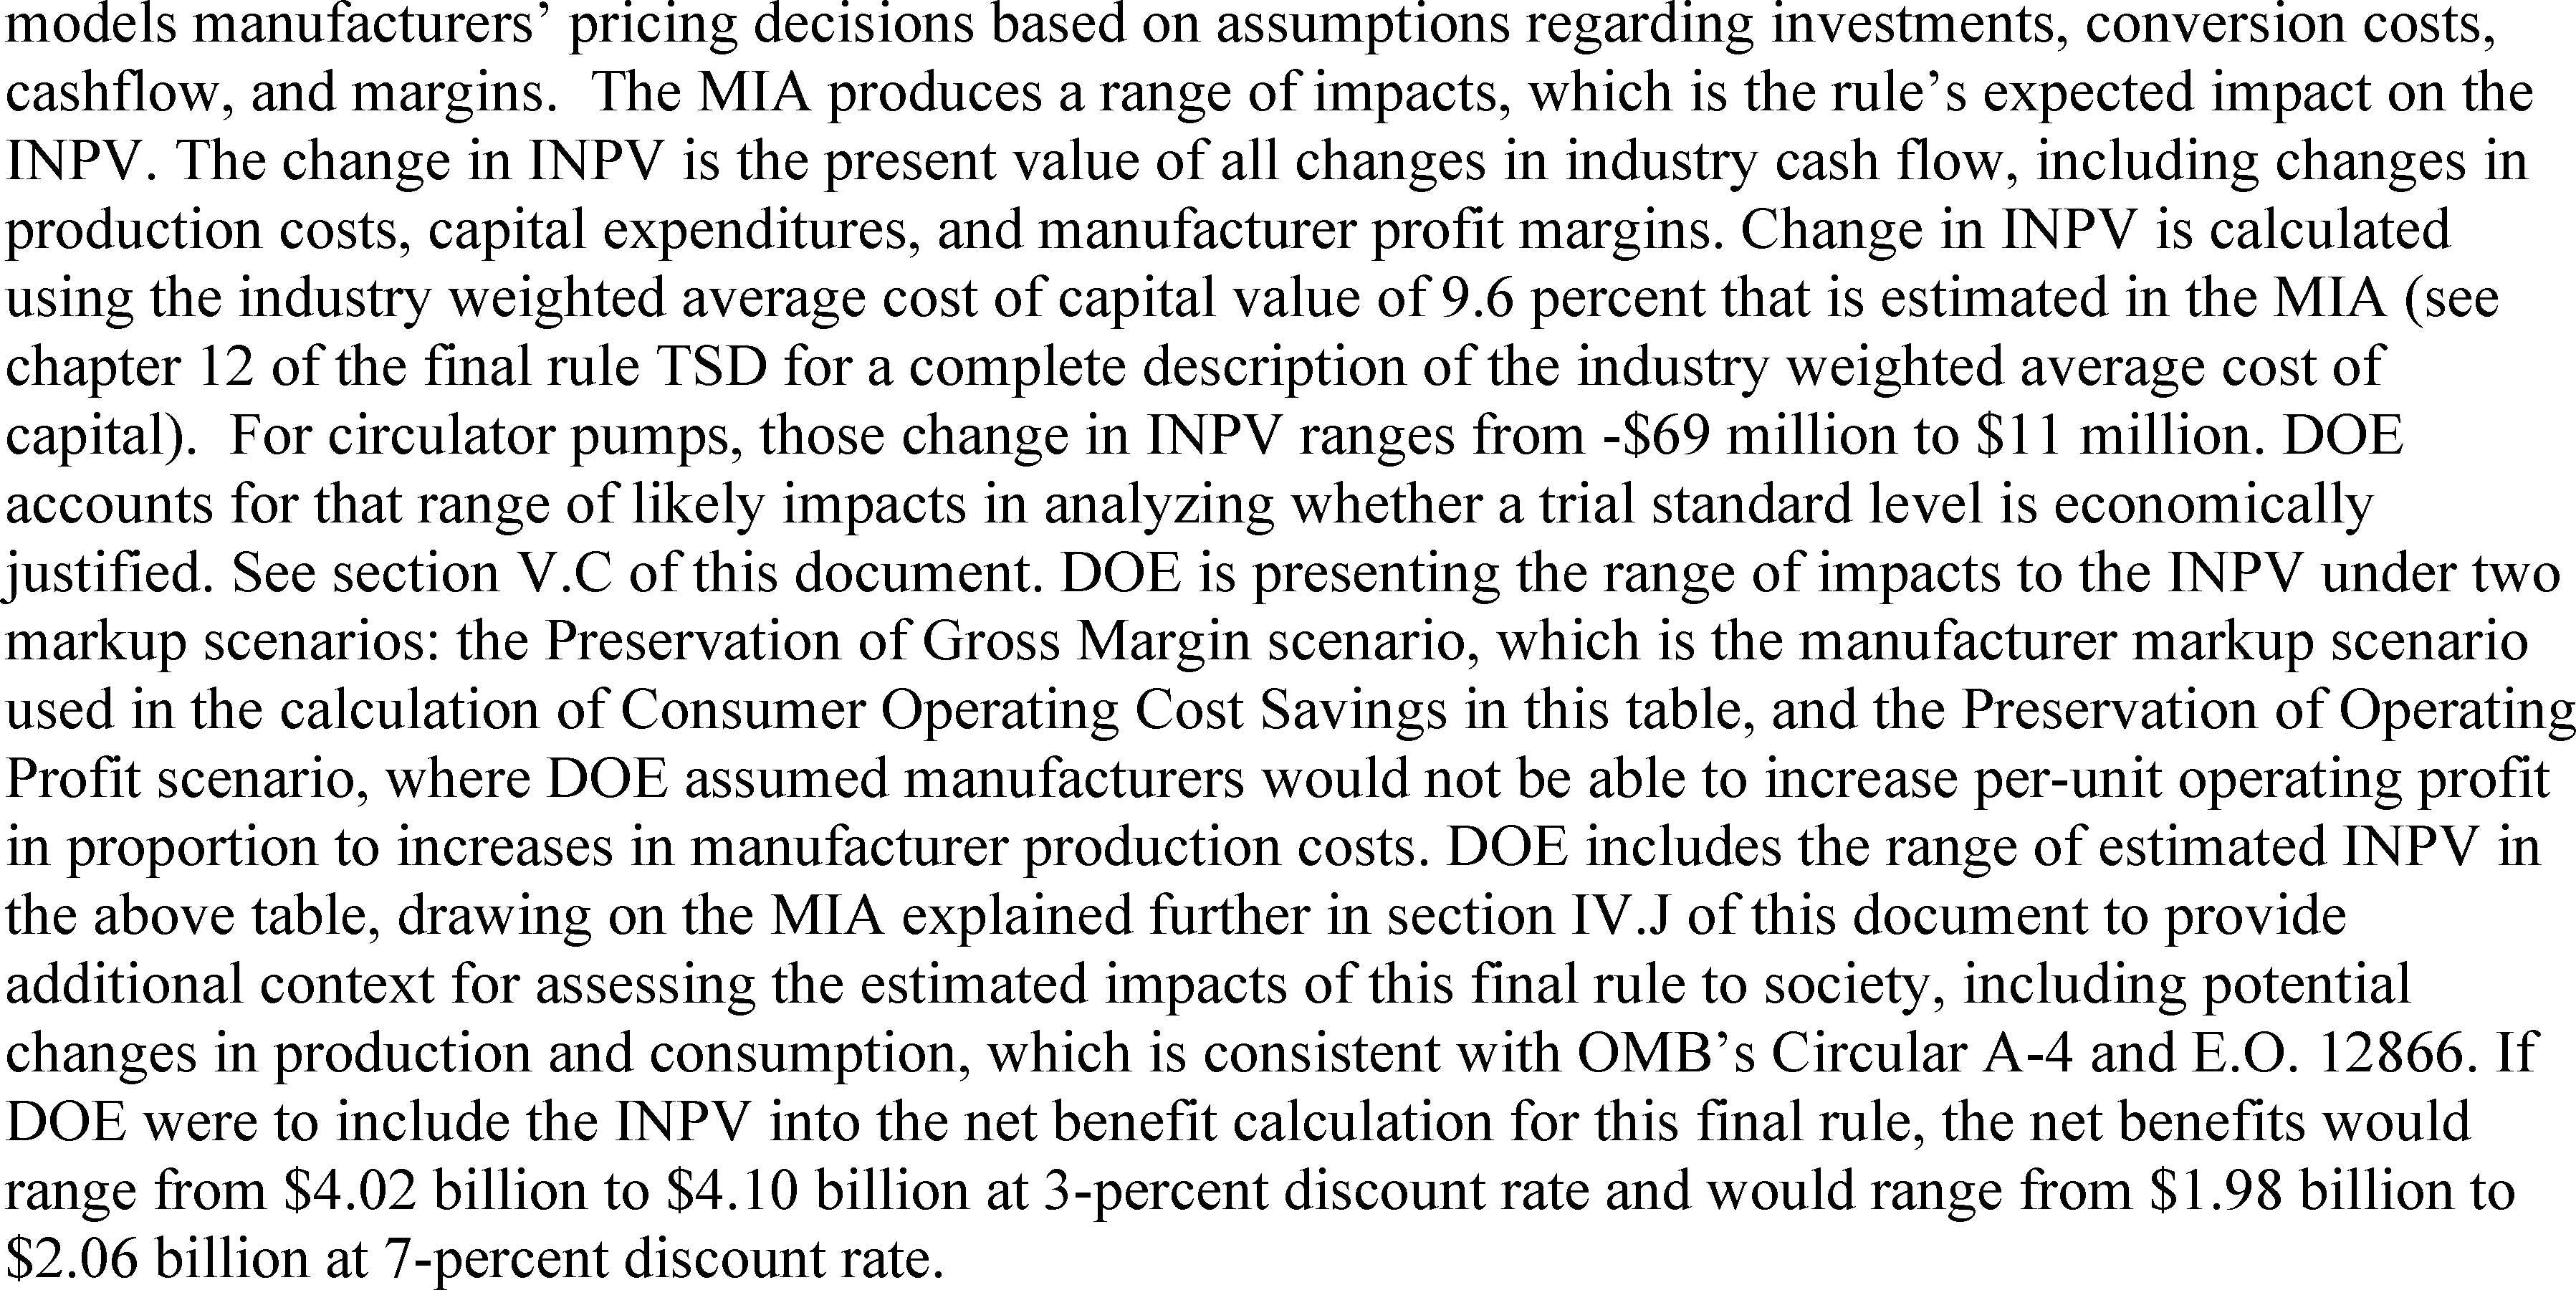
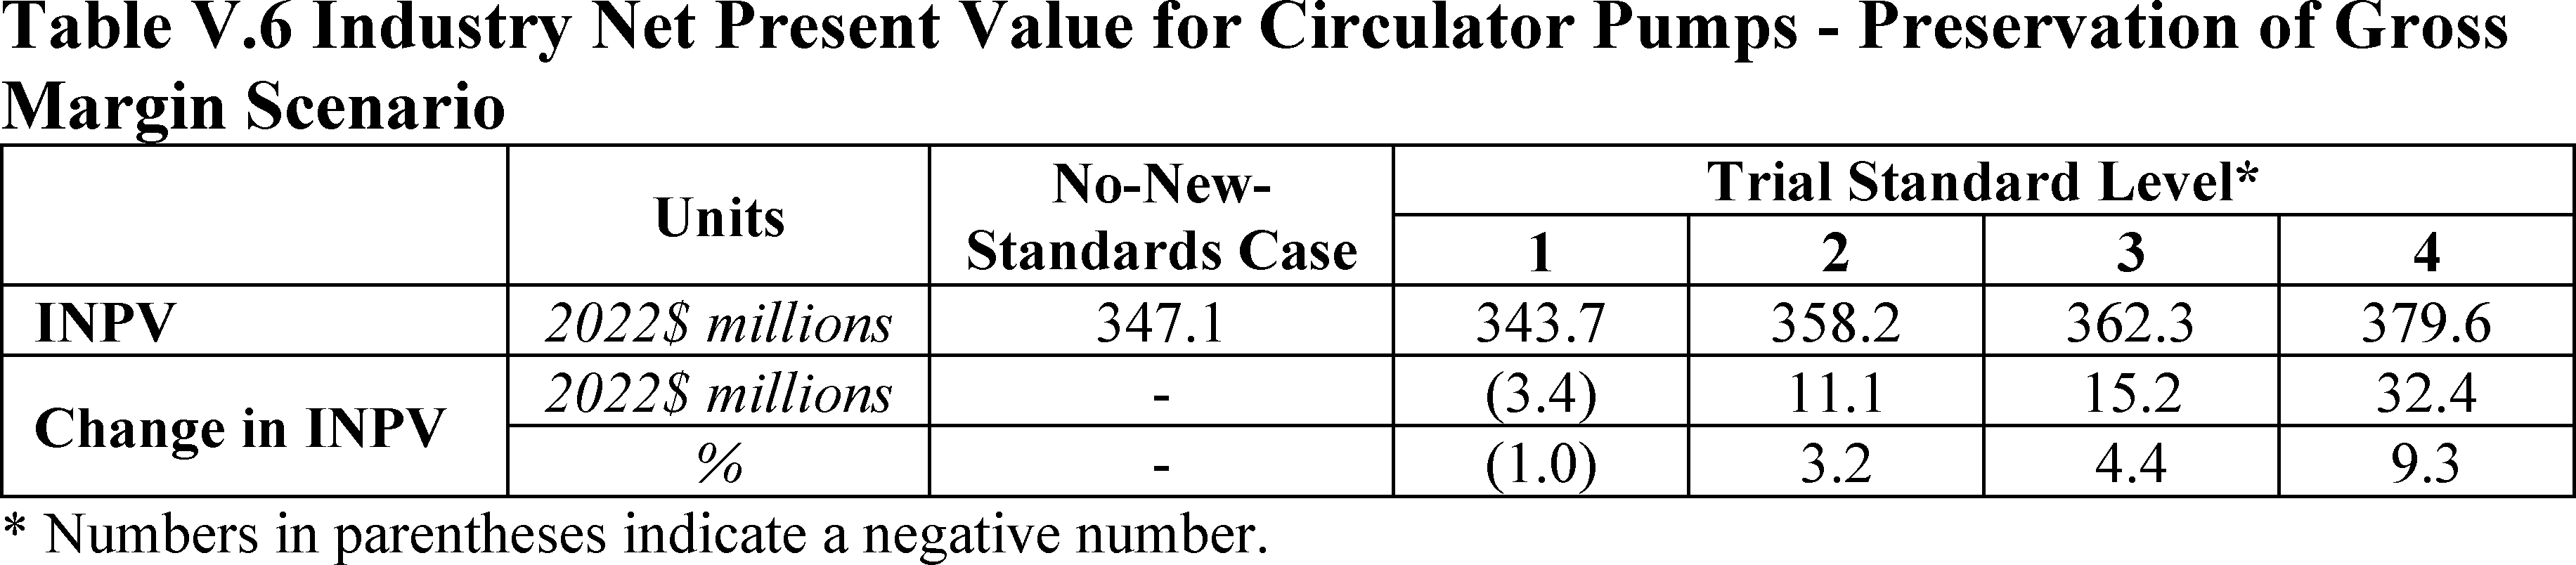
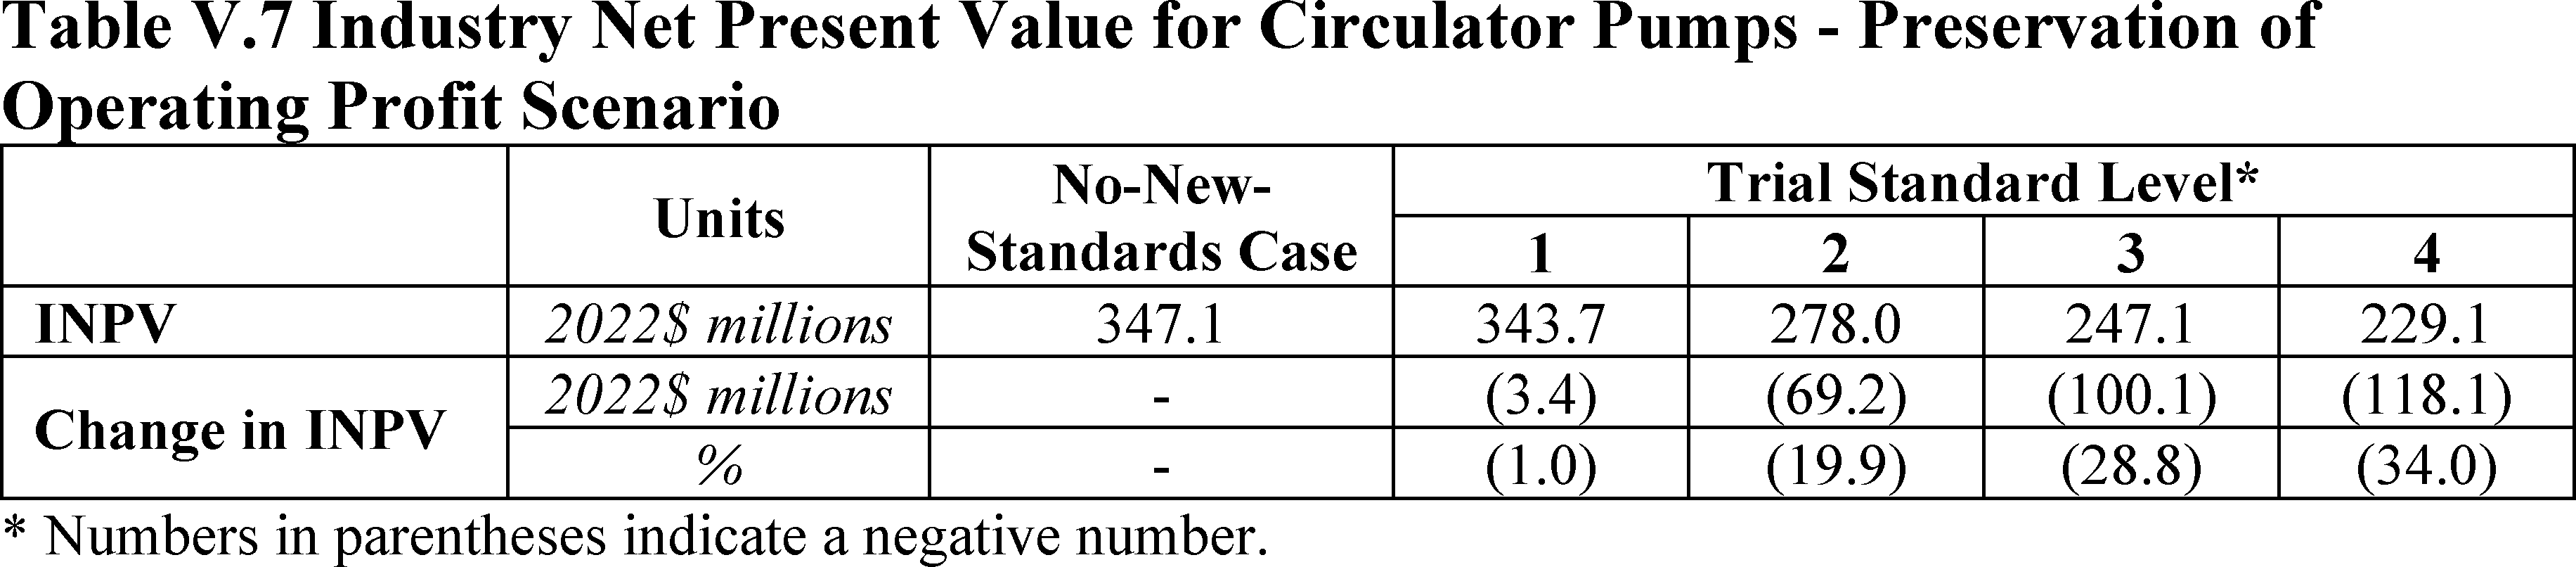
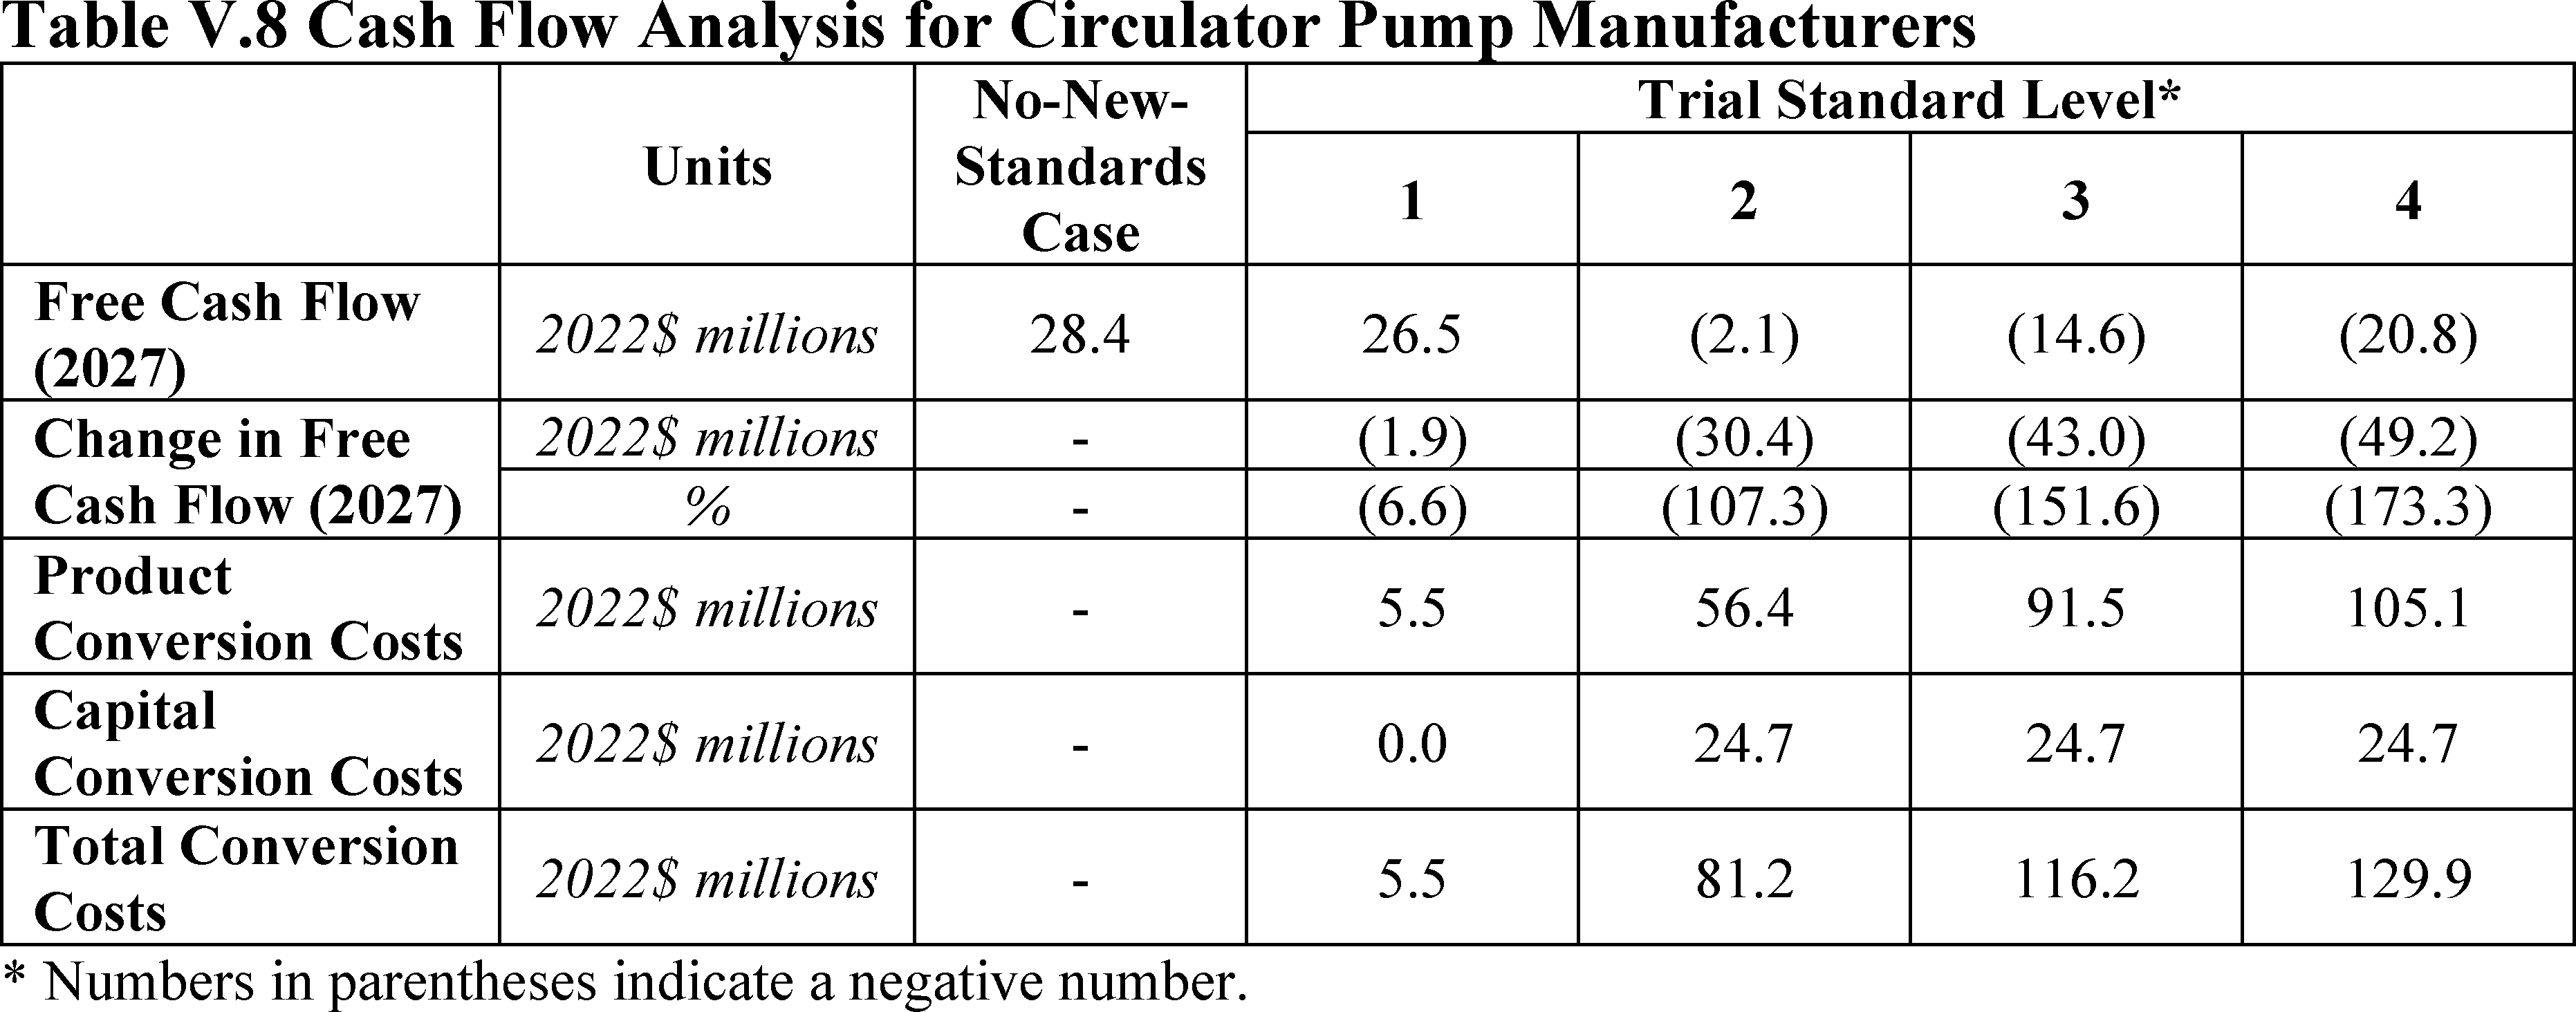
The industry net present value (“INPV”) is the sum of the discounted cash flows to the industry from the base year through the end of the analysis period (2024-2057). Using a real discount rate of 9.6 percent, DOE estimates that the INPV for manufacturers of circulator pumps in the case without new standards is $347.1 million in 2022$. Under the adopted standards, DOE estimates the change in INPV to range from −19.9 percent to 3.2 percent, which is approximately −$69.2 million to $11.1 million. In order to bring equipment into compliance with new standards, it is estimated that industry will incur total conversion costs of $81.2 million.
DOE's analysis of the impacts of the adopted standards on manufacturers is described in sections IV.J and V.B.2 of this document.
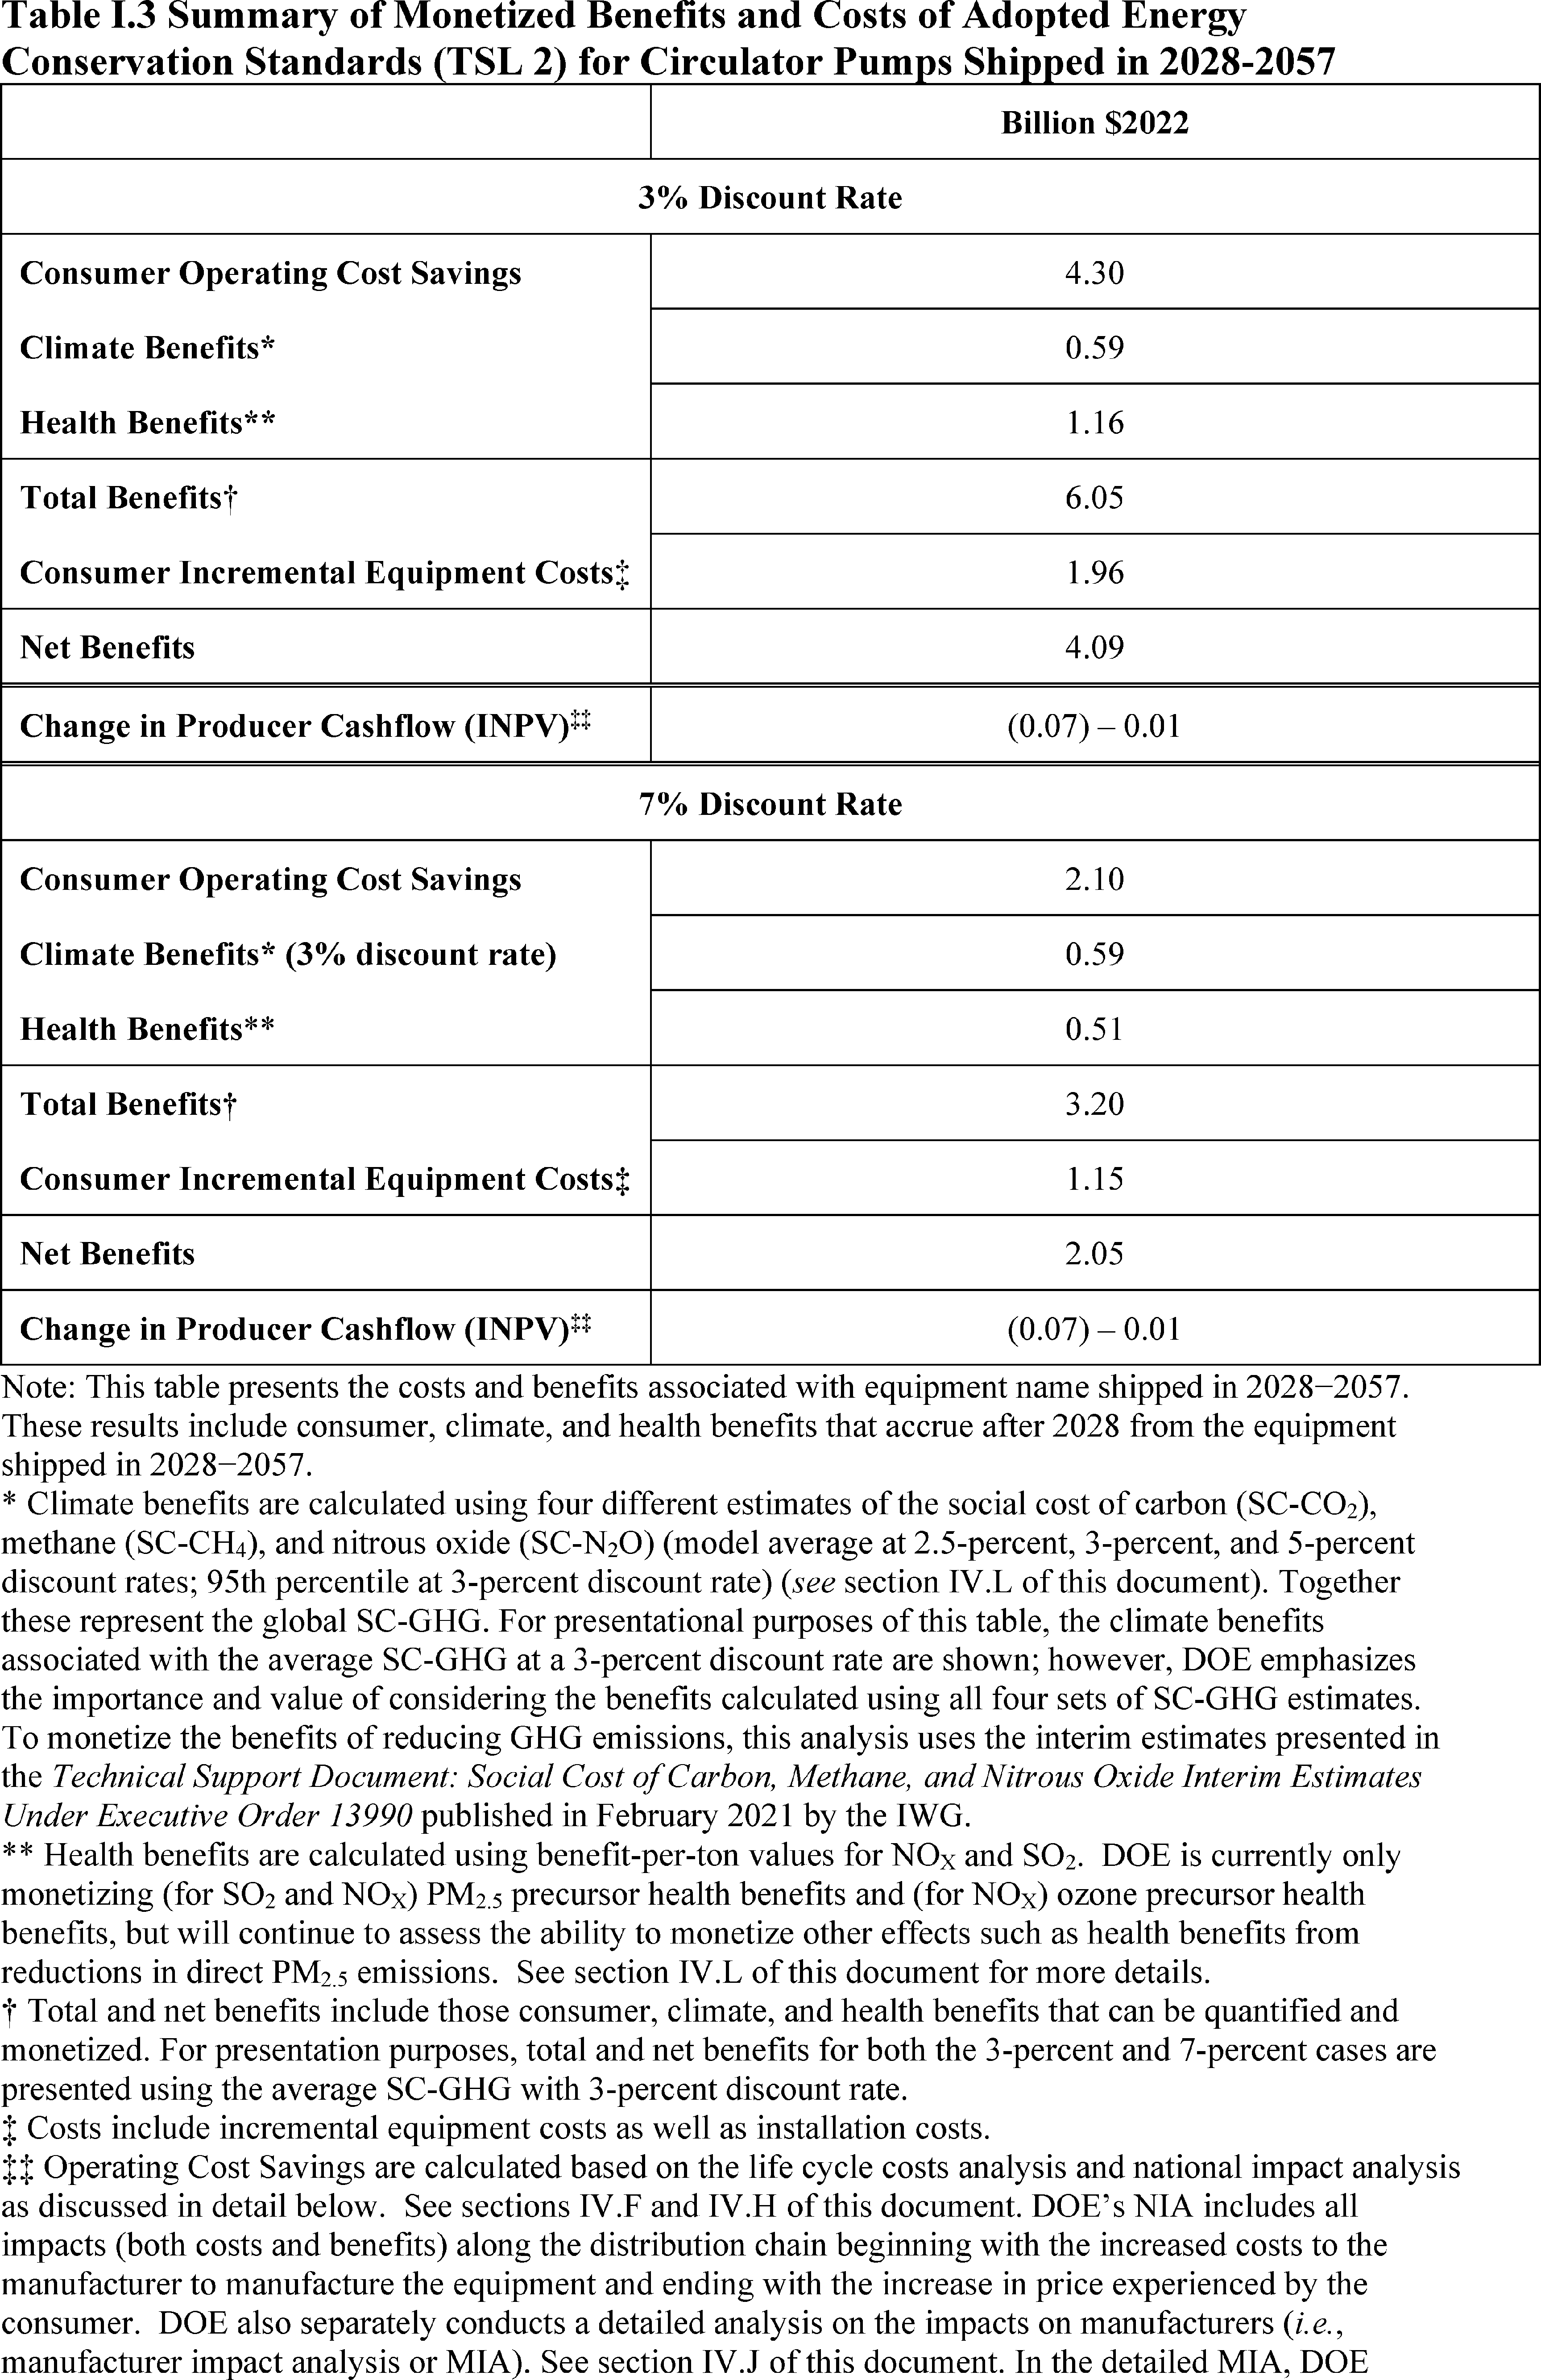
C. National Benefits and Costs
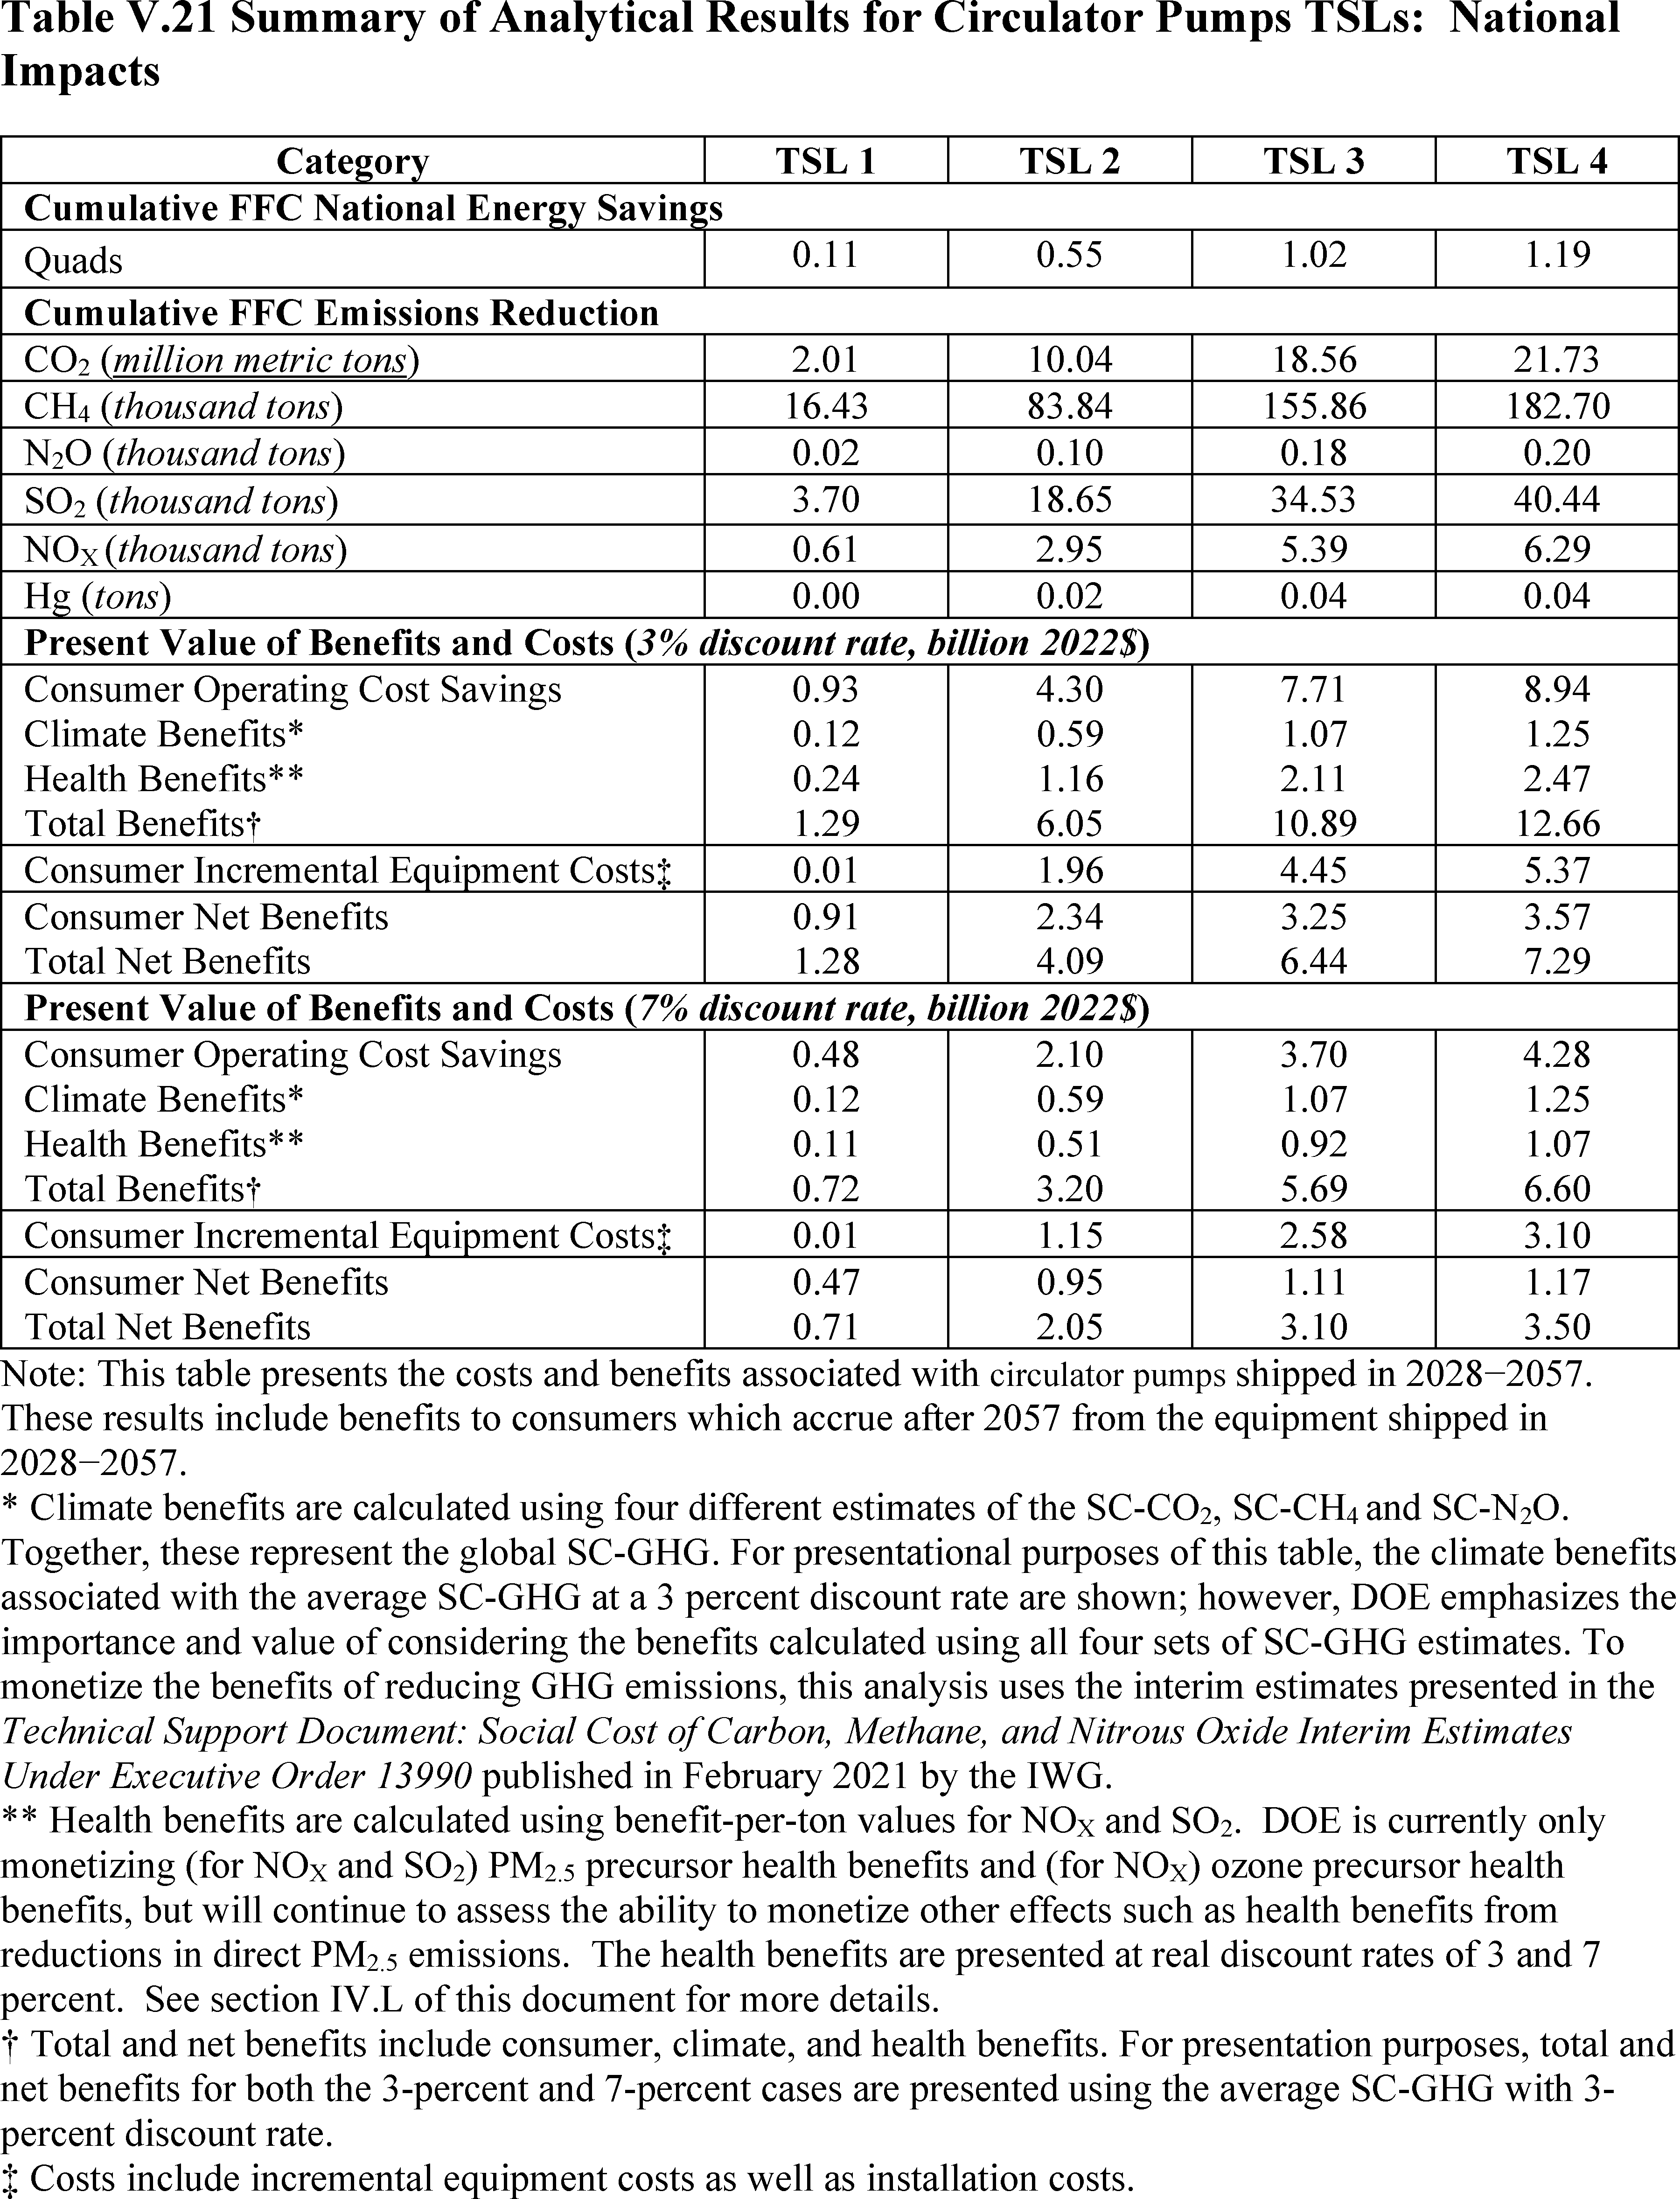
5
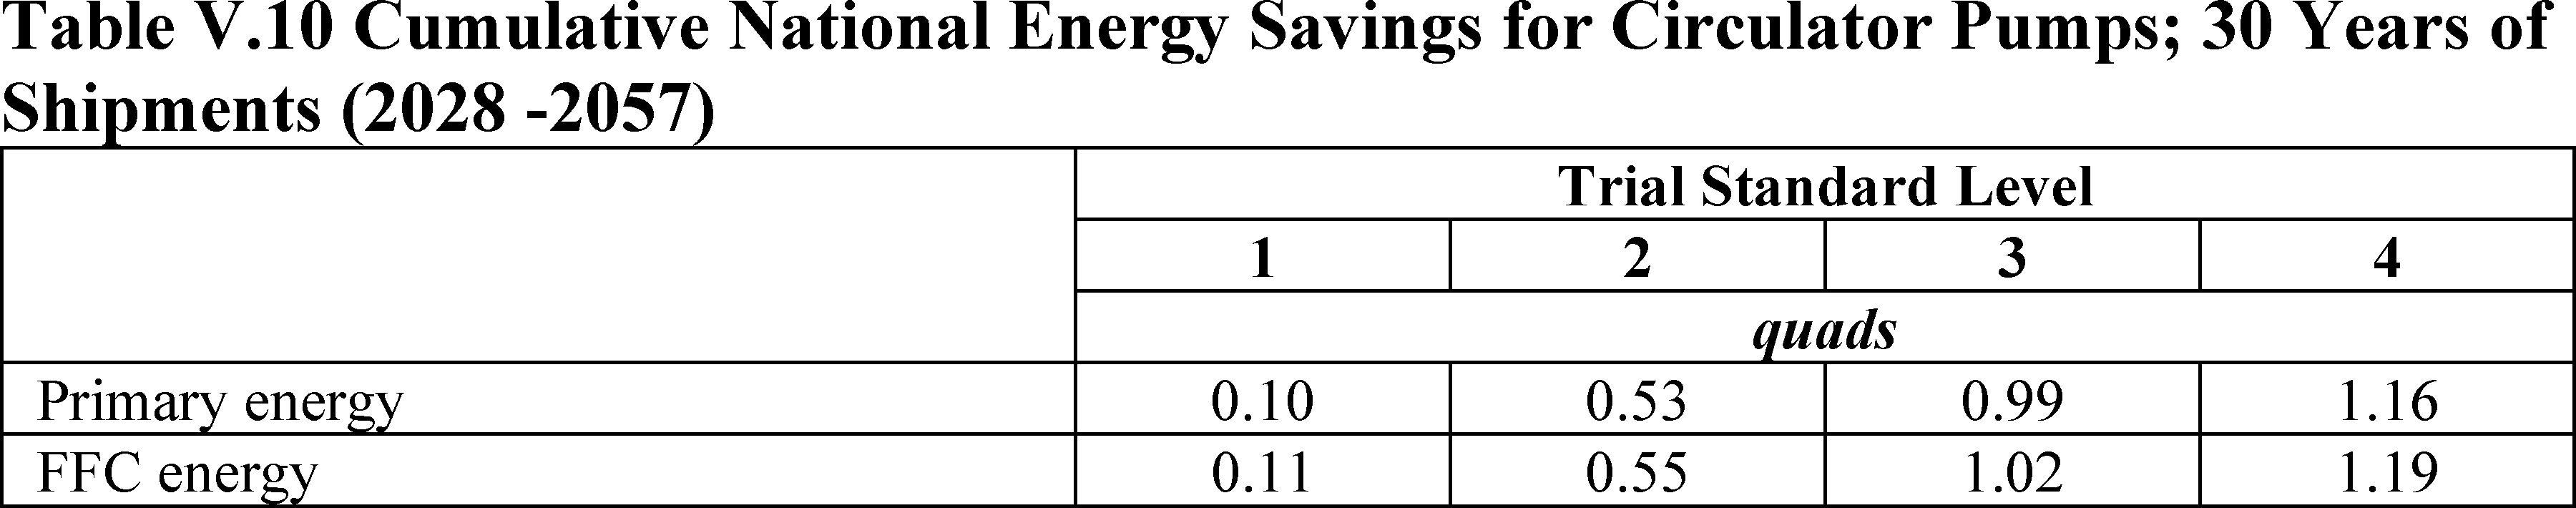
DOE's analyses indicate that the adopted energy conservation standards for circulator pumps would save a significant amount of energy. Relative to the case without new standards, the lifetime energy savings for circulator pumps purchased in the 30-year period that begins in the anticipated year of compliance with the new standards (2028-2057), amount to 0.55 quadrillion British thermal units (“Btu”), or quads.[6]
This represents a savings of 32.6 percent relative to the energy use of these equipment in the case without new standards (referred to as the “no-new-standards case”).
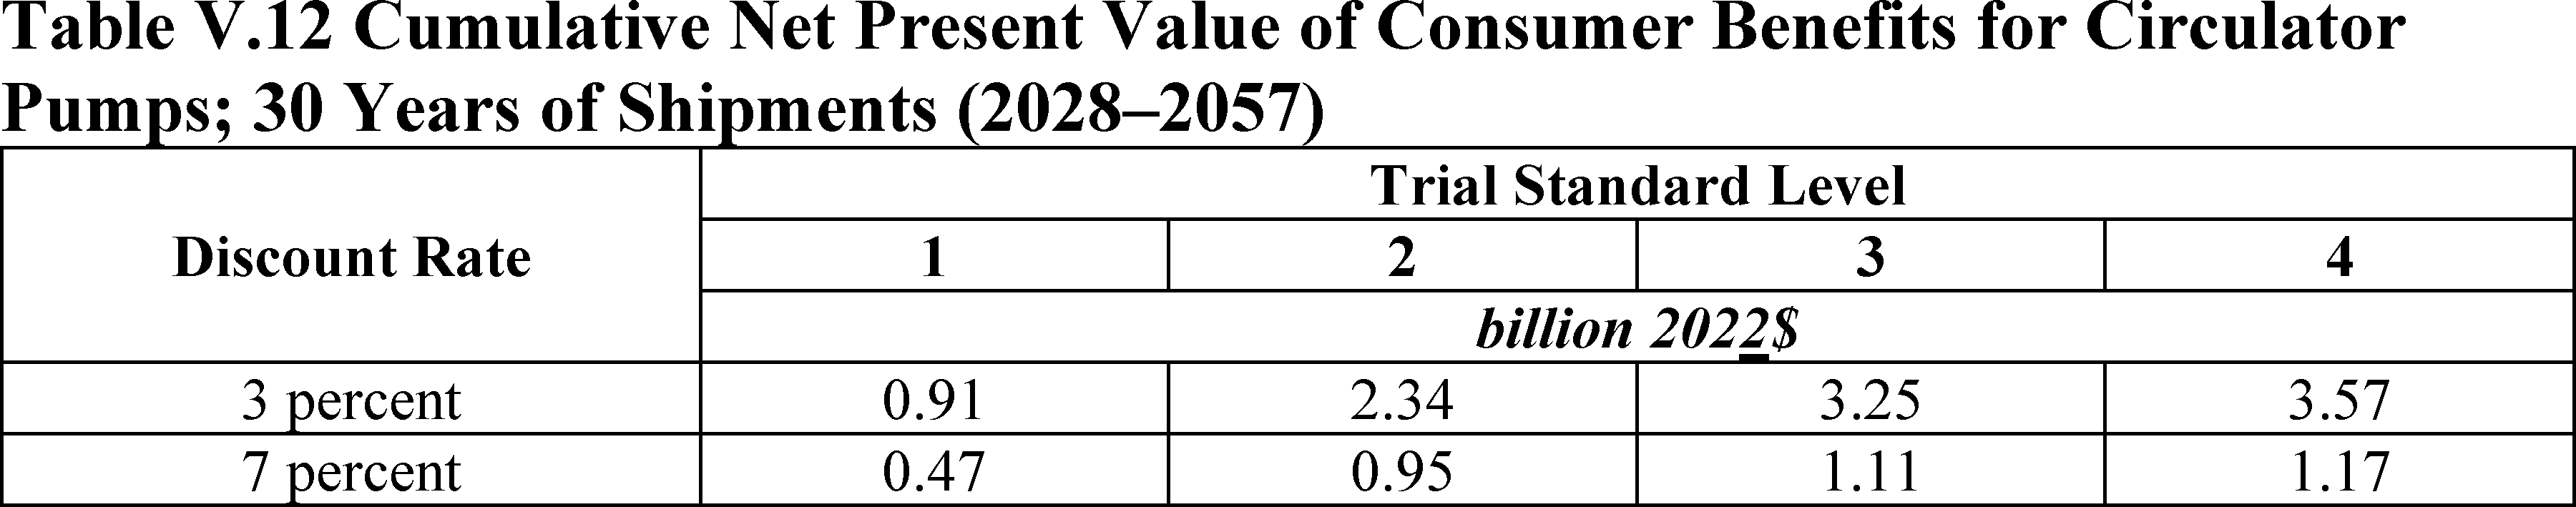
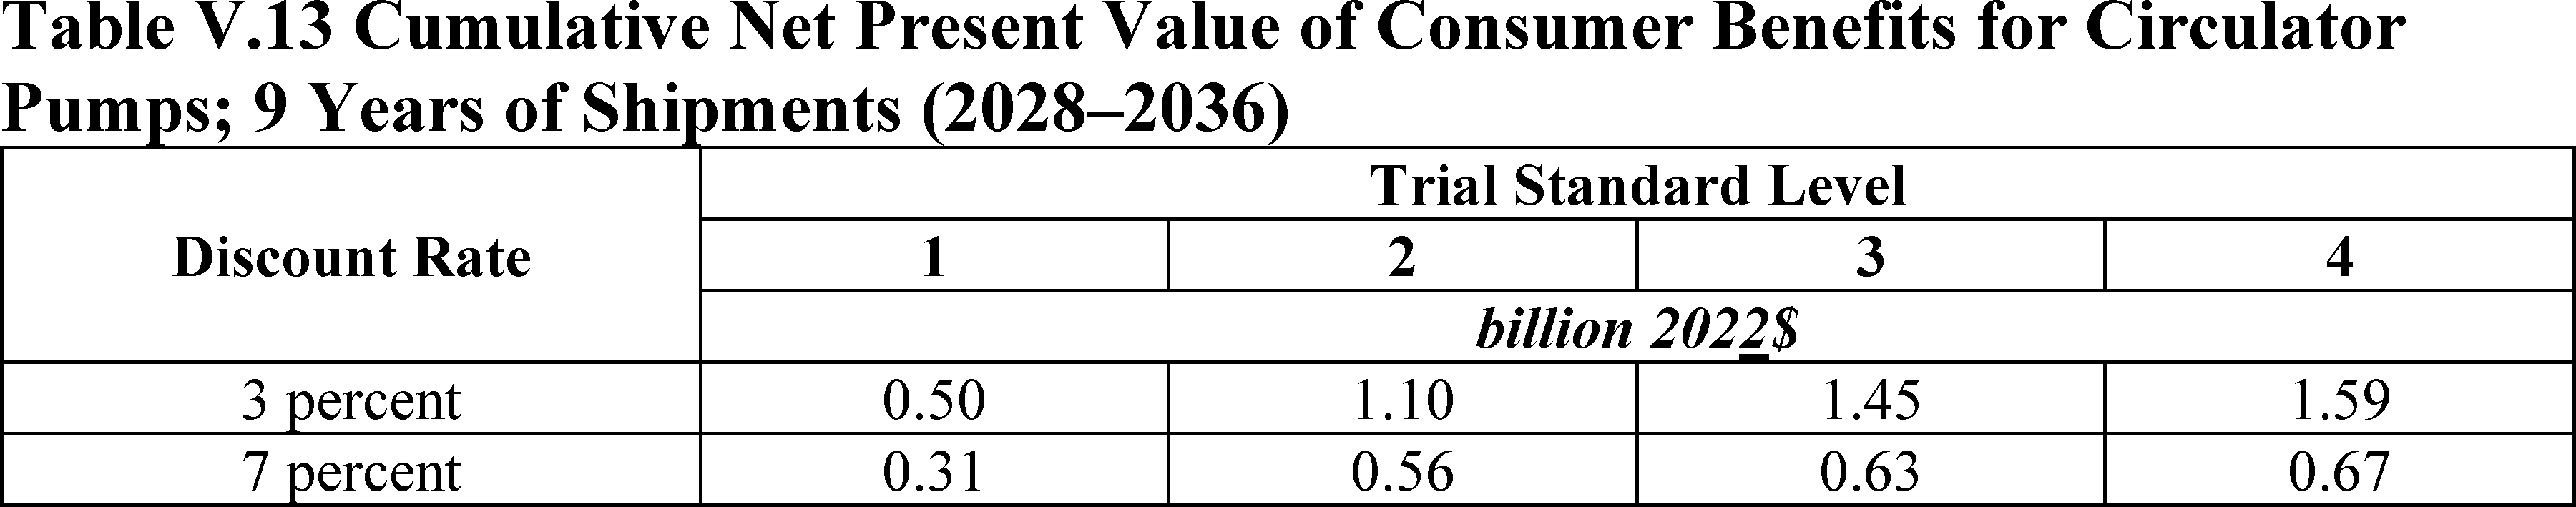
The cumulative net present value (“NPV”) of total consumer benefits of the standards for circulator pumps ranges from 0.95 billion in 2022$ (at a 7-percent discount rate) to 2.34 billion in 2022$ (at a 3-percent discount rate). This NPV expresses the estimated total value of future operating-cost savings minus the estimated increased equipment and installation costs for circulator pumps purchased in 2028-2057.
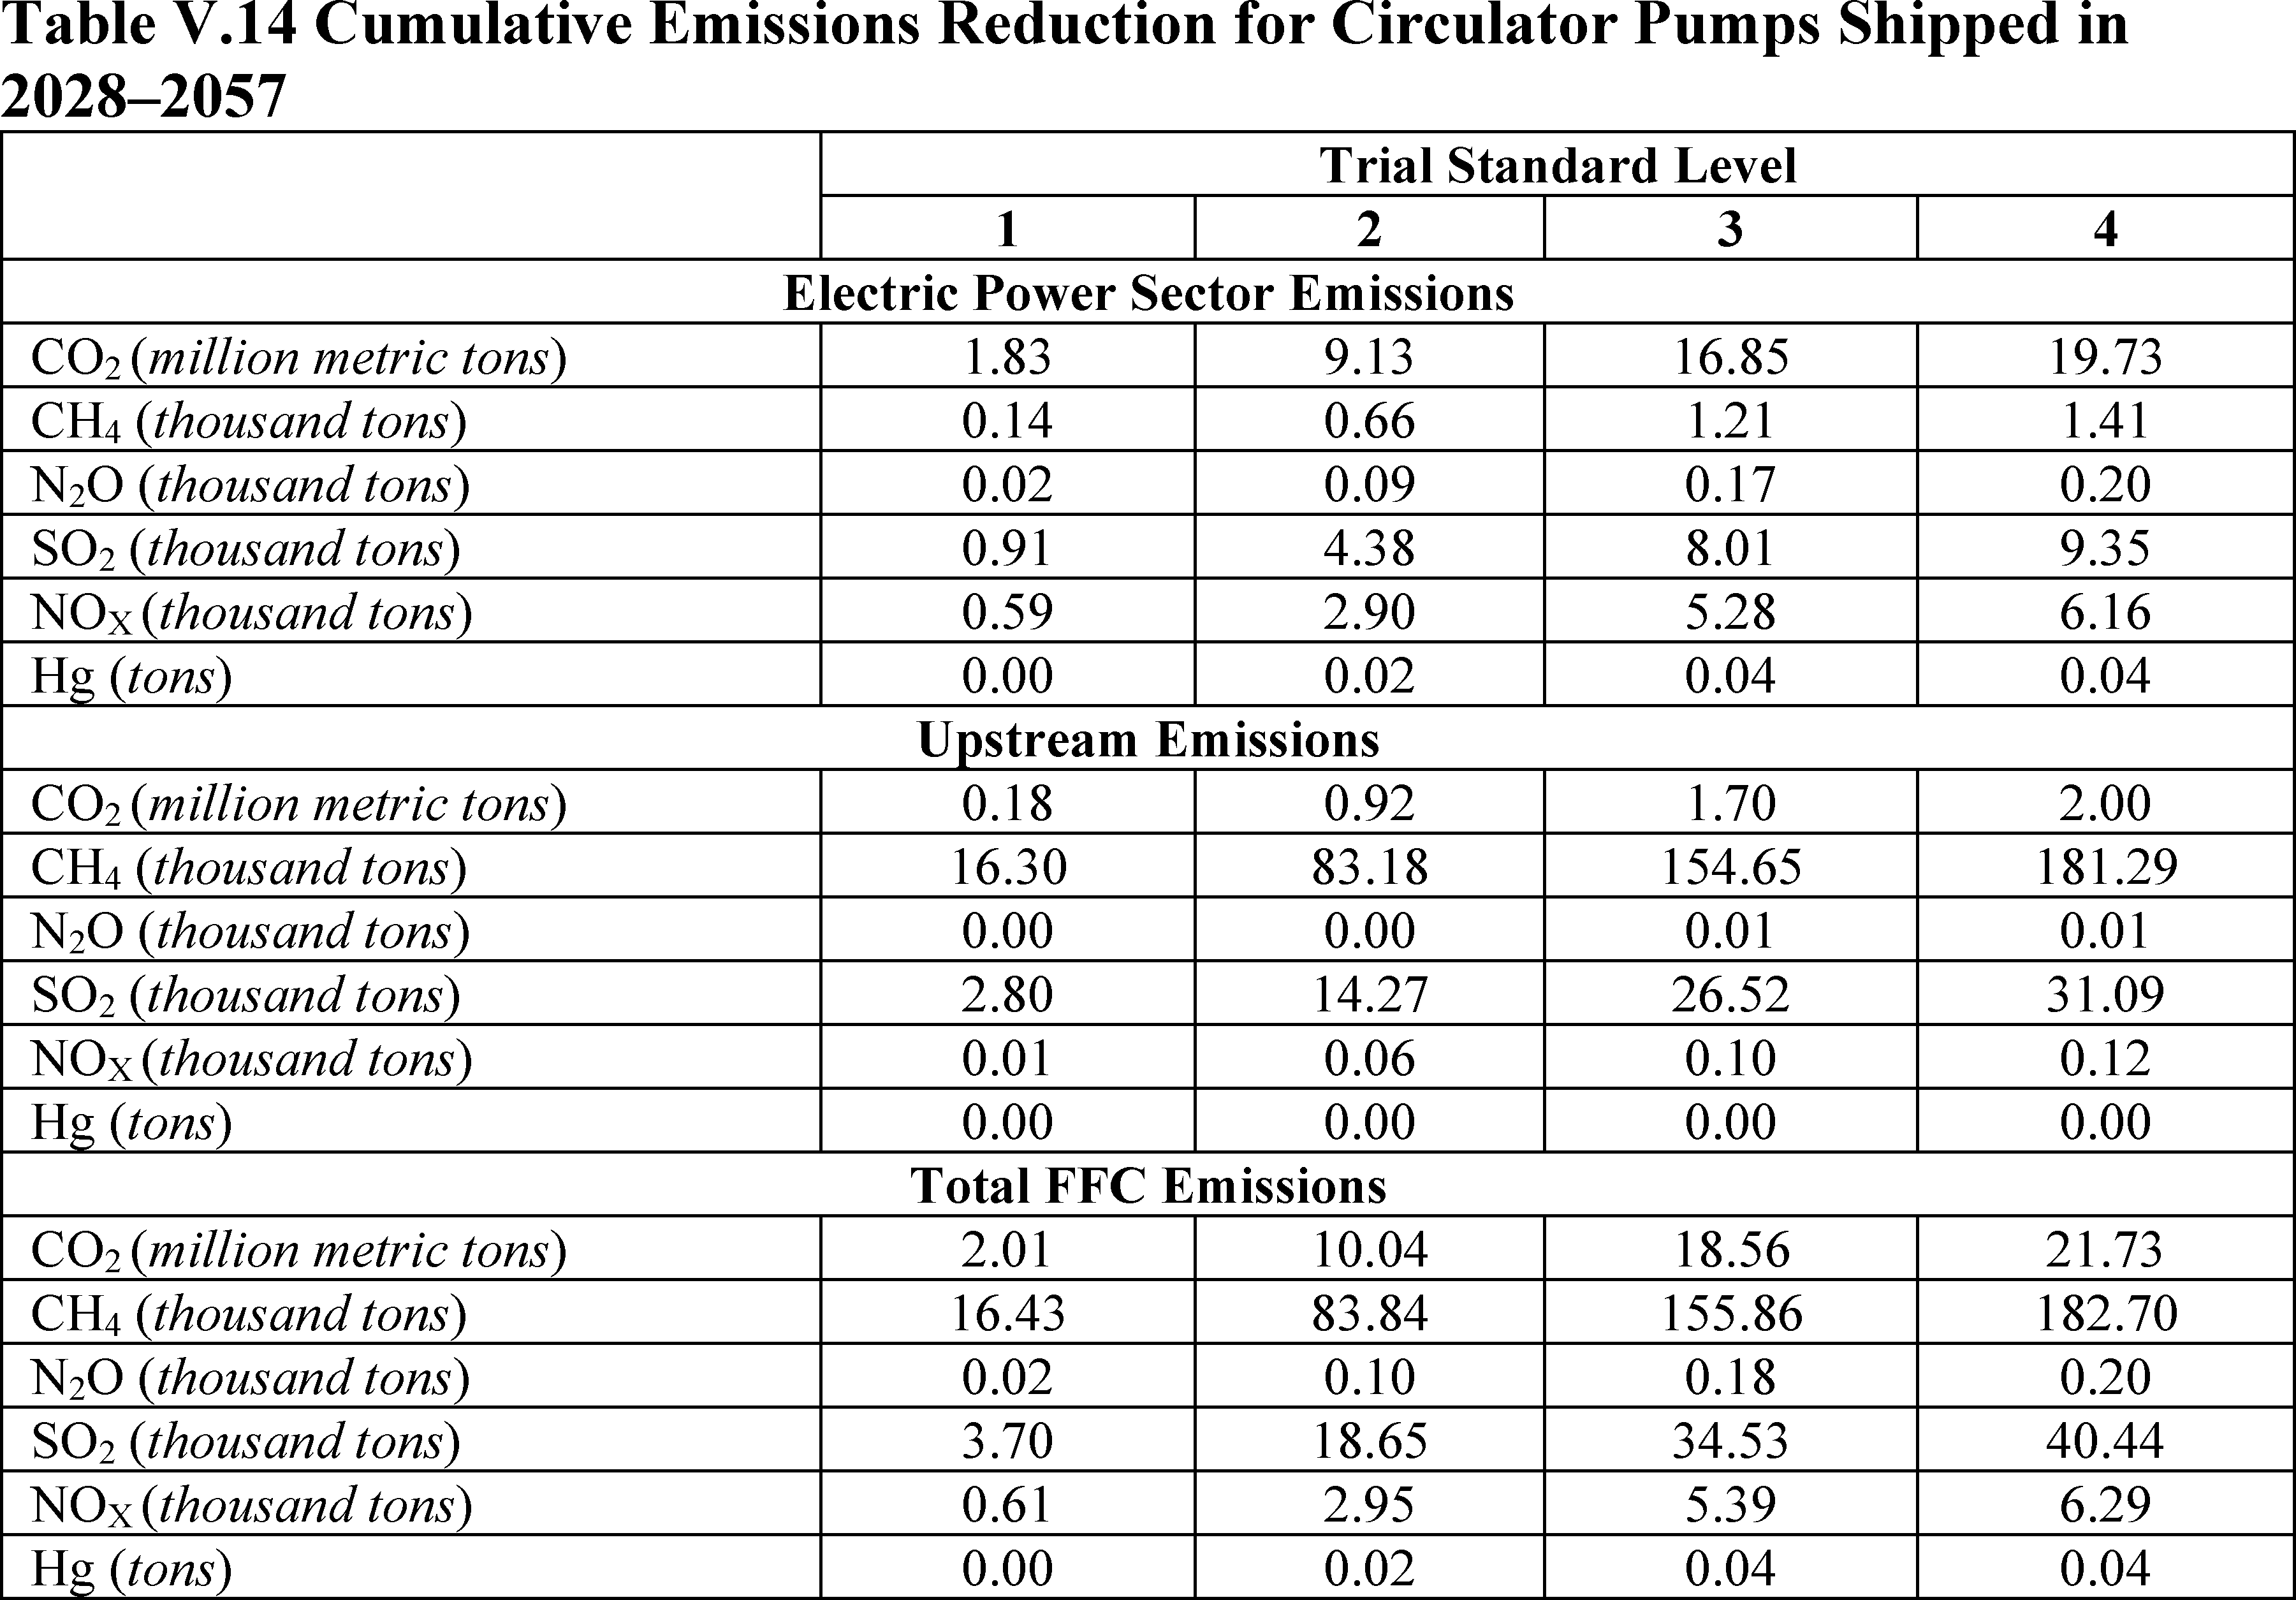
In addition, the adopted standards for circulator pumps are projected to yield significant environmental benefits. DOE estimates that the standards will result in cumulative emission reductions (over the same period as for energy savings) of 10.04 million metric tons (“Mt”) [7]
of carbon dioxide (“CO2
”), 2.95 thousand tons of sulfur dioxide (“SO2
”), 18.65 thousand tons of nitrogen oxides (“NOX
”), 83.84 thousand tons of methane (“CH4
”), 0.10 thousand tons of nitrous oxide (“N2
O”), and 0.02 tons of mercury (“Hg”).[8]
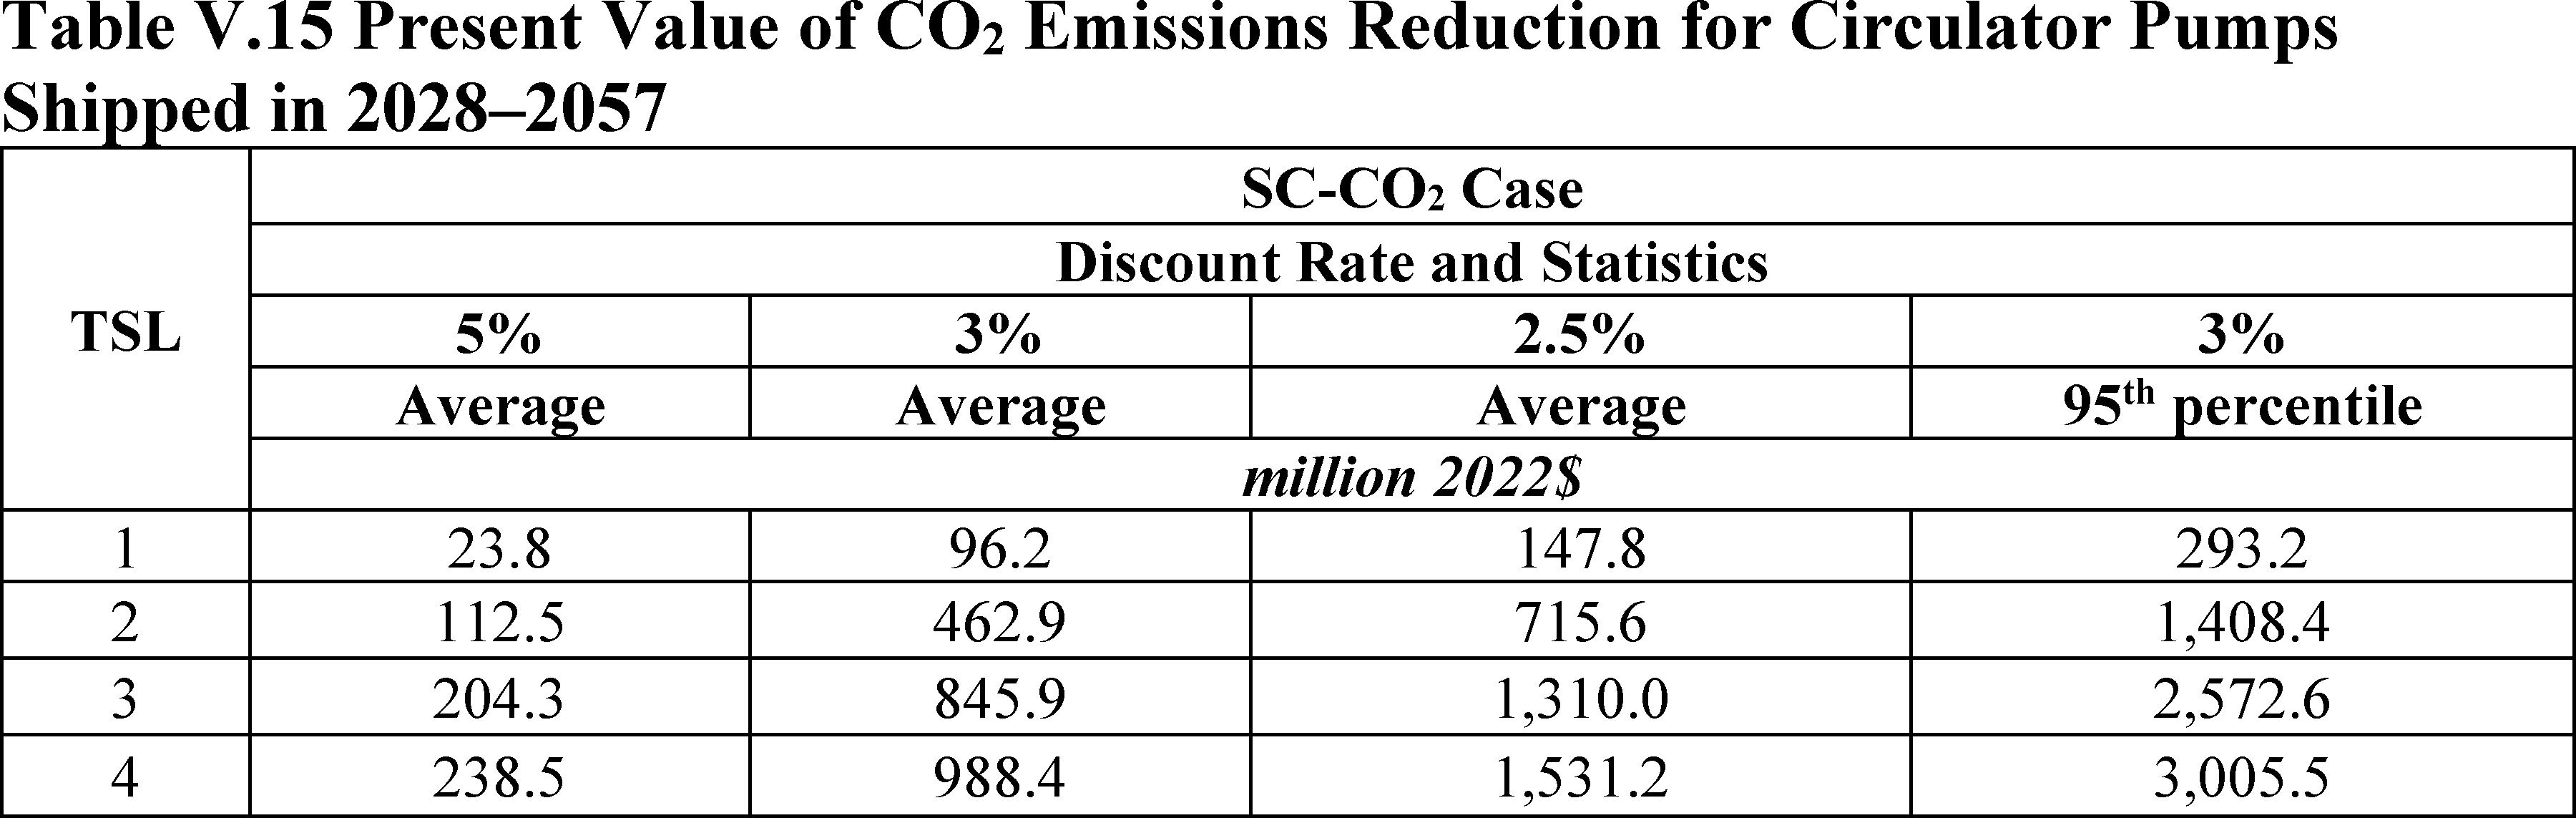
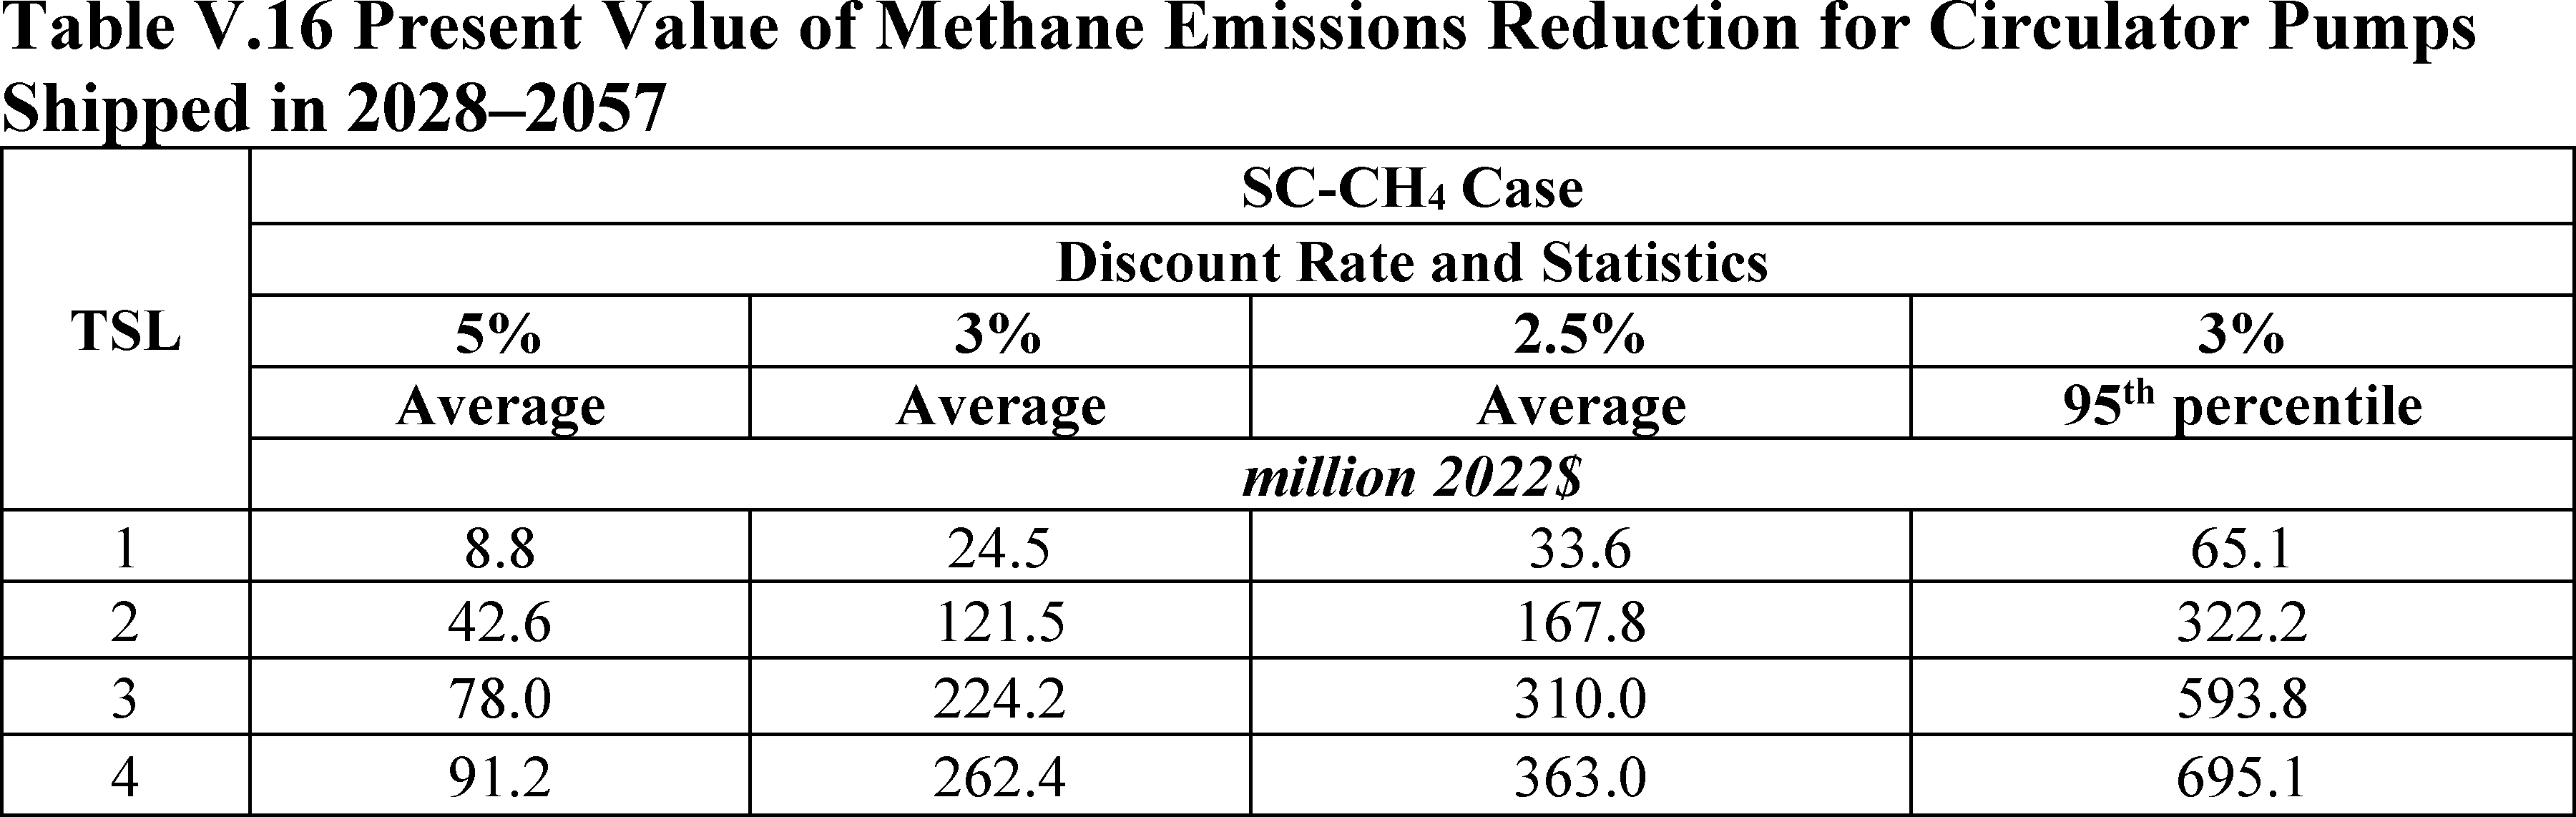
DOE estimates the value of climate benefits from a reduction in greenhouse gases (“GHG”) using four different estimates of the social cost of CO2
(“SC-CO2
”), the social cost of methane (“SC-CH4
”), and the social cost of nitrous oxide (“SC-N2
O”). Together these represent the social cost of GHG (“SC-GHG”). DOE used interim SC-GHG values (in terms of benefit per ton of GHG avoided) developed by an Interagency Working Group on the Social Cost of Greenhouse Gases (“IWG”).[9]
The derivation of these values is discussed in section IV.L of this document. For presentational purposes, the climate benefits associated with the average SC-GHG at a 3-percent discount rate are estimated to be $0.59 billion. DOE does not have a single central SC-GHG point estimate and it emphasizes the importance and value of considering the benefits calculated using all four sets of SC-GHG estimates. DOE notes, however, that the adopted standards would be economically justified even without inclusion of monetized benefits of reduced GHG emissions.
DOE estimated the monetary health benefits of SO2
and NOX
emissions reductions, using benefit per ton estimates from the Environmental
( printed page 44467)
Protection Agency,[10]
as discussed in section IV.L of this document. DOE estimated the present value of the health benefits would be $0.51 billion using a 7-percent discount rate, and $1.16 billion using a 3-percent discount rate.[11]
DOE is currently only monetizing health benefits from changes in ambient fine particulate matter (PM2.5) concentrations from two precursors (SO2
and NOX), and from changes in ambient ozone from one precursor (for NOX), but will continue to assess the ability to monetize other effects such as health benefits from reductions in direct PM2.5
emissions.
Table I.3 summarizes the monetized benefits and costs expected to result from the new standards for circulator pumps. There are other important unquantified effects, including certain unquantified climate benefits, unquantified public health benefits from the reduction of toxic air pollutants and other emissions, unquantified energy security benefits, and distributional effects, among others.
( printed page 44468)
( printed page 44469)
The benefits and costs of the proposed standards can also be expressed in terms of annualized values. The monetary values for the total annualized net benefits are (1) the reduced consumer operating costs, minus (2) the increase in equipment purchase prices and installation costs, plus (3) the value of climate and health benefits of emission reductions, all annualized.[12]
The national operating cost savings are domestic private U.S. consumer monetary savings that occur as a result of purchasing the covered equipment and are measured for the lifetime of circulator pumps shipped in 2028-2057. The benefits associated with reduced emissions achieved as a result of the adopted standards are also calculated based on the lifetime of circulator pumps shipped in 2028-2057. Total benefits for both the 3-percent and 7-percent cases are presented using the average GHG social costs with 3-percent discount rate. Estimates of SC-GHG values are presented for all four discount rates in section V.B.6 of this document.
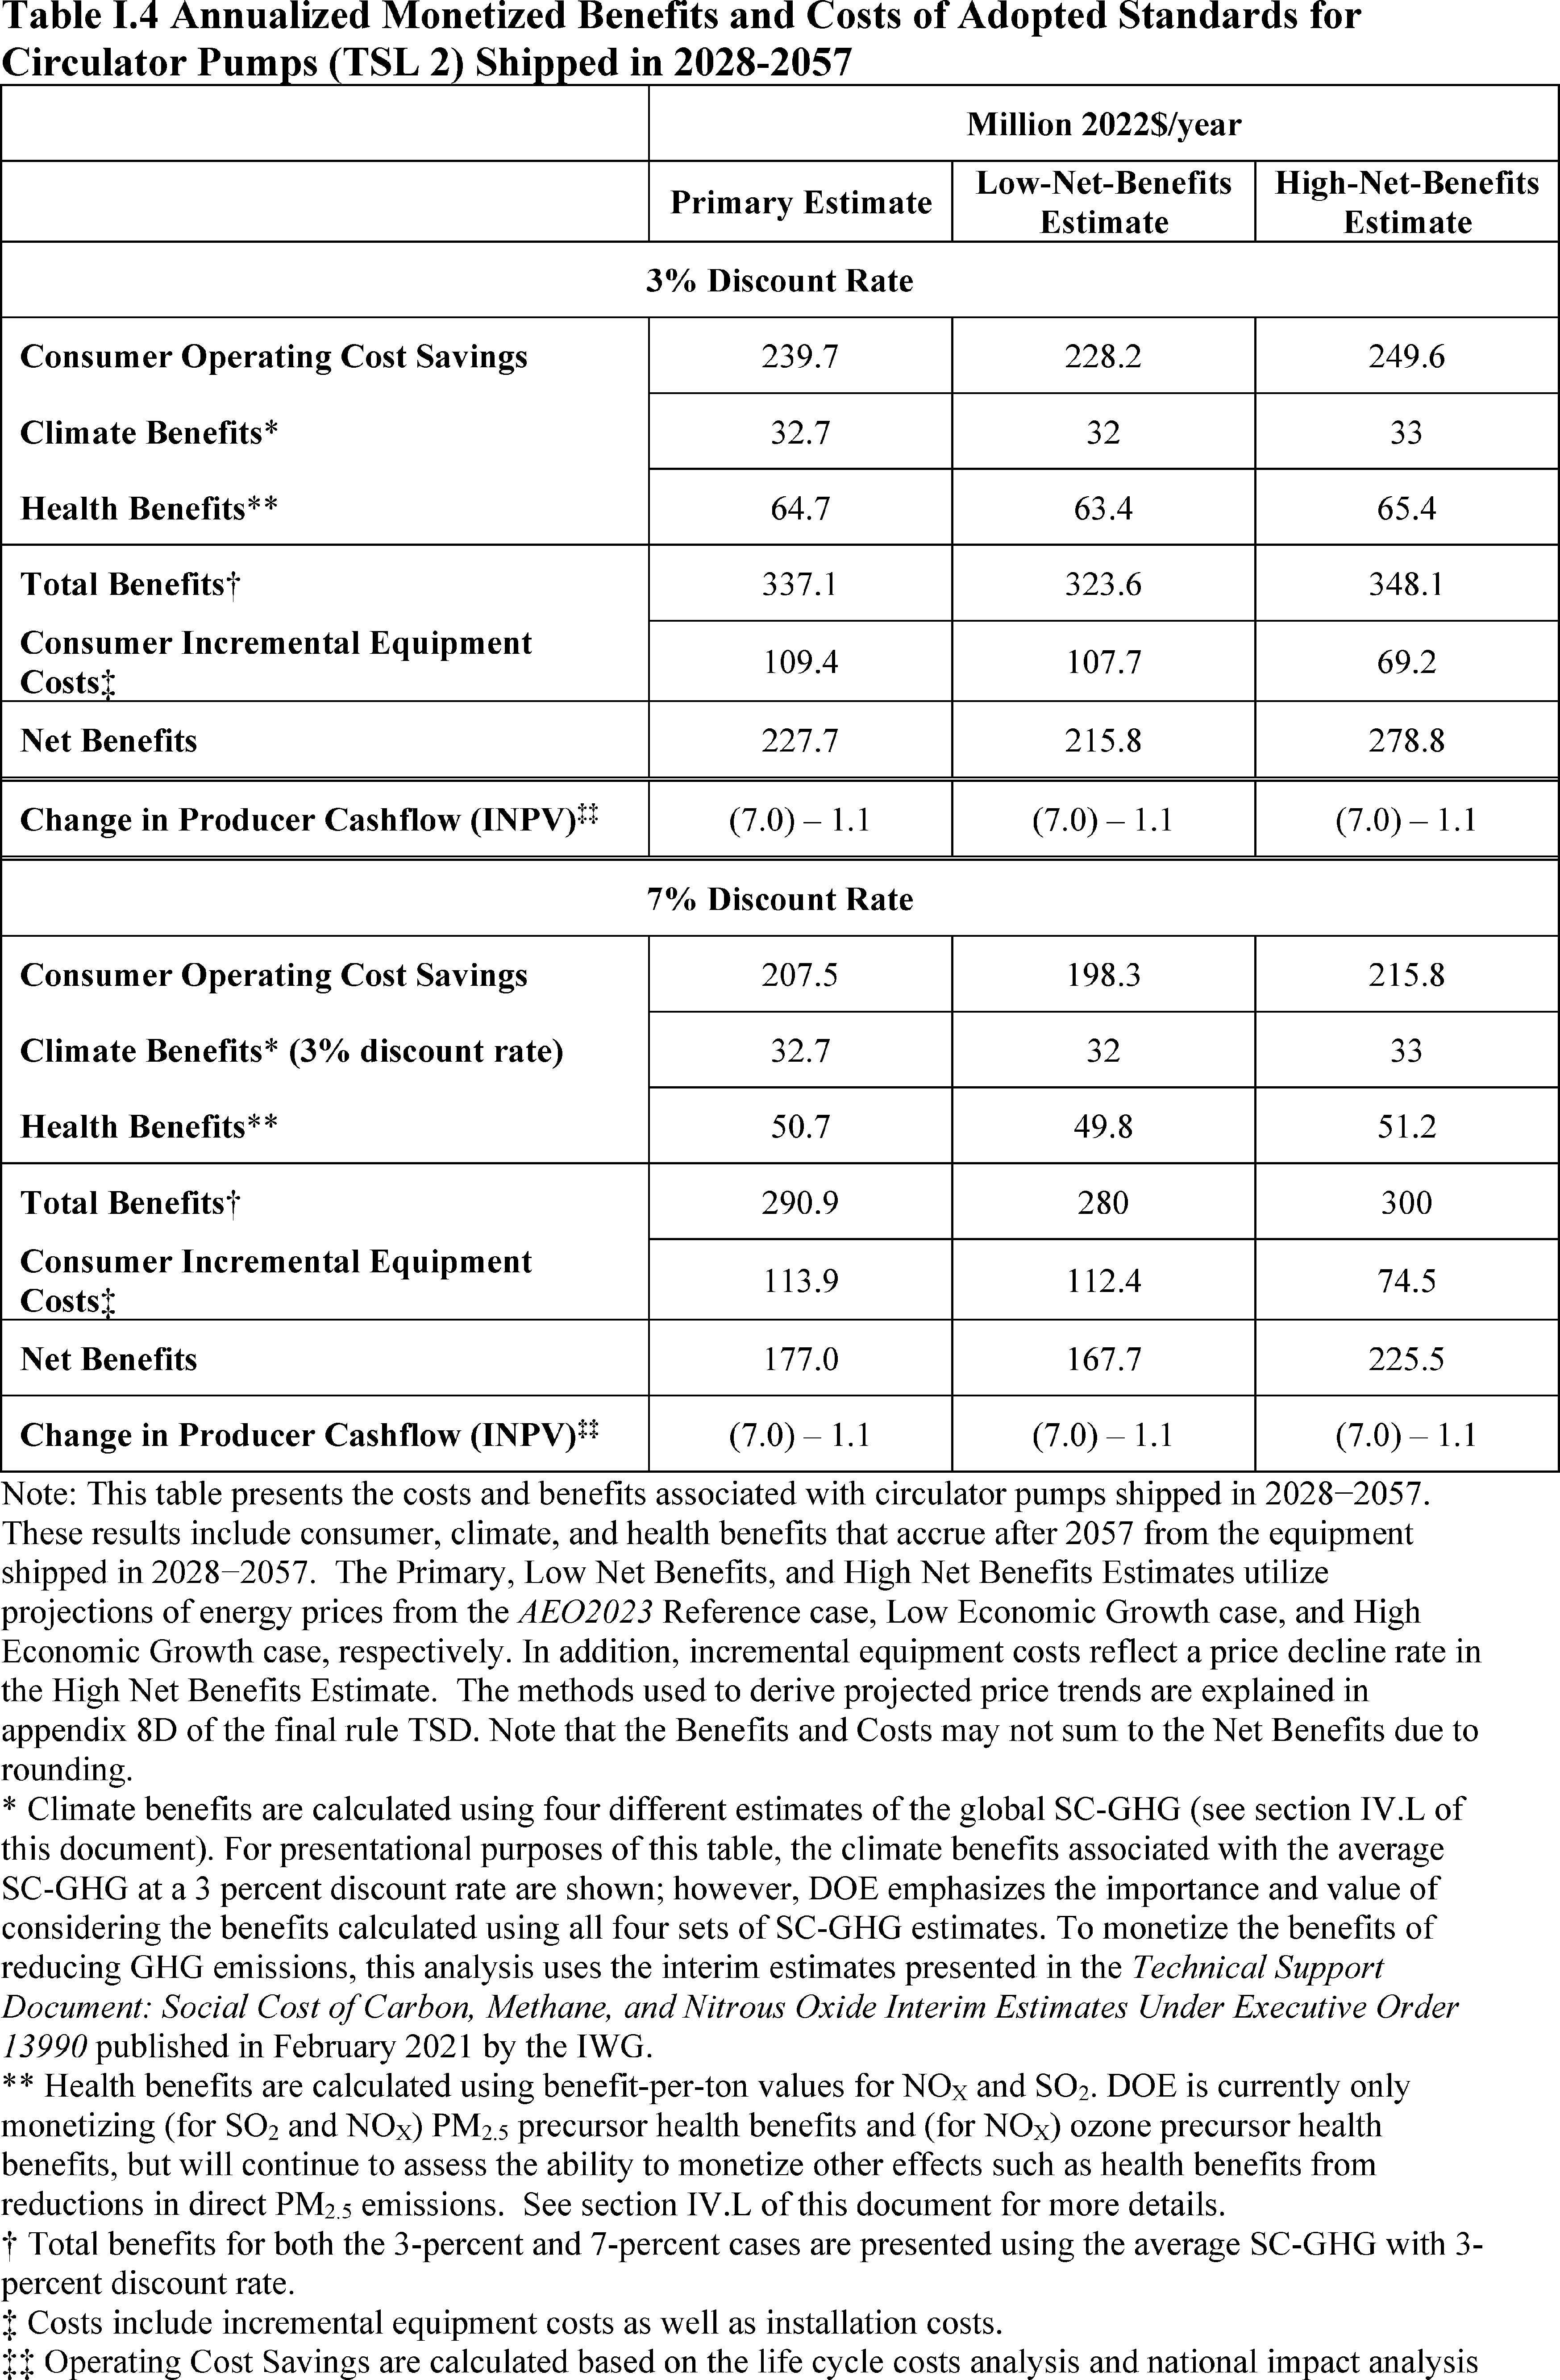
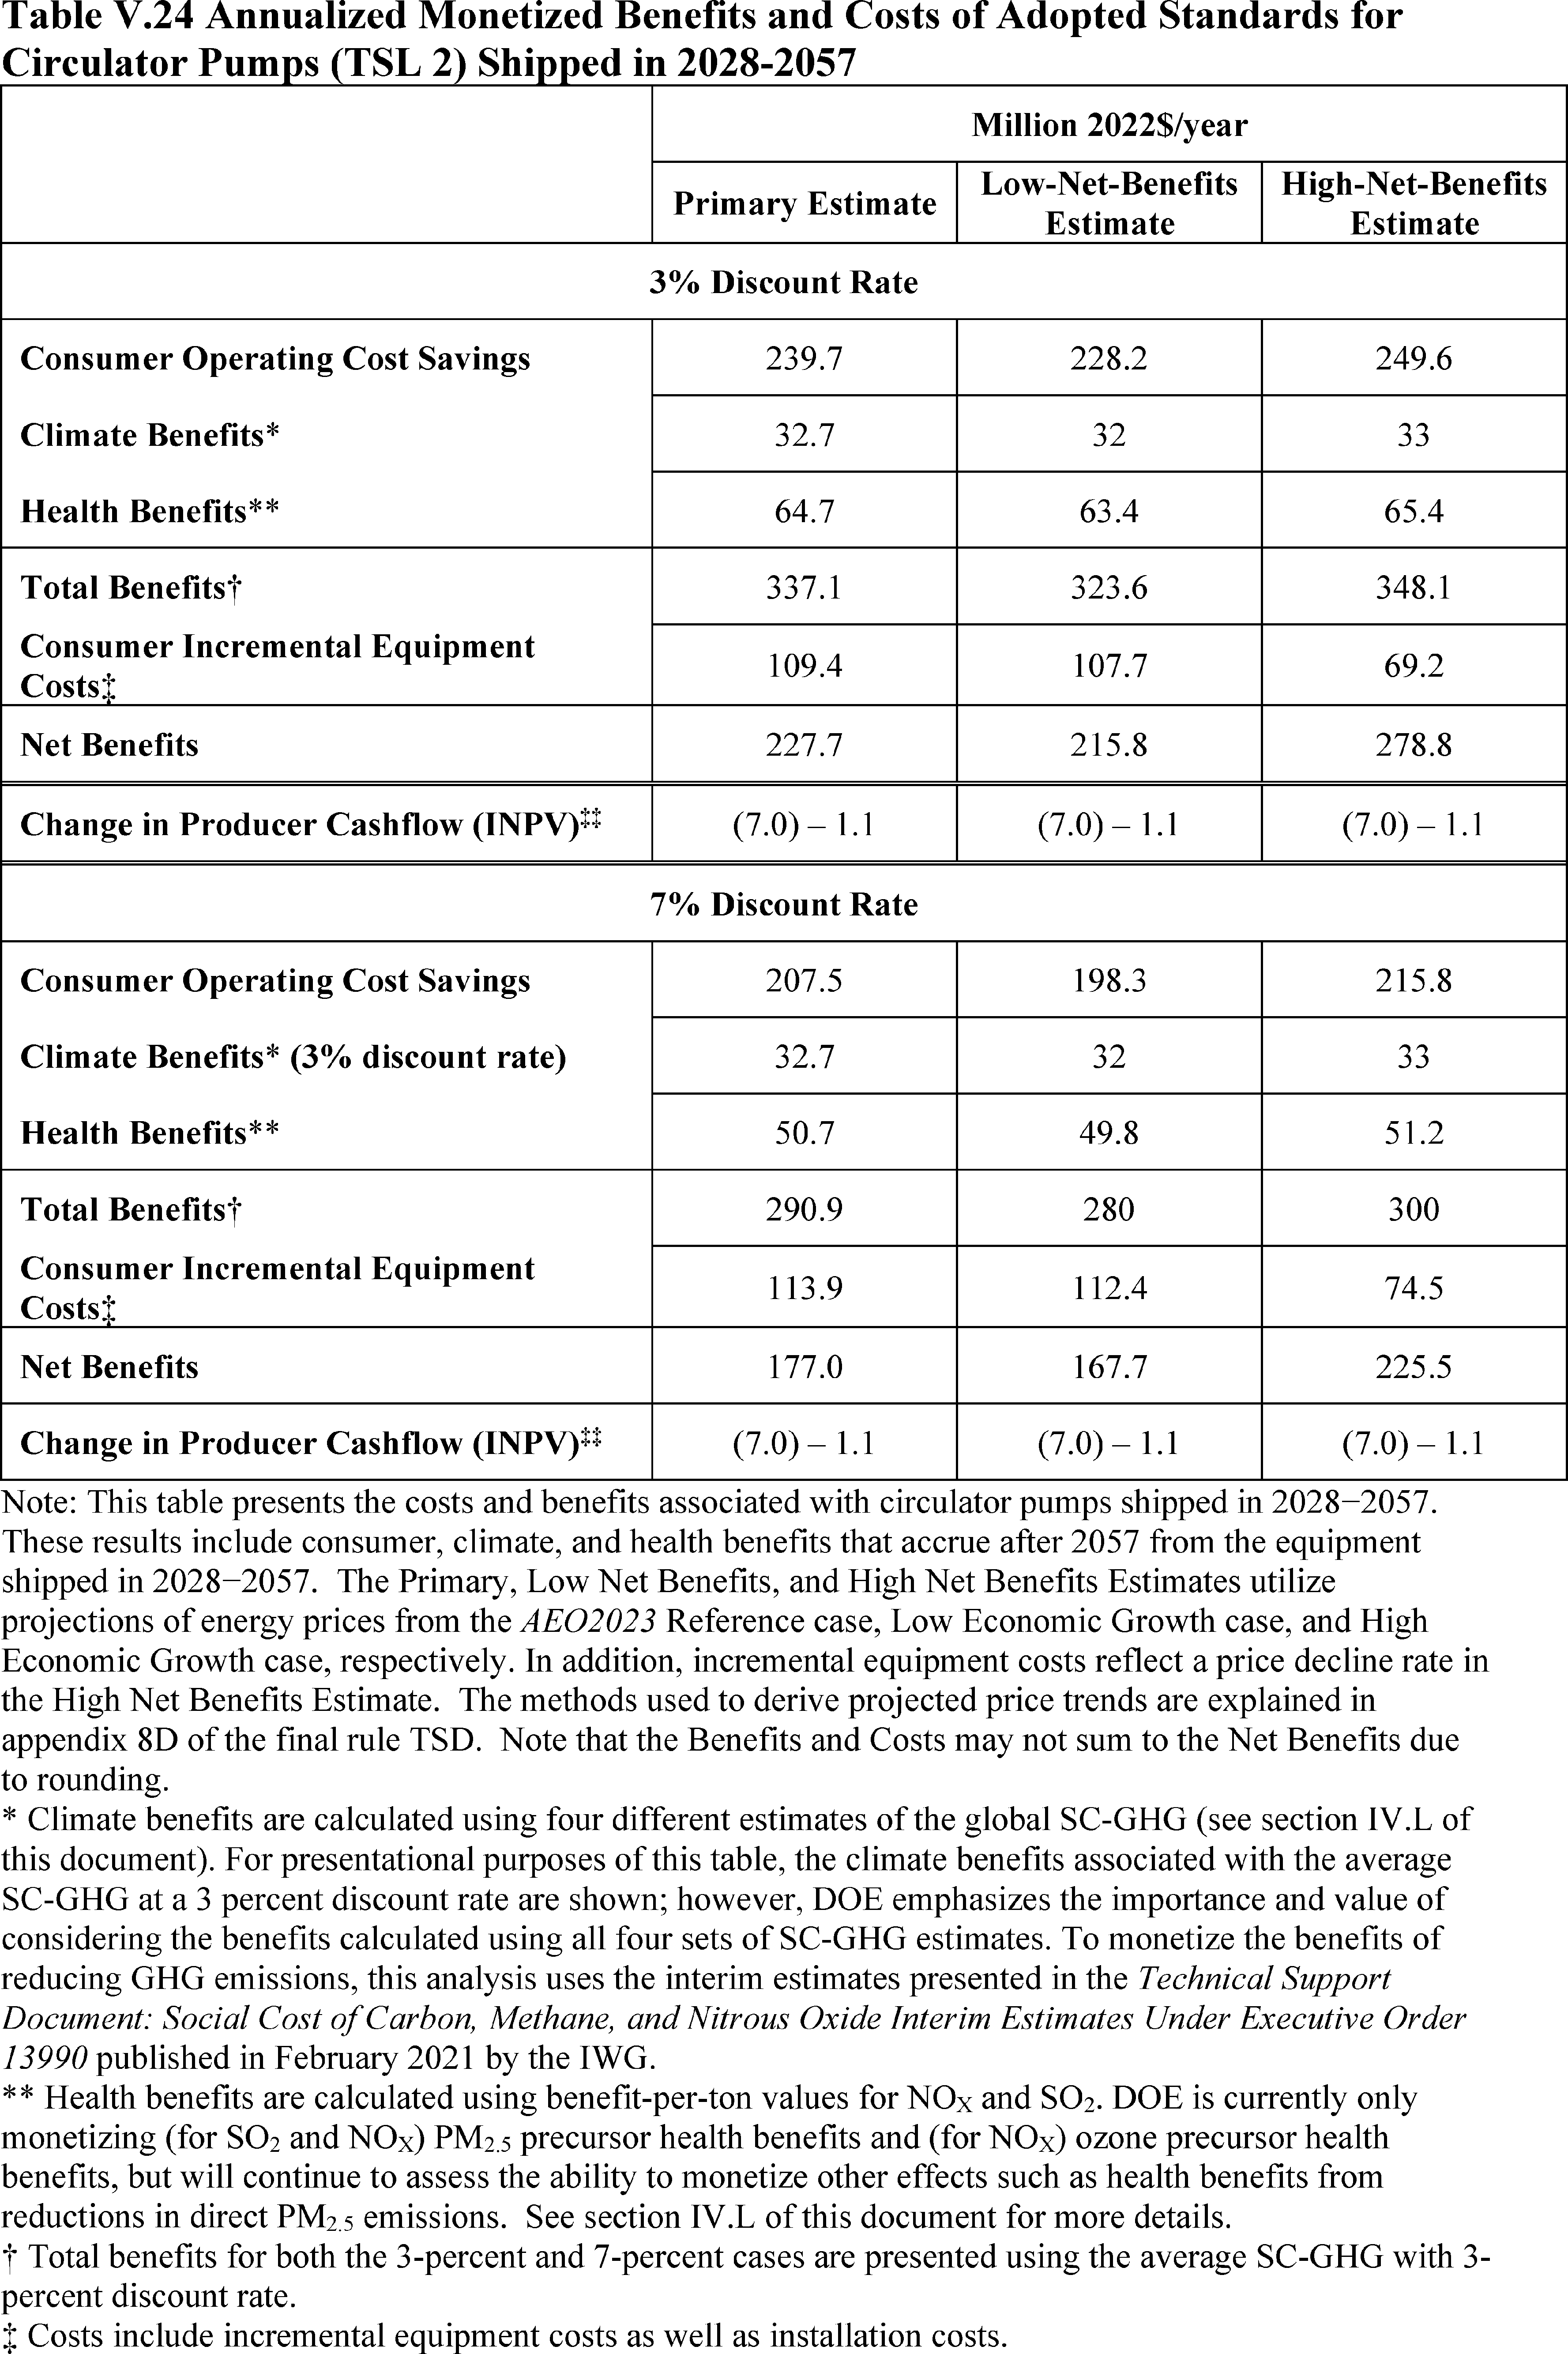
Table I.4 presents the total estimated monetized benefits and costs associated with the proposed standard, expressed in terms of annualized values. The results under the primary estimate are as follows.
Using a 7-percent discount rate for consumer benefits and costs and health benefits from reduced NOX
and SO2
emissions, and the 3-percent discount rate case for climate benefits from reduced GHG emissions,[13]
the estimated cost of the standards adopted in this rule is $113.9 million per year in increased equipment costs, while the estimated annual benefits are $207.5 million in reduced equipment operating costs, $32.7 million in climate benefits, and $50.7 million in health benefits. In this case, the net benefit would amount to $177.0 million per year.
Using a 3-percent discount rate for all benefits and costs, the estimated cost of the standards is $109.4 million per year in increased equipment costs, while the estimated annual benefits are $239.7 million in reduced operating costs, $32.7 million in climate benefits, and $64.7 million in health benefits. In this case, the net benefit would amount to $227.7 million per year.
( printed page 44470)
( printed page 44471)
DOE's analysis of the national impacts of the adopted standards is described in sections IV.H, IV.K and IV.L of this document.
D. Conclusion
DOE concludes that the standards adopted in this final rule represent the maximum improvement in energy efficiency that is technologically feasible and economically justified, and would result in the significant conservation of energy. Specifically, with regards to technological feasibility, equipment achieving these standard levels is already commercially available for all equipment in the single product class covered by this final rule. As for economic justification, DOE's analysis shows that the benefits of the standards exceed, to a great extent, the burdens of the standards.
Using a 7-percent discount rate for consumer benefits and costs and NOX
and SO2
reduction benefits, and a 3-percent discount rate case for GHG social costs, the estimated cost of the standards for circulator pumps is $113.9 million per year in increased equipment costs, while the estimated annual benefits are $207.5 million in reduced equipment operating costs, $32.7 million in climate benefits, and $50.7 million in health benefits. The net benefit amounts to $177.0 million per year. DOE notes that the net benefits are substantial even in the absence of the climate benefits [14]
and DOE would adopt the same standards in the absence of such benefits.
The significance of energy savings offered by a new energy conservation standard cannot be determined without knowledge of the specific circumstances surrounding a given rulemaking.[15]
For example, some covered equipment have most of their energy consumption occur during periods of peak energy demand. The impacts of these equipment on the energy infrastructure can be more pronounced than equipment with relatively constant demand. Accordingly, DOE evaluates the significance of energy savings on a case-by-case basis.
As previously mentioned, the standards are projected to result in estimated national energy savings of 0.55 quad FFC, the equivalent of the primary annual energy use of 5.9 million homes. In addition, they are projected to reduce CO2
emissions by 10.04 Mt. Based on these findings, DOE has determined the energy savings from the standard levels adopted in this final rule are “significant” within the meaning of 42 U.S.C. 6295(o)(3)(B). A more detailed discussion of the basis for these conclusions is contained in the remainder of this document and the accompanying TSD.
II. Introduction
The following section briefly discusses the statutory authority underlying this final rule, as well as some of the relevant historical background related to the establishment of standards for circulator pumps.
A. Authority
EPCA authorizes DOE to regulate the energy efficiency of a number of consumer products and certain industrial equipment. Title III, Part C of EPCA, added by Public Law 95-619, Title IV, section 441(a), established the Energy Conservation Program for Certain Industrial Equipment, which sets forth a variety of provisions designed to improve energy efficiency. This equipment includes pumps, the subject of this rulemaking. (42 U.S.C. 6311(1)(A))
EPCA further provides that, not later than 6 years after the issuance of any final rule establishing or amending a standard, DOE must publish either a notice of determination that standards for the equipment do not need to be amended, or a notice of proposed rulemaking (“NOPR”) including new proposed energy conservation standards (proceeding to a final rule, as appropriate). (42 U.S.C. 6316(a); 42 U.S.C. 6295(m)(1))
The energy conservation program under EPCA consists essentially of four
( printed page 44472)
parts: (1) testing, (2) labeling, (3) the establishment of Federal energy conservation standards, and (4) certification and enforcement procedures. Relevant provisions of EPCA include definitions (42 U.S.C. 6311), test procedures (42 U.S.C. 6314), labeling provisions (42 U.S.C. 6315), energy conservation standards (42 U.S.C. 6313), and the authority to require information and reports from manufacturers (42 U.S.C. 6316).
Federal energy efficiency requirements for covered equipment established under EPCA generally supersede State laws and regulations concerning energy conservation testing, labeling, and standards. (42 U.S.C. 6316(a) and 42 U.S.C. 6316(b); 42 U.S.C. 6297) DOE may, however, grant waivers of Federal preemption in limited instances for particular State laws or regulations, in accordance with the procedures and other provisions set forth under EPCA. (
See42 U.S.C. 6316(a) (applying the preemption waiver provisions of 42 U.S.C. 6297))
Subject to certain criteria and conditions, DOE is required to develop test procedures to measure the energy efficiency, energy use, or estimated annual operating cost of all covered equipment. (42 U.S.C. 6316(a); 42 U.S.C. 6295(o)(3)(A) and (r)) Manufacturers of covered equipment must use the Federal test procedures as the basis for: (1) certifying to DOE that their equipment complies with the applicable energy conservation standards adopted pursuant to EPCA (42 U.S.C. 6316(a); 42 U.S.C. 6295(s)), and (2) making representations about the efficiency of that equipment (42 U.S.C. 6314(d)). Similarly, DOE must use these test procedures to determine whether the equipment complies with relevant standards promulgated under EPCA. (42 U.S.C. 6316(a); 42 U.S.C. 6295(s)) The DOE test procedures for circulator pumps appear at title 10 of the Code of Federal Regulations (“CFR”) part 431, subpart Y, appendix D.
DOE must follow specific statutory criteria for prescribing new standards for covered equipment, including circulator pumps. Any new standard for covered equipment must be designed to achieve the maximum improvement in energy efficiency that the Secretary of Energy determines is technologically feasible and economically justified. (42 U.S.C. 6316(a); 42 U.S.C. 6295(o)(2)(A)) Furthermore, DOE may not adopt any standard that would not result in the significant conservation of energy. (42 U.S.C. 6316(a); 42 U.S.C. 6295(o)(3))
Moreover, DOE may not prescribe a standard (1) for certain equipment, including circulator pumps, if no test procedure has been established for the equipment, or (2) if DOE determines by rule that the standard is not technologically feasible or economically justified. (42 U.S.C. 6316(a); 42 U.S.C. 6295(o)(3)(A)-(B)) In deciding whether a proposed standard is economically justified, DOE must determine whether the benefits of the standard exceed its burdens.
Id.
DOE must make this determination after receiving comments on the proposed standard, and by considering, to the greatest extent practicable, the following seven statutory factors:
(1) The economic impact of the standard on manufacturers and consumers of the equipment subject to the standard;
(2) The savings in operating costs throughout the estimated average life of the covered equipment in the type (or class) compared to any increase in the price, initial charges, or maintenance expenses for the covered equipment that are likely to result from the standard;
(3) The total projected amount of energy (or as applicable, water) savings likely to result directly from the standard;
(4) Any lessening of the utility or the performance of the covered equipment likely to result from the standard;
(5) The impact of any lessening of competition, as determined in writing by the Attorney General, that is likely to result from the standard;
(6) The need for national energy and water conservation; and
(7) Other factors the Secretary of Energy (“Secretary”) considers relevant.
Further, EPCA, as codified, establishes a rebuttable presumption that a standard is economically justified if the Secretary finds that the additional cost to the consumer of purchasing equipment complying with an energy conservation standard level will be less than three times the value of the energy savings during the first year that the consumer will receive as a result of the standard, as calculated under the applicable test procedure. (42 U.S.C. 6316(a); 42 U.S.C. 6295(o)(2)(B)(iii))
EPCA, as codified, also contains what is known as an “anti-backsliding” provision, which prevents the Secretary from prescribing any new standard that either increases the maximum allowable energy use or decreases the minimum required energy efficiency of covered equipment. (42 U.S.C. 6316(a); 42 U.S.C. 6295(o)(1)) Also, the Secretary may not prescribe a new standard if interested persons have established by a preponderance of the evidence that the standard is likely to result in the unavailability in the United States in any covered equipment type (or class) of performance characteristics (including reliability), features, sizes, capacities, and volumes that are substantially the same as those generally available in the United States. (42 U.S.C. 6316(a); 42 U.S.C. 6295(o)(4))
Additionally, EPCA specifies requirements when promulgating an energy conservation standard for covered equipment that has two or more subcategories. DOE must specify a different standard level for a type or class of equipment that has the same function or intended use if DOE determines that equipment within such group (A) consumes a different kind of energy from that consumed by other covered equipment within such type (or class); or (B) has a capacity or other performance-related feature which other equipment within such type (or class) does not have and such feature justifies a higher or lower standard. (42 U.S.C. 6316(a); 42 U.S.C. 6295(q)(1)) In determining whether a performance-related feature justifies a different standard for a group of equipment, DOE must consider such factors as the utility to the consumer of such a feature and other factors DOE deems appropriate.
Id.
Any rule prescribing such a standard must include an explanation of the basis on which such higher or lower level was established. (42 U.S.C. 6316(a); 42 U.S.C. 6295(q)(2))
B. Background
As stated, EPCA includes “pumps” among the industrial equipment listed as “covered equipment” for the purpose of Part A-1, although EPCA does not define the term “pump.” (42 U.S.C. 6311(1)(A)) In a final rule published January 25, 2016, DOE established a definition for “pump,” definitions associated with pumps, and test procedures for certain pumps. 81 FR 4086, 4090 (“January 2016 TP Final Rule”). “Pump” is defined as “equipment designed to move liquids (which may include entrained gases, free solids, and totally dissolved solids) by physical or mechanical action and includes a bare pump and, if included by the manufacturer at the time of sale, mechanical equipment, driver, and controls.” 10 CFR 431.462. Circulator pumps fall within this definition. The specific pump categories subject to the test procedures described in the January 2016 TP Final Rule are referred to as “general pumps” in this document. Circulator pumps were not included as general pumps.
In general, and relative to pumps at-large, circulator pumps tend to be toward the smaller end of the range of both power and hydraulic head. Circulated fluid would not require a net elevation gain, and thus the required
( printed page 44473)
head is that associated with the resistance of the hydraulic circuit. A circulator pump, by definition, is a pump that is either a wet rotor circulator pump; a dry rotor, two-piece circulator pump; or a dry rotor, three-piece circulator pump. A circulator pump may be distributed in commerce with or without a volute.
The January 2016 TP Final Rule implemented the recommendations of the Commercial and Industrial Pump Working Group (“CIPWG”), established through the Appliance Standards Rulemaking Federal Advisory Committee (“ASRAC”) to negotiate standards and a test procedure for general pumps. (Docket No. EERE-2013-BT-NOC-0039) The CIPWG and ASRAC approved a term sheet containing recommendations to DOE that included initiation of a separate rulemaking for circulator pumps. (Docket No. EERE-2013-BT-NOC-0039, No. 92, Recommendation #5A at p. 2)
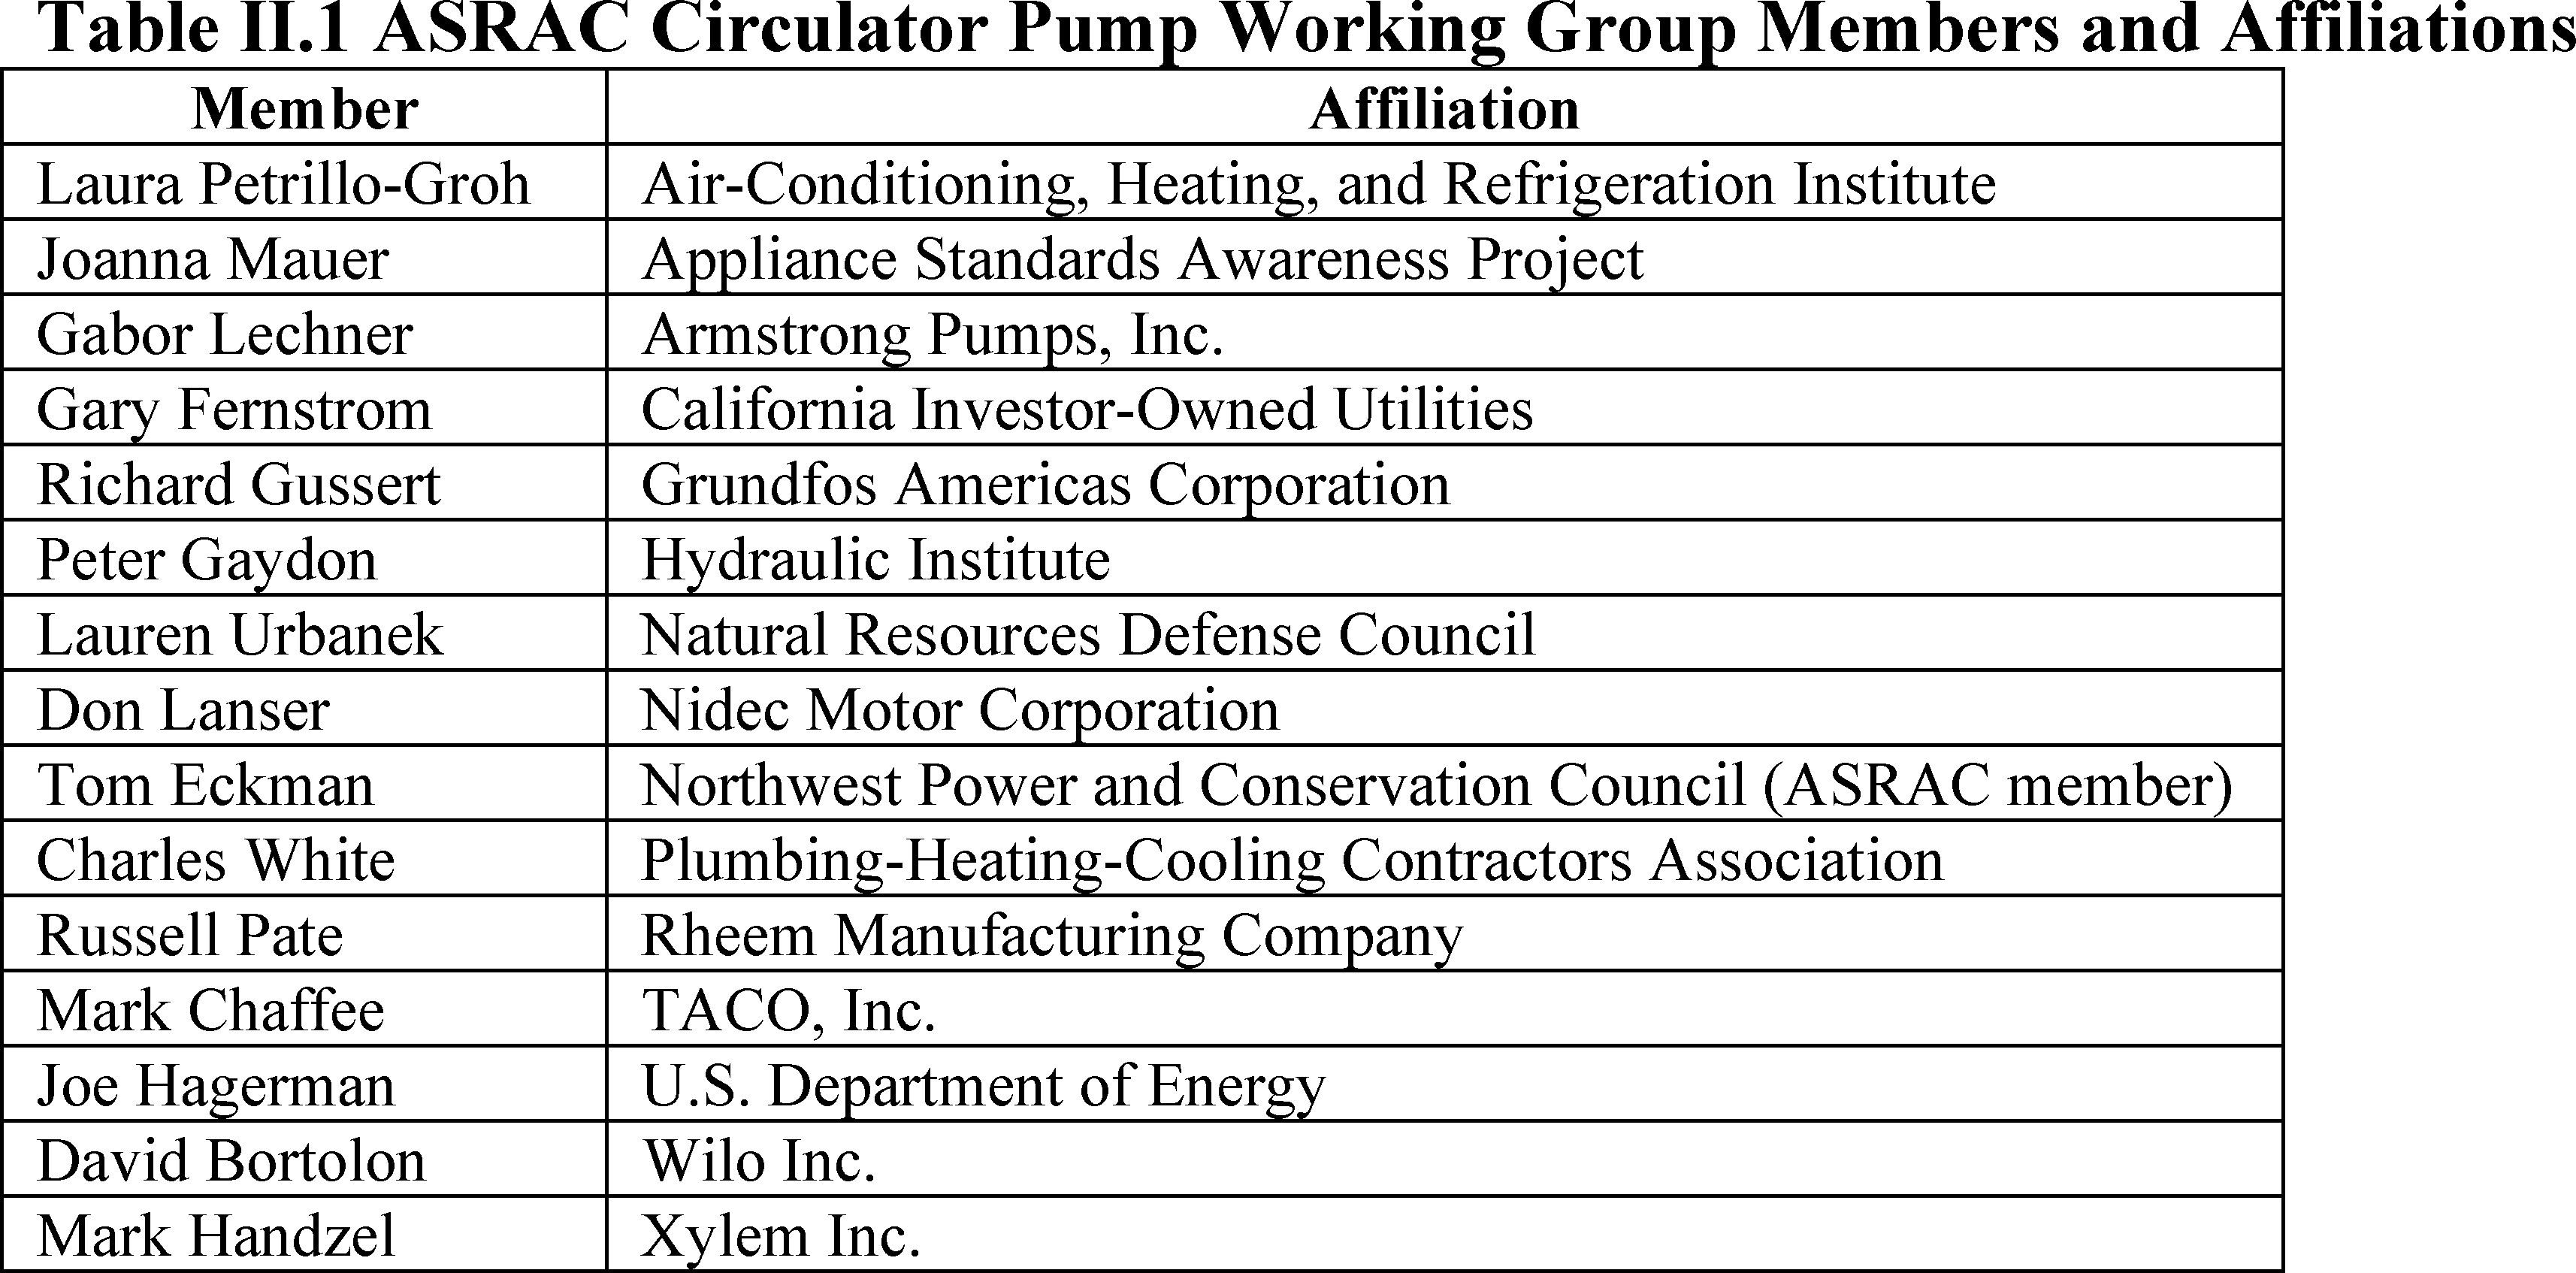
On February 3, 2016, DOE issued a notice of intent to establish a working group to negotiate a NOPR for energy conservation standards for circulator pumps, to negotiate, if possible, Federal standards and a test procedure for circulator pumps, and to announce the first public meeting. 81 FR 5658. The members of the Circulator Pump Working Group (“CPWG”), which was established under the ASRAC, were selected to ensure a broad and balanced array of interested parties and expertise, including representatives from efficiency advocacy organizations and manufacturers. Additionally, one member from ASRAC and one DOE representative were part of the CPWG. Table II.1 lists the 15 members of the CPWG and their affiliations.
The CPWG commenced negotiations at an open meeting on March 29, 2016, and held six additional meetings to discuss scope, metric, and the test procedure. The CPWG concluded its negotiations for test procedure topics on September 7, 2016, with a consensus vote to approve a term sheet containing recommendations to DOE on scope, definitions, metric, and the basis of the test procedure (“September 2016 CPWG Recommendations”). The September 2016 CPWG Recommendations are available in the CPWG docket. (Docket No. EERE-2016-BT-STD-0004, No. 58)
The CPWG continued to meet to address potential energy conservation standards for circulator pumps. Those meetings were held November 3-4, 2016, and November 29-30, 2016, with approval of a second term sheet (“November 2016 CPWG Recommendations”) containing CPWG recommendations related to energy conservation standards, applicable test procedure, labeling, and certification requirements for circulator pumps (Docket No. EERE-2016-BT-STD-0004, No. 98). Whereas the September 2016 CPWG Recommendations are discussed in the September 2022 TP Final Rule, the November 2016 CPWG Recommendations are summarized in section III.A of this document. In a meeting held December 22, 2016, ASRAC voted unanimously to approve the September 2016 and November 2016 CPWG Recommendations. (Docket No. EERE-2013-BT-NOC-0005, No. 91 at p. 2) [16]
In a letter dated June 9, 2017, the Hydraulic Institute (“HI”) expressed its support for the process that DOE initiated regarding circulator pumps and encouraged the publishing of a NOPR and a final rule by the end of 2017. (Docket No. EERE-2016-BT-STD-0004, HI, No. 103 at p. 1) DOE took no actions regarding circulator pumps between 2017 and 2020. In response to an early assessment review request for information (“RFI”) published September 28, 2020, regarding the existing test procedures for general pumps (85 FR 60734, “September 2020 Early Assessment RFI”), HI commented that it continues to support the recommendations from the CPWG. (Docket No. EERE-2020-BT-TP-0032, HI, No. 6 at p. 1) The Northwest Energy Efficiency Alliance (“NEEA”) also referenced the September 2016 CPWG Recommendations and recommended that DOE adopt test procedures for circulator pumps in the pumps rulemaking or a separate rulemaking. (Docket No. EERE-2020-BT-TP-0032, NEEA, No. 8 at p. 8)
On May 7, 2021, DOE published a request for information related to test procedures and energy conservation standards for circulator pumps and received comments from the interested parties. 86 FR 24516 (“May 2021 RFI”).
DOE published a NOPR for the test procedure on December 20, 2021, presenting DOE's proposals to establish
( printed page 44474)
a circulator pump test procedure (“December 2021 TP NOPR”). 86 FR 72096. DOE held a public meeting related to this NOPR on February 2, 2022. DOE published a final rule for the test procedure on September 19, 2022 (“September 2022 TP Final Rule”). The test procedure final rule established definitions, testing methods and a performance metric, requirements regarding sampling and representations of energy consumption and certain other metrics, and enforcement provisions for circulator pumps.
DOE published an energy conservation standard NOPR on December 6, 2022. 87 FR 74850 (“December 2022 NOPR”). DOE held a public meeting related to the December 2022 NOPR on January 19, 2023 (“NOPR public meeting”).
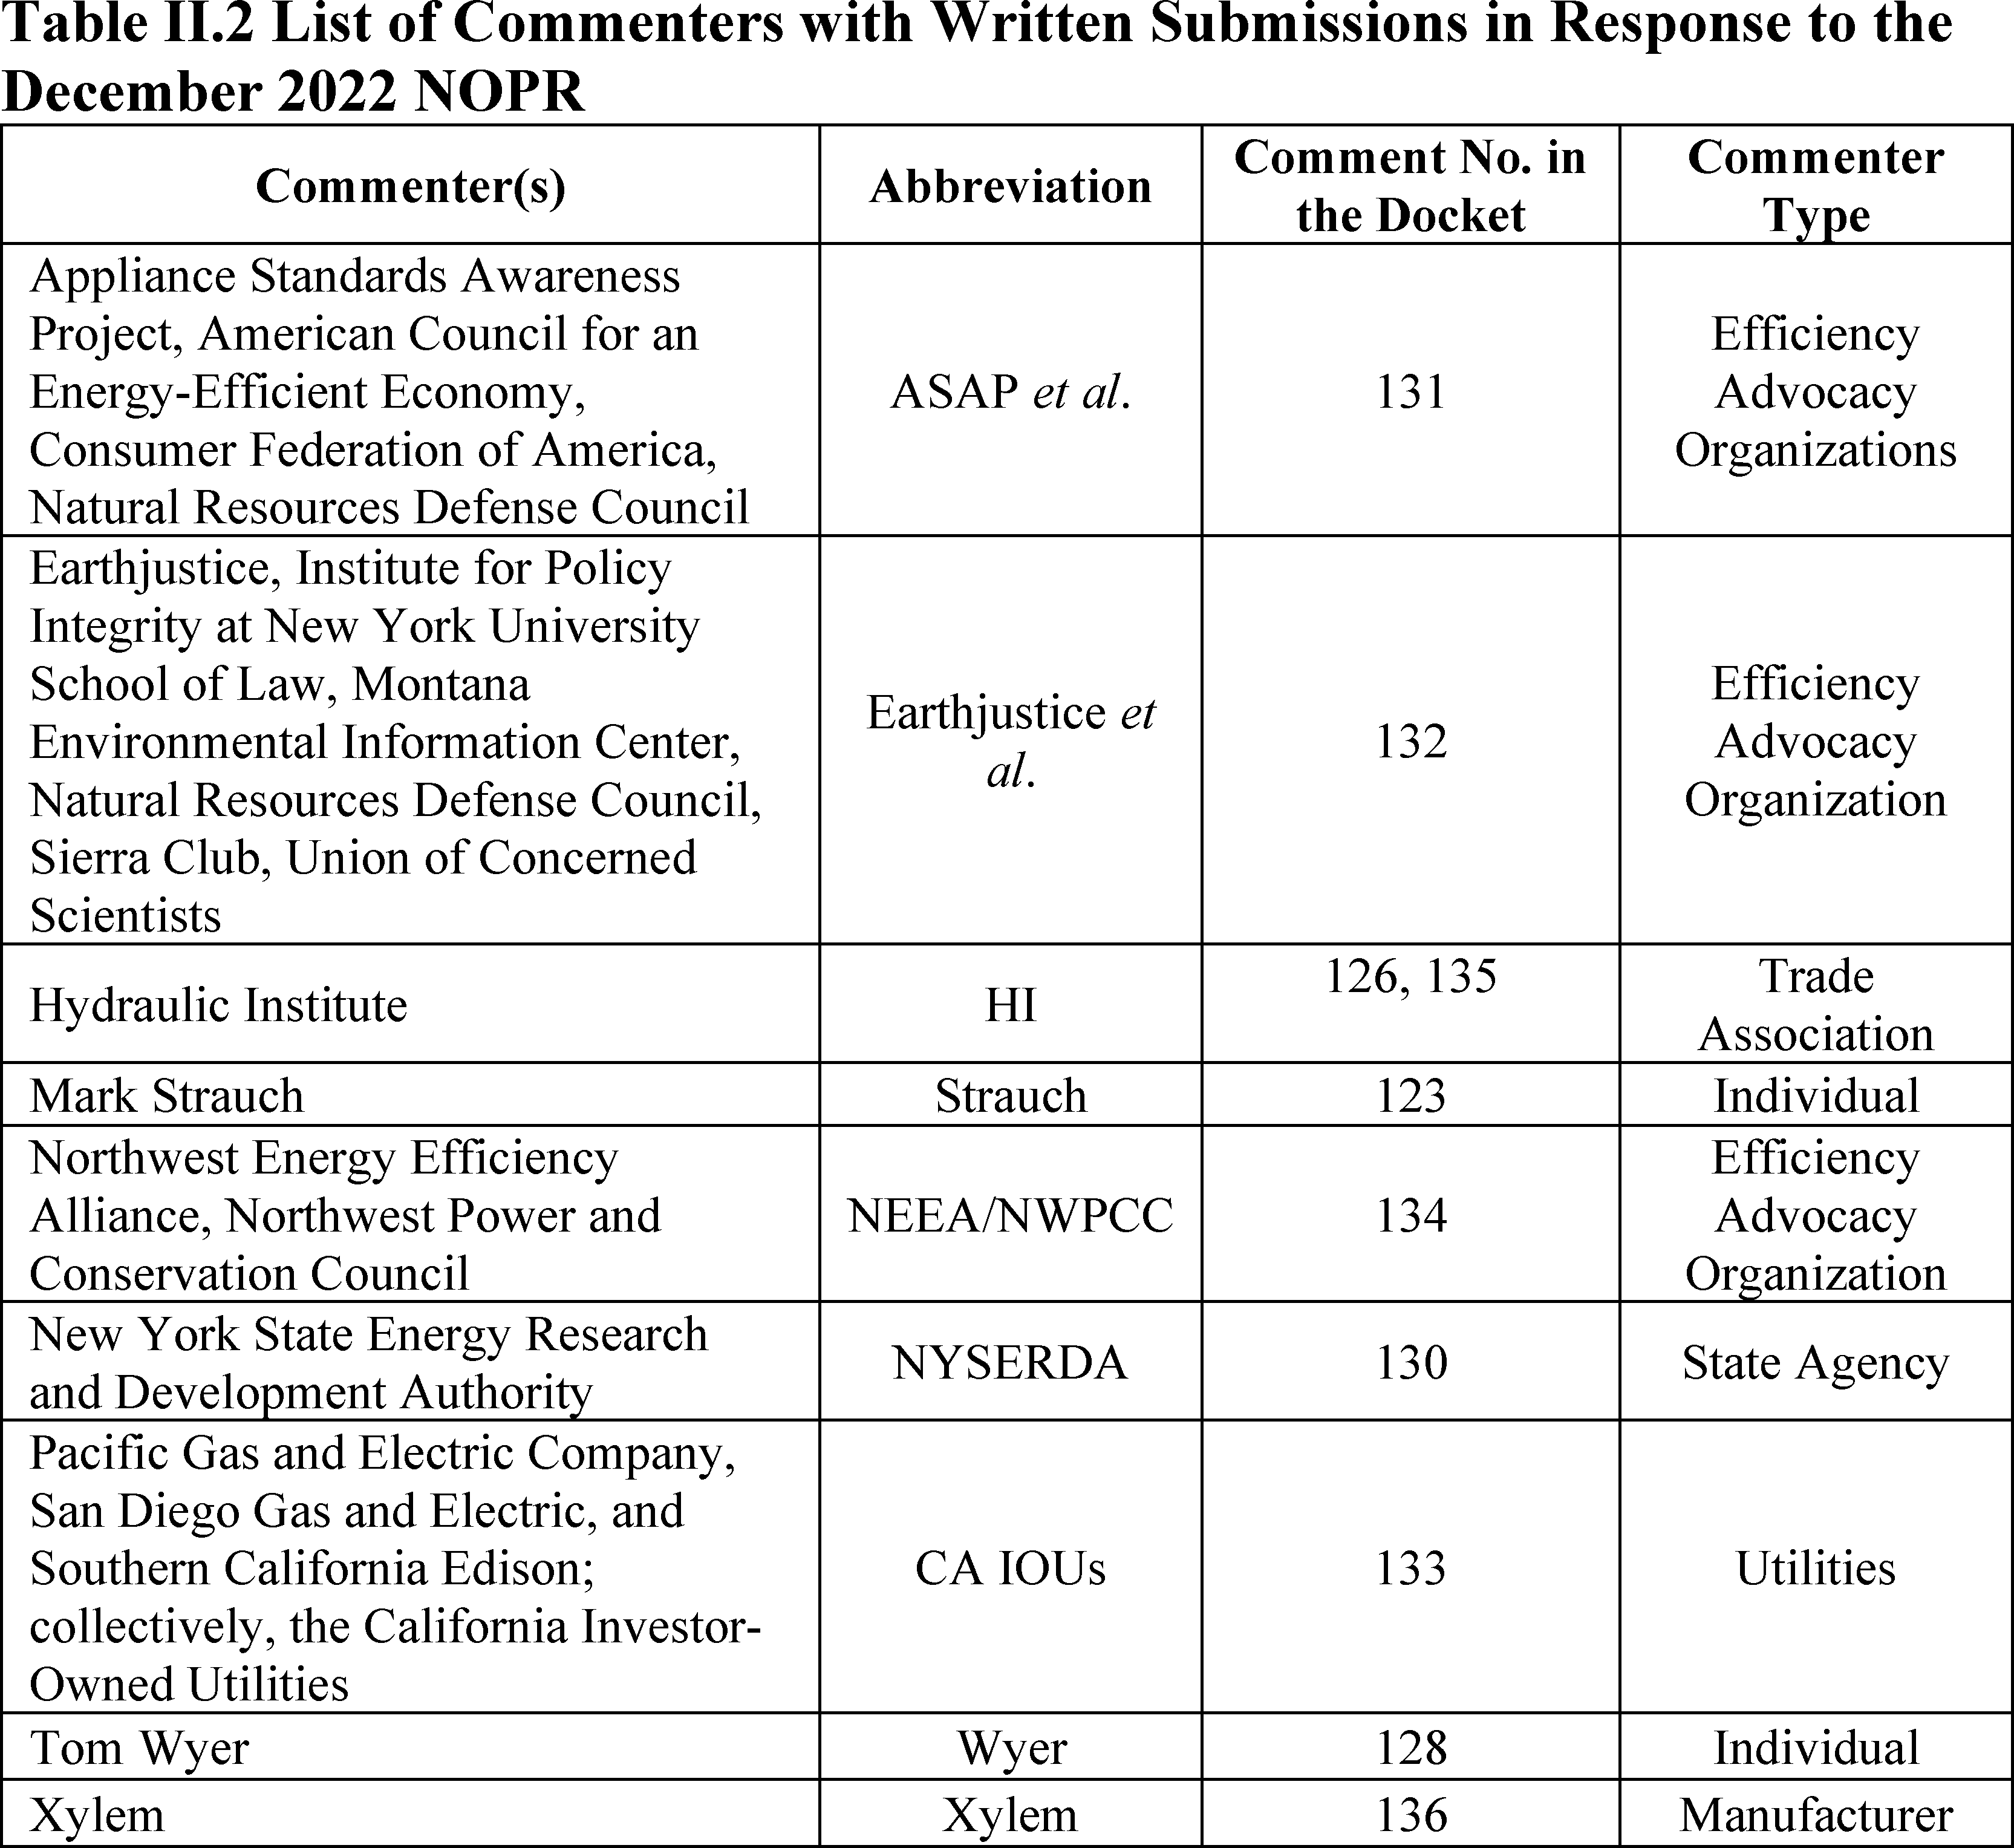
DOE received comments in response to the December 2022 NOPR from the interested parties listed in Table II.2.
A parenthetical reference at the end of a comment quotation or paraphrase provides the location of the item in the public record.[17]
To the extent that interested parties have provided written comments that are substantively consistent with any oral comments provided during the NOPR public meeting, DOE cites the written comments throughout this final rule. Any oral comments provided during the NOPR public meeting that are not substantively addressed by written comments are summarized and cited separately throughout this final rule.
III. General Discussion
DOE developed this final rule after considering oral and written comments, data, and information from interested parties that represent a variety of interests. The following discussion addresses issues raised by these commenters.
A. November 2016 CPWG Recommendations
As discussed in section II.B of this document, the CPWG approved two term sheets which represented the group's consensus recommendations. The second term sheet, referred to in this final rule as the “November 2016 CPWG Recommendations” contained the CPWG's recommendations related to energy conservation standards, applicable test procedure, labeling, and certification requirements for circulator pumps. (Docket No. EERE-2016-BT-STD-0004, No. 98) The standards established in this final rule closely mirror the November 2016 CPWG Recommendations, which are summarized in this section.
In response to the December 2022 NOPR, the CA IOUs provided comments that supported DOE's alignment of the proposed regulations and the CPWG's consensus November term sheet. (CA IOUs, No. 133 at pp. 1-2) HI stated they support the recommendations agreed upon by the CPWG. (HI, No. 135 at p.
( printed page 44475)
1) HI acknowledged DOE has incorporated the appropriate sections for the testing and rating of circulator pumps.
Id.
1. Energy Conservation Standard Level
The November 2016 CPWG Recommendations recommended that each circulator pump be required to meet an applicable minimum efficiency standard. Specifically, the recommendation was that each pump must have a CEI [18]
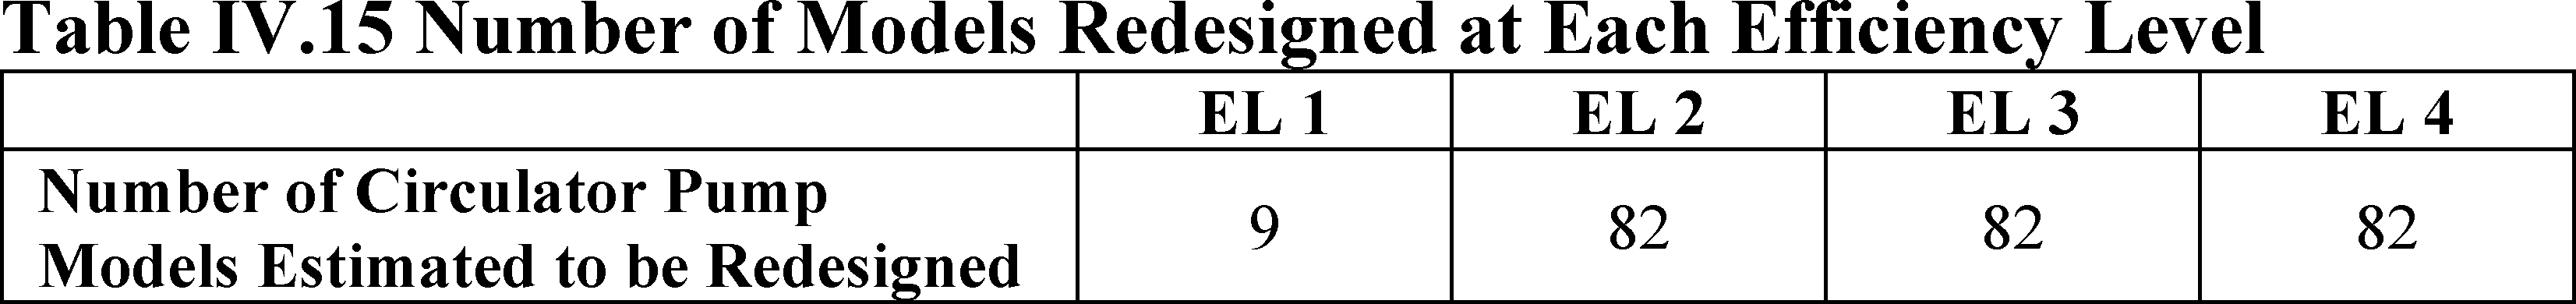
of less than or equal to 1.00. Among the numbered efficiency levels (“ELs”) considered by the CPWG as potential standard levels, the agreed level was EL 2,
i.e.,
a CEI less than or equal to 1.00 (“Recommendation #1”).
In response to the December 2022 NOPR, NEEA/NWPCC supported the proposed rulemaking, specifically the proposed adoption of TSL 2. (NEEA/NWPCC, No. 134 at pp. 3-4) In the December 2022 NOPR DOE defined EL 2 and TSL 2 at the same standard level, which is consistent with this final rule, as discussed in section V.B.2 of this document. 87 FR 74850, 74895. NYSERDA supported the proposed adoption of TSL 2 as well, due to the number of multifamily buildings in New York City being higher than the national average. (NYSERDA, No. 130 at p. 4) NYSERDA commented that circulator pumps likely operate more in any given year in places such as New York City and they may see more energy savings than the NOPR proposed.
Id.
The CA IOUs also supported DOE's development of energy conservation standards based on the consensus recommendations and supported adoption of the proposed TSL 2 recommendation. (CA IOUs, No. 133 at p. 1)
DOE did not receive any comments that did not support the CPWG-recommended standard level for circulator pumps in response to the December 2022 NOPR. Accordingly, and as described in section V.C.1 of this document, DOE, in this final rule, is adopting energy conservation standards for circulator pumps at TSL 2.
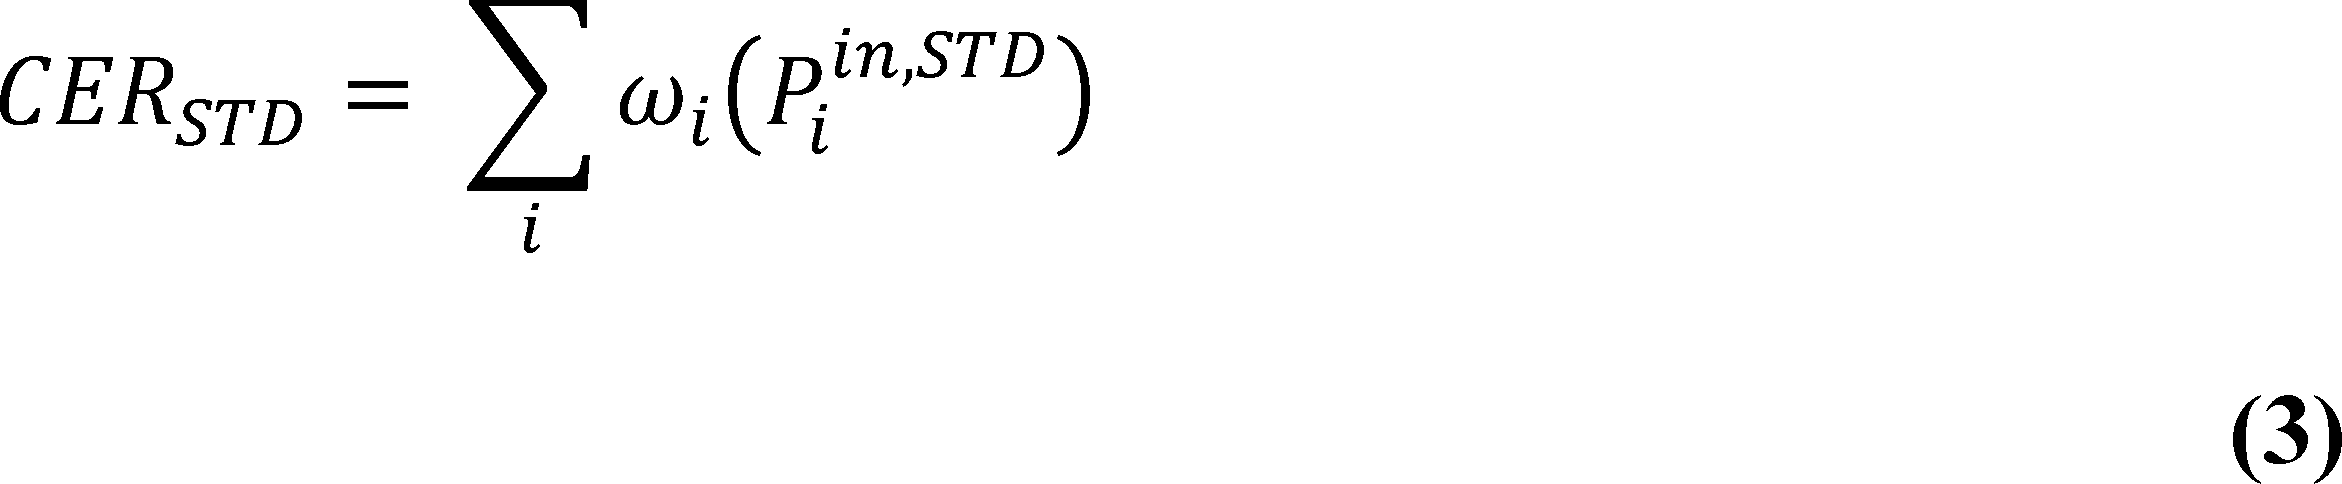
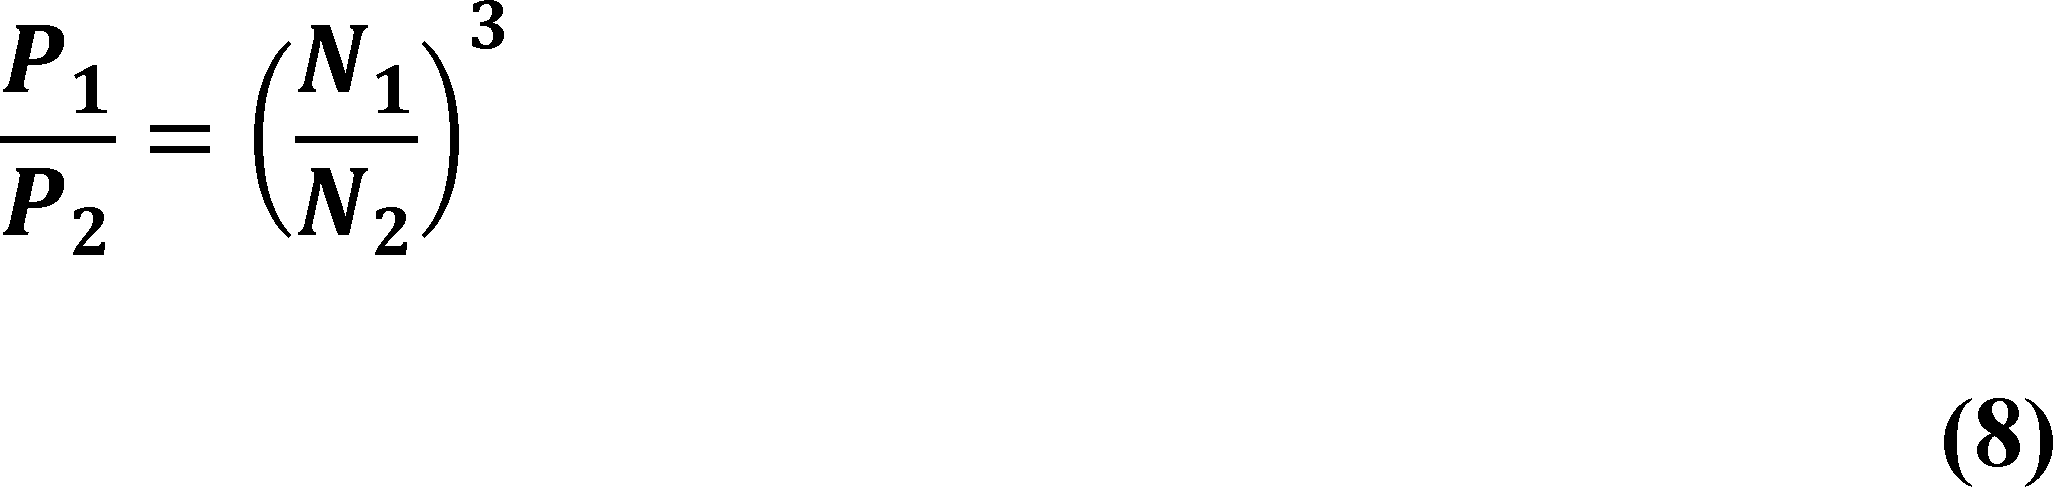
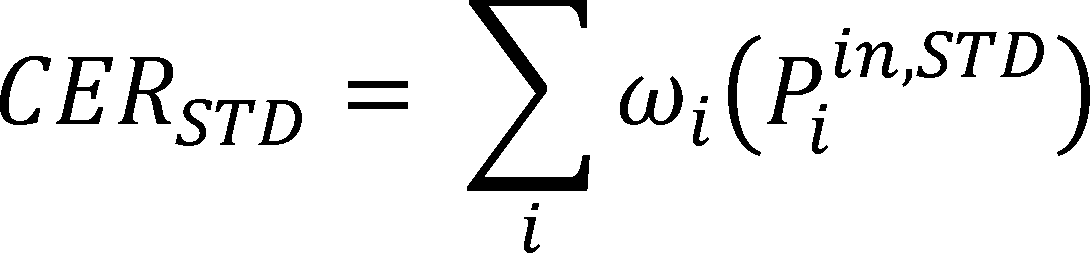
CEI was defined in the September 2022 TP Final Rule consistent with the November 2016 CPWG Recommendations as shown in equation (2), and consistent with section 41.5.3.2 of HI 41.5-2022. 87 FR 57264.
Where:
CER = circulator energy rating (hp); and
CERSTD
= circulator energy rating for a minimally compliant circulator pump serving the same hydraulic load as the tested pump.
The value of CER varies according to the circulator pump control variety of the tested pump, but in all cases is a function of measured pump input power when operated under certain conditions, as described in the September 2022 TP Final Rule.
Relatedly, CERSTD
represents CER for a hypothetical circulator pump, as a function of hydraulic power, that is minimally compliant with DOE's energy conservation standards, as determined in accordance with the specifications at paragraph (i) of § 431.465. 87 FR 57264. Conceptually, it is a curve that provides a value of pump input power for any hydraulic output power. Energy conservation standards could equivalently have been formulated to direct that a circulator pump must carry a CER less than the value of CERSTD
at its particular hydraulic output power. Defining CEI as a ratio of CER and CERSTD
serves to normalize the energy conservation standard, allowing it to assume a fixed numerical value regardless of hydraulic output power, which has the advantage of simplicity and better comparability among different pump models.
The November 2016 CPWG Recommendations contained a proposed method for calculating CERSTD
.[19]
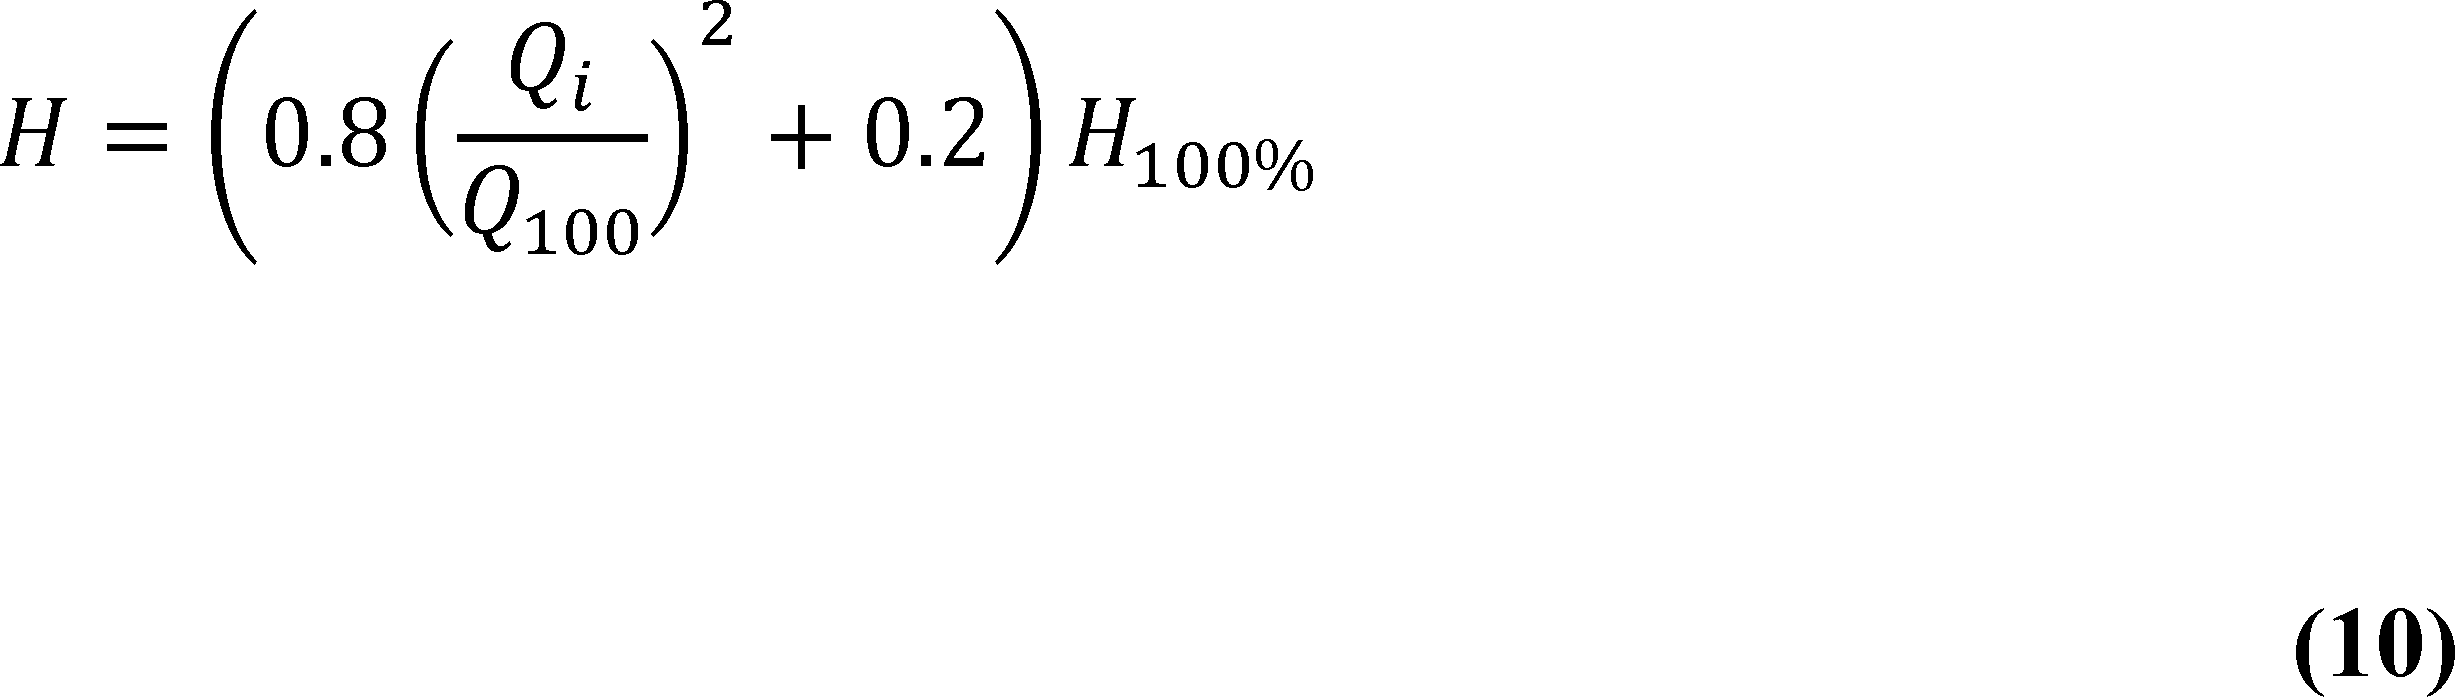
The equation represents a summation of weighted input powers at each part load test point. The part load test points are set at 25%, 50%, 75%, and 100% of the flow at best efficiency point (“BEP”). Each test point is weighted based on the controls used for testing. This equation is shown in equation (3):
Where:
ωi
= weight at each test point i, specified in Recommendation #2B;
Piin,STD
= reference power input to the circulator pump driver at test point i, calculated using the equations and method specified in Recommendation #2C; and
i = test point(s), defined as 25%, 50%, 75%, and 100% of the flow at BEP.
Recommendation #2B of the November 2016 CPWG Recommendations specified a weighting factor of 25% for each respective test point i. (“Recommendation #2B”).
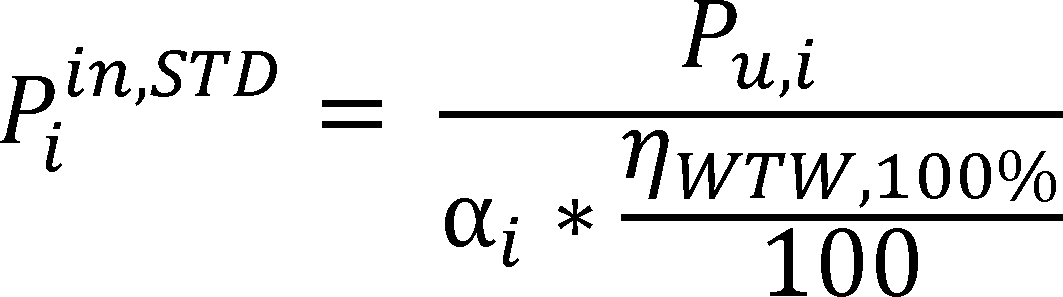
The November 2016 CPWG Recommendations also included (“Recommendation #2C”) a
( printed page 44476)
recommended reference input power, Piin,STD
, as described in equation (4).
Where:
Pu,i
= tested hydraulic power output of the pump being rated at test point i, in hp;
ηWTW,100%
= reference BEP circulator pump efficiency at the recommended standard level (%), calculated using the equations and values specified in Recommendation #2D;
αi
= part-load efficiency factor at each test point i, specified in Recommendation #2E; and
i = test point(s), defined as 25%, 50%, 75%, and 100% of the flow at BEP.
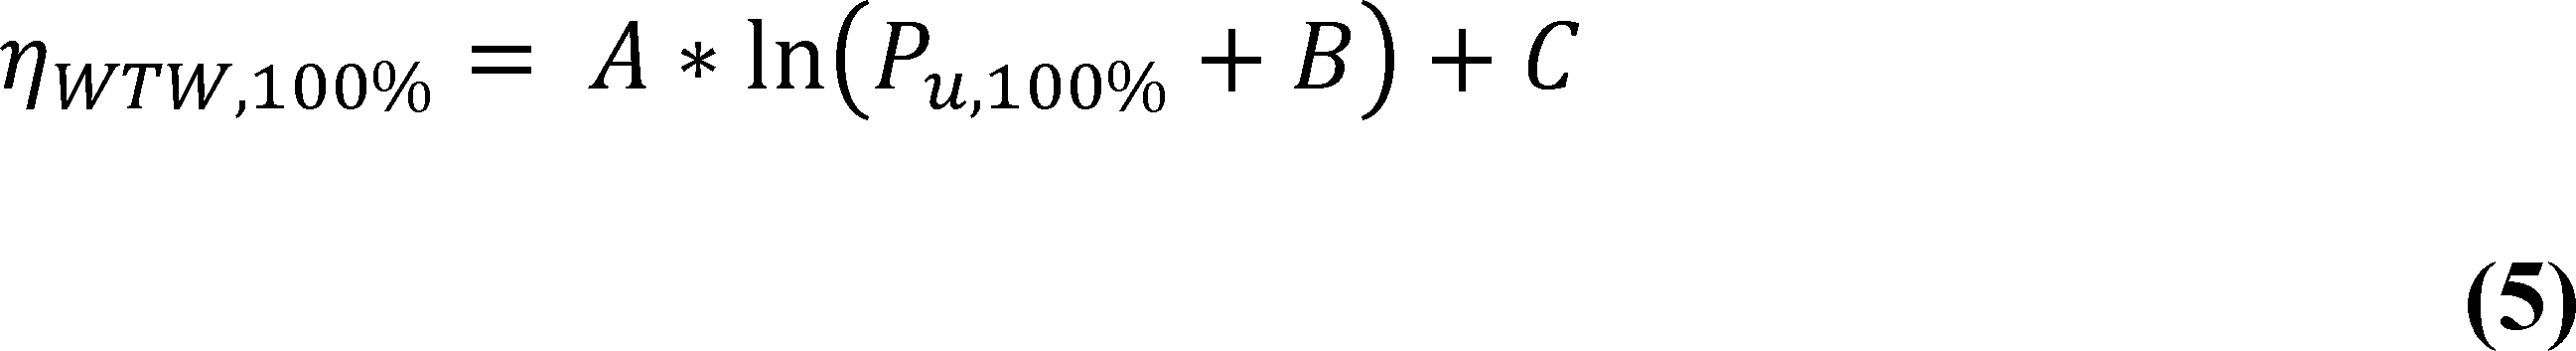
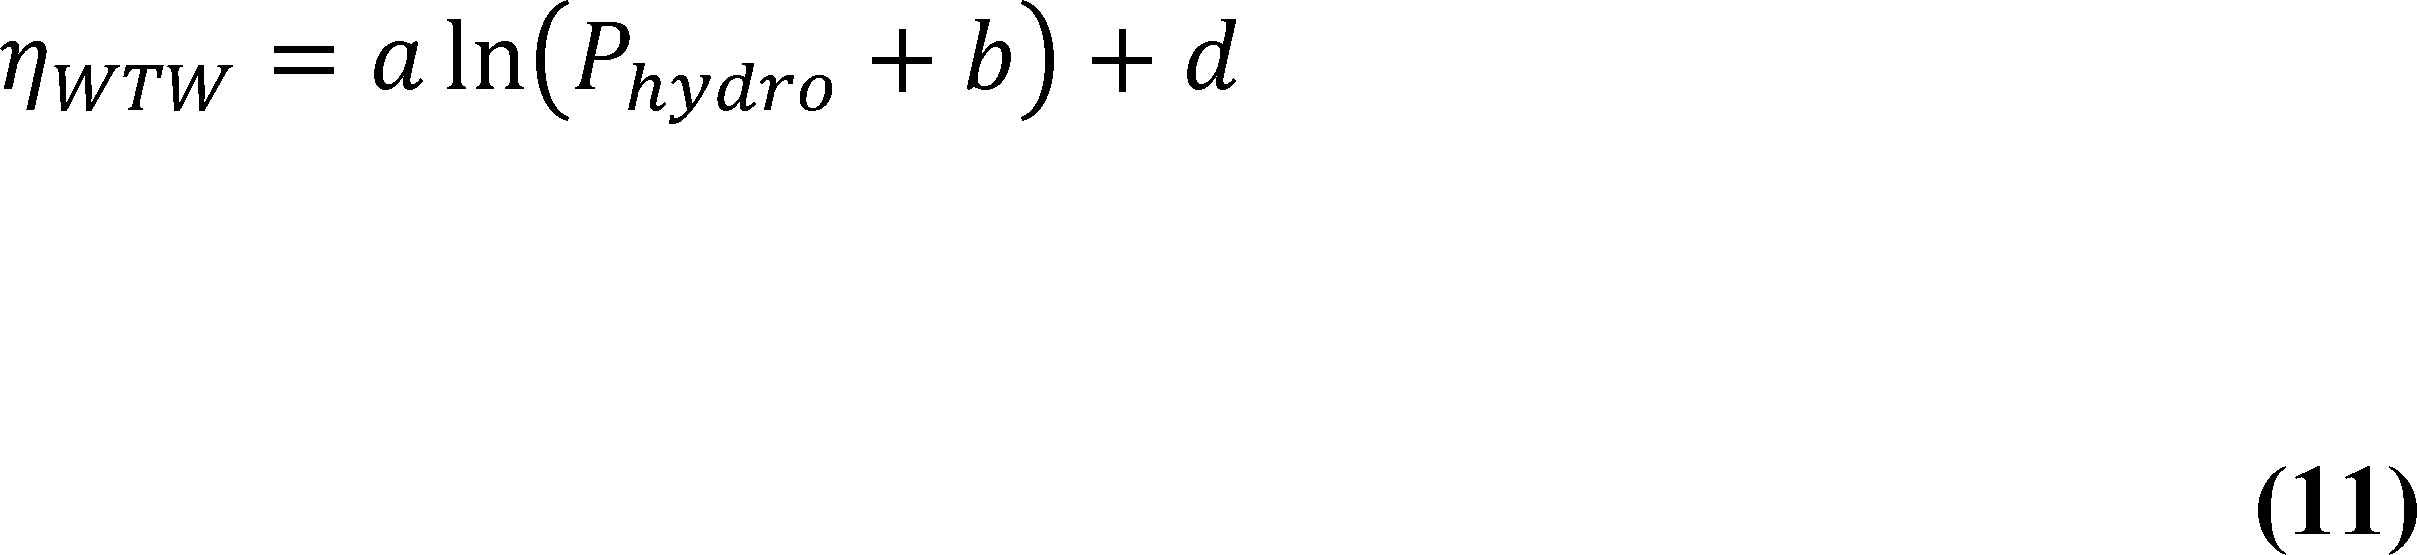
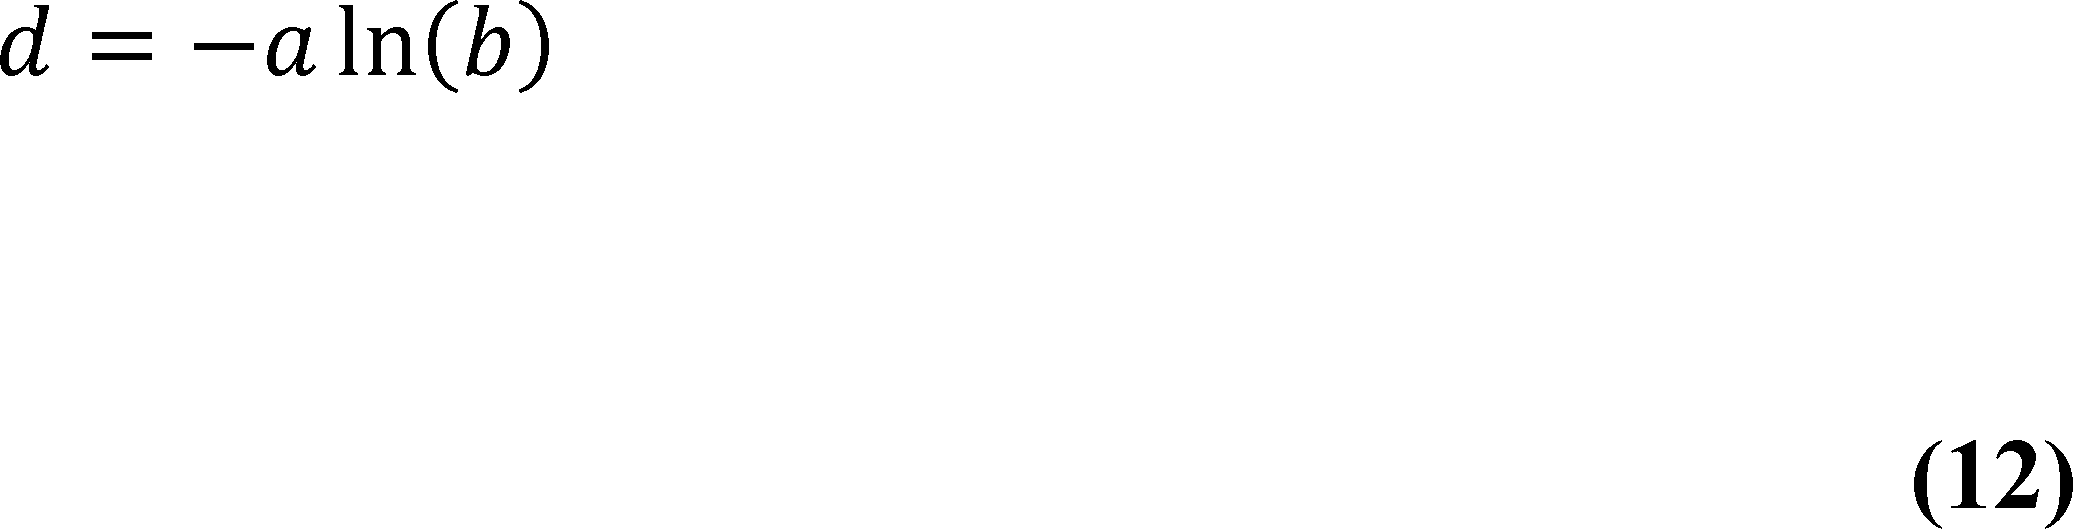
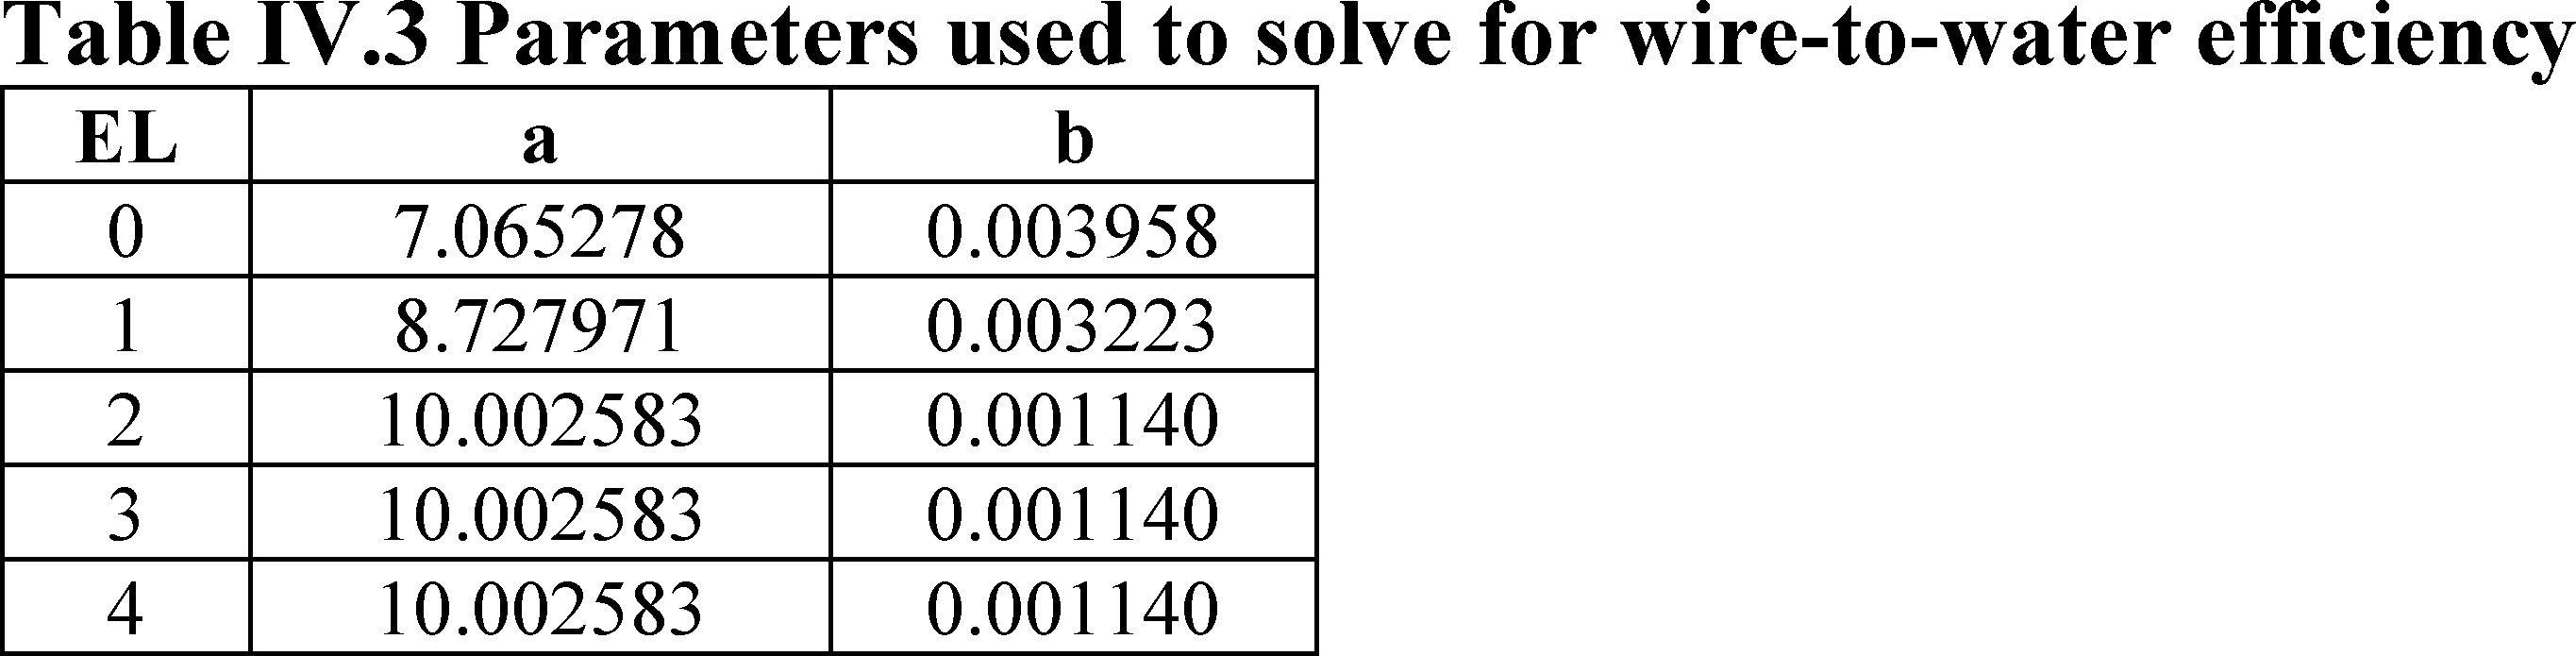
The November 2016 CPWG Recommendations also included a reference efficiency at BEP at the CPWG-recommended standard level, ηWTW,100%
(“Recommendation #2D”), which varies by circulator pump hydraulic output power.
Specifically, for circulator pumps with BEP hydraulic output power Pu,100%
<1 hp, the reference efficiency at BEP (ηWTW,100%
) should be determined using equation (5):
Where:
ηWTW,100%
= reference BEP pump efficiency at the recommended standard level (%); and
Pu,100%
= tested hydraulic power output of the pump being rated at BEP (hp).
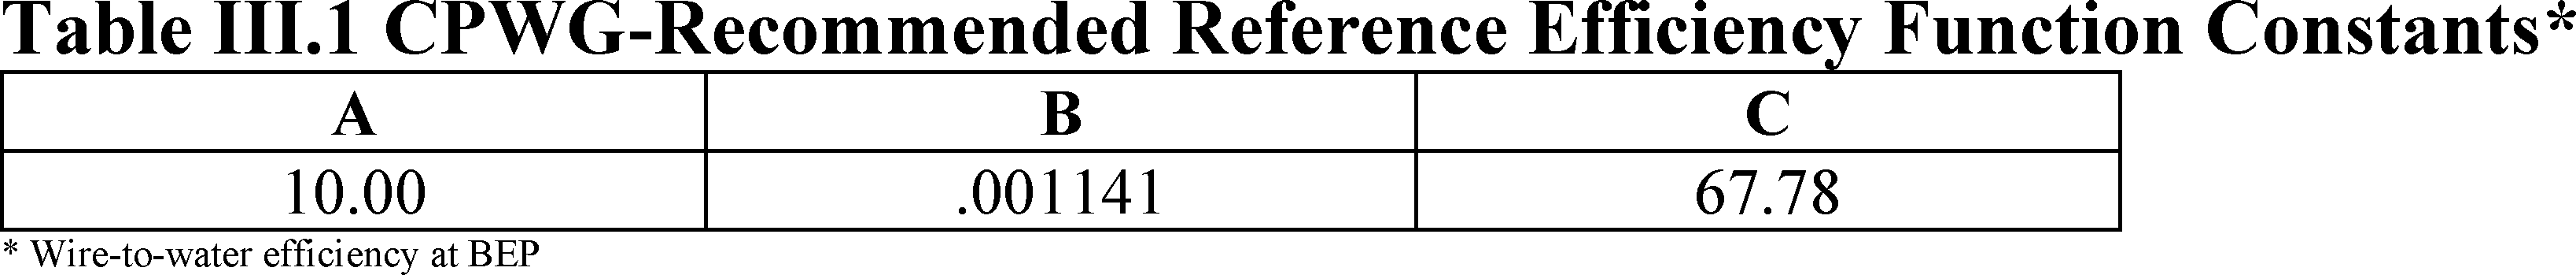
For the CPWG-recommended standard level, the constants A, B, and C used in equation 5 would have the values listed in Table III.1.
For circulator pumps with BEP hydraulic output power Pu,100%
≥1 hp, the reference efficiency at BEP (ηWTW,100%
) would have a constant value of 67.79.
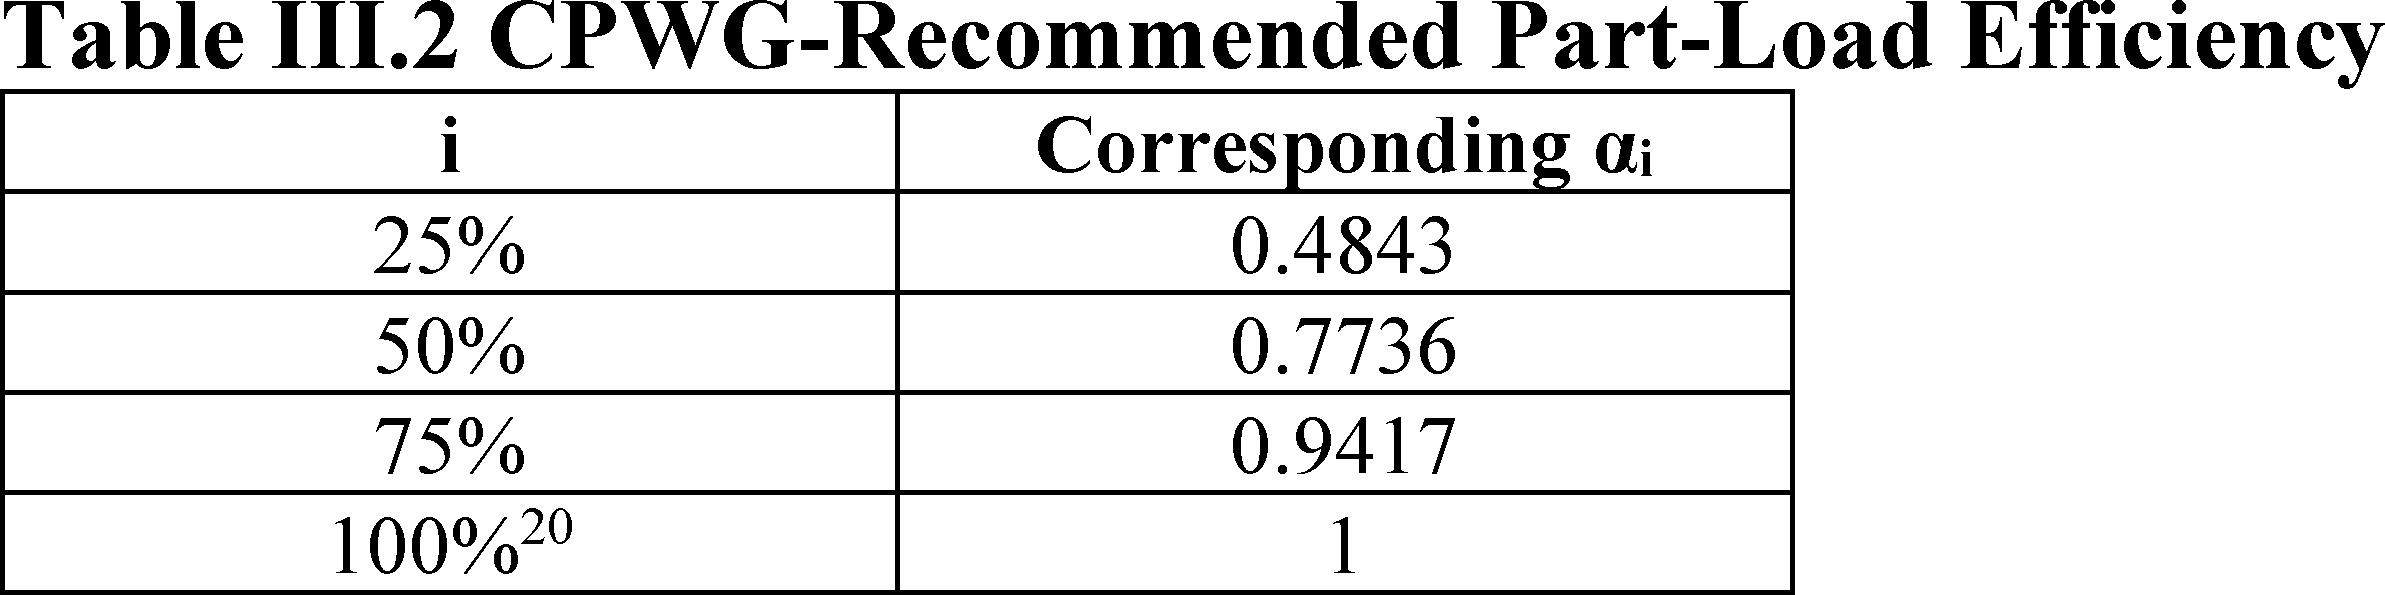
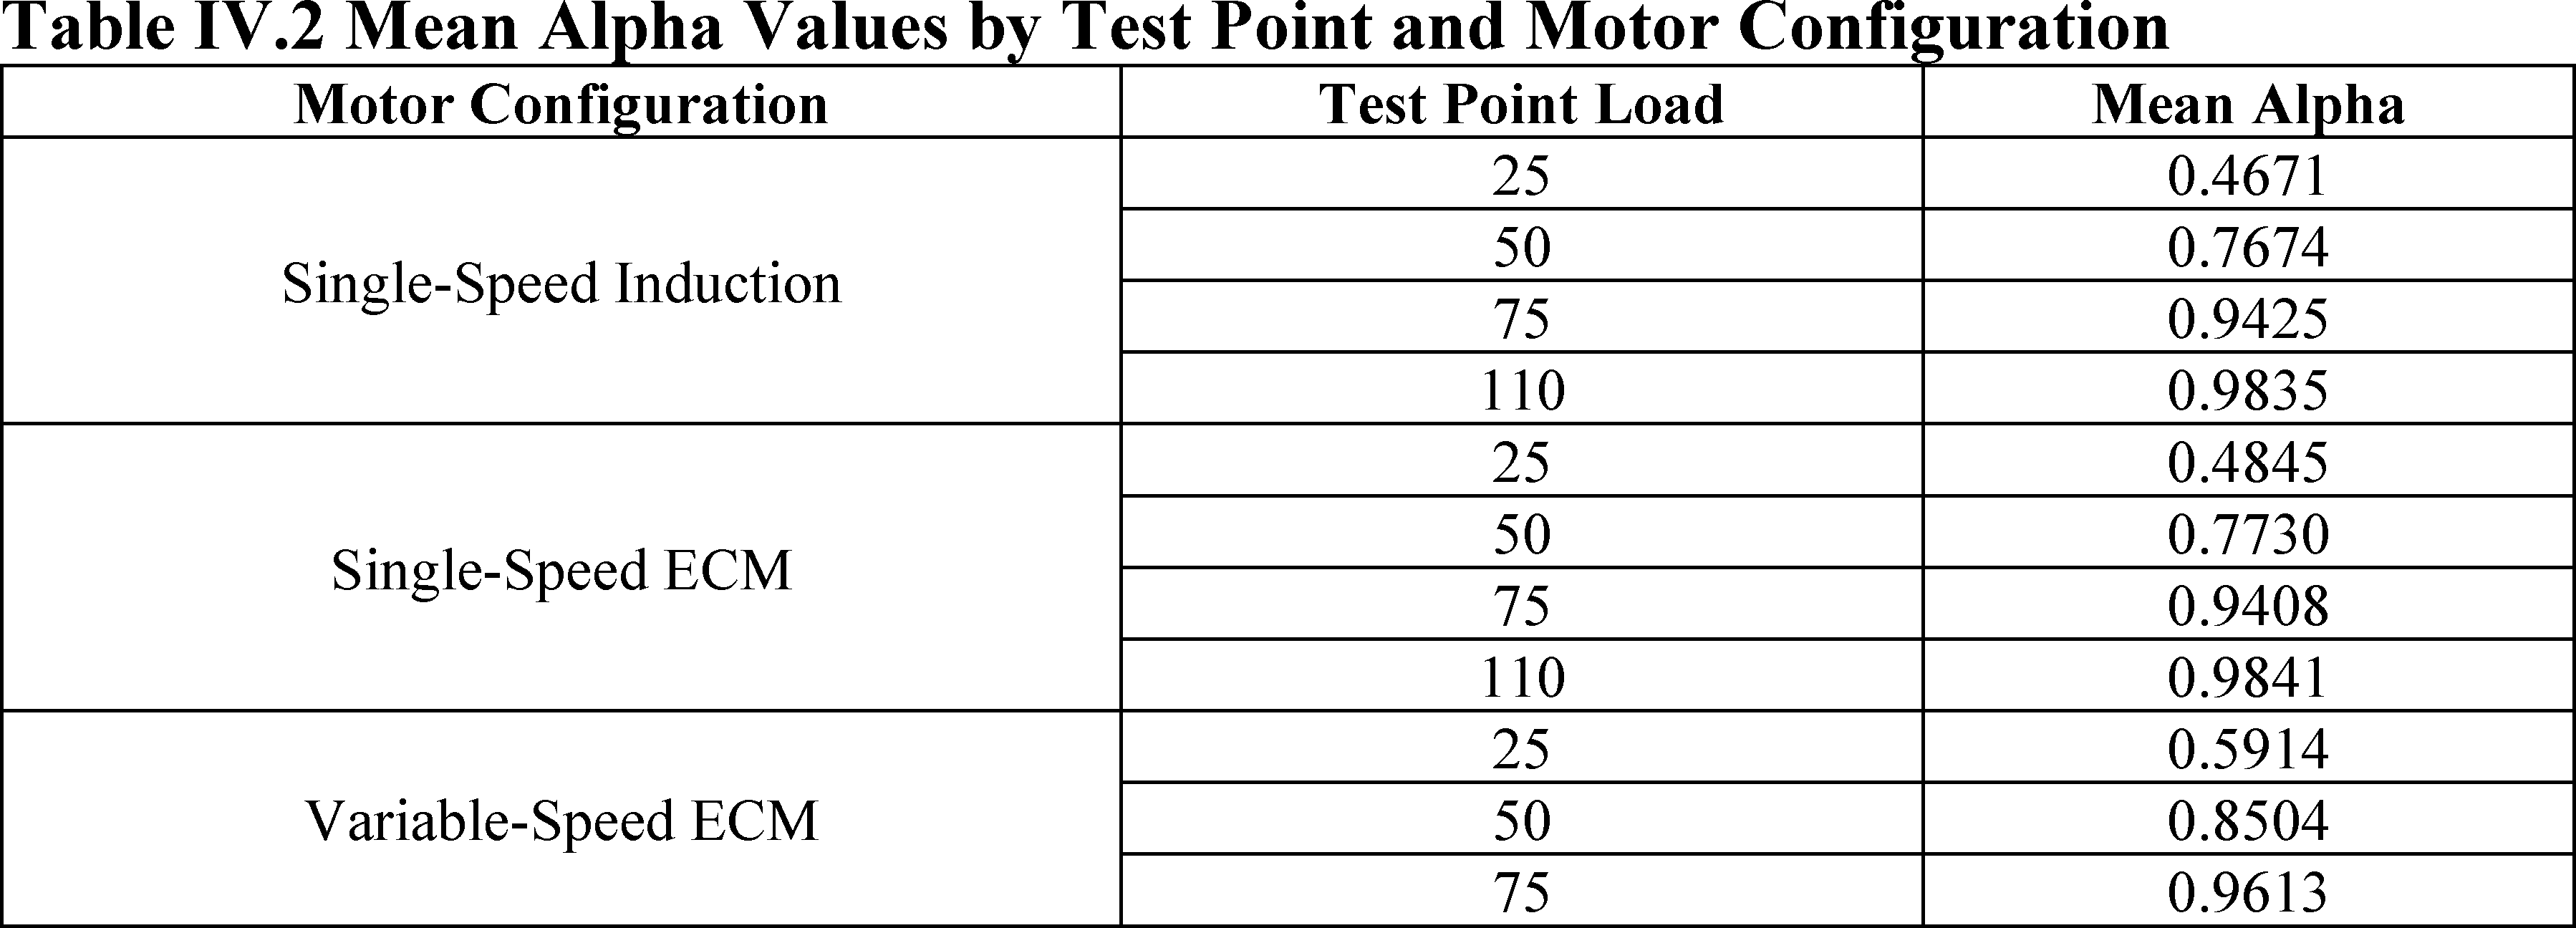
Additionally, the November 2016 CPWG Recommendations included a part-load efficiency factor (αi, as appears in equation (4)), which varies according to test point (“Recommendation #2E). Specifically, αi
would have the values listed in Table III.2.
This CPWG-recommended equation structure is used to characterize the standard level established in this final rule, with certain inconsequential changes to variable names.
2. Labeling Requirements
Under EPCA, DOE has certain authority to establish labeling requirements for covered equipment. (42 U.S.C. 6315) The November 2016 CPWG Recommendations contained one recommendation regarding labeling requirements, which was to include both model number and CEI [21]
on the circulator nameplate. (Docket No. EERE-2016-BT-STD-0004, No. 98, Recommendation #3 at p. 4)
( printed page 44477)
In response to the December 2022 NOPR, HI recommended that DOE establish label requirements for circulator pumps in this rulemaking that only include the basic model number and CEI, as agreed to by the CPWG. (HI, No. 135 at p. 6) DOE did not receive any other comments regarding the establishment of labeling requirements for circulator pumps.
DOE is considering establishing labeling requirements for circulator pumps in a separate rulemaking and is carefully evaluating the potential benefits of establishing labeling requirements as explained by HI. Accordingly, in this final rule, DOE is not establishing specific labeling requirements for circulator pumps, but DOE may consider such requirements for circulator pumps, including those recommended by the CPWG, in a separate rulemaking.
3. Certification Reports
Under EPCA, DOE has the authority to require information and reports from manufacturers with respect to the energy efficiency or energy use. (42 U.S.C. 6316; 42 U.S.C. 6296).
The November 2016 CPWG Recommendations contained one recommendation regarding certification reporting requirements. Specifically, the CPWG recommended that the following information should be included in both certification reports and the public Compliance Certification Management System (“CCMS”) database:
Flow (in gallons per minute) and head (in feet) at BEP
Tested control setting
Input power at measured data points
(Docket No. EERE-2016-BT-STD-0004, No. 98, Recommendation #4 at p. 4)
The aforementioned CPWG recommendation also included that certain additional information be permitted but not mandatorily included in both certification reports and the public CCMS database. (Docket No. EERE-2016-BT-STD-0004, No. 98 Recommendation #4 at p. 4) These additional options are: true root mean square (“RMS”) current, true RMS voltage, real power, and resultant power factor at measured data points.
Id.
In response to the December 2022 NOPR proposal to require a pump operating in the least consumptive control mode when meeting compliance with energy conservation standards for circulator pumps, the CA IOUs noted that the most consumptive performance of circulator products indicates the product's combined motor and hydraulic efficiency without controls, providing helpful information to consumers and the regulatory process. (CA IOUs, No. 133 at p. 2) They encouraged DOE to support voluntary reporting of this performance data to inform future rulemakings.
Id.
DOE is not establishing certification or reporting, voluntary or mandatory, requirements for circulator pumps in this final rule. Instead, DOE may consider proposals to address amendments to the certification requirements and reporting for circulator pumps under a separate rulemaking regarding appliance and equipment certification. Further information on this voluntary reporting of performance in various control modes is discussed in section III.D.1 of this document.
B. General Comments
DOE received a single general comment from an interested party regarding rulemaking timing and process. Specifically, ASAP
et al.
commented in response to the December 2022 NOPR that they supported DOE's proposed rulemaking for circulator pumps. (ASAP
et al.,
No. 131 at p. 1)
C. Equipment Classes and Scope of Coverage
When evaluating and establishing energy conservation standards, DOE divides covered equipment into equipment classes by the type of energy used or by capacity or other performance-related features that justify differing standards. In determining whether a performance-related feature justifies a different standard, DOE must consider such factors as the utility of the feature to the consumer and other factors DOE determines are appropriate. (42 U.S.C. 6316(a); 42 U.S.C. 6295(q))
This final rule covers equipment that meets the definition of “circulator pumps,” as codified at 10 CFR 431.462, which is consistent with the September 2016 CPWG Recommendations. DOE identified no basis to change the scope of energy conservation standards for circulator pumps relative to the scope of test procedures adopted in the September 2022 Final Rule. Accordingly, in this final rule, DOE is aligning the scope of energy conservation standards for circulator pumps with that of the circulator pumps test procedure. 87 FR 57264. Specifically, this final rule is applying energy conservation standards to all circulator pumps that are also clean water pumps, including on-demand circulator pumps and circulators-less-volute, and excluding submersible pumps and header pumps. Comments related to scope are discussed and considered in the test procedure final rule.
Both of these proposals—scope and equipment classes—match the recommendations of the CPWG, which are summarized in this section. They are discussed further in section IV.A.1 of this document.
1. CPWG Recommendations
a. Scope
The September 2016 CPWG Recommendations addressed the scope of a circulator pumps rulemaking. Specifically, the CPWG recommended that the scope of a circulator pumps test procedure and energy conservation standards cover clean water pumps (as defined at 10 CFR 431.462) distributed in commerce with or without a volute and that are one of the following categories: wet rotor circulator pumps, dry-rotor close-coupled circulator pumps, and dry-rotor mechanically coupled circulator pumps. The CPWG also recommended that the scope exclude submersible pumps and header pumps. 86 FR 24516, 24520. (Docket No. EERE-2016-BT-STD-0004, No. 58, Recommendations #1A, 2A, and 2B at pp. 1-2) As previously stated, the scope of this rule aligns with the scope recommended by the CPWG, consistent with the September 2022 TP Final Rule.
b. Definitions
The CPWG also recommended several definitions relevant to scope. DOE notes that, generally, definitions recommended by the CPWG rely on terms previously defined in the January 2016 TP final rule, including “close-coupled pump,” “mechanically-coupled pump,” “dry rotor pump,” “single axis flow pump,” and “rotodynamic pump.” 81 FR 4086, 4146-4147; 10 CFR 431.462.
In the September 2022 TP Final Rule, DOE did not propose a new definition for submersible circulator pumps, instead signaling applicability of an established term, “submersible pump,” which was defined in the 2017 test procedure final rule for dedicated-purpose pool pumps. 82 FR 36858, 36922 (Aug. 7, 2017):
“Submersible pump” means a pump that is designed to be operated with the motor and bare pump fully submerged in the pumped liquid. 10 CFR 431.462.
In the September 2022 TP Final Rule, DOE established a number of definitions related to circulator pumps. 87 FR
( printed page 44478)
57264. Specifically, DOE defined “circulator pump,” “wet rotor circulator pump,” “dry rotor, two-piece circulator pump,” “dry rotor, three-piece circulator pump,” “horizontal motor,” “header pump,” and “circulator-less-volute.”
Id.
“Circulator pump” was defined to include both wet- and dry-rotor designs and to include circulators-less-volute, which are distributed in commerce without a volute and for which a paired volute is also distributed in commerce. Header pumps, by contrast, are those without volutes and for which no paired volute is available in commerce.
Id.
DOE is maintaining these definitions from the September 2022 TP Final Rule in the standards for circulator pumps.
c. Equipment Classes
The CPWG recommended that all circulator pumps be analyzed in a single equipment class. (Docket No. EERE-2016-BT-STD-0004, No. 98, Recommendation #1 at p. 1) DOE's proposal aligns with the recommendation of the CPWG. Equipment classes are discussed further in section IV.A.1.b of this document.
d. Small Vertical In-Line Pumps
The CPWG recommended that DOE analyze and establish energy conservation standards for small vertical in-line pumps (“SVILs”) with a compliance date equivalent to the previous energy conservation standards final rule (81 FR 4367, Jan. 26, 2016) for general (not circulator) pumps. (Docket No. EERE-2016-BT-STD-0004, No. 58, Recommendation #1B at pp. 1-2) The CPWG recommended the standards for SVILs be similar in required performance to those of general pumps. (Docket No. EERE-2016-BT-STD-0004, No. 58, Recommendation #1B at p. 2) In addition to energy conservation standards for SVILs, the CPWG recommended SVILs be evaluated using the same test metric as general pumps.
Id.
Consistent with the CPWG recommendation, DOE extended the commercial and industrial pump test procedures to SVILs in a separate final rule published March 24, 2023. 88 FR 17934 (“March 2023 Final Rule”). That test procedure allows evaluation of energy conservation standards for SVILs as part of a commercial and industrial pumps rulemaking process.
In the December 2022 NOPR, DOE tentatively determined to maintain its approach to address energy conservation standards for circulator pumps only in this rulemaking, separately from SVILs. 87 FR 74850, 74862. DOE did not receive adequate data or information to suggest that DOE should address standards for SVILs along with the circulator pumps within the scope of the December 2022 NOPR.
Id.
Accordingly, DOE did not propose to include SVILs within the scope of the energy conservation standards considered in the December 2022 NOPR.
Id.
Relatedly, the September 2022 TP Final Rule did not adopt test procedures for SVILs. 87 FR 57264.
In the December 2022 NOPR, DOE requested comment on its approach to exclude SVILs from the scope of the NOPR, and whether DOE should consider standards for any SVILs as part of this rulemaking. 87 FR 74850, 74862.
HI and NEEA/NWPCC agreed with DOE's decision to exclude SVIL pumps from the circulators scope. (NEEA/NWPCC, No. 134 at pp. 4-5; HI, No. 135 at p. 4) HI also commented that according to ASRAC negotiations, SVILs should instead be addressed under the commercial and industrial pumps rulemaking. (HI, No. 135 at p. 4)
Due to stakeholders providing comment supporting SVILs to be evaluated in the commercial and pumps rulemaking in both this rulemaking and the commercial and industrial pumps rulemaking, DOE has determined to maintain its approach to address energy conservation standards for circulator pumps only in this rulemaking, separately from SVILs. Accordingly, DOE is not including SVILs within the scope of the energy conservation standards considered in this final rule.
D. Test Procedure
EPCA sets forth generally applicable criteria and procedures for DOE's adoption and amendment of test procedures. (42 U.S.C. 6314(a)) Manufacturers of covered equipment must use these test procedures to certify to DOE that their equipment complies with energy conservation standards and to quantify the efficiency of their equipment. DOE's current energy conservation standards for circulator pumps are expressed in terms of CEI. CEI represents the weighted average electric input power to the driver over a specified load profile, normalized with respect to a circulator pump serving the same hydraulic load that has a specified minimum performance level.[23]
(
See10 CFR 431.464(c).)
1. Control Mode
Circulator pumps may be equipped with speed controls that govern their response to settings or signals. DOE's test procedure contains definitions and test methods applicable to pressure controls, temperature controls, manual speed controls, external input signal controls, and no controls (
i.e.,
full speed operation only).[24]
Section B.1 of appendix D to subpart Y of 10 CFR part 431 specifies that circulator pumps without one of the identified control varieties (
i.e.,
pressure control, temperature control, manual speed control or external input signal control) are tested at full speed.
Some circulator pumps operate in only a single control mode, whereas others are capable of operating in any of several control modes. As discussed in the September 2022 TP Final Rule, circulator pump energy consumption typically varies by control mode, for circulator pumps equipped with more than one control mode. 87 FR 57264, 57273-57275. In the September 2022 TP Final Rule, DOE summarized and responded to a variety of stakeholder comments which discussed advantages and disadvantages of various potential requirements regarding the control variety activated during testing.
Id.
Ultimately, DOE determined not to restrict active control variety during testing.
Id.
To not limit application of a particular control mode, the test procedure for circulator pumps states “if a given circulator pump model is distributed in commerce with multiple control varieties available, the manufacturer may select a control variety (or varieties) among those available with which to test the circulator pump, including the test method for circulator pumps at full speed or circulator pumps without external input signal, manual, pressure, or temperature controls).” Section 2.2 of appendix D to subpart Y of 10 CFR part 431.
In the September 2022 TP Final Rule, DOE stated that although the test procedure does not restrict active control variety during testing, whether compliance with any standards would be based on a specific control mode (or no controls) would be addressed in an energy conservation standard rulemaking. 87 FR 57264, 57275. It further explains that a future energy conservation standard rulemaking could determine whether certain information related to the control mode used for testing would be required as part of certification.
Id.
In the December 2022 NOPR, DOE proposed to require compliance with
( printed page 44479)
energy conservation standards for circulator pumps while operated in the least consumptive control mode in which it is capable of operating. 87 FR 74850, 74862. Because many circulator pumps equipped with control modes designed to reduce energy consumption relate to full-speed operating also include the ability to operate at constant speed, to require testing using a circulator pump's most consumptive control mode may reduce the ability of rated CEI to characterize the degree of energy savings possible across circulator pump models. 87 FR 74850, 74862-74863. Circulator pump basic models equipped with a variety of control modes would receive the same rating as an otherwise identical basic model which could operate only at full speed, even though in practice the former may consume considerably less energy in many applications. 87 FR 74850, 74863.
In the December 2022 NOPR, DOE requested comment regarding circulator pump control variety for the purposes of demonstrating compliance with energy conservation standards. 87 FR 74850, 74863.
HI, ASAP
et al.,
and the CA IOUs all supported using the least consumptive operating mode as the CEI rating metric. (HI, No. 135 at p. 4; ASAP
et al.,
No. 131 at p. 2; CA IOUs, No. 133 at p. 2) The CA IOUs also noted that variable-speed control demonstrated potential savings relative to maximum-speed-only circulator pumps. (CA IOUs, No. 133 at p. 2) Therefore, the CA IOUs recommended DOE support voluntary reporting of performance data of variable-speed control as well as account for variable-speed control savings in future circulator pump test methods and conservation standards.
Id.
Further, ASAP
et al.
encouraged DOE to require additional reporting of ratings with the most consumptive method. (ASAP
et al.,
No. 131 at p. 2) ASAP
et al.
commented that specifying CEI ratings based only on the least consumptive model may not accurately reflect the energy usage of fixed-speed-mode circulator pumps.
Id.
DOE agrees that performance data obtained from a circulator pump operated in one mode may not reflect performance when operated in a different mode, including the fixed-speed mode cited by ASAP. While DOE is not adopting certification requirements, mandatory or voluntary, in this final rule, as stated in section III.A.3 of this document, it may do so as part of a separate rulemaking.
NEEA/NWPCC recommended DOE require circulator pumps to be tested and to demonstrate compliance with energy conservation standards in the most consumptive control mode because: (1) they “are concerned that manufacturers will meet the standard through an optional speed control setting rather than hydraulic redesign or addition of an efficient motor, meaning that the circulator will often function in a control setting that delivers performance below what is required by the standard. In some cases, such as three speed circulator pumps, the speed controls are intended to serve different sizes of systems, and the least-consumptive mode will not be representative of larger systems.” (2) “Least-consumptive testing will increase testing burden, as manufacturers will have to test multiple settings to first determine which setting is the least-consumptive. Conversely, DOE has asserted (and we agree) that the most-consumptive control is the full speed setting, meaning there is no additional testing required to determine the most-consumptive setting.” (3) “Non-guaranteed performance will discourage utility programs, as they will not be able to determine the current practice baseline because many circulators will operate below the actual standard.” (4) “The market will be confused about the performance of circulators in the field, because least-consumptive control does not equate to the most representative control. While we agree with DOE's assertion in this NOPR that testing in the least-consumptive control mode will better communicate the range of controls available to the market and their relative energy consumption, consumers may be confused as to why the expected energy performance fails to materialize.” (5) “Manufacturers already support testing in most-consumptive control setting as they test and submit ratings to the Hydraulic Institute (HI) circulator Energy Rating (ER) database.” (6) ” Least-consumptive testing impedes future rulemakings that could strengthen the standard. Least-consumptive testing will allow for a range of performance, with some circulators operating in modes that perform worse than the DOE standard. Tightening that standard in the future may simply widen the gap of tested versus actual performance. Conversely, most-consumptive testing would establish a clear minimum performance standard that DOE can build upon in future rulemakings.” (NEEA/NWPCC, No. 134 at pp. 2-3) NEEA/NWPCC also explained that the most-consumptive testing ensures that any tightening of the standard will remove equipment with low performance, but least-consumptive testing may not if their lowest consumptive method is in standards and the rest are not.
Id.
NEEA/NWPCC stated that the revised standard would only achieve the energy conservation goals if using most consumptive testing, and NEEA/NWPCC recommend that DOE revisit this issue in future circulator pump rulemakings.
Id.
Regarding NEEA/NWPCC's first point that manufacturers may comply with a standard based on the least consumptive operating mode by incorporating controls, DOE recognizes the possibility but not that it would necessarily be detrimental. Speed reduction is a legitimate means of reducing circulator pump energy consumption, far outstripping the savings potential of other technology options for certain applications. Even in nominally fixed-speed applications, which call for no flow variability, speed adjustment can be used to match the circulator pump output to load imposed by the actual hydraulic circuit at hand. The potential for manufacturers of noncompliant circulator pumps adding manual speed controls as a way to reduce CEI to reach compliance is not expected to be significant. Analysis of submitted manufacturer model data indicates that adding manual speed controls reduces a circulator pump's CER metric by an average of 6.5%. DOE's analysis of the market shows that less than 2% of circulator pumps that would not be compliant with the standard levels adopted in this final rule are single-speed models that could attain compliance by introducing manual speed controls. Further, because there would likely be significant conversion cost associated with modifying circulator pump models, manufacturers may be hesitant to develop them unless confident of strong demand that would enable recovery of those costs. Further, the products themselves would cost more to manufacture due to multispeed motors' costing more to purchase or construct than single-speed motors, which would reduce their appeal to first-cost-motivated consumers. Finally, while NEEA/NWPCC identifies a potential case in which manual speed controls reduce the energy savings achievable by an energy conservation standard, so too can manual speed controls be used to save energy in applications that do not require the circulator pumps' full output. In view of the relatively small fraction of the market that could feasibly function as NEEA/NWPCC describes, the additional equipment costs and conversion costs associated with multi-speed products relative to single-speed, and the potential for manual-speed control to
( printed page 44480)
help as well as hinder the objective of energy savings, the potential of manual speed control to undermine the anticipated energy savings of this final rule appears minimal.
Regarding NEEA/NWPCC's second point that least consumptive testing may increase testing burden, industry standard HI 41.5-2022, section 41.5.3.4 “Determination of CER” directs that circulator pumps already be rated at both the most and least consumptive control methods. Accordingly, DOE finds incremental testing burden to be minimized to the extent that computing both methods is already widespread industry practice.
Regarding NEEA/NWPCC's third point that non-guaranteed performance may discourage utility programs, DOE does not have information to evaluate the size of potential energy savings arising from utility programs concerning circulator pumps relative to the magnitude of the energy savings estimated to be associated with the energy conservation standards adopted in this final rule. Further, a least-consumptive-based compliance requirement does not necessarily obscure differences in full-load performance, as more-efficient motors will tend to perform better at both full and reduced speeds.
Regarding NEEA/NWPCC's fourth point that the market may be confused about the performance of circulators in the field, DOE observes that the “field” would include an array of applications, some of which would realize greater or lesser savings than a single CEI value in isolation could convey. One factor which may tend to make the former less likely than the latter is cost—because variable-speed circulator pumps tend to cost more, purchasers may be more likely to have developed enough understanding of the product to justify paying a premium.
It is possible that a circulator pump purchaser may wind up with less savings than anticipated if purchasing a variable-speed circulator pump for an application that truly requires single-speed operation. However, even in an application with truly constant demand, variable-speed circulator pumps may still offer energy savings relative to a single-speed circulator pump. Such savings could arise from the fact that, while circulator pump applications exist over a continuous spectrum of hydraulic power requirements, circulator pump models are offered only at certain, discrete hydraulic power levels. Thus, even purchasers who accurately estimate their demand would likely end up with some amount of unnecessary hydraulic power. A variable-speed circulator pump may save energy by operating closer to the necessary hydraulic power level, even if that level does not vary over time.
DOE cannot be certain of how electric utilities might design future incentive programs for circulator pumps but does not see that they would necessarily dismiss the potential of variable-speed circulator pumps to save energy, even while purchase of a variable-speed circulator pump does not guarantee that every individual installation would realize savings relative to a hypothetical alternative of a single-speed circulator pump with less full-speed power consumption. One potential mitigating factor, in the case of a utility unwilling to consider an incentive program that could not guarantee savings at every circulator pump installation using the CEI metric alone, is that full-speed pump performance data may be published for those pumps and subsequently used as basis for incentive qualification provided that such data was generated consistently with the test procedure for circulator pumps. (
See10 CFR 431.464(c).)
Regarding NEEA/NWPCC's fifth point that manufacturers already support testing in the most-consumptive setting, as evidenced by their testing and submission of corresponding ratings to HI's circulator Energy Rating database, those manufacturers also submit ratings corresponding to the least consumptive setting. As stated, this is a voluntary directive of industry standard HI 41.5-2022, § 41.5.3.4 “Determination of CER”.
Regarding NEEA/NWPCC's sixth point that least consumptive testing may impede future rulemakings that could otherwise have strengthened standards, DOE observes that more-stringent standards in a hypothetical future rulemaking would not be prohibited, or even materially impeded, by this final rule's adoption of requirements to base compliance on the least-consumptive operating mode. Improved motors and hydraulic assemblies, which are the sources of improved performance in the fixed-speed evaluation scenario supported by NEEA/NWPCC's arguments, would still carry potential to improve under any choice of required operating mode for compliance.
Several commenters argue that testing in the least consumptive control mode may provide a less representative CEI value in certain situations, but do not openly consider that the same must be true of a requirement to test in the most consumptive control mode. Testing and certifying performance using the most consumptive mode would also generate results that are not accurate in all individual situations. Because there are multiple control modes on some circulator pumps, testing at one load profile could not represent every potential circulator pump application. For the purpose of estimating energy savings that would be realized by consumers at various potential standard levels, DOE does not assume a pump would consume energy in direct proportion to its CEI value, but instead relies on energy use assumption as discussed in section IV.E of this document.
The energy conservation standards evaluated in this final rule are based on wire-to-water efficiency, which is influenced by both hydraulic efficiency and motor efficiency. Because circulator pump efficiency is measured on a wire-to-water basis, it is difficult to entirely disentangle performance differences due to motor efficiency from those due to hydraulic efficiency. In redesigning a pump model to meet the standard established in this final rule, manufacturers would likely consider both hydraulic efficiency and motor efficiency. Speed reduction is a legitimate means of reducing energy consumption and likely offers greater potential energy savings than hydraulic optimization would alone due to pump affinity laws, which are described in section IV.A.2.c of this document. If compliance with energy conservation standards were based on the most consumptive control mode, circulator pumps with energy-saving controls would be unlikely to receive benefit to their CEI score, as essentially all circulator pumps would be evaluated at full speed.
In view of the foregoing discussion and the support of HI, ASAP
et al.,
and the CA IOUs, DOE is adopting the requirement that circulator pumps comply with energy conservation standards while operated in their least consumptive mode.
As stated in section III.A.3 of this document, certification requirements, including those related to active control variety, are not being proposed in this final rule, but may be addressed in a potential future rulemaking.
E. Technological Feasibility
1. General
In each energy conservation standards rulemaking, DOE conducts a screening analysis based on information gathered on all current technology options and prototype designs that could improve the efficiency of the equipment that is the subject of the rulemaking. As the first step in such an analysis, DOE develops a list of technology options for
( printed page 44481)
consideration in consultation with manufacturers, design engineers, and other interested parties. DOE then determines which of those means for improving efficiency are technologically feasible. DOE considers technologies incorporated in commercially available equipment or in working prototypes to be technologically feasible. 10 CFR 431.4; sections 6(b)(3)(i) and 7(b)(1) of appendix A to 10 CFR part 430 subpart C (“Process Rule”).
After DOE has determined that particular technology options are technologically feasible, it further evaluates each technology option in light of the following additional screening criteria: (1) practicability to manufacture, install, and service; (2) adverse impacts on equipment utility or availability; (3) adverse impacts on health or safety and (4) unique-pathway proprietary technologies. 10 CFR 431.4; sections 7(b)(2)-(5). Section IV.B of this document discusses the results of the screening analysis for circulator pumps, particularly the designs DOE considered, those it screened out, and those that are the basis for the standards considered in this rulemaking. For further details on the screening analysis for this rulemaking, see chapter 4 of the final rule technical support document (“TSD”).
2. Maximum Technologically Feasible Levels
When DOE proposes to adopt a new standard for a type or class of covered equipment, it must determine the maximum improvement in energy efficiency or maximum reduction in energy use that is technologically feasible for such equipment. (42 U.S.C. 6316(a); 42 U.S.C. 6295(p)(1)) Accordingly, in the engineering analysis, DOE determined the maximum technologically feasible (“max-tech”) improvements in energy efficiency for circulator pumps, using the design parameters for the most efficient equipment available on the market or in working prototypes. The max-tech levels that DOE determined for this rulemaking are described in section IV.C.2 of this final rule and in chapter 5 of the final rule TSD.
F. Energy Savings
1. Determination of Savings
For each TSL, DOE projected energy savings from application of the TSL to circulator pumps purchased in the 30-year period that begins in the year of compliance with the new standards (2028-2057).[25]
The savings are measured over the entire lifetime of equipment purchased in the 30-year analysis period. DOE quantified the energy savings attributable to each TSL as the difference in energy consumption between each standards case and the no-new-standards case. The no-new-standards case represents a projection of energy consumption that reflects how the market for equipment would likely evolve in the absence of new energy conservation standards.
DOE used its national impact analysis (“NIA”) spreadsheet models to estimate national energy savings (“NES”) from potential new standards for circulator pumps. The NIA spreadsheet model (described in section IV.H of this document) calculates energy savings in terms of site energy, which is the energy directly consumed by equipment at the locations where it is used. For electricity, DOE reports national energy savings in terms of primary energy savings, which is the savings in the energy that is used to generate and transmit the site electricity. DOE also calculates NES in terms of full-fuel-cycle (“FFC”) energy savings. The FFC metric includes the energy consumed in extracting, processing, and transporting primary fuels (
i.e.,
coal, natural gas, petroleum fuels), and thus presents a more complete picture of the impacts of energy conservation standards.[26]
DOE's approach is based on the calculation of an FFC multiplier for each of the energy types used by covered equipment. For more information on FFC energy savings, see section IV.H.2 of this document.
2. Significance of Savings
To adopt any new standards for covered equipment, DOE must determine that such action would result in significant energy savings. (42 U.S.C. 6295(o)(3)(B))
The significance of energy savings offered by a new energy conservation standard cannot be determined without knowledge of the specific circumstances surrounding a given rulemaking.[27]
For example, some covered equipment has most of its energy consumption occur during periods of peak energy demand. The impact of this equipment on the energy infrastructure can be more pronounced than equipment with relatively constant demand. Accordingly, DOE evaluates the significance of energy savings on a case-by-case basis, considering the significance of cumulative FFC national energy savings, the cumulative FFC emissions reductions, and the need to confront the global climate crisis, among other factors.
As stated, the standard levels adopted in this final rule are projected to result in national energy savings of 0.55 quad, the equivalent of the primary annual energy use of 5.9 million homes. Based on the amount of FFC savings, the corresponding reduction in emissions, and the need to confront the global climate crisis, DOE has determined the energy savings from the standard levels adopted in this final rule are “significant” within the meaning of 42 U.S.C. 6316(a); 42 U.S.C. 6295(o)(3)(B). Even without considering the need to confront the global climate crisis, DOE has determined the energy savings from the standard levels adopted in this rule are “significant” under EPCA.
G. Economic Justification
1. Specific Criteria
As noted previously, EPCA provides seven factors to be evaluated in determining whether a potential energy conservation standard is economically justified. (42 U.S.C. 6316(a); 42 U.S.C. 6295(o)(2)(B)(i)(I)-(VII)) The following sections discuss how DOE has addressed each of those seven factors in this rulemaking.
a. Economic Impact on Manufacturers and Consumers
In determining the impacts of potential new standards on manufacturers, DOE conducts an MIA, as discussed in section IV.J of this document. DOE first uses an annual cash-flow approach to determine the quantitative impacts. This step includes both a short-term assessment—based on the cost and capital requirements during the period between when a regulation is issued and when entities must comply with the regulation—and a long-term assessment over a 30-year period. The industry-wide impacts analyzed include (1) INPV, which values the industry on the basis of expected future cash flows; (2) cash flows by year; (3) changes in revenue and income; and (4) other measures of impact, as appropriate. Second, DOE analyzes and reports the impacts on different types of manufacturers, including impacts on small manufacturers. Third, DOE considers the impact of standards on
( printed page 44482)
domestic manufacturer employment and manufacturing capacity, as well as the potential for standards to result in plant closures and loss of capital investment. Finally, DOE considers cumulative impacts of various DOE regulations and other regulatory requirements on manufacturers.
For individual consumers, measures of economic impact include the changes in LCC and payback period (“PBP”) associated with new standards. These measures are discussed further in the following section. For consumers in the aggregate, DOE also calculates the national net present value of the consumer costs and benefits expected to result from particular standards. DOE also evaluates the impacts of potential standards on identifiable subgroups of consumers that may be affected disproportionately by a standard.
b. Savings in Operating Costs Compared to Increase in Price (LCC and PBP)
EPCA requires DOE to consider the savings in operating costs throughout the estimated average life of the covered equipment in the type (or class) compared to any increase in the price of, or in the initial charges for, or maintenance expenses of, the covered equipment that are likely to result from a standard. (42 U.S.C. 6316(a); 42 U.S.C. 6295(o)(2)(B)(i)(II)) DOE conducts this comparison in its LCC and PBP analysis.
The LCC is the sum of the purchase price of equipment (including its installation) and the operating cost (including energy, maintenance, and repair expenditures) discounted over the lifetime of the equipment. The LCC analysis requires a variety of inputs, such as equipment prices, equipment energy consumption, energy prices, maintenance and repair costs, equipment lifetime, and discount rates appropriate for consumers. To account for uncertainty and variability in specific inputs, such as equipment lifetime and discount rate, DOE uses a distribution of values, with probabilities attached to each value.
The PBP is the estimated amount of time (in years) it takes consumers to recover the increased purchase cost (including installation) of more-efficient equipment through lower operating costs. DOE calculates the PBP by dividing the change in purchase cost due to a more-stringent standard by the change in annual operating cost for the year that standards are assumed to take effect.
For its LCC and PBP analysis, DOE assumes that consumers will purchase the covered equipment in the first year of compliance with new standards. The LCC savings for the considered efficiency levels are calculated relative to the case that reflects projected market trends in the absence of new standards. DOE's LCC and PBP analysis is discussed in further detail in section IV.F of this document.
c. Energy Savings
Although significant conservation of energy is a separate statutory requirement for adopting an energy conservation standard, EPCA requires DOE, in determining the economic justification of a standard, to consider the total projected energy savings that are expected to result directly from the standard. (42 U.S.C. 6316(a); 42 U.S.C. 6295(o)(2)(B)(i)(III)) As discussed in section IV.H of this document, DOE uses the NIA spreadsheet models to project national energy savings.
d. Lessening of Utility or Performance of Equipment
In establishing equipment classes, and in evaluating design options and the impact of potential standard levels, DOE evaluates potential standards that would not lessen the utility or performance of the considered equipment. (42 U.S.C. 6295(o)(2)(B)(i)(IV)) Based on data available to DOE, the standards adopted in this document would not reduce the utility or performance of the equipment under consideration in this rulemaking.
e. Impact of Any Lessening of Competition
EPCA directs DOE to consider the impact of any lessening of competition, as determined in writing by the Attorney General, that is likely to result from a standard. (42 U.S.C. 6316(a); 42 U.S.C. 6295(o)(2)(B)(i)(V)) It also directs the Attorney General to determine the impact, if any, of any lessening of competition likely to result from a standard and to transmit such determination to the Secretary within 60 days of the publication of a proposed rule, together with an analysis of the nature and extent of the impact. (42 U.S.C. 6316(a); 42 U.S.C. 6295(o)(2)(B)(ii)) To assist the Department of Justice (“DOJ”) in making such a determination, DOE transmitted copies of its proposed rule and the NOPR TSD to the Attorney General for review, with a request that the DOJ provide its determination on this issue. In its assessment letter responding to DOE, DOJ concluded that the proposed energy conservation standards for circulator pumps are unlikely to have a significant adverse impact on competition. DOE is publishing the Attorney General's assessment at the end of this final rule.
f. Need for National Energy Conservation
DOE also considers the need for national energy and water conservation in determining whether a new standard is economically justified. (42 U.S.C. 6316(a); 42 U.S.C. 6295(o)(2)(B)(i)(VI)) The energy savings from the adopted standards are likely to provide improvements to the security and reliability of the Nation's energy system. Reductions in the demand for electricity also may result in reduced costs for maintaining the reliability of the Nation's electricity system. DOE conducts a utility impact analysis to estimate how standards may affect the Nation's needed power generation capacity, as discussed in section IV.M of this document.
DOE has determined that environmental and public health benefits associated with the more efficient use of energy are important to take into account when considering the need for national energy conservation. The adopted standards are likely to result in environmental benefits in the form of reduced emissions of air pollutants and greenhouse gases (“GHGs”) associated with energy production and use. DOE conducts an emissions analysis to estimate how potential standards may affect these emissions, as discussed in section IV.K of this document; the estimated emissions impacts are reported in section V.B.6 of this document. DOE also estimates the economic value of emissions reductions resulting from the considered TSLs, as discussed in section IV.L of this document.
g. Other Factors
In determining whether an energy conservation standard is economically justified, DOE may consider any other factors that the Secretary deems to be relevant. (42 U.S.C. 6316(a); 42 U.S.C. 6295(o)(2)(B)(i)(VII)) To the extent DOE identifies any relevant information regarding economic justification that does not fit into the other categories described previously, DOE could consider such information under “other factors.”
2. Rebuttable Presumption
EPCA creates a rebuttable presumption that an energy conservation standard is economically justified if the additional cost to the equipment that meets the standard is less than three times the value of the first year's energy savings resulting from the standard, as calculated under the applicable DOE test procedure. (42 U.S.C. 6316(a); 42 U.S.C.
( printed page 44483)
6295(o)(2)(B)(iii)) DOE's LCC and PBP analyses generate values used to calculate the effect potential new energy conservation standards would have on the payback period for consumers. These analyses include, but are not limited to, the 3-year payback period contemplated under the rebuttable-presumption test. In addition, DOE routinely conducts an economic analysis that considers the full range of impacts to consumers, manufacturers, the Nation, and the environment, as required under (42 U.S.C. 6316(a); 42 U.S.C. 6295(o)(2)(B)(i)) The results of this analysis serve as the basis for DOE's evaluation of the economic justification for a potential standard level (thereby supporting or rebutting the results of any preliminary determination of economic justification). The rebuttable presumption payback calculation is discussed in section IV.F of this final rule.
H. Compliance Date
EPCA does not prescribe a compliance lead time for energy conservation standards for pumps,
i.e.,
the number of years between the date of publication of a final energy conservation standard (“effective date”) and the date on which manufacturers must comply with the new standard. The November 2016 CPWG Recommendations specified a compliance date of four years following publication of the final rule.
In response to the May 2021 RFI, DOE received two comments regarding the compliance date. Grundfos recommended a 2-year compliance date and NEEA recommended a 3-year compliance date. (Docket No. EERE-2016-BT-STD-0004, Grundfos, No. 113, at p. 1; Docket No. EERE-2016-BT-STD-0004, NEEA, No. 115, at p. 3) Neither Grundfos nor NEEA provided additional comments regarding the compliance date in response to the December 2022 NOPR.
In the December 2022 NOPR, DOE proposed a 2-year compliance date for energy conservation standards due to the industry being more mature than when the CPWG made its recommendation. 87 FR 74850, 74865. DOE requested comment on its proposal.
Id.
DOE also noted that, due to projected market trends, a change in the rulemaking's compliance date may lead to a small but non-negligible change in consumer and manufacturer benefits or impacts.
Id.
In response to the December 2022 NOPR, HI and Xylem recommended DOE adopt a 4-year compliance lead time for manufacturers to meet the proposed standard. (HI, No. 135 at p. 1; Xylem, No. 136 at p. 1) HI and Xylem stated that the proposed 2-year compliance lead time conflicts with the 4-year time negotiated by the CPWG and that the existing equipment on the market meeting EL 2 does not cover the breadth of utility required by the market.
Id.
Xylem explained that implementing a 2-year compliance timeline for pumps would delay, rather than accelerate, manufacturer compliance. (Xylem, No. 136 at p. 1) Xylem recommended that DOE make recourse to the European Union's method of implementing regulations to decrease circulator pump energy consumption by providing manufacturers the necessary time to comply with the regulations. (Xylem, No. 136 at p. 2)
HI and Xylem commented that, as stated in the December 2022 NOPR, 66 percent of circulator pumps on the market need to be redesigned to meet the proposed standard, and manufacturers will benefit from a 4-year compliance lead time to engineer, develop, and test equipment to meet the standard. (HI, No. 135 at p. 2; Xylem, No. 136 at p. 2) HI and Xylem commented that, due to supply chain issues, it is not uncommon for an 18-month lead time for manufacturers to obtain materials to leave just 6 months for all engineering, development, and third-party agency testing; meaning this timeline is not feasible for manufacturers. (HI, No. 135 at pp. 2-3; Xylem, No. 136 at p. 3). HI and Xylem also stated that much of the development, sourcing, testing, and equipment line implementation is linear, with each step dependent on prior steps being completed.
Id.
HI and Xylem commented that much equipment will require an EL 3 effort to be compliant and meet market competitiveness requirements, which will extend the timeline of equipment development and testing well beyond 2 years.
Id.
In addition, HI added that manufacturers are required to obtain safety and drinking water approvals via third party agency testing for all new/redesigned equipment. (HI, No. 135 at p. 3)
HI and Xylem further commented that manufacturers, including Xylem itself, anticipate struggling to meet capacity, for instance regarding lead times for electronically commutated motors (“ECMs”), production test equipment, and other assets that will delay the compliance lead time. (HI, No. 135 at p. 3; Xylem, No. 136 at p. 3) HI noted that ECM component suppliers have been unable to meet demand and will continue to fall behind as the circulator market transitions to ECMs. (HI, No. 135 at p. 4) Xylem commented that manufacturers will see similar lead time issues when developing new production lines as seen with materials in the supply chain. (Xylem, No. 136 at pp. 3-4) Xylem stated it will take 12-18 months to source and implement production lines, which will delay the compliance lead time.
Id.
Xylem commented that manufacturers' inability to meet the aggressive compliance timeline will result in a gap of pumps available in the market and potentially lead to overinflated pricing, substitution of older and less efficient equipment, and costly conversions to alternative systems.
Id.
In the NOPR public meeting, Taco commented that the proposed implementation period is extremely short and requires a lot of changes. (Taco, Inc., Public Meeting Transcript, No. 129 at pp. 65-66) Taco stated it is nearly impossible to get anything electronic in a two-year period to go through this testing.
Id.
Taco further commented that everything would need to be redesigned with no way to get the parts in house to make that happen.
Id.
Taco stated that, at the time of the public meeting, it was receiving two-year quotes to get in new electronic products.
Id.
HI and Xylem commented that a 2-year lead time will pose an additional financial burden on manufacturers due to conversion-cost impacts with a quick turnaround. (HI, No. 135 at p. 4; Xylem, No. 136 at p. 4) Xylem commented that even large companies may not be able to justify achieving the extremely short investment-to-launch period proposed by DOE. (Xylem, No. 136 at p. 4) Xylem believes manufacturers will redesign to be competitive, which likely means redesigning past the minimal compliance CEI of 1.0, which will include additional costs and time needed.
Id.
Xylem agreed that basic model counts would decrease with a transition to ECMs due to the greater range of applications served.
Id.
However, Xylem recommended DOE consider the additional incremental cost to transition these models to EL 3 levels.
Id.
Xylem commented that capital investment is likely to increase when going from EL 2 to EL 4 and that DOE has underestimated the capital investment and time commitment needed to reach EL 3 and EL 4.
Id.
HI and Xylem recommended that DOE follow up with manufacturers to qualify the lead times to acquire and commission manufacturing assets. (HI, No. 135 at p. 4; Xylem, No. 136 at pp. 3-4).
Further, HI and Xylem disagreed with DOE's assertion that manufacturers
( printed page 44484)
affected by this rulemaking are not affected by other rulemakings and recommended that DOE consider the cumulative burden of rulemakings currently in progress, such as those regarding commercial and industrial pumps and electric motors. (HI, No. 135 at p. 4; Xylem, No. 136 at p. 5) HI also recommended DOE consider that the ECM technology used in CP2- and CP3-style circulator pumps is under consideration in the electric motor rulemakings. (HI, No. 135 at p. 6) HI commented that the timing and outcome of the electric motor rulemakings would impact circulator manufacturers' ability to redesign CP2 and CP3 equipment within the 2-year compliance lead time.
Id.
Wyer commented that the manufacturing industry has seen an increase in the number of ECM circulator pumps in recent years and this increase has proven problematic. (Tom Wyer, No. 128 at pp. 1-2) Wyer commented that the pump manufacturers listed by the CPWG do not currently have the ability to produce ECM pumps in sufficient quantities to satisfy a growing market.
Id.
Wyer commented that several manufacturers are substituting permanent split capacitor “”PSC”) motor pumps for ECMs to make up for the insufficient availability of ECM pumps, which is due to: (1) international supply chain shortages; (2) plant capacity in the facilities that manufacturer ECM circulators, all of which are located in Europe; and (3) the rapid adoption of hydronic heat pumps in Europe caused by the war in Ukraine, natural gas supply constraints, and rising prices.
Id.
Wyer commented that U.S. manufacturing infrastructure cannot support the level of production needed to satisfy the hydronics market with ECM circulators. (Tom Wyer, No. 128 at p. 2) Wyer stated that ECM pumps with the performance curves necessary for the geothermal HVAC industry are only manufactured in Europe, while the majority of PSC pumps currently used in the geothermal HVAC industry are made in the United States.
Id.
Wyer commented that U.S.-based manufacturers are more likely to shut down domestic facilities and continue importing ECM circulators rather than invest to upgrade their plants to produce ECM pumps.
Id.
Wyer recommended that DOE consider the impact of the proposed rulemaking on domestic manufacturer employment and the potential of plant closures.
Id.
Wyer commented that 3 years is not enough time for pump manufacturers to upgrade their capacity to supply the entire hydronics market in the U.S. and recommended that DOE delay the implementation of the standard until the domestic supply of ECM pumps is sufficient to meet current and future demand.
Id.
Wyer recommended that if DOE continues with the proposed rulemaking, the compliance time should be increased to a minimum of 6 years.
Id.
In response, DOE notes that, as stated by manufacturers, the redesign process for circulator pumps contains multiple, sequential steps dependent on completion of the preceding step. Third-party water testing, which is necessary after the redesign process but before the circulator pumps go to market, adds further time constraints to pump manufacturers. These reasons make a 2-year compliance date hard for manufacturers to reach EL 2 levels, but some manufacturers will use the redesigning process as an opportunity for further energy savings. HI and Xylem also noted that they feel the cumulative regulatory burden from other rulemakings, including commercial industrial pumps and small electric motors, put further strain on manufacturers who expect a 2-year compliance date for circulator pumps to add significant financial burden. Cumulative regulatory burden from other rulemakings is discussed in section V.B.2.e of this document.
As discussed previously, in the December 2022 NOPR DOE did not follow the CPWG's recommendation of a 4-year compliance date, instead proposing a 2-year compliance date due to the market maturing since the 2016 CPWG meetings. However, as discussed by stakeholders, the natural growth of ECMs in the market has been slow, with only around 1 percent of the market switching to ECMs annually, leaving the majority of the market in need of redesign to reach EL 2. As such, DOE agrees that a longer compliance period than proposed in the DOE 2022 NOPR is warranted. However, although the natural market share growth of ECMs has been slow, the market is closer to EL 2 on average now than when the CPWG initially recommended a 4-year compliance date, which has led DOE to conclude that no additional time past the 4-year recommendation, such as a 6-year compliance date, is necessary. Accordingly, in this final rule, DOE is adopting a 4-year compliance date for energy conservation standards.
IV. Methodology and Discussion of Related Comments
This section addresses the analyses DOE has performed for this rulemaking with regard to circulator pumps. Separate subsections address each component of DOE's analyses.
DOE used several analytical tools to estimate the impact of the standards considered in this document. The first tool is a spreadsheet that calculates the LCC savings and PBP of potential new energy conservation standards. The national impacts analysis uses a second spreadsheet set that provides shipments projections and calculates national energy savings and net present value of total consumer costs and savings expected to result from potential energy conservation standards. DOE uses the third spreadsheet tool, the Government Regulatory Impact Model (“GRIM”), to assess manufacturer impacts of potential standards. These three spreadsheet tools are available on the DOE website for this rulemaking:
www.regulations.gov/docket/EERE-2016-BT-STD-0004. Additionally, DOE used output from the latest version of the Energy Information Administration's (“EIA's”)
Annual Energy Outlook
(“
AEO”) for the emissions and utility impact analyses.
A. Market and Technology Assessment
DOE develops information in the market and technology assessment that provides an overall picture of the market for the equipment concerned, including the purpose of the equipment, the industry structure, manufacturers, market characteristics, and technologies used in the equipment. This activity includes both quantitative and qualitative assessments, based primarily on publicly available information. The subjects addressed in the market and technology assessment for this rulemaking include (1) a determination of the scope of the rulemaking and equipment classes, (2) manufacturers and industry structure, (3) existing efficiency programs, (4) shipments information, (5) market and industry trends, and (6) technologies or design options that could improve the energy efficiency of circulator pumps. The key findings of DOE's market assessment are summarized in the following sections. See chapter 3 of the final rule TSD for further discussion of the market and technology assessment.
In response to the December 2022 NOPR, HI requested that DOE provide its market assessment of basic model information as a supplemental publication, including the estimated number of models left for conversion and the percentage they make up of the market. (HI, No. 126 at p. 1) HI requested that DOE allow manufacturers time to review the market assessment data and provide comments.
Id.
DOE responded to this comment by publishing a supplementary document
( printed page 44485)
with the estimated number of models at or above EL 2 and the number of models below EL 2 on January 31, 2023. (Docket No. EERE-2016-BT-STD-0004-0127) This information is reflected in Table IV.14 in section IV.J.2.c of this document.
1. Scope of Coverage and Equipment Classes
a. Scope
As stated in the December 2022 NOPR, DOE proposed to align the scope of these proposed energy conservation standards with that of the circulator pumps test procedure. 87 FR 74850, 74865; 87 FR 57264. In that document, DOE finalized the scope of the circulator pumps test procedure such that it applies to circulator pumps that are clean water pumps, including circulators-less-volute and on-demand circulator pumps, and excluding header pumps and submersible pumps. 87 FR 74850, 74865-74866. That scope is consistent with the recommendations of the CPWG. (Docket No. EERE-2016-BT-STD-0004, No. 58)
In the December 2022 NOPR, DOE proposed to apply energy conservation standards to all circulator pumps included in the CWPG recommendations, which excluded submersible pumps and header pumps. 87 FR 74850, 74866. (Docket No. EERE-2016-BT-STD-0004, No. 58) The September 2022 TP Final Rule also excluded submersible pumps and header pumps. 87 FR 57264, 57272. Any future evaluation of energy conservation standards would require a corresponding test procedure.
In the December 2022 NOPR, DOE requested comment regarding the proposed scope of energy conservation standards for circulator pumps. 87 FR 74850, 74866.
HI agreed with DOE's proposal to apply standards to all circulator pumps included in the CWPG recommendations, which excluded submersible pumps and header pumps. (HI, No. 135 at p. 4)
Equipment Diagrams
In general, DOE establishes written definitions to designate which equipment falls within the scope of a test procedure or energy conservation standard. In the specific case of circulator pumps, certain scope-related definitions were adopted by the September 2022 TP Final Rule and codified at 10 CFR 431.462.
DOE adopted the definitions that distinguish various circulator pumps nearly unchanged from those recommended by the CPWG at meeting 2. (Docket No. EERE-2016-BT-STD-0004-0021, p. 22) 10 CFR 431.462. CPWG membership included five manufacturers of circulator pumps; a trade association representing the U.S. hydraulic industry; a trade association representing plumbing, heating, and cooling contractors; and other manufacturers of equipment that either use or are used by circulator pumps as components.
In the December 2022 NOPR, DOE stated that given the strong representation of entities with deep experience in circulator pump design and for whom definitional ambiguity could be burdensome, it is reasonable to expect the CPWG-proposed definitions were viewed as sufficiently clear at the time of their recommendation. 87 FR 74850, 74866.
Additionally, in the December 2022 NOPR, DOE explained that the development of diagrams to support the definitions could create confusion if interpretations of such diagrams differ from those of the corresponding written definitions. For this reason, and in the absence of any evidence of ambiguity in the definitions, DOE did not propose to establish equipment diagrams in the December 2022 NOPR, but requested comments on the definitions and whether any clarification was needed. 87 FR 74850, 74866.
HI agreed that the proposed definitions are sufficiently clear and consistent with the diagrams provided in ANSI/HI 14.1-14.2. (HI, No. 135 at p. 4)
Accordingly, DOE is not establishing equipment diagrams in this final rule.
b. Equipment Classes
When evaluating and establishing energy conservation standards, DOE may divide covered equipment into equipment classes by the type of energy used, or by capacity or other performance-related features that justify a different standard. (42 U.S.C. 6316(a); 42 U.S.C. 6295(q)) In making a determination whether capacity or another performance-related feature justifies a different standard, DOE must consider such factors as the utility of the feature to the consumer and other factors DOE deems appropriate.
Id.
For circulator pumps, there are no current energy conservation standards and, thus, no preexisting equipment classes. However, the November 2016 Term Sheets contained a recommendation related to establishing equipment classes for circulator pumps. Specifically, “Recommendation #1” of the November 2016 CPWG Recommendations suggests grouping all circulator pumps into a single equipment class, though with numerical energy conservation standard values that vary as a function of hydraulic output power. (Docket No. EERE-2016-BT-STD-0004, No. 98, Recommendation #1 at p.1)
As stated in section III.C.1 of this document, circulator pumps may be offered in wet- or dry-rotor configurations, and if dry-rotor, in either close-coupled or mechanically coupled construction. Minor differences may exist across configurations. For example, during interviews with manufacturers, DOE learned that wet-rotor pumps tended to be quieter, whereas dry-rotor pumps may be easier to service. In general, however, each respective pump variety serves similar applications. Similarly, data provided to DOE as part of the confidential submission process indicates that each variety may reach similar efficiency levels when operated with similar motor technology. Accordingly, no apparent basis exists to warrant establishing separate equipment classes by circulator pump configuration.
One additional salient design attribute of circulator pumps is housing material. Generally, circulator pumps are built using a cast iron, bronze, or stainless-steel housing. Bronze and stainless steel (sometimes discussed collectively with the descriptor “nonferrous”) carry greater corrosion resistance and are thus suitable for use in applications in which they will be exposed to corrosive elements. Typically, corrosion resistance is most important in “open loop” applications in which new water is constantly being replaced.
By contrast, cast iron (sometimes described as “ferrous” to distinguish from the “nonferrous” descriptor applied to bronze and stainless steel) pump housing is less resistant to corrosion than bronze or stainless steel, and as a result is generally limited to “closed loop” applications in which the same water remains in the hydraulic circuit, in which it will eventually become deionized and less able to corrode metallic elements of circulator pumps. Cast iron is generally less expensive to manufacture than bronze or stainless steel and, as a result, bronze or stainless-steel circulator pumps are less commonly selected by consumers for applications that do not strictly require them.
As discussed in the December 2022 NOPR, although a difference in utility exists across circulator pump housing materials, no such difference exists in ability to reach higher efficiencies. 87 FR 74850, 74866. All housing materials can reach all efficiency levels analyzed in this final rule.
Id.
Accordingly, no
( printed page 44486)
apparent basis exists to warrant establishing separate equipment classes by circulator pump housing material.
Id.
In the December 2022 NOPR, DOE requested comment regarding the proposal to analyze all circulator pumps within a single equipment class. 87 FR 74850, 74866.
In response, ASAP
et al.
and HI supported DOE's proposal of a single equipment class and standard for all circulator pumps, as it is consistent with the CPWG recommendations. (ASAP
et al.,
No. 131 at pp. 1-2; HI, No. 135 at p. 4)
Based on the foregoing analysis and the support of stakeholders, DOE is establishing circulator pumps in a single equipment class.
Strauch commented that while DOE regularly considers the cumulative regulatory burden on manufacturers, DOE does not address an equivalent burden on consumers, for whom regulatory processes result in diminished equipment choices. (Mark Strauch, No. 123 at p. 2)
As discussed by Strauch, DOE evaluated cumulative regulatory burden on manufacturers in this rulemaking. See section V.B.2.e of this document. In response to Strauch's comment regarding diminishing equipment choices, DOE notes that some circulator pump models with induction motors also come equipped with automatic continuous variable speed controls and therefore not all induction motors will be removed from the market. Further, DOE analyzes burden on consumers in section IV.I of this document.
On-Demand Circulator Pumps
On-demand circulator pumps respond to actions of the user rather than other factors such as pressure, temperature, or time. In the September 2022 TP Final Rule, DOE adopted the following definition for on-demand circulator pumps, which is consistent with that recommended by the CPWG (Docket No. EERE-2016-BT-STD-0004, No. 98, Recommendation 4 at p. 5):
On-demand circulator pump
means a circulator pump that is distributed in commerce with an integral control that:
Initiates water circulation based on receiving a signal from the action of a user [of a fixture or appliance] or sensing the presence of a user of a fixture and cannot initiate water circulation based on other inputs, such as water temperature or a pre-set schedule.
Automatically terminates water circulation once hot water has reached the pump or desired fixture.
Does not allow the pump to operate when the temperature in the pipe exceeds 104 °F or for more than 5 minutes continuously.
The TP final rule (87 FR 57264) responded to a number of comments received in response to the December 2021 TP NOPR, which were discussed therein. Several commenters encouraged DOE to develop an adjustment to the CEI metric that accounted for the potential of on-demand circulator pumps to save energy in certain contexts. (EERE-2016-BT-TP-0033, No. 10 at p. 5; EERE-2016-BT-TP-0033, No. 11 at pp. 4-5). Other commenters did not support an adjusted CEI metric for on-demand circulator pumps in the test procedure final rule, but recommended evaluation of such in a potential future rulemaking. (Docket No. EERE-2016-BT-TP-0033, No. 9 at p. 3; EERE-2016-BT-TP-0033, No. 7 at p. 1).
DOE ultimately did not adopt any modification to the CEI metric for on-demand circulator pumps in the final rule but stated that it would consider the appropriate scope and equipment categories for standards for on-demand circulator pumps in a separate energy conservation rulemaking.
As stated in section III.C of this document, DOE is aligning the scope of energy conservation standards for circulator pumps consistently with that of the test procedure for circulator pumps, which includes on-demand circulator pumps. 87 FR 57264.
As discussed in the December 2022 NOPR, in developing the equipment class structure, DOE is directed to consider, among other factors, performance-related features that justify a different standard and the utility of such features to the consumer. 87 FR 74850, 74867. (42 U.S.C. 6316(a); 42 U.S.C. 6295(q)) In the specific case of on-demand circulator pumps, the primary distinguishing feature (
i.e.,
ability to react to user action or presence) is not obviously performance related in that it does not impede the ability of on-demand circulator pumps to reach the same performance levels as any other circulator pumps.
Id.
On that basis, DOE proposed not to establish a separate equipment class for on-demand circulator pumps in the December 2022 NOPR.
Id.
In the December 2022 NOPR, DOE requested comment on its proposal not to establish a separate equipment class for on-demand circulator pumps. 87 FR 74850, 74867.
In response to the December 2022 NOPR, HI and NEEA/NWPCC stated their support of DOE's proposal to refrain from creating a separate equipment class for on-demand circulators. (HI, No. 135 at p. 4; NEEA/NWPCC, No. 134 at p. 4) NEEA/NWPCC also recommended that, due to the associated energy savings, DOE adopt a CEI credit for on-demand circulator pumps, recognizing that the necessary data collection may delay implementing such a credit until the next circulator pumps rulemaking. (NEEA/NWPCC, No. 134 at p. 4)
On-demand circulator pumps have access to the same technology options as circulator pumps at-large. Thus, it is not clear that on-demand function relates to efficiency, as measured by the test procedure for circulator pumps. (
See10 CFR 431.464(c)) In certain applications, on-demand circulator pumps may conceivably save energy if used to replace an equivalent non-on-demand circulator pump through reduced aggregate operating duration rather the improved energy efficiency during operation. DOE expects the energy efficiency during operation to be the same. DOE does not have data to determine the extent to which on-demand circulator pumps are replacing more traditional circulator pumps. However, such energy savings during the life of the operation would be highly variable based on used and would not materialize if the on-demand circulator pump were installed where none had existed previously (
i.e.,
a newly added on-demand circulator pump). DOE already accounts for operating duration of on-demand circulator pumps in the energy use analysis, which is described in section IV.E of this final rule. In summary, on-demand circulator pumps neither obviously provide additional utility to consumers relative to non-on-demand circulator pumps nor face any impediment to achieving the same performance levels as circulator pumps at-large. Accordingly, DOE is not able to conclude that on-demand function would meet the statutory requirements for establishment of a separate equipment class (42 U.S.C. 6316(a); 42 U.S.C. 6295(q)).
Based on the foregoing analysis and consistent with commenters, DOE is not establishing a separate equipment class for on-demand circulators. If DOE receives data regarding a potential CEI credit for on-demand circulator pumps, DOE may consider a CEI credit at that time.
2. Technology Options
In the preliminary market analysis and technology assessment, DOE identified 3 technology options that would be expected to improve the efficiency of circulator pumps, as measured by the DOE test procedure:
Improved hydraulic design;
More efficient motors; and
( printed page 44487)
Increased number of motor speeds.
Chapter 3 of the final rule TSD details each of these technology options. Section IV.C.2.c of this document provides examples of which technology options may be used to reach various efficiency levels.
a. Hydraulic Design
The performance characteristics of a pump, such as flow, head, and efficiency, are influenced by the pump's hydraulic design. For the purposes of DOE's analysis, “hydraulic design” is a broad term used to describe the system design of the wetted components of a pump. Although hydraulic design focuses on the specific hydraulic characteristics of the impeller and the volute/casing, it also includes design choices related to bearings, seals, and other ancillary components.
Impeller and volute/casing geometries, clearances, and associated components can be redesigned to a higher efficiency (at the same flow and head) using a combination of techniques including historical best practices and modern computer-aided design (CAD) and analysis methods. The wide availability of modern CAD packages and techniques now enables pump designers to reach designs with improved vane shapes, flow paths, and cutwater designs more quickly, all of which work to improve the efficiency of the pump as a whole.
b. More Efficient Motors
Different constructions of motors have different achievable efficiencies. Two general motor constructions are present in the circulator pump market: induction motors and ECMs. Induction motors include both single-phase and three-phase configurations. Single-phase induction motors may be further differentiated and include split-phase, capacitor-start induction-run (“CSIR”), capacitor-start capacitor-run (“CSCR”), and PSC motors. In manufacturer interviews, DOE, using confidentially submitted manufacturer data, found that induction motor circulator pumps account for the majority of the circulator pump market.
The efficiency of an induction motor can be increased by redesigning the motor to reduce slip losses between the rotor and stator components, as well as reducing mechanical losses at seals and bearings. ECMs are generally more efficient than induction motors because their construction minimizes slip losses between the rotor and stator components. Unlike induction motors, however, ECMs require an electronic drive to function. This electronic drive consumes electricity, and variations in drive losses and mechanical designs lead to a range of ECM efficiencies.
The energy conservation standard in this rule is based upon wire-to-water efficiency, which is defined as the hydraulic output power of a circulator pump divided by its line input power and is expressed as a percentage. The achievable wire-to-water efficiency of circulator pumps is influenced by both hydraulic efficiency and motor efficiency. As part of the engineering analysis (section IV.C of this document), DOE assessed the range of attainable wire-to-water efficiencies for circulator pumps with induction motors and those with ECMs over a range of hydraulic power outputs. Because circulator pump efficiency is measured on a wire-to-water basis, it is difficult to fully separate differences due to motor efficiency from those due to hydraulic efficiency. In redesigning a pump model to meet the standard established in this final rule, manufacturers could consider both hydraulic efficiency and motor efficiency.
Higher motor capacities are generally required for higher hydraulic power outputs, and as motor capacity increases, the attainable efficiency of the motor at full load also increases. Higher horsepower motors also operate close to their peak efficiency for a wider range of loading conditions.[28]
Circulator pump manufacturers either manufacture motors in-house or purchase complete or partial motors from motor manufacturers and/or distributors. Manufacturers may select an entirely different motor or redesign an existing motor in order to improve a pump's motor efficiency.
c. Speed Reduction
Circulator pumps with variable speed capability can reduce their energy consumption by reducing pump speed to match load requirements. As discussed in the September 2022 TP Final Rule, the CER metric is a weighted average of input powers at each test point relative to BEP flow. The circulator pump test procedure allows CER values for multi- and variable-speed circulator pumps to be calculated as the weighted average of input powers at full speed BEP flow, and reduced speed at flow points less than BEP; CER for single-speed circulator pumps is calculated based only on input power at full speed. 10 CFR 431.464(c)(2). Due to pump affinity laws, variable-speed circulator pumps will achieve reduced power consumption at flow points less than BEP by reducing their rotational speed to more closely match required system head. As such, the CER metric grants benefits on circulator pumps capable of variable speed operation.
Specifically, pump affinity laws describe the relationship of pump operating speed, flow rate, head, and hydraulic power. According to the affinity laws, flow varies proportionally with the pump's rotational speed, as described in equation (6). The affinity laws also establish that pump total head is proportional to speed squared, as described in equation (7), and pump hydraulic power is proportional to speed cubed, as described in equation (8)
( printed page 44488)
Where:
Q1
and
Q2
= volumetric flow rate at two operating points;
H1
and
H2
= pump total head at two operating points;
N1
and
N2
= pump rotational speed at two operating points; and
P1
and
P2
= pump hydraulic power at two operating points.
This means that a pump operating at half speed will provide one half of the pump's full-speed flow and one eighth of the pump's full-speed power.[29]
However, pump affinity laws do not account for changes in hydraulic and motor efficiency that may occur as a pump's rotational speed is reduced. Typically, hydraulic efficiency and motor efficiency will be reduced at lower operating speeds. Consequently, at reduced speeds, power consumption is not reduced as drastically as hydraulic output power. Even so, the efficiency losses at low-speed operation are typically outweighed by the exponential reduction in hydraulic output power at low-speed operation; this results in a lower input power at low-speed operation at flow points lower than BEP.
Circulator pump speed controls may be discrete or continuous, as well as manual or automatic. Circulator pumps with discrete speed controls vary the circulator pump's rotational speed in a stepwise manner. Discrete controls are found mostly on circulator pumps with induction motors and have several speed settings that can be used to allow contractors greater installation flexibility with a single circulator pump model. For these circulator pumps, the speed is set manually with a dial or buttons by the installer or user, and they operate at a constant speed once the installation is complete.
Circulator pumps equipped with automatic speed controls can adjust the circulator pump's rotational speed based on a signal from differential pressure or temperature sensors, or an external input signal from a boiler. The variable frequency drives required for ECMs make them fairly amenable to the addition of variable speed control logic; currently, the vast majority of circulator pumps with automatic continuously variable speed controls also have ECMs. However, some circulator pump models with induction motors also come equipped with automatic continuous variable speed controls. While automatic controls can reduce energy consumption by allowing circulator pump speed to dynamically respond to changes in system conditions, these controls can also reduce energy consumption by reducing speed to a single, constant value that is optimized based on system head at the required flow point. Automatic controls can be broadly categorized into two groups: pressure-based controls, and temperature-based controls.
Pressure-based controls vary the circulator pump speed based on changes in the system pressure. These pressure changes are typically induced by a thermostatically controlled zone valve that monitors the space temperature in different zones and calls for heat (
i.e.,
opens the valve) when the space/zone temperature is below the set-point, similar to a thermostat. In this type of control, a pressure sensor internal to the circulator pump determines the amount of pressure in the system and adjusts the circulator pump speed to achieve the desired system pressure.
Temperature-based controls monitor the supply and return temperature to the circulator pump and modulate the circulator pump's speed to maintain a fixed temperature drop across the system. Circulator pumps with temperature-based controls are able to serve the heat loads of a conditioned space at a lower speed, and therefore lower input power, than the differential pressure control because it can account for the differential temperature between the space and supplied hot water, delivering a constant BTU/hr load to the space when less heat is needed even in a given zone or zones.
In the December 2022 NOPR, DOE concluded that the technology options identified were sufficient to conduct the engineering analysis, which is discussed in section IV.C of this document.
B. Screening Analysis
DOE uses the following four screening criteria to determine which technology options are suitable for further consideration in an energy conservation standards rulemaking:
(1)
Technological feasibility.
Technologies that are not incorporated in commercial equipment or in commercially viable, existing prototypes will not be considered further.
(2)
Practicability to manufacture, install, and service.
If it is determined that mass production of a technology in commercial equipment and reliable installation and servicing of the technology could not be achieved on the scale necessary to serve the relevant market at the time of the projected compliance date of the standard, then that technology will not be considered further.
(3)
Impacts on equipment utility.
If a technology is determined to have a significant adverse impact on the utility of the equipment to subgroups of consumers, or result in the unavailability of any covered equipment type with performance characteristics (including reliability), features, sizes, capacities, and volumes that are substantially the same as equipment generally available in the United States at the time, it will not be considered further.
(4)
Safety of technologies.
If it is determined that a technology would have significant adverse impacts on health or safety, it will not be considered further.
(5)
Unique-pathway proprietary technologies.
If a technology has proprietary protection and represents a unique pathway to achieving a given efficiency level, it will not be considered further, due to the potential for monopolistic concerns.
In sum, if DOE determines that a technology, or a combination of technologies, fails to meet one or more of the listed five criteria, it will be excluded from further consideration in
( printed page 44489)
the engineering analysis. The reasons for eliminating any technology are discussed in the following sections.
The subsequent sections include comments from interested parties pertinent to the screening criteria, DOE's evaluation of each technology option against the screening analysis criteria, and whether DOE determined that a technology option should be excluded (“screened out”) based on the screening criteria.
1. Screened-Out Technologies
In the December 2022 NOPR DOE received comment from stakeholders regarding the potential of screening out ECMs. HI responded to the May 2021 RFI by commenting that ECMs and controls could potentially become a problem due to scarcity of necessary component materials, reliance on foreign sources, and the degree of automation and specialized tooling involved in the manufacture of ECMs. (Docket No. EERE-2016-BT-STD-0004, HI, No. 112, at p. 7) DOE interpreted HI's comment to be discussing a hypothetical future scenario, and not to be stating that ECMs are unavailable at this time. 87 FR 74850, 74870. Accordingly in the December 2022 NOPR, DOE retained ECMs as a design option for the analysis.
Id.
In the December 2022 NOPR DOE requested comment regarding the current and anticipated forward availability of ECMs and components necessary for their manufacture. 87 FR 74850, 74870.
HI responded stating the suppliers of ECM components, such as chips, electronic components, and rare earth metals, have not been able to meet demand and that some manufacturers have been seeing lead times of 18 months. (HI, No. 135 at p. 4)
Subsequent private interview of a well-known circulator pump manufacturer concluded that, although certain components had realized shortages following the COVID-19 pandemic, the market appeared to be equilibrating and there was no reason to expect the shortage would persist.
DOE has found ECMs available in a range of sizes needed to support the circulator pumps market and commercially and readily available today. Further, the U.S. government is investing in domestic manufacturing of semiconductor microchips in programs such as the CHIPS and Science Act. Semiconductors are an integral part of ECMs and are often the limiting factor in the motor's production. CHIPS for America is a program that offers $52 billion of financial incentives for domestic manufacturing and development of semiconductors and was signed into law on August 9, 2022. Therefore, domestic microchip production may be expected to grow.
DOE did not receive any comments requesting that ECMs be screened out in this analysis. Therefore, DOE is retaining ECMs as a design option for the analysis.
2. Remaining Technologies
Through a review of each technology, DOE tentatively concludes that all of the other identified technologies listed in section IV.A.2 of this document met all five screening criteria to be examined further as design options in DOE's final rule analysis. In summary, DOE did not screen out the following technology options:
Improved hydraulic design;
Improved motor efficiency; or
Increased number of motor speeds.
DOE determined that these technology options are technologically feasible because they are being used or have previously been used in commercially available equipment or working prototypes. DOE also finds that all of the remaining technology options meet the other screening criteria (
i.e.,
practicable to manufacture, install, and service and do not result in adverse impacts on consumer utility, equipment availability, health, or safety). For additional details, see chapter 4 of the final rule TSD.
C. Engineering Analysis
The purpose of the engineering analysis is to establish the relationship between the efficiency and cost of circulator pumps. There are two elements to consider in the engineering analysis; the selection of efficiency levels to analyze (
i.e.,
the “efficiency analysis”) and the determination of equipment cost at each efficiency level (
i.e.,
the “cost analysis”). In determining the performance of higher-efficiency equipment, DOE considers technologies and design option combinations not eliminated by the screening analysis. For each equipment class, DOE estimates the baseline cost, as well as the incremental cost for the equipment at efficiency levels above the baseline. The output of the engineering analysis is a set of cost-efficiency “curves” that are used in downstream analyses (
i.e.,
the LCC and PBP analyses and the NIA).
1. Representative Equipment
To assess MPC-efficiency relationships for all circulator pumps available on the market, DOE selected a set of representative units to analyze. These representative units exemplify capacities and hydraulic characteristics typical of circulator pumps currently found on the market. In general, to determine representative capacities and hydraulic characteristics, DOE analyzed the distribution of all available models and/or shipments and discussed its findings with the CPWG. The analysis focused on single speed induction motors as they represent the bulk of the baseline of the market.
To start the selection process, nominal horsepower targets based on CPWG feedback of 1/40, 1/25, 1/12, 1/6, and 1 hp were selected for representative units (Docket No. EERE-2016-BT-STD-0004-0061, p. 9). At each horsepower target, pump curves were constructed from manufacturer data. Near identical pump curves were consolidated into single curves and curves that represent circulator pumps with low shipments were filtered out to remove the impact of low-selling pumps. These high-sales consolidated pump curves were then grouped with similar curves to form clusters of similar circulator pumps. A representative curve was then constructed from this cluster of pumps by using the mean flow and head at each test point. Eight of these curves were constructed to form the eight representative units used in further analyses.
a. Circulator Pump Varieties
Circulator pumps varieties are used to classify different pumps in industry. Wet rotor circulator pumps are commonly referred to as CP1; dry-rotor, two-piece circulator pumps are commonly referred to as CP2; and dry-rotor, three-piece circulator pumps are commonly referred to as CP3. The distinction of circulator varieties does not have a large impact on performance with all circulator pump varieties being capable of achieving any particular performance curve. Due to the performance similarities, the groups of pump curves used to generate representative units contain a mix of all three circulator varieties. Although DOE analyzed CP1, CP2, and CP3 circulator varieties as a single equipment class, representative units were selected such that all circulator varieties were captured in the analysis.
The parameters of each of the representative units used in this analysis are provided in Table IV.1.
( printed page 44490)
2. Efficiency Analysis
DOE typically uses one of two approaches to develop energy efficiency levels for the engineering analysis: (1) relying on observed efficiency levels in the market (
i.e.,
the efficiency-level approach), or (2) determining the incremental efficiency improvements associated with incorporating specific design options to a baseline model (
i.e.,
the design-option approach). Using the efficiency-level approach, the efficiency levels established for the analysis are determined based on the market distribution of existing equipment (in other words, based on the range of efficiencies and efficiency level “clusters” that already exist on the market). Using the design option approach, the efficiency levels established for the analysis are determined through detailed engineering calculations and/or computer simulations of the efficiency improvements from implementing specific design options that have been identified in the technology assessment. DOE may also rely on a combination of these two approaches. For example, the efficiency-level approach (based on actual equipment on the market) may be extended using the design option approach to interpolate to define “gap fill” levels (to bridge large gaps between other identified efficiency levels) and/or to extrapolate to the “max-tech” level (particularly in cases where the “max-tech” level exceeds the maximum efficiency level currently available on the market).
In this rulemaking, DOE applied an efficiency-level approach due to the availability of robust data characterizing both performance and selling price at a variety of efficiency levels.
a. Baseline Efficiency
For each equipment class, DOE generally selects a baseline model as a reference point for each class, and measures changes resulting from potential energy conservation standards against the baseline. The baseline model in each equipment class represents the characteristics of equipment typical of that class (
e.g.,
capacity, physical size). Generally, a baseline model is one that just meets current energy conservation standards, or, if no standards are in place, the baseline is typically a common, low-efficiency unit on the market.
For all representative units, DOE modeled a baseline circulator pump as one with a PSC motor.
b. Higher Efficiency Levels
As part of DOE's analysis, the maximum available efficiency level is the highest efficiency unit currently available on the market. DOE also defines a “max-tech” efficiency level to represent the maximum possible efficiency for a given type of equipment.
For all representative units, DOE modeled a max-tech circulator pump as one with an ECM and operated on a differential temperature-based control scheme.
c. EL Analysis
DOE examined the influence of different parameters on wire-to-water efficiency including hydraulic power. Hydraulic power has a significant impact on wire-to-water efficiency as seen in the different representative units. To find the correlation, the relationship of power and wire-to-water efficiency were evaluated for both single speed induction and single speed ECMs. Multiple relationships were tested with a logarithmic relationship being the most accurate. This logarithmic relationship can be used to set efficiency levels inclusive of all representative units across the ranges of horsepower.
To calculate wire-to-water efficiency at part-load conditions, wire-to-water efficiency at full-load conditions is multiplied by a part-load coefficient, represented by alpha (α). As instructed by the CPWG, a mean fit was developed for each part-load test point across representative units to find a single value to use for alpha for each test point. This methodology was conducted independently for single-speed induction, single-speed ECM, and variable-speed ECM to find unique alphas at each point for each motor type. The unique alpha values are provided in Table IV.2.
( printed page 44491)
DOE set EL 0 as the baseline configuration of circulator pumps representing the minimum efficiency available on the market. DOE used the logarithmic function developed when finding the relationship between hydraulic power and wire-to-water efficiency to find the lower second percentile of single speed induction circulator pumps to set as EL 0. DOE finds single speed circulator pumps with induction motors have the lowest wire-to-water efficiency and are being set as EL 0, as agreed on at CPWG meeting 8. (Docket No. EERE-2016-BT-STD-0004-0061, p. 15)
DOE set EL 1 to correspond approximately to single-speed induction motors with improved wire-to-water efficiency. EL 1 is an intermediate efficiency level between the baseline EL 0 and more efficient ECMs defined in higher efficiency levels. EL 1 was defined as the halfway between the most efficient single-speed induction motors and the baseline used as EL 0.
EL 2 is set to correspond approximately to single-speed ECMs. The values for these circulator pumps are found using the same base logarithmic function that was used when finding the relationship between hydraulic power and wire-to-water efficiency. EL 2 corresponds to a CEI of 1.00, which is the level recommended by the CPWG in the November 2016 CPWG Recommendations.
EL 3 is set to correspond approximately to variable-speed ECMs with automatic proportional pressure control. The effect of a 50-percent proportional pressure control is applied using equation (9) for each part-load test point. The wire-to-water efficiency at each test point is found using the alpha values for variable speed ECM values for Alpha.
Where:
Hi
= total system head at each load point
i
(ft);
Qi
= flow rate at each load point
i
(gpm);
Q100%
= flow rate at 100 percent of BEP flow at maximum speed (gpm); and
H100%
= total pump head at 100 percent of BEP flow at maximum speed (ft).
EL 4 is the max-tech efficiency level, which represents the circulator pumps with the maximum possible efficiency. EL 4 is set as variable speed ECMs with automatic differential temperature control. The effects of the controls are calculated using equation (10). Similar to EL 3, the wire-to-water efficiencies are found using the alpha values for variable speed ECMs.
For pumps that do not fit exactly into a representative unit, DOE developed a continuous function for wire-to-water efficiency at BEP. The technique extends the representative units for each EL to compute wire-to-water efficiency at BEP for all circulator pumps by using a logarithmic function based on hydraulic power represented in equation (11) and fit to each pump's specific performance data. A logarithmic curve form was selected based on apparent fit over a wide power range to manufacturer-submitted pump performance data. Variable
d
can be solved by using equation (12) and the variables for a and b are presented in Table IV.3 which contains different values for each efficiency level.
See
TSD Chapter 5 for additional detail on the engineering analysis.
( printed page 44492)
Where:
ηWTW
= wire-to-water efficiency
Phydro
= hydraulic power (hp);
Table IV.4 contains a summary of the motor type and control scheme associated with each EL.
3. Cost Analysis
The cost analysis portion of the engineering analysis is conducted using one or a combination of cost approaches. The selection of cost approach depends on a suite of factors, including the availability and reliability of public information, characteristics of the regulated equipment, the availability and timeliness of purchasing the equipment on the market. The cost approaches are summarized as follows:
☐
Physical teardowns:
Under this approach, DOE physically dismantles commercially available equipment, component-by-component, to develop a detailed bill of materials for the equipment.
☐
Catalog teardowns:
In lieu of physically deconstructing equipment, DOE identifies each component using parts diagrams (available from manufacturer websites or appliance repair websites, for example) to develop the bill of materials for the equipment.
☐
Price surveys:
If neither a physical nor catalog teardown is feasible (for example, for tightly integrated equipment such as fluorescent lamps, which are infeasible to disassemble and for which parts diagrams are unavailable) or cost-prohibitive and otherwise impractical (
e.g.,
large commercial boilers), DOE conducts price surveys using publicly available pricing data published on major online retailer websites and/or by soliciting prices from distributors and other commercial channels.
In the present case, DOE conducted the analysis using a combination of physical teardowns and price surveys. The resulting bill of materials provides the basis for the manufacturer production cost (“MPC”) estimates.
To account for manufacturers' non-production costs and profit margin, DOE applies a multiplier (the manufacturer markup) to the MPC. The resulting manufacturer selling price (“MSP”) is the price at which the manufacturer distributes a unit into commerce. DOE developed an average manufacturer markup by examining the annual Securities and Exchange Commission (“SEC”) 10-K reports filed by publicly traded manufacturers primarily engaged in machinery and equipment-industrial pumps, except hydraulic fluid power pumps, not seasonally adjusted manufacturing, and whose combined equipment range includes circulator pumps.
( printed page 44493)
4. Cost-Efficiency Results
The results of the engineering analysis are reported as cost-efficiency data (or “curves”) in the form of wire-to-water efficiency versus MPC (in dollars). DOE developed 15 curves representing the 15 representative units in the analysis. The methodology for developing the curves started with determining the energy consumption for baseline equipment and MPCs for this equipment. Above the baseline, DOE implemented design options using the ratio of cost to savings and implemented only one design option at each level. Design options were implemented until all available technologies were employed (
i.e.,
at a max-tech level).
Table IV.5, Table IV.6, Table IV.7, and Table IV.8 contain cost-efficiency results of the engineering analysis. MPCs are presented for circulator pumps with both ferrous and nonferrous housing material. Housing material does not significantly affect the energy consumption of circulator pumps but does alter production cost. Housing material is discussed further in section IV.A.1.b of this document.
See
TSD Chapter 5 for additional detail on the engineering analysis.
( printed page 44494)
( printed page 44495)
5. Manufacturer Markup and Manufacturer Selling Price
To account for manufacturers' non-production costs and profit margin, DOE applies a non-production cost multiplier (the manufacturer markup) to the full MPC. The resulting MSP is the price at which the manufacturer can recover production and non-production costs. To calculate the manufacturer markups, DOE used data from 10-K reports [30]
submitted to the U.S. Securities and Exchange Commission (“SEC”) by the publicly owned circulator pump manufacturers. DOE then averaged the financial figures spanning the years 2018 to 2022 to calculate the initial estimate of markups for circulator pumps for this rulemaking. During the 2022 manufacturer interviews, DOE discussed the manufacturer markup with manufacturers and used the feedback to modify the manufacturer markup calculated through review of SEC 10-K reports.
To calculate the MSP for circulator pump equipment, DOE multiplied the calculated MPC at each efficiency level by the manufacturer markup. See chapter 12 of the final rule TSD for more details about the manufacturer markup calculation and the MSP calculations.
D. Markups Analysis
The markups analysis develops appropriate markups (
e.g.,
retailer markups, wholesaler markups, contractor markups) in the distribution chain and sales taxes to convert the MSP estimates derived in the engineering analysis to consumer prices, which are then used in the LCC and PBP analysis and in the manufacturer impact analysis. At each step in the distribution channel, companies mark up the price of the equipment to cover business costs and profit.
For circulator pumps, the main parties in the distribution channel are (1) sales representatives (reps); (2) wholesalers; (3) contractors; and (4) original equipment manufacturers (OEMs). For each actor in the distribution channel, DOE developed baseline and incremental markups. Baseline markups are applied to the price of equipment with baseline efficiency, while incremental markups are applied to the difference in price between baseline and higher-efficiency models (the incremental cost increase). The incremental markup is typically less than the baseline markup and is designed to maintain similar per-unit operating profit before and after new standards.[31]
DOE identified distribution channels for circulator pumps and estimated their respective shares of shipments by sector (residential and commercial) based on feedback from manufacturers and the CPWG (Docket No. EERE-2016-BT-STD-0004, No. 49 at p. 51), as shown in Table IV.9.
( printed page 44496)
The sales representative in the distribution chain serves the role of a wholesale distributor, as they do not take commission from the sale, but buy the equipment and take title to it. The OEM channels represent sales of circulator pumps, which are included in other equipment, such as hot water boilers.
In the December 2022 NOPR, DOE requested comment on whether the distribution channels described above and the percentage of equipment sold through the different channels are appropriate and sufficient to describe the distribution markets for circulator pumps. 87 FR 74850, 74875. Specifically, DOE requested comment and data on online sales of circulator pumps and the appropriate channel to characterize them.
Id.
HI commented that it generally agreed with the distribution channels presented in Table IV.9 and noted that online sales would be split between line 2 (Sales Rep → Distributor → Contractor → End User) and line 4 (Sales Rep → Distributor → End User) (HI, No. 135 at p. 5)
DOE acknowledges that the online sales of circulator pumps may have increased in the past few years. However, there is currently no sufficient data supporting a notable price difference between online sales and conventional sales, namely channel 2 and channel 4. Hence, DOE assumed that circulator pumps sold through online channels have the same prices as those through conventional channels and that online sales have been included in the shares of channel 2 and channel 4.
To estimate average baseline and incremental markups, DOE relied on several sources, including: (1) U.S. Census Bureau 2017 Annual Wholesale Trade Survey [32]
(for sales representatives and circulator wholesalers), (2) U.S. Census Bureau 2017 Economic Census data [33]
on the residential and commercial building construction industry (for contractors), and (3) the Heating, Air Conditioning & Refrigeration Distributors International (“HARDI”) 2013 Profit Report [34]
(for equipment wholesalers). In addition to markups of distribution channel costs, DOE applied state and local sales tax provided by the Sales Tax Clearinghouse to derive the final consumer purchase prices for circulator pumps.[35]
Chapter 6 of the final rule TSD provides details on DOE's development of markups for circulator pumps.
E. Energy Use Analysis
The purpose of the energy use analysis is to determine the annual energy consumption of circulator pumps at different efficiencies in representative U.S. single-family homes, multi-family residences, and commercial buildings, and to assess the energy savings potential of increased circulator pump efficiency. The energy use analysis estimates the range of energy use of circulator pumps in the field (
i.e.,
as they are actually used by consumers). The energy use analysis provides the basis for other analyses DOE performed, particularly assessments of the energy savings and the savings in consumer operating costs that could result from adoption of new standards.
Following the same approach as in the December 2022 NOPR, to calculate the annual energy use (“AEU”) for circulator pumps, DOE multiplied the annual operating hours by the line input power (derived in the engineering analysis) at each operating point. The following sections describe how DOE estimated circulator pump energy use in the field for different applications, geographical areas, and use cases.
1. Circulator Pump Applications
DOE identified two primary applications for circulator pumps: hydronic heating, and hot water recirculation. Hydronic heating systems are typically characterized by the use of water to move heating from sources such as hot water boilers to different rooms through pipes and radiating surfaces. Hot water recirculation systems serve the purpose of moving hot water from sources such as water heaters, through pipes, to water fixture outlets. For each of these applications, DOE developed estimates of operating hours and load profiles to characterize circulator pump energy use in the field.
Circulator pumps used in hydronic heating applications typically have cast iron housings, while those used in hot water recirculation applications have housings made of stainless steel or bronze. DOE collected sales data for circulator pumps, including their housing materials, through manufacturer interviews, and was able to estimate the market share of each application by horsepower and efficiency level. To estimate market shares by sector and horsepower rating, DOE relied primarily on industry expert input.
In the May 2021 RFI, DOE requested feedback on whether the breakdowns of circulator pumps by sector and application have changed since the CPWG proceedings. HI commented that there have not been any market changes to warrant a different estimate. (HI, No. 112 at p. 9) During the 2022 manufacturer interviews, DOE collected recent data and updated the estimated market shares by application. According to these data, DOE estimated the market share of circulator pumps used in hydronic heating and hot water recirculation applications at 66.6, and 33.4 percent, respectively.
( printed page 44497)
2. Consumer Samples
To estimate the energy use of circulator pumps in field operating conditions, DOE developed consumer samples that are representative of installation and operating characteristics of how such equipment is used in the field, as well as distributions of annual energy use by application and market segment.
To develop a sample of circulator pump consumers, DOE used the Energy Information Administration's (EIA) 2018 Commercial Buildings Energy Consumption Survey (CBECS) [36]
and the 2015 residential energy consumption survey (RECS) [37]
. For the commercial sector, DOE selected commercial buildings from CBECS and apartment buildings with five or more units from RECS. For the residential sector, DOE selected single family attached or detached buildings from RECS. As discussed in chapter 7 of the final rule TSD, the majority of consumers (73.7%) of circulator pumps are in the residential sector, and the rest (26.3%) are in the commercial sector. The following paragraphs describe how DOE developed the consumer samples by application.
For hydronic heating, because there is no data in RECS and CBECS specifically on the use of circulator pumps, DOE used data on hot water boilers to develop its consumer sample. DOE adjusted the selection weight associated with the representative RECS and CBECS buildings containing boilers to effectively exclude steam boilers, which are not used with circulator pumps. To estimate the distribution of circulator pumps by geographical region, DOE also used information on each building's heated area by boilers to correlate it to circulator horsepower rating.
For hot water recirculation, there is limited information in RECS and CBECS. In the residential sector, DOE selected consumers based on building square footage and assumed that buildings greater than 3,000 square feet have a hot water recirculation system, according to feedback from the CPWG.[38]
(Docket No. EERE-2016-BT-STD-0004, No. 67 at pp. 171,172) DOE also assumed that only small (<
1/12
hp) circulator pumps are installed in residential buildings, according to feedback from the CPWG. (Docket No. EERE-2016-BT-STD-0004, No. 67 at pp. 157-163) For the commercial sector, DOE first selected buildings in CBECS with water heaters. Further, DOE assigned a circulator pump size category based on the number of floors in each building. The commercial segment of the RECS sample was defined as multi-family buildings with more than four units. Similar to the hydronic heating application, to determine a distribution by region by representative unit, DOE assigned circulator pump sizes (
i.e.,
horsepower ratings) to building types based on the number of floors in each building.
For details on the consumer sample methodology, see chapter 7 of the final rule TSD.
3. Operating Hours
DOE developed annual operating hour estimates by sector (commercial, residential) and application (hydronic heating, hot water recirculation).
a. Hydronic Heating
For hydronic heating applications in the residential sector, operating hours per year were estimated based on two sources: 2015 confidential residential field metering data from Vermont, and a 2012-2013 residential metering study in Ithaca, NY.[39]
DOE used the data from these metering data to establish a relationship between heating degree days (HDDs) [40]
and circulator pump operating hours. DOE correlated monthly operating hours with corresponding HDDs to annual operating hours. DOE then used the geographic distribution of consumers, derived from the consumer sample based on RECS and CBECS in correlation to the presence of hot water boilers, as described in section IV.E.2, to estimate weighted-average HDDs for each region. For the residential sector, this scaling factor was 0.33 HPY/HDD. For the commercial sector, the CPWG recommended a scaling factor of 0.45 HPY/HDD. (Docket No. EERE-2016-BT-STD-0004, No. 100 at pp. 122-123). The weighted average operating hours per year for the hydronic heating application were estimated at approximately 1,970 and 2,200 for the residential and commercial sector, respectively.
b. Hot Water Recirculation
For circulator pumps used in hot water recirculation applications, DOE developed operating hour and consumer fractions estimates based on their associated control types, according to feedback from the CPWG (Docket No. EERE-2016-BT-STD-0004, No. 60 at p. 74; Docket No. EERE-2016-BT-STD-0004, No. 67 at pp. 194-195; Docket No. EERE-2016-BT-STD-0004, No. 68 at p. 184), as shown in Table IV.10.
( printed page 44498)
With regard to Table IV.10, Strauch commented that DOE overestimates operating hours for circulator pumps in the residential sector and cited personal experience with using a circulator pump with an integrated timer. (Strauch, No. 123 at p. 1) In response, while DOE acknowledges that the estimates in Table IV.10 are averages and do not cover all use cases, it also notes that these estimates were discussed in the CPWG and supported by stakeholders following the May 2021 RFI. (NEEA, No. 115 at pp. 5-6); (Grundfos, No. 113 at p. 9); (HI, No. 112 at p. 9)
NYSERDA commented that DOE's assumed average operating hours across technology options are nationally representative but may be higher when high-rise multi-family buildings due to longer pipes with increased heat loss, as well as larger household sizes and water usage. (NYSERDA, No.130 at p. 4)
DOE agrees with NYSERDA that multi-family buildings may consume more water and experience more heat loss than other types of buildings. However, DOE is not aware of data relating circulator pump hours of operation to building type. DOE also notes that its analysis does consider purchasers with the characteristics related to high-rise multi-family buildings. For example, half of the purchasers in the hot water recirculation application are estimated to use their circulator pump 24 hours per day. Further, DOE considers a wide range of piping configurations in its calculation of load profiles as described in the section IV.E.4, including systems curves related to longer pipes.
4. Load Profiles
To estimate the power consumption of each representative unit at each efficiency level, DOE used the following methodology: For each representative unit, DOE defined a range of typical system curves representing different piping and fluid configurations and bounded the representative unit's pump curve derived in the engineering analysis within those system curves. The upper and lower boundaries of this range of system curves correspond to a maximum (
Qmax) and minimum (
Qmin) value of volumetric flow. The value of
Qmax
is capped to 150% of BEP flow at most, while the value of the value of
Qmin
is capped to at least 25% of BEP flow.
For single speed circulator pumps (ELs 0-2) in single zone applications, DOE randomly selects a single operating point (
Q0) within the boundaries of a uniform distribution defined by the system curves such that
Q0
is between
Qmin
and
Qmax. The AEU is then calculated by multiplying the power consumption at the volumetric flow
Q0, as derived in the engineering analysis, by the annual operating hours. DOE notes that while a random operating point is assigned to each purchaser of an analyzed representative unit, as discussed in the previous paragraph, the boundaries
Qmin
and
Qmax
are selected such that they correspond to appropriate operating ranges specifically for each of those representative units.
For variable-speed circulator pumps (ELs 3-4) in single-zone applications, similarly, DOE randomly selects a single operating point (
Q0) within the boundaries of the system curves, such that
Q0
is between
Qmin
and
Qmax. After the operating point is selected, the procedure to determine the AEU varies depending on the value of
Q0: If the selected operating point (
Q0) has a flow that is equal or higher than QBEP, the method is the same as the one for single speed circulator pumps in single zones. For operating points where
Q0
<QBEP, DOE assumes that the circulator pump reduces its speed and operates at the intersection of the corresponding system curve and the control curve of each EL (dP or dT), at a flow
Qx. The AEU is then calculated by multiplying the power consumption at the volumetric flow
Qx, as derived in the engineering analysis, by the annual operating hours, after adjusting the hours to maintain the same heat as
Q0.
For circulator pumps in multi-zone applications DOE modeled their operation by assuming that representative multi-zone systems have three zones, resulting in two additional operating points (
Q−
and
Q+), which are equidistant from a randomly selected operating point,
Q0, and are within the allowable operating flow (between
Qmin
and
Qmax), as defined by the representative unit's characteristic system curves. (Docket #0004, No. 61 at p. 88)
In the December 2022 NOPR, DOE noted that its energy use analysis assumes that all purchasers of variable-speed equipment with controls (ELs 3 and 4) are installed in systems that benefit from such control capabilities. However, this assumption may differ from the reality of installations in the field, where a fraction of purchasers may not benefit from such control capabilities due to system characteristics or improper installation. In such cases, the energy use of EL 3 and EL 4 equipment would be at similar levels to EL 2 equipment. The CA IOUs commented that they agree with DOE's
( printed page 44499)
assertion that a portion of purchasers do not benefit from controls in the field, in which case energy savings of variable speed controls compared to EL 2 may not be fully realized. However, they noted that occurrences of ineffective installed controls should decrease over time as integrated controls and automatic-operating-point adjustments become simpler to set-up and more widely adopted (CA IOUs, No. 133 at p. 3) ASAP requested that DOE determine the fraction of circulator pump installations in the field that are indeed capable of benefiting from speed control. (ASAP, No. 131 at p. 2)
In response to these comments, DOE conducted further research but found no data on the fraction of circulator pump installations in the field that are indeed capable of benefiting from speed controls. In turn, DOE conducted a sensitivity analysis to estimate the impact in the LCC analysis of varying the fraction of purchasers that benefit from controls in the field. Results showed that the fraction of purchasers experiencing a net cost at EL 3 and EL 4 would linearly increase from 42.7% to 60.7% and 45.9% to 74.8%, respectively, when the fraction of purchasers who do benefit from controls in the field varies from 100% to 0%. The remaining ELs (EL0 and EL1) do not include controls and were not affected. See chapter 8 of the final rule TSD and appendix 8D for more details on this sensitivity analysis.
Chapter 7 of the final rule TSD provides details on DOE's energy use analysis.
F. Life-Cycle Cost and Payback Period Analysis
DOE conducted LCC and PBP analyses to evaluate the economic impacts on individual purchasers of potential energy conservation standards for circulator pumps. The effect of new energy conservation standards on individual purchasers usually involves a reduction in operating cost and an increase in purchase cost. DOE used the following two metrics to measure consumer impacts:
☐ The LCC is the total consumer expense of an equipment over the life of that equipment, consisting of total installed cost (manufacturer selling price, distribution chain markups, sales tax, and installation costs) plus operating costs (expenses for energy use, maintenance, and repair). To compute the operating costs, DOE discounts future operating costs to the time of purchase and sums them over the lifetime of the equipment.
☐ The PBP is the estimated amount of time (in years) it takes purchasers to recover the increased purchase cost (including installation) of a more-efficient equipment through lower operating costs. DOE calculates the PBP by dividing the change in purchase cost at higher efficiency levels by the change in annual operating cost for the year that new standards are assumed to take effect.
For any given efficiency level, DOE measures the change in LCC relative to the LCC in the no-new-standards case, which reflects the estimated efficiency distribution of circulator pumps in the absence of new energy conservation standards. In contrast, the PBP for a given efficiency level is measured relative to the baseline equipment.
For each considered efficiency level in each equipment class, DOE calculated the LCC and PBP for a nationally representative set of commercial and residential purchasers. As stated previously, DOE developed purchaser samples from the 2015 RECS and the 2018 CBECS, for the residential and commercial sectors, respectively. For each sampled purchaser, DOE determined the energy consumption for the circulator pumps and the appropriate energy price. By developing a representative sample of purchasers, the analysis captured the variability in energy consumption and energy prices associated with the use of circulator pumps.
Inputs to the calculation of total installed cost include the cost of the equipment—which includes MPCs, manufacturer markups, retailer and distributor markups, and sales taxes—and installation costs. Inputs to the calculation of operating expenses include annual energy consumption, energy prices and price projections, repair and maintenance costs, equipment lifetimes, and discount rates. DOE created distributions of values for equipment lifetime, discount rates, and sales taxes, with probabilities attached to each value, to account for their uncertainty and variability.
The computer model DOE uses to calculate the LCC relies on a Monte Carlo simulation to incorporate uncertainty and variability into the analysis. The Monte Carlo simulations randomly sample input values from the probability distributions and circulator pumps user samples. The model calculated the LCC and PBP for a sample of 75,000 purchasers per simulation run. The analytical results include a distribution of 75,000 data points showing the range of LCC savings. In performing an iteration of the Monte Carlo simulation for a given consumer, equipment efficiency is chosen based on its probability. By accounting for purchasers who already purchase more-efficient equipment, DOE avoids overstating the potential benefits from increasing efficiency.
DOE calculated the LCC and PBP for purchasers of circulator pumps as if each were to purchase a new equipment in the first year of required compliance with new standards. As discussed in section III.G, new standards would apply to circulator pumps manufactured 4 years after the date on which any new or amended standard is published. DOE is publishing this final rule in 2024. Therefore, for purposes of its analysis, DOE used 2028 as the first year of compliance with standards for circulator pumps.
Table IV.11 summarizes the approach and data DOE used to derive inputs to the LCC and PBP calculations. The subsections that follow provide further discussion. Details of the model, and of all the inputs to the LCC and PBP analyses, are contained in chapter 8 of the final rule TSD and its appendices.
( printed page 44500)
1. Equipment Cost
To calculate consumer equipment costs, DOE multiplied the MPCs developed in the engineering analysis by the markups described previously (along with sales taxes). DOE used different markups for baseline equipment and higher-efficiency equipment because DOE applies an incremental markup to the increase in MSP associated with higher-efficiency equipment. Due to lack of historical price data and uncertainty on the factors that may affect future circulator pump prices, such as price declines on certain equipment components, DOE assumed a constant price over the analysis period. However, DOE developed a sensitivity analysis accounting for future price declines of electronic components in circulator pumps with ECMs. See chapter 8 of the final rule TSD and appendix 8D for more details on this sensitivity analysis.
2. Installation Cost
Installation cost includes labor, overhead, and any miscellaneous materials and parts associated with installing a circulator pump in the place of use. DOE derived installation costs for circulator pumps based on data from RSMeans and input from the CPWG.[41]
(Docket #0004, No. 67 at p. 266)
DOE assumed that circulator pumps without variable speed controls (ELs 0-2) require a labor time of 3 hours and an additional 30 minutes for circulators with electronic controls (ELs 3 and 4). (Docket #0004, No. 67 at p. 266) RSMeans provides estimates on the labor hours and labor costs required to install equipment. In the NOPR, DOE derived the installation cost for circulator pumps as the product of labor hours and time required to install a circulator pump. Installation costs vary by geographic location and efficiency level. During the 2022 manufacturer interviews, manufacturers agreed with DOE's approach to estimate installation costs.
In the December 2022 NOPR, the CA IOUs acknowledged DOE's installation cost assumptions regarding additional set-up time for circulator pumps with controls due to commissioning challenges. However, they noted that, in a future rulemaking evaluation cycle, DOE should not consider incremental set-up time for circulator pumps at EL 3 and EL 4 that have automatic-operating-point selection functionality. (CA IOUs, No.133 at p. 2-3) In response to the CA IOUs comment, DOE states that is not aware of data quantifying the fraction of circulator pumps purchasers that have automatic-operating-point selection functionality. Therefore, DOE maintained its installation cost assumptions, which are based on what was agreed by the CWPG, as previously described.
3. Annual Energy Consumption
For each sampled purchaser, DOE determined the AEU for a circulator pump at different efficiency levels using the approach described previously in section IV.E.3 of this document.
4. Energy Prices
Because marginal electricity price more accurately captures the incremental savings associated with a change in energy use from higher efficiency, it provides a better representation of incremental change in consumer costs than average electricity prices. DOE generally applies average electricity prices for the energy use of the equipment purchased in the no-new-standards case, and marginal electricity prices for the incremental change in energy use associated with the other efficiency levels considered. In this final rule, DOE only used marginal electricity prices due to the calculated annual electricity cost for some regions and efficiency levels being negative when using average electricity prices for the energy use of the equipment purchased in the no-new-standards case. Negative costs can occur in instances where the marginal electricity cost for the region and the energy savings relative to the baseline for the given efficiency level are large enough that the incremental cost savings exceed the baseline cost.
DOE derived electricity prices in 2022 using data from EEI Typical Bills and Average Rates reports. Based upon comprehensive, industry-wide surveys, this semi-annual report presents typical monthly electric bills and average kilowatt-hour costs to the customer as charged by investor-owned utilities. For the residential sector, DOE calculated
( printed page 44501)
electricity prices using the methodology described in Coughlin and Beraki (2018).[42]
For the commercial sector, DOE calculated electricity prices using the methodology described in Coughlin and Beraki (2019).
DOE's methodology allows electricity prices to vary by sector, region, and season. In the analysis, variability in electricity prices is chosen to be consistent with the way the consumer economic and energy use characteristics are defined in the LCC analysis.
To estimate energy prices in future years, DOE multiplied the 2022 regional energy prices by the projection of annual change in national-average residential or commercial energy price from
AEO2023,
which has an end year of 2050.[43]
For each purchaser sampled, DOE applied the projection for the geographic location in which the consumer was located. To estimate price trends after 2050, DOE assumed that the regional prices would remain at the 2050 value.
DOE used the electricity price trends associated with the AEO Reference case, which is a business-as-usual estimate, given known market, demographic, and technological trends. DOE also included AEO High Economic Growth and AEO Low Economic Growth scenarios in the analysis. The high- and low-growth cases show the projected effects of alternative economic growth assumptions on energy prices.
For a detailed discussion of the development of electricity prices, see chapter 8 of the final rule TSD.
5. Maintenance and Repair Costs
Repair costs are associated with repairing or replacing equipment components that have failed in an equipment; maintenance costs are associated with maintaining the operation of the equipment. Typically, small incremental increases in equipment efficiency entail no, or only minor, changes in repair and maintenance costs compared to baseline efficiency equipment.
As in the December 2022 NOPR, DOE assumed that only certain types of CP3 circulators require annual maintenance through oil lubrication. Based on CPWG feedback, DOE assumed that 50 percent of commercial purchasers have a maintenance cost of $10 per year and 25 percent of residential purchasers have a maintenance cost of $20 per year, which result in an overall $5 annual maintenance cost for CP3 circulators in each of the two applications. (Docket #0004, No. 47 at pp. 324-327)
Repair costs consist of both labor and replacement part costs. DOE assumed that repair costs for CP1 circulators are negligible because purchasers tend to discard such equipment when they fail. For CP2 and CP3 circulator pumps, DOE assumed that 50 percent of purchasers will incur repairs once in the equipment lifetime, that repair cost does not vary with efficiency level, and that cost is spread over the equipment's lifetime. Rather than assuming a specific repair year, the cost of a single repair is divided over the lifetime of the equipment and added to its annual operating expenses. According to CPWG feedback and manufacturer interview input, typical repairs for CP2 and CP3 include seal replacements and coupler plus motor mount replacements, respectively. DOE assumed consistent labor time with installation costs, which is 3 hours for seal replacement and 1.5 hours for coupler and motor mount replacement. Additionally, DOE assumes there is no variation in repair costs between a baseline efficiency circulator and a higher efficiency circulator. During the 2022 manufacturer interviews, manufacturers agreed with DOE's approach to estimate maintenance and repair costs. DOE maintained its assumptions in this final rule.
6. Equipment Lifetime
Equipment lifetime is the age when a unit of circulator equipment is retired from service. DOE estimated lifetimes and developed lifetime distributions for circulator pumps primarily based on manufacturer interviews conducted in 2016 and CPWG feedback. (Docket #0004, No. 41 at p. 74) The data collected by manufacturers allowed DOE to develop a survival function, which provides a distribution of lifetimes ranging from a minimum of 3 years based on warranty covered period, to a maximum of 50 years for CP1, CP2, or CP3 respectively. Based on manufacturer interviews, DOE assumed circulator pump lifetimes do not vary across efficiency levels. (Docket #0004, No. 41 at p. 74) Table IV.12 shows the average and maximum lifetimes by circulator variety.
During the 2022 manufacturer interviews, DOE solicited additional feedback from manufacturers on the lifetime assumptions presented in Table IV.12, and the general consensus was that there have not been significant technological changes to warrant a different estimate on the circulator pump lifetimes.
Mark Strauch commented that equipment lifetime should vary by efficiency level because more controls equate to less reliability and AC motors and ECMs fail at different rates. (Mark Strauch, No.123 at p. 1) DOE did not modify its lifetime assumptions because its assumptions rely on feedback from manufacturer interviews and CPWG feedback.
7. Discount Rates
In the calculation of LCC, DOE applies discount rates appropriate to residential and commercial purchasers to estimate the present value of future operating cost savings. The subsections below provide information on the derivation of the discount rates by sector.
a. Residential
DOE applies weighted average discount rates calculated from consumer debt and asset data, rather than marginal
( printed page 44502)
or implicit discount rates.[44]
The LCC analysis estimates net present value over the lifetime of the equipment, so the appropriate discount rate will reflect the general opportunity cost of household funds, taking this time scale into account. Given the long time-horizon modeled in the LCC, the application of a marginal interest rate associated with an initial source of funds is inaccurate. Regardless of the method of purchase, purchasers are expected to continue to rebalance their debt and asset holdings over the LCC analysis period, based on the restrictions purchasers face in their debt payment requirements and the relative size of the interest rates available on debts and assets. DOE estimates the aggregate impact of this rebalancing using the historical distribution of debts and assets.
To establish residential discount rates for the LCC analysis, DOE identified all relevant household debt or asset classes in order to approximate a consumer's opportunity cost of funds related to equipment energy cost savings. It estimated the average percentage shares of the various types of debt and equity by household income group using data from the Federal Reserve Board's triennial Survey of Consumer Finances [45]
(“SCF”) in 1995, 1998, 2001, 2004, 2007, 2010, 2013, 2016, and 2019. U.S. Board of Governors of the Federal Reserve System.
Survey of Consumer Finances.
1995, 1998, 2001, 2004, 2007, 2010, 2013, 2016, and 2019. (Last accessed August 1, 2023.)
https://www.federalreserve.gov/econresdata/scf/scfindex.htm.
Using the SCF and other sources, DOE developed a distribution of rates for each type of debt and asset by income group to represent the rates that may apply in the year in which new standards would take effect. DOE assigned each sample household a specific discount rate drawn from one of the distributions. The average rate across all types of household debt and equity and income groups, weighted by the shares of each type, is 3.9 percent. See chapter 8 of the final rule TSD for further details on the development of consumer discount rates.
b. Commercial
For commercial purchasers, DOE used the cost of capital to estimate the present value of cash flows to be derived from a typical company project or investment. Most companies use both debt and equity capital to fund investments, so the cost of capital is the weighted-average cost to the firm of equity and debt financing. This corporate finance approach is referred to as the weighted-average cost of capital. DOE used currently available economic data in developing commercial discount rates, with Damodaran Online being the primary data source.[46]
The average discount rate across the commercial building types is 6.9 percent.
See chapter 8 of the final rule TSD for further details on the development of discount rates.
8. Energy Efficiency Distribution in the No-New-Standards Case
To accurately estimate the share of purchasers that would be affected by a potential energy conservation standard at a particular efficiency level, DOE's LCC analysis considered the projected distribution (market shares) of equipment efficiencies under the no-new-standards case (
i.e.,
the case without new energy conservation standards).
To estimate the energy efficiency distribution of circulator pumps at the assumed compliance year (2028), DOE first analyzed detailed confidential manufacturer shipments data from 2015, broken down by efficiency level, circulator variety, and nominal horsepower. During the 2016 manufacturer interviews, DOE also collected aggregated historical circulator pump efficiency data from 2013 to 2015. Based on these data, DOE developed an efficiency trend between the year for which DOE had detailed data (2015) and the expected first year of compliance.[47]
According to CPWG feedback, DOE applied an efficiency trend from baseline (EL 0) circulator pumps to circulator pumps with ECMs (ELs 2-4). (Docket #0004, No. 78 at p. 6).
In the May 2021 RFI, DOE requested information on whether any changes in the circulator pump market since 2015 have affected the market efficiency distribution of circulator pumps. NEEA discussed their energy efficiency program for circulators since mid 2020 and the circulator sales data collected from circulator manufacturer representatives covering the entire Northwest at the start of 2020. NEEA stated that more than two-thirds of circulator pumps sold by participants in the Northwest are not equipped with ECM. NEEA stated that fewer than one-fifth of circulator pumps are equipped with speed control technology. (NEEA, No. 115 at pp. 2-3, 6) HI stated that small incremental growth is occurring for ECMs, but first cost is a barrier. (HI, No. 112 at p. 9-10) Grundfos suggested market changes have affected distribution of circulators since 2015 and DOE should use manufacturer and market interviews to update their dataset. (Grundfos, No. 113 at p. 9)
During the 2022 manufacturer interviews, DOE collected additional aggregated historical circulator pump efficiency data (ranging from 2016 to 2021). Based on these data, DOE retained the methodology described earlier, but updated the efficiency trend, which was used to project the no-standards-case efficiency distribution at the assumed compliance year (2028) and beyond. See chapter 8 of the final rule TSD for further information on the derivation of the efficiency distributions.
Following the December 2022 NOPR, in which DOE requested further comment on its approach and inputs to develop the no-new standards case efficiency distribution, HI commented that it agrees with DOE's approach and noted that markets are moving towards more controlled equipment. (HI, No. 135 at p. 5). DOE maintained the same methodology as in the December 2022 NOPR to develop the no-standards-case efficiency distribution in this final rule.
a. Assignment of Circulator Pump Efficiency to Sampled Consumers
While DOE expects economic factors to play a role when consumers, commercial building owners, or builders decide on what type of circulator pump to install, assignment of circulator pump efficiency for a given installation based solely on economic measures such as life-cycle cost or simple payback period would not fully and accurately reflect most real-world installations. There are a number of market failures discussed in the economics literature that illustrate how purchasing decisions with respect to
( printed page 44503)
energy efficiency are unlikely to be perfectly correlated with energy use, as described subsequently. DOE maintains that the method of assignment, which is in part random, is a reasonable approach. It simulates behavior in the circulator pump market, where market failures result in purchasing decisions not being perfectly aligned with economic interests. DOE further emphasizes that its approach does not assume that all purchasers of circulator pumps make economically irrational decisions (
i.e.,
the lack of a correlation is not the same as a negative correlation). As part of the random assignment, some homes or buildings with large heating loads will be assigned higher-efficiency circulator pumps, and some homes or buildings with particularly low heating loads will be assigned baseline circulator pumps, which aligns with the available data. By using this approach, DOE acknowledges the uncertainty inherent in the data and does not assume certain market conditions that are unsupported by the available evidence.
The following discussion provides more detail about the various market failures that affect circulator pump purchases. First, consumers are motivated by more than simple financial trade-offs. There are consumers who are willing to pay a premium for more energy-efficient products because they are environmentally conscious.[48]
Additionally, there are systematic market failures that are likely to contribute further complexity to how equipment is chosen by consumers. For example, in new construction, builders influence the type of circulator pumps used in many buildings but do not pay operating costs. Also, contractors install a large share of circulator pumps in replacement situations, and they can exert a high degree of influence over the type of circulator pump purchased. Furthermore, emergency replacements of essential equipment such as a circulator pump in the heating season are strongly biased toward like-for-like replacement (
i.e.,
replacing the non-functioning equipment with a similar or identical product). Time is a constraining factor during emergency replacements, and consumers may not consider the full range of available options on the market, despite their availability. The consideration of alternative equipment options is far more likely for planned replacements and installations in new construction.
There are market failures relevant to circulator pumps installed in commercial applications as well. It is often assumed that because commercial and industrial customers are businesses that have trained or experienced individuals making decisions regarding investments in cost-saving measures, some of the commonly observed market failures present in the general population of residential customers should not be as prevalent in a commercial setting. However, there are many characteristics of organizational structure and historic circumstance in commercial settings that can lead to underinvestment in energy efficiency.
First, a recognized problem in commercial settings is the split incentive problem, where the building owner (or building developer) selects the equipment, and the tenant (or subsequent building owner) pays for energy costs.[49 50]
There are other similarly misaligned incentives embedded in the organizational structure within a given firm or business that can impact the choice of a circulator pump. For example, if one department or individual within an organization is responsible for capital expenditures (and therefore equipment selection) while a separate department or individual is responsible for paying the energy bills, a market failure similar to the split-incentive problem can result.[51]
Additionally, managers may have other responsibilities and often have other incentives besides operating cost minimization, such as satisfying shareholder expectations, which can sometimes be focused on short-term returns.[52]
Decision-making related to commercial buildings is highly complex and involves gathering information from and for a variety of different market actors. It is common to see conflicting goals across various actors within the same organization, as well as information asymmetries between market actors in the energy efficiency context in commercial building construction.[53]
The arguments for the existence of market failures in the commercial and industrial sectors are corroborated by empirical evidence. One study in particular showed evidence of substantial gains in energy efficiency that could have been achieved without negative repercussions on profitability, but the investments had not been undertaken by firms.[54]
The study found that multiple organizational and institutional factors caused firms to require shorter payback periods and higher returns than the cost of capital for alternative investments of similar risk. Another study demonstrated similar results with firms requiring very short payback periods of 1-2 years in order to adopt energy-saving projects, implying hurdle rates of 50 to 100 percent, despite the potential economic benefits.[55]
The existence of market failures in the residential and commercial sectors is well supported by the economics literature and by a number of case studies. If DOE developed an efficiency distribution that assigned circulator pump efficiency in the no-new-standards case solely according to energy use or economic considerations such as life-cycle cost or payback period, the resulting distribution of efficiencies within the building sample would not reflect any of the market failures or behavioral factors above. Thus, DOE concludes such a distribution would not be representative of the circulator pump market.
9. Payback Period Analysis
The payback period is the amount of time (expressed in years) it takes the consumer to recover the additional installed cost of more-efficient equipment, compared to baseline equipment, through energy cost savings. Payback periods that exceed the life of
( printed page 44504)
the equipment mean that the increased total installed cost is not recovered in reduced operating expenses.
The inputs to the PBP calculation for each efficiency level are the change in total installed cost of the equipment and the change in the first-year annual operating expenditures relative to the baseline. DOE refers to this as a “simple PBP” because it does not consider changes over time in operating cost savings. The PBP calculation uses the same inputs as the LCC analysis when deriving first-year operating costs.
As noted previously, EPCA establishes a rebuttable presumption that a standard is economically justified if the Secretary finds that the additional cost to the consumer of purchasing an equipment complying with an energy conservation standard level will be less than three times the value of the first year's energy savings resulting from the standard, as calculated under the applicable test procedure. (42 U.S.C. 6295(o)(2)(B)(iii)) For each considered efficiency level, DOE determined the value of the first year's energy savings by calculating the energy savings in accordance with the applicable DOE test procedure, and multiplying those savings by the average energy price projection for the year in which compliance with the new standards would be required.
G. Shipments Analysis
DOE uses projections of annual equipment shipments to calculate the national impacts of potential new energy conservation standards on energy use, NPV, and future manufacturer cash flows.[56]
The shipments model takes an accounting approach, tracking market shares of each equipment class and the vintage of units in the stock. Stock accounting uses equipment shipments as inputs to estimate the age distribution of in-service equipment stocks for all years. The age distribution of in-service equipment stocks is a key input to calculations of both the NES and NPV, because operating costs for any year depend on the age distribution of the stock.
In the accounting approach, shipments are the result either of demand for the replacement of existing equipment, or of demand for equipment from new commercial and residential construction. Replacements in any projection year are based on (a) shipments in prior years, and (b) the lifetime of previously shipped equipment. Demand for new equipment is based on the rate of increase in commercial floor space (in the commercial sector), and residential housing (in the residential sector). In each year of shipments projections, retiring equipment is removed from a record of existing stock, and new shipments are added. DOE accounts for demand lost to demolitions (
i.e.
loss of circulator pumps that will not be replaced) by assuming that a small fraction of stock is retired without being replaced in each year, based on a derived demolition rate for each sector.
DOE collected confidential historical shipments data for the period 2013-2021 from manufacturer interviews held in 2016 (during the CPWG) and 2022. Shipments data provided by manufacturers were broken down by circulator variety, nominal horsepower rating, and efficiency. Table IV.13 presents historical circulator pumps shipments. Note that due to confidentiality concerns, DOE is only able to present aggregated circulator pump shipments.
1. No-New-Standards Case Shipments Projections
The no-new-standards case shipments projections are an estimate of how much of each equipment type would be shipped in the absence of any new standard. DOE projected shipments in the no-new-standards case by circulator pump variety (CP1, CP2, and CP3) as well as sector (residential and commercial) and application (hydronic heating and hot water recirculation).
In the no-new-standards case, DOE assumes that demand for new installations would be met by CP1 circulator pumps alone. New demand is based on AEO 2023 projections of commercial floorspace and new construction (for demand to the commercial sector), and projections of residential housing stock and starts (for demand to the residential sector).
HI commented that DOE should consider the impact of legislation and increased demand of heat pumps and their impact on circulator pump shipments. (HI, No.135 at p. 5) While DOE is not able to explicitly estimate the effect of recent legislation incentivizing heat pump adoption, DOE assumes that over time, a decreasing amount of demand for equipment in the hydronic heating application is met by circulator pumps. For each year in the shipments projection period (2022-2057), DOE estimates a 6 percent year-over-year reduction of new demand penetration for circulator pumps in the hydronic heating application. This estimate is based on a trendline fit from available Census data on new heating systems.[57]
See Chapter 9 of the final rule TSD for more details on this analysis.
DOE assumed that demand for replacements would be met by circulator pumps of the same variety (
e.g.,
CP2 only replaced by CP2) in each
( printed page 44505)
sector and application, according to manufacturer feedback.[58]
After calculating retirements of existing pumps based on those previously shipped and equipment lifetimes, DOE assumes that some of this quantity will not be replaced due to demolition. DOE estimates the demolition rate of existing equipment stock by using the AEO 2023 projections of new commercial floorspace and floorspace growth in the commercial sector, and new housing starts and housing stock in the residential sector.
2. Standards-Case Shipment Projections
The standards-case shipments projections account for the effects of potential standards on shipments. DOE assumed a “roll-up” scenario to estimate standards-case shipments, wherein the no-new-standards-case shipments that would be below the minimum qualifying efficiency level prescribed by a standard beginning in the assumed compliance year (2028) are “rolled up” (
i.e.,
added to) to the minimum qualifying equipment efficiency level at that standard level.
HI did not provide any further suggestions beyond the approach proposed by DOE. (HI, No.135 at p. 5). See chapter 9 of the final rule TSD for details on the shipments analysis.
H. National Impact Analysis
The NIA assesses the national energy savings (“NES”) and the NPV from a national perspective of total consumer costs and savings that would be expected to result from new standards at specific efficiency levels.[59]
(“Consumer” in this context refers to purchasers of the equipment being regulated.) DOE calculates the NES and NPV for the potential standard levels considered based on projections of annual equipment shipments, along with the annual energy consumption and total installed cost data from the energy use and LCC analyses. For the present analysis, DOE projected the energy savings, operating cost savings, equipment costs, and NPV of consumer benefits over the lifetime of circulator pumps sold from 2028 through 2057.
DOE evaluates the impacts of new standards by comparing a case without such standards with standards-case projections. The no-new-standards case characterizes energy use and consumer costs for each equipment class in the absence of new energy conservation standards. For this projection, DOE considers historical trends in efficiency and various forces that are likely to affect the mix of efficiencies over time. DOE compares the no-new-standards case with projections characterizing the market for each equipment class if DOE adopted new standards at specific energy efficiency levels (
i.e.,
the TSLs or standards cases) for that class. For the standards cases, DOE considers how a given standard would likely affect the market shares of equipment with efficiencies greater than the standard.
DOE provides a spreadsheet model to calculate the energy savings and the national consumer costs and savings from each TSL. Interested parties can review DOE's analyses by changing various input quantities within the spreadsheet. The NIA spreadsheet model uses typical values (as opposed to probability distributions) as inputs.
Table IV.14 summarizes the inputs and methods DOE used for the NIA analysis for the final rule. Discussion of these inputs and methods follows the table. See chapter 10 of the final rule TSD for further details.
1. Equipment Efficiency Trends
A key component of the NIA is the trend in energy efficiency projected for the no-new-standards case and each of the standards cases. Section IV.F.8 of this document describes how DOE developed an energy efficiency distribution for the no-new-standards case (which yields a shipment-weighted average efficiency) for each of the considered equipment classes for the year of anticipated compliance with an new standard. To project the trend in efficiency absent new standards for circulator pumps over the entire shipments projection period, DOE followed the approach discussed in section IV.F.8 of this document. The approach is further described in chapter 8 of the final rule TSD.
For the standards cases, DOE used a “roll-up” scenario to establish the shipment-weighted efficiency for the year that standards are assumed to
( printed page 44506)
become effective (2028). In this scenario, the market shares of equipment in the no-new-standards case that do not meet the standard under consideration would “roll up” to meet the new standard level, and the market share of equipment above the standard would remain unchanged.
The CA IOUs commented that they expect accelerated adoption of circulator pumps with variable speed controls following a standard at TSL 2 and strongly encouraged DOE to collaborate with stakeholders monitoring these trends to better inform the LCC and NIA analyses and associated savings from EL 3 and EL 4 circulator pumps. (CA IOUs, No.133 at p. 4) In response, DOE notes that based on manufacturer-provided data, DOE estimates an efficiency trend from baseline (EL 0) or EL 1 circulator pumps to ELs 2 through 4 in the absence of standards (see section F.8 of this document and chapter 8 of the final rule TSD for details). In the standards case, while it is possible that a higher percentage of purchasers and applications may shift to circulator pumps with variable speed control (
i.e.,
ELs 3 and 4), DOE does not have the data (
e.g.,
historical price and efficiency data) to estimate that trend, therefore, consistent with the NOPR analysis, it assumes a roll-up scenario in this final rule.
2. National Energy Savings
The national energy savings analysis involves a comparison of national energy consumption of the considered equipment between each potential standards case (“TSL”) and the case with no new energy conservation standards. DOE calculated the national energy consumption by multiplying the number of units (stock) of each equipment (by vintage or age) by the unit energy consumption (also by vintage). DOE calculated annual NES based on the difference in national energy consumption for the no-new-standards case and for each higher efficiency standard case. DOE estimated energy consumption and savings based on site energy and converted the electricity consumption and savings to primary energy (
i.e.,
the energy consumed by power plants to generate site electricity) using annual conversion factors derived from
AEO2023.
Cumulative energy savings are the sum of the NES for each year over the timeframe of the analysis.
Use of higher-efficiency equipment is sometimes associated with a direct rebound effect, which refers to an increase in utilization of the equipment due to the increase in efficiency. DOE did not find any data on the rebound effect specific to circulator pumps [60]
and requested comment on its assumption of 0 rebound effect in the NOPR issued in 2021. DOE requested a comment specifically for circulator pumps, including the magnitude of any rebound effect and data sources specific to circulator pumps. In response, HI commented that it agrees with DOE's assumed negligible rebound effect. (HI, No.135 at p. 5)
In 2011, in response to the recommendations of a committee on “Point-of-Use and Full-Fuel-Cycle Measurement Approaches to Energy Efficiency Standards” appointed by the National Academy of Sciences, DOE announced its intention to use FFC measures of energy use and greenhouse gas and other emissions in the national impact analyses and emissions analyses included in future energy conservation standards rulemakings. 76 FR 51281 (Aug. 18, 2011). After evaluating the approaches discussed in the August 18, 2011 notice, DOE published a statement of amended policy in which DOE explained its determination that EIA's National Energy Modeling System (“NEMS”) is the most appropriate tool for its FFC analysis and its intention to use NEMS for that purpose. 77 FR 49701 (Aug. 17, 2012). NEMS is a public domain, multi-sector, partial equilibrium model of the U.S. energy sector [61]
that EIA uses to prepare its
Annual Energy Outlook.
The FFC factors incorporate losses in production and delivery in the case of natural gas (including fugitive emissions) and additional energy used to produce and deliver the various fuels used by power plants. The approach used for deriving FFC measures of energy use and emissions is described in appendix 10B of the final rule TSD.
3. Net Present Value Analysis
The inputs for determining the NPV of the total costs and benefits experienced by purchasers are (1) total annual installed cost, (2) total annual operating costs (energy costs and repair and maintenance costs), and (3) a discount factor to calculate the present value of costs and savings. DOE calculates net savings each year as the difference between the no-new-standards case and each standards case in terms of total savings in operating costs versus total increases in installed costs. DOE calculates operating cost savings over the lifetime of each equipment shipped during the projection period.
Due to lack of historical price data and uncertainty on the factors that may affect future circulator pump prices, DOE assumed a constant price (in $2022) when estimating circulator pump prices in future years. However, as discussed in section IV.F.1 of this document, DOE developed a sensitivity analysis to account for the effect of potential future price declines of electronic components in circulator pumps with ECMs. See appendix 10C of the final rule TSD for the results of this sensitivity analysis.
The operating cost savings are energy cost savings and costs associated with repair and maintenance, which are calculated using the estimated operating cost savings in each year and the projected price of the appropriate form of energy. The energy cost savings are calculated using the estimated energy savings in each year and the projected price of the appropriate form of energy. To estimate energy prices in future years, DOE multiplied the average regional energy prices by the projection of annual national-average residential energy price changes in the Reference case from
AEO2023,
which has an end year of 2050. To estimate price trends after 2050, the 2050 price was used for all years. As part of the NIA, DOE also analyzed scenarios that used inputs from variants of the
AEO2023
Reference case that have lower and higher economic growth. Those cases have lower and higher energy price trends compared to the Reference case. NIA results based on these cases are presented in appendix10C of the final rule TSD.
In calculating the NPV, DOE multiplies the net savings in future years by a discount factor to determine their present value. For this final rule, DOE estimated the NPV of consumer benefits using both a 3-percent and a 7-percent real discount rate. DOE uses these discount rates in accordance with guidance provided by the Office of Management and Budget (“OMB”) to Federal agencies on the development of regulatory analysis.[62]
The discount rates for the determination of NPV are in contrast to the discount rates used in the
( printed page 44507)
LCC analysis, which are designed to reflect a consumer's perspective. The 7-percent real value is an estimate of the average before-tax rate of return to private capital in the U.S. economy. The 3-percent real value represents the “social rate of time preference,” which is the rate at which society discounts future consumption flows to their present value.
I. Consumer Subgroup Analysis
In analyzing the potential impact of new energy conservation standards on purchasers, DOE evaluates the impact on identifiable subgroups of purchasers that may be disproportionately affected by a new national standard. The purpose of a subgroup analysis is to determine the extent of any such disproportional impacts. DOE evaluates impacts on particular subgroups of purchasers by analyzing the LCC impacts and PBP for those particular purchasers from alternative standard levels. For this final rule, due to the high fraction of consumers utilizing circulator pumps in the residential sector, DOE analyzed the impacts of the considered standard levels on one subgroup:
i.e.,
senior-only households. The analysis used subsets of the RECS 2015 sample composed of households that meet the criteria for the considered subgroups. DOE used the LCC and PBP spreadsheet model to estimate the impacts of the considered efficiency levels on these subgroups. Chapter 11 in the final rule TSD describes the consumer subgroup analysis.
In the December 2022 NOPR, NYSERDA commented that DOE should consider including high-rise multifamily buildings in the subgroup analysis for subsequent rulemakings because they are likely to experience higher operating hours, especially for the HWR application. (NYSERDA, No.130 at p. 4)
DOE notes the primary purpose of a subgroup analysis is to investigate whether a subsection of purchasers would be negatively impacted by standards. If high-rise multifamily buildings are expected to experience higher operating hours than the general purchaser population, then they will incur larger and more positive benefits from standards, rendering a subgroup analysis of these purchasers unnecessary.
J. Manufacturer Impact Analysis
1. Overview
DOE performed an MIA to estimate the financial impacts of new energy conservation standards on manufacturers of circulator pumps and to estimate the potential impacts of such standards on employment and manufacturing capacity. The MIA has both quantitative and qualitative aspects and includes analyses of projected industry cash flows, the INPV, investments in research and development (“R&D”) and manufacturing capital, and domestic manufacturing employment. Additionally, the MIA seeks to determine how new energy conservation standards might affect manufacturing employment, capacity, and competition, as well as how standards contribute to overall regulatory burden. Finally, the MIA serves to identify any disproportionate impacts on manufacturer subgroups, including small business manufacturers.
The quantitative part of the MIA primarily relies on the Government Regulatory Impact Model (“GRIM”), an industry cash flow model with inputs specific to this rulemaking. The key GRIM inputs include data on the industry cost structure, unit production costs, equipment shipments, manufacturer markups, and investments in R&D and manufacturing capital required to produce compliant equipment. The key GRIM outputs are the INPV, which is the sum of industry annual cash flows over the analysis period, discounted using the industry-weighted average cost of capital, and the impact on domestic manufacturing employment. The model uses standard accounting principles to estimate the impacts of more-stringent energy conservation standards on a given industry by comparing changes in INPV and domestic manufacturing employment between a no-new-standards case and the various standards cases (
i.e.,
TSLs). To capture the uncertainty relating to manufacturer pricing strategies following new standards, the GRIM estimates a range of possible impacts under different manufacturer markup scenarios.
The qualitative part of the MIA addresses manufacturer characteristics and market trends. Specifically, the MIA considers such factors as a potential standard's impact on manufacturing capacity, competition within the industry, the cumulative impact of other DOE and non-DOE regulations, and impacts on manufacturer subgroups. The complete MIA is outlined in chapter 12 of the final rule TSD.
DOE conducted the MIA for this rulemaking in three phases. In Phase 1 of the MIA, DOE prepared a profile of the circulator pump manufacturing industry based on the market and technology assessment, preliminary manufacturer interviews, and publicly available information. This included a top-down analysis of circulator pump manufacturers that DOE used to derive preliminary financial inputs for the GRIM (
e.g.,
revenues; materials, labor, overhead, and depreciation expenses; selling, general, and administrative expenses (“SG&A”); and R&D expenses). DOE also used public sources of information to further calibrate its initial characterization of the circulator pump manufacturing industry, including company filings of form 10-K from the SEC,[63]
corporate annual reports, the U.S. Census Bureau's “Economic Census,” [64]
and reports from D&B Hoovers.[65]
In Phase 2 of the MIA, DOE prepared a framework industry cash-flow analysis to quantify the potential impacts of new energy conservation standards. The GRIM uses several factors to determine a series of annual cash flows starting with the announcement of the standard and extending over a 30-year period following the compliance date of the standards. These factors include annual expected revenues, costs of sales, SG&A and R&D expenses, taxes, and capital expenditures. In general, energy conservation standards can affect manufacturer cash flow in three distinct ways: (1) creating a need for increased investment, (2) raising production costs per unit, and (3) altering revenue due to higher per-unit prices and changes in sales volumes.
In addition, during Phase 2, DOE developed interview guides to distribute to manufacturers of circulator pumps in order to develop other key GRIM inputs, including product and capital conversion costs, and to gather additional information on the anticipated effects of energy conservation standards on revenues, direct employment, capital assets, industry competitiveness, and subgroup impacts.
In Phase 3 of the MIA, DOE conducted structured, detailed interviews with representative manufacturers. During these interviews, DOE discussed engineering, manufacturing, procurement, and financial topics to validate assumptions used in the GRIM and to identify key issues or concerns. As part of Phase 3, DOE also evaluated subgroups of manufacturers that may be disproportionately impacted by new standards or that may not be accurately represented by the average cost assumptions used to develop the
( printed page 44508)
industry cash-flow analysis. Such manufacturer subgroups may include small business manufacturers, low-volume manufacturers, niche players, and/or manufacturers exhibiting a cost structure that largely differs from the industry average. DOE identified one subgroup for a separate impact analysis: small business manufacturers. The small business subgroup is discussed in section VI.B, “Review under the Regulatory Flexibility Act” and in chapter 12 of the final rule TSD.
2. Government Regulatory Impact Model and Key Inputs
DOE uses the GRIM to quantify the changes in cash flow due to new standards that result in a higher or lower industry value. The GRIM uses a standard, annual discounted cash-flow analysis that incorporates manufacturer costs, markups, shipments, and industry financial information as inputs. The GRIM model changes in costs, distribution of shipments, investments, and manufacturer margins that could result from new energy conservation standards. The GRIM spreadsheet uses the inputs to arrive at a series of annual cash flows, beginning in 2024 (the base year of the analysis) and continuing to 2057. DOE calculated INPVs by summing the stream of annual discounted cash flows during this period. For manufacturers of circulator pumps, DOE used a real discount rate of 9.6 percent, which was derived from industry financials and then modified according to feedback received during manufacturer interviews.
The GRIM calculates cash flows using standard accounting principles and compares changes in INPV between the no-new-standards case and each standards case. The difference in INPV between the no-new-standards case and a standards case represents the financial impact of new energy conservation standards on manufacturers. As discussed previously, DOE developed critical GRIM inputs using a number of sources, including publicly available data, results of the engineering analysis, information gathered from industry stakeholders during the course of manufacturer interviews, and subsequent Working Group meetings. The GRIM results are presented in section V.B.2 of this document. Additional details about the GRIM, the discount rate, and other financial parameters can be found in chapter 12 of the final rule TSD.
a. Manufacturer Production Costs
Manufacturing more efficient equipment is typically more expensive than manufacturing baseline equipment due to the use of more complex components, which are typically more costly than baseline components. The changes in the MPCs of covered equipment can affect the revenues, gross margins, and cash flow of the industry. MPCs were derived in the engineering analysis using methods discussed in section IV.C.3 of this document.
For a complete description of the MPCs,
see
chapter 5 of the final rule TSD.
b. Shipments Projections
The GRIM estimates manufacturer revenues based on total unit shipment projections and the distribution of those shipments by efficiency level. Changes in sales volumes and efficiency mix over time can significantly affect manufacturer finances. For this analysis, the GRIM uses the NIA's annual shipment projections derived from the shipments analysis from 2024 (the base year) to 2057 (the end year of the analysis period).
See
chapter 9 of the final rule TSD for additional details.
c. Product and Capital Conversion Costs
New energy conservation standards could cause manufacturers to incur conversion costs to bring their production facilities and equipment designs into compliance. DOE evaluated the level of conversion-related expenditures that would be needed to comply with each considered efficiency level in each equipment class. For the MIA, DOE classified these conversion costs into two major groups: (1) product conversion costs; and (2) capital conversion costs. Product conversion costs are investments in research, development, testing, marketing, and other non-capitalized costs necessary to make equipment designs comply with new energy conservation standards. Capital conversion costs are investments in property, plant, and equipment necessary to adapt or change existing production facilities such that new compliant equipment designs can be fabricated and assembled.
To evaluate the level of product conversion costs manufacturers would likely incur to comply with new energy conservation standards, DOE estimated the number of basic models that manufacturers would have to re-design to move their equipment lines to each incremental efficiency level. DOE developed the product conversion costs by estimating the amount of labor per basic model manufacturers would need for research and development to raise the efficiency of models to each incremental efficiency level. DOE anticipates that manufacturer basic model counts would decrease with use of ECMs due to the greater range of applications served by one ECM as opposed to an induction motor. DOE also assumed manufacturers would incur testing costs to establish certified ratings using DOE's test procedure for circulator pumps and applying DOE's statistical sampling plans to assess compliance.
For circulator pumps, DOE estimated that the re-design effort varies by efficiency level. At EL 1, DOE anticipates a minor redesign effort as manufacturers increase their breadth of offerings to meet standards at this level. DOE estimated a redesign effort of 18 months of engineering labor and 9 months of technician labor per model at this level. At EL 2, DOE anticipates manufacturers to integrate ECMs into their circulator pumps. This requires a significant amount of re-design as manufacturers transition from legacy AC induction motors to ECMs. DOE estimated a redesign effort of 35 months of engineering labor and 18 months of technician labor per model. At EL 3 and EL 4, DOE anticipates manufacturers to incur additional control board redesign costs as manufacturers add controls (
e.g.,
proportional pressure controls). DOE estimated a redesign effort of 54 months of engineering labor and 35 months of technician labor per model at EL 3. DOE estimated a redesign effort of 54 months of engineering labor and 54 months of technician labor per model at EL 4.
To evaluate the level of capital conversion costs manufacturers would likely incur to comply with new energy conservation standards, DOE used information derived from the engineering analysis, shipments analysis, and manufacturer interviews. DOE used the information to estimate the additional investments in property, plant, and equipment that are necessary to meet energy conservation standards. In the engineering analysis evaluation of higher efficiency equipment from leading manufacturers of circulator pumps, DOE found a range of designs and manufacturing approaches. DOE attempted to account for both the range of manufacturing pathways and the current efficiency distribution of shipments in the modeling of industry capital conversion costs.
For all circulator pump varieties, DOE estimates that capital conversion costs are driven by the cost for industry to expand production capacity at efficiency levels requiring use of an ECM (
i.e.,
EL 2, EL 3, and EL 4). DOE anticipates capital investments to be similar among EL 2 through EL 4 as circulator pump controls are likely to be used to increase a circulator pump
( printed page 44509)
beyond EL 2, and pump controls do not require additional capital investments. At all ELs, DOE anticipates manufacturers will incur costs to expand production capacity of more efficient equipment.
For CP1 type circulator pumps, DOE anticipates manufacturers would choose to assemble ECMs in-house. As such, the capital conversion cost estimates for CP1-type circulator pumps include, but were not limited to, capital investments in welding and bobbin tooling, magnetizers, winders, lamination dies, testing equipment, and additional manufacturing floor-space requirements.
For CP2 and CP3 type circulator pumps, DOE anticipates manufacturers would purchase ECMs as opposed to assembling in-house. As such, DOE estimated that the design changes to produce circulator pumps with ECMs would be driven by purchased parts (
i.e.,
ECMs). The capital conversion costs for these variety of circulator pumps are based on additional manufacturing floor space requirements to expand manufacturing capacity of ECMs.
During the NOPR public meeting, Taco requested that DOE provide an estimate on the number of models that are assumed to be redesigned for each EL. (Taco, Inc., Public Meeting Transcript, No. 129 at pp. 69-70) Table IV.15 displays the number of circulator pump models that would be redesigned and introduced into the market at each efficiency level.
HI and Xylem commented on the December 2022 NOPR that the investments DOE estimated in the December 2022 NOPR required to comply with standards set at TSL 2, TSL 3, and TSL 4, would be substantial investments given the size of and total free cash flow available to most circulator pump manufacturers. (HI, No. 135 at pp. 3-5; Xylem, No. 136 at p. 4) HI and Xylem continued by stating that requiring manufacturers to make these investments in a 2-year compliance period and the current market's supply chain issues increases the conversion cost impacts on the manufacturers. (
Id.
) Additionally, HI and Xylem commented that considering lead times for materials and components, it is not possible to invest the amount required to comply with TSL 2 efficiently within the 2-year compliance period.[66]
(
Id.) HI and Xylem recommended that DOE have a 4-year compliance period, which was the compliance period agreed to by the CPWG. (
Id.) As discussed in section III.H of this document, DOE is establishing a 4-year compliance date for energy conservation standards for circulator pumps. DOE interprets HI's comment regarding conversion cost impact to manufacturers' will be mitigated if a 4-year compliance date is adopted.
HI and Xylem also commented that it would be difficult for companies to introduce a circulator pump into the market that has a CEI right at 1.0 and have it be competitive in the market. (HI, No. 135 at pp. 3-5; Xylem, No. 136 at p. 4) Therefore, HI and Xylem state that the DOE NOPR analysis of TSL 2, which only looks at the costs associated with making circulator pumps that are minimally compliant with TSL 2 (
i.e.,
comply with standards set at TSL 2 but would not meet efficiency levels associated with TSL 3) is not accurate. (
Id.) HI and Xylem stated that the market realities are that new circulators need to be designed to successfully compete in the market as well, which will require an investment much closer to the impacts (cost & time) which DOE has associated with TSL 3. (
Id.) As described in section IV.G.2 of this document, the shipments analysis models a “roll-up” scenario to estimate standards-case shipments. In this scenario, the shipments in the no-new-standards-case that would be below the minimum qualifying efficiency level prescribed by standards are “rolled up” (
i.e.,
added to) to the minimum qualifying equipment efficiency level at that standard level. DOE disagrees that there would not be a market for minimally qualifying circulator pumps at any of the analyzed TSLs. As displayed in Table IV.4 through Table IV.7, MPCs increase at higher efficiency levels, which results in more expensive end-user prices at higher efficiency levels. DOE estimates that approximately 70 percent of circulator pump shipments currently sold into the U.S. market are at baseline or EL 1 (which are the least expensive circulator pumps on the market). HI additionally stated that while small incremental growth is occurring for ECMs (circulator pumps with ECMs typically are at EL 2, EL 3, or EL 4) first cost is a barrier for customers. (HI, No. 112 at pp. 9-10) DOE agrees that the initial purchase price prevents some customers from purchasing more efficient and expensive circulator pumps. Therefore, DOE modeled a shipment scenario that has customers continuing to purchase the minimally complaint circulator pumps (which would also be the least expensive circulator pumps) after compliance with each analyzed energy conservation standard.
HI and Xylem also commented that capital investment will increase going from EL 2 to EL 4. (
Id.) HI commented that EL 3 and EL 4 circulator pumps are more complex equipment that will require additional investment in programing and testing infrastructure, and additional manufacturing tooling for EL 4 beyond what is required at EL 3 to simulate the external input signals during manufacturing testing. (
Id.
) DOE agrees that EL 3 and EL 4 will require additional programing and testing and has included those additional costs in the product conversion costs shown in Table IV.16 as these programing and testing costs are non-capitalized costs and should be included in product conversion costs and not capital conversion costs.[67]
Therefore, DOE has included these additional investments required to comply with EL 3 and EL 4.
In general, DOE assumes all conversion-related investments occur between the date of publication of this final rule and the year by which manufacturers must comply with the new standards. The conversion cost figures used in the GRIM can be found in Table IV.16 and in section V.B.2.a of this document. For additional information on the estimated capital
( printed page 44510)
and product conversion costs,
see
chapter 12 of the final rule TSD.
d. Manufacturer Markup Scenarios
MSPs include direct manufacturing production costs (
i.e.,
labor, materials, and overhead estimated in DOE's MPCs) and all non-production costs (
i.e.,
SG&A, R&D, and interest), along with profit. To calculate the MSPs in the GRIM, DOE applied non-production cost markups to the MPCs estimated in the engineering analysis for each equipment class and efficiency level. Modifying these markups in the standards case yields different sets of impacts on manufacturers. For the MIA, DOE modeled two standards-case manufacturer markup scenarios to represent uncertainty regarding the potential impacts on prices and profitability for manufacturers following the implementation of new energy conservation standards: (1) a preservation of gross margin scenario and (2) a preservation of operating profit scenario. These scenarios lead to different manufacturer markup values that, when applied to the MPCs, result in varying revenue and cash flow impacts.
Under the preservation of gross margin scenario, DOE applied a single uniform “gross margin percentage” across all efficiency levels, which assumes that manufacturers would be able to maintain the same amount of profit as a percentage of revenues at all efficiency levels within an equipment class. As MPCs increase with efficiency, this scenario implies that the absolute dollar markup will increase. This is the manufacturer markup scenario that is used in all consumer analyses (
e.g.,
LCC, NIA,
etc.).
To estimate the average manufacturer markup used in the preservation of gross margin scenario, DOE analyzed publicly available financial information for manufacturers of circulator pumps. DOE then requested feedback on its initial manufacturer markup estimates during manufacturer interviews. Based on manufacturer interviews, DOE revised the initial manufacturer markups that were used in December 2022 NOPR. DOE did not receive any comments on the manufacturer markups presented in the December 2022 NOPR. Therefore, DOE continues to use the same manufacturer markups in this final rule analysis that were used in the December 2022 NOPR. Table IV.17 presents the manufacturers markups used in this final rule analysis for the no-new-standards case and the preservation of gross margin scenario standards cases. These markups capture all non-production costs, including SG&A expenses, R&D expenses, interest expenses, and profit.
Under the preservation of operating profit scenario, DOE modeled a situation in which manufacturers are not able to increase per-unit operating profit in proportion to increases in MPCs. In this scenario, manufacturer markups are set so that operating profit one year after the compliance date of energy conservation standards is the same as in the no-new-standards case on a per-unit basis. In other words, manufacturers are not able to garner additional operating profit from the higher MPCs and the investments that are required to comply with the energy conservation standards. However, manufacturers are able to maintain the same per-unit operating profit in the standards case that was earned in the no-new-standards case. Therefore, operating margin in percentage terms is reduced between the no-new-standards case and standards case.
A comparison of industry financial impacts under the two manufacturer markup scenarios is presented in section V.B.2.a of this document.
K. Emissions Analysis
The emissions analysis consists of two components. The first component estimates the effect of potential energy conservation standards on power sector and site (where applicable) combustion emissions of CO2, NOX, SO2, and Hg. The second component estimates the impacts of potential standards on emissions of two additional greenhouse gases, CH4
and N2
O, as well as the reductions in emissions of other gases due to “upstream” activities in the fuel production chain. These upstream activities comprise extraction, processing, and transporting fuels to the site of combustion.
The analysis of electric power sector emissions of CO2, NOX, SO2, and Hg uses emissions intended to represent the marginal impacts of the change in electricity consumption associated with new standards. The methodology is based on results published for the
AEO,
including a set of side cases that implement a variety of efficiency-related policies. The methodology is described in appendix 13A in the final rule TSD. The analysis presented in this notice uses projections from
AEO2023.
Power sector emissions of CH4
and N2
O from fuel combustion are estimated using Emission Factors for Greenhouse Gas Inventories published by the Environmental Protection Agency (EPA).[68]
( printed page 44511)
FFC upstream emissions, which include emissions from fuel combustion during extraction, processing, and transportation of fuels, and “fugitive” emissions (direct leakage to the atmosphere) of CH4
and CO2, are estimated based on the methodology described in chapter 15 of the final rule TSD.
The emissions intensity factors are expressed in terms of physical units per MWh or MMBtu of site energy savings. For power sector emissions, specific emissions intensity factors are calculated by sector and end use. Total emissions reductions are estimated using the energy savings calculated in the national impact analysis.
1. Air Quality Regulations Incorporated in DOE's Analysis
DOE's no-new-standards case for the electric power sector reflects the
AEO,
which incorporates the projected impacts of existing air quality regulations on emissions.
AEO2023
reflects, to the extent possible, laws and regulations adopted through mid-November 2022, including the emissions control programs discussed in the following paragraphs the emissions control programs discussed in the following paragraphs, and the Inflation Reduction Act.[69]
SO2
emissions from affected electric generating units (“EGUs”) are subject to nationwide and regional emissions cap-and-trade programs. Title IV of the Clean Air Act sets an annual emissions cap on SO2
for affected EGUs in the 48 contiguous States and the District of Columbia (“DC”). (42 U.S.C. 7651et seq.
) SO2
emissions from numerous States in the eastern half of the United States are also limited under the Cross-State Air Pollution Rule (“CSAPR”). 76 FR 48208 (Aug. 8, 2011). CSAPR requires these States to reduce certain emissions, including annual SO2
emissions, and went into effect as of January 1, 2015.[70]
The
AEO
incorporates implementation of CSAPR, including the update to the CSAPR ozone season program emission budgets and target dates issued in 2016. 81 FR 74504 (Oct. 26, 2016). Compliance with CSAPR is flexible among EGUs and is enforced through the use of tradable emissions allowances. Under existing EPA regulations, for states subject to SO2
emissions limits under CSAPR, any excess SO2
emissions allowances resulting from the lower electricity demand caused by the adoption of an efficiency standard could be used to permit offsetting increases in SO2
emissions by another regulated EGU.
However, beginning in 2016, SO2
emissions began to fall as a result of the Mercury and Air Toxics Standards (“MATS”) for power plants.[71] 77 FR 9304 (Feb. 16, 2012). The final rule establishes power plant emission standards for mercury, acid gases, and non-mercury metallic toxic pollutants. Because of the emissions reductions under the MATS, it is unlikely that excess SO2
emissions allowances resulting from the lower electricity demand would be needed or used to permit offsetting increases in SO2
emissions by another regulated EGU. Therefore, energy conservation standards that decrease electricity generation will generally reduce SO2
emissions. DOE estimated SO2
emissions reduction using emissions factors based on
AEO2023.
CSAPR also established limits on NOX
emissions for numerous States in the eastern half of the United States. Energy conservation standards would have little effect on NOX
emissions in those States covered by CSAPR emissions limits if excess NOX
emissions allowances resulting from the lower electricity demand could be used to permit offsetting increases in NOX
emissions from other EGUs. In such case, NOX
emissions would remain near the limit even if electricity generation goes down. Depending on the configuration of the power sector in the different regions and the need for allowances, however, NOX
emissions might not remain at the limit in the case of lower electricity demand. That would mean that standards might reduce NOX
emissions in covered States. Despite this possibility, DOE has chosen to be conservative in its analysis and has maintained the assumption that standards will not reduce NOX
emissions in States covered by CSAPR. Standards would be expected to reduce NOX
emissions in the States not covered by CSAPR. DOE used
AEO2023
data to derive NOX
emissions factors for the group of States not covered by CSAPR.
The MATS limit mercury emissions from power plants, but they do not include emissions caps and, as such, DOE's energy conservation standards would be expected to slightly reduce Hg emissions. DOE estimated mercury emissions reduction using emissions factors based on
AEO2023,
which incorporates the MATS.
L. Monetizing Emissions Impacts
As part of the development of this final rule, for the purpose of complying with the requirements of Executive Order 12866, DOE considered the estimated monetary benefits from the reduced emissions of CO2, CH4, N2
O, NOX, and SO2
that are expected to result from each of the TSLs considered. In order to make this calculation analogous to the calculation of the NPV of consumer benefit, DOE considered the reduced emissions expected to result over the lifetime of equipment shipped in the projection period for each TSL. This section summarizes the basis for the values used for monetizing the emissions benefits and presents the values considered in this final rule.
To monetize the benefits of reducing GHG emissions, this analysis uses the interim estimates presented in the
Technical Support Document: Social Cost of Carbon, Methane, and Nitrous Oxide Interim Estimates Under Executive Order 13990
published in February 2021 by the IWG.
1. Monetization of Greenhouse Gas Emissions
DOE estimates the monetized benefits of the reductions in emissions of CO2, CH4, and N2
O by using a measure of the SC of each pollutant (
e.g.,
SC-CO2). These estimates represent the monetary value of the net harm to society associated with a marginal increase in emissions of these pollutants in a given year, or the benefit of avoiding that increase. These estimates are intended to include (but are not limited to) climate-change-related changes in net agricultural productivity, human health, property damages from increased flood risk, disruption of energy systems, risk of conflict, environmental migration, and the value of ecosystem services.
DOE exercises its own judgment in presenting monetized climate benefits as recommended by applicable Executive orders, and DOE would reach the same conclusion presented in this
( printed page 44512)
rulemaking in the absence of the social cost of greenhouse gases. That is, the social costs of greenhouse gases, whether measured using the February 2021 interim estimates presented by the Interagency Working Group on the Social Cost of Greenhouse Gases or by another means, did not affect the rule ultimately proposed by DOE.
DOE estimated the global social benefits of CO2, CH4, and N2
O reductions using SC-GHG values that were based on the interim values presented in the
Technical Support Document: Social Cost of Carbon, Methane, and Nitrous Oxide Interim Estimates under Executive Order 13990,
published in February 2021 by the IWG (“February 2021 SC-GHG TSD”). The SC-GHG is the monetary value of the net harm to society associated with a marginal increase in emissions in a given year, or the benefit of avoiding that increase. In principle, the SC-GHG includes the value of all climate change impacts, including (but not limited to) changes in net agricultural productivity, human health effects, property damage from increased flood risk and natural disasters, disruption of energy systems, risk of conflict, environmental migration, and the value of ecosystem services. The SC-GHG therefore, reflects the societal value of reducing emissions of the gas in question by one metric ton. The SC-GHG is the theoretically appropriate value to use in conducting benefit-cost analyses of policies that affect CO2, N2
O and CH4
emissions. As a member of the IWG involved in the development of the February 2021 SC-GHG TSD, DOE agreed that the interim SC-GHG estimates represent the most appropriate estimate of the SC-GHG until revised estimates are developed reflecting the latest, peer-reviewed science.
See87 FR 78382, 78406-78408 for discussion of the development and details of the IWG SC-GHG estimates.
There are a number of limitations and uncertainties associated with the SC-GHG estimates. First, the current scientific and economic understanding of discounting approaches suggests discount rates appropriate for intergenerational analysis in the context of climate change are likely to be less than 3 percent, near 2 percent or lower.[72]
Second, the IAMs used to produce these interim estimates do not include all of the important physical, ecological, and economic impacts of climate change recognized in the climate change literature and the science underlying their “damage functions”—
i.e.,
the core parts of the IAMs that map global mean temperature changes and other physical impacts of climate change into economic (both market and nonmarket) damages—lags behind the most recent research. For example, limitations include the incomplete treatment of catastrophic and non-catastrophic impacts in the integrated assessment models, their incomplete treatment of adaptation and technological change, the incomplete way in which inter-regional and intersectoral linkages are modeled, uncertainty in the extrapolation of damages to high temperatures, and inadequate representation of the relationship between the discount rate and uncertainty in economic growth over long time horizons. Likewise, the socioeconomic and emissions scenarios used as inputs to the models do not reflect new information from the last decade of scenario generation or the full range of projections. The modeling limitations do not all work in the same direction in terms of their influence on the SC-CO2
estimates. However, as discussed in the February 2021 SC-GHG TSD, the IWG has recommended that, taken together, the limitations suggest that the interim SC-GHG estimates used in this final rule likely underestimate the damages from GHG emissions. DOE concurs with this assessment.
Earthjustice et al. commented that DOE appropriately applies the social cost estimates developed by the IWG to its analysis of climate benefits. They stated that these values are widely agreed to underestimate the full social costs of greenhouse gas emissions, but for now they remain appropriate to use as conservative estimates. (Earthjustice et al., No. 132-1 at p. 1)
DOE agrees that the interim SC-GHG values applied for this final rule are conservative estimates. In the February 2021 SC-GHG TSD, the IWG stated that the models used to produce the interim estimates do not include all of the important physical, ecological, and economic impacts of climate change recognized in the climate change literature. For these same impacts, the science underlying their “damage functions” lags behind the most recent research. In the judgment of the IWG, these and other limitations suggest that the range of four interim SC-GHG estimates presented in the TSD likely underestimate societal damages from GHG emissions. The IWG is in the process of assessing how best to incorporate the latest peer-reviewed science and the recommendations of the National Academies to develop an updated set of SC-GHG estimates, and DOE remains engaged in that process.
Earthjustice et al. suggested that DOE should state that criticisms of the social cost of greenhouse gases are moot in this rulemaking because the proposed rule is justified without them. (Earthjustice et al., No. 132-1 at p.2) DOE agrees that the proposed rule is economically justified without including climate benefits associated with reduced GHG emissions.
Earthjustice et al. commented that DOE should consider applying sensitivity analysis using EPA's draft climate-damage estimates released in November 2022, as EPA's work faithfully implements the roadmap laid out in 2017 by the National Academies of Sciences and applies recent advances in the science and economics on the costs of climate change. (Earthjustice et al., No. 132-1 at pp. 2-3)
DOE is aware that in December 2023, EPA issued a new set of SC-GHG estimates in connection with a final rulemaking under the Clean Air Act.[73]
As DOE had used the IWG interim values in proposing this rule and is currently reviewing the updated 2023 SC-GHG values, for this final rule, DOE used these updated 2023 SC-GHG values to conduct a sensitivity analysis of the value of GHG emissions reductions. DOE notes that because EPA's estimates are considerably higher than the IWG's interim SC-GHG values applied for this final rule, an analysis that uses the EPA's estimates results in significantly greater climate-related benefits. However, such results would not affect DOE's decision in this final rule. As stated elsewhere in this document, DOE would reach the same conclusion regarding the economic justification of the standards presented in this final rule without considering the IWG's interim SC-GHG values, which DOE agrees are conservative estimates. For the same reason, if DOE were to use EPA's higher SC-GHG estimates, they would not change DOE's conclusion that the standards are economically justified.
DOE's derivations of the SC-CO2, SC-N2
O, and SC-CH4
values used for this final rule are discussed in the following sections, and the results of DOE's analyses estimating the benefits of the reductions in emissions of these GHGs are presented in section V.B.6 of this document.
( printed page 44513)
a. Social Cost of Carbon
The SC-CO2
values used for this final rule were based on the values developed for the February 2021 SC-GHG TSD, which are shown in Table IV.18 in five-year increments from 2020 to 2050. The set of annual values that DOE used, which was adapted from estimates published by EPA,[74]
is presented in Appendix 14A of the final rule TSD. These estimates are based on methods, assumptions, and parameters identical to the estimates published by the IWG (which were based on EPA modeling), and include values for 2051 to 2070. DOE expects additional climate benefits to accrue for equipment still operating after 2070, but a lack of available SC-CO2
estimates for emissions years beyond 2070 prevents DOE from monetizing these potential benefits in this analysis.
DOE multiplied the CO2
emissions reduction estimated for each year by the SC-CO2
value for that year in each of the four cases. DOE adjusted the values to 2022$ using the implicit price deflator for gross domestic product (“GDP”) from the Bureau of Economic Analysis. To calculate a present value of the stream of monetary values, DOE discounted the values in each of the four cases using the specific discount rate that had been used to obtain the SC-CO2
values in each case.
b. Social Cost of Methane and Nitrous Oxide
The SC-CH4
and SC-N2
O values used for this final rule were based on the values developed for the February 2021 SC-GHG TSD. Table IV.19 shows the updated sets of SC-CH4
and SC-N2
O estimates from the latest interagency update in 5-year increments from 2020 to 2050. The full set of annual values used is presented in appendix 14A of the final rule TSD. To capture the uncertainties involved in regulatory impact analysis, DOE has determined it is appropriate to include all four sets of SC-CH4
and SC-N2
O values, as recommended by the IWG. DOE derived values after 2050 using the approach described above for the SC-CO2.
DOE multiplied the CH4
and N2
O emissions reduction estimated for each year by the SC-CH4
and SC-N2
O estimates for that year in each of the cases. DOE adjusted the values to 2022$ using the implicit price deflator for gross domestic product (“GDP”) from the Bureau of Economic Analysis. To calculate a present value of the stream of monetary values, DOE discounted the values in each of the cases using the specific discount rate that had been used to obtain the SC-CH4
and SC-N2
O estimates in each case.
c. Sensitivity Analysis Using Updated SC-GHG Estimates
In December 2023, EPA issued an updated set of SC-GHG estimates (2023
( printed page 44514)
SC-GHG) in connection with a final rulemaking under the Clean Air Act.[75]
These estimates incorporate recent research and address recommendations of the National Academies (2017) and comments from a 2023 external peer review of the accompanying technical report. For this rulemaking, DOE used these updated 2023 SC-GHG values to conduct a sensitivity analysis of the value of GHG emissions reductions associated with alternative standards for circulator pumps. This sensitivity analysis provides an expanded range of potential climate benefits associated with amended standards. The final year of EPA's new 2023 SC-GHG estimates is 2080; therefore, DOE did not monetize the climate benefits of GHG emissions reductions occurring after 2080.
The overall climate benefits are greater when using the higher, updated 2023 SC-GHG estimates, compared to the climate benefits using the older IWG SC-GHG estimates. The results of the sensitivity analysis are presented in appendix 14C of the final rule TSD.
2. Monetization of Other Emissions Impacts
For the final rule, DOE estimated the monetized value of NOX
and SO2
emissions reductions from electricity generation using benefit-per-ton estimates for that sector from the EPA's Benefits Mapping and Analysis Program.[76]
DOE used EPA's values for PM2.5
-related benefits associated with NOX
and SO2
and for ozone-related benefits associated with NOX
for 2025 and 2030, and 2040, calculated with discount rates of 3 percent and 7 percent. DOE used linear interpolation to define values for the years not given in the 2025 to 2040 period; for years beyond 2040, the values are held constant. DOE combined the EPA regional benefit-per-ton estimates with regional information on electricity consumption and emissions from
AEO2023
to define weighted-average national values for NOX
and SO2
(see appendix 14B of the final rule TSD).
DOE multiplied the site emissions reduction (in tons) in each year by the associated $/ton values, and then discounted each series using discount rates of 3 percent and 7 percent as appropriate.
M. Utility Impact Analysis
The utility impact analysis estimates the changes in installed electrical capacity and generation projected to result for each considered TSL. The analysis is based on published output from the NEMS associated with
AEO2023.
NEMS produces the
AEO
Reference case, as well as a number of side cases that estimate the economy-wide impacts of changes to energy supply and demand. For the current analysis, impacts are quantified by comparing the levels of electricity sector generation, installed capacity, fuel consumption and emissions in the
AEO2023
Reference case and various side cases. Details of the methodology are provided in the appendices to chapters 13 and 15 of the final rule TSD.
The output of this analysis is a set of time-dependent coefficients that capture the change in electricity generation, primary fuel consumption, installed capacity and power sector emissions due to a unit reduction in demand for a given end use. These coefficients are multiplied by the stream of electricity savings calculated in the NIA to provide estimates of selected utility impacts of potential new energy conservation standards.
N. Employment Impact Analysis
DOE considers employment impacts in the domestic economy as one factor in selecting a standard. Employment impacts from new energy conservation standards include both direct and indirect impacts. Direct employment impacts are any changes in the number of employees of manufacturers of the equipment subject to standards, their suppliers, and related service firms. The MIA addresses those impacts. Indirect employment impacts are changes in national employment that occur due to the shift in expenditures and capital investment caused by the purchase and operation of more-efficient equipment. Indirect employment impacts from standards consist of the net jobs created or eliminated in the national economy, other than in the manufacturing sector being regulated, caused by (1) reduced spending by purchasers on energy, (2) reduced spending on new energy supply by the utility industry, (3) increased consumer spending on the equipment to which the new standards apply and other goods and services, and (4) the effects of those three factors throughout the economy.
One method for assessing the possible effects on the demand for labor of such shifts in economic activity is to compare sector employment statistics developed by the Labor Department's Bureau of Labor Statistics (“BLS”). BLS regularly publishes its estimates of the number of jobs per million dollars of economic activity in different sectors of the economy, as well as the jobs created elsewhere in the economy by this same economic activity. Data from BLS indicate that expenditures in the utility sector generally create fewer jobs (both directly and indirectly) than expenditures in other sectors of the economy.[77]
There are many reasons for these differences, including wage differences and the fact that the utility sector is more capital-intensive and less labor-intensive than other sectors. Energy conservation standards have the effect of reducing consumer utility bills. Because reduced consumer expenditures for energy likely lead to increased expenditures in other sectors of the economy, the general effect of efficiency standards is to shift economic activity from a less labor-intensive sector (
i.e.,
the utility sector) to more labor-intensive sectors (
e.g.,
the retail and service sectors). Thus, the BLS data suggest that net national employment may increase due to shifts in economic activity resulting from energy conservation standards.
DOE estimated indirect national employment impacts for the standard levels considered in this final rule using an input/output model of the U.S. economy called Impact of Sector Energy Technologies version 4 (“ImSET”).[78]
ImSET is a special-purpose version of the “U.S. Benchmark National Input-Output” (“I-O”) model, which was designed to estimate the national employment and income effects of energy-saving technologies. The ImSET software includes a computer-based I-O model having structural coefficients that characterize economic flows among 187 sectors most relevant to industrial, commercial, and residential building energy use.
DOE notes that ImSET is not a general equilibrium forecasting model, and that the uncertainties involved in projecting employment impacts, especially changes in the later years of the analysis. Because ImSET does not incorporate price changes, the employment effects predicted by ImSET may over-estimate actual job impacts
( printed page 44515)
over the long run for this rule. Therefore, DOE used ImSET only to generate results for near-term timeframes (2028-2032), where these uncertainties are reduced. For more details on the employment impact analysis, see chapter 16 of the final rule TSD.
V. Analytical Results and Conclusions
The following section addresses the results from DOE's analyses with respect to the considered energy conservation standards for circulator pumps. It addresses the TSLs examined by DOE, the projected impacts of each of these levels if adopted as energy conservation standards for circulator pumps, and the standards level that DOE is adopting in this final rule. Additional details regarding DOE's analyses are contained in the final rule TSD supporting this document.
A. Trial Standard Levels
In general, DOE typically evaluates potential new standards for equipment by grouping individual efficiency levels for each class into TSLs. Use of TSLs allows DOE to identify and consider manufacturer cost interactions between the equipment classes, to the extent that there are such interactions, and price elasticity of consumer purchasing decisions that may change when different standard levels are set.
In the analysis conducted for this final rule, DOE analyzed the benefits and burdens of four TSLs for circulator pumps. As discussed previously, because there is only one equipment class for circulator pumps, DOE developed TSLs that align with their corresponding ELs (
i.e.,
TSL 1 corresponds to EL 1, etc.). DOE presents the results for the TSLs in this document, while the results for all efficiency levels that DOE analyzed are in the final rule TSD.
Table V.1 presents the TSLs and the corresponding efficiency levels that DOE has identified for potential new energy conservation standards for circulator pumps. TSL 4 represents the maximum technologically feasible (“max-tech”) energy efficiency.
B. Economic Justification and Energy Savings
1. Economic Impacts on Individual Consumers
DOE analyzed the economic impacts on circulator pump consumers by looking at the effects that potential new standards at each TSL would have on the LCC and PBP. DOE also examined the impacts of potential standards on selected consumer subgroups. These analyses are discussed in the following sections.
a. Life-Cycle Cost and Payback Period
In general, higher-efficiency equipment affects consumers in two ways: (1) purchase price increases and (2) annual operating costs decrease. Inputs used for calculating the LCC and PBP include total installed costs (
i.e.,
equipment price plus installation costs), and operating costs (
i.e.,
annual energy use, energy prices, energy price trends, repair costs, and maintenance costs). The LCC calculation also uses equipment lifetime and a discount rate. Chapter 8 of the final rule TSD provides detailed information on the LCC and PBP analyses.
Table V.2 and Table V.3 show the LCC and PBP results for the TSLs considered for each equipment class. In the first of each pair of tables, the simple payback is measured relative to the baseline equipment. In the second table, the impacts are measured relative to the efficiency distribution in the in the no-new-standards case in the compliance year (see section IV.F.8 of this document). Because some consumers purchase equipment with higher efficiency in the no-new-standards case, the average savings are less than the difference between the average LCC of the baseline equipment and the average LCC at each TSL. The savings refer only to consumers who are affected by a standard at a given TSL. Those who already purchase an equipment with efficiency at or above a given TSL are not affected. Consumers for whom the LCC increases at a given TSL experience a net cost.
( printed page 44516)
b. Consumer Subgroup Analysis
In the consumer subgroup analysis, due to the high fraction of circulator pumps used in the residential sector, DOE estimated the impact of the considered TSLs on senior-only households. The analysis used subsets of the RECS 2015 sample composed of households that meet the criteria for seniors to generate a new sample of 75,000 senior consumers. Table V.4 compares the average LCC savings and PBP at each efficiency level for the consumer subgroups with similar metrics for the entire consumer sample for circulator pumps. In most cases, the average LCC savings and PBP for senior-only households at the considered efficiency levels are not substantially different from the average for all households. Chapter 11 of the final rule TSD presents the complete LCC and PBP results for the considered subgroup.
c. Rebuttable Presumption Payback
As discussed in section II.A of this document, EPCA establishes a rebuttable presumption that an energy conservation standard is economically justified if the increased purchase cost for an equipment that meets the standard is less than three times the value of the first-year energy savings resulting from the standard. In calculating a rebuttable presumption payback period for each of the considered TSLs, DOE used discrete values, and as required by EPCA, based the energy use calculation on the DOE test procedures for circulator pumps. In contrast, the PBPs presented in section
( printed page 44517)
V.B.1.a were calculated using distributions that reflect the range of energy use in the field.
Table V.5 presents the rebuttable-presumption payback periods for the considered TSLs for circulator pumps. While DOE examined the rebuttable-presumption criterion, it considered whether the standard levels considered for this rule are economically justified through a more detailed analysis of the economic impacts of those levels, pursuant to 42 U.S.C. 6295(o)(2)(B)(i), that considers the full range of impacts to the consumer, manufacturer, Nation, and environment. The results of that analysis serve as the basis for DOE to definitively evaluate the economic justification for a potential standard level, thereby supporting or rebutting the results of any preliminary determination of economic justification.[79]
2. Economic Impacts on Manufacturers
DOE performed an MIA to estimate the impact of new energy conservation standards on manufacturers of circulator pumps. The next section describes the expected impacts on manufacturers at each considered TSL. Chapter 12 of the final rule TSD explains the analysis in further detail.
a. Industry Cash Flow Analysis Results
In this section, DOE provides GRIM results from the analysis, which examines changes in the industry that would result from new energy conservation standards. The following tables summarize the estimated financial impacts (represented by changes in INPV) of potential new energy conservation standards on manufacturers of circulator pumps, as well as the conversion costs that DOE estimates manufacturers of circulator pumps would incur at each TSL.
As discussed in section IV.J.2.d of this document, DOE modeled two manufacturer markup scenarios to evaluate a range of cash flow impacts on the circulator pump industry: (1) the preservation of gross margin scenario and (2) the preservation of operating profit scenario. DOE considered the preservation of gross margin scenario by applying a “gross margin percentage” for each equipment class across all efficiency levels. As MPCs increase with efficiency, this scenario implies that the absolute dollar markup will increase. Because this scenario assumes that a manufacturer's absolute dollar markup would increase as MPCs increase in the standards cases, it represents the upper-bound to industry profitability under new energy conservation standards.
The preservation of operating profit scenario reflects manufacturers' concerns about their inability to maintain margins as MPCs increase to meet higher efficiency levels. In this scenario, while manufacturers make the necessary investments required to convert their facilities to produce compliant equipment, operating profit remains the same in absolute dollars, but decreases as a percentage of revenue.
Each of the modeled manufacturer markup scenarios results in a unique set of cash-flows and corresponding industry values at each TSL. In the following discussion, the INPV results refer to the difference in industry value between the no-new-standards case and each standards case resulting from the sum of discounted cash-flows from 2024 through 2057. To provide perspective on the short-run cash-flow impact, DOE includes in the discussion of results a comparison of free cash flow between the no-new-standards case and the standards case at each TSL in the year before new energy conservation standards are required.
DOE presents the range in INPV for circulator pump manufacturers in Table V.6 and Table V.7. DOE presents the impacts to industry cash flows and the conversion costs in Table V.8.
( printed page 44518)
At TSL 4, DOE estimates the change in INPV will range from −$118.1 million to $32.4 million, which represents a change in INPV of −34.0 percent to 9.3 percent, respectively. At TSL 4, industry free cash flow decreases to −$20.8 million, which represents a decrease of approximately 173.3 percent, compared to the no-new-standards case value of $28.4 million in 2027, the year before the compliance year.
TSL 4 sets the efficiency level at EL 4, max-tech, for all circulator pump varieties. DOE estimates that approximately 2 percent of all circulator pump shipments will meet the ELs required at TSL 4 in the no-new-standards case in 2028, the compliance year.
At TSL 4, DOE estimates manufacturers would incur $105.1 million in product conversion costs and $24.7 million in capital conversion costs to bring their equipment portfolios into compliance with standards set at TSL 4. At TSL 4, product conversion costs are the key driver of the decrease in free cash flow. These upfront investments result in a significantly lower free cash flow in the year before the compliance date.
At TSL 4, the shipment weighted-average MPC significantly increases by approximately 65.3 percent relative to the no-new-standards case MPC. In the preservation of gross margin scenario, this increase in MPC causes an increase in manufacturer free cash flow, while the $129.9 million in conversion costs estimated at TSL 4 cause a decrease in manufacturer free cash flow. Ultimately, these factors result in a moderately positive change in INPV at TSL 4 under the preservation of gross margin scenario.
Under the preservation of operating profit scenario, the significant increase in the shipment weighted-average MPC results in a lower average manufacturer markup. This lower average manufacturer markup and the $129.9 million in conversion costs result in a significantly negative change in INPV at TSL 4 under the preservation of operating profit scenario.
At TSL 3, DOE estimates the change in INPV will range from −$100.1 million to $15.2 million, which represents a change in INPV of −28.8 percent to 4.4 percent, respectively. At TSL 3, industry free cash flow decreases to −$14.6 million, which represents a decrease of approximately 151.6 percent, compared to the no-new-standards case value of $28.4 million in 2027, the year before the compliance year.
TSL 3 sets the efficiency level at EL 3 for all circulator pump varieties. DOE estimates that approximately 20 percent of all circulator pump shipments will meet or exceed the ELs required at TSL 3 in the no-new-standards case in 2028, the compliance year.
At TSL 3, DOE estimates manufacturers would incur $91.5 million in product conversion costs and $24.7 million in capital conversion costs to bring their equipment portfolios into compliance with standards set at TSL 3. At TSL 3, product conversion costs continue to be a key driver of the decrease in free cash flow. These upfront investments result in a significantly lower free cash flow in the year before the compliance date.
At TSL 3, the shipment weighted-average MPC significantly increases by approximately 51.0 percent relative to the no-new-standards case MPC. In the preservation of gross margin scenario, this increase in MPC causes an increase in manufacturer free cash flow, while the $116.2 million in conversion costs estimated at TSL 3 cause a decrease in manufacturer free cash flow. Ultimately, these factors result in a slightly positive change in INPV at TSL 3 under the preservation of gross margin scenario.
Under the preservation of operating profit scenario, the significant increase in the shipment weighted-average MPC results in a lower average manufacturer markup. This lower average manufacturer markup and the $116.2 million in conversion costs result in a significantly negative change in INPV at TSL 3 under the preservation of operating profit scenario.
( printed page 44519)
At TSL 2, DOE estimates the change in INPV will range from −$69.2 million to $11.1 million, which represents a change in INPV of −19.9 percent to 3.2 percent, respectively. At TSL 2, industry free cash flow decreases to −$2.1 million, which represents a decrease of approximately 107.3 percent, compared to the no-new-standards case value of $28.4 million in 2027, the year before the compliance year.
TSL 2 sets the efficiency level at EL 2 for all circulator pump varieties. DOE estimates that approximately 37 percent of all circulator pump shipments will meet or exceed the ELs required at TSL 2 in the no-new-standards case in 2028, the compliance year.
At TSL 2, DOE estimates manufacturers would incur $56.4 million in product conversion costs and $24.7 million in capital conversion costs to bring their equipment portfolios into compliance with standards set at TSL 2. At TSL 2, product conversion costs continue to be a key driver of the decrease in free cash flow. These upfront investments result in a lower free cash flow in the year before the compliance date.
At TSL 2, the shipment weighted-average MPC moderately increases by approximately 36.5 percent relative to the no-new-standards case MPC. In the preservation of gross margin scenario, this increase in MPC causes an increase in manufacturer free cash flow, while the $81.2 million in conversion costs estimated at TSL 2 cause a decrease in manufacturer free cash flow. Ultimately, these factors result in a slightly positive change in INPV at TSL 2 under the preservation of gross margin scenario.
Under the preservation of operating profit scenario, the moderate increase in the shipment weighted-average MPC results in a lower average manufacturer markup. This lower average manufacturer markup and the $81.2 million in conversion costs result in a moderately negative change in INPV at TSL 2 under the preservation of operating profit scenario.
At TSL 1, DOE estimates the change in INPV will be −$3.4 million, which represents a change in INPV of −1.0 percent. At TSL 1, industry free cash flow decreases to $26.5 million, which represents a decrease of approximately 6.6 percent, compared to the no-new-standards case value of $28.4 million in 2027, the year before the compliance year.
TSL 1 sets the efficiency level at EL 1 for all circulator pump varieties. DOE estimates that approximately 69 percent of all circulator pump shipments will meet or exceed the ELs required at TSL 1 in the no-new-standards case in 2028, the compliance year.
At TSL 1, DOE does not expect the increases in efficiency requirements at this TSL to require any capital investments. DOE anticipates that manufacturers would have to make slight investments in R&D to re-design some of their equipment offering to meet standards set at TSL 1. Overall, DOE estimates that manufacturers would incur $5.5 million in product conversion costs to bring their equipment portfolios into compliance with standards set to TSL 1. At TSL 1, all manufacturers have basic models that meet or exceed these efficiency levels.
At TSL 1, the shipment-weighted average MPC for all circulator pumps does not increase relative to the no-new-standards case shipment-weighted average MPC in 2028. Since the shipment-weighted average MPC does not increase at all at TSL 1 compared to the no-new-standards case, manufacturers are not able to recover any additional revenue at TSL 1, despite the conversion costs that they incur at TSL 1. Therefore, the $5.5 million in conversion costs incurred by manufacturers causes a slightly negative change in INPV at TSL 1 in both manufacturer markup scenarios.
b. Direct Impacts on Employment
To quantitatively assess the potential impacts of new energy conservation standards on direct employment in the circulator pump industry, DOE used the GRIM to estimate the domestic labor expenditures and number of direct employees in the no-new-standards case and in each of the standards cases during the analysis period. This analysis includes both production and non-production employees employed by circulator pump manufacturers. DOE used statistical data from the U.S. Census Bureau's 2021 Annual Survey of Manufacturers [80]
(“ASM”), the results of the engineering analysis, and interviews with manufacturers to determine the inputs necessary to calculate industry-wide labor expenditures and domestic employment levels. Labor expenditures related to manufacturing of the equipment are a function of the labor intensity of the equipment, the sales volume, and an assumption that wages remain fixed in real terms over time.
The total labor expenditures in the GRIM are converted to domestic production worker employment levels by dividing production labor expenditures by the average fully burdened wage per production worker. DOE calculated the fully burdened wage by multiplying the industry production worker hourly blended wage (provided by the ASM) by the fully burdened wage ratio. The fully burdened wage ratio factors in paid leave, supplemental pay, insurance, retirement and savings, and legally required benefits. DOE determined the fully burdened ratio from the Bureau of Labor Statistics' employee compensation data.[81]
The estimates of production workers in this section cover workers, including line supervisors who are directly involved in fabricating and assembling the equipment within the manufacturing facility. Workers performing services that are closely associated with production operations, such as materials handling tasks using forklifts, are also included as production labor.
Non-production worker employment levels were determined by multiplying the industry ratio of production worker employment to non-production employment against the estimated production worker employment previously explained. Estimates of non-production workers in this section cover above-the-line supervisors, sales, sales delivery, installation, office functions, legal, and technical employees.
The total direct-employment impacts calculated in the GRIM are the sum of the changes in the number of domestic production and non-production workers resulting from energy conservation standards for circulator pumps, as compared to the no-new-standards case. Typically, more efficient equipment is more complex and labor intensive to produce. Per-unit labor requirements and production time requirements trend higher with more stringent energy conservation standards.
DOE estimates that approximately 65 percent of circulator pumps sold in the United States are manufactured domestically. In the absence of energy conservation standards, DOE estimates that there would be 173 domestic production workers in the circulator pump industry in 2028, the compliance year.
DOE's analysis estimates that the circulator pump industry will domestically employ 284 production and non-production workers in the circulator pump industry in 2028 in the absence of energy conservation standards. Table V.9 presents the range
( printed page 44520)
of potential impacts of energy conservation standards on U.S. production workers of circulator pumps.
At the upper end of the range, all examined TSLs show an increase (or no change) in the number of domestic workers for circulator pumps. The upper end of the range represents a scenario where manufacturers increase production and non-production hiring due to the increase in labor associated with more efficient circulator pumps and the additional engineers needed to redesign more efficient circulator pumps. However, this assumes that in addition to hiring more production and no-production employees, all existing domestic production and non-production employees would remain in the United States and not shift to other countries that currently produce circulator pumps that are sold in the United States.
At the lower end of the range, all examined TSLs show a decrease (or no change) in the number of domestic workers for circulator pumps. Based on information gathered during manufacturer interviews, DOE understands circulator pumps with ECMs are primarily manufactured outside the United States. However, manufacturers stated that they would likely expand their ECM production capacities in the United States if standards were established at efficiency levels that would likely require ECMs (
i.e.,
TSL 2 or higher). The lower end of the range represents a scenario where some manufacturers with existing production facilities abroad move their circulator pump production for ELs that will likely require an ECM to those production facilities abroad. Therefore, DOE modeled a low-end employment range that assumes half of existing domestic production would be relocated to foreign countries due to the energy conservation standard at TSL 2 or higher.
HI stated that domestic employment is specific to each manufacturer. To obtain this information DOE is encouraged to procure these estimates under NDA with each manufacturer. (HI, No. 135 at p. 6) DOE conducted manufacturer interviews with a variety of circulator pump manufacturers prior to the December 2022 NOPR. DOE continues to use the information gathered during those manufacturer interviews in this final rule.
Wyer commented that U.S. manufacturing infrastructure cannot support the level of production needed to satisfy the hydronics market with ECM circulators. (Wyer, No. 128 at p. 2) Wyer stated that ECM pumps with the performance curves necessary for the geothermal HVAC industry are only manufactured in Europe, while the majority of PSC pumps currently being used in the geothermal HVAC industry are made in the United States. (
Id.) Wyer commented that U.S.-based manufacturers are more likely to shut down domestic facilities and continue importing ECM circulators rather than invest to upgrade their plants to produce ECM pumps. (
Id.) Wyer recommended that DOE consider the impact of the proposed rulemaking on domestic manufacturer employment and the potential of plant closures. (
Id.) Table V.9 displays the range of potential impacts to domestic manufacturing. Specifically, the lower end of the range represents a scenario where some manufacturers move their circulator pump production for ELs that will likely require an ECM to production facilities located abroad.
Due to variations in manufacturing labor practices, actual direct employment could vary depending on manufacturers' preference for high capital or high labor practices in response to standards. DOE notes that the employment impacts discussed here are independent of the indirect employment impacts to the broader U.S. economy, which are documented in chapter 15 of the accompanying TSD.
c. Impacts on Manufacturing Capacity
During manufacturer interviews, industry feedback indicated that manufacturers' current production capacity was strained due to upstream supply chain constraints. Additionally, manufacturers expressed that additional production lines would be required during the conversion period if standards were set at a level requiring ECMs. However, many manufacturers noted that their portfolios have expanded in recent years to accommodate more circulator pumps using ECMs. Furthermore, manufacturers indicated that a circulator pump utilizing an ECM could support a wider range of applications compared to a circulator pump utilizing an induction motor.
As part of the December 2022 NOPR, DOE requested comment on a potential 2-year compliance period. HI and Xylem commented that manufacturers will benefit from a 4-year compliance period to allow time to engineer, develop, and test equipment to meet the standards. Additionally, there could be manufacturing capacity concerns if DOE required compliance within 2 years of
( printed page 44521)
publication of a final rule. (HI, No. 135 at pp. 2-3; Xylem, No. 136 at pp. 3-4) This topic is also discussed in more detail in section III.H of this document. Given that DOE is requiring compliance with energy conservation standards 4 years after publication of this final rule, DOE does not anticipate any manufacturing capacity concerns.
d. Impacts on Subgroups of Manufacturers
As discussed in section IV.J of this document, using average cost assumptions to develop an industry cash-flow estimate may not be adequate for assessing differential impacts among manufacturer subgroups. Small manufacturers, niche manufacturers, and manufacturers exhibiting a cost structure substantially different from the industry average could be affected disproportionately. DOE used the results of the industry characterization to group manufacturers exhibiting similar characteristics. Consequently, DOE identified small business manufacturers as a subgroup for a separate impact analysis.
For the small business subgroup analysis, DOE applied the small business size standards published by the Small Business Administration (“SBA”) to determine whether a company is considered a small business. The size standards are codified at 13 CFR part 201. To be categorized as a small business under the North American Industry Classification System (“NAICS”) code 333914, “Measuring, Dispensing, and Other Pumping Equipment Manufacturing,” a circulator pump manufacturer and its affiliates may employ a maximum of 750 employees. The 750-employee threshold includes all employees in a business's parent company and any other subsidiaries. Based on this classification, DOE identified three small businesses that manufacture circulator pumps in the United States. DOE estimates one of the small businesses does not manufacture any circulator pump models that would meet the adopted standards. The other two small businesses both offer circulator pumps that would meet the adopted standards. The first small business is estimated to redesign 32 basic models at a cost of approximately $50.1 million, which corresponds to approximately 7.9 percent of that small business's annual revenue over the 4-year compliance period. The second small business is estimated to redesign 3 basic models at a cost of approximately $3.7 million, which corresponds to approximately 11.6 percent of that small business's annual revenue over the 4-year compliance period. The third small business is estimated to redesign 1 basic model at a cost of approximately $1.5 million, which corresponds to approximately 18.3 percent of that small business's annual revenue over the 4-year compliance period.
The small business subgroup analysis is discussed in more detail in chapter 12 of the final rule TSD and in section VI.B of this document.
e. Cumulative Regulatory Burden
One aspect of assessing manufacturer burden involves looking at the cumulative impact of multiple DOE standards and the regulatory actions of other Federal agencies and States that affect the manufacturers of covered equipment. While any one regulation may not impose a significant burden on manufacturers, the combined effects of several existing or impending regulations may have serious consequences for some manufacturers, groups of manufacturers, or an entire industry. Multiple regulations affecting the same manufacturer can strain profits and lead companies to abandon equipment lines or markets with lower expected future returns than competing equipment. For these reasons, DOE conducts an analysis of cumulative regulatory burden as part of its rulemakings pertaining to equipment efficiency.
DOE evaluates equipment-specific regulations that will take effect approximately 3 years before or after the 2028 compliance date of any energy conservation standards for circulator pumps.[82]
DOE is aware that circulator pump manufacturers produce other equipment or products including dedicated-purpose pool pumps [83]
and commercial and industrial pumps.[84]
None of these products or equipment have proposed or adopted energy conservation standards that require compliance within 3 years of the adopted energy conservation standards for circulator pumps in this final rule.
HI and Xylem stated that the commercial and industrial pumps rulemaking is ongoing and the impact of the commercial and industrial pumps rulemaking will certainly require extensive resources from the same manufacturers being affected by the circulator pumps rulemaking during the same time horizon. (HI, No. 135 at p. 4; Xylem, No. 136 at p. 5) The commercial and industrial pumps rulemaking is an ongoing rulemaking that has not published a proposed rulemaking (
i.e.,
NOPR) or a final rule. DOE is unable to estimate the potential impact of rulemakings that do not have proposed or adopted energy conservation standards. However, DOE will consider the cumulative effect of this circulator pumps rulemaking as part of the commercial and industrial pumps rulemaking if DOE proposes or establishes standards for commercial and industrial pumps in a future rulemaking.
Lastly, HI and Xylem commented that the electric motors rulemaking [85]
will have a significant impact on the availability (style and volume), and breadth of ECMs to support conversion, especially the CP2 and CP3 style circulator pumps. (
Id.) DOE was unable to find any circulator pump manufacturer that also manufactures electric motors covered by that rulemaking. Additionally, the ECMs that are used in the circulator pumps to meet the efficiency levels at EL 2 and above, are not covered by that electric motors rulemaking.
3. National Impact Analysis
This section presents DOE's estimates of the national energy savings and the NPV of consumer benefits that would result from each of the TSLs considered as potential new standards.
a. Significance of Energy Savings
To estimate the energy savings attributable to potential new standards for circulator pumps, DOE compared their energy consumption under the no-new-standards case to their anticipated energy consumption under each TSL. The savings are measured over the entire lifetime of equipment purchased in the 30-year period that begins in the year of anticipated compliance with new standards (2028-2057). Table V.10 presents DOE's projections of the national energy savings for each TSL considered for circulator pumps. The savings were calculated using the approach described in section IV.H.2 of this document.
( printed page 44522)
OMB Circular A-4 [86]
requires agencies to present analytical results, including separate schedules of the monetized benefits and costs that show the type and timing of benefits and costs. Circular A-4 also directs agencies to consider the variability of key elements underlying the estimates of benefits and costs. For this rulemaking, DOE undertook a sensitivity analysis using 9 years, rather than 30 years, of equipment shipments. The choice of a 9-year period is a proxy for the timeline in EPCA for the review of certain energy conservation standards and potential revision of and compliance with such revised standards.[87]
The review timeframe established in EPCA is generally not synchronized with the equipment lifetime, equipment manufacturing cycles, or other factors specific to circulator pumps. Thus, such results are presented for informational purposes only and are not indicative of any change in DOE's analytical methodology. The NES sensitivity analysis results based on a 9-year analytical period are presented in Table V.11. The impacts are counted over the lifetime of circulator pumps purchased in 2028-2036.
b. Net Present Value of Consumer Costs and Benefits
DOE estimated the cumulative NPV of the total costs and savings for consumers that would result from the TSLs considered for circulator pumps. In accordance with OMB's guidelines on regulatory analysis,[88]
DOE calculated NPV using both a 7-percent and a 3-percent real discount rate. Table V.12 shows the consumer NPV results with impacts counted over the lifetime of equipment purchased in 2028-2057.
The NPV results based on the aforementioned 9-year analytical period are presented in Table V.13. The impacts are counted over the lifetime of equipment purchased in 2028-2036. As mentioned previously, such results are presented for informational purposes only and are not indicative of any change in DOE's analytical methodology or decision criteria.
( printed page 44523)
c. Indirect Impacts on Employment
DOE estimates that new energy conservation standards for circulator pumps will reduce energy expenditures for consumers of those equipment, with the resulting net savings being redirected to other forms of economic activity. These expected shifts in spending and economic activity could affect the demand for labor. As described in section IV.N of this document, DOE used an input/output model of the U.S. economy to estimate indirect employment impacts of the TSLs that DOE considered. There are uncertainties involved in projecting employment impacts, especially changes in the later years of the analysis. Therefore, DOE generated results for near-term timeframes (2028-2032), where these uncertainties are reduced.
The results suggest that the adopted standards are likely to have a negligible impact on the net demand for labor in the economy. The net change in jobs is so small that it would be imperceptible in national labor statistics and might be offset by other, unanticipated effects on employment. Chapter 16 of the final rule TSD presents detailed results regarding anticipated indirect employment impacts.
4. Impact on Utility or Performance of Equipment
As discussed in section III.G.1.d of this document, DOE has concluded that the standards adopted in this final rule will not lessen the utility or performance of the circulator pumps under consideration in this rulemaking. Manufacturers of these equipment currently offer units that meet or exceed the adopted standards.
5. Impact of Any Lessening of Competition
DOE considered any lessening of competition that would be likely to result from new standards. As discussed in section III.G.1.e of this document, EPCA directs the Attorney General of the United States (“Attorney General”) to determine the impact, if any, of any lessening of competition likely to result from a proposed standard and to transmit such determination in writing to the Secretary within 60 days of the publication of a proposed rule, together with an analysis of the nature and extent of the impact. To assist the Attorney General in making this determination, DOE provided the Department of Justice (“DOJ”) with copies of the NOPR and the TSD for review. In its assessment letter responding to DOE, DOJ concluded that the proposed energy conservation standards for circulator pumps are unlikely to have a significant adverse impact on competition. DOE is publishing the Attorney General's assessment at the end of this final rule.
6. Need of the Nation To Conserve Energy
Enhanced energy efficiency, where economically justified, improves the Nation's energy security, strengthens the economy, and reduces the environmental impacts (costs) of energy production. Reduced electricity demand due to energy conservation standards is also likely to reduce the cost of maintaining the reliability of the electricity system, particularly during peak-load periods. Chapter 15 in the final rule TSD presents the estimated impacts on electricity, for the TSLs that DOE considered in this rulemaking.
Energy conservation resulting from potential energy conservation standards for circulator pumps is expected to yield environmental benefits in the form of reduced emissions of certain air pollutants and greenhouse gases. Table V.14 provides DOE's estimate of cumulative emissions reductions expected to result from the TSLs considered in this rulemaking. The emissions were calculated using the multipliers discussed in section IV.K of this document. DOE reports annual emissions reductions for each TSL in chapter 13 of the final rule TSD.
( printed page 44524)
As part of the analysis for this rule, DOE estimated monetary benefits likely to result from the reduced emissions of CO2
that DOE estimated for each of the considered TSLs for circulator pumps. Section IV.L of this document discusses the estimated SC-CO2
values that DOE used. Table V.15 presents the value of CO2
emissions reduction at each TSL for each of the SC-CO2
cases. The time-series of annual values is presented for the selected TSL in chapter 14 of the final rule TSD.
As discussed in section IV.L.2 of this document, DOE estimated the climate benefits likely to result from the reduced emissions of methane and N2
O that DOE estimated for each of the considered TSLs for circulator pumps. Table V.16 presents the value of the CH4
emissions reduction at each TSL, and Table V.17 presents the value of the N2
O emissions reduction at each TSL. The time-series of annual values is presented for the selected TSL in chapter 14 of the final rule TSD.
( printed page 44525)
DOE is well aware that scientific and economic knowledge about the contribution of CO2
and other GHG emissions to changes in the future global climate and the potential resulting damages to the global and U.S. economy continues to evolve rapidly. DOE, together with other Federal agencies, will continue to review methodologies for estimating the monetary value of reductions in CO2
and other GHG emissions. This ongoing review will consider the comments on this subject that are part of the public record for this and other rulemakings, as well as other methodological assumptions and issues. DOE notes, however, that the adopted standards would be economically justified even without inclusion of monetized benefits of reduced GHG emissions.
DOE also estimated the monetary value of the economic benefits associated with NOX
and SO2
emissions reductions anticipated to result from the considered TSLs for circulator pumps. The dollar-per-ton values that DOE used are discussed in section IV.L of this document. Table V.18 presents the present value for NOX
emissions reduction for each TSL calculated using 7-percent and 3-percent discount rates, and Table V.19 presents similar results for SO2
emissions reductions. The results in these tables reflect application of EPA's low dollar-per-ton values, which DOE used to be conservative. The time-series of annual values is presented for the selected TSL in chapter 14 of the final rule TSD.
( printed page 44526)
Not all the public health and environmental benefits from the reduction of greenhouse gases, NOX, and SO2
are captured in the values above, and additional unquantified benefits from the reductions of those pollutants as well as from the reduction of direct PM and other co-pollutants may be significant. DOE has not included monetary benefits of the reduction of Hg emissions because the amount of reduction is very small.
7. Other Factors
The Secretary of Energy, in determining whether a standard is economically justified, may consider any other factors that the Secretary deems to be relevant. (42 U.S.C. 6295(o)(2)(B)(i)(VII)) No other factors were considered in this analysis.
8. Summary of Economic Impacts
Table V.20 presents the NPV values that result from adding the estimates of the economic benefits resulting from reduced GHG and NOX
and SO2
emissions to the NPV of consumer benefits calculated for each TSL considered in this rulemaking. The consumer benefits are domestic U.S. monetary savings that occur as a result of purchasing the covered equipment and are measured for the lifetime of equipment shipped in 2028-2057. The climate benefits associated with reduced GHG emissions resulting from the adopted standards are global benefits and are also calculated based on the lifetime of circulator pumps shipped in 2028-2057.
C. Conclusion
When considering new energy conservation standards, the standards that DOE adopts for any type (or class) of covered equipment must be designed to achieve the maximum improvement in energy efficiency that the Secretary determines is technologically feasible and economically justified. (42 U.S.C. 6316(a); 42 U.S.C. 6295(o)(2)(A)) In determining whether a standard is economically justified, the Secretary must determine whether the benefits of the standard exceed its burdens by, to the greatest extent practicable, considering the seven statutory factors discussed previously. (42 U.S.C. 6316(a); 42 U.S.C. 6295(o)(2)(B)(i)) The new standard must also result in significant conservation of energy. (42 U.S.C. 6316(a); 42 U.S.C. 6295(o)(3)(B))
For this final rule, DOE considered the impacts of new standards for circulator pumps at each TSL, beginning with the maximum technologically feasible level, to determine whether that level was economically justified. Where the max-tech level was not justified, DOE then considered the next most efficient level and undertook the same evaluation until it reached the highest efficiency level that is both technologically feasible and economically justified and saves a significant amount of energy.
To aid the reader as DOE discusses the benefits and/or burdens of each TSL, tables in this section present a summary of the results of DOE's quantitative analysis for each TSL. In addition to the quantitative results presented in the tables, DOE also considers other burdens and benefits that affect economic justification. These include the impacts on identifiable subgroups of consumers who may be disproportionately affected by a national standard and impacts on employment.
1. Benefits and Burdens of TSLs Considered for Circulator Pump Standards
Table V.21 and Table V.22 summarize the quantitative impacts estimated for each TSL for circulator pumps. The national impacts are measured over the lifetime of circulator pumps purchased
( printed page 44527)
in the 30-year period that begins in the anticipated year of compliance with new standards (2028-2057). The energy savings, emissions reductions, and value of emissions reductions refer to full-fuel-cycle results. DOE is presenting monetized benefits of GHG emissions reductions in accordance with the applicable Executive orders and DOE would reach the same conclusion presented in this notice in the absence of the social cost of greenhouse gases, including the Interim Estimates presented by the Interagency Working Group. The efficiency levels contained in each TSL are described in section V.A of this document.
( printed page 44528)
DOE first considered TSL 4, which represents the max-tech efficiency levels. TSL 4 would save an estimated 1.19 quads of energy, an amount DOE considers significant. Under TSL 4, the NPV of consumer benefit would be $1.17 billion using a discount rate of 7 percent, and $3.57 billion using a discount rate of 3 percent.
The cumulative emissions reductions at TSL 4 are 21.73 Mt of CO2, 40.4 thousand tons of SO2, 6.29 thousand tons of NOX, 0.04 tons of Hg, 182.7 thousand tons of CH4, and 0.20 thousand tons of N2
O. The estimated monetary value of the climate benefits from reduced GHG emissions (associated with the average SC-GHG at a 3-percent discount rate) at TSL 4 is $1.25 billion. The estimated monetary value of the health benefits from reduced SO2
and NOX
emissions at TSL 4 is $1.07 billion using a 7-percent discount rate and $2.47 billion using a 3-percent discount rate.
Using a 7-percent discount rate for consumer benefits and costs, health benefits from reduced SO2
and NOX
emissions, and the 3-percent discount rate case for climate benefits from reduced GHG emissions, the estimated total NPV at TSL 4 is $3.5 billion. Using a 3-percent discount rate for all benefits and costs, the estimated total NPV at TSL 4 is $7.29 billion.
At TSL 4, the average LCC impact is a savings of $112.4. The simple payback period is 4.6 years. The fraction of purchasers experiencing a net LCC cost is 45.9 percent.
At TSL 4, the projected change in INPV ranges from a decrease of $118.1 million to an increase of $32.4 million, which corresponds to a decrease of 34.0 percent and an increase of 9.3 percent, respectively. DOE estimates that industry must invest $129.9 million to comply with standards set at TSL 4. This investment is primarily driven by converting all existing equipment to include differential-temperature based controls and the associated product conversion costs that would be needed to support such a transition. DOE estimates that approximately 2 percent of circulator pump shipments would meet the efficiency levels analyzed at TSL 4 in the no-new-standards case.
The Secretary concludes that at TSL 4 for circulator pump, the benefits of energy savings, positive NPV of consumer benefits, emission reductions, and the estimated monetary value of the emissions reductions would be outweighed by the economic burden on many consumers, and the impacts on manufacturers, including the large conversion costs, profit margin impacts that could result in a large reduction in INPV, and the lack of manufacturers currently offering products meeting the efficiency levels required at this TSL, including small businesses. Almost a majority of circulator pump customers (45.9 percent) would experience a net cost and manufacturers would have to significantly ramp up production of more efficient models since only 2 percent of shipments currently meet the efficiency levels at TSL 4. Consequently, the Secretary has concluded that TSL 4 is not economically justified.
DOE then considered TSL 3, which represents EL 3 for all circulator pumps, and would require automatic proportional pressure controls to be added to the circulator pump. TSL 3 would save an estimated 1.02 quads of energy, an amount DOE considers significant. Under TSL 3, the NPV of consumer benefit would be $1.11 billion using a discount rate of 7 percent, and $3.25 billion using a discount rate of 3 percent.
The cumulative emissions reductions at TSL 3 are 18.56 Mt of CO2, 5.39 thousand tons of SO2, 34.5 thousand tons of NOX, 0.04 tons of Hg, 155.86 thousand tons of CH4, and 0.18 thousand tons of N2
O. The estimated monetary value of the climate benefits from reduced GHG emissions (associated with the average SC-GHG at a 3-percent discount rate) at TSL 3 is $1.07 billion. The estimated monetary value of the health benefits from reduced SO2
and NOX
emissions at TSL 3 is $0.92 billion using a 7-percent discount rate and $2.11 billion using a 3-percent discount rate.
Using a 7-percent discount rate for consumer benefits and costs, health benefits from reduced SO2
and NOX
emissions, and the 3-percent discount rate case for climate benefits from reduced GHG emissions, the estimated total NPV at TSL 3 is $3.10 billion. Using a 3-percent discount rate for all benefits and costs, the estimated total NPV at TSL 3 is $6.44 billion.
At TSL 3, the average LCC impact is a savings of $117.4. The simple payback period is 4.5 years. The fraction of consumers experiencing a net LCC cost is 42.7 percent.
At TSL 3, the projected change in INPV ranges from a decrease of $100.1 million to an increase of $15.2 million, which corresponds to a decrease of 28.8 percent and an increase of 4.4 percent, respectively. DOE estimates that industry must invest $116.2 million to comply with standards set at TSL 3. DOE estimates that approximately 20 percent of circulator pump shipments will meet or exceed the efficiency levels analyzed at TSL 3 in the no-new-standards case.
DOE also notes that the estimated energy and economic savings from TSL 3 are highly dependent on the end-use systems in which the circulator pumps
( printed page 44529)
are installed (
e.g.,
hydronic heating or water heating applications). Circulator pumps are typically added to systems when installed in the field and can be replaced separately than the end-use appliance in which they are paired. Depending on the type of controls that the end-use appliance contains, the circulator pumps may not see the field savings benefits from the technologies incorporated in TSL 3 because the end-use system cannot accommodate full variable-speed operation. In particular, some systems will not achieve any additional savings from differential pressure controls as compared to a single speed ECM with no controls (
i.e.,
TSL 2). As discussed earlier in this document, to evaluate the effect of a varying fraction of circulator pumps benefitting from controls, DOE conducted a sensitivity in the LCC analysis. The results of this sensitivity analysis showed that the fraction of purchasers experiencing a net cost at EL 3 and EL 4 would linearly increase from 42.7% to 60.7% and 45.9% to 74.8%, respectively, when the fraction of purchasers who do benefit from controls in the field varies from 100% to 0%. While the analysis includes the best available assumptions on the distribution of system curves and single-zone versus multi-zone applications, variation in those assumptions could have a large impact on savings potential and resulting economics providing uncertainty in the savings associated with TSL 3.
The Secretary concludes that at TSL 3 for circulator pump, the benefits of energy savings, positive NPV of consumer benefits, emission reductions, and the estimated monetary value of the emissions reductions would be outweighed by the economic burden on many consumers, and the impacts on manufacturers, including the large conversion costs, profit margin impacts that could result in a large reduction in INPV, and the lack of manufacturers currently offering products meeting the efficiency levels required at this TSL, including small businesses. Almost a majority of circulator pump customers (42.7 percent) would experience a net cost and manufacturers would have to significantly ramp up production of more efficient models since only 2 percent of shipments currently meet TSL 3 efficiency levels. In addition, the Secretary is also concerned about the uncertainty regarding the potential energy savings as compared to the field savings due to the lack of end-use appliances being able to respond to differential pressure controls from the circulator pump. Consequently, the Secretary has concluded that TSL 3 is not economically justified.
DOE then considered TSL 2, which represents efficiency level 2 for circulator pumps. TSL 2 would save an estimated 0.55 quads of energy, an amount DOE considers significant. Under TSL 2, the NPV of consumer benefit would be $0.95 billion using a discount rate of 7 percent, and $2.34 billion using a discount rate of 3 percent.
The cumulative emissions reductions at TSL 2 are 10.04 Mt of CO2, 2.95 thousand tons of SO2, 18.65 thousand tons of NOX, 0.02 tons of Hg, 83.84 thousand tons of CH4, and 0.10 thousand tons of N2
O. The estimated monetary value of the climate benefits from reduced GHG emissions (associated with the average SC-GHG at a 3-percent discount rate) at TSL 2 is $0.59 billion. The estimated monetary value of the health benefits from reduced SO2
and NOX
emissions at TSL 2 is $0.51 billion using a 7-percent discount rate and $1.16 billion using a 3-percent discount rate.
Using a 7-percent discount rate for consumer benefits and costs, health benefits from reduced SO2
and NOX
emissions, and the 3-percent discount rate case for climate benefits from reduced GHG emissions, the estimated total NPV at TSL 2 is $2.05 billion. Using a 3-percent discount rate for all benefits and costs, the estimated total NPV at TSL 2 is $4.09 billion.
At TSL 2, the average LCC impact is a savings of $110.9. The simple payback period is 3.3 years. The fraction of consumers experiencing a net LCC cost is 28.0 percent.
At TSL 2, the projected change in INPV ranges from a decrease of $69.2 million to an increase of $11.1 million, which corresponds to a decrease of 19.9 percent and to an increase of 3.2 percent, respectively. DOE estimates that industry must invest $81.2 million to comply with standards set at TSL 2. DOE estimates that approximately 37 percent of circulator pump shipments would meet the efficiency levels analyzed at TSL 2. At TSL 2, most manufacturers have current circulator pump offerings at this level.
Standards set at TSL 2 essentially guarantees energy savings in all applications currently served by an induction motor, as the savings accrue from motor efficiency alone rather than from a particular control strategy that must be properly matched to the system in the field. In comparison, TSL 3 and 4 include an ECM as in TSL 2, but TSL 3 and 4 also include the associated variable speed controls that must be properly matched in the field. TSL 2 also allows and encourages uptake of circulators with controls, as manufacturers may choose to prioritize variable speed ECM as opposed to single speed ECM. This could increase the potential savings from TSL 2 from those captured in the analysis, while providing consumers and manufacturers with flexibility to select the motor and/or control strategy most appropriate to their given application.
After considering the analysis and weighing the benefits and burdens, the Secretary has concluded that a standard set at TSL 2 for circulator pumps would be economically justified. At this TSL, the average LCC savings are positive. An estimated 28.0 percent [89]
of circulator pump consumers experience a net cost. The FFC national energy savings are significant and the NPV of consumer benefits is positive using both a 3-percent and 7-percent discount rate. Notably, the benefits to consumers vastly outweigh the cost to manufacturers. At TSL 2, the NPV of consumer benefits, even measured at the more conservative discount rate of 7 percent is over 13 times higher than the maximum estimated manufacturers' loss in INPV. The standard levels at TSL 2 are economically justified even without weighing the estimated monetary value of emissions reductions. When those emissions reductions are included—representing $0.59 billion in climate benefits (associated with the average SC-GHG at a 3-percent discount rate), and $1.16 billion (using a 3-percent discount rate) or $0.51 billion (using a 7-percent discount rate) in health benefits—the rationale becomes stronger still.
As stated, DOE conducts the walk-down analysis to determine the TSL that represents the maximum improvement in energy efficiency that is technologically feasible and economically justified as required under EPCA. The walk-down is not a comparative analysis, as a comparative analysis would result in the maximization of net benefits instead of energy savings that are technologically feasible and economically justified, which would be contrary to the statute. 86 FR 70892, 70908. Although DOE has not conducted a comparative analysis to select the new energy conservation standards, DOE notes that despite the average consumer LCC savings being
( printed page 44530)
similar between TSL 2 ($110.9), TSL 3 ($117.4) and TSL 4 ($112.4), TSL 2 has a much lower fraction of consumers who experience a net cost (28.0%) than TSL 3 (42.7%) and TSL 4 (45.9%). In terms of industry investment to comply with each standard level, TSL 2 ($81.2 million) has considerably lower impact than TSL 3 ($116.2 million) and TSL 4 ($129.9 million).
Therefore, based on the previous considerations, DOE adopts the energy conservation standards for circulator pumps at TSL 2. The new energy conservation standards for circulator pumps, which are expressed as CEI, are shown in Table V.23.
2. Annualized Benefits and Costs of the Adopted Standards
The benefits and costs of the adopted standards can also be expressed in terms of annualized values. The annualized net benefit is (1) the annualized national economic value (expressed in 2022$) of the benefits from operating equipment that meet the adopted standards (consisting primarily of operating cost savings from using less energy), minus increases in equipment purchase costs, and (2) the annualized monetary value of the climate and health benefits.
Table V.24 shows the annualized values for circulator pumps under TSL 2, expressed in 2022$. The results under the primary estimate are as follows.
Using a 7-percent discount rate for consumer benefits and costs and NOX
and SO2
reductions, and the 3-percent discount rate case for GHG social costs, the estimated cost of the adopted standards for circulator pumps is $113.9 million per year in increased equipment installed costs, while the estimated annual benefits are $207.5 million from reduced equipment operating costs, $32.7 million in GHG reductions (climate benefits), and $50.7 million in health benefits from reduced NOX
and SO2
emissions. In this case, the net benefit amounts to $177 million per year.
Using a 3-percent discount rate for all benefits and costs, the estimated cost of the adopted standards for circulator pumps is $109.4 million per year in increased equipment costs, while the estimated annual benefits are $239.7 million in reduced operating costs, $32.7 million from GHG reductions, and $64.7 million from reduced NOX
and SO2
emissions. In this case, the net benefit amounts to $227.7 million per year.
( printed page 44531)
( printed page 44532)
VI. Procedural Issues and Regulatory Review
A. Review Under Executive Orders 12866, 13563, and 14094
Executive Order (“E.O.”) 12866, “Regulatory Planning and Review,” as supplemented and reaffirmed by E.O. 13563, “Improving Regulation and Regulatory Review,” 76 FR 3821 (Jan. 21, 2011) and amended by E.O. 14094, “Modernizing Regulatory Review,” 88 FR 21879 (April 11, 2023), requires agencies, to the extent permitted by law, to (1) propose or adopt a regulation only upon a reasoned determination that its benefits justify its costs (recognizing that some benefits and costs are difficult to quantify); (2) tailor regulations to impose the least burden on society, consistent with obtaining regulatory objectives, taking into account, among other things, and to the extent practicable, the costs of cumulative regulations; (3) select, in choosing among alternative regulatory approaches, those approaches that maximize net benefits (including potential economic, environmental, public health and safety, and other advantages; distributive impacts; and equity); (4) to the extent feasible, specify performance objectives, rather than specifying the behavior or manner of compliance that regulated entities must adopt; and (5) identify and assess available alternatives to direct regulation, including providing economic incentives to encourage the desired behavior, such as user fees or marketable permits, or providing information upon which choices can be made by the public. DOE emphasizes as well that E.O. 13563 requires agencies to use the best available techniques to quantify anticipated present and future benefits and costs as accurately as possible. In its guidance, the Office of Information and Regulatory Affairs (“OIRA”) in the Office of Management and Budget (“OMB”) has emphasized that such techniques may include identifying changing future compliance costs that might result from technological innovation or anticipated behavioral changes. For the reasons stated in the preamble, this final regulatory action is consistent with these principles.
Section 6(a) of E.O. 12866 also requires agencies to submit “significant regulatory actions” to OIRA for review. OIRA has determined that this final regulatory action constitutes a “significant regulatory action” within the scope of section 3(f)(1) of E.O. 12866., as amended by E.O. 14094. Accordingly, pursuant to section 6(a)(3)(C) of E.O. 12866, DOE has provided to OIRA an assessment, including the underlying analysis, of benefits and costs anticipated from the final regulatory action, together with, to the extent feasible, a quantification of those costs; and an assessment, including the underlying analysis, of costs and benefits of potentially effective and reasonably feasible alternatives to the planned regulation, and an explanation why the planned regulatory action is preferable to the identified potential alternatives. These assessments are summarized in this preamble and further detail can be found in the technical support document for this rulemaking.
B. Review Under the Regulatory Flexibility Act
The Regulatory Flexibility Act (5 U.S.C. 601et seq.) requires preparation of an initial regulatory flexibility analysis (“IRFA”) and a final regulatory flexibility analysis (“FRFA”) for any rule that by law must be proposed for public comment, unless the agency certifies that the rule, if promulgated, will not have a significant economic impact on a substantial number of small entities. As required by E.O. 13272, “Proper Consideration of Small Entities in Agency Rulemaking,” 67 FR 53461 (Aug. 16, 2002), DOE published procedures and policies on February 19, 2003, to ensure that the potential impacts of its rules on small entities are properly considered during the rulemaking process. 68 FR 7990. DOE has made its procedures and policies available on the Office of the General Counsel's website (
energy.gov/gc/office-general-counsel). DOE has prepared the following FRFA for the equipment that is the subject of this rulemaking.
For manufacturers of circulator pumps, the SBA has set a size threshold, which defines those entities classified as “small businesses” for the purposes of the statute. DOE used the SBA's small business size standards to determine whether any small entities would be subject to the requirements of the rule. (
See13 CFR part 121.) The size standards are listed by NAICS code and industry description and are available at
www.sba.gov/document/support-table-size-standards.
Manufacturing of circulator pumps is classified under NAICS 333914, “Measuring, Dispensing, and Other Pumping Equipment Manufacturing.” The SBA sets a threshold of 750 employees or fewer for an entity to be considered as a small business for this category.
1. Need for, and Objectives of, Rule
The January 2016 TP Final Rule and the January 2016 ECS Final Rule implemented the recommendations of the CIPWG established through the ASRAC to negotiate standards and a test procedure for general pumps. (Docket No. EERE-2013-BT-NOC-0039) The CIPWG approved a term sheet containing recommendations to DOE on appropriate standard levels for general pumps, as well as recommendations addressing issues related to the metric and test procedure for general pumps (“CIPWG recommendations”). (Docket No. EERE-2013-BT-NOC-0039, No. 92) Subsequently, ASRAC approved the CIPWG recommendations. The CIPWG recommendations included initiation of a separate rulemaking for circulator pumps. (Docket No. EERE-2013-BT-NOC-0039, No. 92, Recommendation #5A at p. 2)
On February 3, 2016, DOE issued a notice of intent to establish the Circulator Pumps Working Group to negotiate a NOPR for energy conservation standards for circulator pumps; to negotiate, if possible, Federal standards and a test procedure for circulator pumps; and to announce the first public meeting. 81 FR 5658. The CPWG met to address potential energy conservation standards for circulator pumps. Those meetings began on November 3-4, 2016, and concluded on November 30, 2016, with approval of a term sheet (“November 2016 CPWG Recommendations”) containing CPWG recommendations related to energy conservation standards, applicable test procedure, and labeling and certification requirements for circulator pumps. (Docket No. EERE-2016-BT-STD-0004, No. 98) As such, DOE has undertaken this rulemaking to consider establishing energy conservation standards for circulator pumps.
2. Significant Issues Raised by Public Comments in Response to the IRFA
HI commented that while they do not have any specific small business data to provide, the 2-year compliance lead time will be very difficult for small businesses to comply with, which may cause these small businesses to exit the market. As discussed in section III.H of this document, DOE is establishing a 4-year compliance date for energy conservation standards for circulator pumps. DOE interprets HI's comment regarding the impacts to small businesses will be mitigated if a 4-year compliance date is adopted.
3. Description and Estimated Number of Small Entities Affected
As previously described, DOE used SBA's definition of a small business to identify any circulator pump small business manufacturers. DOE used
( printed page 44533)
publicly available information to identify small businesses that manufacture circulator pumps covered in this rulemaking. DOE identified ten companies that are manufacturers of circulator pumps covered by this rulemaking. DOE screened out companies that do not meet the definition of a “small business,” are foreign-owned and operated, or do not manufacture circulator pumps in the United States. DOE identified three small businesses that manufacture circulator pumps in the United States using subscription-based business information tools to determine the number of employees and revenue of these small businesses.
4. Description of Reporting, Recordkeeping, and Other Compliance Requirements
This final rule establishes energy conservation standards for circulator pumps. To determine the impact on the small business manufacturers, DOE estimated the product conversion costs and capital conversion costs that all circulator pump manufacturers would incur. DOE additionally estimated the product and capital conversion costs that the three identified small business manufacturers would incur. Product conversion costs are investments in research, development, testing, marketing, and other non-capitalized costs necessary to make equipment designs comply with energy conservation standards. Capital conversion costs are one-time investments in plant, property, and equipment made in response to standards.
DOE estimates there is one small business that does not have any circulator pump models that would meet the adopted standards. The other two businesses both offer circulator pumps that would meet the adopted standards. DOE applied the conversion cost methodology described in section IV.J.2.c of this document to arrive at its estimate of product and capital conversion costs for the small business manufacturers. DOE assumes that all circulator pump manufacturers, including small business manufacturers, would spread conversion costs over the four-year compliance timeframe, as manufacturers are required to comply with standards four years after the publication of this final rule. Using publicly available data, DOE estimated the average annual revenue for each of the three small businesses, displayed in Table VI.1.
Additionally, these manufacturers could choose to discontinue their least efficient models and ramp up production of existing, compliant models rather than redesign each of their non-compliant models. Therefore, DOE's estimated conversion costs could overestimate the actual conversion costs that these small businesses would incur.
5. Significant Alternatives Considered and Steps Taken To Minimize Significant Economic Impacts on Small Entities
The discussion in the previous section analyzes impacts on small businesses that would result from the adopted standards, represented by TSL 2. In reviewing alternatives to the adopted standards, DOE examined energy conservation standards set at lower efficiency levels. While TSL 1 would reduce the impacts on small business manufacturers, it would come at the expense of a reduction in energy savings. TSL 1 achieves 80 percent lower energy savings and achieves 51 percent lower consumer net benefits compared to the energy savings and consumer net benefits at TSL 2.
Establishing standards at TSL 2 is the maximum improvement in energy efficiency that is technologically feasible and that DOE has determined in this final rule to be economically justified as requirement by EPCA, including considering the potential burdens placed on circulator pump manufacturers, including small business manufacturers. Accordingly, DOE is not adopting one of the other TSLs considered in the analysis, or the other policy alternatives examined as part of the regulatory impact analysis and included in chapter 17 of the final rule TSD.
Additional compliance flexibilities may be available through other means. Manufacturers subject to DOE's energy efficiency standards may apply to DOE's Office of Hearings and Appeals for exception relief under certain circumstances. Manufacturers should refer to 10 CFR part 430, subpart E, and 10 CFR part 1003 for additional details.
C. Review Under the Paperwork Reduction Act
Manufacturers of circulator pumps must certify to DOE that their equipment complies with any applicable energy conservation standards. In certifying compliance, manufacturers must test their equipment according to the DOE test procedures for circulator pumps, including any amendments adopted for those test procedures. DOE has established regulations for the certification and recordkeeping requirements for all covered consumer equipment and commercial equipment, including circulator pumps. (See generally 10 CFR part 429). The collection-of-information requirement for the certification and recordkeeping is subject to review and approval by OMB under the Paperwork Reduction Act (“PRA”). This requirement has been approved by OMB under OMB control number 1910-1400. Public reporting burden for the certification is estimated to average 35 hours per response, including the time for reviewing instructions, searching existing data sources, gathering and maintaining the data needed, and completing and reviewing the collection of information.
Certification data will be required for circulator pumps; however, DOE is not adopting certification or reporting requirements for circulator pumps in this final rule. Instead, DOE may consider proposals to establish certification requirements and reporting for circulator pumps under a separate rulemaking regarding appliance and equipment certification. DOE will address changes to OMB Control
( printed page 44534)
Number 1910-1400 at that time, as necessary.
Notwithstanding any other provision of the law, no person is required to respond to, nor shall any person be subject to a penalty for failure to comply with, a collection of information subject to the requirements of the PRA, unless that collection of information displays a currently valid OMB Control Number.
D. Review Under the National Environmental Policy Act of 1969
Pursuant to the National Environmental Policy Act of 1969 (“NEPA”), DOE has analyzed this proposed action rule in accordance with NEPA and DOE's NEPA implementing regulations (10 CFR part 1021). DOE has determined that this rule qualifies for categorical exclusion under 10 CFR part 1021, subpart D, appendix B5.1 because it is a rulemaking that establishes energy conservation standards for consumer equipment or industrial equipment, none of the exceptions identified in B5.1(b) apply, no extraordinary circumstances exist that require further environmental analysis, and it meets the requirements for application of a categorical exclusion. (
See10 CFR 1021.410.) Therefore, DOE has determined that promulgation of this rule is not a major Federal action significantly affecting the quality of the human environment within the meaning of NEPA, and does not require an environmental assessment or an environmental impact statement.
E.O. 13132, “Federalism,” 64 FR 43255 (Aug. 10, 1999), imposes certain requirements on Federal agencies formulating and implementing policies or regulations that preempt State law or that have federalism implications. The Executive order requires agencies to examine the constitutional and statutory authority supporting any action that would limit the policymaking discretion of the States and to carefully assess the necessity for such actions. The Executive order also requires agencies to have an accountable process to ensure meaningful and timely input by State and local officials in the development of regulatory policies that have federalism implications. On March 14, 2000, DOE published a statement of policy describing the intergovernmental consultation process it will follow in the development of such regulations. 65 FR 13735. DOE has examined this rule and has determined that it would not have a substantial direct effect on the States, on the relationship between the national government and the States, or on the distribution of power and responsibilities among the various levels of government. EPCA governs and prescribes Federal preemption of State regulations as to energy conservation for the equipment that are the subject of this final rule. States can petition DOE for exemption from such preemption to the extent, and based on criteria, set forth in EPCA.
See42 U.S.C. 6316(a) and (b); 42 U.S.C. 6297) Therefore, no further action is required by Executive Order 13132.
With respect to the review of existing regulations and the promulgation of new regulations, section 3(a) of E.O. 12988, “Civil Justice Reform,” imposes on Federal agencies the general duty to adhere to the following requirements: (1) eliminate drafting errors and ambiguity, (2) write regulations to minimize litigation, (3) provide a clear legal standard for affected conduct rather than a general standard, and (4) promote simplification and burden reduction. 61 FR 4729 (Feb. 7, 1996). Regarding the review required by section 3(a), section 3(b) of E.O. 12988 specifically requires that Executive agencies make every reasonable effort to ensure that the regulation (1) clearly specifies the preemptive effect, if any, (2) clearly specifies any effect on existing Federal law or regulation, (3) provides a clear legal standard for affected conduct while promoting simplification and burden reduction, (4) specifies the retroactive effect, if any, (5) adequately defines key terms, and (6) addresses other important issues affecting clarity and general draftsmanship under any guidelines issued by the Attorney General. Section 3(c) of E.O. 12988 requires Executive agencies to review regulations in light of applicable standards in section 3(a) and section 3(b) to determine whether they are met or it is unreasonable to meet one or more of them. DOE has completed the required review and determined that, to the extent permitted by law, this final rule meets the relevant standards of E.O. 12988.
G. Review Under the Unfunded Mandates Reform Act of 1995
Title II of the Unfunded Mandates Reform Act of 1995 (“UMRA”) requires each Federal agency to assess the effects of Federal regulatory actions on State, local, and Tribal governments and the private sector. Public Law 104-4, sec. 201 (codified at 2 U.S.C. 1531). For a regulatory action likely to result in a rule that may cause the expenditure by State, local, and Tribal governments, in the aggregate, or by the private sector of $100 million or more in any one year (adjusted annually for inflation), section 202 of UMRA requires a Federal agency to publish a written statement that estimates the resulting costs, benefits, and other effects on the national economy. (2 U.S.C. 1532(a), (b)) The UMRA also requires a Federal agency to develop an effective process to permit timely input by elected officers of State, local, and Tribal governments on a “significant intergovernmental mandate,” and requires an agency plan for giving notice and opportunity for timely input to potentially affected small governments before establishing any requirements that might significantly or uniquely affect them. On March 18, 1997, DOE published a statement of policy on its process for intergovernmental consultation under UMRA. 62 FR 12820. DOE's policy statement is also available at
energy.gov/sites/prod/files/gcprod/documents/umra_97.pdf.
DOE has concluded that this final rule may require expenditures of $100 million or more in any one year by the private sector. Such expenditures may include (1) investment in research and development and in capital expenditures by circulator pumps manufacturers in the years between the final rule and the compliance date for the new standards and (2) incremental additional expenditures by consumers to purchase higher-efficiency circulator pumps, starting at the compliance date for the applicable standard.
Section 202 of UMRA authorizes a Federal agency to respond to the content requirements of UMRA in any other statement or analysis that accompanies the final rule. (2 I.C. 1532(c)) The content requirements of section 202(b) of UMRA relevant to a private sector mandate substantially overlap the economic analysis requirements that apply under section 325(o) of EPCA and Executive Order 12866. The
SUPPLEMENTARY INFORMATION
section of this document and the TSD for this final rule respond to those requirements.
Under section 205 of UMRA, DOE is obligated to identify and consider a reasonable number of regulatory alternatives before promulgating a rule for which a written statement under section 202 is required. (2 U.S.C. 1535(a)) DOE is required to select from those alternatives the most cost-effective and least burdensome alternative that achieves the objectives of the rule unless DOE publishes an explanation for doing otherwise, or the selection of such an alternative is inconsistent with law. As required by 42 U.S.C. 6295(m), this final rule establishes new energy conservation standards for circulator pumps that are designed to achieve the
( printed page 44535)
maximum improvement in energy efficiency that DOE has determined to be both technologically feasible and economically justified, as required by 6295(o)(2)(A) and 6295(o)(3)(B). A full discussion of the alternatives considered by DOE is presented in chapter [17] of the TSD for this final rule.
H. Review Under the Treasury and General Government Appropriations Act, 1999
Section 654 of the Treasury and General Government Appropriations Act, 1999 (Pub. L. 105-277) requires Federal agencies to issue a Family Policymaking Assessment for any rule that may affect family well-being. This rule would not have any impact on the autonomy or integrity of the family as an institution. Accordingly, DOE has concluded that it is not necessary to prepare a Family Policymaking Assessment.
Pursuant to E.O. 12630, “Governmental Actions and Interference with Constitutionally Protected Property Rights,” 53 FR 8859 (March 18, 1988), DOE has determined that this rule would not result in any takings that might require compensation under the Fifth Amendment to the U.S. Constitution.
J. Review Under the Treasury and General Government Appropriations Act, 2001
Section 515 of the Treasury and General Government Appropriations Act, 2001 (44 U.S.C. 3516, note) provides for Federal agencies to review most disseminations of information to the public under information quality guidelines established by each agency pursuant to general guidelines issued by OMB. OMB's guidelines were published at 67 FR 8452 (Feb. 22, 2002), and DOE's guidelines were published at 67 FR 62446 (Oct. 7, 2002). Pursuant to OMB Memorandum M-19-15, Improving Implementation of the Information Quality Act (April 24, 2019), DOE published updated guidelines which are available at
www.energy.gov/sites/prod/files/2019/12/f70/DOE%20Final%20Updated%20IQA%20Guidelines%20Dec%202019.pdf.
DOE has reviewed this final rule under the OMB and DOE guidelines and has concluded that it is consistent with applicable policies in those guidelines.
E.O. 13211, “Actions Concerning Regulations That Significantly Affect Energy Supply, Distribution, or Use,” 66 FR 28355 (May 22, 2001), requires Federal agencies to prepare and submit to OIRA at OMB, a Statement of Energy Effects for any significant energy action. A “significant energy action” is defined as any action by an agency that promulgates or is expected to lead to promulgation of a final rule, and that (1) is a significant regulatory action under Executive Order 12866, or any successor order; and (2) is likely to have a significant adverse effect on the supply, distribution, or use of energy, or (3) is designated by the Administrator of OIRA as a significant energy action. For any significant energy action, the agency must give a detailed statement of any adverse effects on energy supply, distribution, or use should the proposal be implemented, and of reasonable alternatives to the action and their expected benefits on energy supply, distribution, and use.
DOE has concluded that this regulatory action, which sets forth new energy conservation standards for circulator pumps, is not a significant energy action because the standards are not likely to have a significant adverse effect on the supply, distribution, or use of energy, nor has it been designated as such by the Administrator at OIRA. Accordingly, DOE has not prepared a Statement of Energy Effects on this final rule.
L. Information Quality
On December 16, 2004, OMB, in consultation with the Office of Science and Technology Policy (“OSTP”), issued its Final Information Quality Bulletin for Peer Review (“the Bulletin”). 70 FR 2664 (Jan. 14, 2005). The Bulletin establishes that certain scientific information shall be peer reviewed by qualified specialists before it is disseminated by the Federal Government, including influential scientific information related to agency regulatory actions. The purpose of the Bulletin is to enhance the quality and credibility of the Government's scientific information. Under the Bulletin, the energy conservation standards rulemaking analyses are “influential scientific information,” which the Bulletin defines as “scientific information the agency reasonably can determine will have, or does have, a clear and substantial impact on important public policies or private sector decisions.” 70 FR 2664, 2667.
In response to OMB's Bulletin, DOE conducted formal peer reviews of the energy conservation standards development process and the analyses that are typically used and prepared a report describing that peer review.[90]
Generation of this report involved a rigorous, formal, and documented evaluation using objective criteria and qualified and independent reviewers to make a judgment as to the technical/scientific/business merit, the actual or anticipated results, and the productivity and management effectiveness of programs and/or projects. Because available data, models, and technological understanding have changed since 2007, DOE has engaged with the National Academy of Sciences to review DOE's analytical methodologies to ascertain whether modifications are needed to improve DOE's analyses. DOE is in the process of evaluating the resulting report.[91]
M. Congressional Notification
As required by 5 U.S.C. 801, DOE will report to Congress on the promulgation of this rule prior to its effective date. Pursuant to Subtitle E of the Small Business Regulatory Enforcement Fairness Act of 1996 (also known as the Congressional Review Act), the Office of Information and Regulatory Affairs has determined that this rule meets the criteria set forth in 5 U.S.C. 804(2).
VII. Approval of the Office of the Secretary
The Secretary of Energy has approved publication of this final rule.
This document of the Department of Energy was signed on April 9, 2024, by Jeffrey Marootian, Principal Deputy Assistant Secretary for Energy Efficiency and Renewable Energy, pursuant to delegated authority from the Secretary of Energy. That document with the original signature and date is maintained by DOE. For administrative purposes only, and in compliance with requirements of the Office of the Federal Register, the undersigned DOE
Federal Register
Liaison Officer has been authorized to sign and submit the document in electronic format for
( printed page 44536)
publication, as an official document of the Department of Energy. This administrative process in no way alters the legal effect of this document upon publication in the
Federal Register
.
Signed in Washington, DC, on April 10, 2024.
Treena V. Garrett,
Federal Register Liaison Officer,U.S. Department of Energy.
Circulator pumps energy conservation standards and their compliance dates.
* * * * *
(i) Each circulator pump that is manufactured starting on May 22, 2028 and that meets the criteria in paragraphs (i)(1) through (i)(2) of this section must have a circulator energy index (“CEI”) rating (as determined in accordance with the test procedure in § 431.464(c)(2)) of not more than 1.00 using the instructions in paragraph (i)(3) of this section and with a control mode as specified in paragraph (i)(4) of this section:
(1) Is a clean water pump as defined in § 431.462.
(2) Is not a submersible pump or a header pump, each as defined in § 431.462.
(3) The relationships in this paragraph (i)(3) are necessary to calculate maximum CEI.
(i) Calculate CEI according to the following equation:
Equation 1 to Paragraph (i)(3)(i)
Where:
CEI = the circulator energy index (dimensionless);
CER = the circulator energy rating (hp), determined in accordance with section 6 of appendix D to subpart Y of part 431; and
CERSTD
= the CER for a circulator pump that is minimally compliant with DOE's energy conservation standards with the same hydraulic horsepower as the rated pump (hp), determined in accordance with paragraph (i)(3)(ii) of this section.
(ii) Calculate CERSTD
according to the following equation:
Equation 2 to Paragraph (i)(3)(ii)
Where:
CERSTD
= the CER for a circulator pump that is minimally compliant with DOE's energy conservation standards with the same hydraulic horsepower as the rated pump (hp);
i = the index variable of the summation notation used to express CERSTD
(dimensionless) as described in the table 3 to paragraph (i)(3)(ii), in which i is expressed as a percentage of circulator pump flow at best efficiency point, determined in accordance with the test procedure in § 431.464(c)(2);
ωi
= the weighting factor (dimensionless) at each corresponding test point, i, as described in table 3 to paragraph (i)(3)(ii); and Piin,STD
= the reference power input to the circulator pump driver (hp) at test point i, calculated using the equations and method specified in paragraph (i)(3)(iii) of this section.
Table 3 to Paragraph
(i)(3)(ii)
I
(%)
Corresponding
ωi
25
.25
50
.25
75
.25
100
.25
(iii) Calculate Piin,STD
according to the following equation:
Equation 3 to Paragraph (i)(3)(iii)
Where:
Piin,STD
= the reference power input to the circulator pump driver at test point i (hp);
Pu,i
= circulator pump basic model rated hydraulic horsepower (hp) determined in accordance with 10 CFR 429.59(a)(2)(i);
αi
= part-load efficiency factor (dimensionless) at each test point i as described in table 4 to paragraph (i)(3)(iii); and
ηWTW,100%
= reference circulator pump wire-to-water efficiency at best efficiency point (%) at the applicable energy conservation standard level, as described in table 5 to paragraph (i)(3)(iii) as a function of circulator pump basic model rated hydraulic horsepower at 100% BEP flow, Pu,100%
.
( printed page 44537)
Table 4 to Paragraph (
i
)(3)(iii)
I
(%)
Corresponding
αi
25
0.4843
50
0.7736
75
0.9417
100
1
Table 5 to Paragraph (
i
)(3)(iii)
Pu,100%
ηWTW,100%
<1
10*ln(Pu,100%
+ 0.001141) + 67.78.
≥1
67.79%.
(4) A circulator pump subject to energy conservation standards as described in this paragraph (i) must achieve the maximum CEI as described in paragraph (i)(3)(i) of this section and in accordance with the test procedure in § 431.464(c)(2) in the least consumptive control mode in which it is capable of operating.
Note:
The following letter will not appear in the Code of Federal Regulations.
U.S. DEPARTMENT OF JUSTICE
Antitrust Division
RFK Main Justice Building
950 Pennsylvania Avenue NW
Washington, DC 20530-0001
January 26, 2024
Ami Grace-Tardy
Assistant General Counsel
for Litigation, Regulation and Energy Efficiency
U.S. Department of Energy
Washington, DC 20585
Re: Energy Conservation Standards for Circulator Pumps
DOE Docket No. EERE-2016-BT-STD-0004
Dear Assistant General Counsel Grace-Tardy:
I am responding to your November 28, 2023, letter seeking the views of the Attorney General about the potential impact on competition of energy conservation standards for circulator pumps.
Your request was submitted under Section 325(o)(2)(B)(i)(V) of the Energy Policy and Conservation Act, as amended (ECPA), 42 U.S.C. 6295(o)(2)(B)(i)(V), which requires the Attorney General to make a determination of the impact of any lessening of competition that is likely to result from the imposition of proposed energy conservation standards. The Attorney General's responsibility for responding to requests from other departments about the effect of a program on competition has been delegated to the Assistant Attorney General for the Antitrust Division in 28 CFR§ 0.40(g). The Assistant Attorney General for the Antitrust Division has authorized me, as the Policy Director for the Antitrust Division, to provide the Antitrust Division's views regarding the potential impact on competition of proposed energy conservation standards on his behalf.
In conducting its analysis, the Antitrust Division examines whether a potential amended standard may lessen competition, for example, by substantially limiting consumer choice, by placing certain manufacturers at an unjustified competitive disadvantage, or by inducing avoidable inefficiencies in production or distribution of particular products. A lessening of competition could result in higher prices to manufacturers and consumers.
We have reviewed the proposed standards contained in the Notice of proposed rulemaking and request for comment (87 FR 74850, December 6, 2022) and the related Technical Support Document. We have also reviewed public comments and information discussed at the Working Group Meetings held in November 29-30, 2016.
Based on this review, our conclusion is that the proposed energy conservation standards for circulator pumps are unlikely to have a significant impact on competition.
Sincerely,
David G.B. Lawrence,
Policy Director
Footnotes
1.
All references to EPCA in this document refer to the statute as amended through the Energy Act of 2020, Public Law 116-260 (Dec. 27, 2020), which reflect the last statutory amendments that impact Parts A and A-1 of EPCA.
2.
HI 41.5-2022 uses the term CERREF
for the analogous concept. In the September 2022 TP Final Rule, DOE discussed this decision to instead use CERSTD
in the context of Federal energy conservation standards.
3.
HI 41.5-2022 provides additional instructions for testing circulator pumps to determine an Energy Rating value for different circulator pump control varieties.
4.
The average LCC savings refer to consumers that are affected by a standard and are measured relative to the efficiency distribution in the no-new-standards case, which depicts the market in the compliance year in the absence of new standards (
see
section IV.F.9 of this document). The simple PBP, which is designed to compare specific efficiency levels, is measured relative to the baseline product (
see
section IV.C of this document).
5.
All monetary values in this document are expressed in 2022 dollars. and, where appropriate, are discounted to 2024 unless explicitly stated otherwise.
6.
The quantity refers to full-fuel-cycle (FFC) energy savings. FFC energy savings includes the energy consumed in extracting, processing, and transporting primary fuels (
i.e.,
coal, natural gas, petroleum fuels), and, thus, presents a more complete picture of the impacts of energy efficiency standards. For more information on the FFC metric, see section IV.H.2 of this document.
8.
DOE calculated emissions reductions relative to the no-new-standards-case, which reflects key assumptions in the
Annual Energy Outlook 2023
(
“AEO2023”).
AEO2023
reflects, to the extent possible, laws and regulations adopted through mid-November 2022, including the Inflation Reduction Act. See section IV.K of this document for further discussion of
AEO2023
assumptions that affect air pollutant emissions.
11.
DOE estimates the economic value of these emissions reductions resulting from the considered TSLs for the purpose of complying with the requirements of Executive Order 12866.
12.
To convert the time-series of costs and benefits into annualized values, DOE calculated a present value in 2024, the year used for discounting the NPV of total consumer costs and savings. For the benefits, DOE calculated a present value associated with each year's shipments in the year in which the shipments occur (
e.g.,
2020 or 2030), and then discounted the present value from each year to 2024. Using the present value, DOE then calculated the fixed annual payment over a 30-year period, starting in the compliance year, that yields the same present value.
13.
As discussed in section IV.L.1 of this document, DOE agrees with the IWG that using consumption-based discount rates (
e.g.,
3 percent) is appropriate when discounting the value of climate impacts. Combining climate effects discounted at an appropriate consumption-based discount rate with other costs and benefits discounted at a capital-based rate (
i.e.,
7 percent) is reasonable because of the different nature of the types of benefits being measured.
15.
Procedures, Interpretations, and Policies for Consideration in New or Revised Energy Conservation Standards and Test Procedures for Consumer Products and Commercial/Industrial Equipment, 86 FR 70892, 70901 (Dec. 13, 2021).
16.
All references in this document to the approved recommendations included in 2016 Term Sheets are noted with the recommendation number and a citation to the appropriate document in the CPWG docket (
e.g.,
Docket No. EERE-2016-BT-STD-0004, No. X, Recommendation #Y at p. Z). References to discussions or suggestions of the CPWG not found in the 2016 Term Sheets include a citation to meeting transcripts and the commenter, if applicable (
e.g.,
Docket No. EERE-2016-BT-STD-0004, [Organization], No. X at p. Y).
17.
The parenthetical reference provides a reference for information located in the docket of DOE's rulemaking to develop energy conservation standards for circulator pumps. (Docket No. EERE-2016-BT-STD-0004, which is maintained at
www.regulations.gov). The references are arranged as follows: (commenter name, comment docket ID number, page of that document).
18.
The November 2016 CPWG Recommendations predated establishment of the current metric, called “CEI,” and instead used the analogous term “PEICIRC
”. In the December 2021 TP NOPR, DOE proposed to adopt the “CEI” nomenclature instead based, in part, on comments received, to remain consistent with terminology used in HI 41.5 and to avoid potential confusion. After receiving favorable comments on its proposal, DOE adopted the CEI nomenclature in the September 2022 TP Final Rule.
19.
The November 2016 CPWG Recommendations predated establishment of the current term “CERSTD
” and instead used the analogous term “PERCIRC,STD
”. In the December 2021 TP NOPR, DOE proposed to adopt the “CERSTD
” nomenclature instead of “PERCIRC,STD
” because DOE believed that CERSTD
was more reflective of Federal energy conservation standards. After receiving no opposition on its proposal, DOE adopted the CERSTD
nomenclature in the September 2022 TP Final Rule.
20.
The November 2016 CPWG Recommendations did not explicitly include a value for the part-load efficiency factor, αi, in Recommendation #2E. Nonetheless, Recommendation #2C makes clear that a value for αi
is required to calculate reference input power, which calls for a value at test point i=100%. DOE infers the omission of α100%
from Recommendation #2E to reflect that i=100% corresponds to full-load, and thus implies no part-load-driven reduction in efficiency and, by extension, a load coefficient of unity. DOE is making this assumption that α100%
= 1 explicit by including it in this table, which is otherwise identical to that of Recommendation #2E.
24.
In this document, circulator pumps with “no controls” are also inclusive of other potential control varieties that are not one of the specifically identified control varieties.
26.
The FFC metric is discussed in DOE's statement of policy and notice of policy amendment. 76 FR 51282 (Aug. 18, 2011), as amended at 77 FR 49701 (Aug. 17, 2012).
27.
The numeric threshold for determining the significance of energy savings established in a final rule published on February 14, 2020 (85 FR 8626, 8670) was subsequently eliminated in a final rule published on December 13, 2021 (86 FR 70892).
28.
U.S. DOE Building Technologies Office. Energy Savings Potential and Opportunities for High-Efficiency Electric Motors in Residential and Commercial Equipment. December 2013. Prepared for the DOE by Navigant Consulting. pp. 4. Available at
energy.gov/sites/prod/files/2014/02/f8/Motor%20Energy%20Savings%20Potential%20Report%202013-12-4.pdf DFR.
31.
Because the projected price of standards-compliant equipment is typically higher than the price of baseline equipment, using the same markup for the incremental cost and the baseline cost would result in higher per-unit operating profit. While such an outcome is possible in the short run, DOE maintains that in markets that are reasonably competitive it is unlikely that standards would lead to a sustainable increase in profitability in the long run.
34.
Heating, Air Conditioning & Refrigeration Distributors International (“HARDI”),
2013 HARDI Profit Report,
available at
hardinet.org/
(last accessed February 07, 2023). Note that the 2013 HARDI Profit Report is the latest version of the report.
35.
Sales Tax Clearinghouse Inc.,
State Sales Tax Rates Along with Combined Average City and County Rates, 2023
(Available at:
thestc.com/STrates.stm) (Last accessed September. 11, 2023).
36.
U.S. Department of Energy-Energy Information Administration. 2012 Commercial Buildings Energy Consumption Survey (CBECS). 2018. (Last accessed September 29, 2023.)
www.eia.gov/consumption/commercial/data/2012/.
37.
U.S. Department of Energy: Energy Information Administration. 2015 Residential Energy Consumption Survey (RECS). 2015. (Last accessed September 29, 2023.)
www.eia.gov/consumption/residential/data/2015/.
38.
As discussed during the CPWG, a hot water recirculation pump is more likely to be available in a building where the distance from a water heater to outlets (
e.g.,
bathrooms) is such that the benefits of a HWR system are more pronounced. (Docket No. EERE-2016-BT-STD-0004, No. 46 at pp. 180-181,184)
39.
Arena, L. and O. Faakye. Optimizing Hydronic System Performance in Residential Applications. 2013. U.S. Department of Energy Building Technologies Office. Last accessed July 21, 2022.
www.nrel.gov/docs/fy14osti/60200.pdf.
40.
Heating Degree Day (HDD) is a measure of how cold a location was over a period of time, relative to a base temperature. In RECS and CBECS, the base temperature used is 65 °F and the period of time is one year. The heating degree-days for a single day is the difference between the base temperature and the day's average outside temperature if the daily average is less than the base, and zero if the daily average outside temperature is greater than or equal to the base temperature. The heating degree-days for a longer period of time are the sum of the daily heating degree-days for days in that period.
42.
Coughlin, K. and B. Beraki.2018. Residential Electricity Prices: A Review of Data Sources and Estimation Methods. Lawrence Berkeley National Lab. Berkeley, CA. Report No. LBNL-2001169.
ees.lbl.gov/publications/residential-electricity-prices-review.
44.
The implicit discount rate is inferred from a consumer purchase decision between two otherwise identical goods with different first cost and operating cost. It is the interest rate that equates the increment of first cost to the difference in net present value of lifetime operating cost, incorporating the influence of several factors: transaction costs; risk premiums and response to uncertainty; time preferences; interest rates at which a consumer is able to borrow or lend. The implicit discount rate is not appropriate for the LCC analysis because it reflects a range of factors that influence consumer purchase decisions, rather than the opportunity cost of the funds that are used in purchases.
45.
U.S. Board of Governors of the Federal Reserve System.
Survey of Consumer Finances.
1995, 1998, 2001, 2004, 2007, 2010, 2013, 2016, and 2019. (Last accessed May 1, 2023.)
www.federalreserve.gov/econresdata/scf/scfindex.htm.
47.
To develop the efficiency trend, DOE also utilized an estimated introduction year of 1994 for circulator pumps with ECMs. (Docket #0004, No. 78 at p. 6).
49.
Vernon, D., and Meier, A. (2012). “Identification and quantification of principal-agent problems affecting energy efficiency investments and use decisions in the trucking industry,”
Energy Policy,
49, 266-273.
50.
Blum, H. and Sathaye, J. (2010). “Quantitative Analysis of the Principal-Agent Problem in Commercial Buildings in the U.S.: Focus on Central Space Heating and Cooling,” Lawrence Berkeley National Laboratory, LBNL-3557E (Available at:
escholarship.org/uc/item/6p1525mg) (Last accessed March 14, 2024).
51.
Prindle, B., Sathaye, J., Murtishaw, S., Crossley, D., Watt, G., Hughes, J., and de Visser, E. (2007). “Quantifying the effects of market failures in the end-use of energy,” Final Draft Report Prepared for International Energy Agency (Available from International Energy Agency, Head of Publications Service, 9 rue de la Federation, 75739 Paris, Cedex 15 France).
52.
Bushee, B.J. (1998). “The influence of institutional investors on myopic R&D investment behavior,”
Accounting Review,
305-333. DeCanio, S.J. (1993). “Barriers Within Firms to Energy Efficient Investments,”
Energy Policy,
21(9), 906-914 (explaining the connection between short-termism and underinvestment in energy efficiency).
53.
International Energy Agency (IEA). (2007). Mind the Gap: Quantifying Principal-Agent Problems in Energy Efficiency. OECD Pub. (Available at
www.iea.org/reports/mind-the-gap) (Last accessed March 14, 2024).
54.
DeCanio, S.J. (1998). “The Efficiency Paradox: Bureaucratic and Organizational Barriers to Profitable Energy-Saving Investments,”
Energy Policy,
26(5), 441-454.
55.
Andersen, S.T., and Newell, R.G. (2004). “Information programs for technology adoption: the case of energy-efficiency audits,”
Resource and Energy Economics,
26, 27-50.
56.
DOE uses data on manufacturer shipments as a proxy for national sales, as aggregate data on sales are lacking. In general, one would expect a close correspondence between shipments and sales.
58.
According to manufacturer feedback, circulator pumps are typically replaced by the same model if available when they fail. Contractors and technicians are more likely to replace a like-for-like circulator pump in order to match installation configurations and that the replacement pump meets the performance criteria of the replaced one.
60.
DOE acknowledges that studies have found a rebound effect in residential heating situations. However, none of these studies address circulator pumps in particular. DOE does not expect that consumers would increase utilization of their heating system due to increased efficiency of a small component of the system.
61.
For more information on NEMS, refer to
The National Energy Modeling System: An Overview 2009,
DOE/EIA-0581(2009), October 2009. Available at
www.eia.gov/forecasts/aeo/index.cfm
(last accessed October 5, 2023).
66.
In the December 2022 NOPR (Table IV.13) DOE estimated that manufacturers will have to invest $54.7 million in product conversion costs and an additional $22.3 million in capital conversion cost ($77.0 million total). 87 FR 74850, 74886.
67.
At EL 2 DOE estimates the product conversion costs will be $56.4 million. This will increase to $91.5 million at EL 3 and increase to $105.1 million at EL 4.
69.
For further information, see the Assumptions to
AEO2023
report that sets forth the major assumptions used to generate the projections in the Annual Energy Outlook. Available at
www.eia.gov/outlooks/aeo/assumptions/
(last accessed September 29, 2023).
70.
CSAPR requires states to address annual emissions of SO2
and NOX, precursors to the formation of fine particulate matter (“PM2.5
”) pollution, in order to address the interstate transport of pollution with respect to the 1997 and 2006 PM2.5
National Ambient Air Quality Standards (“NAAQS”). CSAPR also requires certain states to address the ozone season (May-September) emissions of NOX, a precursor to the formation of ozone pollution, in order to address the interstate transport of ozone pollution with respect to the 1997 ozone NAAQS. 76 FR 48208 (Aug. 8, 2011). EPA subsequently issued a supplemental rule that included an additional five states in the CSAPR ozone season program; 76 FR 80760 (Dec. 27, 2011) (Supplemental Rule), and EPA issued the CSAPR Update for the 2008 ozone NAAQS. 81 FR 74504 (Oct. 26, 2016).
71.
In order to continue operating, coal power plants must have either flue gas desulfurization or dry sorbent injection systems installed. Both technologies, which are used to reduce acid gas emissions, also reduce SO2
emissions.
74.
See
EPA, Revised 2023 and Later Model Year Light-Duty Vehicle GHG Emissions Standards: Regulatory Impact Analysis, Washington, DC, December 2021. Available at
nepis.epa.gov/Exe/ZyPDF.cgi?Dockey=P1013ORN.pdf
(last accessed October 2, 2023).
77.
See U.S. Department of Commerce—Bureau of Economic Analysis.
Regional Multipliers: A User Handbook for the Regional Input-Output Modeling System (“RIMS II”).
1997. U.S. Government Printing Office: Washington, DC. Available at
apps.bea.gov/scb/pdf/regional/perinc/meth/rims2.pdf
(last accessed October 02, 2023).
78.
Livingston, O.V., S.R. Bender, M.J. Scott, and R.W. Schultz.
ImSET 4.0: Impact of Sector Energy Technologies Model Description and User's Guide.
2015. Pacific Northwest National Laboratory: Richland, WA. PNNL-24563.
79.
As shown in Table V.5, the rebuttable payback period for the recommended standard level (3.0 years) comes very close to satisfying the rebuttable presumption.
87.
EPCA requires DOE to review its standards at least once every 6 years, and requires, for certain equipment, a 3-year period after any new standard is promulgated before compliance is required, except that in no case may any new standards be required within 6 years of the compliance date of the previous standards. (42 U.S.C. 6295(m)) While adding a 6-year review to the 3-year compliance period adds up to 9 years, DOE notes that it may undertake reviews at any time within the 6-year period and that the 3-year compliance date may yield to the 6-year backstop. A 9-year analysis period may not be appropriate given the variability that occurs in the timing of standards reviews and the fact that for some equipment, the compliance period is 5 years rather than 3 years.
89.
While there are various factors that may lead to certain consumers experiencing a net cost (
e.g.,
high discount rates, lower equipment lifetimes, or a combination thereof), typically consumers who use their equipment for lower operating hours compared to the rest of the sample are generally less likely to recoup the purchase price of the equipment through operating cost savings.
90.
The 2007 “Energy Conservation Standards Rulemaking Peer Review Report” is available at the following website:
energy.gov/eere/buildings/downloads/energy-conservation-standards-rulemaking-peer-review-report-0
(last accessed September 19, 2023).