Securities and Exchange Commission
- [Release No. 34-104909/February 27, 2026]
I. Background
Section 31 of the Securities Exchange Act of 1934 (“Exchange Act”) requires each national securities exchange and national securities association to pay transaction fees to the Commission.[1] Specifically, Section 31(b) requires each national securities exchange to pay to the Commission fees based on the aggregate dollar amount of sales of certain securities (“covered sales”) transacted on the exchange.[2] Section 31(c) requires each national securities association to pay to the Commission fees based on the aggregate dollar amount of covered sales transacted by or through any member of the association other than on an exchange.[3]
Section 31 of the Exchange Act requires the Commission to annually adjust the fee rates applicable under Sections 31(b) and (c) to a uniform adjusted rate.[4] Specifically, the Commission must adjust the fee rates to a uniform adjusted rate that is reasonably likely to produce aggregate fee collections (including assessments on security futures transactions) equal to the regular appropriation to the Commission for the applicable fiscal year.[5]
The Commission is required to publish notice of the new fee rates under Section 31 not later than 30 days after the date on which an Act making a regular appropriation for the applicable fiscal year is enacted.[6] On February 3, 2026, the President signed into law the Consolidated Appropriations Act, 2026, which includes total appropriations of $2,149,000,000 to the SEC for fiscal year 2026.
II. Fiscal Year 2026 Annual Adjustment to the Fee Rate
The new fee rate is determined by (1) subtracting the sum of fees estimated to be collected prior to the effective date of the new fee rate [7] and estimated assessments on security futures transactions to be collected under Section 31(d) of the Exchange Act for all of fiscal year 2026 [8] from an amount equal to the regular appropriation to the Commission for fiscal year 2026, and (2) dividing by the estimated aggregate dollar amount of covered sales for the remainder of the fiscal year following the effective date of the new fee rate.[9]
As noted above, the Consolidated Appropriations Act, 2026, includes total appropriations of $2,149,000,000 to the Commission for fiscal year 2026.[10] The Commission estimates that it will collect $0 in fees for the period prior to the effective date of the new fee rate and $0 in assessments on round turn transactions in security futures products during all of fiscal year 2026. Using the methodology described in Appendix A, the Commission estimates that the aggregate dollar amount of covered sales for the remainder of fiscal year 2026 to be $104,121,391,900,000.
The uniform adjusted rate is computed by dividing the residual fees to be collected by the estimated aggregate dollar amount of covered sales for the remainder of fiscal year; this ( printed page 10644) results in a uniform adjusted rate for fiscal year 2026 of $20.60 per million.[11]
III. Effective Date of the Uniform Adjusted Rate
Under Section 31(j)(4)(A) of the Exchange Act, the fiscal year 2026 annual adjustments to the fee rates applicable under Sections 31(b) and (c) of the Exchange Act shall take effect on the later of October 1, 2025, or 60 days after the date on which a regular appropriation to the Commission for fiscal year 2026 is enacted.[12] The regular appropriation to the Commission for fiscal year 2026 was enacted on February 3, 2026, and accordingly, the new fee rates applicable under Sections 31(b) and (c) of the Exchange Act will take effect on April 4, 2026.
IV. Conclusion
Accordingly, pursuant to Section 31 of the Exchange Act,
It is hereby ordered that the fee rates applicable under Sections 31(b) and (c) of the Exchange Act shall be $20.60 per $1,000,000 effective on April 4, 2026.
By the Commission.
Sherry R. Haywood,
Assistant Secretary.
Appendix A
This appendix provides the methodology for determining the annual adjustment to the fee rates applicable under Sections 31(b) and (c) of the Exchange Act for fiscal year 2026. Section 31 of the Exchange Act requires the fee rates to be adjusted so that it is reasonably likely that the Commission will collect aggregate fees equal to its regular appropriation for fiscal year 2026.
To make the adjustment, the Commission must project the aggregate dollar amount of covered sales of securities on the securities exchanges and certain over-the-counter (“OTC”) markets over the course of the year. The fee rate equals the ratio of the Commission's regular appropriation for fiscal year 2026 (less the sum of fees to be collected during fiscal year 2026 prior to the effective date of the new fee rate and aggregate assessments on security futures transactions during all of fiscal year 2026) to the estimated aggregate dollar amount of covered sales for the remainder of the fiscal year following the effective date of the new fee rate.
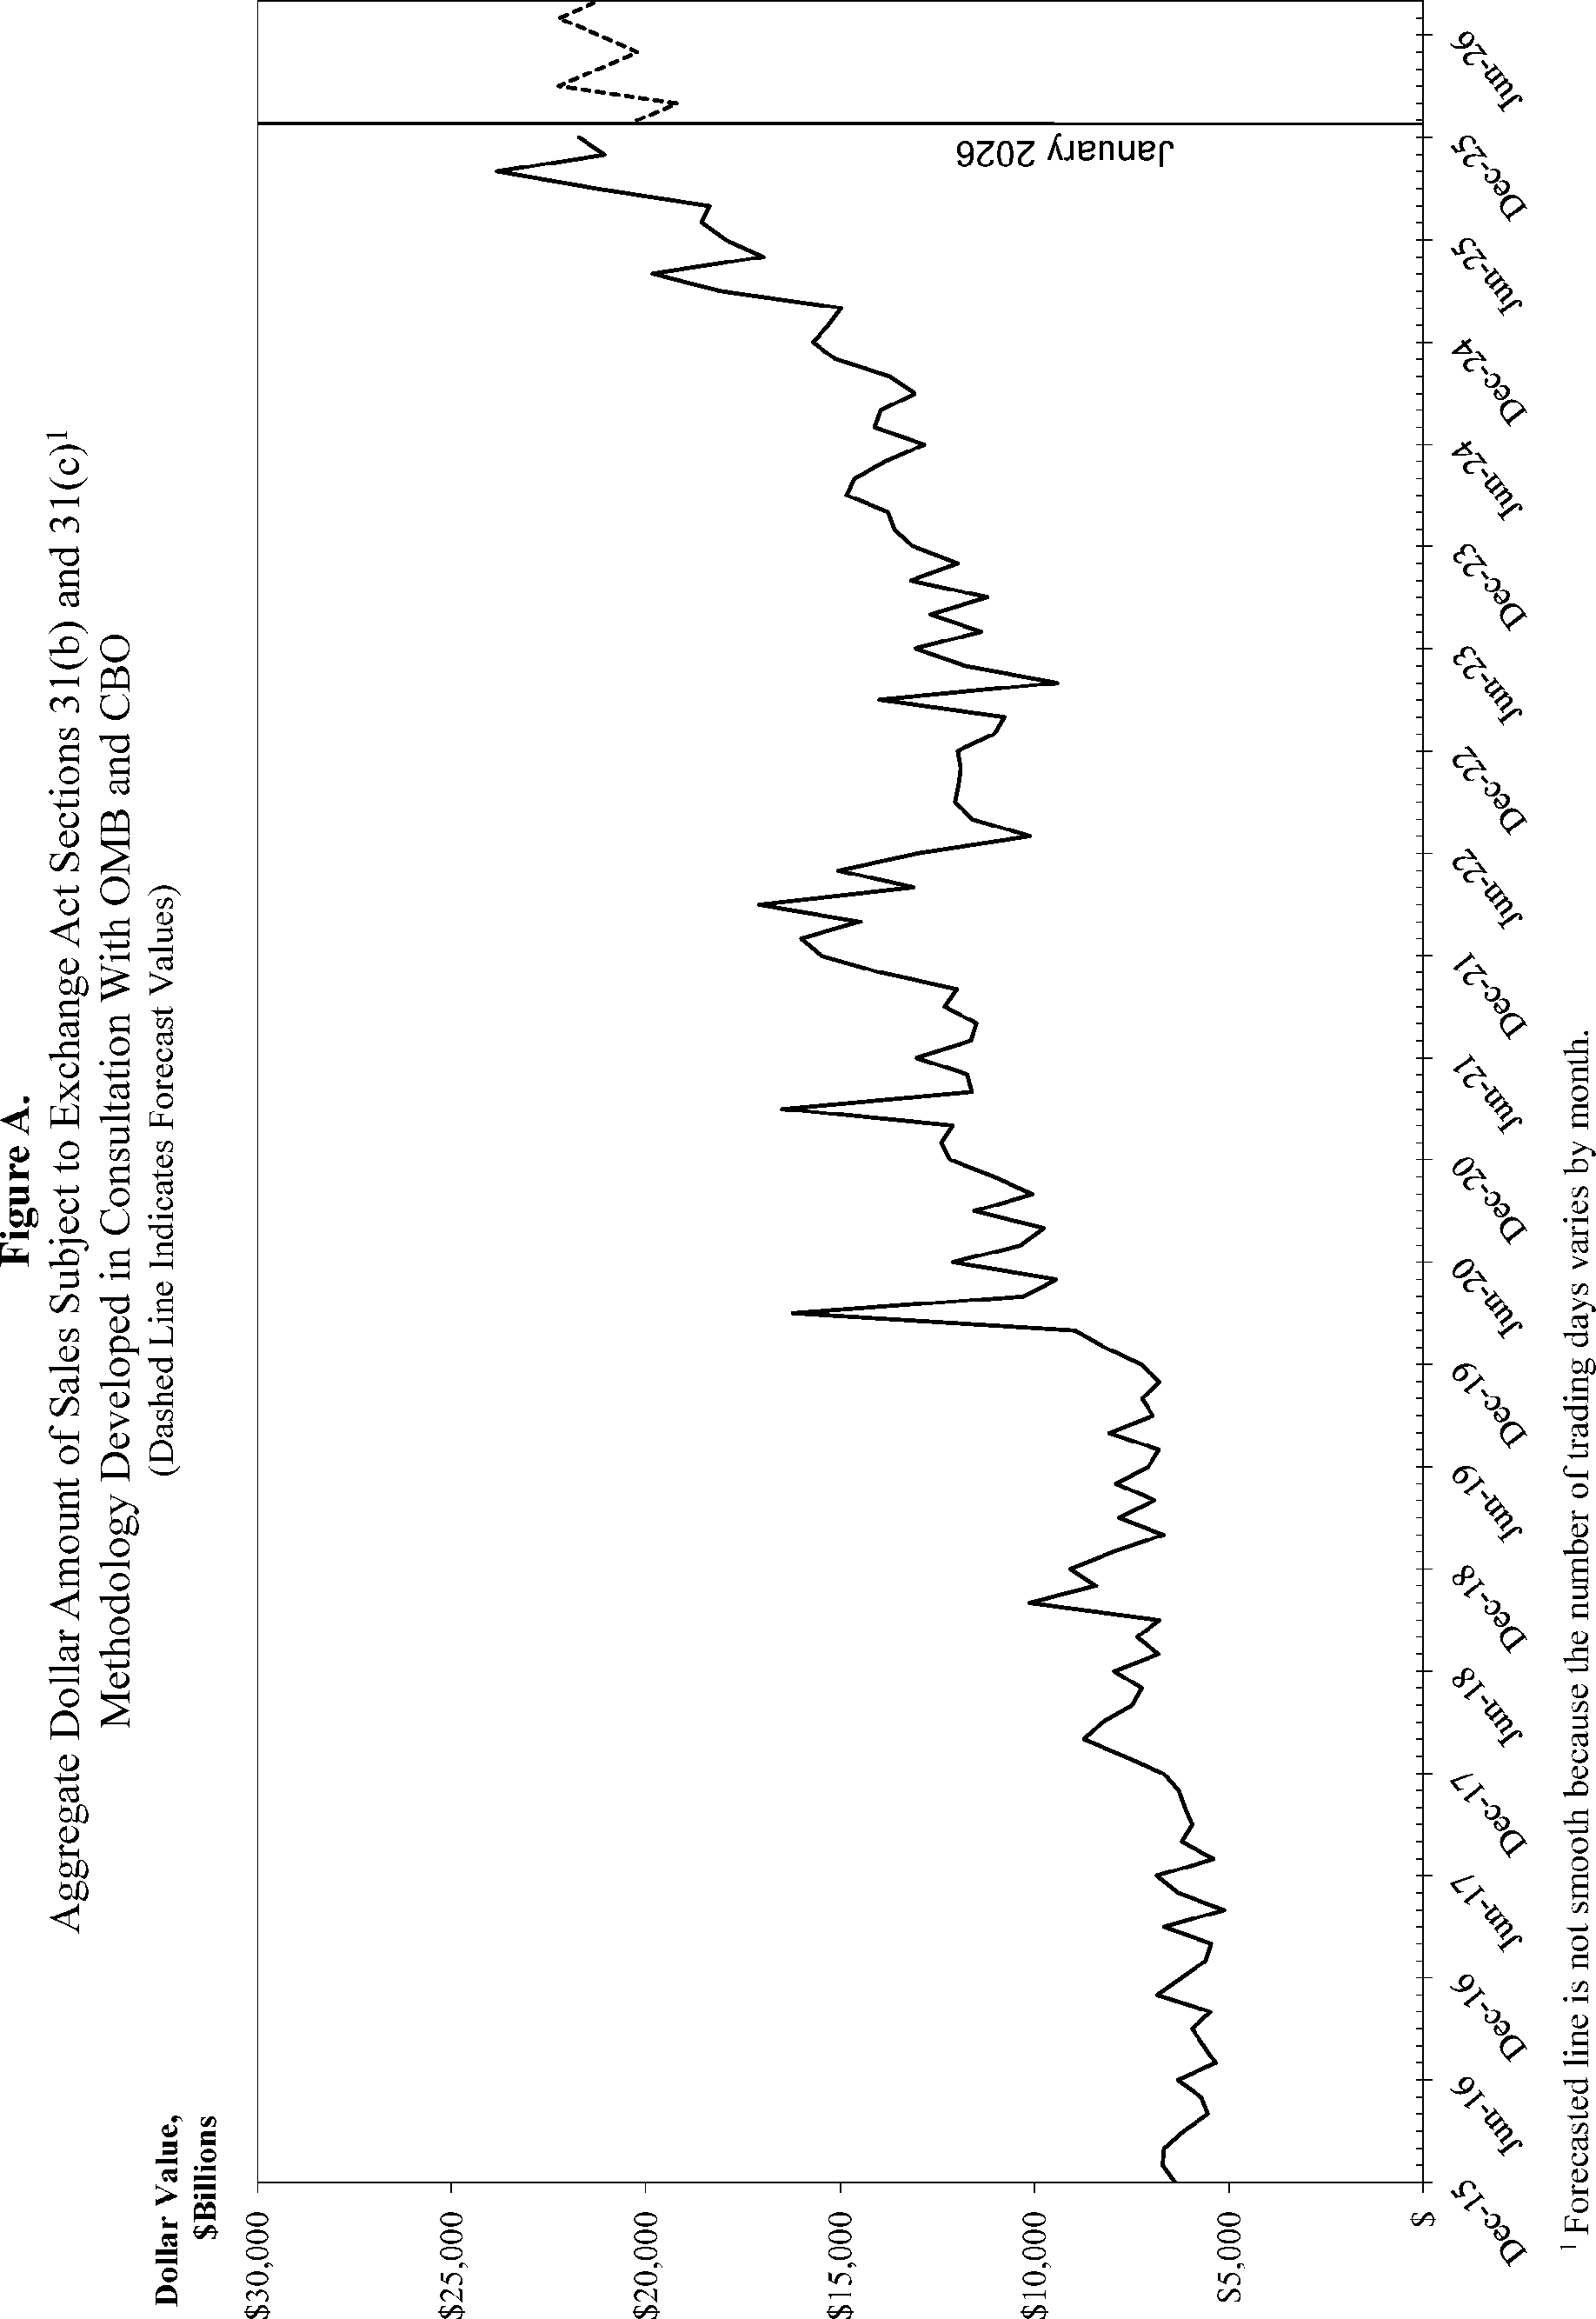
For 2026, the Commission has estimated the aggregate dollar amount of covered sales by projecting forward the trend established in the previous decade. More specifically, the dollar amount of covered sales was forecasted for months subsequent to December, 2025, the last month for which the Commission has data on the dollar volume of covered sales.[13]
The following sections describe this process in detail.
A. Baseline Estimate of the Aggregate Dollar Amount of Covered Sales for Fiscal Year 2026
First, calculate the average daily dollar amount of covered sales (“ADS”) for each month in the sample (April 2015 through December 2025). The monthly total dollar amount of covered sales (exchange plus certain OTC markets) is presented in column C of Table A.
The model forecasts the monthly moving average of the average daily dollar amount of covered sales. Each month's average daily dollar amount of covered sales is calculated by dividing the total covered sales for that month (column C of Table A) by the number of trading days for that month (column B of Table A). These amounts are shown in column D of Table A. The moving average will span the same number of months required to be forecast for the remainder of the fiscal year. The trailing moving average used in the forecast model is presented in column E of Table A.
To capture the recent trends in the monthly changes in the moving averages, calculate the one- and two-month lags of the trailing moving average shown in column E in Table A. These amounts are shown in columns F and G, respectively, of Table A.
Next, model the monthly trailing moving average of ADS as function of a constant term and the two lagged trailing moving averages using the ordinary least squares technique.
Use the estimated model to forecast the trailing moving average of ADS of the first month after the last available monthly data. Estimate the trailing moving average of the second month using the forecasted value of the first month and the actual value of the month before that. Similarly, estimate the trailing moving average of the third month using the forecasted values of the two previous months. Continue in this fashion until the end of the fiscal year.
The estimate of the trailing moving average ADS for the last applicable month in the fiscal year is a prediction of the moving average for those months that need to be predicted. This estimate is used as the predicted value of ADS for each month in the forecast period; to obtain the forecast total covered sales for each month, multiply the predicted ADS by the number of days in each month.
The following is a more formal (mathematical) description of the procedure:
1. Begin with the monthly data for total dollar volume of covered sales (column C). The sample spans ten years, from April 2015 through December 2025.[14] Divide each month's total dollar volume by the number of trading days in that month (column B) to obtain the average daily dollar volume (ADS, column D).
2. For each month t, calculate the eight-month trailing moving average of ADS (shown in column E). For example, the value for November 2015 is the average of the eight months ending in November 2015, or April 2015 through November 2015 inclusive.
3. Calculate the one- and two-month lags of the trailing moving average. For example, the one-month lag of the eight-month trailing moving average for December 2015 is equal to the eight-month trailing moving average for November 2015. The two-month lag of the eight-month trailing moving average for January 2016 is equal to the eight-month trailing moving average for November 2015. These are shown in columns F and G.
4. Estimate the model using ordinary least squares:
yt = α + β 1 yt-1 + β2yt-2 + ut
Where yt, is the eight-month trailing moving average of the average daily sales for month t, and yt-1 and yt-2 are the one- and two-month lags of yt, and ut representing the error term for month t. The model can be estimated using standard commercially available software. The estimated parameter values are α = +686,264,830, β1 = +1.647148, β2 = −0.644620. The root-mean squared error (RMSE) of the regression is 10,624,793,826.
5. The predicted value of the eight-month trailing moving average of the last month to be forecast represents the final forecast of covered sales for the entire prediction period. This value is shown in column H. This represents the prediction for August 2026. To calculate this value from the model above, one needs the one-month and two-month lag of the eight-month trailing moving average ADS, i.e., the eight-month trailing moving average for June and July. The eight-month trailing moving average for July is obtained by using the one- and two-month lags for July, that is, the eight-month trailing moving averages for June and May. To arrive at all the necessary inputs, one begins with the first month to be forecast, in this case, January 2026, and iterates predictions forward until the last month is predicted. One then multiplies the final predicted eight-month trailing moving average ADS by the number of days in each month to arrive at the forecast total dollar amount of covered sales. This is shown in column I.
6. For example, for January 2026, using the a, b1, and b2 parameter estimates shown above, along with the one- and two-month lags in the eight-month trailing moving average ADS (representing the eight-month trailing moving average ADS for November and December 2025, respectively), one can estimate the forecast eight-month trailing moving average ADS for January: ( printed page 10645) +686,264,830 + (1.647148 × 946,221,753,795) + (−0.644620 × 940,759,326,390) = 952,821,918,200.
7. With the estimated eight-month trailing moving average ADS for January 2026 calculated above, one can estimate the eight-month trailing moving average ADS for February 2026. The estimate obtained from January 2026 becomes the one-month lag for February, and the one-month lag used in the January forecast becomes the two-month lag for the February forecast. Thus, the predicted eight-month trailing moving average ADS for February 2026 is calculated as: +686,264,830 + (1.647148 × 952,821,918,200) + (−0.644620× 946,221,753,795) = 960,170,180,025.
8. Using the forecasts for January and February, one can estimate the value for March. Repeat this procedure for subsequent months, until the estimate for August 2026 is obtained. This value is 1,010,887,300,000.[15] This value is then used to calculate the final forecast total monthly covered sales for all eight months from January 2026 through August 2026.
9. To obtain the estimate of total monthly covered sales for each month, multiply the number of trading days in the month, shown in column B in Table A, by the final forecast eight-month trailing moving average ADS, shown in column H of Table A. This product is shown in column I of Table A, and these figures are used to calculate the new fee rate.
B. Using the Forecasts From A To Calculate the new fee Rate
1. Use Table A to estimate fees collected for the period September 1, 2025, through April 3, 2026. The projected aggregate dollar amount of covered sales for this period is $151,563,603,123,198. Actual and projected fee collections at the current fee rate of $0.00 per million are $0.
2. Estimate the amount of assessments on security futures products collected from September 1, 2025, through August 31, 2026. The only entity reporting assessable security futures products ceased operations in September 2020.[16] Consequently, the estimated amount of assessments on security futures products collected from September 2025 through August 2026 is zero.
3. Subtract the amount $0 from the target off-setting collection amount set by Congress of $2,149,000,000, resulting in $2,149,000,000 to be collected on dollar volume for the period April 4, 2026, through August 31, 2026.
4. Use Table A to estimate dollar volume for the period April 4, 2026, through August 31, 2026. The estimate is $104,121,391,900,000. Finally, compute the fee rate required to produce the $2,149,000,000 in revenue. This rate is $2,149,000,000 divided by $104,121,391,900,000 or 0.00002063937.
5. Round the result to the seventh decimal point, yielding a rate of 0.0000206 (or −$20.60 per million).
This table summarizes the estimates of the aggregate dollar amount of covered sales, by time period. The figures in this table can be used to determine the new fee rate.
| a. Baseline estimate of the aggregate dollar amount of sales, 09/01/2025 to 03/31/2026 ($Millions) | 149,541,829 |
| b. Baseline estimate of the aggregate dollar amount of sales, 04/01/2026 to 04/03/2026 ($Millions) | 2,021,775 |
| c. Baseline estimate of the aggregate dollar amount of sales, 04/04/2026 to 04/30/2026 ($Millions) | 19,206,859 |
| d. Baseline estimate of the aggregate dollar amount of sales, 05/01/2026 to 08/31/2026 ($Millions) | 84,914,533 |
| e. Estimated collections in assessments on security futures products in fiscal year 2026 ($Millions) | 0.000 |
| f. Implied fee rate (($2,149,000,000−$0.00 * (a + b)−e) / (c + d) | $20.60 |
| (A) | (B) | (C) | (D) | (E) | (F) | (G) | (H) | (I) |
|---|---|---|---|---|---|---|---|---|
| Month | Number of trading days in month | Total dollar amount of sales | Average daily dollar amount of sales (ADS) | 8-Month trailing moving average ADS | 1-Month lag of 8-month trailing moving average ADS | 2-Month lag of 8-month trailing moving average ADS | Forecast 8-month trailing moving average ADS | Forecast total dollar amount of sales |
| Apr-15 | 21 | $5,625,548,298,004 | $267,883,252,286 | |||||
| May-15 | 20 | 5,521,351,972,386 | 276,067,598,619 | |||||
| Jun-15 | 22 | 6,005,521,460,806 | 272,978,248,218 | |||||
| Jul-15 | 22 | 6,493,670,315,390 | 295,166,832,518 | |||||
| Aug-15 | 21 | 6,963,901,249,270 | 331,614,345,203 | |||||
| Sep-15 | 21 | 6,434,496,770,897 | 306,404,608,138 | |||||
| Oct-15 | 22 | 6,592,594,708,082 | 299,663,395,822 | |||||
| Nov-15 | 20 | 5,822,824,015,945 | 291,141,200,797 | $292,614,935,200 | ||||
| Dec-15 | 22 | 6,384,337,478,801 | 290,197,158,127 | 295,404,173,430 | $292,614,935,200 | |||
| Jan-16 | 19 | 6,696,059,796,055 | 352,424,199,792 | 304,948,748,577 | 295,404,173,430 | $292,614,935,200 | ||
| Feb-16 | 20 | 6,659,878,908,747 | 332,993,945,437 | 312,450,710,729 | 304,948,748,577 | 295,404,173,430 | ||
| Mar-16 | 22 | 6,161,943,754,542 | 280,088,352,479 | 310,565,900,725 | 312,450,710,729 | 304,948,748,577 | ||
| Apr-16 | 21 | 5,541,076,988,322 | 263,860,808,968 | 302,096,708,695 | 310,565,900,725 | 312,450,710,729 | ||
| May-16 | 21 | 5,693,520,415,112 | 271,120,019,767 | 297,686,135,149 | 302,096,708,695 | 310,565,900,725 | ||
| Jun-16 | 22 | 6,317,212,852,759 | 287,146,038,762 | 296,121,465,516 | 297,686,135,149 | 302,096,708,695 | ||
| Jul-16 | 20 | 5,331,797,261,269 | 266,589,863,063 | 293,052,548,300 | 296,121,465,516 | 297,686,135,149 | ||
| Aug-16 | 23 | 5,635,976,607,786 | 245,042,461,208 | 287,408,211,185 | 293,052,548,300 | 296,121,465,516 | ||
| Sep-16 | 21 | 5,942,072,286,976 | 282,955,823,189 | 278,724,664,109 | 287,408,211,185 | 293,052,548,300 | ||
| Oct-16 | 21 | 5,460,906,573,682 | 260,043,170,175 | 269,605,817,202 | 278,724,664,109 | 287,408,211,185 | ||
| Nov-16 | 21 | 6,845,287,809,886 | 325,966,086,185 | 275,340,533,915 | 269,605,817,202 | 278,724,664,109 | ||
| Dec-16 | 21 | 6,208,579,880,985 | 295,646,660,999 | 279,313,765,419 | 275,340,533,915 | 269,605,817,202 | ||
| Jan-17 | 20 | 5,598,200,907,603 | 279,910,045,380 | 280,412,518,620 | 279,313,765,419 | 275,340,533,915 | ||
| Feb-17 | 19 | 5,443,426,609,533 | 286,496,137,344 | 280,331,280,943 | 280,412,518,620 | 279,313,765,419 | ||
| Mar-17 | 23 | 6,661,861,914,530 | 289,646,170,197 | 283,213,319,335 | 280,331,280,943 | 280,412,518,620 | ||
| Apr-17 | 19 | 5,116,714,033,499 | 269,300,738,605 | 286,245,604,009 | 283,213,319,335 | 280,331,280,943 | ||
| May-17 | 22 | 6,305,822,460,672 | 286,628,293,667 | 286,704,662,819 | 286,245,604,009 | 283,213,319,335 | ||
| Jun-17 | 22 | 6,854,993,097,601 | 311,590,595,346 | 293,148,090,965 | 286,704,662,819 | 286,245,604,009 | ||
| Jul-17 | 20 | 5,394,333,070,522 | 269,716,653,526 | 286,116,911,883 | 293,148,090,965 | 286,704,662,819 | ||
| Aug-17 | 23 | 6,206,204,906,864 | 269,834,995,951 | 282,890,453,752 | 286,116,911,883 | 293,148,090,965 | ||
| Sep-17 | 20 | 5,939,886,169,525 | 296,994,308,476 | 285,025,986,639 | 282,890,453,752 | 286,116,911,883 | ||
| Oct-17 | 22 | 6,134,529,538,894 | 278,842,251,768 | 284,069,250,942 | 285,025,986,639 | 282,890,453,752 | ||
| Nov-17 | 21 | 6,289,748,560,897 | 299,511,836,233 | 285,302,459,196 | 284,069,250,942 | 285,025,986,639 | ||
| Dec-17 | 20 | 6,672,181,323,001 | 333,609,066,150 | 293,341,000,140 | 285,302,459,196 | 284,069,250,942 | ||
| Jan-18 | 21 | 7,672,288,677,308 | 365,347,079,872 | 303,180,848,415 | 293,341,000,140 | 285,302,459,196 | ||
| Feb-18 | 19 | 8,725,420,462,639 | 459,232,655,928 | 321,636,105,988 | 303,180,848,415 | 293,341,000,140 | ||
| Mar-18 | 21 | 8,264,755,011,030 | 393,559,762,430 | 337,116,494,601 | 321,636,105,988 | 303,180,848,415 | ||
| Apr-18 | 21 | 7,490,308,402,446 | 356,681,352,497 | 347,972,289,169 | 337,116,494,601 | 321,636,105,988 | ||
| May-18 | 22 | 7,242,077,467,361 | 329,185,339,426 | 351,996,168,038 | 347,972,289,169 | 337,116,494,601 | ||
| Jun-18 | 21 | 7,936,783,802,579 | 377,942,085,837 | 364,383,647,297 | 351,996,168,038 | 347,972,289,169 | ||
| Jul-18 | 21 | 6,807,593,326,456 | 324,171,110,784 | 367,466,056,615 | 364,383,647,297 | 351,996,168,038 | ||
| Aug-18 | 23 | 7,363,115,477,823 | 320,135,455,558 | 365,781,855,291 | 367,466,056,615 | 364,383,647,297 | ||
| Sep-18 | 19 | 6,781,988,459,996 | 356,946,761,052 | 364,731,815,439 | 365,781,855,291 | 367,466,056,615 | ||
| Oct-18 | 23 | 10,133,514,482,168 | 440,587,586,181 | 362,401,181,721 | 364,731,815,439 | 365,781,855,291 | ||
| Nov-18 | 21 | 8,414,847,862,204 | 400,707,041,057 | 363,294,591,549 | 362,401,181,721 | 364,731,815,439 | ||
| Dec-18 | 19 | 9,075,221,733,736 | 477,643,249,144 | 378,414,828,630 | 363,294,591,549 | 362,401,181,721 | ||
| Jan-19 | 21 | 7,960,664,643,749 | 379,079,268,750 | 384,651,569,795 | 378,414,828,630 | 363,294,591,549 | ||
| Feb-19 | 19 | 6,676,391,653,247 | 351,389,034,381 | 381,332,438,363 | 384,651,569,795 | 378,414,828,630 | ||
| Mar-19 | 21 | 7,828,979,311,928 | 372,808,538,663 | 387,412,116,848 | 381,332,438,363 | 384,651,569,795 | ||
| Apr-19 | 21 | 6,907,923,076,080 | 328,948,717,909 | 388,513,774,642 | 387,412,116,848 | 381,332,438,363 | ||
| May-19 | 22 | 7,895,053,976,747 | 358,866,089,852 | 388,753,690,742 | 388,513,774,642 | 387,412,116,848 | ||
| Jun-19 | 20 | 7,070,583,442,058 | 353,529,172,103 | 377,871,388,982 | 388,753,690,742 | 388,513,774,642 | ||
| Jul-19 | 22 | 6,792,811,319,721 | 308,764,150,896 | 366,378,527,712 | 377,871,388,982 | 388,753,690,742 | ||
| Aug-19 | 22 | 8,059,527,400,976 | 366,342,154,590 | 352,465,890,893 | 366,378,527,712 | 377,871,388,982 | ||
| Sep-19 | 20 | 6,958,132,871,506 | 347,906,643,575 | 348,569,312,746 | 352,465,890,893 | 366,378,527,712 | ||
| Oct-19 | 23 | 7,235,982,824,882 | 314,607,948,908 | 343,971,677,062 | 348,569,312,746 | 352,465,890,893 | ||
| Nov-19 | 20 | 6,784,888,230,209 | 339,244,411,510 | 339,776,161,168 | 343,971,677,062 | 348,569,312,746 | ||
| Dec-19 | 21 | 7,252,856,724,647 | 345,374,129,745 | 341,829,337,648 | 339,776,161,168 | 343,971,677,062 | ||
| Jan-20 | 21 | 8,178,172,797,805 | 389,436,799,895 | 345,650,676,403 | 341,829,337,648 | 339,776,161,168 | ||
| Feb-20 | 19 | 8,951,554,790,521 | 471,134,462,659 | 360,351,337,722 | 345,650,676,403 | 341,829,337,648 | ||
| ( printed page 10647) | ||||||||
| Mar-20 | 22 | 16,218,726,536,159 | 737,214,842,553 | 413,907,674,179 | 360,351,337,722 | 345,650,676,403 | ||
| Apr-20 | 21 | 10,289,596,902,933 | 489,980,804,902 | 429,362,505,468 | 413,907,674,179 | 360,351,337,722 | ||
| May-20 | 20 | 9,435,524,799,540 | 471,776,239,977 | 444,846,205,019 | 429,362,505,468 | 413,907,674,179 | ||
| Jun-20 | 22 | 12,093,857,552,130 | 549,720,797,824 | 474,235,311,133 | 444,846,205,019 | 429,362,505,468 | ||
| Jul-20 | 22 | 10,355,334,352,448 | 470,697,016,020 | 490,666,886,697 | 474,235,311,133 | 444,846,205,019 | ||
| Aug-20 | 21 | 9,763,364,099,611 | 464,922,099,981 | 505,610,382,976 | 490,666,886,697 | 474,235,311,133 | ||
| Sep-20 | 21 | 11,545,564,207,158 | 549,788,771,769 | 525,654,379,461 | 505,610,382,976 | 490,666,886,697 | ||
| Oct-20 | 22 | 10,052,383,314,951 | 456,926,514,316 | 523,878,385,918 | 525,654,379,461 | 505,610,382,976 | ||
| Nov-20 | 20 | 11,039,477,432,965 | 551,973,871,648 | 500,723,264,555 | 523,878,385,918 | 525,654,379,461 | ||
| Dec-20 | 22 | 12,172,302,216,779 | 553,286,464,399 | 508,636,471,992 | 500,723,264,555 | 523,878,385,918 | ||
| Jan-21 | 19 | 12,396,479,814,996 | 652,446,306,052 | 531,220,230,251 | 508,636,471,992 | 500,723,264,555 | ||
| Feb-21 | 19 | 12,103,659,666,497 | 637,034,719,289 | 542,134,470,435 | 531,220,230,251 | 508,636,471,992 | ||
| Mar-21 | 23 | 16,485,012,205,966 | 716,739,661,129 | 572,889,801,073 | 542,134,470,435 | 531,220,230,251 | ||
| Apr-21 | 21 | 11,602,282,119,601 | 552,489,624,743 | 583,835,741,668 | 572,889,801,073 | 542,134,470,435 | ||
| May-21 | 20 | 11,729,455,630,914 | 586,472,781,546 | 588,421,242,890 | 583,835,741,668 | 572,889,801,073 | ||
| Jun-21 | 22 | 13,038,812,281,463 | 592,673,285,521 | 605,389,589,291 | 588,421,242,890 | 583,835,741,668 | ||
| Jul-21 | 21 | 11,623,478,100,180 | 553,498,957,151 | 605,580,224,979 | 605,389,589,291 | 588,421,242,890 | ||
| Aug-21 | 22 | 11,493,350,851,643 | 522,425,038,711 | 601,722,546,768 | 605,580,224,979 | 605,389,589,291 | ||
| Sep-21 | 21 | 12,312,072,157,576 | 586,289,150,361 | 593,452,902,306 | 601,722,546,768 | 605,580,224,979 | ||
| Oct-21 | 21 | 12,011,570,888,110 | 571,979,566,100 | 585,321,008,158 | 593,452,902,306 | 601,722,546,768 | ||
| Nov-21 | 21 | 13,996,377,941,116 | 666,494,187,672 | 579,040,323,976 | 585,321,008,158 | 593,452,902,306 | ||
| Dec-21 | 22 | 15,494,373,840,971 | 704,289,720,044 | 598,015,335,888 | 579,040,323,976 | 585,321,008,158 | ||
| Jan-22 | 20 | 16,002,717,162,409 | 800,135,858,120 | 624,723,220,460 | 598,015,335,888 | 579,040,323,976 | ||
| Feb-22 | 19 | 14,483,452,476,259 | 762,286,972,435 | 645,924,931,324 | 624,723,220,460 | 598,015,335,888 | ||
| Mar-22 | 23 | 17,089,275,084,128 | 743,011,960,179 | 669,614,056,703 | 645,924,931,324 | 624,723,220,460 | ||
| Apr-22 | 20 | 13,123,148,685,917 | 656,157,434,296 | 686,330,606,151 | 669,614,056,703 | 645,924,931,324 | ||
| May-22 | 21 | 15,039,352,606,836 | 716,159,647,945 | 702,564,418,349 | 686,330,606,151 | 669,614,056,703 | ||
| Jun-22 | 21 | 13,021,062,095,851 | 620,050,575,993 | 708,573,294,586 | 702,564,418,349 | 686,330,606,151 | ||
| Jul-22 | 20 | 10,112,087,348,637 | 505,604,367,432 | 688,462,067,055 | 708,573,294,586 | 702,564,418,349 | ||
| Aug-22 | 23 | 11,593,039,396,644 | 504,045,191,158 | 663,431,500,945 | 688,462,067,055 | 708,573,294,586 | ||
| Sep-22 | 21 | 12,052,452,021,792 | 573,926,286,752 | 635,155,304,524 | 663,431,500,945 | 688,462,067,055 | ||
| Oct-22 | 21 | 11,962,224,366,908 | 569,629,731,758 | 611,073,149,439 | 635,155,304,524 | 663,431,500,945 | ||
| Nov-22 | 21 | 11,900,801,868,077 | 566,704,850,861 | 589,034,760,774 | 611,073,149,439 | 635,155,304,524 | ||
| Dec-22 | 21 | 11,980,859,826,961 | 570,517,134,617 | 578,329,723,314 | 589,034,760,774 | 611,073,149,439 | ||
| Jan-23 | 20 | 11,045,225,185,619 | 552,261,259,281 | 557,842,424,731 | 578,329,723,314 | 589,034,760,774 | ||
| Feb-23 | 19 | 10,787,317,510,620 | 567,753,553,191 | 551,305,296,881 | 557,842,424,731 | 578,329,723,314 | ||
| Mar-23 | 23 | 13,985,409,202,169 | 608,061,269,660 | 564,112,409,660 | 551,305,296,881 | 557,842,424,731 | ||
| Apr-23 | 19 | 9,399,552,596,651 | 494,713,294,561 | 562,945,922,585 | 564,112,409,660 | 551,305,296,881 | ||
| May-23 | 22 | 11,791,806,548,751 | 535,991,206,761 | 558,204,037,586 | 562,945,922,585 | 564,112,409,660 | ||
| Jun-23 | 21 | 13,061,036,476,029 | 621,954,117,906 | 564,744,585,855 | 558,204,037,586 | 562,945,922,585 | ||
| Jul-23 | 20 | 11,366,116,854,082 | 568,305,842,704 | 564,944,709,835 | 564,744,585,855 | 558,204,037,586 | ||
| Aug-23 | 23 | 12,671,358,964,418 | 550,928,650,627 | 562,496,149,336 | 564,944,709,835 | 564,744,585,855 | ||
| Sep-23 | 20 | 11,205,898,765,006 | 560,294,938,250 | 563,500,359,207 | 562,496,149,336 | 564,944,709,835 | ||
| Oct-23 | 22 | 13,188,976,620,062 | 599,498,937,276 | 567,468,532,218 | 563,500,359,207 | 562,496,149,336 | ||
| Nov-23 | 21 | 11,988,333,174,115 | 570,873,008,291 | 562,819,999,547 | 567,468,532,218 | 563,500,359,207 | ||
| Dec-23 | 20 | 13,128,847,387,720 | 656,442,369,386 | 583,036,133,900 | 562,819,999,547 | 567,468,532,218 | ||
| Jan-24 | 21 | 13,601,328,853,198 | 647,682,326,343 | 596,997,523,848 | 583,036,133,900 | 562,819,999,547 | ||
| Feb-24 | 20 | 13,773,538,263,581 | 688,676,913,179 | 605,337,873,257 | 596,997,523,848 | 583,036,133,900 | ||
| Mar-24 | 20 | 14,842,839,760,845 | 742,141,988,042 | 627,067,391,424 | 605,337,873,257 | 596,997,523,848 | ||
| Apr-24 | 22 | 14,638,651,655,508 | 665,393,257,069 | 641,375,467,229 | 627,067,391,424 | 605,337,873,257 | ||
| May-24 | 22 | 13,826,082,480,569 | 628,458,294,571 | 649,895,886,770 | 641,375,467,229 | 627,067,391,424 | ||
| Jun-24 | 19 | 12,831,940,323,239 | 675,365,280,170 | 659,379,179,631 | 649,895,886,770 | 641,375,467,229 | ||
| Jul-24 | 22 | 14,104,512,115,506 | 641,114,187,068 | 668,159,326,979 | 659,379,179,631 | 649,895,886,770 | ||
| Aug-24 | 22 | 13,948,316,899,330 | 634,014,404,515 | 665,355,831,370 | 668,159,326,979 | 659,379,179,631 | ||
| Sep-24 | 20 | 13,073,651,577,918 | 653,682,578,896 | 666,105,862,939 | 665,355,831,370 | 668,159,326,979 | ||
| Oct-24 | 23 | 13,738,447,402,519 | 597,323,800,110 | 654,686,723,805 | 666,105,862,939 | 665,355,831,370 | ||
| Nov-24 | 20 | 15,117,645,718,320 | 755,882,285,916 | 656,404,261,039 | 654,686,723,805 | 666,105,862,939 | ||
| Dec-24 | 21 | 15,704,624,168,553 | 747,839,246,122 | 666,710,009,671 | 656,404,261,039 | 654,686,723,805 | ||
| Jan-25 | 20 | 15,298,115,468,255 | 764,905,773,413 | 683,765,944,526 | 666,710,009,671 | 656,404,261,039 | ||
| Feb-25 | 19 | 14,975,273,939,488 | 788,172,312,605 | 697,866,823,580 | 683,765,944,526 | 666,710,009,671 | ||
| Mar-25 | 21 | 18,093,127,738,971 | 861,577,511,380 | 725,424,739,119 | 697,866,823,580 | 683,765,944,526 | ||
| Apr-25 | 21 | 19,822,747,389,726 | 943,940,351,892 | 764,165,482,541 | 725,424,739,119 | 697,866,823,580 | ||
| May-25 | 21 | 16,983,642,177,865 | 808,744,865,613 | 783,548,268,381 | 764,165,482,541 | 725,424,739,119 | ||
| Jun-25 | 20 | 17,964,511,164,856 | 898,225,558,243 | 821,160,988,148 | 783,548,268,381 | 764,165,482,541 | ||
| Jul-25 | 22 | 18,565,691,120,241 | 843,895,050,920 | 832,162,583,773 | 821,160,988,148 | 783,548,268,381 | ||
| Aug-25 | 21 | 18,361,048,773,892 | 874,335,655,900 | 847,974,634,995 | 832,162,583,773 | 821,160,988,148 | ||
| ( printed page 10648) | ||||||||
| Sep-25 | 21 | 21,261,215,063,850 | 1,012,438,812,564 | 878,916,264,889 | 847,974,634,995 | 832,162,583,773 | ||
| Oct-25 | 23 | 23,822,371,846,734 | 1,035,755,297,684 | 909,864,138,024 | 878,916,264,889 | 847,974,634,995 | ||
| Nov-25 | 19 | 21,066,041,347,783 | 1,108,739,018,304 | 940,759,326,390 | 909,864,138,024 | 878,916,264,889 | ||
| Dec-25 | 22 | 21,728,074,964,832 | 987,639,771,129 | 946,221,753,795 | 940,759,326,390 | 909,864,138,024 | ||
| Jan-26 | 20 | 946,221,753,795 | 940,759,326,390 | $1,010,887,300,000 | $20,217,746,000,000 | |||
| Feb-26 | 19 | 946,221,753,795 | 1,010,887,300,000 | 19,206,858,700,000 | ||||
| Mar-26 | 22 | 1,010,887,300,000 | 22,239,520,600,000 | |||||
| Apr-26 | 21 | 1,010,887,300,000 | 21,228,633,300,000 | |||||
| May-26 | 20 | 1,010,887,300,000 | 20,217,746,000,000 | |||||
| Jun-26 | 21 | 1,010,887,300,000 | 21,228,633,300,000 | |||||
| Jul-26 | 22 | 1,010,887,300,000 | 22,239,520,600,000 | |||||
| Aug-26 | 21 | 1,010,887,300,000 | 21,228,633,300,000 | |||||