Small Business Size Standards: Revised Size Standards Methodology
The U.S. Small Business Administration (SBA or Agency) advises the public that it has revised its white paper explaining how it establishes, reviews, and modifies small business...
Notice of availability of Revised Size Standards Methodology for comments.
SUMMARY:
The U.S. Small Business Administration (SBA or Agency) advises the public that it has revised its white paper explaining how it establishes, reviews, and modifies small business size standards. The revised white paper provides a detailed description of SBA's size standards methodology, including changes from SBA's 2024 Revised Size Standards Methodology (2024 Methodology, available at
www.sba.gov/size). SBA welcomes comments and feedback on the 2026 Revised Methodology, which SBA has applied to the proposed review of size standards filed concurrently in the
Federal Register
.
DATES:
SBA must receive comments on the 2026 Revised Methodology on or before September 21, 2026.
ADDRESSES:
You may submit comments identified Docket No. SBA-2026-0265 by one of the following methods:
(1)
Federal eRulemaking Portal: www.regulations.gov.
Follow the instructions for submitting comments; or
(2)
Mail/Hand Delivery/Courier:
Ryan Lambert, Associate Administrator, Office of Government Contracting and Business Development 409 Third Street SW, Mail Code 6530, Washington, DC 20416.
SBA will post all comments on this Revised Methodology on
www.regulations.gov.
If you wish to submit confidential business information (CBI) as defined in the User Notice at
www.regulations.gov,
you must submit such information to
GCBDregs@sba.gov
with “2026 Revised Methodology” in the subject heading. Highlight the information that you consider to be CBI, and explain why you believe SBA should hold this information as confidential. SBA will review your information and determine whether it will make the information public.
FOR FURTHER INFORMATION CONTACT:
Ryan Lambert, Associate Administrator, Office of Government Contracting and Business Development,
GCBDregs@sba.gov.
SUPPLEMENTARY INFORMATION:
1. Introduction
This document describes the U. S. Small Business Administration's (SBA or Agency) proposed methodology for establishing, reviewing, or adjusting its small business size standards pursuant to the Small Business Act, 15 U.S.C. 631et seq.
(the “Act”). Under the Act (15 U.S.C. 632(a)(2)(A)), the SBA Administrator (Administrator) has the authority to establish small business size standards for federal government programs. This document provides a detailed description of SBA's proposed revised size standards methodology.
SBA sets the standard for what most agencies consider a small business for myriad government programs. From their inception, small business size standards were intended as the mechanism to allow small firms to compete for government contracts, obtain small business loans, obtain relief from regulatory burdens, and participate in other agency small business programs—thereby leading to their financial and economic success. However, over the years the SBA methodology turned into a ceiling in which firms forewent business growth to remain small under a seemingly unresponsive size cap. The proposed SBA methodology adjusts the prior standards that restricted such economic growth. The new standards strengthen American entrepreneurs by ensuring they are not punished for their success, resulting in lost access to capital or contracting opportunities.
The Act sets out a number of requirements for establishing size standards. For example, no concern shall be considered a small business concern unless it is independently owned and operated and is not dominant in its field of operation.
See15 U.S.C. 632(a)(1). In promulgating size standards, the Administration is required to vary size standards from industry to industry to reflect the differing characteristics of industries.
See15 U.S.C. 632(a)(3). Further, and generally, the policy decisions of the Agency should assist small businesses as a means of encouraging and strengthening their competitive position in the economy.
See15 U.S.C. 631(a). These considerations, along with other statutory requirements, serve as the principal basis for SBA's size standards methodology for establishing, reviewing, or modifying small business size standards.
SBA's proposed size standards methodology examines the structural characteristics of an industry or industry group as a basis to assess differences and the overall degree of competitiveness within the industry or industry group. To ensure its size standards offer complete coverage of all areas of the economy where small businesses may compete, SBA uses the most recent revision of the North American Industry Classification System (NAICS), as a method to group similar firms. As used herein, SBA considers an industry to be a 5- or 6- digit NAICS code and an industry group to be a 4-digit NAICS code. As described more fully later in this document, SBA is examining industry structure by analyzing average market size. Average market size can be broken down into three components: first the total size of all participants in the industry group or industry, including for-profit businesses, not-for-profit entities, and government owned entities, which is referred to as the national industry size; second, the number of distinct geographic markets in which competition takes place; and finally an adjustment for imports and exports to account for international competition faced by domestic firms. Industry groups or industries with smaller average market sizes are given smaller size standards as less scale (as a matter of economics) is required in those industries for a firm to be dominant, while industries or industry groups with larger average market sizes are given larger size standards as a greater level of scale is required for a firm to be dominant. If SBA's proposed or revised size standards deviate from the analytical results based on these factors, the Agency will provide a detailed explanation in the final rulemaking.
In addition to reviewing all size standards and adjusting them, as necessary, every five years based on the analysis of industry structure in accordance with the Small Business Jobs Act of 2010 (“Jobs Act”) (Pub. L. 111-240, 124 Stat. 2504, September 27, 2010), SBA also adjusts all receipt based standards for inflation at the same time. SBA has also adjusted receipt based standards for inflation between such reviews as necessary. SBA most recently adjusted size standards for inflation on November 17, 2022 (87 FR 69118). As laid out further herein, SBA is also proposing to adjust receipt-based size standards for productivity growth, and may do so between five-year reviews as necessary. SBA also updates its size standards every five years to adopt the Office of Management and Budget's (OMB) quinquennial NAICS revisions to its table of small business size standards. Effective October 1, 2022, SBA adopted the OMB's 2022 NAICS revisions (86 FR 72277; December 21,
( printed page 54097)
2021) for its table of small business size standards (87 FR 59240; September 29, 2022).
2. Background on SBA's Size Standards Methodology
There is a long history of the U.S. Federal Government establishing small business size standards that predates the establishment of SBA. This section documents the statutory authority for SBA to establish small business size standards and the historical background from the original establishment of a 500-employee size standard by the Small War Plants Corporation in World War II through the most recent size standards methodology revision in 2024. This section is broken down into four parts. First is an overview of the statutory authority for SBA's establishment of small business size standards. Second is the legislative history of that statutory authority. Third is the regulatory history of SBA's implementation of that statutory authority. Last is a summary of the most recent size standards methodology from 2024, which this document is modifying. SBA requests comment on its new methodology, including on any reliance interests implicated by such methodology.
2.1 Statutory Authority
Authority for the Administrator to establish small business size standards for Federal Government programs is the Small Business Act, 15 U.S.C 632et seq.
(the Act). Congress has periodically modified the Act, but has not provided specific values for size standards for Federal Government purposes, other than previously for agricultural enterprises. With respect to general directions on how SBA should establish small business size standards, the Act provides the following:
(1) In General—For the purposes of this Act, a small-business concern, including but not limited to enterprises that are engaged in the business of production of food and fiber, ranching and raising of livestock, aquaculture, and all other farming and agricultural related industries, shall be deemed to be one which is independently owned and operated and which is not dominant in its field of operation.
(2) Establishment of Size Standards.—
(A) In General.—In addition to the criteria specified in paragraph (1), the Administrator may specify detailed definitions or standards by which a business concern may be determined to be a small business concern for the purposes of this Act or any other Act.
(B) Additional Criteria.—The standards described in paragraph (1) may utilize number of employees, dollar volume of business, net worth, net income, a combination thereof, or other appropriate factors.
(C) Requirements.—Unless specifically authorized by statute, no Federal department or agency (including the Administration when acting pursuant to subparagraph (A)) may prescribe a size standard for categorizing a business concern as a small business concern, unless such proposed size standard—
(i) is proposed after an opportunity for public notice and comment;
(ii) provides for determining—
(I) the size of a manufacturing concern as measured by the manufacturing concern's average employment based upon employment during each of the manufacturing concern's pay periods for the preceding 24 months;
(II) the size of a business concern providing services on the basis of the annual average gross receipts of the business concern over a period of not less than 5 years;
(III) the size of other business concerns on the basis of data over a period of not less than 3 years; or
(IV) other appropriate factors; and
(iii) is approved by the Administrator.
(3) Variation by Industry and Consideration of Other Factors.—When establishing or approving any size standard pursuant to paragraph (2), the Administrator shall ensure that the size standard varies from industry to industry to the extent necessary to reflect the differing characteristics of the various industries and consider other factors deemed to be relevant by the Administrator.
(6) Proposed Rulemaking.—In conducting rulemaking to revise, modify or establish size standards pursuant to this section, the Administrator shall consider, and address, and make publicly available as part of the notice of proposed rulemaking and notice of final rule each of the following:
(A) a detailed description of the industry for which the new size standard is proposed;
(B) an analysis of the competitive environment for that industry;
(C) the approach the Administrator used to develop the proposed standard including the source of all data used to develop the proposed rulemaking; and
(D) the anticipated effect of the proposed rulemaking on the industry, including the number of concerns not currently considered small that would be considered small under the proposed rulemaking and the number of concerns currently considered small that would be deemed other than small under the proposed rulemaking.
(7) Common Size Standards.—In carrying out this subsection, the Administrator may establish or approve a single size standard for a grouping of four-digit North American Industry Classification System codes only if the Administrator makes publicly available, not later than the date on which such size standard is established or approved, a justification demonstrating that such size standard is appropriate for each individual industry classification included in the grouping.
(8) Number of Size Standards.—The Administrator shall not limit the number of size standards established pursuant to paragraph (2) and shall assign the appropriate size standard to each North American Industry Classification System Code.
15 U.S.C. 632(a)(2)(A) and
id.
632(a)(2)(B) of the Act says “the Administrator may specify detailed definitions or standards by which a business concern may be determined to be a small business concern” and may utilize factors such as “number of employees, dollar volume of business, net worth, net income, a combination thereof, or other appropriate factors.” 15 U.S.C. 632(a)(2)(C) refers to the procedures for the setting of size standards by federal agencies (including SBA) and
id.
632(a)(3) provides that the Administrator “shall ensure that the size standard varies from industry to industry to the extent necessary to reflect the differing characteristics of the various industries and consider other factors deemed to be relevant”. This authorizes the Administrator to consider, in addition to industry data, other relevant factors, such as current economic conditions, impacts size standards changes would have on small businesses, and public comments when determining size standards.
The requirements for conducting rulemaking to establish, revise or modify size standards are stated in 15 U.S.C. 632(a)(6). The requirements for establishing a common size standard for a grouping of industries are provided in 15 U.S.C. 632(a)(7). Finally, 15 U.S.C. 632(a)(8) directs the Administrator “not limit the number of size standards established . . . and shall assign the appropriate size standard to each [NAICS] Code”. Along with the above broad statutory requirements, the Act also directs the Agency to encourage competition and to ensure that a fair proportion of total Federal purchases, contracts, and property sales be placed with small business enterprises (15 U.S.C. 631(a)). Congress went on to state that “the preservation and expansion of
( printed page 54098)
such competition is basic not only to the economic well-being but to the security of this Nation.”
Id.
Additionally, the National Defense Authorization Act for Fiscal Year 2017 (Pub. L. 114-328), authorized the Administrator to establish size standards for agricultural enterprises in the same manner as for other industries and requires a rolling review of periodic updates. Historically, the size standards for most agricultural industries were established by statute.
2.2 Legislative History
The above statutory language provides the Administrator with broad discretion in establishing, reviewing, or revising size standards. Reading the legislative history of the Act provides further insight. The requirement that a small business concern be “independently owned and operated” requires SBA to define the size of a firm together with its affiliates when calculating its size.[1]
Therefore, SBA must consider not only the size of a firm but also the size of all of its affiliates (both domestic and foreign) when establishing, reviewing, or revising size standards and when determining its small business eligibility for Federal Government programs.
The Banking and Currency Committee recognized the “impossibility of attempting to write into law a rigid definition of small business.” [2]
Therefore, section 3 of the bill defines a small business concern in a flexible and realistic manner. The Committee did this “because it has become universally recognized that it is utterly impossible to define small business rigidly in terms of number of employees, amount of capitalization, or dollar volume of business.”
Id.
In 1957, the House Committee on Banking and Currency addressed how to characterize a small business and stated that “no single definition may be expected to meet all requirements.” Recognition of varying situations motivated the Committee in drafting the present Small Business Act to depart from rigid standards and leave the definition of small business to administrative determination.[3]
That same report explains that the origins of the present statutory requirement that the Agency vary the size standards from industry to industry where number of employees is used as the criteria was the result of the Agency's then existing flat 500-employee rule for all government contracts.
In September 2010, Congress passed the Jobs Act (“Jobs Act”) (Pub. L. 111-240, 124 Stat. 2504; September 27, 2010), requiring SBA to review all size standards every five years and make necessary adjustments to reflect current industry and market conditions. Specifically, the Jobs Act requires SBA to conduct a detailed review of not less than one-third of the size standards during the 18-month period beginning on the date of enactment of this Act and during every 18-month period thereafter, which shall include holding not less than two public forums located in different geographic regions of the United States.
In accordance with section 1661 for the National Defense Authorization Act of Fiscal Year 2013 (“NDAA 2013”) (Pub. L. 112-239; Jan. 2, 2013), SBA has relaxed the limitation on the number of small business size standards. Specifically, section 1661 of NDAA 2013 states “SBA cannot limit the number of size standards, and shall assign the appropriate size standard to each industry identified by NAICS.”
Under section 1831 of the National Defense Authorization Act for Fiscal Year 2017 (NDAA 2017) (Pub. L. 114-328; December 23, 2016), Congress amended paragraph 3(a)(1) of the Act authorizing the Administrator to establish size standards for agricultural enterprises in the same manner as for other industries. The amendment also subjects size standards for agricultural enterprises to the rolling review procedures established under section 1344(a) of the Jobs Act. Historically, the size standards for most agricultural industries were established by statute.
The Small Business Runway Extension Act of 2018 (SBREA) (Pub. L. 115-324; December 17, 2018) amended section 3(a)(2)(C)(ii)(II) of the Act, 15 U.S.C. 632(a)(2)(C)(ii)(II), to modify the requirements for proposed small business size standards prescribed by an agency without separate statutory authority to issue size standards. Specifically, the SBREA changed the averaging period for calculating average annual gross receipts for size standards of services firms from three years to five years.
Section 863 of the National Defense Authorization Act for Fiscal Year 2021 (NDAA 2021) (Pub. L. 116-283; January 1, 2021) changed the averaging period for SBA's employee based size standards from 12 months to 24 months. Section 863 of the NDAA 2021 amended two provisions of section 3(a)(2) of the Act, which sets forth requirements for an agency that would prescribe a proposed size standard. First, the NDAA 2021 provides that those requirements also apply to SBA when the agency acts pursuant to the authority in section 3(a)(2)(A) for SBA to specify small business definitions or size standards. Second, the NDAA 2021 amended section 3(a)(2)(C)(ii)(I) such that a proposed size standard for a manufacturing concern must provide for determining the size of the concern based on the employment during each of the concern's pay periods for the preceding 24 months. Previously, the statute specified the use of a 12-month period.
2.3 Regulatory History
Current small business size standards evolved from a limited number of general size standards for broad industry groups or sectors to a larger number of specific size standards based on individual industries. This transition was recognition that different industries had different characteristics, and thus warranted appropriate industry specific size standards. Many of today's size standards continue at levels established right after the SBA's inception, except that receipts-based size standards have been increased for inflation over the years.
Over the years, SBA has adopted a broad range of size standards—manufacturing industry standards ranged from 250 employees to 1,500 employees; other industry size standards ranged from $0.10 million to $47 million in average annual receipts. SBA establishes its size standards for industries using the latest NAICS industry definitions, developed by the Office of Management and Budget (OMB) in collaboration with U.S. Census Bureau, other U.S. Federal Statistical Agencies, and Statistical Agencies of Canada and Mexico. NAICS replaced the Standard Industrial Classification (SIC) system, effective January 1, 1997. SBA adopted NAICS as the basis for its table of size standards, effective October 1, 2000 (65 FR 30836; May 15, 2000). OMB modifies or updates NAICS every five years and SBA adopts the NAICS updates for its table of size standards, effective October 1 of the same year. SBA has opted to use October 1 because that is the start of the Federal Government's fiscal year.
The 500-employee size standard for Federal contracting predates SBA; it was used by the Reconstruction Finance Corporation and the earlier Small War Plants Corporation, which was a World War II Government contracting agency channeling Federal contracts to small
( printed page 54099)
manufacturers. In 1957, the House Committee on Banking and Currency observed that “the standard of 500 or less employees originated in World War II with several variations. For the want of a better definition, the 500-employee rule generally gained acceptance in the Government, although in many instances there was considerable reluctance by many Government officials and members of Congress to accept such a rigid formula.” (
See
Senate Report No. 555, 85th Congress, 1st Session, page 6.)
SBA adopted 500 employees as the size standard for manufacturing industries at its 1953 inception; it has remained a size standard for many industries until today and had long been considered the “anchor” size standard for employee-based size standards. In 1959, SBA's size regulations distinguished between manufacturing and financial industries. Specifically, the Agency adopted 250-employee, 500-employee, and 1,000-employee size standards for its financial assistance programs, but maintained the 500-employee size standard for Federal contracting programs.
Generally, the Agency has used annual receipts as the measure of size standards for nonmanufacturing industries. Soon after its inception, SBA created size standards for nonmanufacturing based on annual receipts rather than employees. In 1954, SBA established $1 million in average annual receipts as the size standard for nonmanufacturing industries. Receipts based size standards were established subsequently for other industries. They varied between $0.30 million and $1 million for retail trade and services industries, between $2 million and $5 million for wholesale trade industries, and $5 million for construction industries. SBA has periodically increased all receipts based size standards for inflation. With the periodic inflation adjustments, the most common receipts based size standard of $1 million has increased to $9 million today. The $1 million level and its inflation-adjusted equivalents had long been considered the “anchor” size standard for industries with receipts based size standards.
By 1963, SBA receipts based size standards were as follows: $1 million for retail trade industries; $1 million for services industries; $5 million for wholesale trade industries; and $7.5 million for construction industries. SBA continued using two sets of size standards for manufacturing industries—250 employees to 1,000 employees for SBA financial programs, but generally 500 employees for Federal contracting programs.
From 1963 to 1975, many manufacturing size standards were increased from 500 employees to 750 employees or 1,000 employees. Similarly, some services industries, such as engineering and janitorial services were broken into separate industries, with size standards of $5 million and $3 million, respectively.
In 1975, SBA adopted a general increase to its monetary based size standards for inflation (40 FR 32824; August 5, 1975). As a result, the new size standards were $2 million for retail trade and services industries, $12 million for general construction, and $5 million for specialty trade construction. Employee based standards remained unchanged.
After a series of public notices in the
Federal Register
from 1980 to 1983 with an intent to comprehensively revise its size standards,[4]
the Agency adopted in a final rule a detailed list of size standards for industries as defined under the SIC system (49 FR 5024; February 9, 1984). Generally speaking, the size standards framework the Agency followed until the first five-year comprehensive size standards review under the Jobs Act was put in place in 1984.
In 1984, to simplify procurement procedures, SBA adopted a single size standard of 500 employees for all wholesale trade industries, for both procurement and SBA financial programs (49 FR 5024; February 9, 1984). Before that, the wholesale trade industries had a 500-employee size standard for Federal procurement and three levels of receipts based standards ($9.5 million, $14.5 million, and $22 million) for SBA's financial programs. In 1986, SBA amended its size standards for the wholesale trade industries from 500 employees to 100 employees for all SBA financial programs (51 FR 25189; July 11, 1986), while it retained 500-employee size standard for Federal procurement.
In 1992, SBA proposed, along with an inflation adjustment, a reduction in the number of size standard levels from more than forty different levels to nine receipts based size standards and five employee based size standards (57 FR 62515; December 31, 1992). SBA withdrew the proposed rule on February 19, 1993 (58 FR 9131) and re-published it on September 2, 1993 (58 FR 46573). Although public comments overwhelmingly accepted the fixed size standards approach, the proposed levels seemed arbitrary and produced large variations in changes to standards. SBA believed it could not justify such large variations, and therefore, limited the final rule to adjusting the then existing receipts based size standards for inflation (59 FR 16513; April 7, 1994).
In March 2004, SBA proposed to simplify and restructure size standards by establishing all size standards based on number of employees (69 FR 13130; March 19, 2004). For a number of industries, however, an employee based size standard could result in businesses with very high receipts but few employees to qualify as small. There were other skewed outcomes as well, and SBA, therefore, also proposed a maximum receipts size standard along with an employee size standard for certain industries. Public comments showed that for some industries the proposed employee based standards were either too low or did not serve as a suitable measure of business size. Rather than issuing a revised proposed rule with adjusted size standards, SBA decided to seek additional input from the public.
Accordingly, in December 2004, the Agency issued an Advance Notice of Proposed Rulemaking (ANPRM) (69 FR 70197; December 3, 2004). It sought comments on ten specific issues that the public had raised in response to the March 2004 proposed rule. SBA did not make further proposals, but only sought public comment on whether and how it should consider the following: (1) Approaches to simplification of size standards; (2) Calculation of number of employees; (3) Use of receipts based size standards; (4) Designation of size standards for Federal procurements; (5) Establishment of size standards solely for Federal procurement; (6) Establishment of tiered size standards; (7) Simplification of small business status and affiliation with other businesses; (8) Joint ventures and small business eligibility; (9) Grandfathering of currently eligible small businesses; and (10) Impact of SBA size standards on the regulations of other Federal agencies. SBA received several thousand comments on these issues, but no consensus.
In 2007, SBA began a comprehensive review of all size standards to determine whether the existing size standards were consistent with current data, and to revise them, when necessary. In addition, on September 27, 2010, the President of the United States signed the Small Business Jobs Act of 2010 (Jobs Act), Public Law 111-240, 124 Stat.
( printed page 54100)
2504, Sept. 27, 2010. The Jobs Act directs SBA to conduct, at least every five years, a detailed review of all size standards and to make appropriate adjustments to reflect market conditions. SBA completed the first five-year review of size standards in early 2016 and the second five-year review of size standards in early 2023. SBA is currently int the midst of the next (third) five-year review. Across the first two reviews, SBA only decreased three size standards out of more than 1,000, in order to exclude potentially dominant firms from being considered small. The rest were either raised based on an analysis of industry features or maintained because of SBA policy decisions of not lowering size standards in both reviews.[5]
SBA modified its method for calculating average annual receipts used to prescribe size standards for small businesses (84 FR 66561; December 5, 2019). Specifically, in accordance with the Small Business Runway Extension Act of 2018, SBA changed its regulations on the calculation of average annual receipts for all of SBA's receipts based size standards, and for other agencies' proposed receipts based size standards, from a three-year averaging period to a five-year averaging period, outside of the SBA Business Loan and Disaster Loan Programs.
In accordance with NDAA 2021, SBA adopted a 24-month average to calculate a business concern's number of employees for eligibility purposes in all of SBA's programs (87 FR 34094; June 6, 2022). SBA also permitted business concerns in its Business Loan, Disaster Loan, Surety Bond, and Small Business Investment Company (SBIC) Programs to use a five-year averaging period, in addition to the existing three-year averaging period, for the purposes of calculating average annual receipts.
Currently, the most prevalent size standards are $9 million in annual receipts for Retail Trade and Services, $45 million for General Construction, $19 million for Special Trade Construction, 100 employees to 250 employees for Wholesale Trade for all Federal programs except for Federal procurement where it is 500 employees under the nonmanufacturer rule, and 500 employees for manufacturing industries. Monetary based size standards range from $2.25 million in annual receipts for some Agricultural enterprises to $47 million in annual receipts for some Retail Trade and some services industries. Similarly, employee based standards range from 100 employees for Fuel Dealers to 1,500 employees for some Manufacturing, Telecommunications, and Transportation industries. With exceptions of wholesale and retail trade industries, uniform size standards are now in place for all SBA's programs. Wholesale and retail trade industries have a singular 500-employee size standard for Federal procurement purposes under the nonmanufacturer rule and industry-specific size standards that apply to SBA's financial and other non-procurement Federal programs.
2.4 2024 Size Standards Methodology
On September 12, 2024, SBA adopted the current size standards methodology (89 FR 74109). It incorporated minor changes from the previously adopted version from 2019 (84 FR 14587; April 11, 2019), with the exception of inflation adjustments for monetary based size standards and adjustments to the federal contracting disparity calculations. The 2024 methodology used seven factors to determine size standards: the simple average firm size, weighted average firm size, average assets per firm, four firm concentration ratio, Gini coefficient of industry revenue, and two disparity measures of federal contracting for any industries with more than $20 million in federal contracts. For the first five measures, SBA compared an industry's factor to that of a reference group of other industries to arrive at a factor specific size standard. For the federal contracting disparity measures, the methodology proposed an increase if small businesses were significantly below parity in terms of the number of federal contracts or contracting dollars. Once each factor specific size standard had been calculated, all seven were averaged together to arrive at a final size standard. Most size standards corresponded to a NAICS 6-digit industry, though there were some alternative size standards for specific subindustries which are heavily used in federal contracting. Lastly, while not a part of the official size standard methodology, SBA chose not to decrease size standards even when the methodology would support it except in cases where a nationally dominant firm would be classified as small.[6]
3. Grouping Industries
Since 2000, SBA has used the North American Industrial Classification System (NAICS) 6-digit industry codes as a basis for its table of small business size standards, replacing the older Standard Industrial Classification (SIC) (65 FR 30836; May 15, 2000). Since then, the Office of Management and Budget (OMB) has issued five revisions to NAICS—NAICS 2002 (66 FR 3826; January 16, 2001), NAICS 2007 (71 FR 28532; March 16, 2006), NAICS 2012 (76 FR 51240; August 17, 2011), NAICS 2017 (81 FR 52584; August 8, 2016), and the latest 2022 (86 FR 72277; December 21, 2021) revisions. To ensure that size standards are based on latest industry definitions, SBA updates its table of size standards following the release of a new NAICS revision from OMB.
As of the most recent NAICS revision in 2022 there are 1,012 unique industries identified,[7]
with small businesses operating in 980 of those.[8]
With this level of disaggregation, many of the distinctions made are not relevant to businesses, except as it relates to their small business status. For example, there are four different NAICS 6-digit codes for Restaurants: 722511 (Full-Service Restaurants), 722513 (Limited-Service Restaurants), 722514 (Cafeterias, Grill Buffets, and Buffets), and 722515 (Snack and Nonalcoholic Beverage Bars). Choosing which code is correct for most restaurants might be straightforward, but there are edge cases which could create unnecessary confusion. Some restaurants may serve customers with a buffet for lunch so that customers can eat more quickly before returning to work, but as a traditional sit-down restaurant for dinner. Under the current size standards, such a restaurant would have to determine their industry by looking at which type of service generates the majority of its revenue—a relevant distinction as buffets have a size standard that is nearly 3 times higher than full-service restaurants ($34 million in receipts vs. $11.5 million).[9]
SBA size standards are used by a wide range of practitioners, many of whom do not have a nuanced understanding of the nearly 1,000 NAICS 6-digit Industries containing small businesses. The SBA is proposing to establish certain size standards at the NAICS 4-digit Industry Group instead of at a lower 5-digit or 6-digit Industry level for industries as allowed under 15 U.S.C. 632(a)(7), where appropriate. Grouping
( printed page 54101)
at the 4-digit level will allow small businesses to more easily determine where their business fits within the federal government ecosystem, in turn providing them an easier entry to federal contracting and other services that may be available to them. Additionally, grouping at the 4-digit level will help prevent the issue of contracting officers at federal agencies choosing the improper industry and corresponding size standard for contracts up for bid, which has in turn restricted opportunities for small businesses that should have been eligible to compete SBA believes setting size standards at the 4-digit level where appropriate will thus foster a more competitive environment where small businesses can earn revenue and grow.
The SBA's proposed justification for grouping industries at the 4-digit level is based on two criteria with a single size standard chosen for industries if either criterion is met. In such instances, SBA believes that a single size standard is appropriate for all industries within such 4-digit level. When neither criterion is met, the SBA believes a single size standard at the 4-digit level is inappropriate and proposes to use the 5-digit Industry as the level for size standard classification. Because the NAICS framework is hierarchical, size standards proposed at the 4-digit Industry Group will continue to ensure complete coverage of small businesses as each 6-digit Industry is nested inside a single 4-digit Industry Group.[10]
The first is to see if the 4-digit NAICS Industry Group is at or below the lowest level of the hierarchy where the United States, Canada and Mexico are in agreement. Because the three countries are in agreement on these industry definitions but not the lower industries, there is an understanding that these industries are similar enough for cross-country purposes. Further delineation is therefore only used within the United States, and as such the distinctions are more nuanced. Take Oil and Gas Extraction (NAICS 2111), one of the Industry Groups where the three countries have chosen not to delineate further. The United States has chosen to further break the Industry Group down into Crude Petroleum Extraction (NAICS 211120) and Natural Gas Extraction (NAICS 211130). While the two primary commodities produced are distinct, both are often collocated in the same field, leading many firms to produce both. As such the 2022 NAICS manual includes a cross-reference for how to classify establishments.[11]
Of the 297 Industry Groups which may include small businesses, 189 are at or below the lowest level of the NAICS hierarchy. Additionally, all 5-digit NAICS Industries satisfy this criterion.
The second is to see if the cross-references in the 2022 NAICS manual create a complete graph of 5-digit industries within a 4-digit industry group. This means that every 5-digit industry is reachable, either directly or indirectly through a series of cross-references. The most common way this is achieved is by one or more 5-digit industries sharing cross-references with every other industry. Figure 1 shows such an example in Building Finishing Contractors (NAICS 2383), where the 5-digit Industry Other Building Finishing Contractors (23839) references the other five industries. For only two industry groups, Beverage Manufacturers (NAICS 3121) and Basic Chemical Manufacturers (NAICS 3251), is a longer path requiring two intermediary 5-digit industries for some pairs of industries. Figure 2 shows the cross-references for Beverage Manufacturers for reference. Of the 297 Industry Groups which include small businesses, 263 contain a complete graph of 5-digit industries.
( printed page 54102)
Figure 1: Cross-References for the Building Finishing Contractors Industry Group (NAICS 2383)
( printed page 54103)
Figure 2: Cross-References for the Beverage Manufacturing Industry Group (NAICS 3121)
When used in conjunction, the two proposed criteria indicate that 276 Industry Groups meet the criteria to use Industry Group, while 21 do not meet the two-part test being utilized. Of those which meet Industry Grouping criteria, 176 satisfy both criteria, 13 meet the cross-country criterion, and 87 meet the cross-reference criterion. The results for each industry group are shown in Table 1 along with the number of 6-digit NAICS industries that are contained in each. Based on these results, the SBA is proposing 338 size standards, 276 at the 4-digit Industry Group level and 62 at the 5-digit Industry level. This is a significant reduction from the current table which includes 995 size standards.
( printed page 54104)
( printed page 54105)
( printed page 54106)
( printed page 54107)
( printed page 54108)
( printed page 54109)
( printed page 54110)
( printed page 54111)
( printed page 54112)
( printed page 54113)
( printed page 54114)
( printed page 54115)
( printed page 54116)
( printed page 54117)
( printed page 54118)
( printed page 54119)
( printed page 54120)
( printed page 54121)
( printed page 54122)
( printed page 54123)
( printed page 54124)
( printed page 54125)
( printed page 54126)
As OMB issues new updates to NAICS, SBA will continue to match its size standards definition to the latest version. When SBA proposed to replace SIC with NAICS 1997 as the basis of industry definitions for its table of small business size standards, it established a set of guidelines or rules to convert the size standards from industries under SIC to those under NAICS (64 FR 57188; October 22, 1999). The guidelines aimed to minimize the impact of applying a new industry classification system on SBA's size standards and on small businesses that qualified as small under the SIC based size standards. SBA received no negative comments against the proposed guidelines. SBA published the final rule on May 15, 2000 (65 FR 30386) (corrected on September 5, 2000 (65 FR 53533)) adopting the resulting table of size standards based on NAICS 1997, as proposed. To be consistent, SBA also applied the same guidelines when it updated its table of size standards to adopt NAICS 2002 (67 FR 52597; August 13, 2002), NAICS 2007 (72 FR 49639; August 29, 2007), NAICS 2012 (77 FR 49991; August 20, 2012), NAICS 2017 (82 FR 44886; September 27, 2017), and NAICS 2022 revisions (87 FR 59240; September 29, 2022). In all those updates, SBA received no adverse comments on using those guidelines, or on the resulting changes to the size standards. Those guidelines are shown below in Table 1, General Guidelines to Convert Size Standards from Old NAICS to New NAICS Industries.
( printed page 54127)
( printed page 54128)
In addition to the above general guidelines, in cases where a new industry group or industry is formed by merging multiple industry groups or industries or their parts with substantially different levels or different measures of size standards, SBA also examines the relevant latest industry and Federal procurement data to determine an appropriate size standard for the new industry group or industry.
4. Selection of Size Measure
SBA has primarily used two measures of business size for its size standards—receipts and number of employees.[12]
Both are statutorily required for businesses depending on business activity. Businesses providing services are required to have a receipts based
( printed page 54129)
size standard,[13]
and those in manufacturing are required to have an employment based size standard.[14]
In addition, the SBA is afforded the authority to use additional factors as appropriate. For all but one industry, Fishing (NAICS 1141), where Congress has delegated the determination to SBA, SBA proposes to use an employment based size standard. SBA's choice is intended to minimize the number of businesses that fluctuate between small and large each year, as such fluctuation makes it more difficult for businesses to strategically plan, for example, their capital and contracting opportunities, and for federal agencies to likewise evaluate what businesses may be eligible to bid on small business contracts on a year-over-year basis. SBA believes this goal is achievable by deferring to employment-based size standards over receipts where possible because of the lower volatility in employment year to year as compared to receipts.[15]
The Act itself reflects the greater stability of employment relative to receipts, as receipt based size standard determinations are based on the average receipts over five years, while employment based size on average employment over two years.
There are other additional benefits to deferring to employment-based size standards where available. First, greater use of employment-based size standards should also benefit small Federal contractors, as the act of winning a contract will not by itself force a firm to transition into a large business. Second, it will put businesses in high cost of living areas on equal footing with those in low cost of living areas, as high input costs create greater disparities in receipts across the country than employment. For example, restaurants in Manhattan, New York earn $120 thousand in receipts per employee, while those in Manhattan, Kansas earn just $49 thousand.[16]
Lastly, employment-based size standards are robust to both inflation and productivity growth and thus require less frequent updating by SBA. During the periods between adjustments, some businesses lose their small business status only to regain it upon the adjustment. In its most recent rule increasing monetary size standards for inflation, for example, 17,713 firms were expected to regain small businesses status as a result of the rule.17
SBA considered leaving size standards receipts-based where SBA has the discretion to choose the appropriate size standard, but elected not to do so for the reasons discussed above. In deciding whether to shift such size standards from receipts-based to employment-based, SBA considered the potential costs of doing so, including regulatory familiarization. SBA determined that the benefits outweighed the costs and is thus proposing such shifts.
SBA also proposes to end all 18 size standards exceptions for Federal contracting. SBA believes that the other changes made to this document serve to ameliorate the issues these exceptions attempted to address in a patchwork manner. In particular, for all but one exception, the proposed size standards outlined in the accompanying Notice of Proposed Rulemaking for each industry are larger than the exception under that industry. None of the firms using these exemptions are expected to lose small business status as a result of the proposed changes, other than potentially Environmental Remediation Services an exception to NAICS 56291 which currently has an employee based size standard. The proposed methodology would result in a size standard for NAICS 5629 and subsequent NAICS at the 5 and 6 digit level at $113 million in receipts. SBA requests comment on any impact in that exception, as well as on whether any other exceptions for federal contracting are needed under the new methodology and should remain.
To identify industry groups and industries appropriate to transition to employment based size standards, the SBA must first determine whether receipts-based size standards are required under 15 US.C. 632(a)(2)(C)(ii)(II). The SBA proposes to do this by considering whether the industry group or industry is predominantly service-oriented by, in turn, considering whether the industry group or industry is focused on the transfer of ownership or practical control of a tangible item. Regardless of the magnitude of the labor investment in the industry, the focus here is on the contract and the product provided to the customer. To make this determination, SBA is using a three-step process for each industry group or industry considered. First, is to identify what kind of physical objects are being transferred by an industry group or industry. Second is to determine if the industry group or industry primarily exists to transfer such objects. Third is to determine if ownership or long-term practical control of the object is being transferred. Only if all three components of the test are satisfied is an industry group or industry considered a non-service. The test is laid out in Figure 3 below.
( printed page 54130)
Figure 3: Test for Identifying Service-Based Industry Groups
To illustrate how the test works, the SBA has provided examples of industry groups which fail each specific part of the test and one which satisfies all three to be considered other than service. An industry group which would fail the first test (are physical objects transferred) is Elementary and Secondary Schools (NAICS 6111). The industry group provides knowledge to children with little to no physical objects given. An industry group which would fail the second test (are physical objects the focus of business) is Legal Services (NAICS 5411). The industry group does provide physical objects such as contract documents, but legal firms primarily offer their legal expertise which is intangible. An industry group which would fail the final test (is ownership or control transferred) is General Freight Trucking (NAICS 4841). This industry is primarily focused on moving objects around, however it does so without a change in ownership. Trucking firms do not typically purchase what they are hauling to then resell it upon arriving at their destination, but instead move goods on a contract basis. Finally, an industry group which satisfies all three parts is Oil and Gas Extraction (NAICS 2111). In it, oil and gas is brought up out of the ground after which it is sold and ownership is transferred.
As the SBA has not previously made a systematic determination of whether an industry group or industry can be classified as other than service, it evaluated all 192 industry groups and industries which currently have a receipts based size standard and 2 NAICS industry groups with a mix of employment and receipts based size standards where the industries with an employment based size standard generated a minority of total receipts.18
Of these, the SBA is proposing that 66 can be classified as other than service, and proposes that 65 to transition to employment based on the test described above. Regarding the one remaining industry group, Fishing (NAICS 1141), the SBA is proposing to keep as receipts based due to the heavy use of independent contractors rather than employees to work on commercial fishing boats. Based on a combination of data from the Statistics of U.S. Businesses and the Nonemployer Statistics, the SBA found that 57 percent of receipts in the industry group were generated by nonemployers, far higher than any other industry group with a proposed employment based size standard. An explanation for each is provided in Table 3. SBA requests comment on such transitions, including on whether a receipts-based size standard based on the methodology herein is more appropriate for any industries or industry groups.
( printed page 54131)
( printed page 54132)
( printed page 54133)
( printed page 54134)
( printed page 54135)
( printed page 54136)
( printed page 54137)
( printed page 54138)
The effect of these changes is an increase in the number of employment based size standards. Of the 338 industry groups and industries with size
( printed page 54139)
standards 208 are proposed to have an employment based size standard, 129 are proposed to have a receipts based size standard, and one (NAICS 5221 Depository Institutions) has an asset based size standard as seen in Table 2. Many would transition to an employment based size standard either from a receipts based one (64 industries), or a mix of receipts and employment based (6 industries).[19]
The proposed size standard determination for all industries can be found in Table A in the Appendix.
5. Data Sources
Calculating small business size standards as laid out in this proposed methodology requires data from many sources. For 311 out of 338 industry groups and industries, 8 data sources were used, while for the remaining 27 a special data source is needed due to specific data needs that are not covered in the main data sources. Some of these coverage gaps are due to private firms outside of the general sources, such as farms and railroads, while for others the gaps are due to a significant government presence in industry groups such as utilities, urban transportation, and education. Because of these gaps an additional 14 data sources are used. All the data sources used are produced by Federal agencies, publicly accessible, cited, and discussed below. All are presumed to be from 2022 unless mentioned otherwise. Because of changes in size standards factors, few data sources are repeated from the 2024 Methodology.
5.1 General Industry Data
Statistics of U.S. Businesses [20]
—employee counts and receipts by state and industry group or industry from this data source are used to calculate national industry size.
Nonemployer Statistics [21]
—establishment counts and receipts by state and industry group or industry from this data source are used to calculate national industry size. Additionally, total establishment counts by county and industry group or industry from this data source in 2023 are used in the calculation of the number of geographic markets for an industry group or industry.
County Business Patterns [22]
—total employee counts by county and industry group or industry from this data source in 2023 are used in the calculation of the number of geographic markets for an industry group or industry.
County Gazetteer Files [23]
—county latitudes and longitudes from this data source are used in estimating the approximate location of suppressed employment and nonemployer establishments at the county-industry level using a Heckman selection model. This process is part of the calculation of the number of geographic markets for an industry group or industry.
County Population Totals [24]
—2023 county population from this data source is used the calculation of the number of geographic markets for an industry in two ways. First, in estimating the approximate location of suppressed employment and nonemployer establishments at the county-industry level using a Heckman selection model. And second, in calculating the geographic disparity of an industry group or industry.
American Community Survey Commuting Flows [25]
—county to county commuting flows from this data source is used to agglomerate counties into larger areas for the purposes of calculating the number of geographic markets for an industry group or industry. This data is based on the 2016-2020 American Community Survey and is the most recently available.
( printed page 54140)
County Adjacency File [26]
—adjacency information from this data source is used to ensure that only contiguous geographic areas are adjoined when counties are agglomerated into larger areas in the process of calculating the number of geographic markets for an industry group or industry. This data is from 2023.
Use of Commodities by Industry Table [27]
—exports, imports, and output by industry group or industry from this data source are used to adjust national industry size for exports and imports. This data is from 2017 and is the most recent available for the most detailed version.
5.2 Industry Specific Data
Census of Agriculture [28]
—employee counts from this data source are used in place of those from the Statistics of U.S. Businesses (SUSB) and Nonemployer Statistics (NES) for 17 farming industry groups and industries. Additionally, 11 farming industry groups or industries are combined in the Census of Agriculture. Their employment is split in proportion to the amount of receipts generated in each industry group or industry as a proportion of all receipts.
Annual Electric Power Industry Report Form EIA-861 [29]
—total revenue and private industry revenue from this data source is used in combination with data from Form EIA-923 discussed below to adjust SUSB private sector employment for publicly owned electricity distribution in the Electric Power Generation, Transmission and Distribution industry (NAICS 2211). Around 12.1% of electricity is distributed by publicly owned sources. The two values for distribution and generation are averaged to upwardly adjust revenue and employment accordingly.
Annual Electric Power Industry Report Form EIA-923 [30]
—total net generation and private industry net generation from this data source is used in combination with data from Form EIA-861 discussed above to adjust SUSB private sector employment for publicly owned electricity generation in the Electric Power Generation, Transmission and Distribution industry (NAICS 2211). Around 8.0% of electricity is generated from publicly owned sources. The two values for distribution and generation are averaged to upwardly adjust revenue and employment accordingly.
Natural Gas Summary [31]
—average prices and consumption of natural gas from this data source are used to calculate the total revenue of Natural Gas Distribution (NAICS 2212) including both private and government owned entities. Natural gas delivered for electric power generation is excluded as it is primarily delivered via pipeline which is a different industry (NAICS 4861). The number of employees in the industry group from SUSB is then increased proportionally to the ratio of revenue from this source and SUSB.
Data and Information Used by WaterSense [32]
—average prices for water in 2024 from this data source is used in calculating the total revenue of all water and sewage systems (NAICS 2213). It is combined with data from the United States Geological Survey discussed below to estimate the total revenue of water and sewage systems. Total employment of all water and sewage systems is estimated by multiplying the employment at privately owned water and sewage systems by the ratio of total revenue to private revenue reported in SUSB.
Estimated Use of Water in the United States 2015 [33]
—average daily water use by public water systems in 2015 from this data source is used in calculating the total revenue of all water and sewage systems (NAICS 2213). It is combined with data from the Environmental Protection Agency discussed above to estimate the total revenue of water and sewage systems. Total employment of all water and sewage systems is estimated by multiplying the employment of privately owned water and sewage systems by the ratio of total revenue to private revenue reported in SUSB.
Railroad Employment and Compensation [34]
—employee counts for Class I line-haul railroads, Non-Class I line-haul railroads and switching & terminal companies, and the National Railroad Passenger Corporation (Amtrack) are used to calculate the total employment for Rail Transportation (NAICS 4821). Other Commuter railroads, Car-loan companies, Labor organizations, and Miscellaneous employees are excluded as they fall outside the industry group.
Single Summary of Transit Report [35]
—receipts for publicly owned Urban Transit Systems entities (NAICS 4851) from this data set are added to the privately owned numbers from SUSB to arrive at the total receipts for the entire industry group.
Quarterly Banking Profile [36]
—data on assets and receipts of federally insured banks and other savings institutions from this data set are combined with similar information about credit unions from the National Credit Union Administration's Quarterly Data Summary Reports discussed below to create the asset-based size standard for Depository Credit Intermediation (NAICS 5221).
Quarterly Data Summary Report [37]
—data on assets and receipts of federally insured credit unions from this data set are combined with similar information about banks and other savings institutions from the Federal Deposit Insurance Corporation's Quarterly Banking Profile discussed above to create the asset-based size standard for Depository Credit Intermediation (NAICS 5221).
Private Pension Plan Bulletin [38]
—data on administrative expenses to pension plans from this data source is added to the contributions to group health plans discussed below to find the revenue for Insurance and Employee Benefit Funds (NAICS 5251).
Group Health Plans Report [39]
—data on administrative expenses to group health plans from this data source is added to the contributions to pension plans discussed above to find the revenue for Insurance and Employee Benefit Funds (NAICS 5251).
Common Core of Data America's Public Schools [40]
—data on receipts for public Elementary and Secondary Schools (NAICS 6111) from this data source are used. The public school receipts are then added to the private school receipts from SUSB.
Integrated Postsecondary Education Summary Tables [41]
—data on receipts for publicly owned Junior Colleges (NAICS 6112) and Colleges, Universities, and
( printed page 54141)
Professional Schools (NAICS 6113) from this data source are used. Junior Colleges are denoted by being institutions with a typical degree plan of less than 4 years, while Colleges, Universities, and Professional Schools have a typical degree plan of 4 years or more. The public school receipts are then added to the private school receipts from SUSB.
6. Calculation of SBA Size Standards
This section lays out the method by which SBA proposes to calculate size standards for each industry group or industry. First, it explains how the three inputs of average market size are calculated using the data sources cited above. These are: national industry size, number of geographic markets, and an adjustment factor for net imports. These three inputs are combined according to the following equation:
Summary statistics on average market size and its components are presented in Table 3 below. Values for all 338 industry groups or industries are provided in Table A in the Appendix. For both industry groups and industries with employment based and receipt based size standards, the average market size is sharply skewed to the right as indicated by the mean average market size exceeding the median. This is driven by a skew in national industry size and is somewhat mitigated by the effect of the number of geographic markets which is negatively correlated with national industry size. As the number of geographic markets decreases, the national industry size increases and vice versa. The net import adjustment plays only a small role in industry groups or industries with receipt based size standards, but more strongly influences those with employment based size standards.
( printed page 54142)
For 307 out of 338 industry groups or industries, the standard data sources and methodology can be used for all inputs, while the remaining 31 require
( printed page 54143)
at least one deviation due to a variety of reasons, including, nonstandard data sources, government competition, mobile workplaces, or an asset based size standard. Any deviations will be noted as they become relevant. After the calculation of average market size has been explained in detail, the formula for calculating size standards from the measure will be explained.
SBA believes a geographic component is appropriate to add to the calculation of size standards because it is relative in determining whether a firm is dominant in its field of operation. For example, Software Publishers (NAICS 5132) compete in a national market with major brands such as Microsoft or Adobe and thus have the highest size standard, while Florists (NAICS 4593) compete in small local markets and as such have a much lower size standard. Average market size is chosen as the single most appropriate measure for determining small business size standards because SBA can then compare a firm's size to its industry group or industry's average market size to get the firm's approximate market share. Using average market size thus serves as the best approximation of the market average, capturing a wide array of competing firms in a given domain. Higher market shares are indicative of firms which are potentially dominant in their field.[42]
Distinguishing which firms possess greater market shares helps parcel out small and nondominant firms by comparison. Because industry groups and industries range widely in their characteristics, two firms of equal size may be classified differently if they are in different industries. For example, the scale required for a firm to dominate in Child Care Services (NAICS 6244) is significantly less than Colleges, Universities and Professional Schools (NAICS 6113), and average market size reflects this difference with the former having an average market size of $27 million while the latter has an average market size of $17.6 billion.
6.1 National Industry Size
To calculate national industry size for most industry groups or industries requires data from two sources, both produced by the Census Bureau: SUSB to incorporate the contributions of businesses with employees and NES to incorporate the contributions of businesses without employees. Because of how geographic markets are calculated below, only the contributions of firms in the contiguous United States are included. Despite their exclusion to the calculations, the proposed size standards will still be applicable to firms in Alaska and Hawaii, as well as U.S. territories not covered by the data sources used.
For industry groups or industries with receipts based size standards, national industry size can be straightforwardly calculated as the sum of receipts for an industry in both SUSB and NES as follows: [43]
However, for those with an employment-based size standard there is a challenge in combining the two sources since the owners of non-employer firms are contributing the market despite not being employees, though the intensity of that contribution is generally low. The SBA considered treating each nonemployer business as equivalent to an employee but rejected this because it would place too much emphasis on nonemployers' contribution. Of the 29.8 million nonemployer firms in the 2022 NES, 11.3 million (37.9 percent) took in less than $10,000 in revenue, while the average revenue to employee in 2022 SUSB was $374,583. As such the importance of nonemployers in an industry group or industry should be lower than that of an employee. To adjust for this disparity, each industry group or industry gives different weights to account for the importance of nonemployers based on a comparison of the revenue generated per employee and per nonemployer as follows:
Nonemployer receipts per firm vary between 1.2 percent and 83.6 percent of receipts per employee with an average value of 26.5 percent. While the individual contributions of nonemployer firms are low, their combined contributions can be significant and so the SBA choose to include them. Industry groups such as Taxi and Limousine Service (NAICS 4853) and Fishing (NAICS 1141) see more than half of all receipts generated by nonemployers. With this adjustment factor defined the national market size can then be calculated as follows:
Not only is ρi
used to adjust the national industry size for industry groups and industries with employment based size standards, it is also used to adjust employee numbers at the county level for calculating the geographic market definition below.
The method described above is applicable for 312 out of 338 industry groups and industries, but the remaining 26 require datasets beyond SUSB and NES. Out of those, 19 are due to the industry groups or industries
( printed page 54144)
being excluded from those datasets, and as such, an alternative source is needed. These are:
Farms (17 industry groups and industries in NAICS subsectors 111 and 112)—Statistics on farm employment is collected by the National Agricultural Statistics Service in the Census of Agriculture. This data source contains employment information on 6 out of the 17 industry groups with the remaining 11 industry groups or industries are combined with one or more others.[44]
The employment of the two is separated by using the ratio of aquaculture revenue to total revenue in the combined reporting.
Rail Transportation (NAICS 4821)—Statistics on employment in the railroads and related industries is reported by the Railroad Retirement Board in their Employment and Compensation Statistical Tables. To calculate only the railroad industry group's employment, the employment of Class I line-haul railroads, non-Class I line-haul railroads, and the National Railroad Passenger Corporation (Amtrak) are combined.
Insurance and Employee Benefit Plans (NAICS 5251)—the SBA is unaware of any data on employment or receipts in this industry group. Instead, expenses for private pension plans and group health plans from the Employee Benefits Security Administration are used instead of receipts in calculating size standards.
The remaining 7 industry groups do have data reported in SUSB and NES. However, these sources lack information on government owned entities which also compete on a regular basis in the industry groups.[45]
These are:
Electric Power Generation, Transmission and Distribution (NAICS 2211)—Government owned entities participate in the electricity market both in generating and distributing electricity.[46]
To capture this production the employment reported in SUSB is adjusted upward to account for the fact that approximately 8.0% of electricity is generated by public sources and 12.1% is distributed by public sources as reported by the Energy Information Agency.
Natural Gas Distribution (NAICS 2212)—Like electricity, government owned entities participate in the distribution of natural gas to end users. To capture this production the employment reported in SUSB is adjusted upward using data from the Energy Information Agency.
Water, Sewage and Other Systems (NAICS 2213)—90% of all water systems in the United States are operated by local governments.[47]
To capture this production the employment reported in SUSB is adjusted upward using data from the Environmental Protection Agency, and the U.S. Geological Survey.
Urban Transit Systems (NAICS 4851)—2,174 out of 2,922 urban transport systems in the United States are operated by governments, with virtually all operating funds being provided by state and local governments.[48]
To capture this production, the employment reported in SUSB is adjusted upward using data from the Federal Transportation Administration.
Elementary and Secondary Schools (NAICS 6111)—About 91% primary and secondary schools in the United States are operated by local governments.[49]
To capture this production the employment reported in SUSB is adjusted upward using data from the National Center for Education Statistics.
Junior Colleges (NAICS 6112) and Colleges, Universities and Professional Schools (NAICS 6113)—Around 54% of both junior colleges and 4-year universities are operated by state governments.[50]
To capture this production the employment reported in SUSB is adjusted upward using data from the National Center for Education Statistics. Junior Colleges are identified as those specializing in degrees with an expected completion time of 2-years or less.
6.2 Number of Geographic Markets
Calculating the number of geographic markets for a particular industry or industry group is distinct from calculating the national industry size. For purposes of SBA's proposed methodology, the SBA believes that the best reading of the Small Business Act's definition of a small business concern would be to read “field of operation” as equivalent to how the Federal Trade Commission and Department of Justice recently read “any line of commerce in any section of the country” from the Clayton Antitrust Act [51]
in their horizontal merger guidelines.[52]
Their definition has two key components: a product component, which the national industry size incorporates, and a geographic component which will vary in scope for different products. On an intuitive level, geographic market should capture the distance over which customers travel to buy the goods or services of an industry group or industry, or the distance those goods or services travel to reach customers. For example, customers are likely to only travel short distances to get their haircut, go to the grocery store, or get their car repaired. However, at the same time customers are likely to purchase food grown in California's central valley, fill their gas tank with gasoline refined on the Gulf Coast, and purchase a new car manufactured in Michigan even when they live nowhere near those places. To approximate the behavior of customers in various industries, SBA uses a modification of methodology the U.S. Department of Agriculture, Economic Research Service (USDA) uses to create commuting zones which cover the entire country.[53]
Commuting zones have been widely used in the economic literature because of their complete coverage of the United States, unlike other local area market
( printed page 54145)
definitions such as metropolitan statistical areas.[54]
The algorithm the USDA uses to derive commuting zones works by finding the two counties with the strongest connection between them in terms of the number of workers who live in one of the counties but work in the other relative to the counties' number of workers, which is referred to as a proportional flow.[55]
The data on commuting patterns comes from the American Community Survey Commuting Flows data produced by the Census Bureau. Once the two counties with the highest proportional flow have been identified they are combined into one commuting zone and the process repeats until the commuting connections between all current commuting zones falls below a predefined level of 0.023. Formally the proportional flow of commuters between commuting zone
i
and
j
is defined as follows:
The modified version of the algorithm SBA uses is the same except that instead of stopping once a predefined level has been reached, each industry group or industry has the potential to stop at a different level, using a stopping rule based on its geographic disparity of employment. Disparity in employment is used for all industry groups and industries, regardless of what size standard measure is ultimately used. The SBA considered using the disparity in receipts for those industry groups and industries with a receipts based size standard, but concluded this would be inappropriate for two reasons. First, while data on receipts at the county level is available in SUSB, it is only available at the 3-digit subsector level. Second, receipts disparity would encounter problems related to differences in costs of living between different areas of the country, because it would make it look like less activity was taking place in low cost of living areas. Like commuting zones, this concept has also been used in the economics literature.[56]
This measure works by comparing the fraction of all industry group or industry employees and fraction of total population in an area. If the sum of all discrepancies between the two values is below a predefined level of 0.15, the agglomeration of counties for the industry is stopped.[57]
The SBA considered choosing a lower stopping value of 0.12 but rejected it as it suggested too few industry groups or industries for county level markets, excluding the likes of Offices of Dentists (NAICS 6212) and Child Care Services (NAICS 6244). The SBA also considered choosing a higher stopping value of 0.18 but rejected it as it suggested to few industry groups or industries for national level markets, excluding the likes of Aerospace Product and Parts Manufacturing (NAICS 3364) and Software Publishing (NAICS 5132). Formally, an industry group or industry's geographic disparity of employment is defined as:
Data on employment and number of nonemployer firms at the county level is gathered from the CBP and NES, respectively, both of which are produced by the Census Bureau. For 11 industry groups, the geographic disparity is below the stopping value at the first check and thus have 3,109 geographic markets, one for each county in the contiguous United States. This group includes industries such as Offices of Dentists (NAICS 6212), Child Care Services (NAICS 6244), and Restaurants and Other Eating Places (NAICS 7225). On the other side, 46 industry groups and industries only have their geographic disparity fall below the stopping value when all counties have been combined together, and thus, these have just a single geographic market. This group includes industry groups such as Metal Ore Mining (NAICS 2122), Aerospace Product and Parts Manufacturing (NAICS 3364), and Software Publishing (NAICS 5132).
The above method is effective for calculating the size of geographic markets for most industry groups and industries, given it builds on USDA's peer-reviewed algorithm.58
However, there are some general challenges that must be overcome. First are the detached states of Alaska and Hawaii. The USDA's algorithm includes a check to see if two counties border one another before they can be combined. This check precludes any industry group or industries from having just a single national market. This is unlikely for products that are shipped over great distances or services that can be provided remotely. Cargo can be shipped on ocean vessels, and services can be done over the phone or the internet for which a land boarder is not relevant. The SBA considered excluding the bordering check, which would allow for a national market size, but chose to reject one because Alaska and Hawaii were the last areas to be adjoined due to their remote locations. With just 0.7 percent of U.S. Gross Domestic Product produced by these two states, this still led to relatively few industry groups or industries with national markets.59
As such, SBA has chosen to exclude data
( printed page 54146)
on firms from Alaska and Hawaii when calculating all numbers related to size standards.
The second general challenge is that the Census Bureau suppresses data when it might reveal confidential business information. Whenever an observation in the CBP or NES would have fewer than three establishments, the data is suppressed, and no observation is reported.[60]
This is a minor problem for industry groups such as Restaurants and other Eating Places (NAICS 7225) with many establishments spread throughout the country. A few counties with employment in the industry go unreported; but the error is minor. However, the problem is much greater for industry groups with very few establishments such as Forest Nurseries and Gathering of Forest Products (NAICS 1132), which possesses just 160 establishments in the entire country. For this industry, only three establishments are reported in the county data.
To address this issue, the suppressed data are placed into counties without data using a two-step Heckman process [61]
for employees and a probit regression for the nonemployer firms. In the first step, the counties with the highest probability of containing an establishment but do not are found using probit regression. This is done with the following regression:
where
popj
is the populations,
latj
is the latitude, and
lonj
is the longitude of county
j
. The inclusion of latitude, longitude, their squares, and their interaction is included so that geographic concentration of an industry can be included.[62]
Note that each coefficient is industry group or industry specific so each industry can have a different geographic concentration profile. For nonemployer firms the process stops here and the most likely counties are given 1.5 nonemployer firms each till all missing firms have been accounted for. For the employer firms, the second step then estimates the natural logarithm of employment in each county using ordinary least squares with the only independent variables being the population, an industry (or industry group) fixed effect and the inverse mills ratio (λi,j) from equation 7 to predict employment in the most likely counties to be included:
While the above method can be used to find the number of geographic markets for most industries, 29 have issues which must be addressed. Twenty-five of these arise due to the need to bring in industry specific data which does not have county level granularity. For these an approximate geographic scope is chosen based on known industry group or industry characteristics. These are:
Farms (NAICS 111 & 112)—the 17 farming industry groups and industries do not have useful geographic data on employment in the Census of Agriculture for this purpose. For these a single geographic market is assumed, since farming requires a lot of land and therefore tends to be located far from major population centers. SBA replaced employment with the acreage of six crops (wheat, corn, hay, soybeans, vegetables, and fruit orchards), and the number of three types of livestock (cattle, hogs, and broiler chickens) in the clustering algorithm and found that each suggested a single geographic market.
Natural Gas Distribution (NAICS 2212)—using the CBP which only counts the private sector firms, this industry group has 12 geographic markets, which seems low given that the local nature of this industry group. Instead, the number of geographic markets is adjusted upwards to 554 to match the number of commuting zones, since most natural gas is distributed over relatively short distances.
Water, Sewage and Other Systems(NAICS 2213)—using the CBP which only counts the private sector firms, this industry group has 21 geographic markets, which is rather low given the localized nature of this industry group. Instead, the number of geographic markets is adjusted upwards to 554 to match the number of commuting zones, since water systems are generally run by local governments.
Railroad Transportation (NAICS 4821)—the railroad industry does not have useful geographic data from the Railroad Retirement Board. Much of the railroad industry group is scattered throughout the continental United States given the nature of long-distance transport. For this industry group, a single geographic market is assumed, since railroads transport goods and people over long distances. Similar industry groups Deep Sea, Coastal, and Great Lakes Water Transportation (NAICS 4831) and Inland Water Transportation (NAICS 4832) have a single geographic market, while Nonscheduled Air Transportation (NAICS 4812) has three.
Urban Transit Systems (NAICS 4851)—the urban transportation industry group does not have useful geographic data from the Federal Transit Administration. For this industry group, the number of geographic markets is set at 554 which matches the number of commuting zones in the continental United States, since that level of aggregation is similar in size to the metropolitan area that many firms service.
Insurance and Employee Benefit Funds (NAICS 5251)—this industry group does not have useful geographic data from the Employee Benefits
( printed page 54147)
Security Administration. For this industry group, the number of geographic markets is set at 554 which matches the number of commuting zones in the continental United States. This level of aggregation was chosen because competition in this industry group is based around the employment decisions of workers which will mirror their commuting decisions.
Elementary and Secondary Schools (NAICS 6111)—this industry group does not have useful geographic data from the National Center of Education Statistics. For it the number of geographic markets is set at 3,109 which matches the number of counties in the continental United States.[63]
This level of aggregation was chosen because public primary and secondary schools tend to be funded with local taxes.
Junior Colleges (NAICS 6112) and Colleges, Universities, and Professional Schools (NAICS 6113)—these industry groups do not have useful geographic data from the National Center of Education Statistics. For them, the number of geographic markets is set at 49 which matches the number of states in the contiguous United States, including the District of Columbia. This level of aggregation was chosen because public postsecondary education is partially funded through the states.
For the remaining four industry groups which use the standard data sources, the geographic market algorithm produces implausible narrow geographic scopes. SBA recognizes the flaw in the methodology as to these four industry groups and proposes an approach to those outlined below. Although SBA cannot determine the exact cause for these outliers, it notes that all four share a common feature of having a mobile workforce, which could be partially at issue.[64]
Taxi and Limousine Service (NAICS 4853)—using the standard methodology for finding the number of geographic markets produces an implausibly small number for this industry group-ten—given that taxis and limousines are prevalent throughout most major cities in the United States. To address this potential flaw, this figure is replaced with 554, which matches the number of commuting zones in the contiguous United States. This number is chosen due to the mobile nature of this industry group.
School and Employee Bus Transportation (NAICS 4854)—using the standard methodology for finding the number of geographic markets for this industry group produces an implausibly small one. Instead, this is replaced with 554 which matches the number of commuting zones in the continental United States. This number is chosen due to the mobile nature of this industry group.
Employment Services (NAICS 5613)—using the standard methodology for finding the number of geographic markets for this industry group produces an implausibly small four. Instead, this is replaced with 554 which matches the number of commuting zones in the continental United States. This number is chosen due to the mobile nature of this industry group.
Home Healthcare Services (NAICS 6216)—using the standard methodology for finding the number of geographic markets for this industry group produces an implausibly small four. Instead, this is replaced with 554 which matches the number of commuting zones in the continental United States. This number is chosen due to the mobile nature of this industry group.
6.3 Net Import Adjustment
The last required piece for calculating an industry group or industry's average market size is to adjust the imports and exports of the goods and services produced by it. Without this adjustment, some industry groups or industries with heavy import competition will appear too small, while others with dominant American exporters will appear too large. To do this data from the Bureau of Economic Analysis's (BEA) Use of Commodities by Industry Table is used.[65]
The net imports adjustment is calculated as follows:
An example of an industry group that is larger than the sum of U.S. employment or receipts would suggest is Audio and Video Equipment Manufacturing (NAICS 3343). According to the BEA, the U.S. imported 8.7 times more in this industry group than it produced domestically. Given the strong foreign competition in this market, a domestic television manufacturer should be considered small at a higher level than a firm in another industry group or industry with a similar number of employees but no imports, because 90 percent of competition by revenue is located outside the United States. Other examples include: Footwear Manufacturing (NAICS 3162), Computer and Peripheral Equipment Manufacturing (NAICS 3341), and Household Appliance Manufacturing (NAICS 3352). On the other hand, an industry group such as Semiconductor Machinery Manufacturing (NAICS 3332) sees 51.5 percent of domestic output sent abroad as exports. Other examples include: Oilseed and Grain Farming (NAICS 1111), Aerospace Product and Parts Manufacturing (NAICS 3364), and Software Publishing (NAICS 5132). Given the implications of high exports for the size of the domestic market, a domestic semiconductor machinery manufacturer should be considered large at a lower level than another industry group or industry with a similar number of employees but no exports. The overall impact of the net import adjustment raises average market sizes more than it lowers them.
6.4 SBA Size Standards
With the average market size for an industry group or industry calculated, the size standard can now be calculated. Due to the broad range in average market sizes, SBA has not proposed a single fraction of average market size to
( printed page 54148)
be used for all size standards. Instead, the fraction slowly decreases as the average market size increases. As the average market sizes for a particular industry group or industry become larger, it increases the likelihood that niches exist within that act almost as their own markets. And a firm may be able to dominate one of those niches without operating in the others. For example, while Doctor's Offices are a single industry group (NAICS 6211 Offices of Physicians), there are multiple specialties acting as separate markets within this industry. Cardiologists compete with other Cardiologists, while Obstetricians compete with other Obstetricians, but there is no competition between the two specialties. Additionally, SBA has proposed to establish a minimum small business size which is used even when the average market size would suggest a smaller size standard would be justified. This is done so that all businesses below an absolute size level can still have access to SBA services. For employment based size standards, the minimum size standard is 500 employees, which has long been considered the anchor size standard by SBA. Outside of the Wholesale Sector (NAICS 42), which has its own special size range, only one industry Geothermal Electric Power Generation (NAICS 221116) has a size standard lower than 500 employees. Furthermore, for contracting purposes 500 employees is used as the size standard for all Wholesale (NAICS 42) and Retail (NAICS 44-45) sales. For receipt based size standards, the minimum size standard is $30.6 million which is equivalent to the original receipts based size standard of $1 million in 1954 after it has been adjusted for both inflation and productivity growth.[66]
For employment based size standards the equation that defines the relationship between average market size and small business size standards is as follows:
The exponent in equation 10 has been chosen such that the size standard is defined by two anchor points. The low anchor point is the minimum size standard of 500 employees at an average market size of 500 employees, and the high anchor point is a size standard of 2,500 employees when the average market size is 200,000 employees.67
SBA choose this high anchor point because it believes that a firm with 2,500 employees would not be dominant in a market with 200,000 employees, since it would have a low market share of 1.25 percent. Due to the formula for calculating size standards, there is no explicit maximum size standard; rather, the calculated size standard grows more slowly as the average market size gets bigger as seen below in Figure 1. When moving from an average market size of 500 to 1,000 employees the size standard increases by 102 employees, whereas when the average market size increases from 200,000 to 200,500 employees it increases by just 2 employees.
( printed page 54149)
Figure 4: Relationship Between Average Market Size and Employment Based Size Standards
For receipt based size standards the equation that defines the relationship between average market size and small business size standards is much the same, just with employment levels replaced with receipts:
The exponent in equation 11 has been chosen such that the size standard is defined by two anchor points. The low anchor point is the minimum size standard of $30.6 million when the average market size is also $30.6 million. The high anchor point is a size standard of $500 million when the average market size is $20 billion.[68]
SBA choose this high anchor point because it believes that a firm with $500 million in receipts would not be dominant in a market with $20 billion in receipts, since it would have a low market share of 2.5 percent. Due to the formula for calculating size standards there is no explicit maximum size standard, rather the calculated size standard grows more slowly as the average market size gets bigger as seen below in Figure 2. When moving from
( printed page 54150)
an average market size of $30 million to $130 million the size standard increases by $26.5 million, whereas when the average market size increases from $20 billion to $20.1 billion it increases by just $1.3 million.
Figure 5: Relationship Between Average Market Size and Receipts Based Size Standards
The final piece in calculating size standards is to round the output so that they are more easily digestible to both small businesses and those working to support them. For employment based size standards, size standards are rounded to the nearest 50 employees. This is the same degree of rounding that the 2024 methodology used for employment based size standards outside of Wholesale Trade (NAICS Sector 42), where size standards were rounded to the nearest 25 employees. For receipts based size standards, size standards are rounded to the nearest $1 million in receipts. This is not the same degree of rounding that the 2024 methodology used for receipt based size standards which instead rounded to the nearest $0.5 million for most industries and $0.25 million for farming (NAICS 111 and NAICS 112). The proposed change in rounding is because of the generally higher size standards brought about by adjusting them for productivity which raises the minimum size standard from $8 million to $31 million.
One final industry group remains which needs a size standard, Depository Credit Institutions (NAICS 5221), which the SBA is proposing to continue with an asset based size standard. Depository Institutions, such as banks and credit unions, face additional fluctuations in their receipts as compared with other industries because both their receipts and expenses are tied closely to interest rates. For example, across all federally insured depository institutions, receipts increased 19.8 percent between 2021 and 2022 while total assets remained flat and net income fell 4.0 percent due to rising interest rates.[69]
As such the SBA has proposed size standards for these firms in total assets since 1984 (49 FR 40399). Total assets is the preferred measure for size standards for these firms because financial regulators also use it for classifying firms by size. To calculate the asset based size standard, the SBA first begins with receipts based size standard calculated for the industry group, of $222 million. The asset based is then determined by multiplying this by the ratio of total assets to total receipts in 2022 in the Federal Deposit Insurance Corporation's 2023 Quarterly Banking Report and the National Credit Union Administration's Quarterly Data
( printed page 54151)
Summary Report, which was 22.66. This gives a size standard of $5,031 million when rounded to the nearest million dollars.
SBA's objective in proposing this size standard methodology is to ensure no dominant firms are misclassified as small businesses while minimizing the number of non-dominant firms which are misclassified as large businesses. Like the current size standards, however, a number of firms that are dominant may inevitably be captured under a size standard by virtue of setting size standards at any level higher than a business-by-business level. For example, businesses such as a lone gas station for one hundred miles on a rural highway can have a dominant market position even with just a few employees because the market is small. SBA requests comment on potential additional avenues to ensure no dominant firms are captured.
The proposed methodology recommends increasing most size standards though there are exceptions. Under the methodology, 114 thousand businesses would be expected to be reclassified as small businesses due to the proposed changes in methodology.[70]
The industry groups with the most new small businesses would be expected to be Management of Companies and Enterprises (NAICS 5511), Restaurants and Other Eating Places (NAICS 7225), Other Miscellaneous Retailers (NAICS 4599), and Building Equipment Contractors (NAICS 2382) each with more than 4,000 business that would be expected to reclassify. Amongst industry groups with at least 1,000 current small businesses, the industries which would see the largest percentage change in small businesses are Colleges, Universities, and Professional Schools (NAICS 6113) with a 54% increase, General Medical and Surgical Hospitals (NAICS 6221) with a 45% increase, and Management of Companies and Enterprises (NAICS 5511) with a 38% increase. Amongst industry groups which would lose small business status, the two with the greatest number are Wired and Wireless Telecommunications (except Satellite) (NAICS 5171) and Waste Collection (NAICS 5621) which would be expected to see 41 and 33 new large businesses respectively. All other industries would be expected to see fewer than 20 new large businesses.[71]
In total 172 businesses currently classified as small would be expected to lose that status.
7. Adjustment to Receipts Based Size Standards for Productivity Growth and Inflation
SBA makes adjustments to its receipts based size standards when necessary. Adjustments are proposed to be made for two factors the general price increases of inflation and the improving productivity of the U.S. Economy. Prior versions of SBA size standard methodology only adjusted for inflation. Without considering productivity growth in its size standards, SBA put small businesses in industries with a receipts based size standard at a disadvantage to those in industries with an employee based size standard, which have an implicit adjustment for productivity built in. Productivity growth allows small businesses with a given set of resources (time, capital, materials) to more efficiently convert them into useable goods and services. Productivity growth leads to greater output that is not captured by inflation. Without accounting for productivity, the size standards are left with an incomplete assessment of small business size. Over the 72 years since SBA adopted its first receipts based size standard of $1 million, the change in productivity has been substantial. As seen in 6, when only adjusting receipt based size standards for inflation as measured by the Gross Domestic Product (GDP) implicit price deflator the original $1 million size standard is the equivalent to $9.7 million in the first quarter of 2026. However, when using both inflation and productivity the equivalent size standard in 2026 is $30.6 million. Without adjusting for productivity, the SBA has presumed that businesses with receipts based size standards are operating in a similar way to their counterparts 72 years ago. The SBA has repeatedly received petitions to raise size standards or use employee-based standards so that small firms can continue to stay relevant in their industry and withstand rapid, ever-changing economic realities, additional requirements in contracts expanding what the government is procuring, changing costs of doing business, shrinking margins, and various other shifts that the prior SBA size standards were unable to swiftly react to.
( printed page 54152)
Figure 6: Adjusting the Original Receipts Based Size Standard for Productivity Growth and Inflation
To adjust receipt values for both inflation and productivity changes, SBA creates an index of the GDP per employee in the U.S. economy. Data on GDP comes from the BEA, while data on total employment comes from the Bureau of Labor Statistics. Both are accessed through the Federal Reserve Bank of St. Louis for convenience.[72]
The cumulative inflation and productivity growth between any two periods is then calculated as follows:
where the End Period is the period that data was collected or the most recent period for which GDP per employee can be calculated when adjusting monetary size standards, and the base period is the last period for which size standards
( printed page 54153)
have been adjusted for inflation and productivity. Since receipt based size standards have never been adjusted for both inflation and productivity, the base period for adjusting size standards in this document is the first quarter of 1954. This puts the minimum size standard in the first quarter of 2026 at $30.6 million, while for the first quarter of 2022 when the vast majority of the data used to calculate size standards was collected the minimum size standard would be $25.1 million. These numbers are reflected in the above section on calculating size standards.
When SBA revises size standards in accordance with its regular review of all size standards are required under the Jobs Act (Pub. L. 111-240, 124 Stat. 2504; September 27, 2010), it will also adjust all receipt based size standards for inflation and productivity growth. Given the long gaps between the regular reviews, SBA may also adjust monetary size standards more frequently for inflation and productivity growth as it deems necessary.
8. Discussion on the Changes in Methodology
The proposed size standard methodology represents a significant departure from the previous version published in 2024.[73]
As such a detailed discussion of the changes in methodology is warranted to inform the public on why these changes were proposed. The five most significant changes are:
Changing the NAICS level at which size standards are calculated from the 6-digit NAICS code to a mix of 4- and 5-digit NAICS codes—In the current version of SBA size standards, there are nearly 1,000 unique size standards, with numerous exceptions for federal contracting purposes. For example, there is currently a different size standard for Ship Building (1,300 employees) than there is for Boat Building (1,000 employees). While Ships are larger than boats and are more likely to be used for commercial purposes, there is gray area where a firm could be uncertain which standard applied to them. This uncertainty can be resolved as both NAICS 6-digit industries are combined into a single 4-digit industry group. Along with change in aggregation, SBA has also chosen to remove all size standard exceptions.
Converting numerous industry groups and industries from receipt based size standards to an employment based one—In the current version of SBA size standards, it is the default to assume that outside of manufacturing and services where Congress specified the measure for size standards, an industry should have a receipts-based size standard unless certain conditions are met including highly capital intensive industries and low operational costs. This method had 51.6% of size standard be receipts based and 88.8% of all employer firms being in those industries. The proposed methodology takes the opposite approach and defaults to an employment based size standard for all industry groups and industries except service based ones where Congress specified that a receipts based size standard must be used.[74]
As discussed above, this new method is intended to decrease the fluctuations of firms between small and large business status, especially for Federal contractors. The proposed change also would lower the percentage of size standards with a receipts based size standard to 37.9%, and the number of firms with one to 58.2%.
Updated factors determining small business size standards—In the current version of SBA's methodology there are seven factors that are used to determine small business size standards: simple average firm size, weighted average firm size, average assets per firm, national four firm concentration ratio, national Gini coefficient, and two disparity measures of federal contracts when an industry receives more than $20 million in federal contracts. These factors, while often associated with a firm's dominance in its field of operation, did not directly relate and in some cases led size standards astray. For example, the small size of farms led SBA to giving them size standards far below firms in other sectors of the economy despite the fact that the markets they competed in are national in scope. The proposed method uses just three measures: national industry size, number of geographic markets, and an adjustment for net imports which are combined into an average market size measure. The change in factors is intended to more closely align the size standards methodology with the statutory language of the Small Business Act that a small business is one which is “not dominant in its field of operation.” A field of operations should include both the goods or services and business provides but also the geographic area in which they compete, similar to the way the Federal Trade Commission (FTC) and Antitrust Division of the Department of Justice (DOJ) define a market in their Horizontal Merger Guidelines.[75]
A firm may be relatively small nationally but be dominant in a small market as is the case with hospitals which are among the most challenged industry group by the FTC and DOJ despite a very low national concentration.[76]
On the other hand, a firm could be much larger nationally but not be dominant because it competes in a national or even international market. Such is the case with Oil and Gas extraction where the FTC has implemented regulations to exempt acquisitions of mineral rights from the ordinary requirements of premerger notification (16 CFR 802.3 last amended 70 FR 4994, January 31, 2005).
Updated the formula for how factors translate to size standards—The current size standard methodology creates a size standard for each of the seven factors discussed above and then averages those together. In selecting size standards, SBA compares an industry's factor to its relative position among a comparison group of industries. This can lead to unintended consequences if an industry's factor suggests in the absolute case that a size standard should be raised, but the comparison group's factors rose faster leading instead to a recommendation that size standards be lowered. Many of the factors also have a significant skew which led to very high recommended size standards, or, in the case of Gini coefficient size standards less than zero which required the imposition of minimums and maximums to be imposed at early stages in the size standard setting process. The proposed methodology instead uses a different approach of combining its three factors into a single measure, average market size, from which size standards are calculated. Like the factors of the current methodology this measure is skewed but that skew is addressed differently. As average market size grows larger so to do size standards, but at a decreasing rate. This means that there is no maximum size standard. A minimum size standard is kept to ensure that all businesses that are small in absolute size can still access SBA programs.
Added in a productivity growth adjustment for monetary based size standards—SBA has since 1975 (40 FR 32824; August 5, 1975) periodically adjusted receipt based size standards upwards to account for inflation; however, it has to date never adjusted size standards for productivity growth. Without a productivity growth
( printed page 54154)
adjustment, receipt based size standards have fallen out of step with employment based ones which have a natural productivity adjustment built in since a business is free to invest in productivity enhancing technology or training without risk of losing its small business status. By adopting this change small businesses will not lose their small business status due to the general productivity growth of the entire U.S. economy.
9. Public Comments
Public comments on proposed size standard rules provide additional important information. These comments can supplement SBA's analysis of industry structure or the data it used, thereby enabling it to consider other relevant information, where appropriate, in the final decision on a size standard. SBA welcomes and thoroughly reviews all public comments before making final decisions on proposed changes to size standards methodology. While SBA welcomes comments on any aspect of its proposed methodology, including reliance interests implicated by using such methodology to update size standards, in particular SBA is interested in the following questions:
Has SBA chosen the appropriate level of aggregation? Are there markets where the 4-digit NAICS code is too general and a more granular 5-digit NAICS code would be more appropriate? Conversely are some of the industries for which the SBA is proposing a size standard at the 5-digit level too narrow and should be aggregated to the 4-digit level?
Has SBA chosen the appropriate size measure for all industry groups and industries? Should some with employment based size standards have a receipt based one or vis versa? Should some have their size standard defined in terms of some other measure besides employment or receipts?
Has SBA used the most appropriate data sources for incorporating industry groups and industries not included in SUSB, NES, and CBP? Are there more industry groups and industries which have a significant presence of government owned entities which should be incorporated? If so, what publicly accessible data sources produced by Federal agencies are most appropriate to use?
Does the algorithm for calculating the number of geographic markets produce reasonably sized markets for industry groups and industries in general? If not are the geographic markets systematically too large or too small? Are the deviations SBA proposes appropriate? Are there more industry groups or industries where the general method produces inconsistent results and requires adjustment?
Has SBA chosen the proper anchor points in its formula for calculating size standards from an industry's average market size? Are the current minimum size standards too low or too high? Are the current high anchor points too low or too high?
Has SBA chosen the most appropriate measure to increase receipts based size standards for both inflation and productivity growth?
References
Autor, D. H., & Dorn, D. (2013). The Growth of Low-skill Service Jobs and the Polarization of the U.S. Labor Market.
American Economic Review, 103
(5), 1553-1597.
doi.org/10.1257/aer.103.5.1553
Autor, D. H., Dorn, D., & Hanson, G. H. (2013). The China Syndrome: Local Labor Market Effects of Import Competition in the United States.
American Economic Review, 103
(6), 2121-2168.
doi.org/10.1257/aer.103.6.2121
Acemoglu, D., & Restrepo, P. (2020). Robots and Jobs: Evidence from U.S. Labor Markets.
Journal of Political Economy, 128
(6), 2188-2244.
doi.org/10.1086/705716
Desmet, K., & Fafchamps, M. (2006). Employment Concentration Across U.S. Counties.
Regional Science and Urban Economics, 36
(4), 482-509.
doi.org/10.1016/j.regsciurbeco.2006.03.004
Ellison, G., & Glaeser, E. L. (1997). Geographic Concentration in U.S. Manufacturing Industries: A Dartboard Approach.
Journal of Political Economy, 105
(5), 889-927.
doi.org/10.1086/262098
Fowler, C.S. (2024). New Commuting Zone Delineation for the U.S. Based on 2020 Data.
Scientific Data,
11(975).
doi.org/10.1038/s41597-024-03829-5
Fowler, C.S., Rhubart, DC, & Jensen, L. (2016). Reassessing and Revising Commuting Zones for 2010: History, Assessment, and Updates for U.S. `Labor-sheds' 1990-2010.
Population Research and Policy Review,
35(2), 263-286.
doi.org/10.1007/s11113-016-9386-0
Gervais, A., & Jensen, J. B. (2019). The Tradability of Services: Geographic Concentration and Trade Costs.
Journal of International Economics, 118,
331-350.
doi.org/10.1016/j.jinteco.2019.03.003
Heckman, J. (1974). Shadow Prices, Market Wages, and Labor Supply.
Econometrica: Journal of the Econometric Society,
679-694.
doi.org/10.2307/1913937.
Jha P., Neumark D., & Rodriguez-Lopez A., “What's Across the Border? Re-Evaluating the Cross-Border Evidence on Minimum Wage Effects,” NBER Working Paper 32901 (2024),
doi.org/10.3386/w32901.
Mayo, J.W., Press, R., & Whitener, M. (2025). Understanding Early-Stage Merger Investigations: What Drives the Antitrust Agencies?.
Review of Industrial Organization, 67
(2), 133-159.
doi.org/10.1007/s11151-025-10020-6
Tolbert, C.M. & Sizer, M. (1996).
U.S. Commuting Zones and Labor Market Areas: A 1990 Update
(Staff Paper No. AGES-9614). U.S. Department of Agriculture, Economic Research Service.
doi.org/10.22004/ag.econ.278812
11. Appendix
( printed page 54155)
( printed page 54156)
( printed page 54157)
( printed page 54158)
( printed page 54159)
( printed page 54160)
( printed page 54161)
( printed page 54162)
( printed page 54163)
( printed page 54164)
( printed page 54165)
( printed page 54166)
( printed page 54167)
( printed page 54168)
( printed page 54169)
( printed page 54170)
( printed page 54171)
( printed page 54172)
( printed page 54173)
( printed page 54174)
( printed page 54175)
( printed page 54176)
( printed page 54177)
( printed page 54178)
( printed page 54179)
( printed page 54180)
( printed page 54181)
( printed page 54182)
( printed page 54183)
( printed page 54184)
( printed page 54185)
( printed page 54186)
( printed page 54187)
( printed page 54188)
( printed page 54189)
( printed page 54190)
( printed page 54191)
( printed page 54192)
( printed page 54193)
( printed page 54194)
( printed page 54195)
( printed page 54196)
( printed page 54197)
( printed page 54198)
( printed page 54199)
( printed page 54200)
( printed page 54201)
( printed page 54202)
( printed page 54203)
( printed page 54204)
( printed page 54205)
( printed page 54206)
( printed page 54207)
( printed page 54208)
( printed page 54209)
( printed page 54210)
Kelly Loeffler,
Administrator.
Footnotes
1.
See
Hearings on H.R. 4090 and H.R. 5141 before the Committee on Banking and Currency of the U.S. House of Representatives, 83rd Congress, 1st Session (1953), page 17.
5.
Size standards in the first five-year review were not lowered due to lingering impacts of the 2007-2009 Great Recession. Size standards in the second five-year review were not lowered due disruptions because of the COVID-19 Pandemic.
10.
For example, the NAICS Industry Group 3352 Household Appliance Manufacturing contains two 6-digit Industries: 335210 Small Electrical Appliance Manufacturing and 335220 Major Household Appliance Manufacturing. Because the SBA is proposing a unified size standard for the Industry Group it will apply to both Industries.
11.
The cross-reference is as follows: “combined activities of crude petroleum and natural gas extraction—are classified in Industry Group 2111, Oil and Gas Extraction, based on the primary activity of the establishment” 2022 NAICS Manual—Office of Management and Budget.
12.
Besides receipts and employees, the current size standards include two other measures for determining size standards. For Commercial Banking (NAICS 522110), Credit Unions (NAICS 522130), Credit Card Issuing (NAICS 522210), and Savings Institutions and Other Depository Credit Intermediation (NAICS 522180) the size standard is defined as $850 million in total assets, and was chosen because it was “the most commonly accepted measure of bank size” in 1984 (49 FR 40399). For Petroleum Refineries (NAICS 324110) the size standard is defined both in terms of employees and barrels of oil refined per day, again because it was considered a better indicator of size for a single petroleum refinery (57 FR 542). SBA is proposing to replace this standard with just an employment number because employment requires less adjustment as productivity improves. For example, 1992 SBA has raised the barrels of oil part of the size standard 3 times (57 FR 18808; May 1, 1992, 68 FR 15047; March 28, 2003, and 81 FR 4469; January 26, 2016).
15.
Across the entire economy, the variation in total employment is just 44 percent of the variation in total real output (Federal Reserve Economic Data—St. Louis Federal Reserve Bank)
16.
According to the 2022 Statistics of U.S. Businesses. Manhattan, New York number is taken from the receipts and employment in the Food Services and Drinking Places Subsector (NAICS 722) for New York County, New York, while the Manhattan, Kansas number is taken from the receipts and employment in the same subsector for Riley County, Kansas.
18.
Five other industry groups: Automotive Dealers (NAICS 4411), Nonscheduled Air Transportation (NAICS 4812), Other Pipeline Transportation (NAICS 4869), Sound Recording Industries (NAICS 5122), and Web Search Portals, Libraries, Archives, and Other Information Services (NAICS 5192) have industries with employment based size standards currently producing the majority of receipts and are given an employment based size standard based on that criteria. Using a similar test the one industry with a mix of asset and receipt based size standards, Nondepository Credit Intermediation (NAICS 5222) is given a receipts based size standard.
19.
Industries with a mix of size standards are due to the current size standards being defined at the 6-digit NAICS level while certain proposed size standards are defined at the 4-digit NAICS level. In those cases some 6-digit industries had a receipts based size standard while others had employment based size standards.
42.
In their 2023 Horizontal Merger Guidelines, the Federal Trade Commission and Department of Justice, Antitrust Division look for changes in the Herfindahl-Hirschman Index, which is the square of all competing firm's market shares, when determining if potential firms are allowed to merge.
43.
For industry groups or industries with receipts based size standards, the national industry size is also adjusted for the average level of inflation and productivity growth between primary data collection in March of 2022 and the present based on the method described in the section “Adjustment to Receipts Based Size Standards for Productivity Growth and Inflation”. This adjustment raises all receipts based values in the reported data sources by 22.1%.
44.
The industry groups which are combined are: (1) Food Crops Grown Under Cover (NAICS 11141) and Nursery and Floriculture Production (NAICS 11142), (2) Chicken Egg Production (NAICS 11231), Broilers and Other Meat Type Chicken Production (NAICS 11232), Turkey Production (NAICS 11233), Poultry Hatcheries (NAICS 11234), and Other Poultry Production (NAICS 11239), (3) Sheep Farming (NAICS 11241) and Goat Farming (NAICS 11242), and (4) Aquaculture (NAICS 1125) and Other Animal Production (NAICS 1129).
45.
Not all government owned entities are excluded from SUSB. Government owned entities in the following NAICS Codes are included: Beer, Wine, and Distilled Alcoholic Beverage Merchant Wholesalers (NAICS 4248), Beer, Wine, and Liquor Stores (NAICS 44532), Tobacco Stores (NAICS 459991), Book Publishers (513130), Monetary Authorities—Central Bank (NAICS 5211), Savings Institutions (NAICS 522180), Credit Unions (NAICS 522130), Hospitals (NAICS 622), Gambling Industries (NAICS 7132), and Casino Hotels (NAICS 721120). Statistics of U.S. Businesses Methodology—Census Bureau.
49.
See National Center for Education Statistics, “Table 3. Number of operating public elementary and secondary schools, by school type, charter, and state or jurisdiction: School year 2023-24,” Common Core of Data: America's Public Schools, n.d.,
nces.ed.gov/ccd/tables/202324_summary_3.asp.
This figure is derived by taking the percentage of regular schools from the number of operating schools. All regular schools are operated by local school districts.
53.
Commuting Zones and Labor Market Areas—USDA, Economic Research Service The full methodology for calculating 2020 commuting zones is specified in Fowler (2024), prior 2010 commuting zones in Fowler et. al (2016), and 1990 commuting zones in Tolbert and Sizer (1996).
55.
The commuting zones algorithm also includes a check for if two counties are adjacent to one another. For purposes of the size standards methodology this check is of minimal importance as data from Alaska and Hawaii excluded due to the generally weak commuting patterns between these areas and the contiguous United States.
57.
The geographic dispersion ranges from zero to one, with zero representing a perfect match between employment and population, and one representing a complete separation of employment and population. The chosen stopping rule value of 0.15 thus represents a roughly equal distribution of employment and population across the country.
62.
For ten industry groups or industries a modified version of equation 7 is used that includes only population and the industry fixed effect. This is due to these having very limited employment and establishment data at the county level (less than 10 counties in the continental U.S.). The 10 are Forest Nurseries and Gathering of Forest Products (NAICS 1132), Sugar Manufacturing (NAICS 31131), Tobacco Manufacturing (NAICS 3122), Narrow Fabric Mills and Schiffli Machine Embroidery (NAICS 31322), Knit Fabric Mills (NAICS 31324), Leather and Hide Tanning and Finishing (NAICS 3161), Artificial and Synthetic Fibers and Filaments Manufacturing (NAICS 32522), Cement Manufacturing (NAICS 32731), Lime Manufacturing (NAICS 32741), and Securities and Commodity Exchanges (NAICS 5232).
63.
The contiguous United States covers 48 states and the District of Columbia. It excludes disconnected states like Hawaii and Alaska. It also does not include US territories like Guam and Puerto Rico.
64.
The Census Bureau acknowledges this problem in the SUSB methodology for Employment Services (NAICS 5913), and thus, reports a significant proportion of the industry employment only as “statewide” rather than specifying a county.
65.
The industry detail that the BEA uses is not the same as NAICS 4-digit industry. Some industries are combined in the BEA data while others are broken down further. For combined industries all are assumed to have the same net import adjustment. For those with a more detailed breakdown, the lower levels of industry details are first summed before the Net Import Adjustment is calculated. Additionally, the BEA reports construction by type of structure rather than type of firm. As such given the inability to transport construction output, all industries in the construction sector are given a net import adjustment of one.
70.
This number excludes any increases in the number of small businesses in the farming industries (NAICS 111 and 112), and Insurance and Employee Benefit Funds (NAICS 5251), which are not included in SUSB. There may be as many as 38 thousand farms that could gain small business status though the Census of Agriculture lacks detailed data on firm size by employment to make a confident estimate.
 www.sba.gov/size
 www.regulations.gov
 15 U.S.C. 631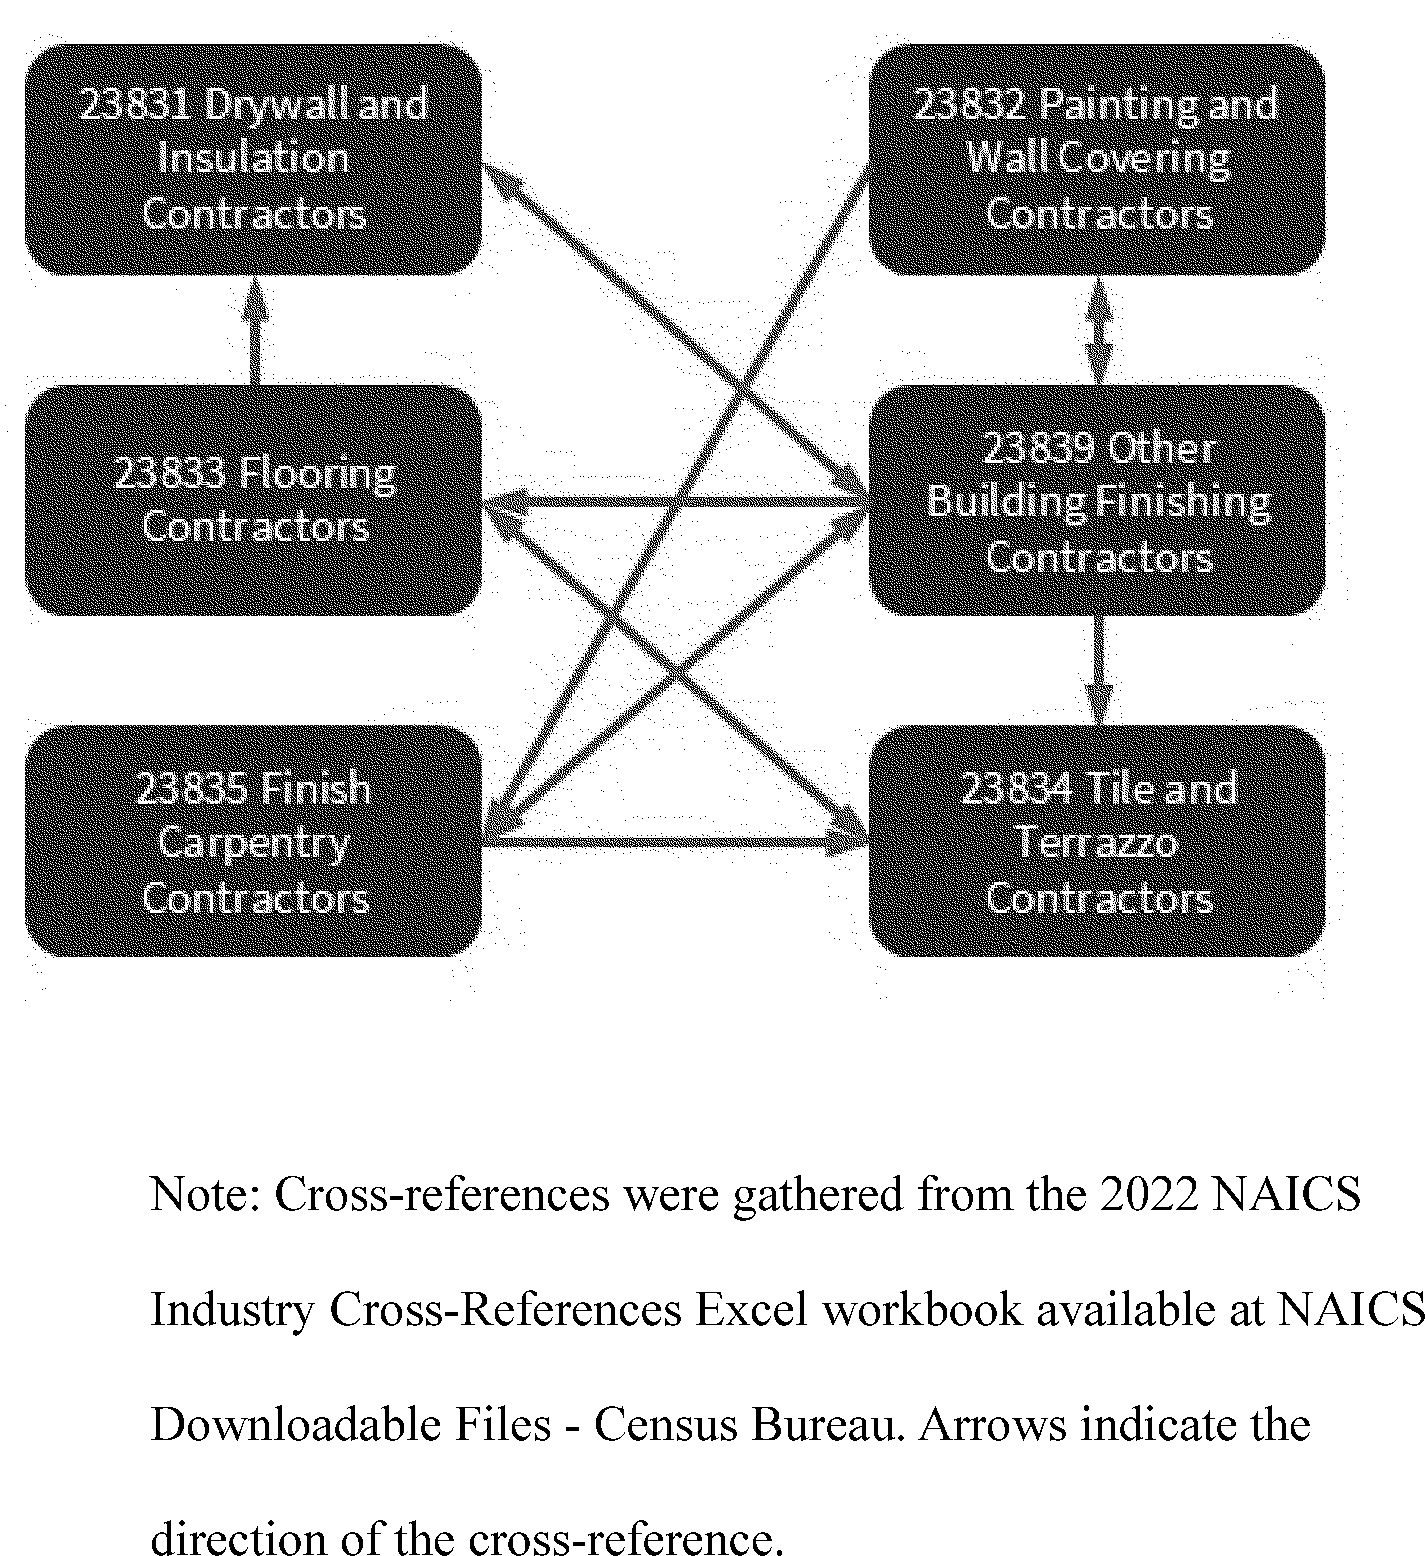
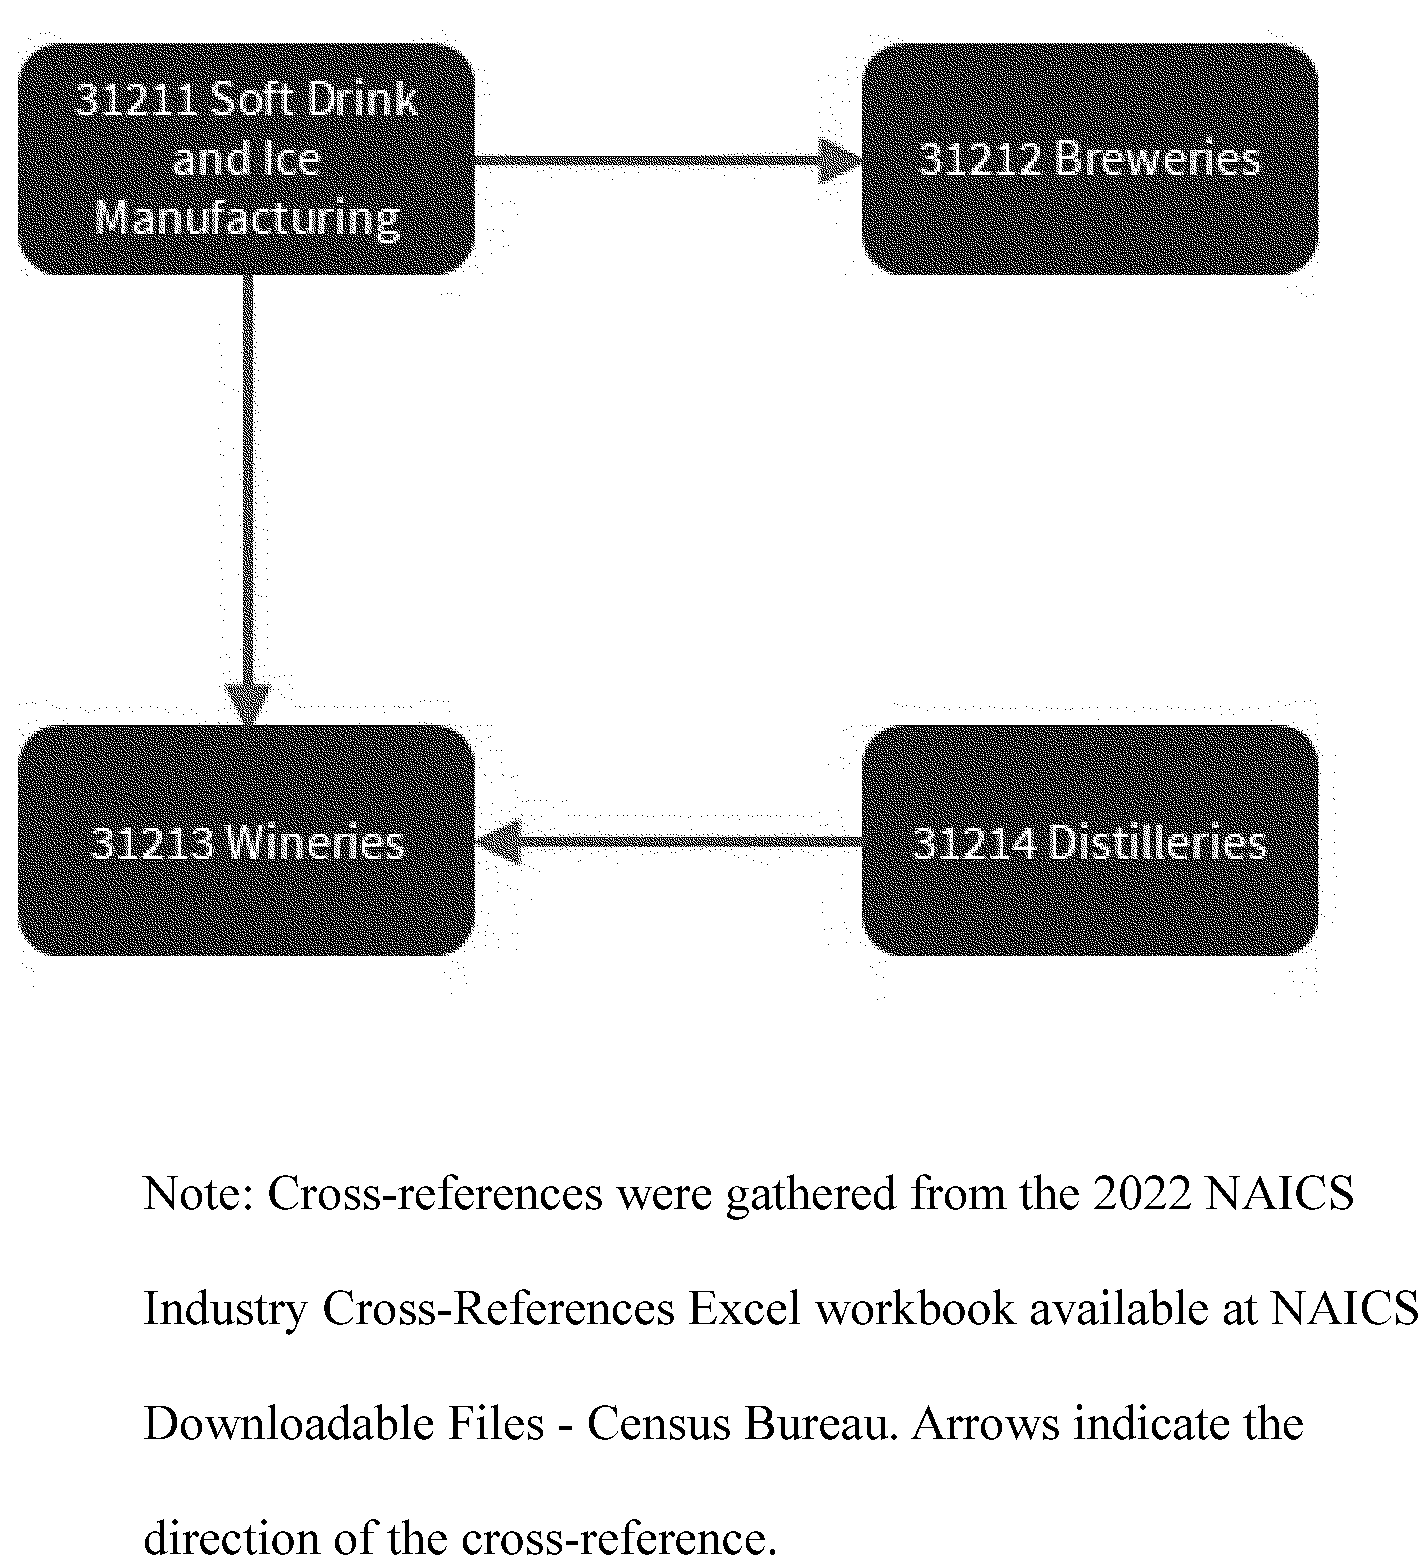
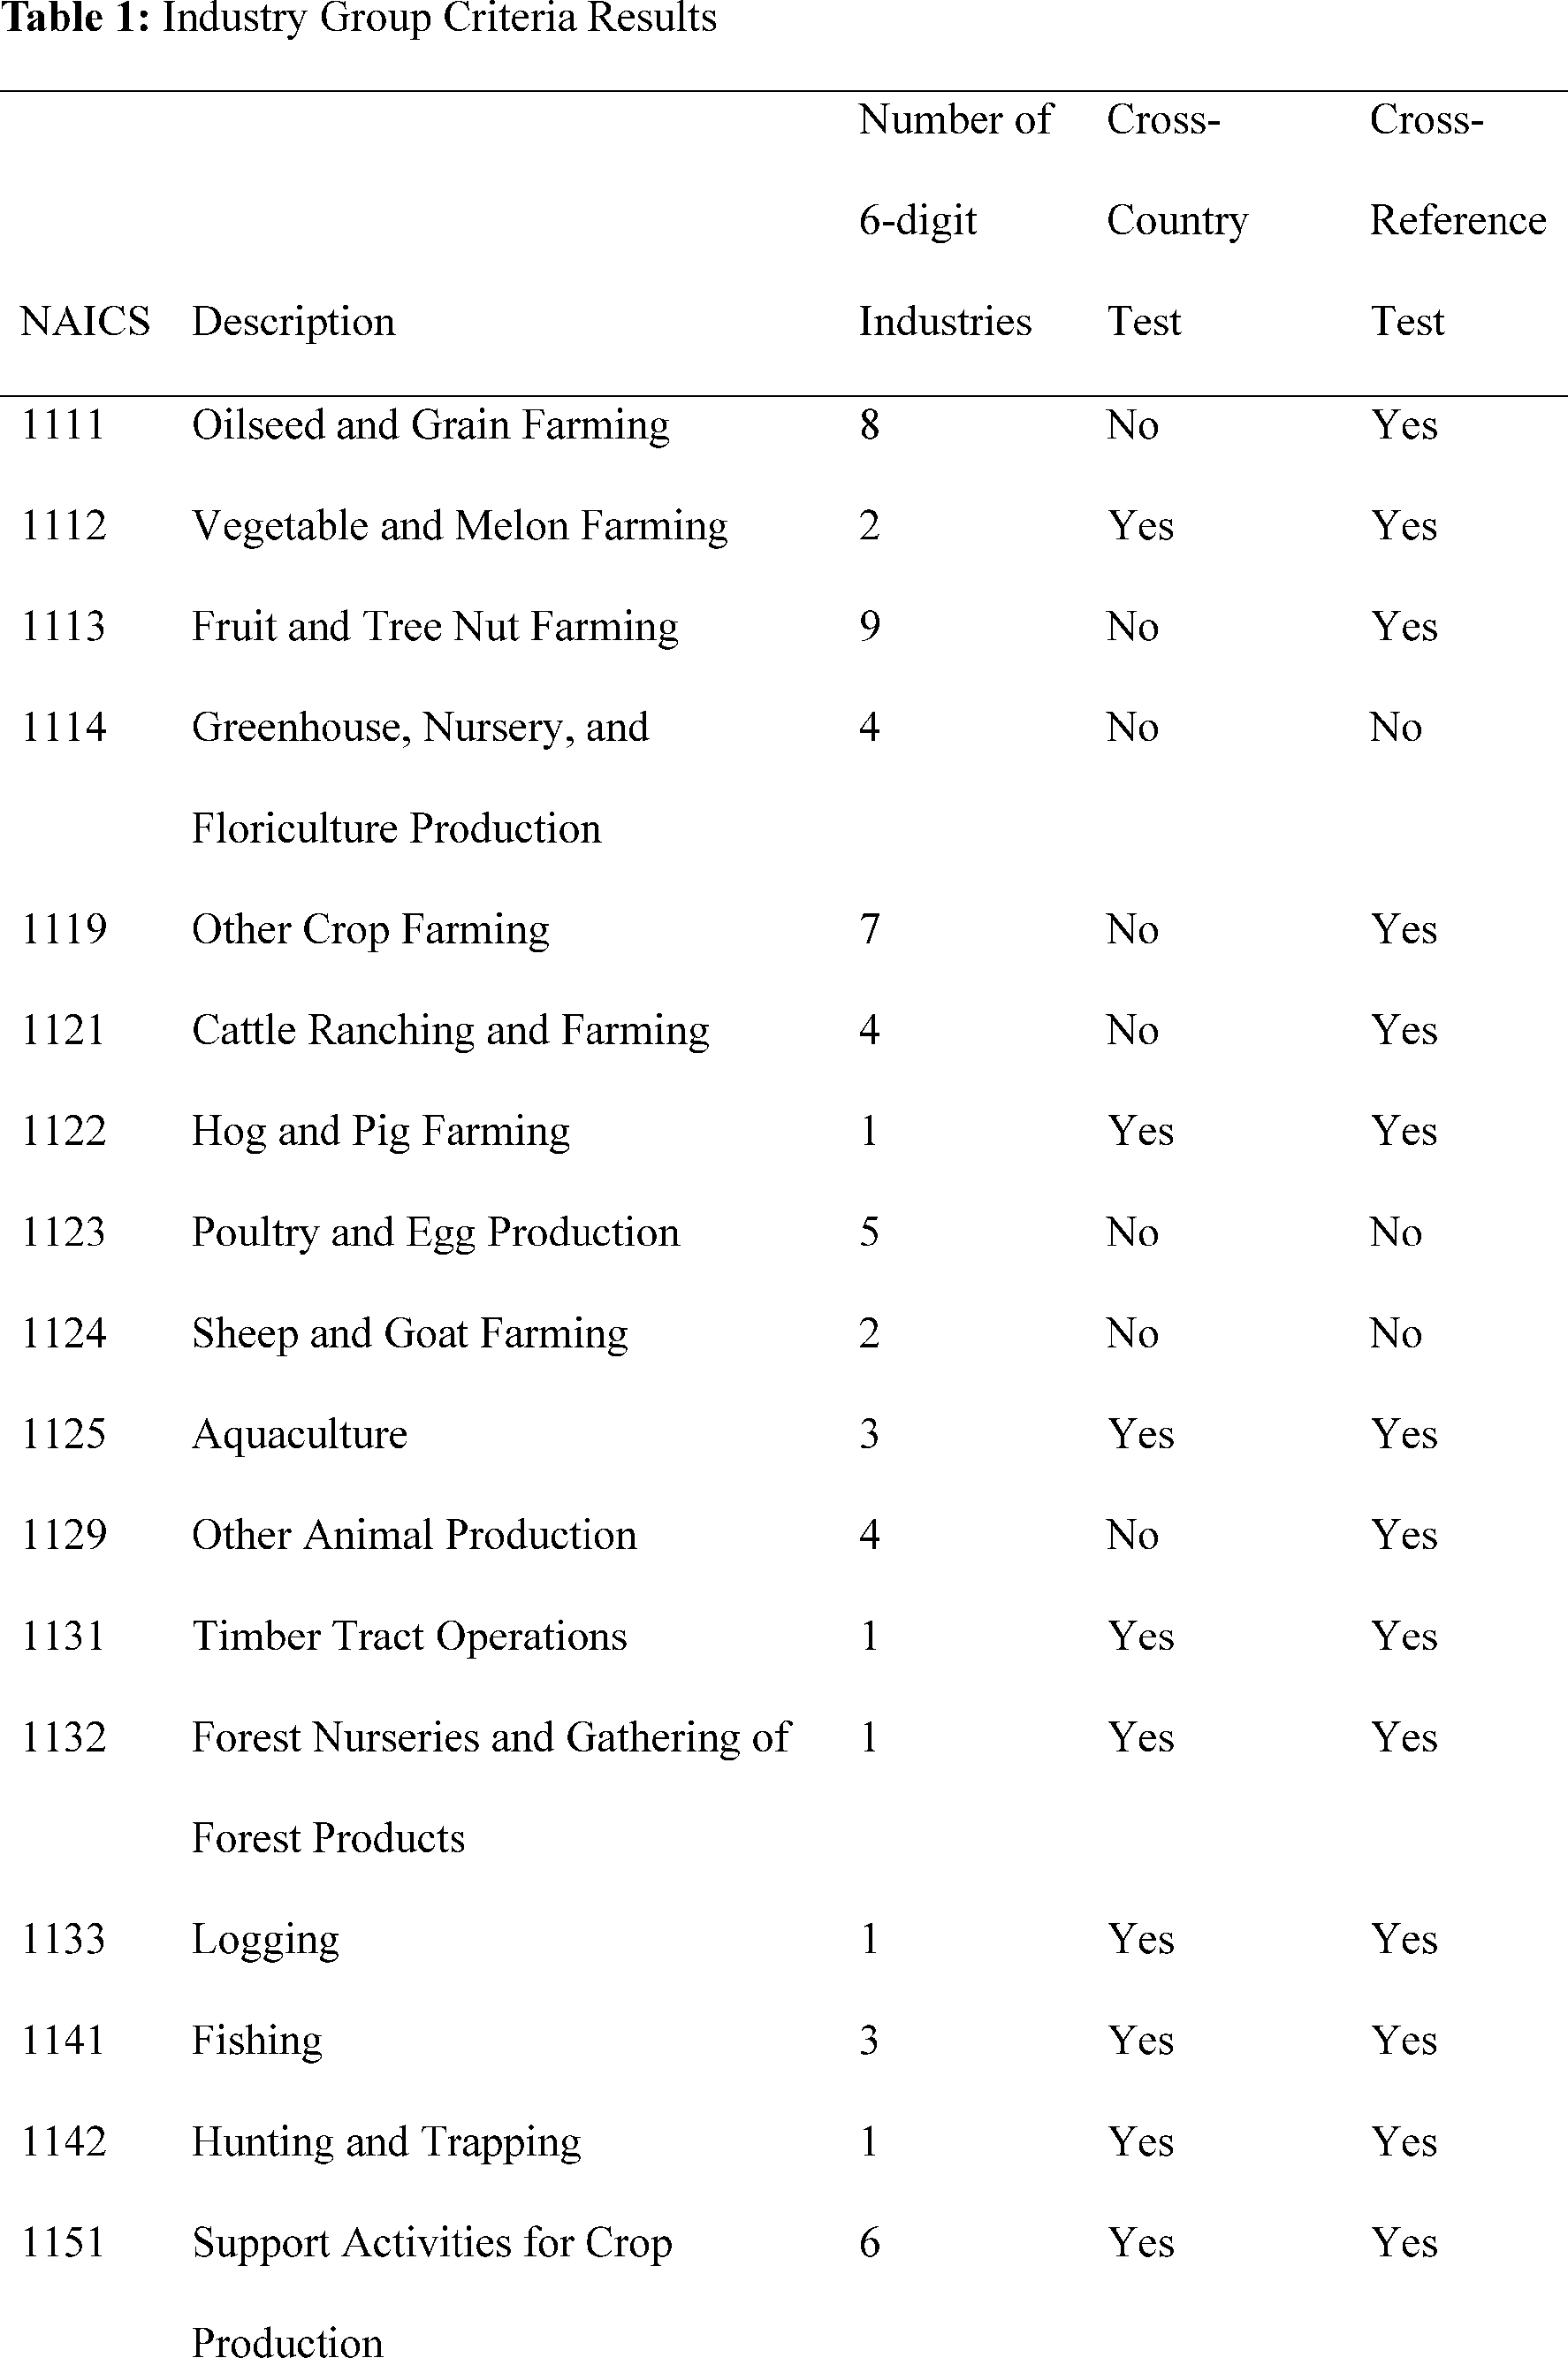
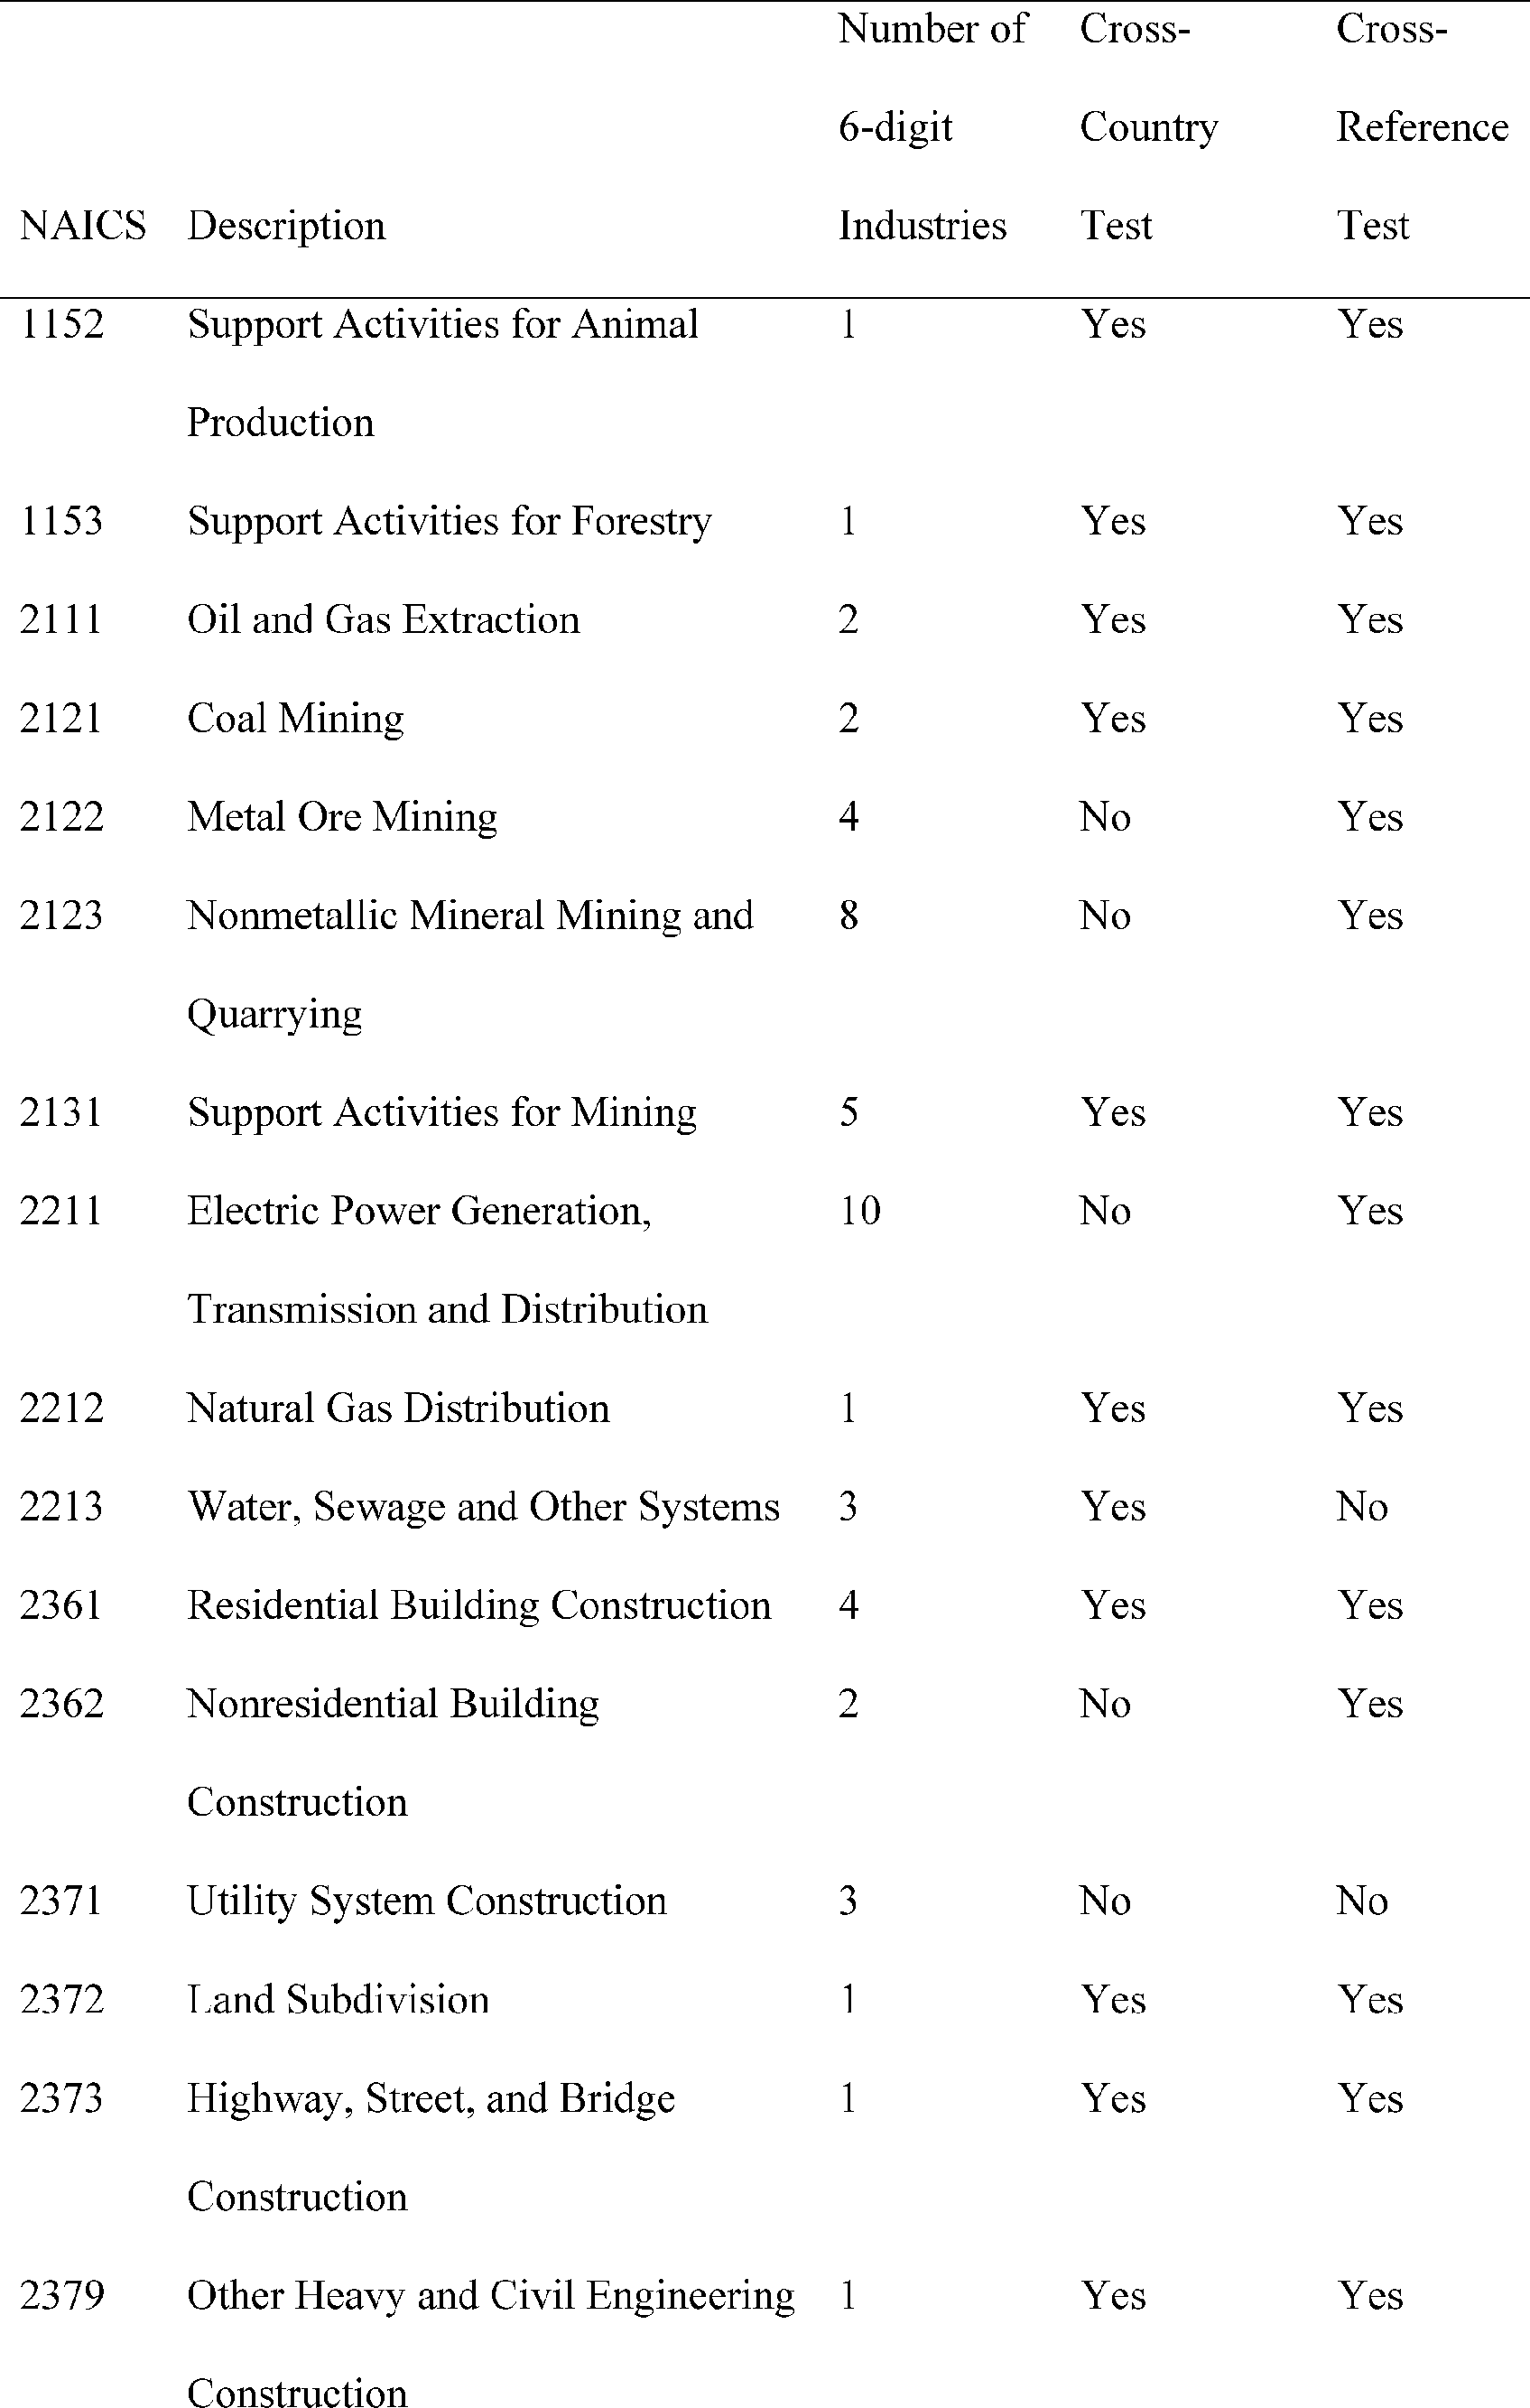
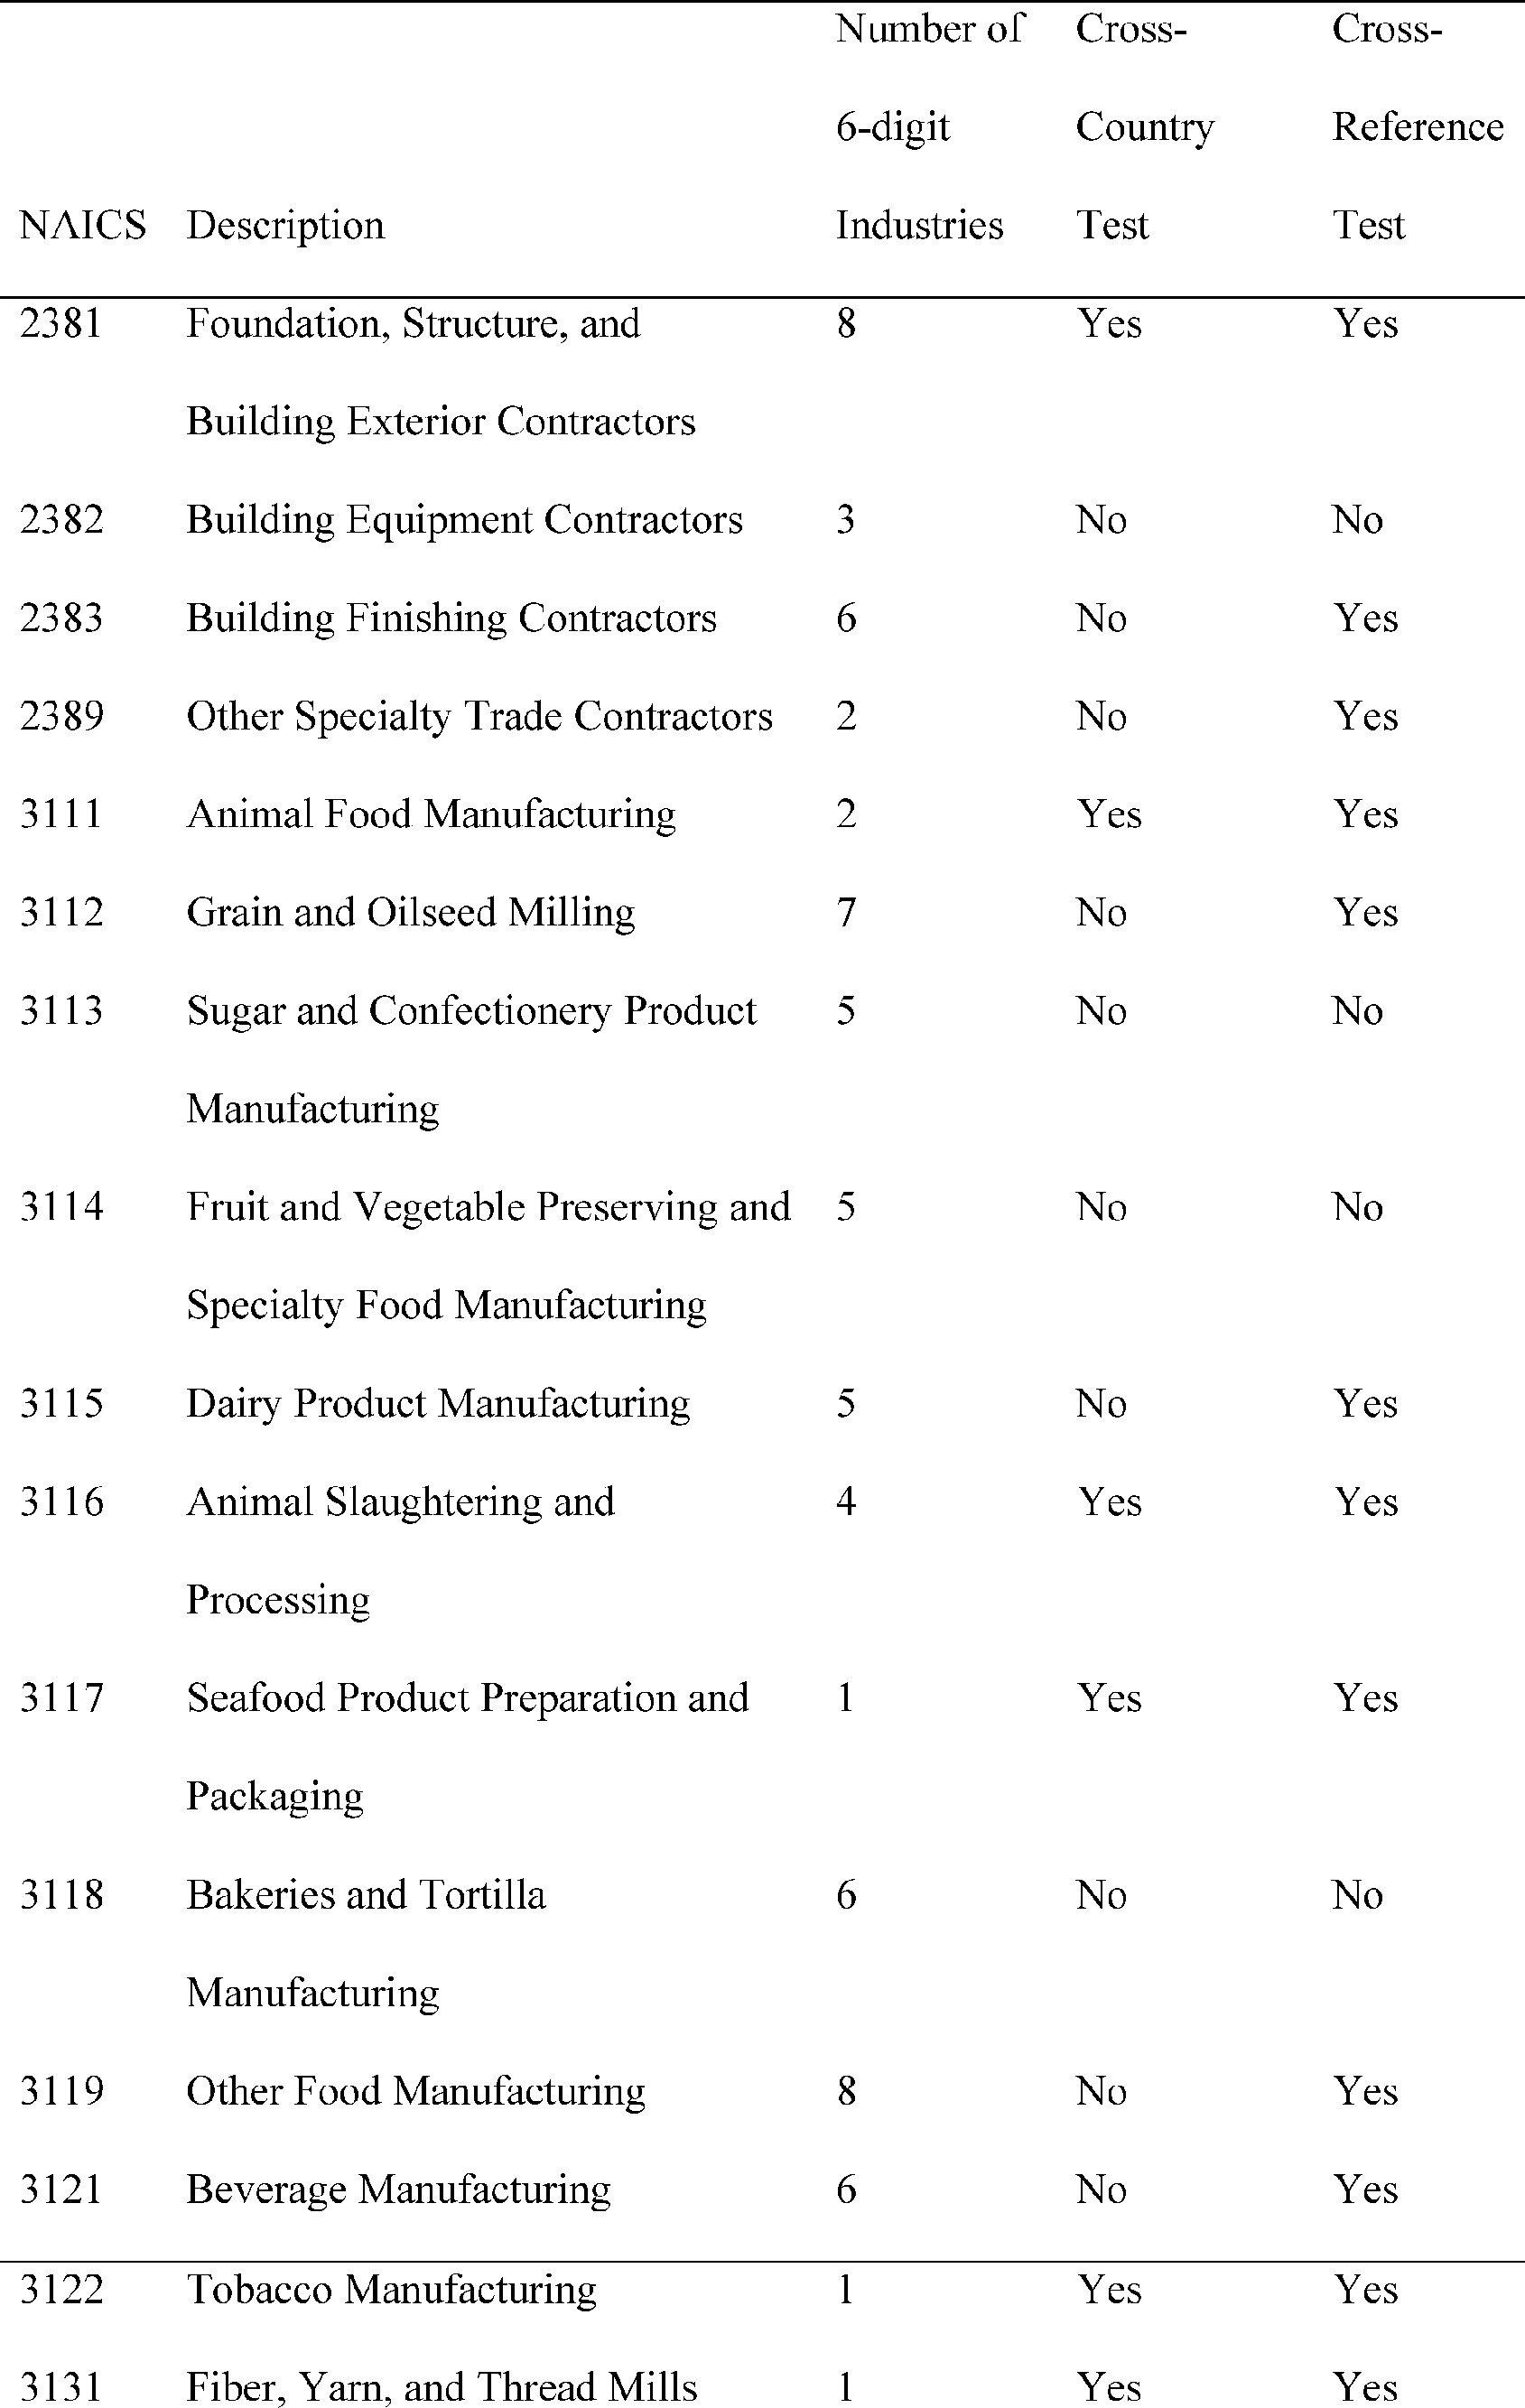
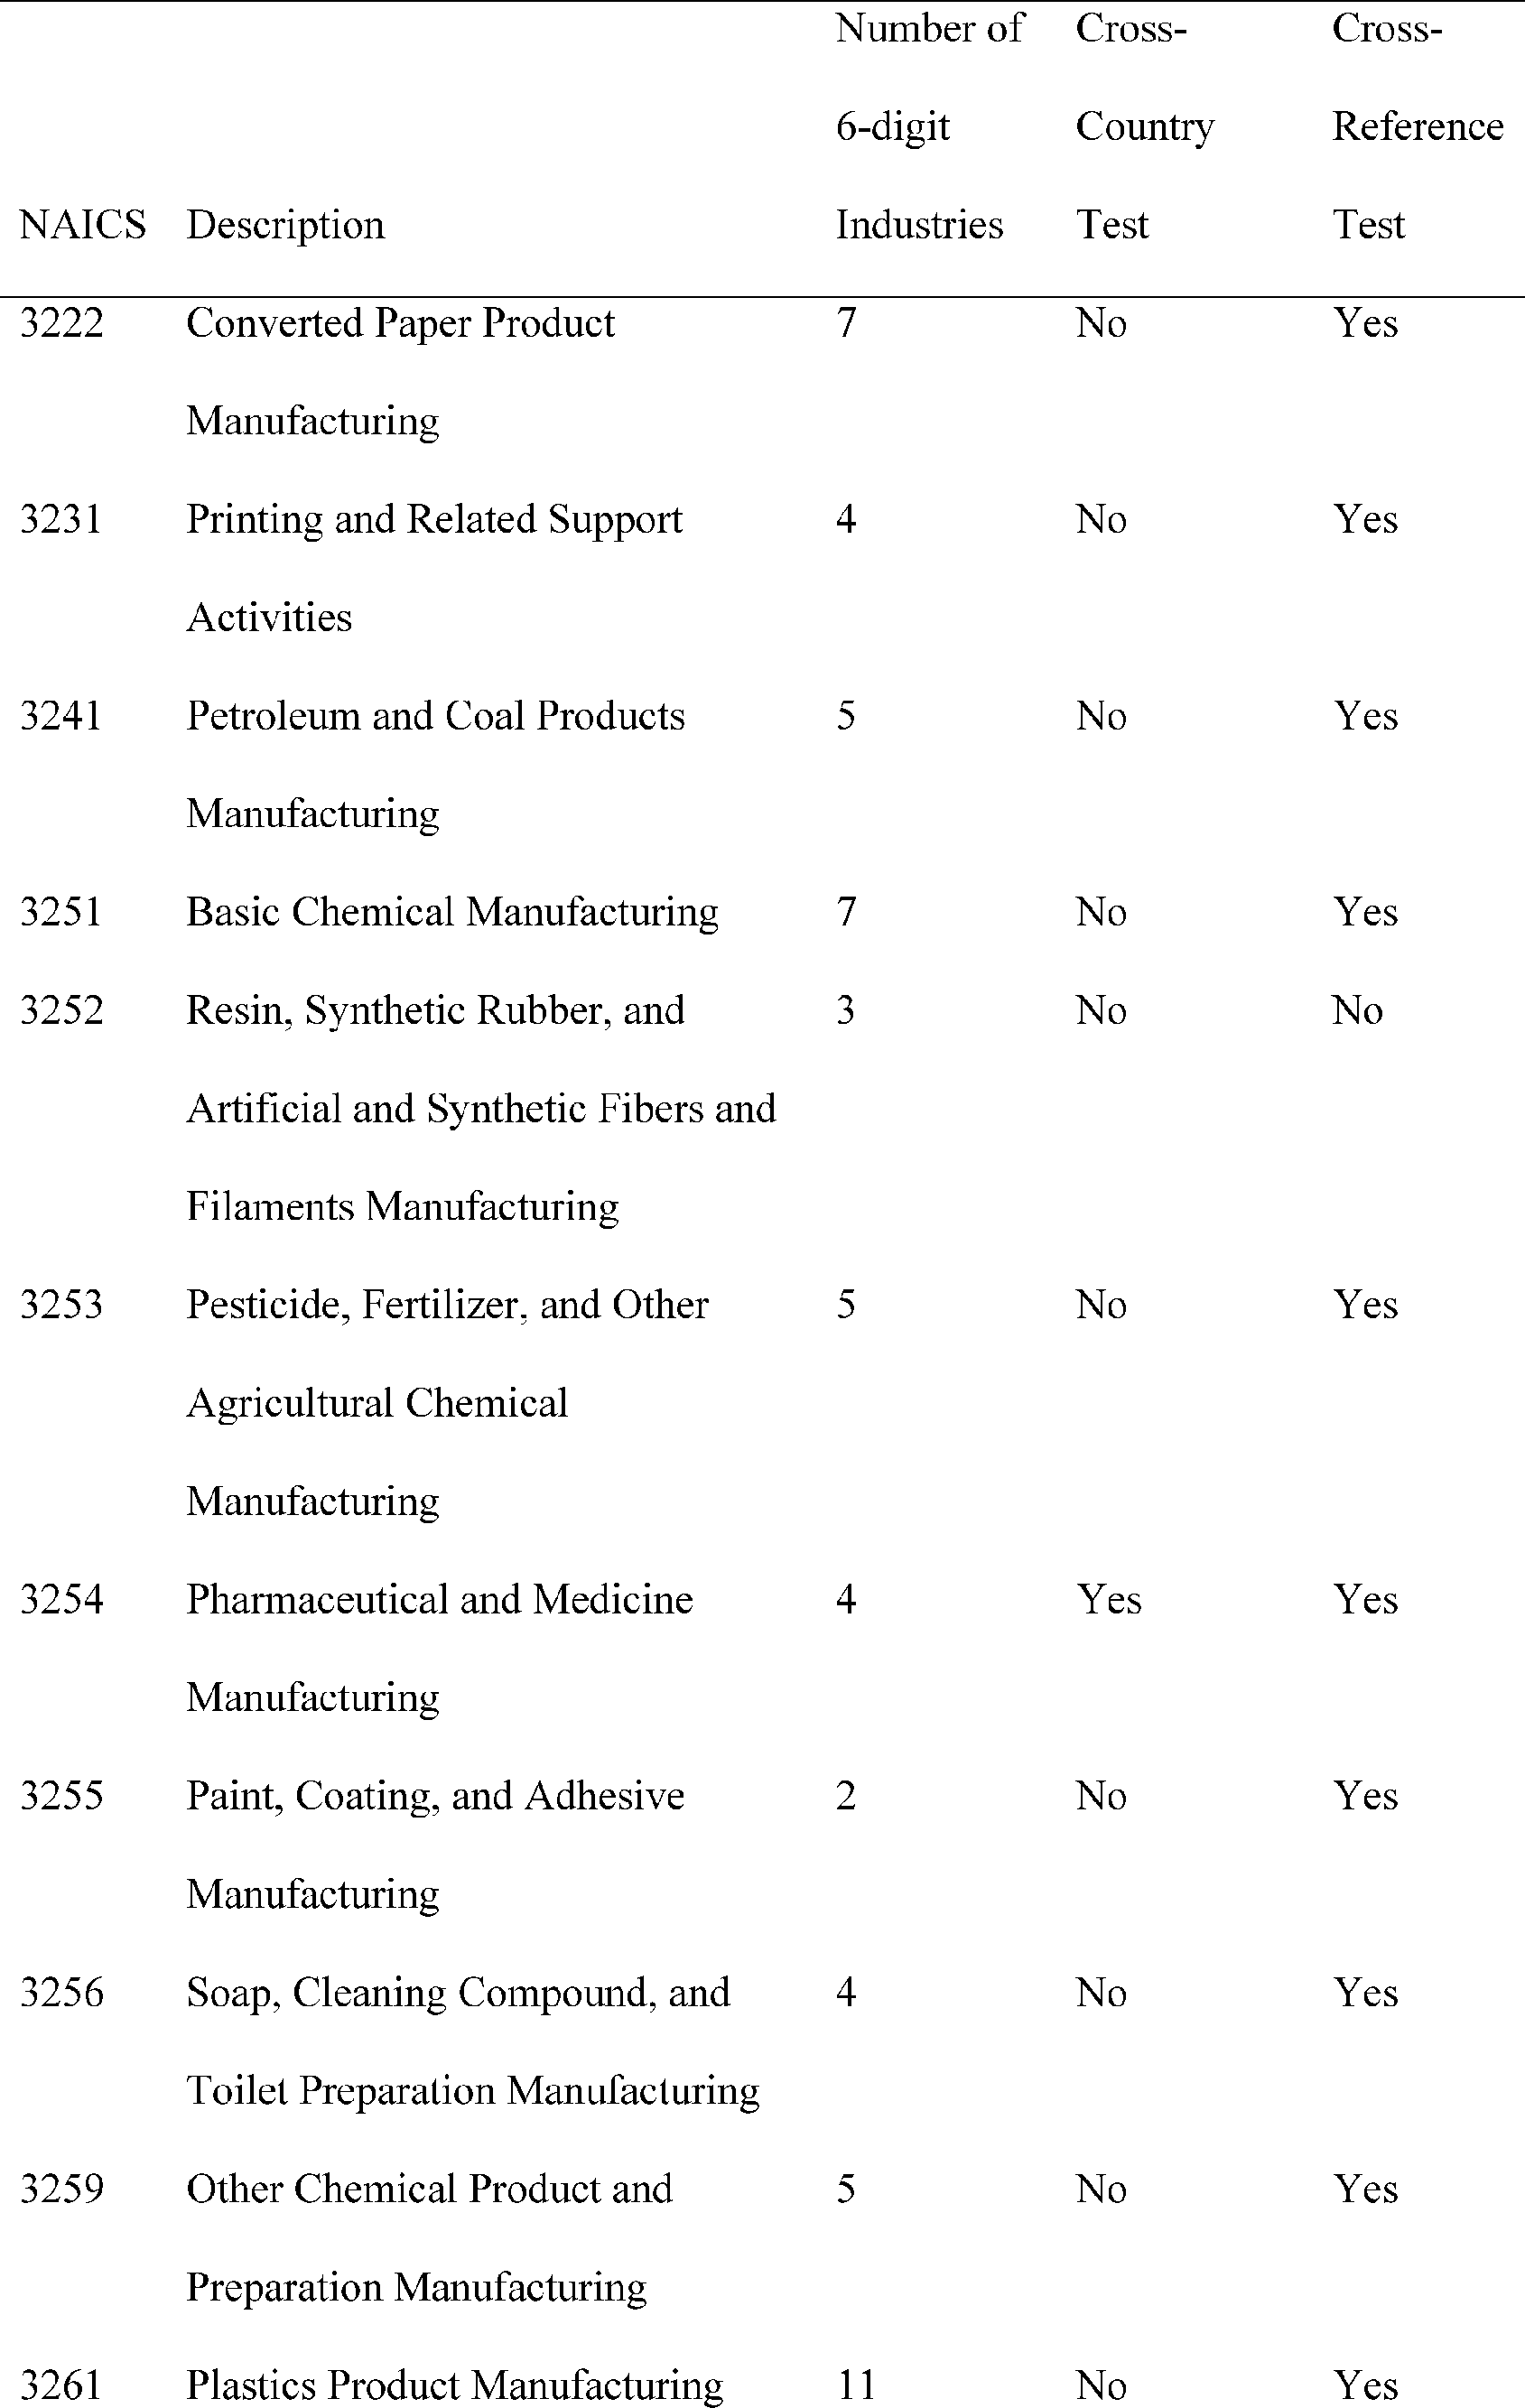
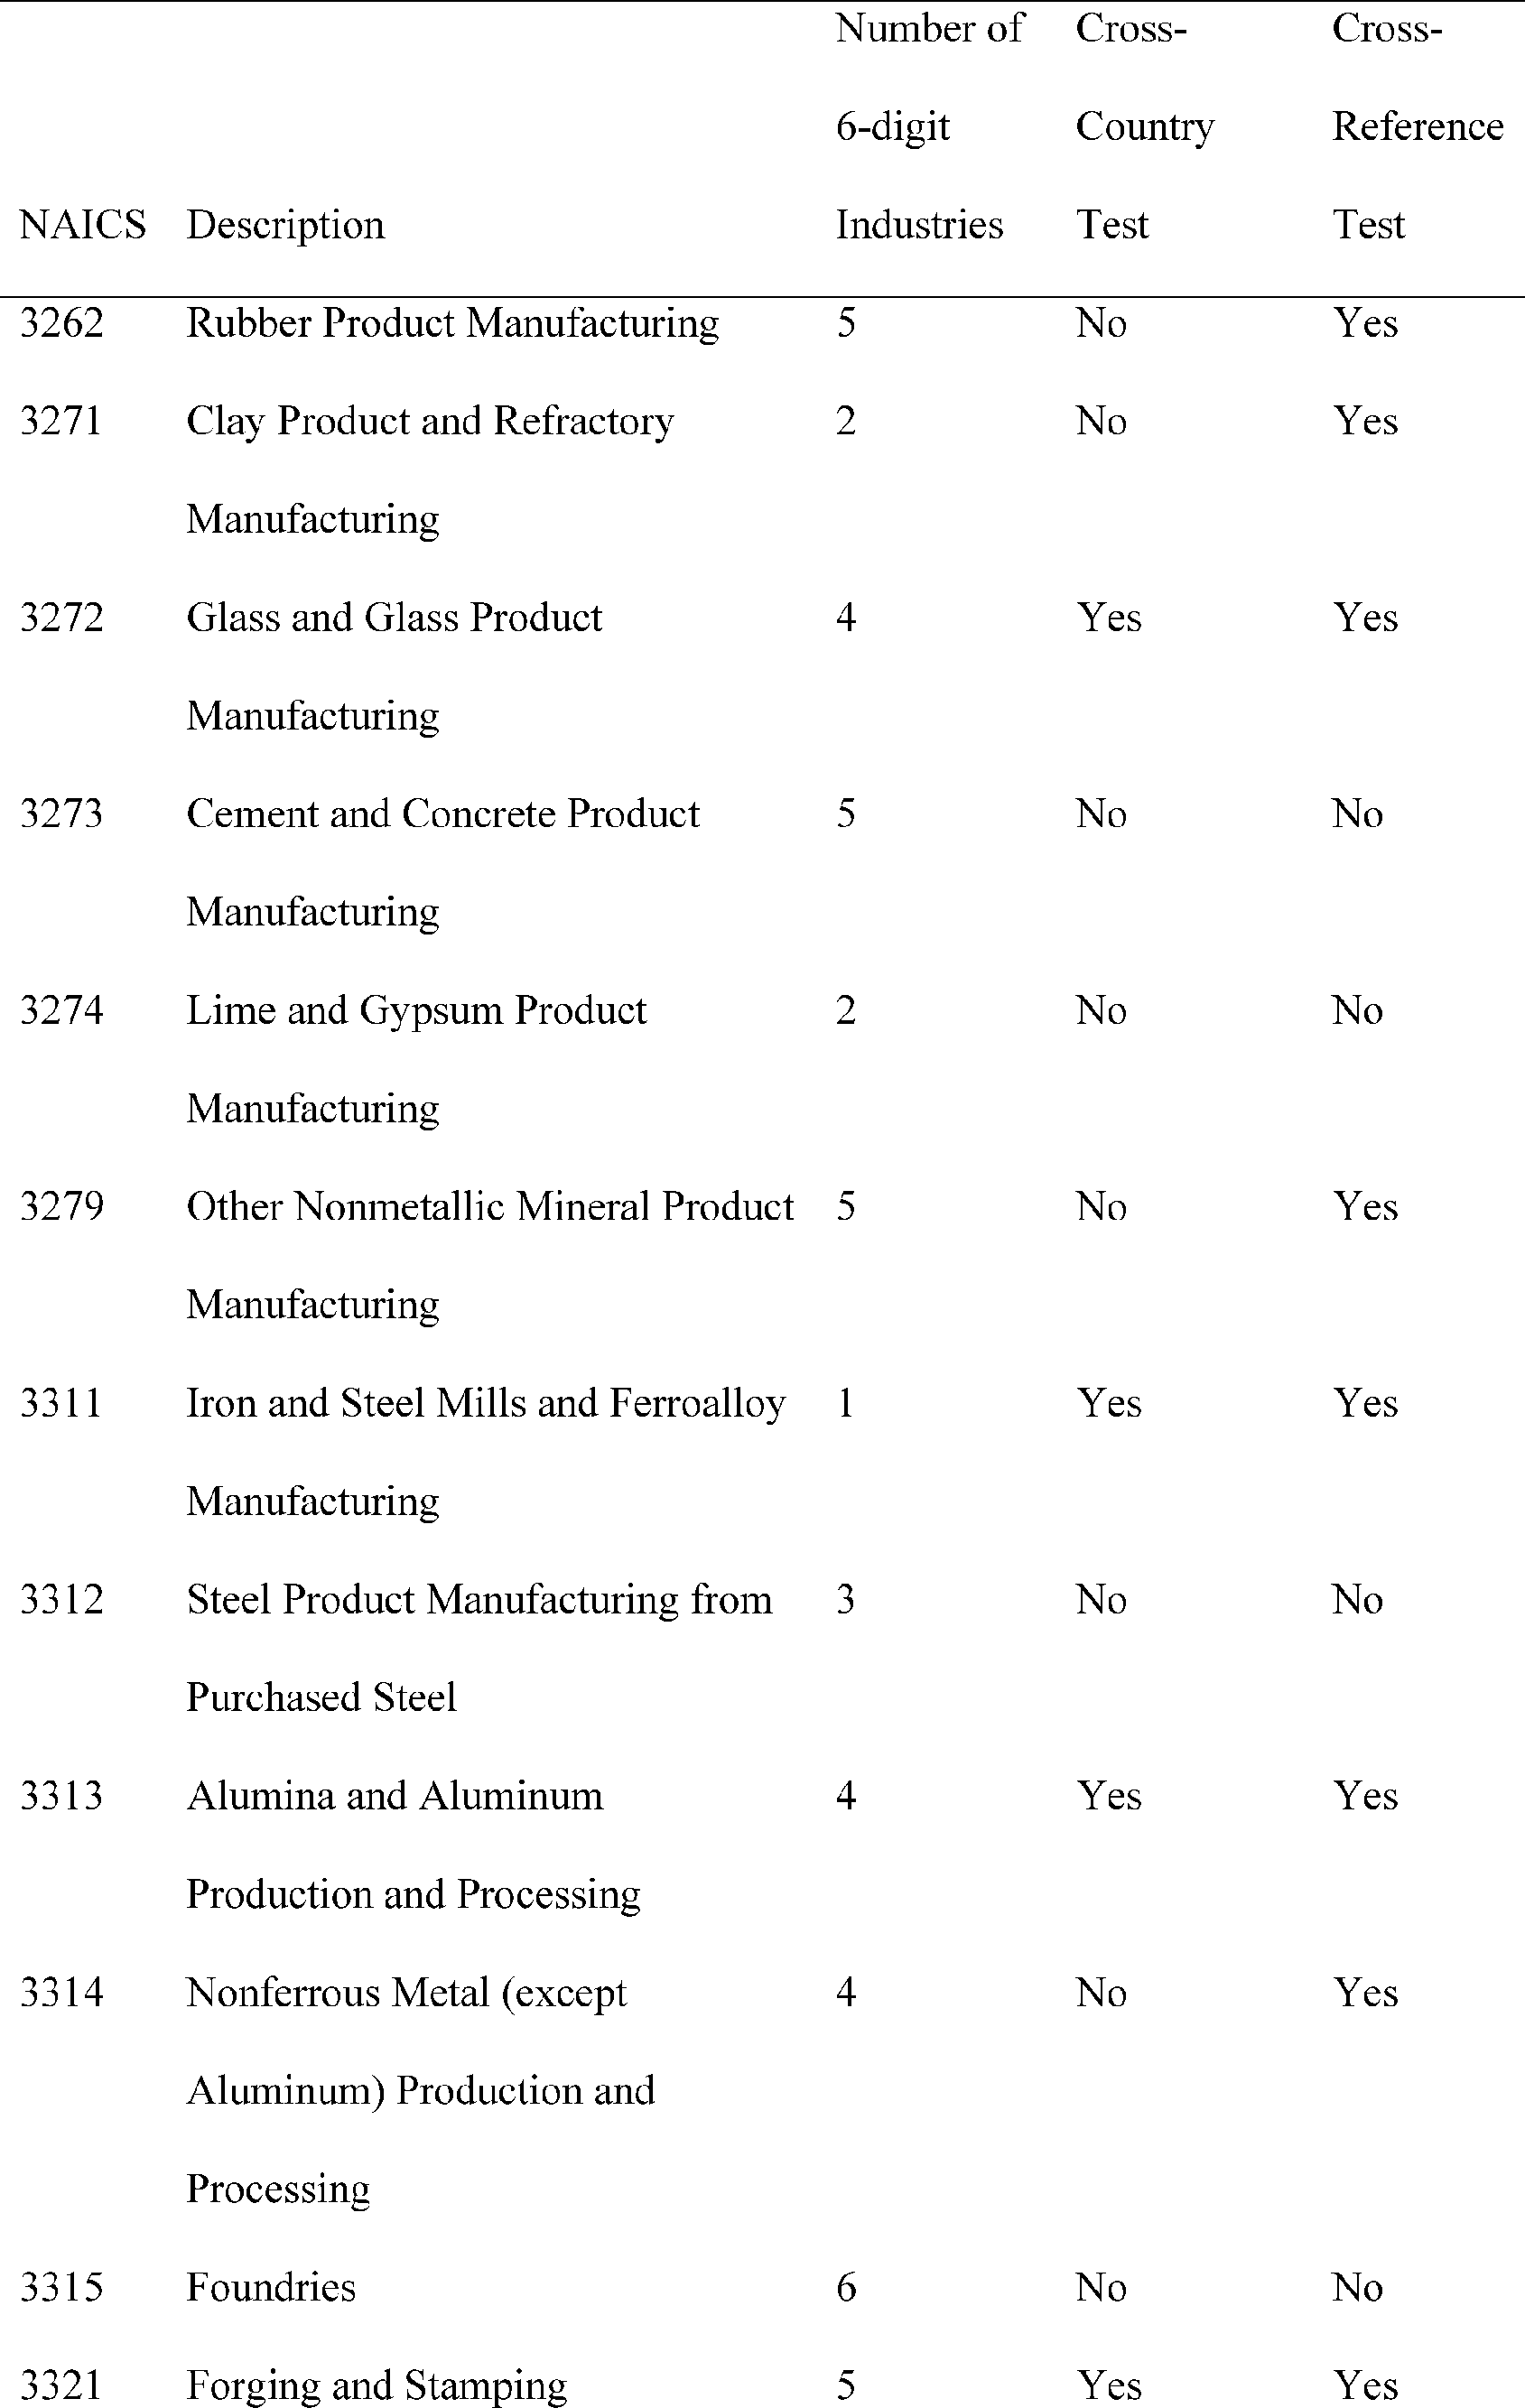
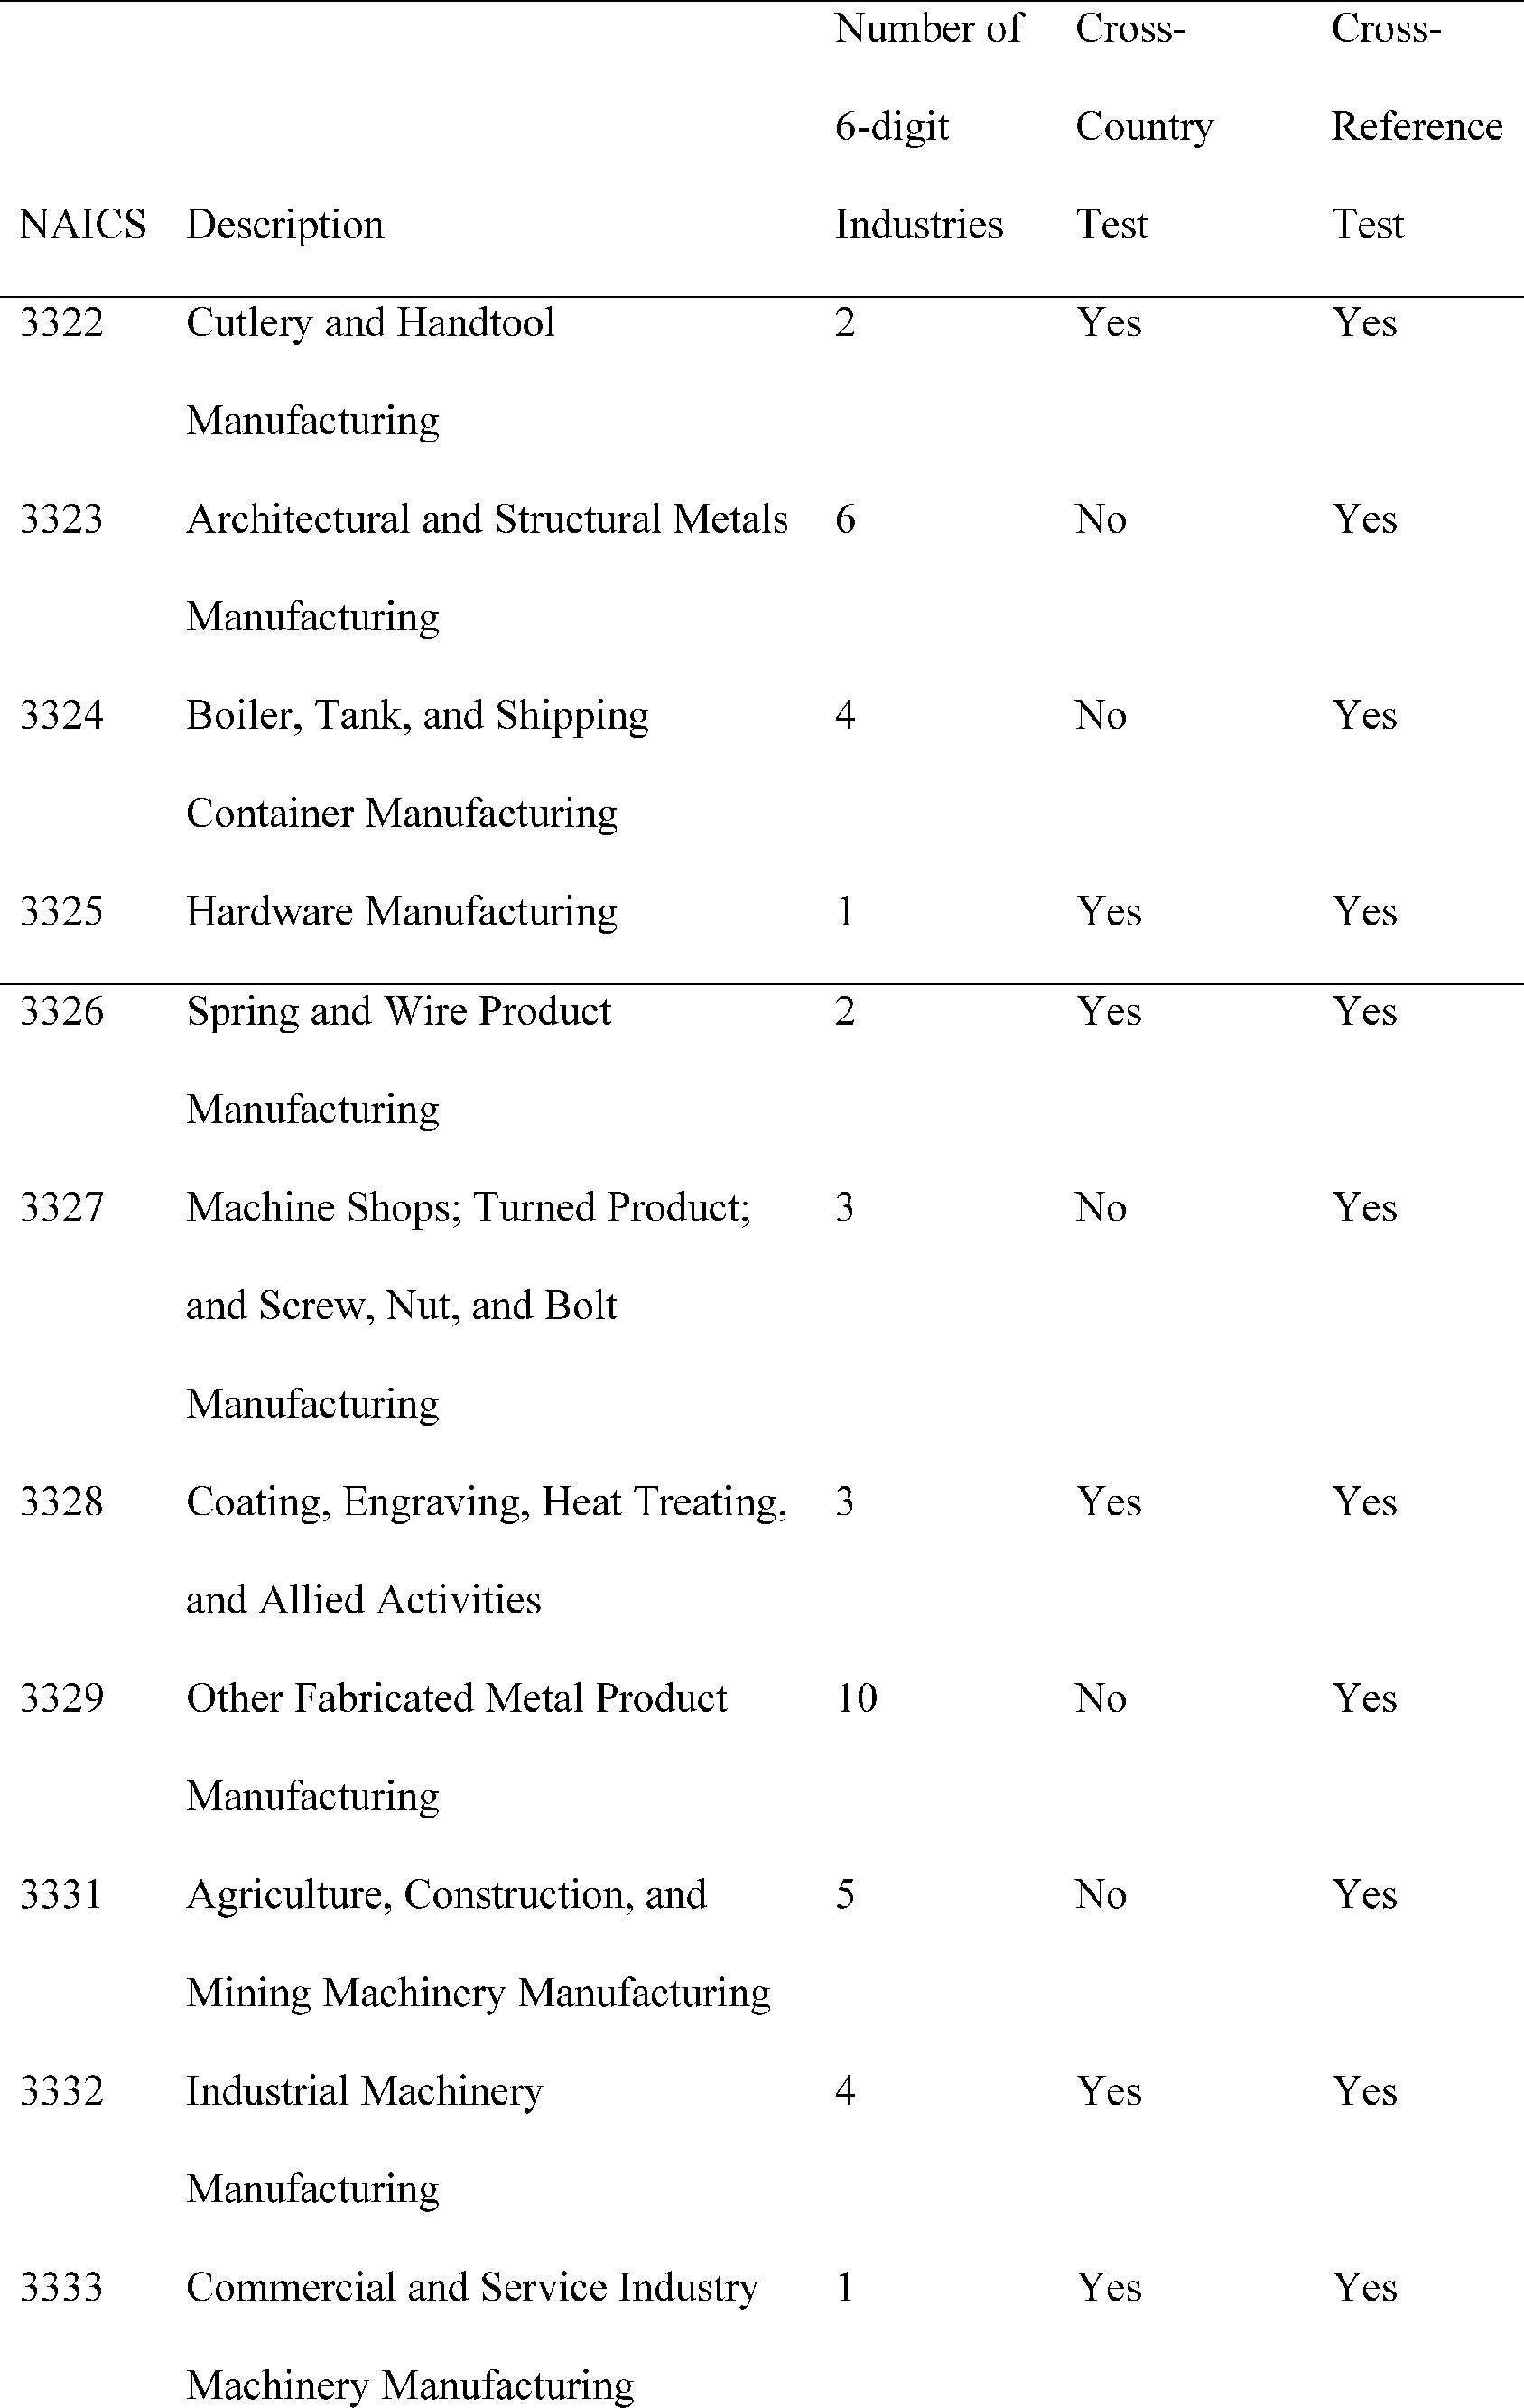
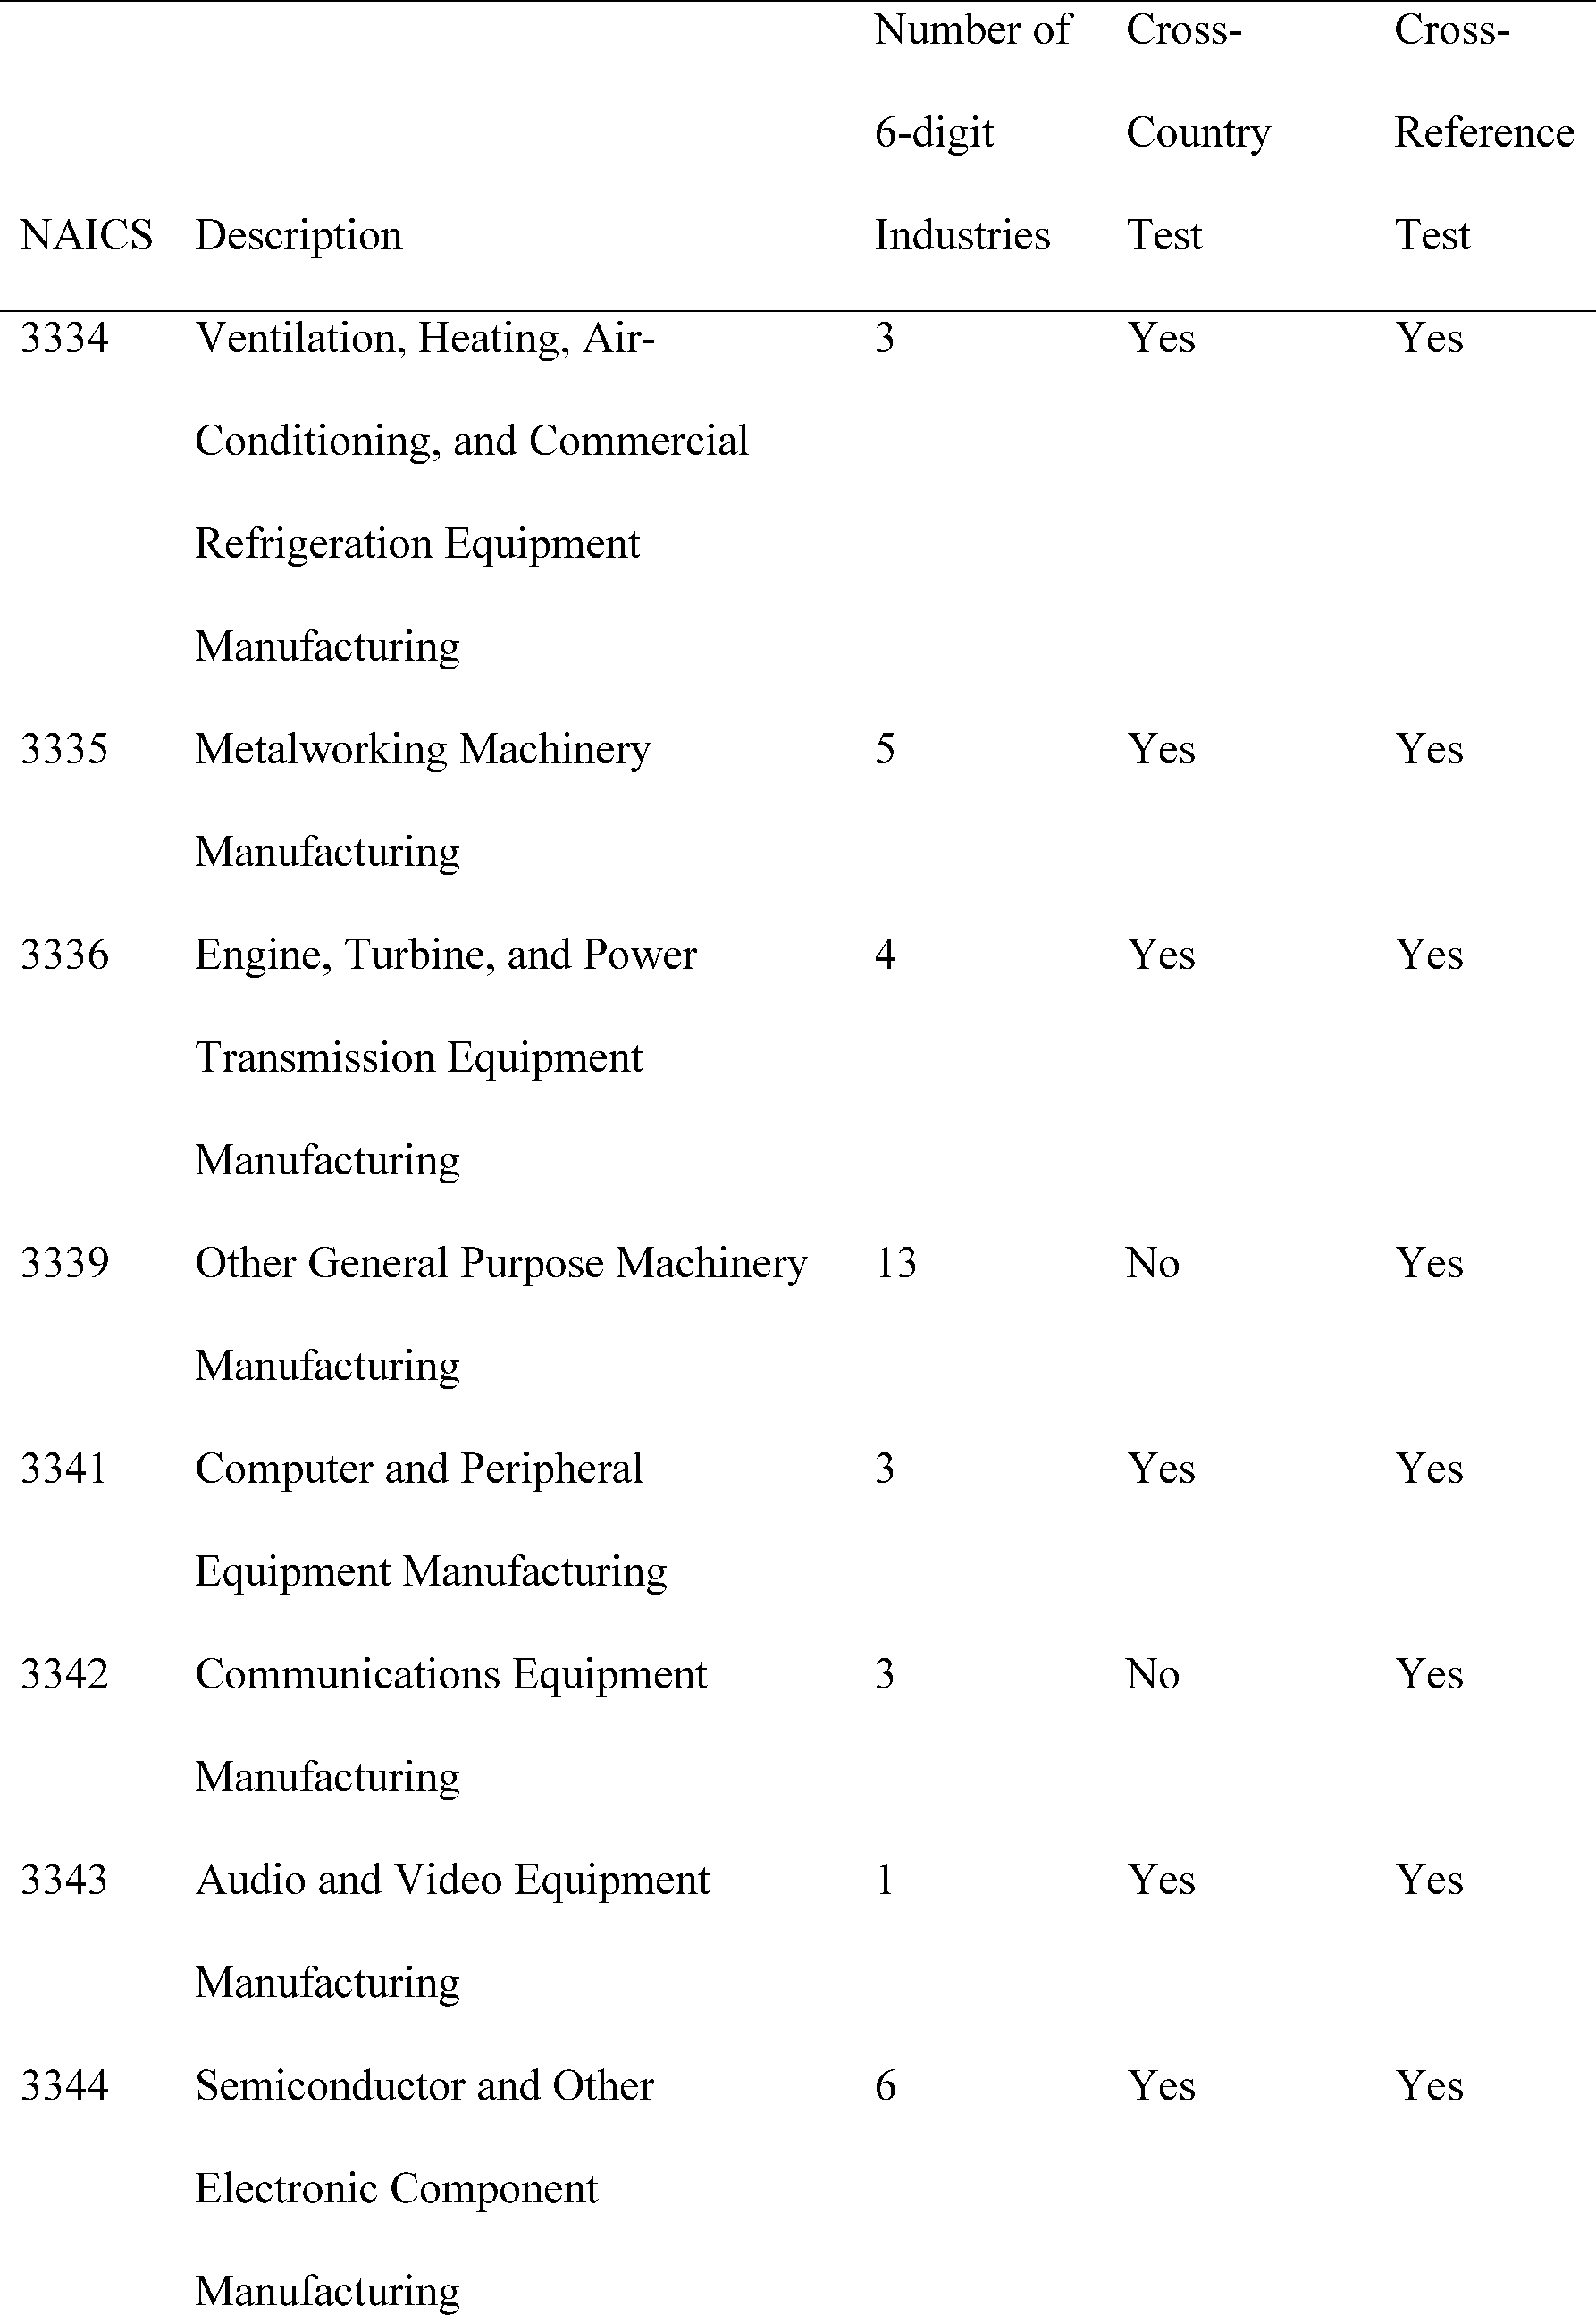
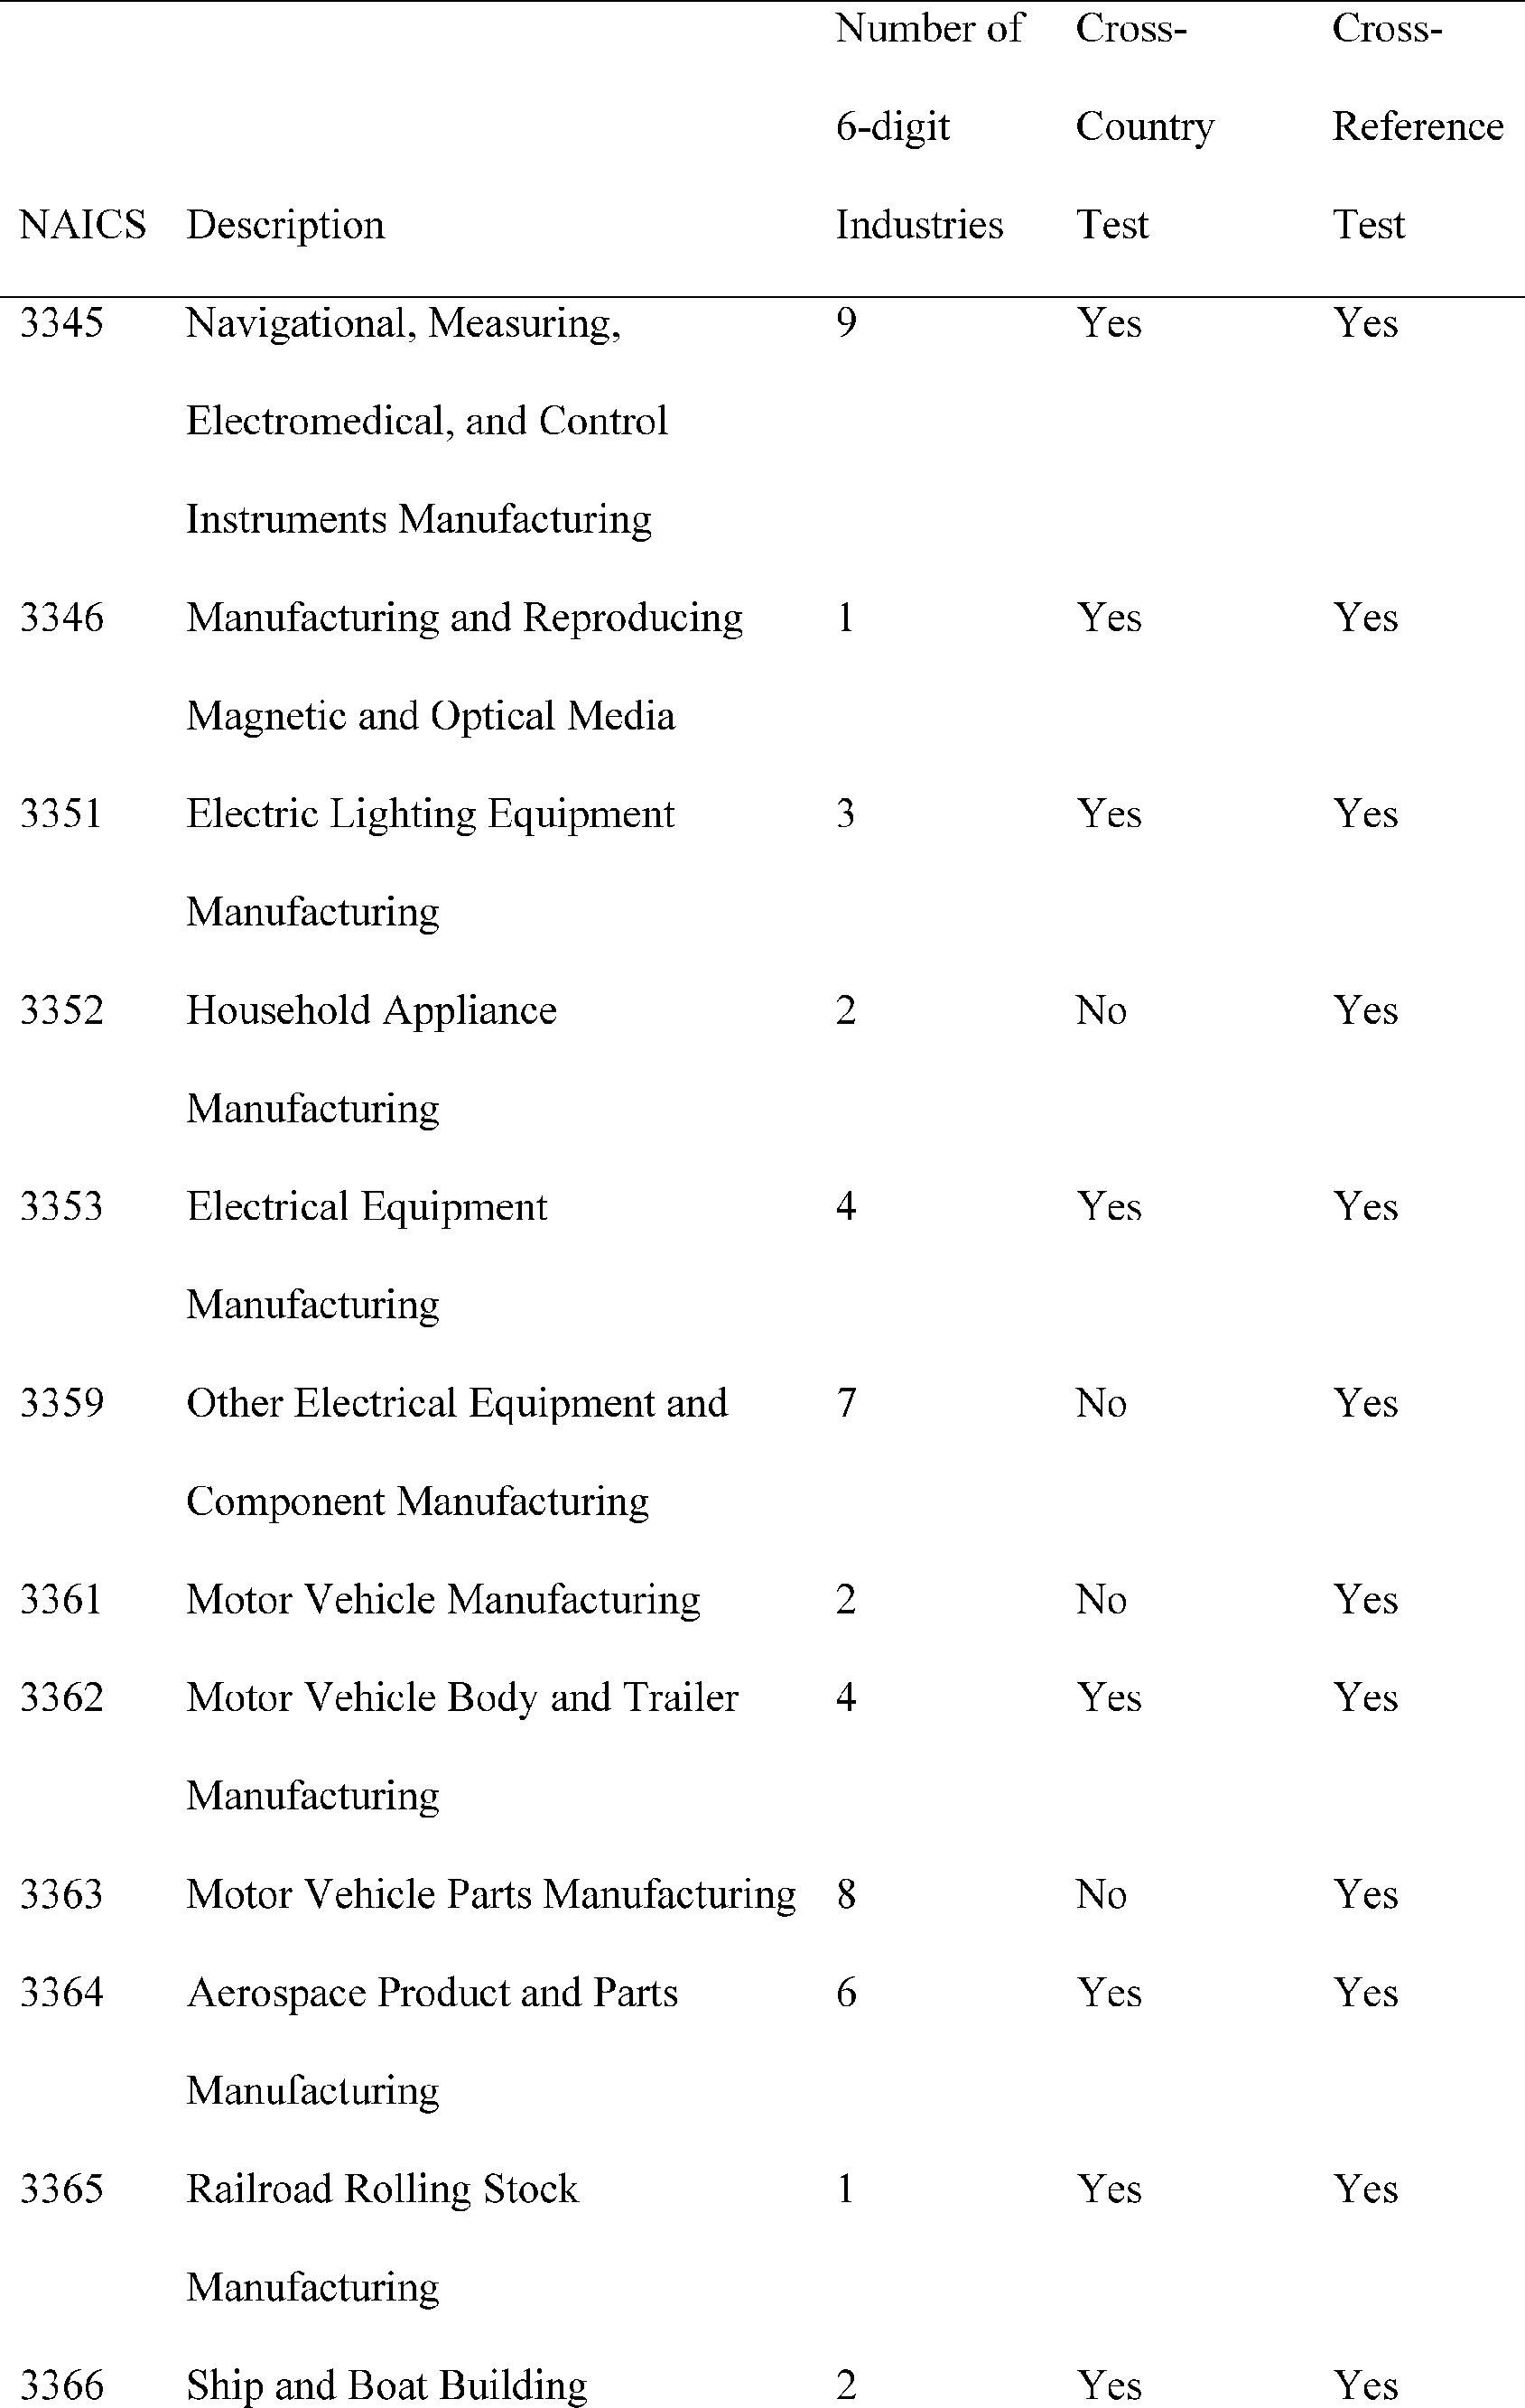
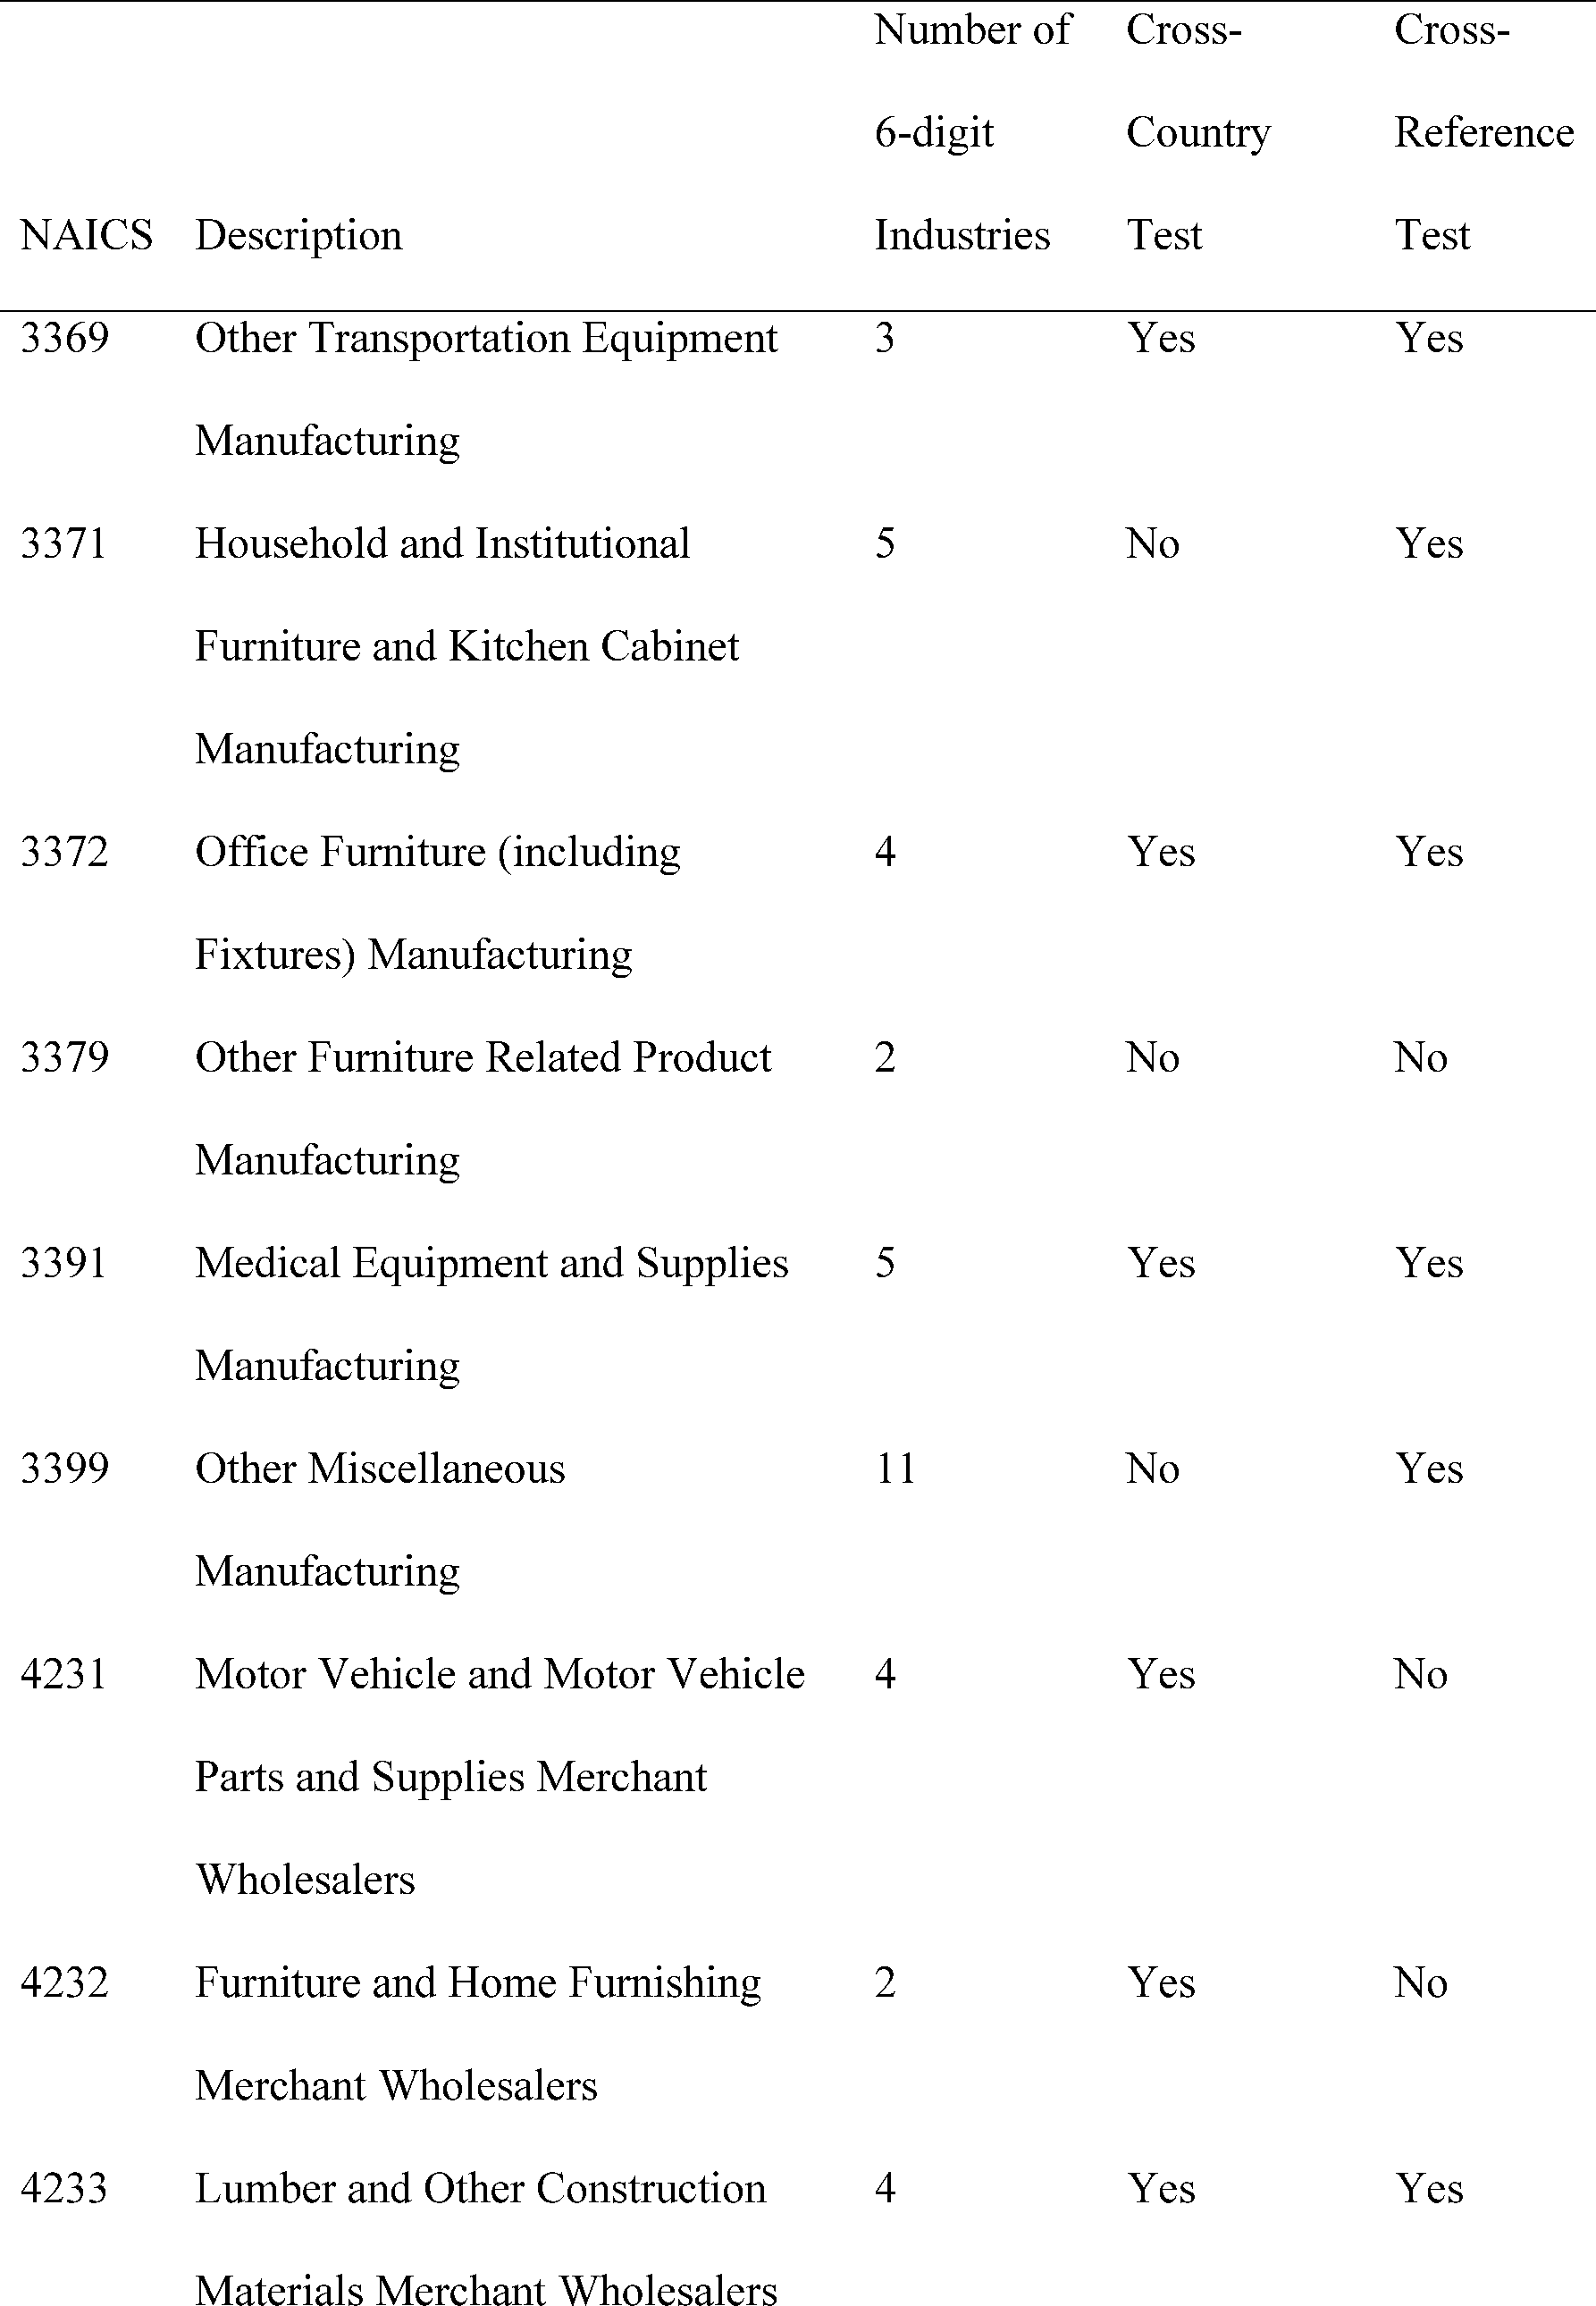
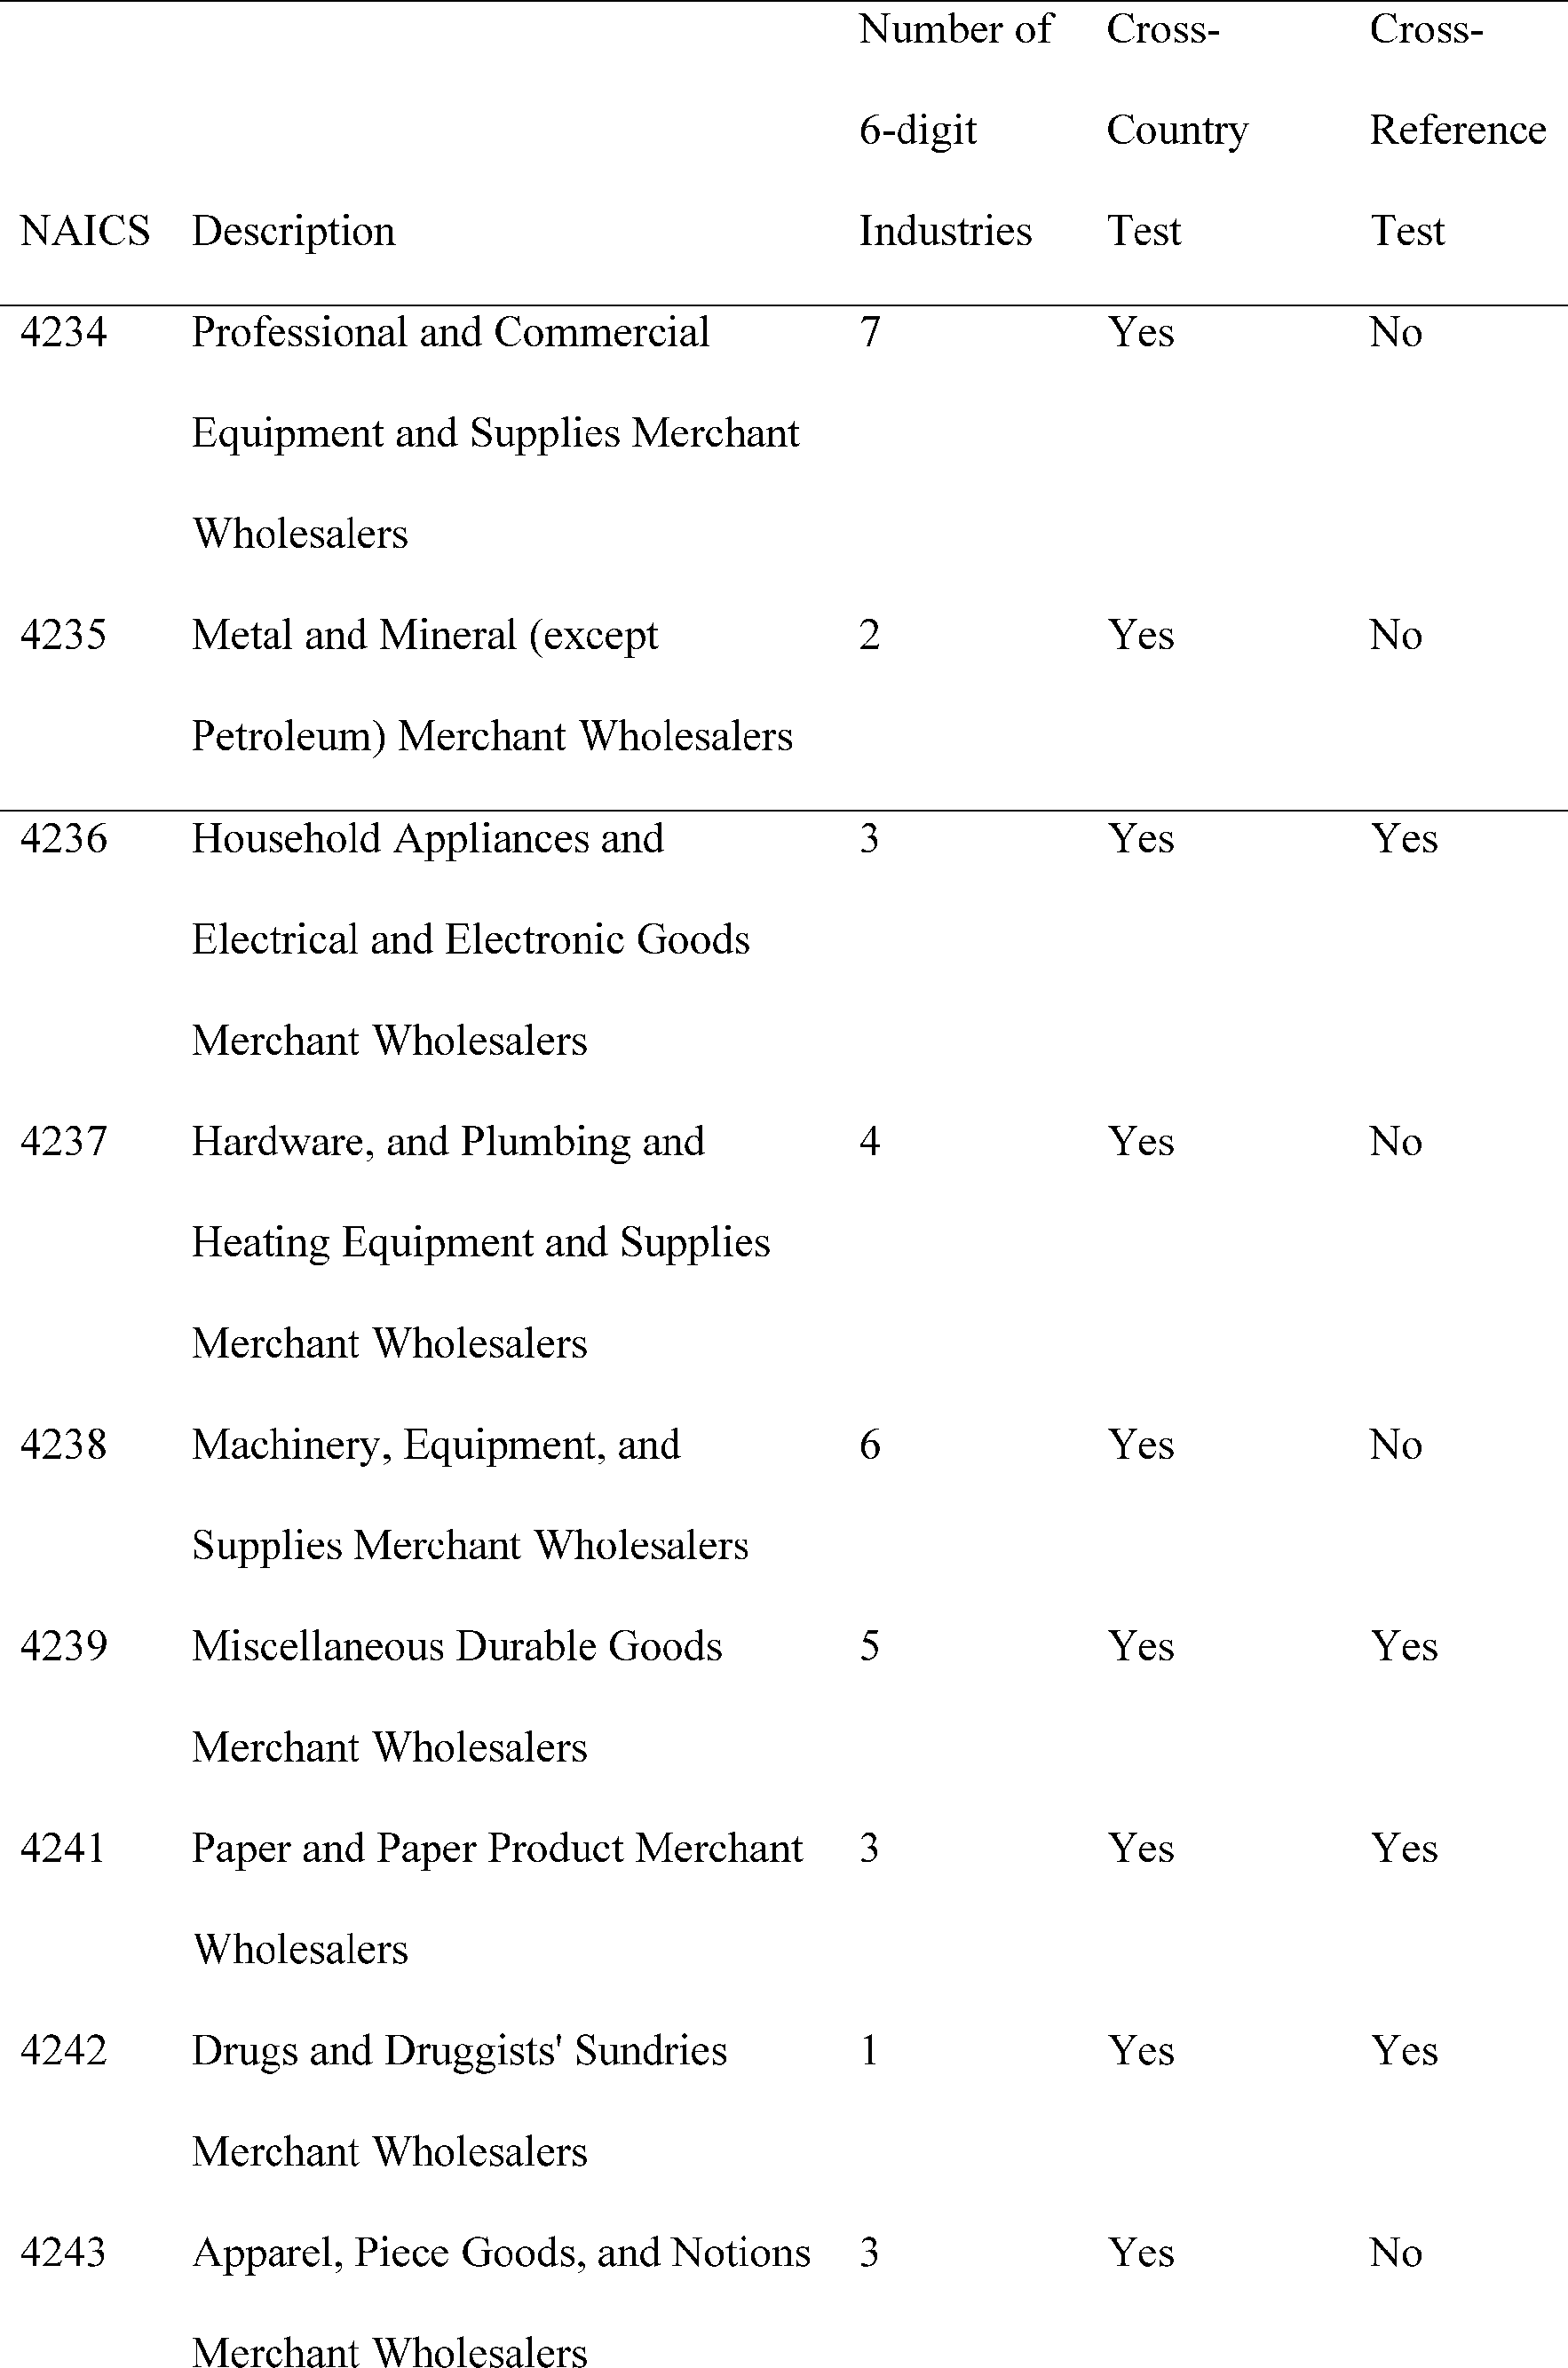
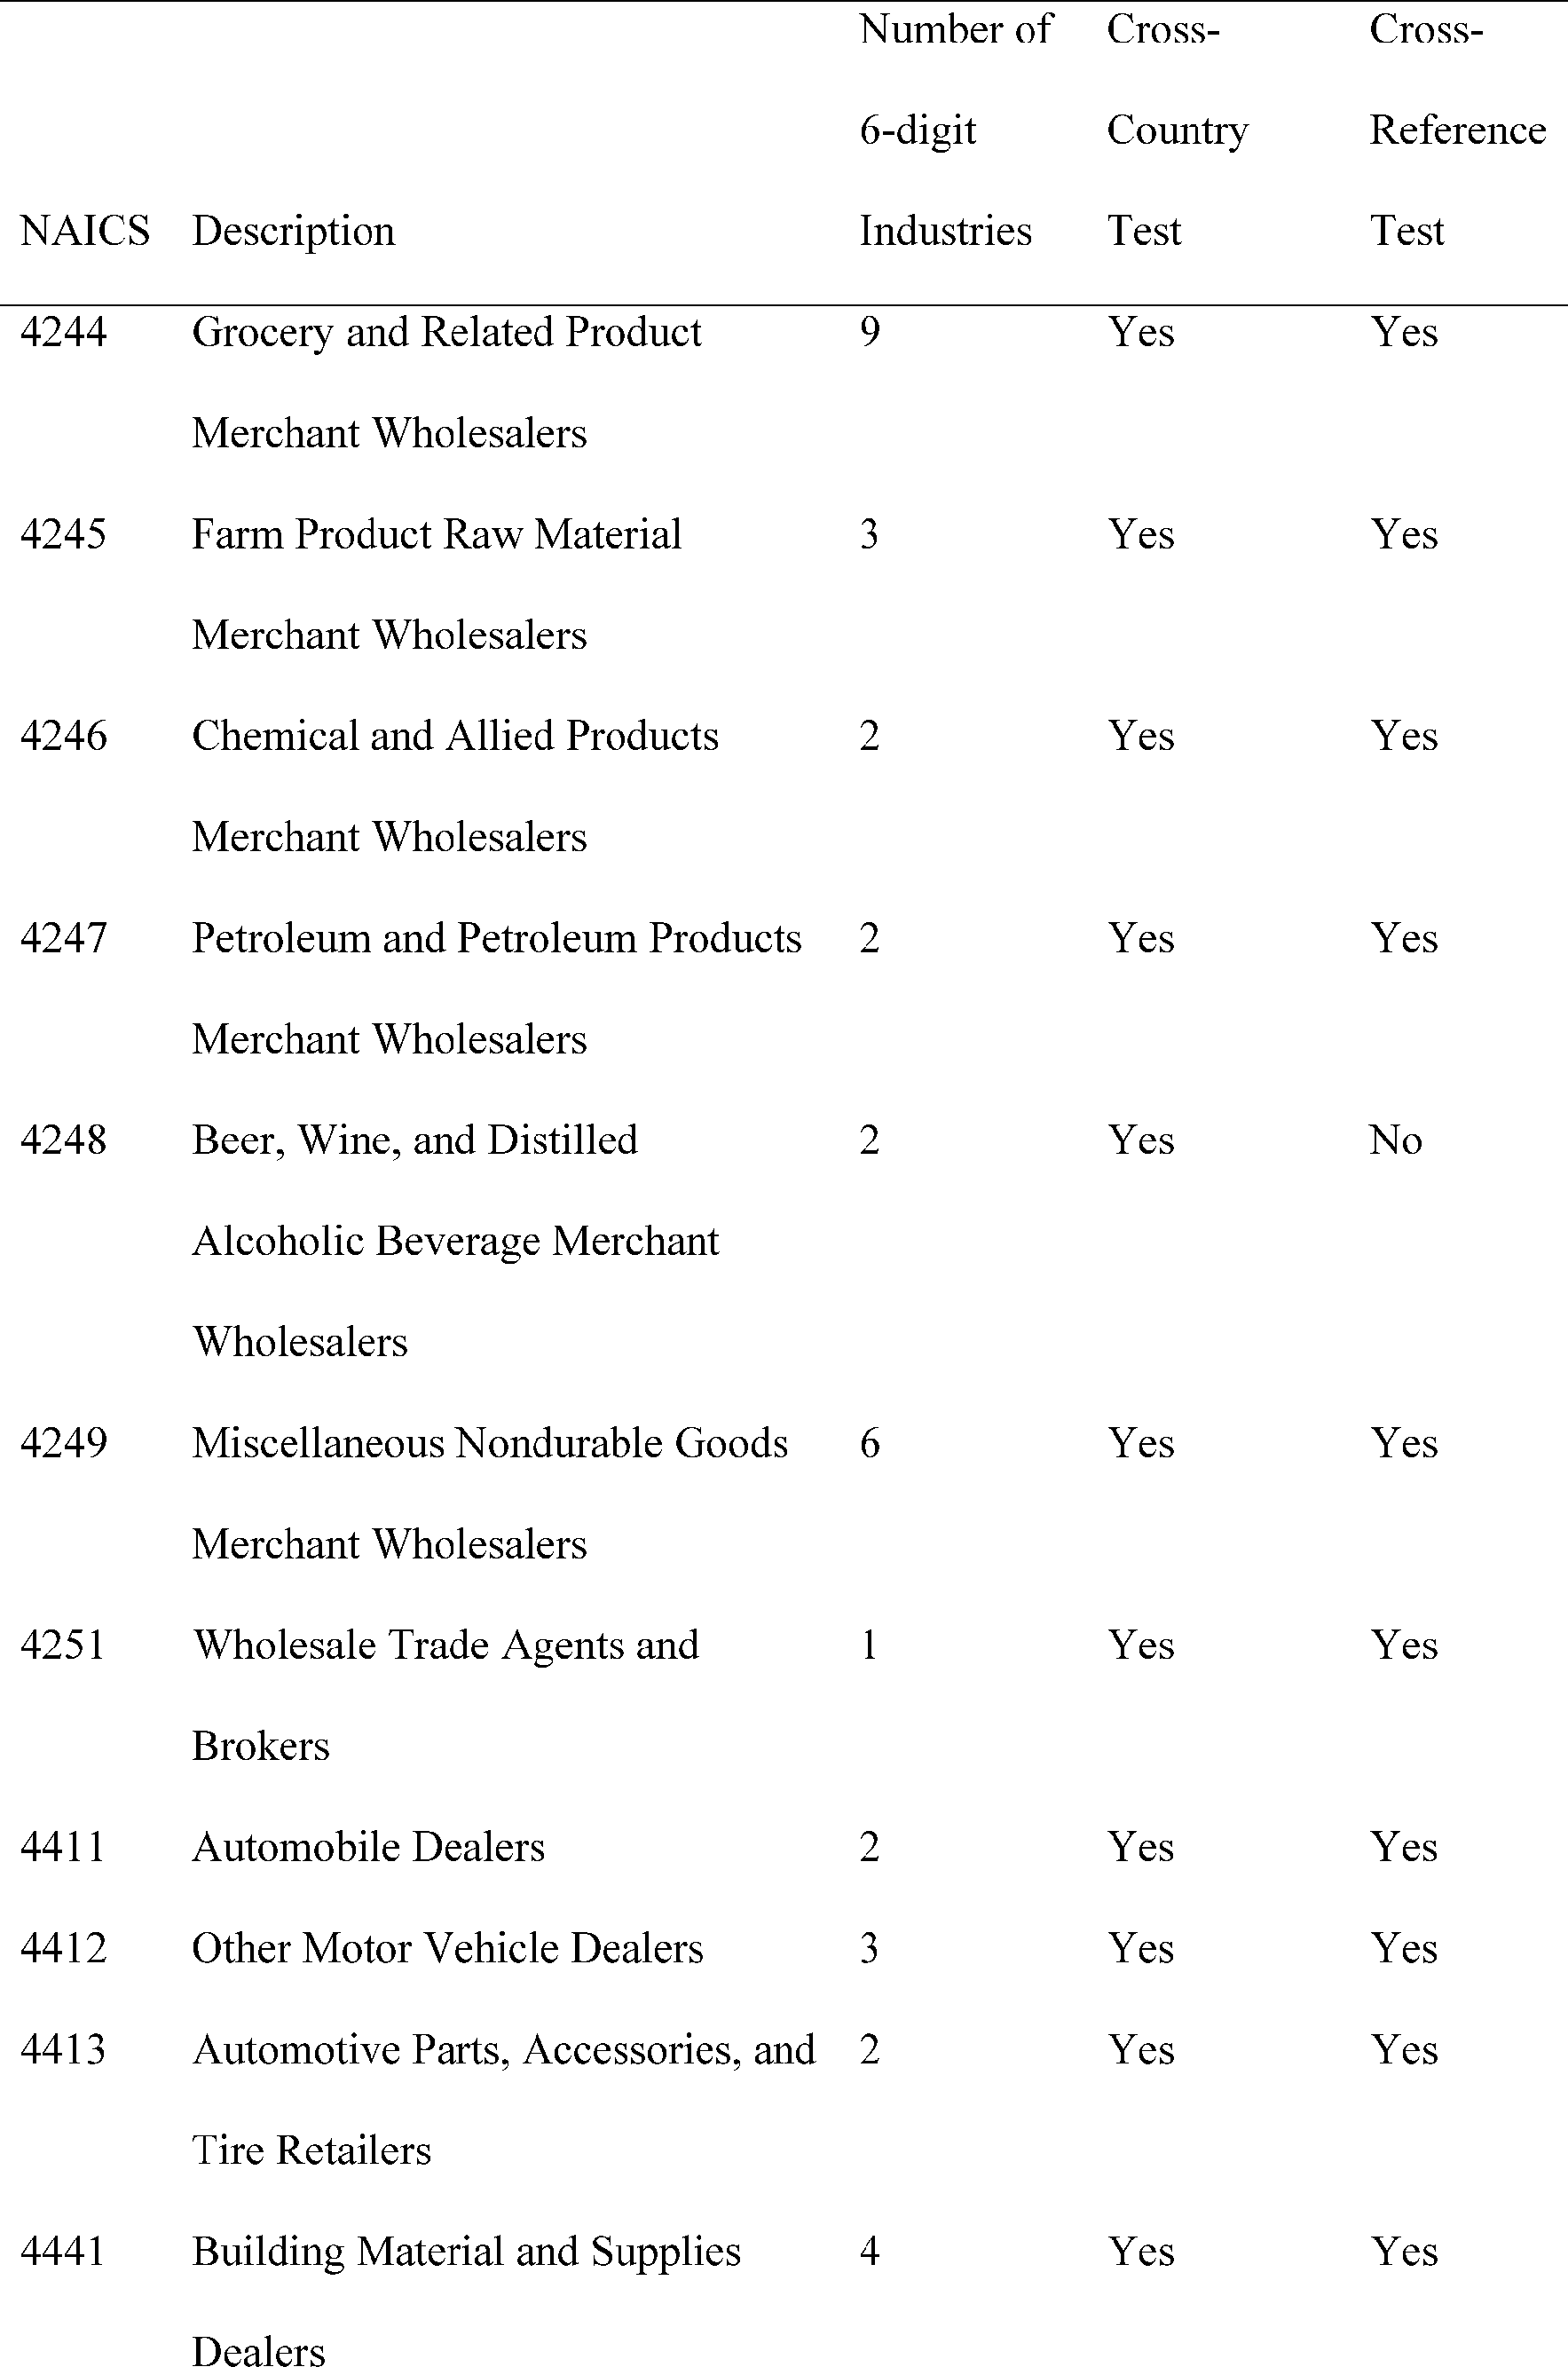
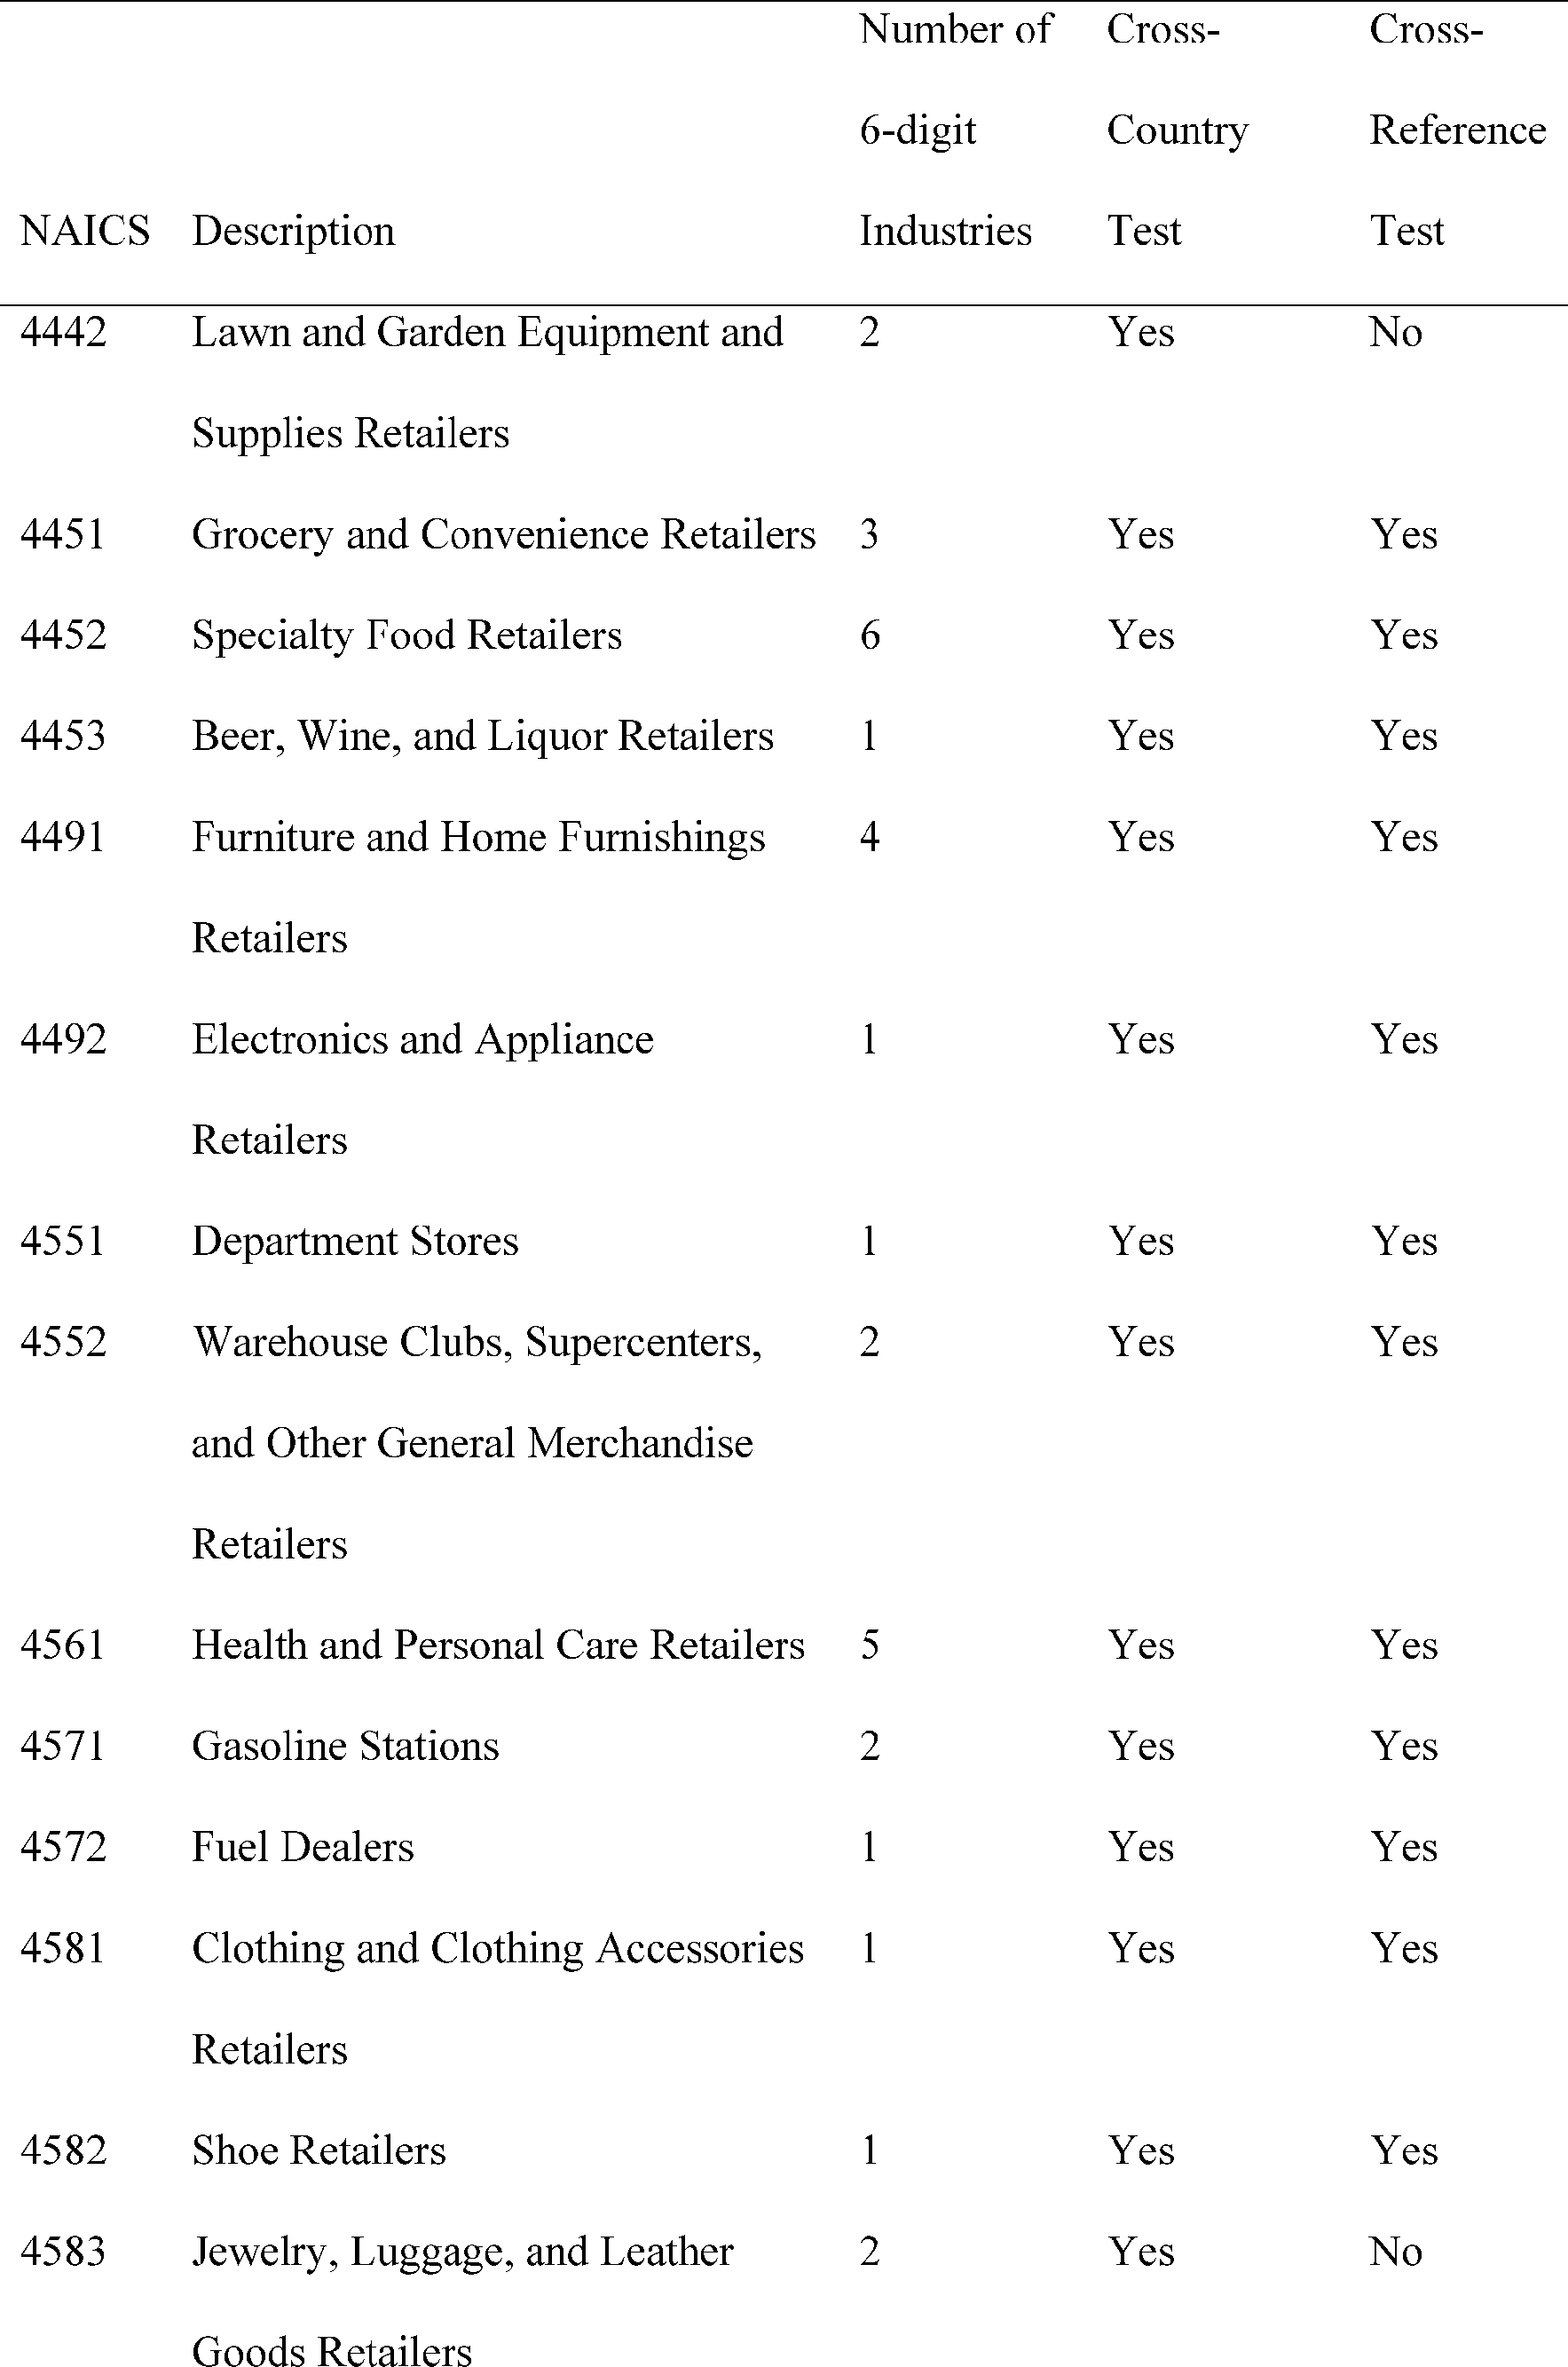
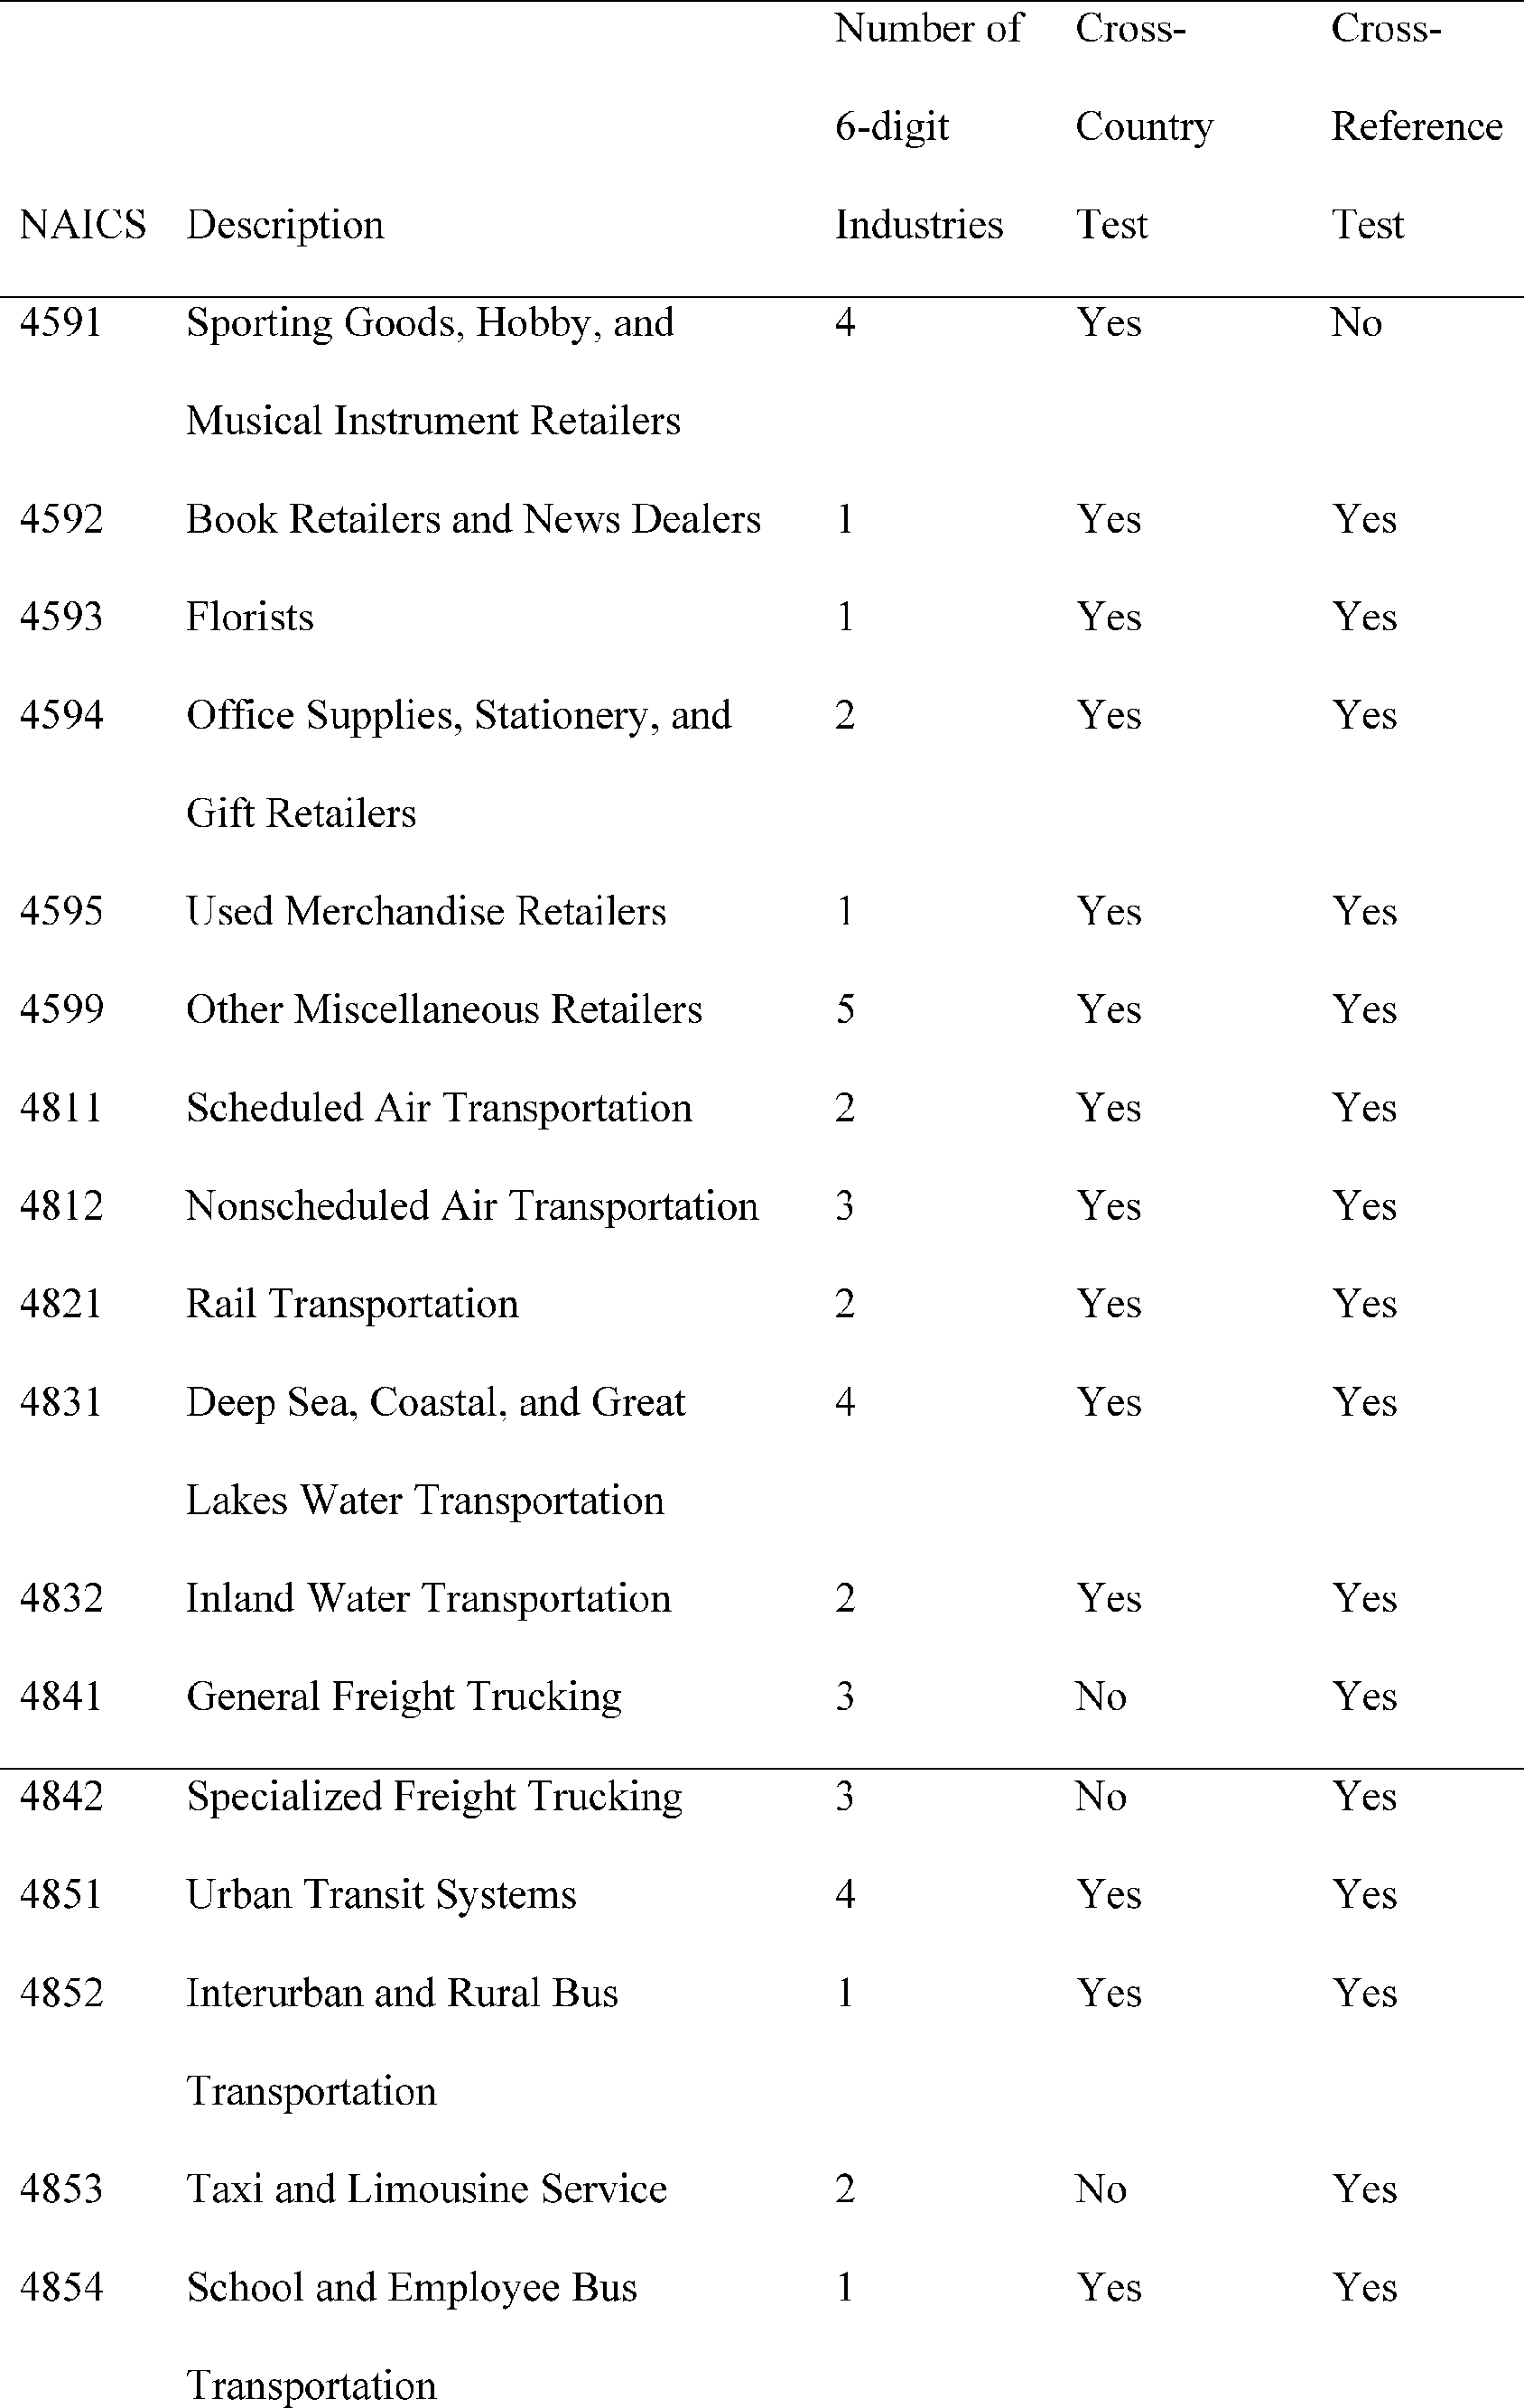
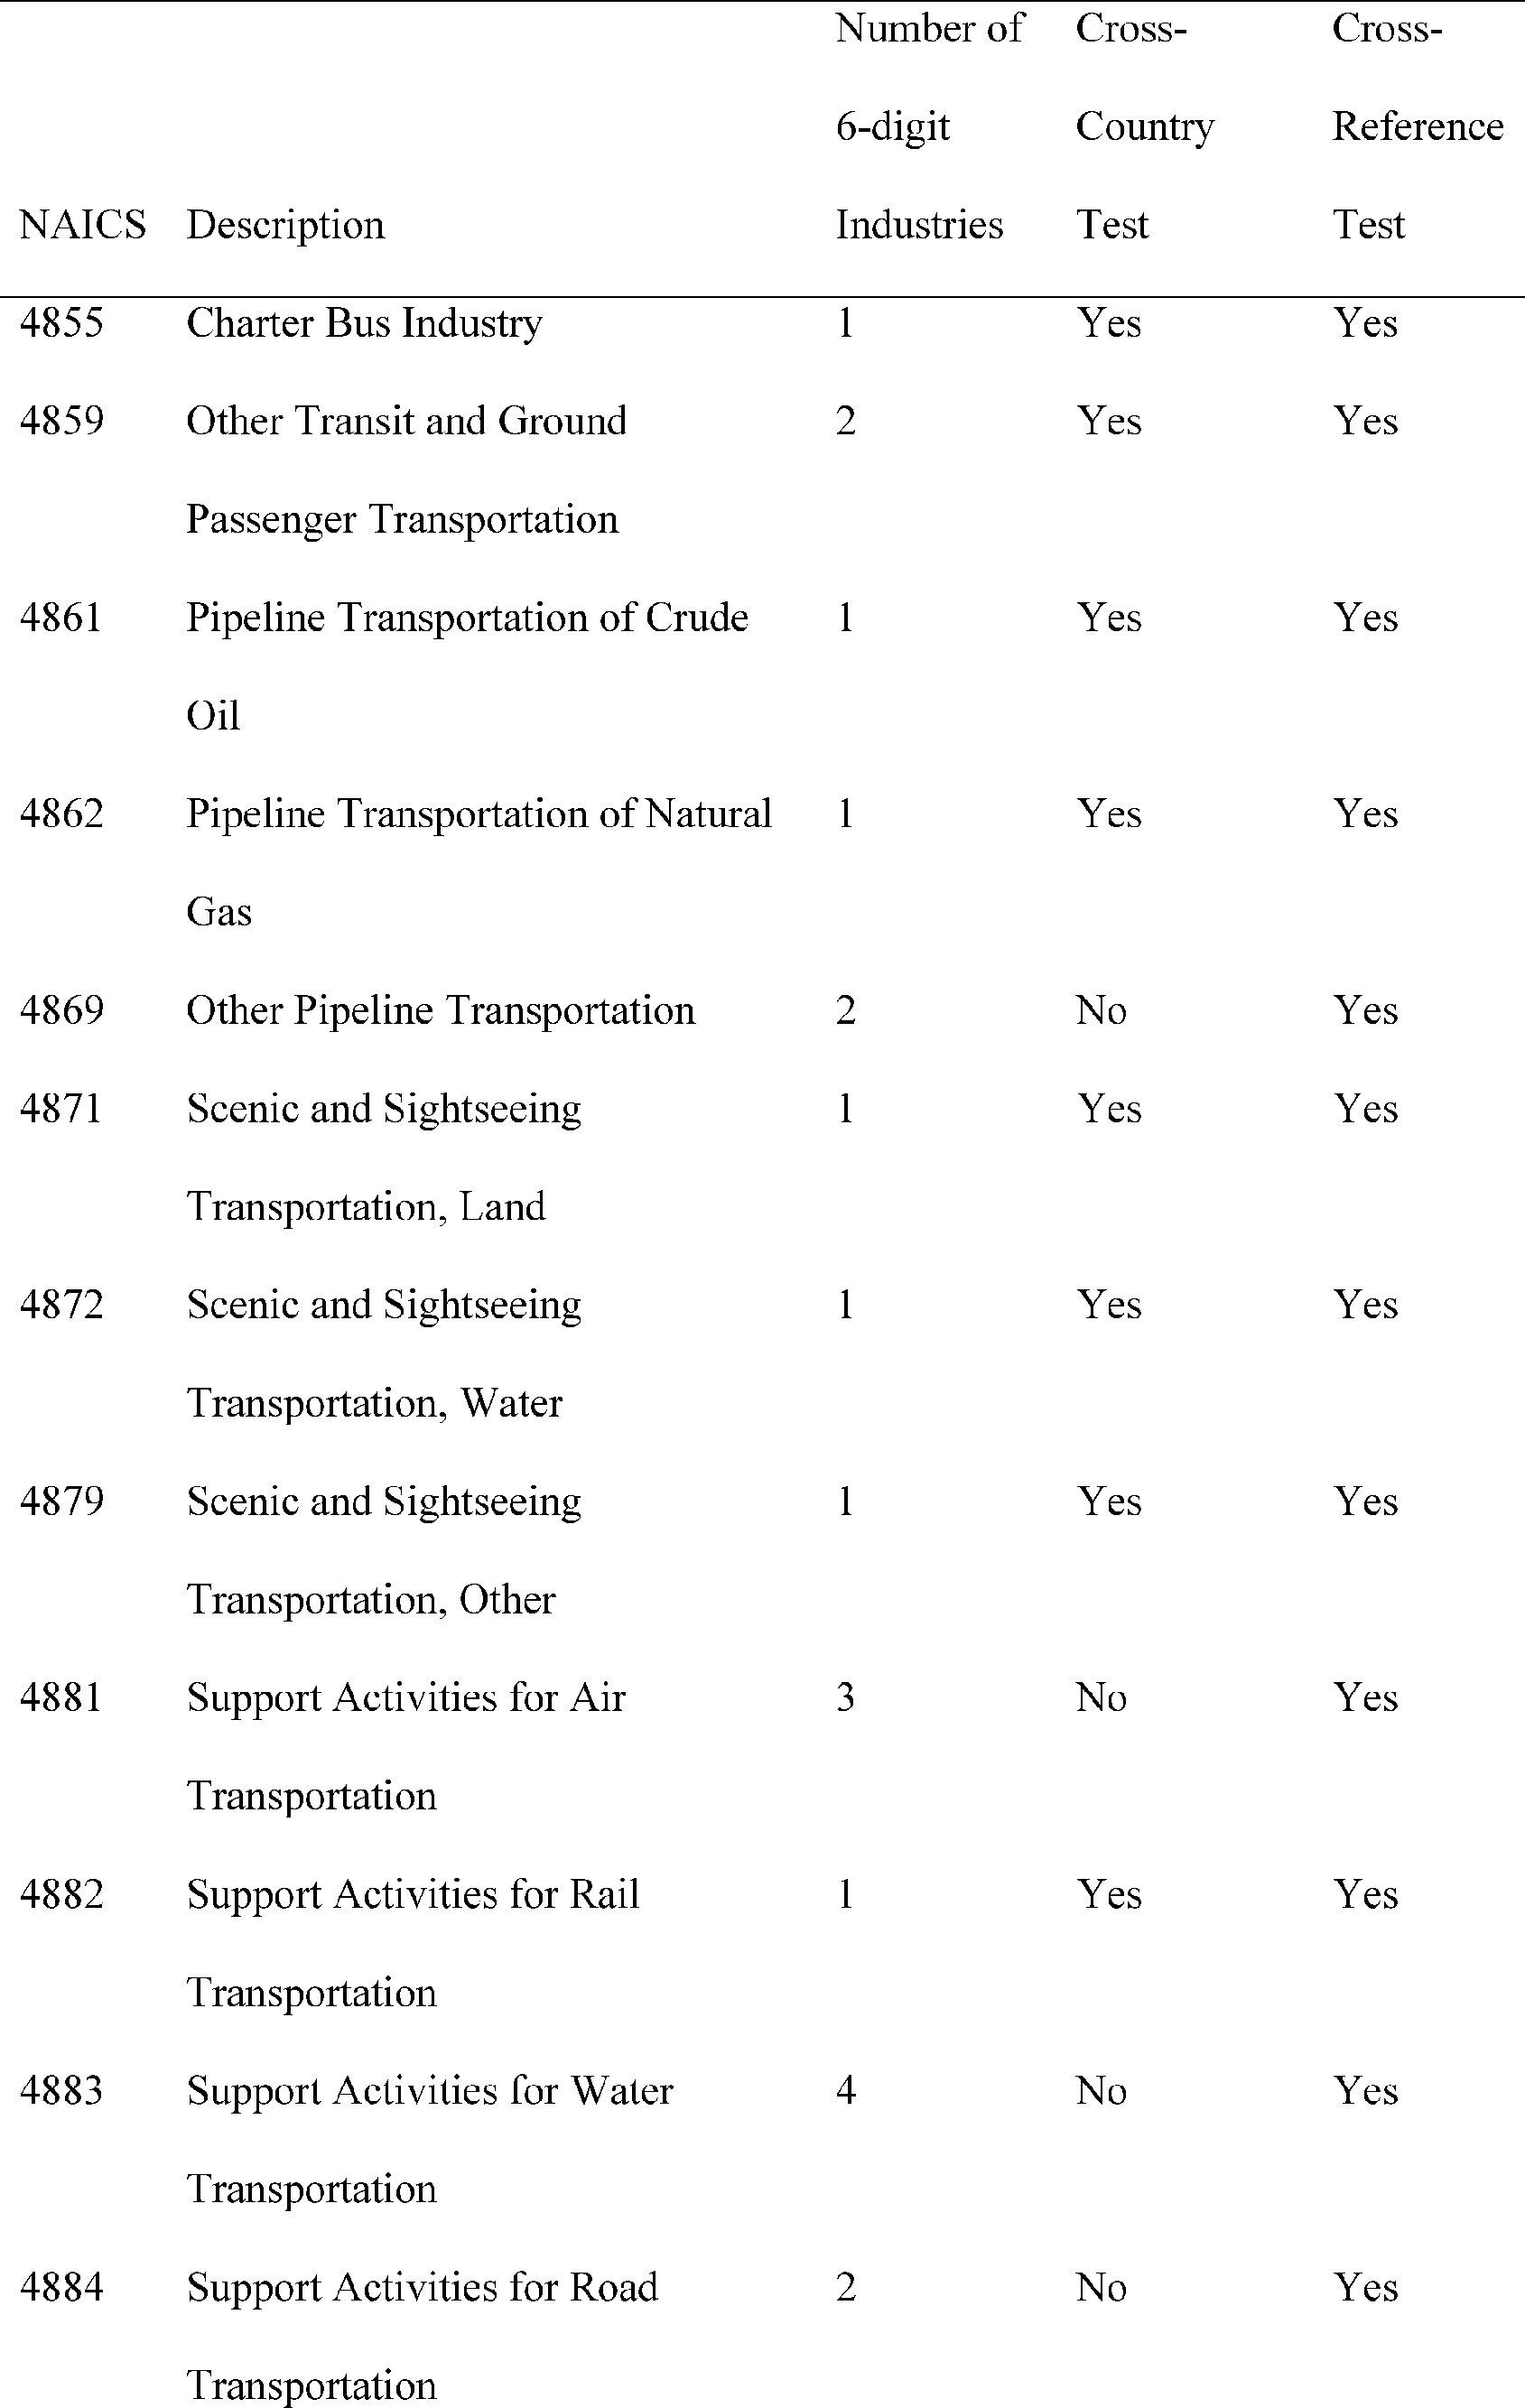
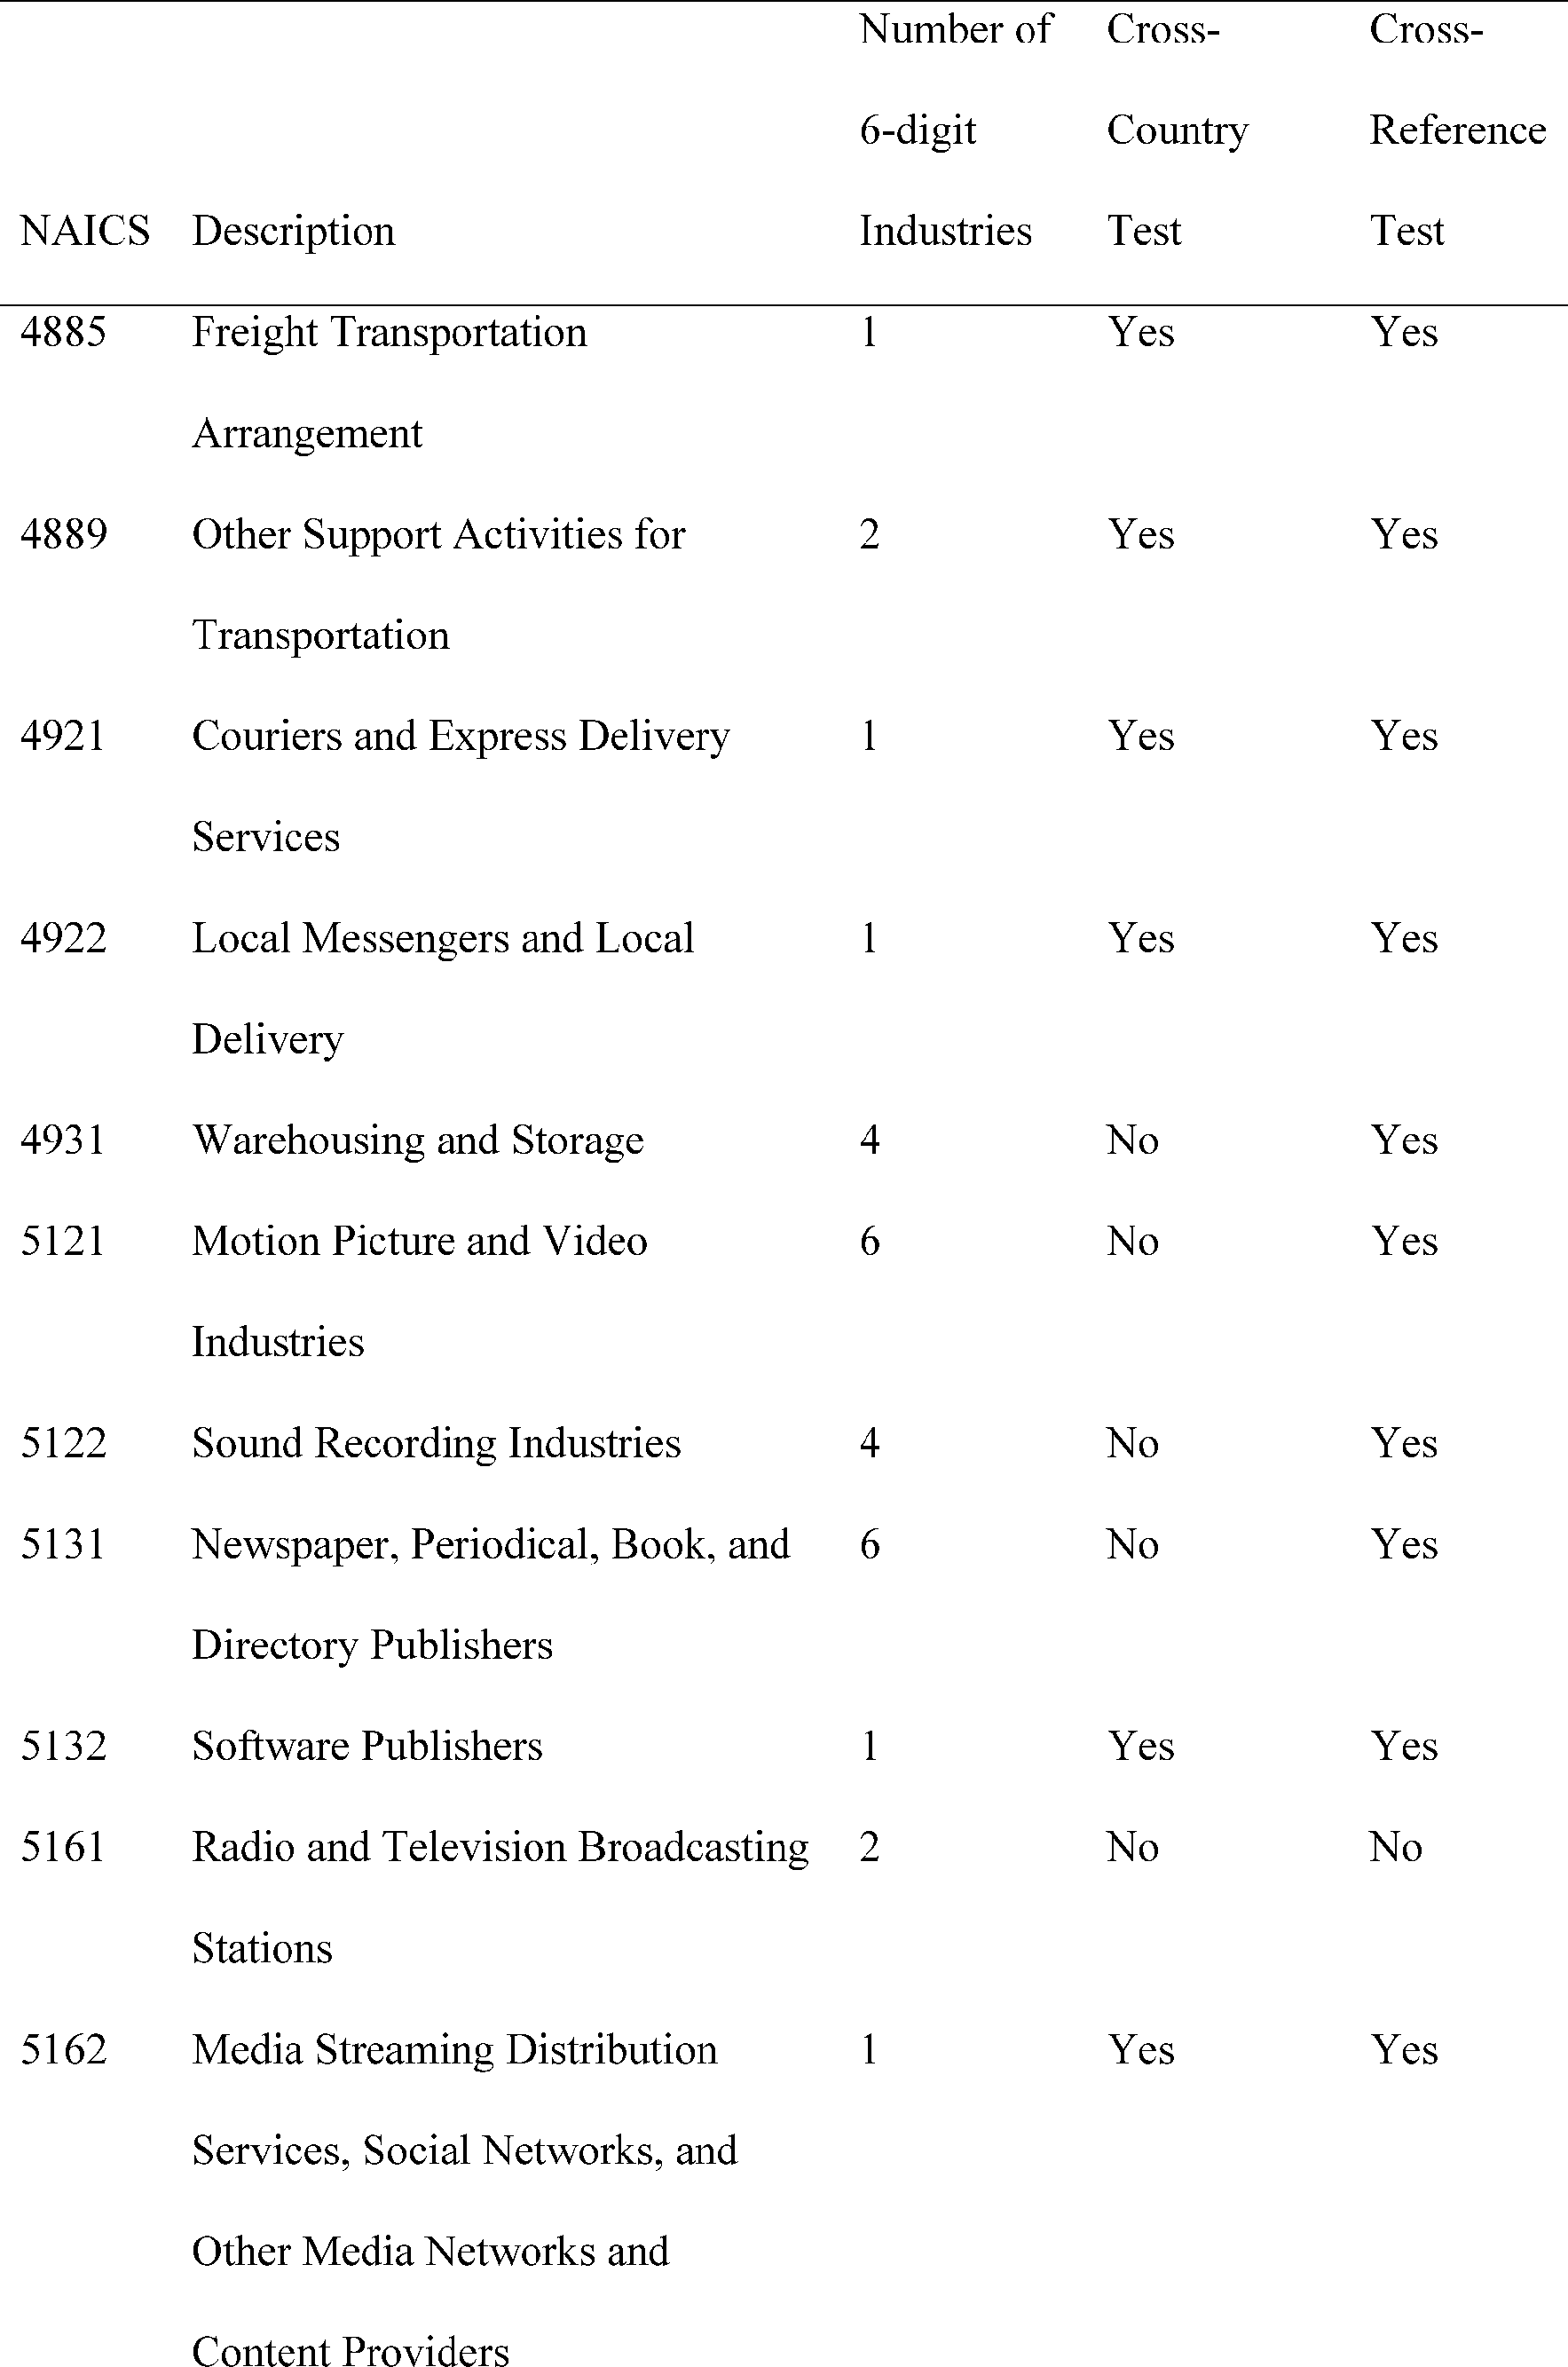
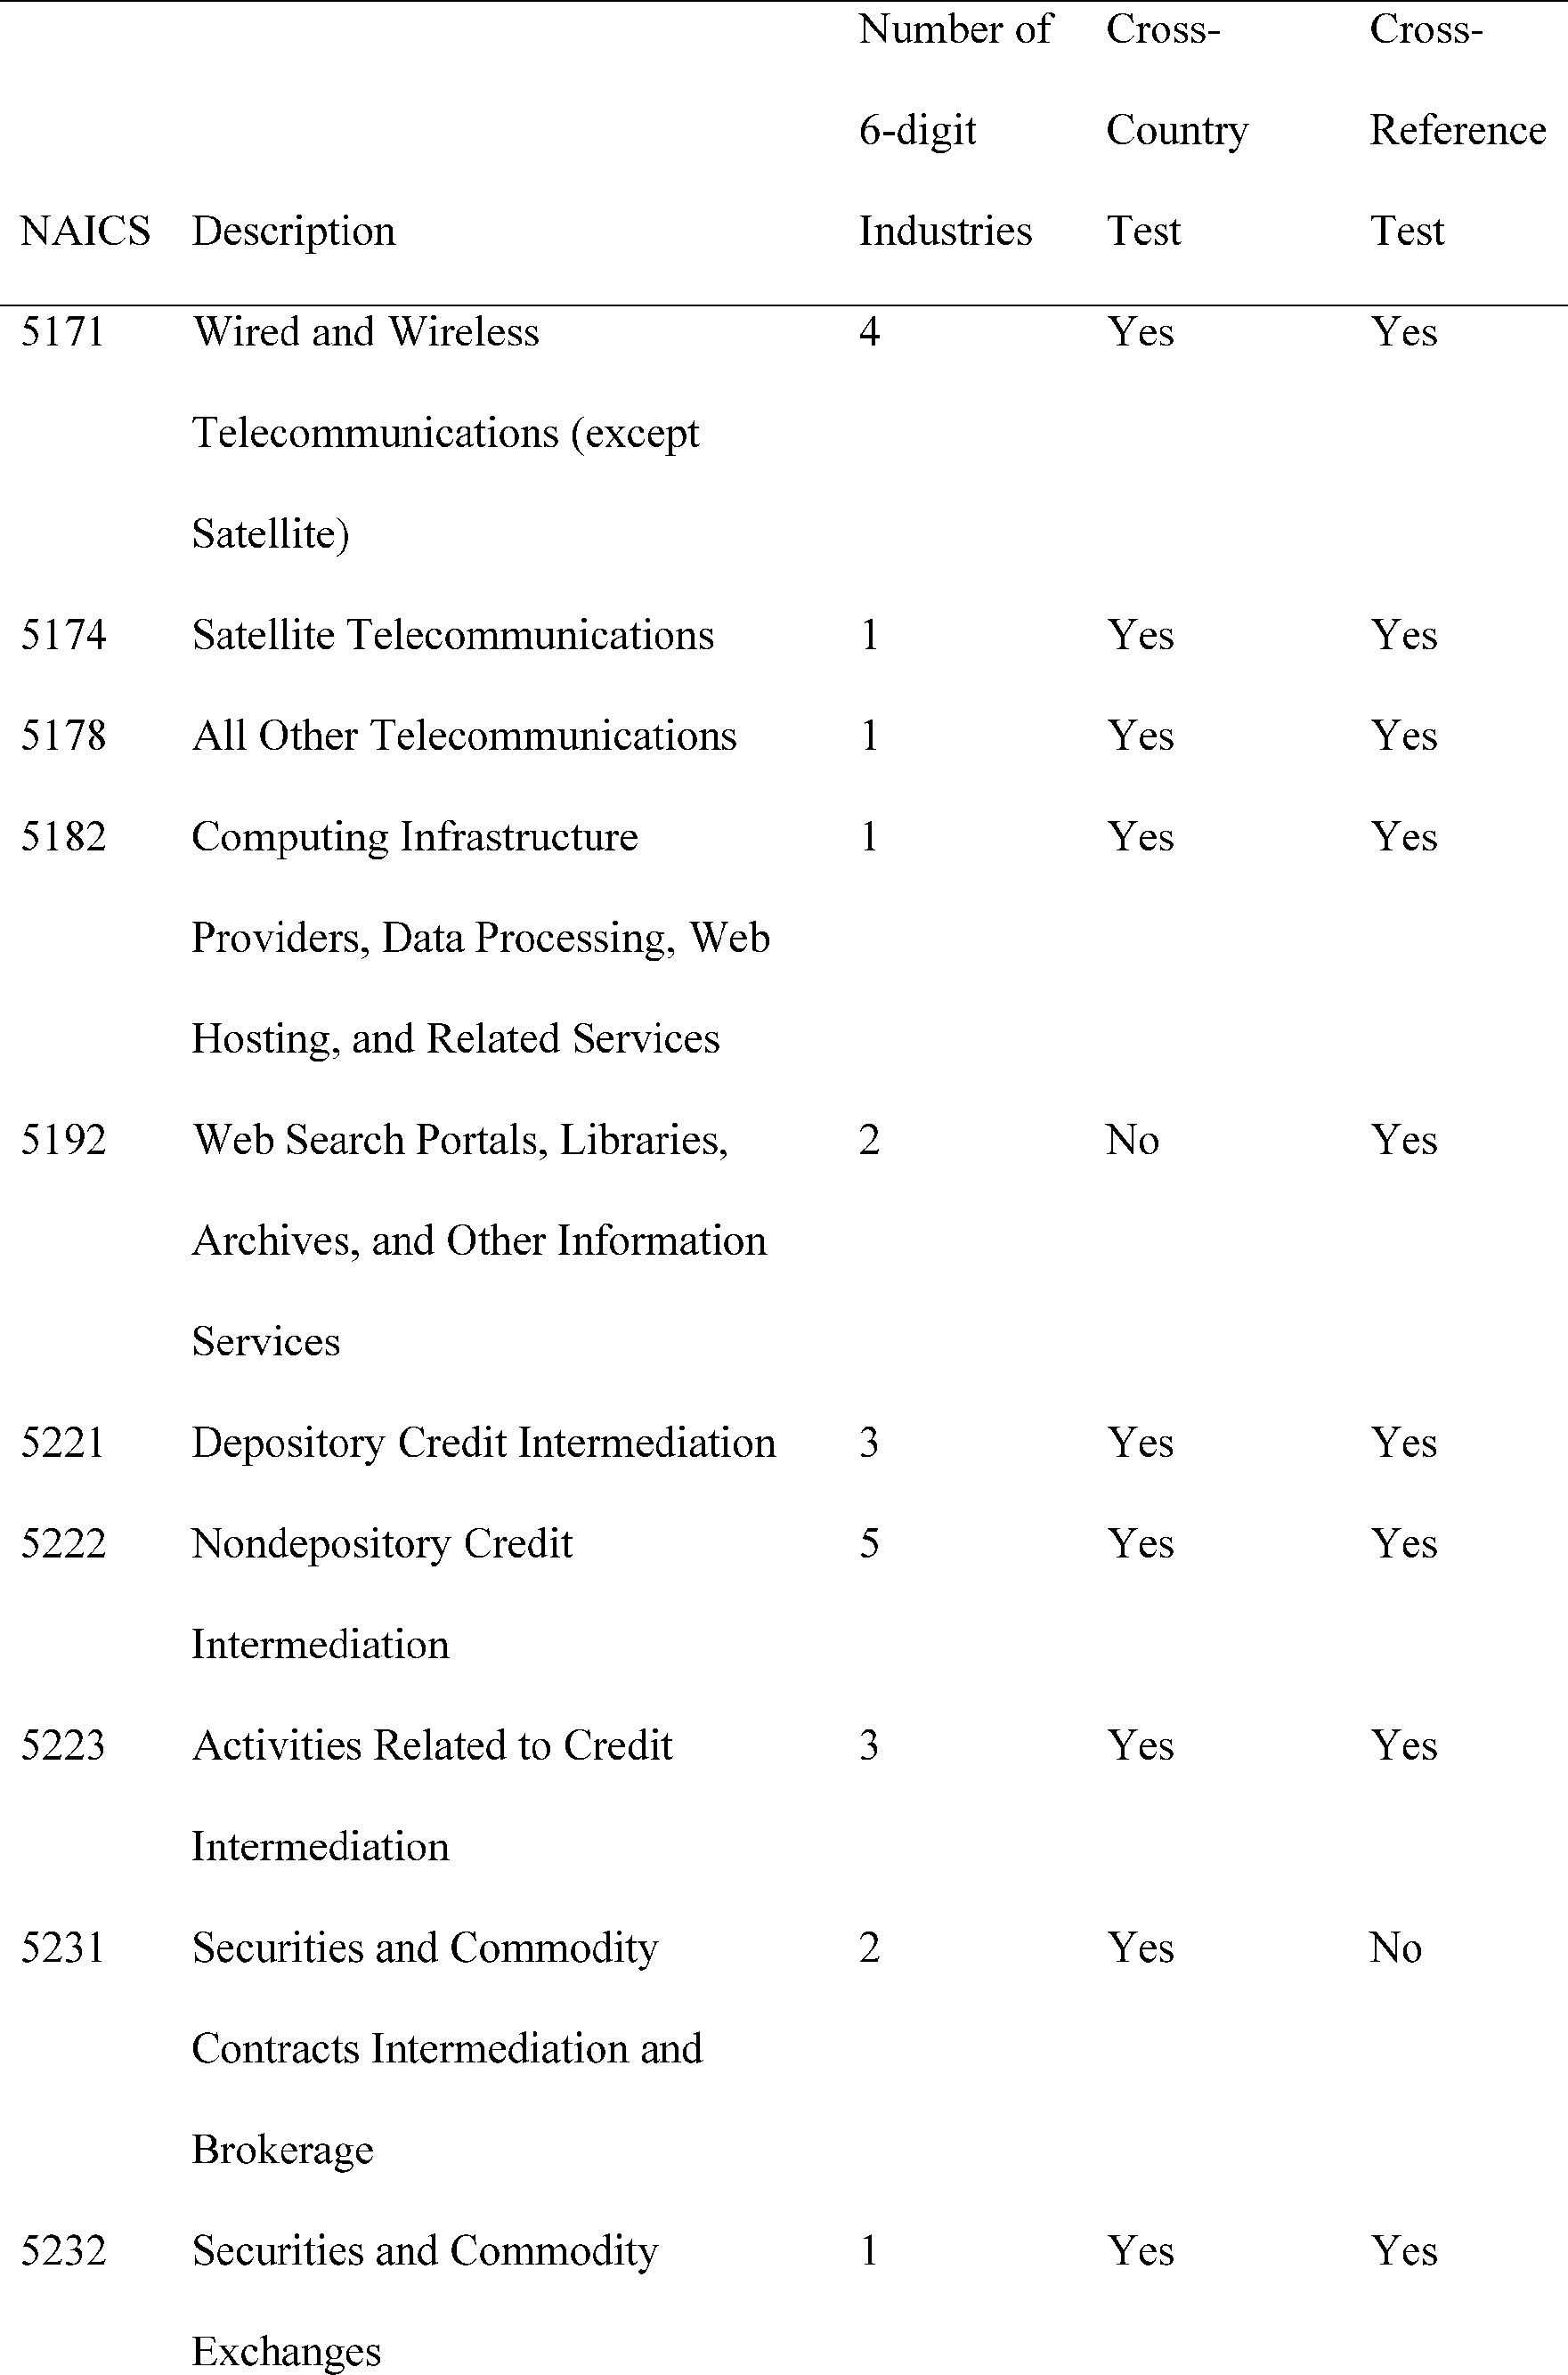
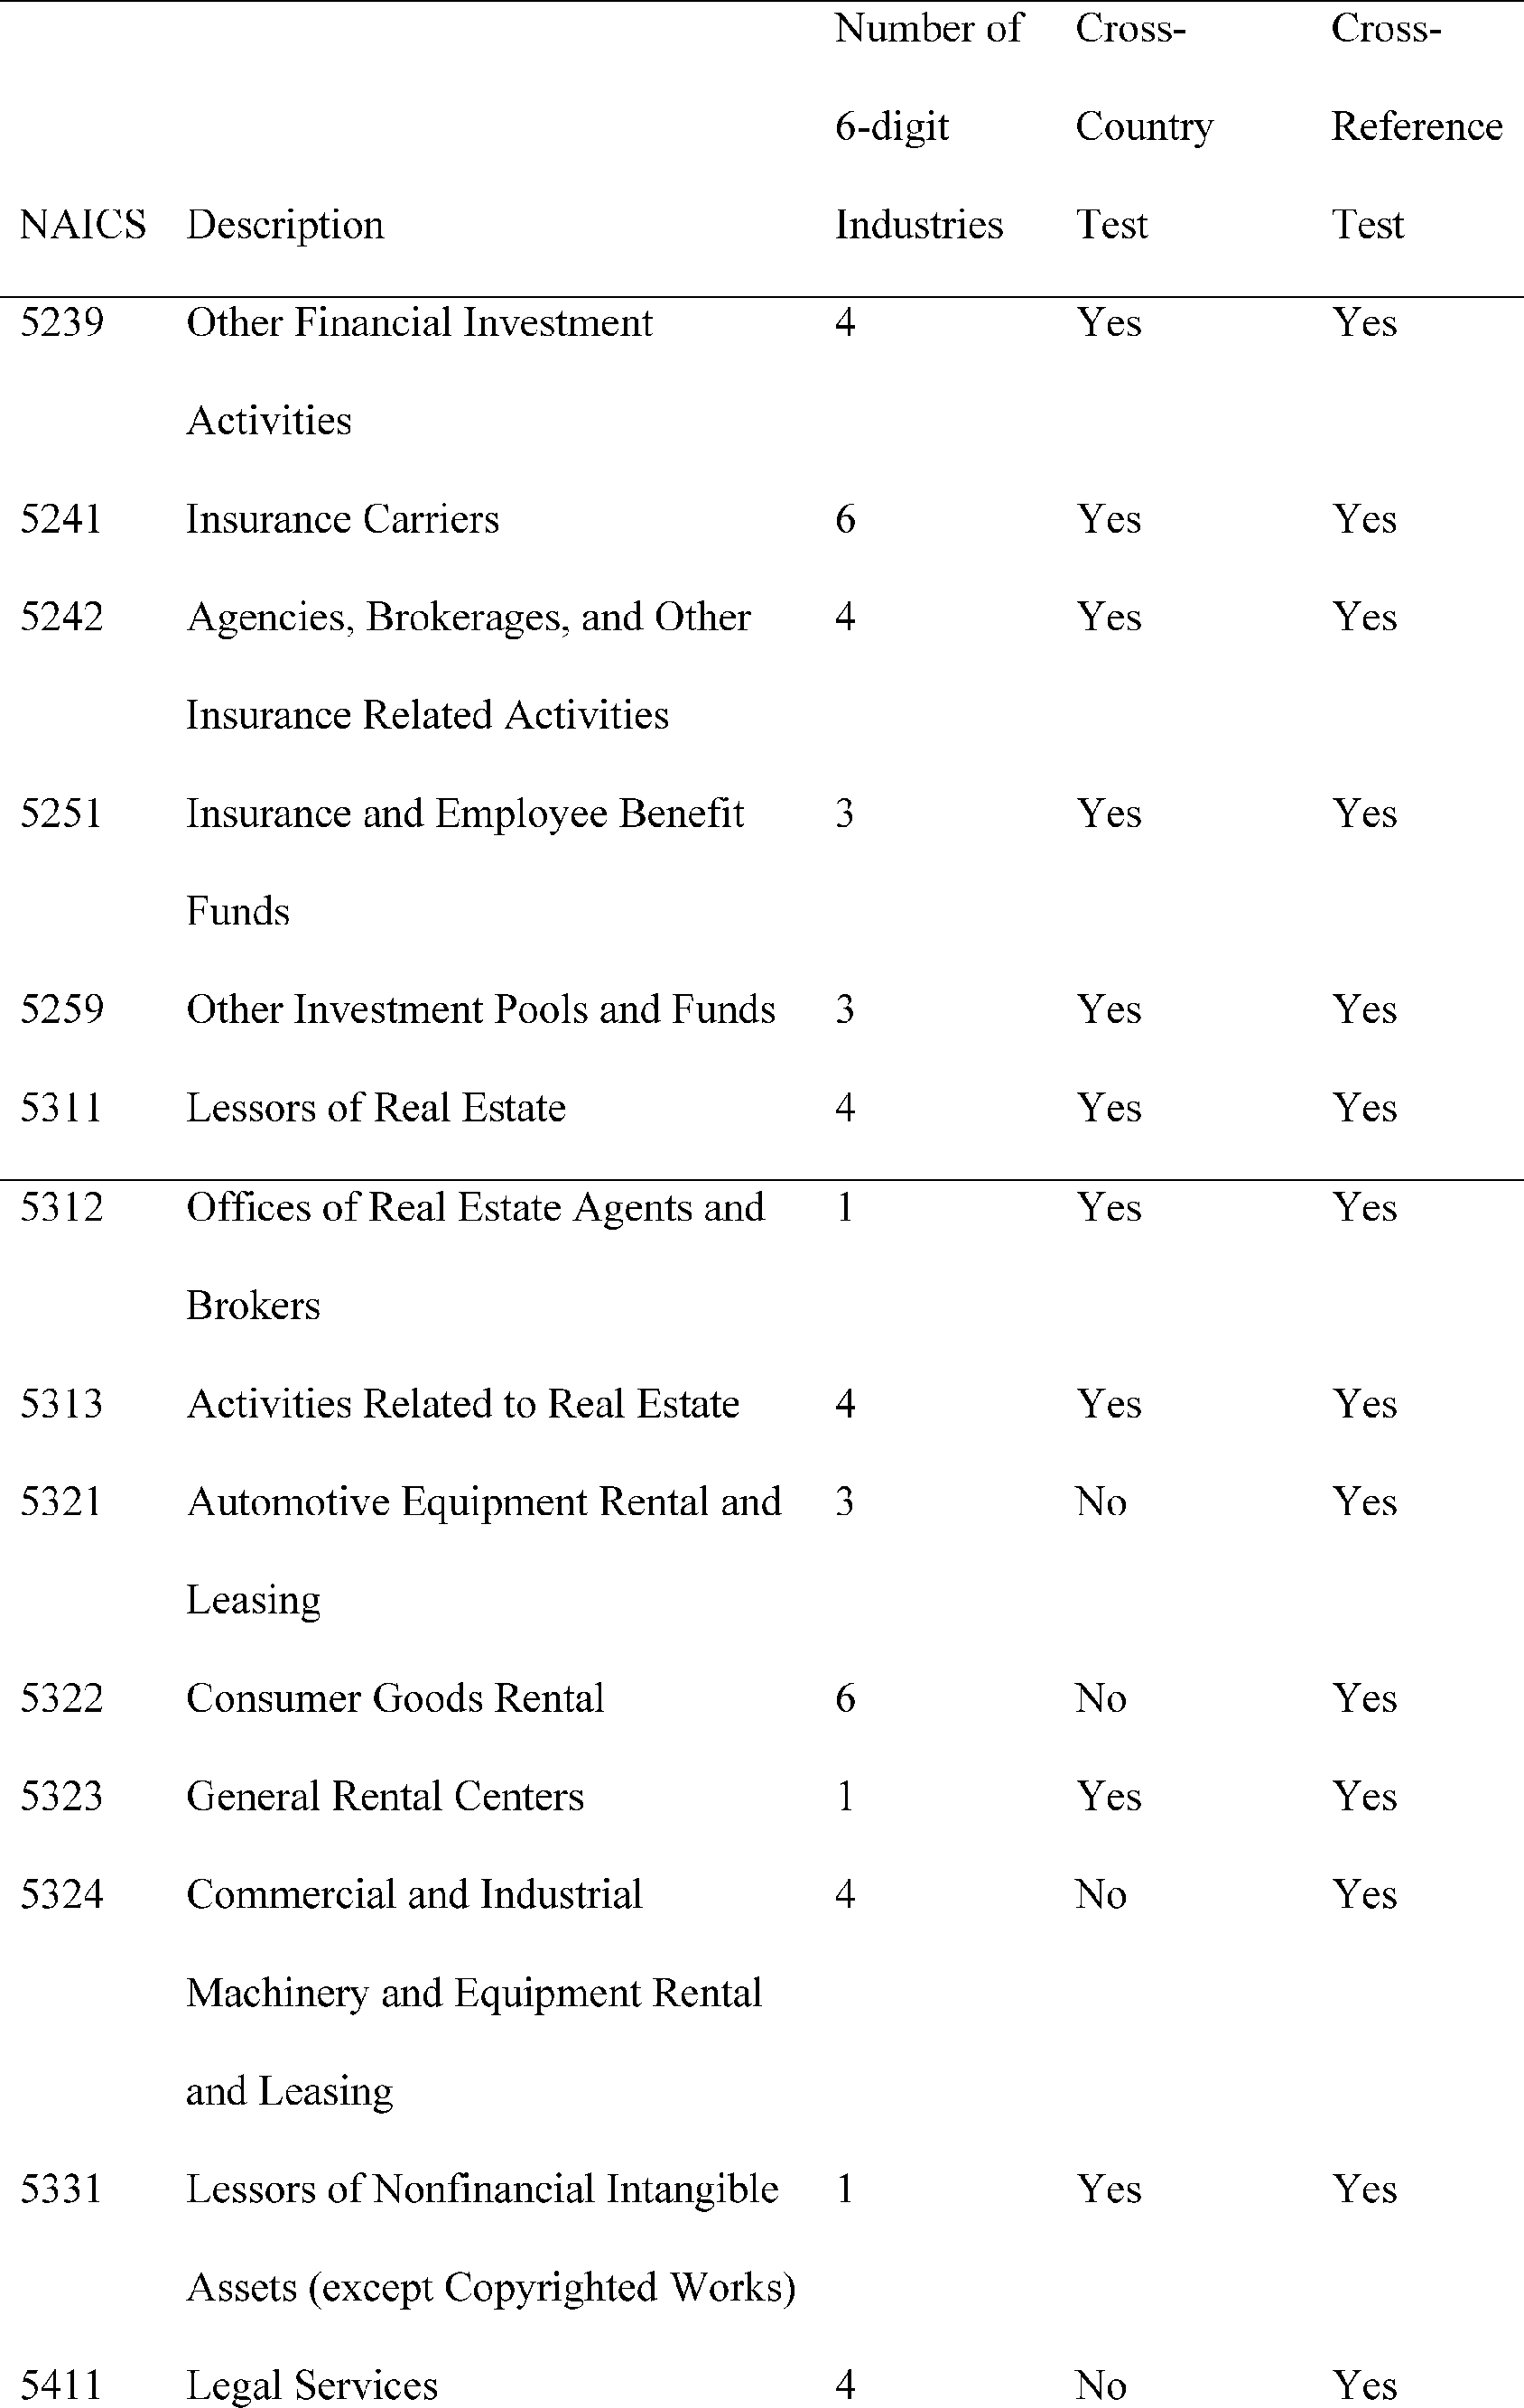
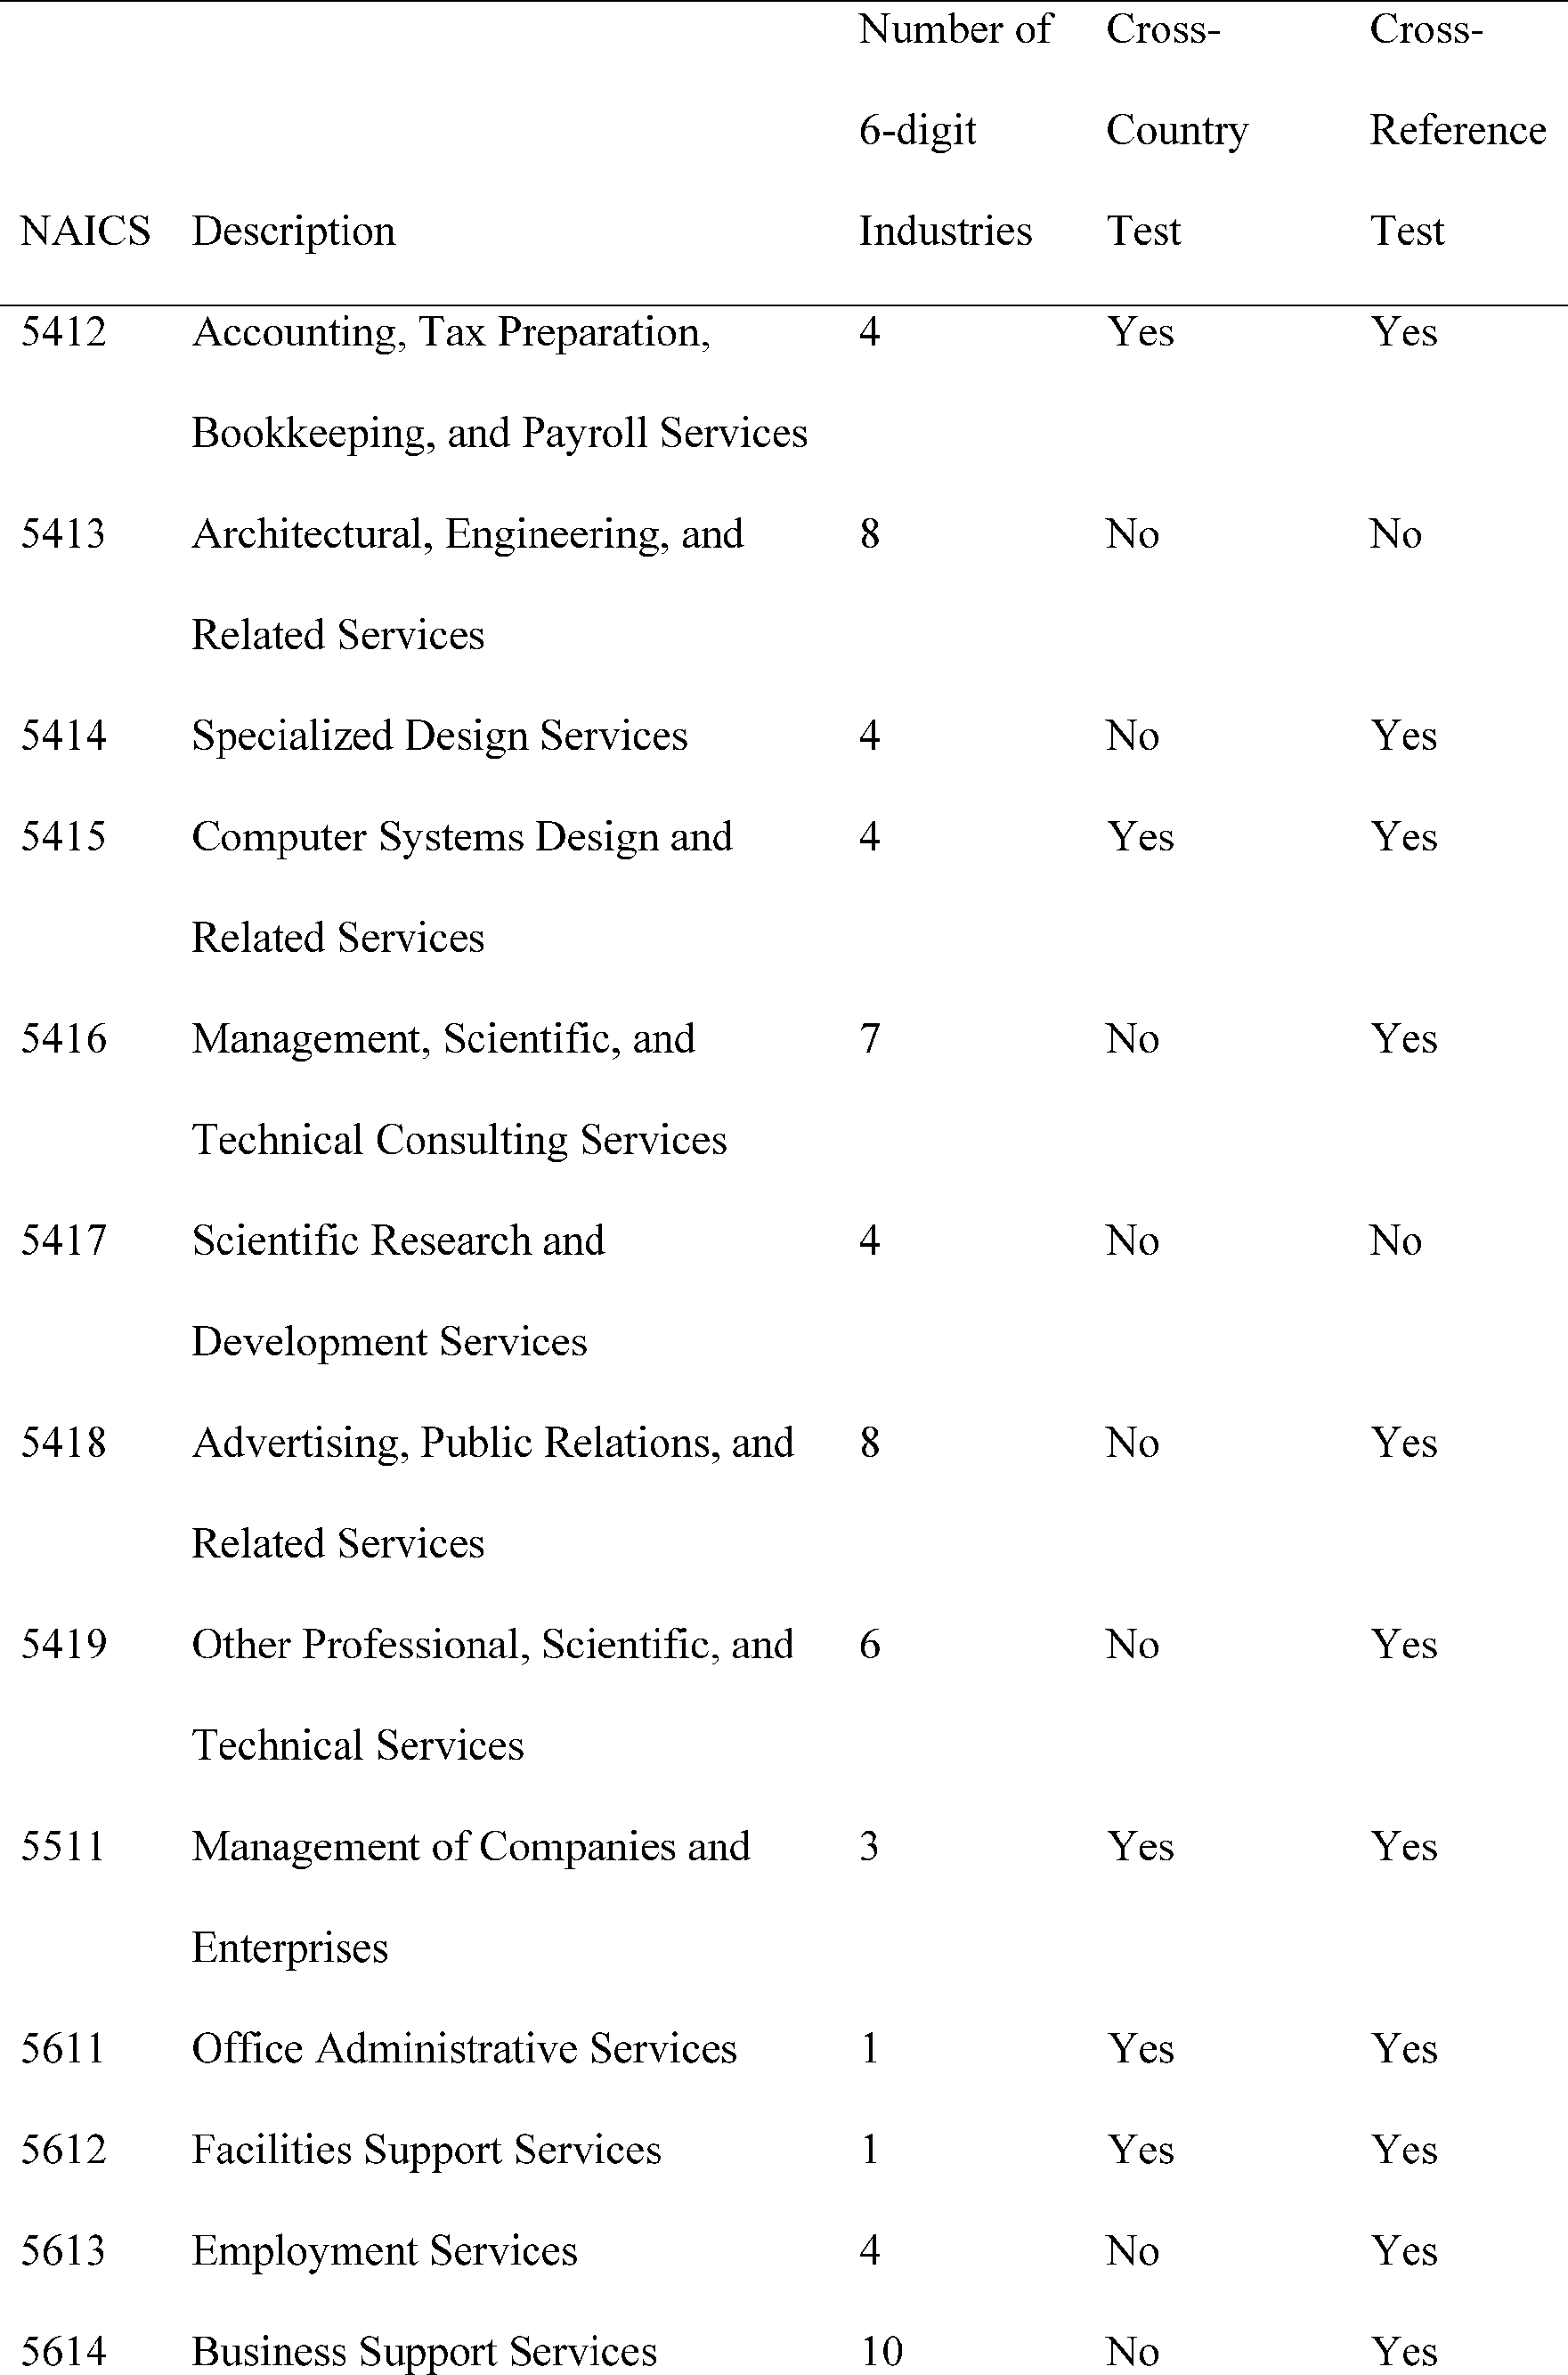
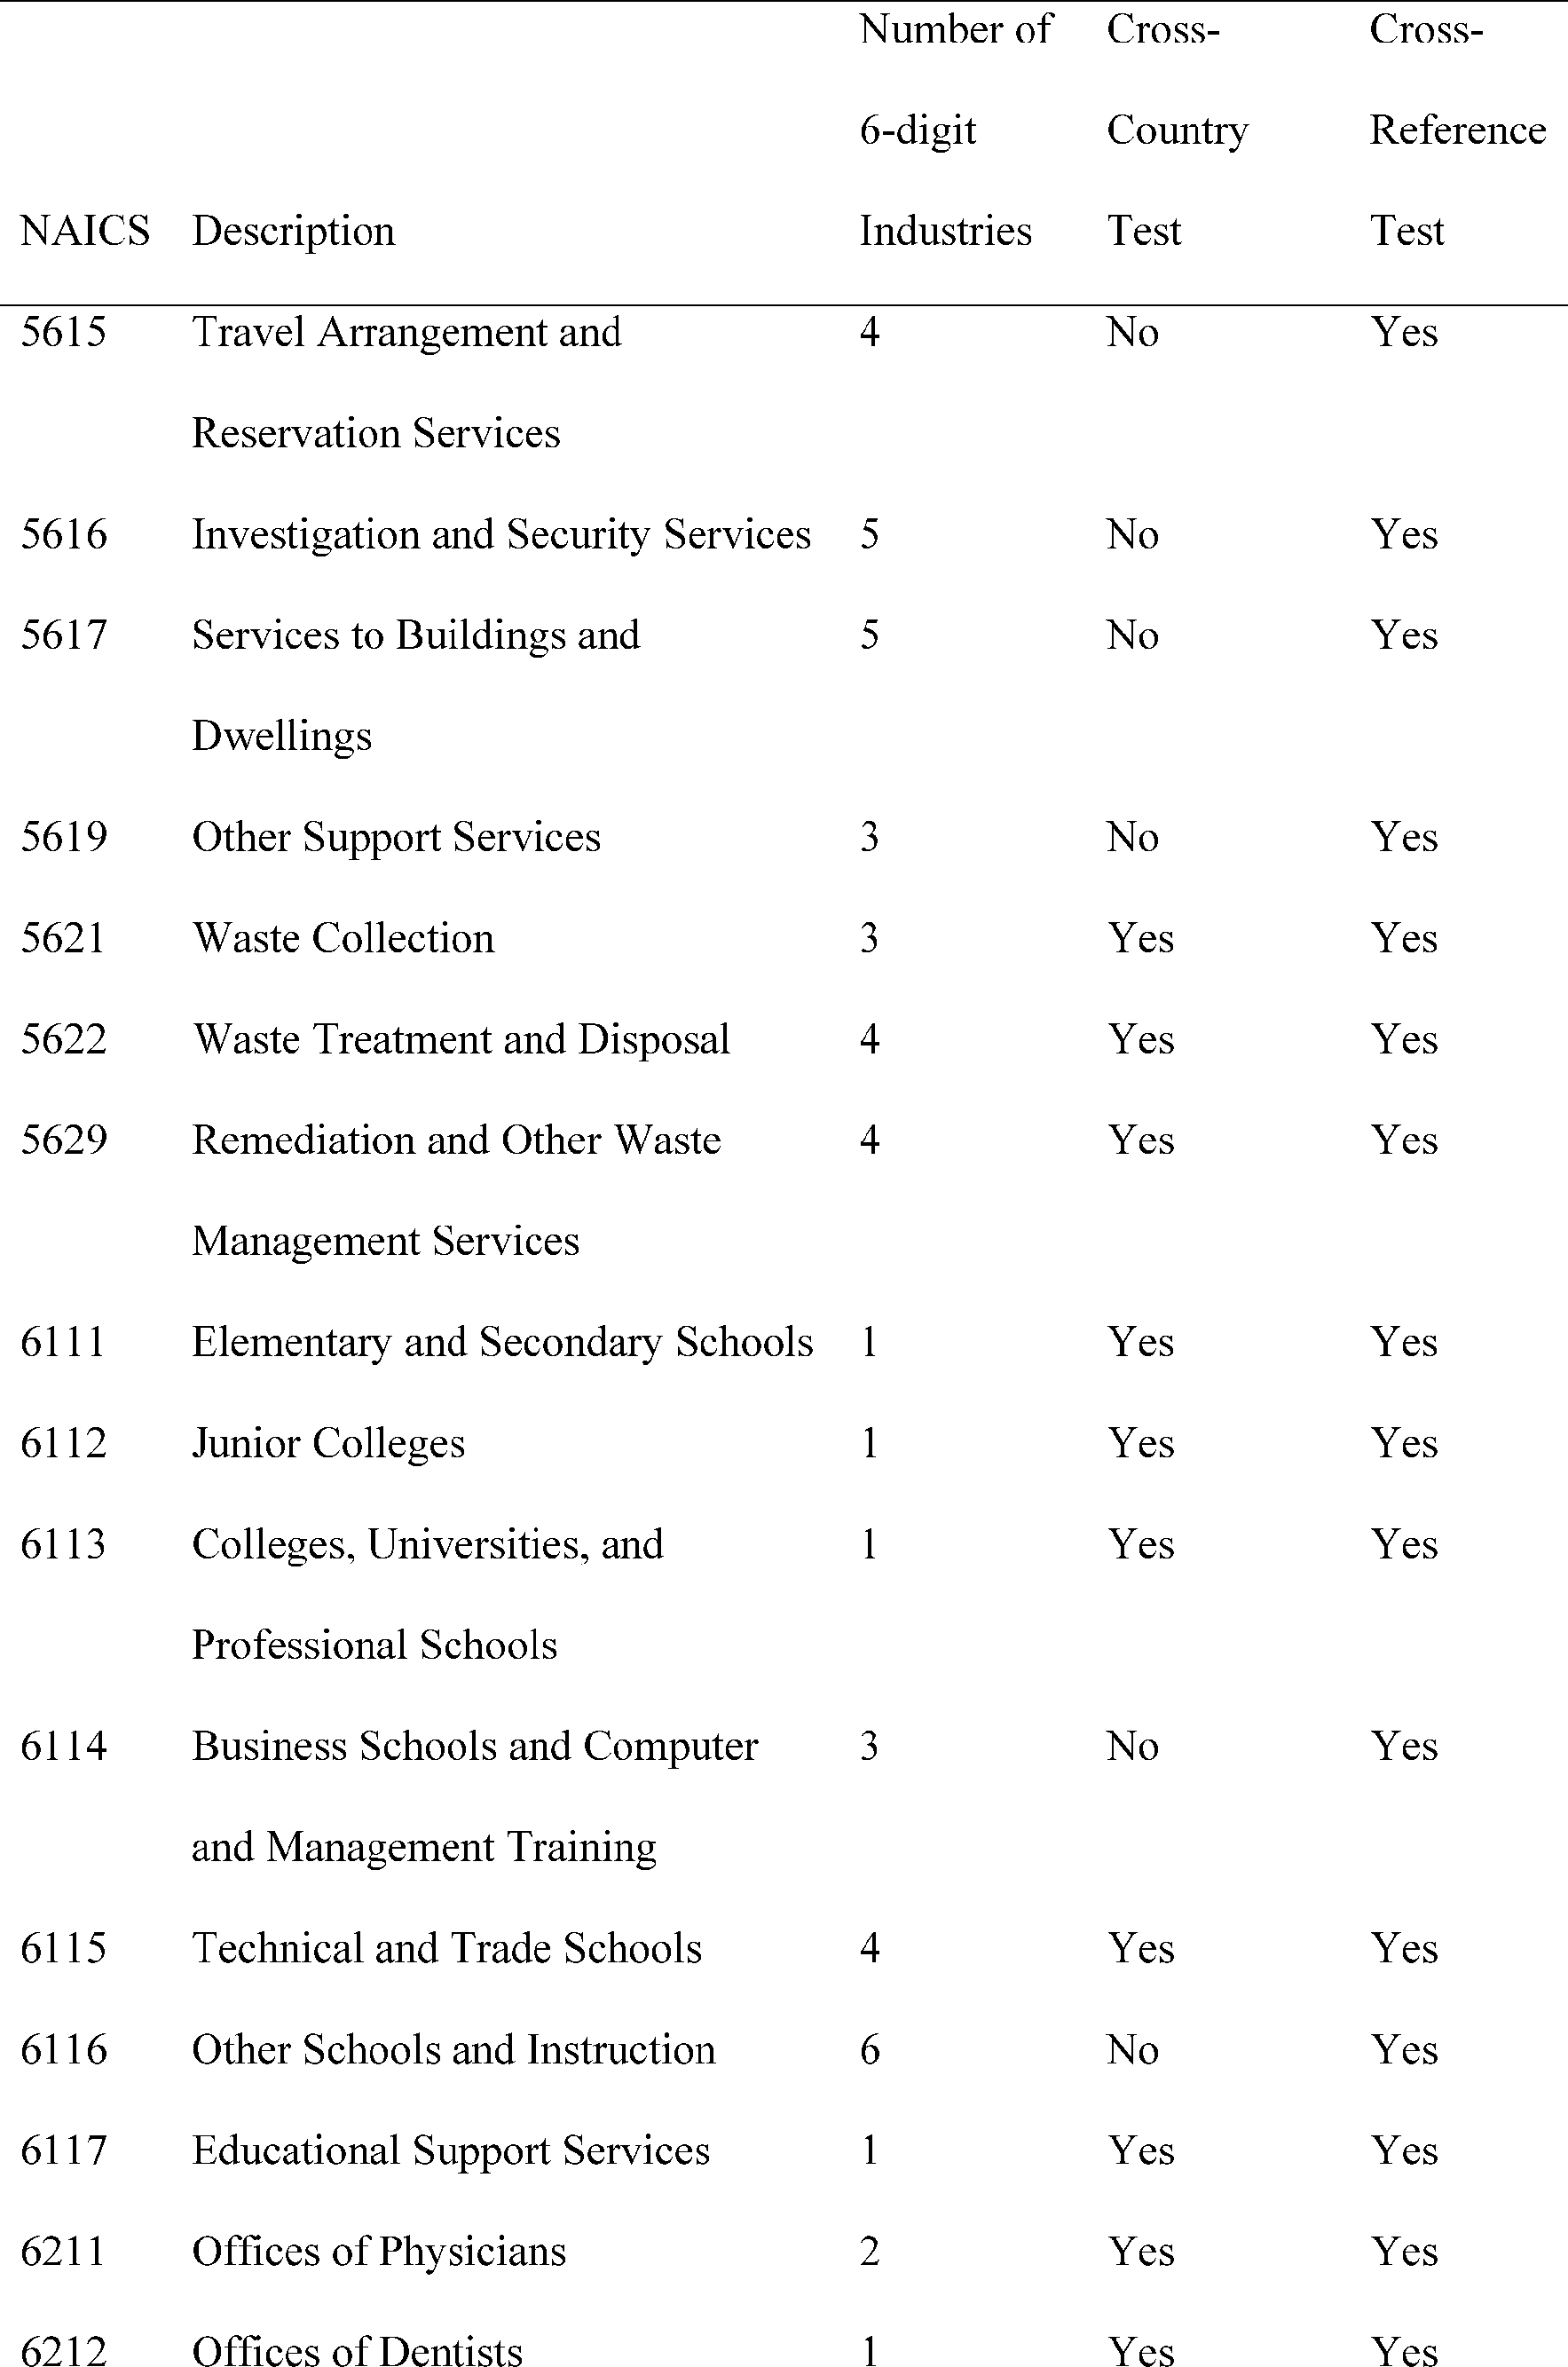
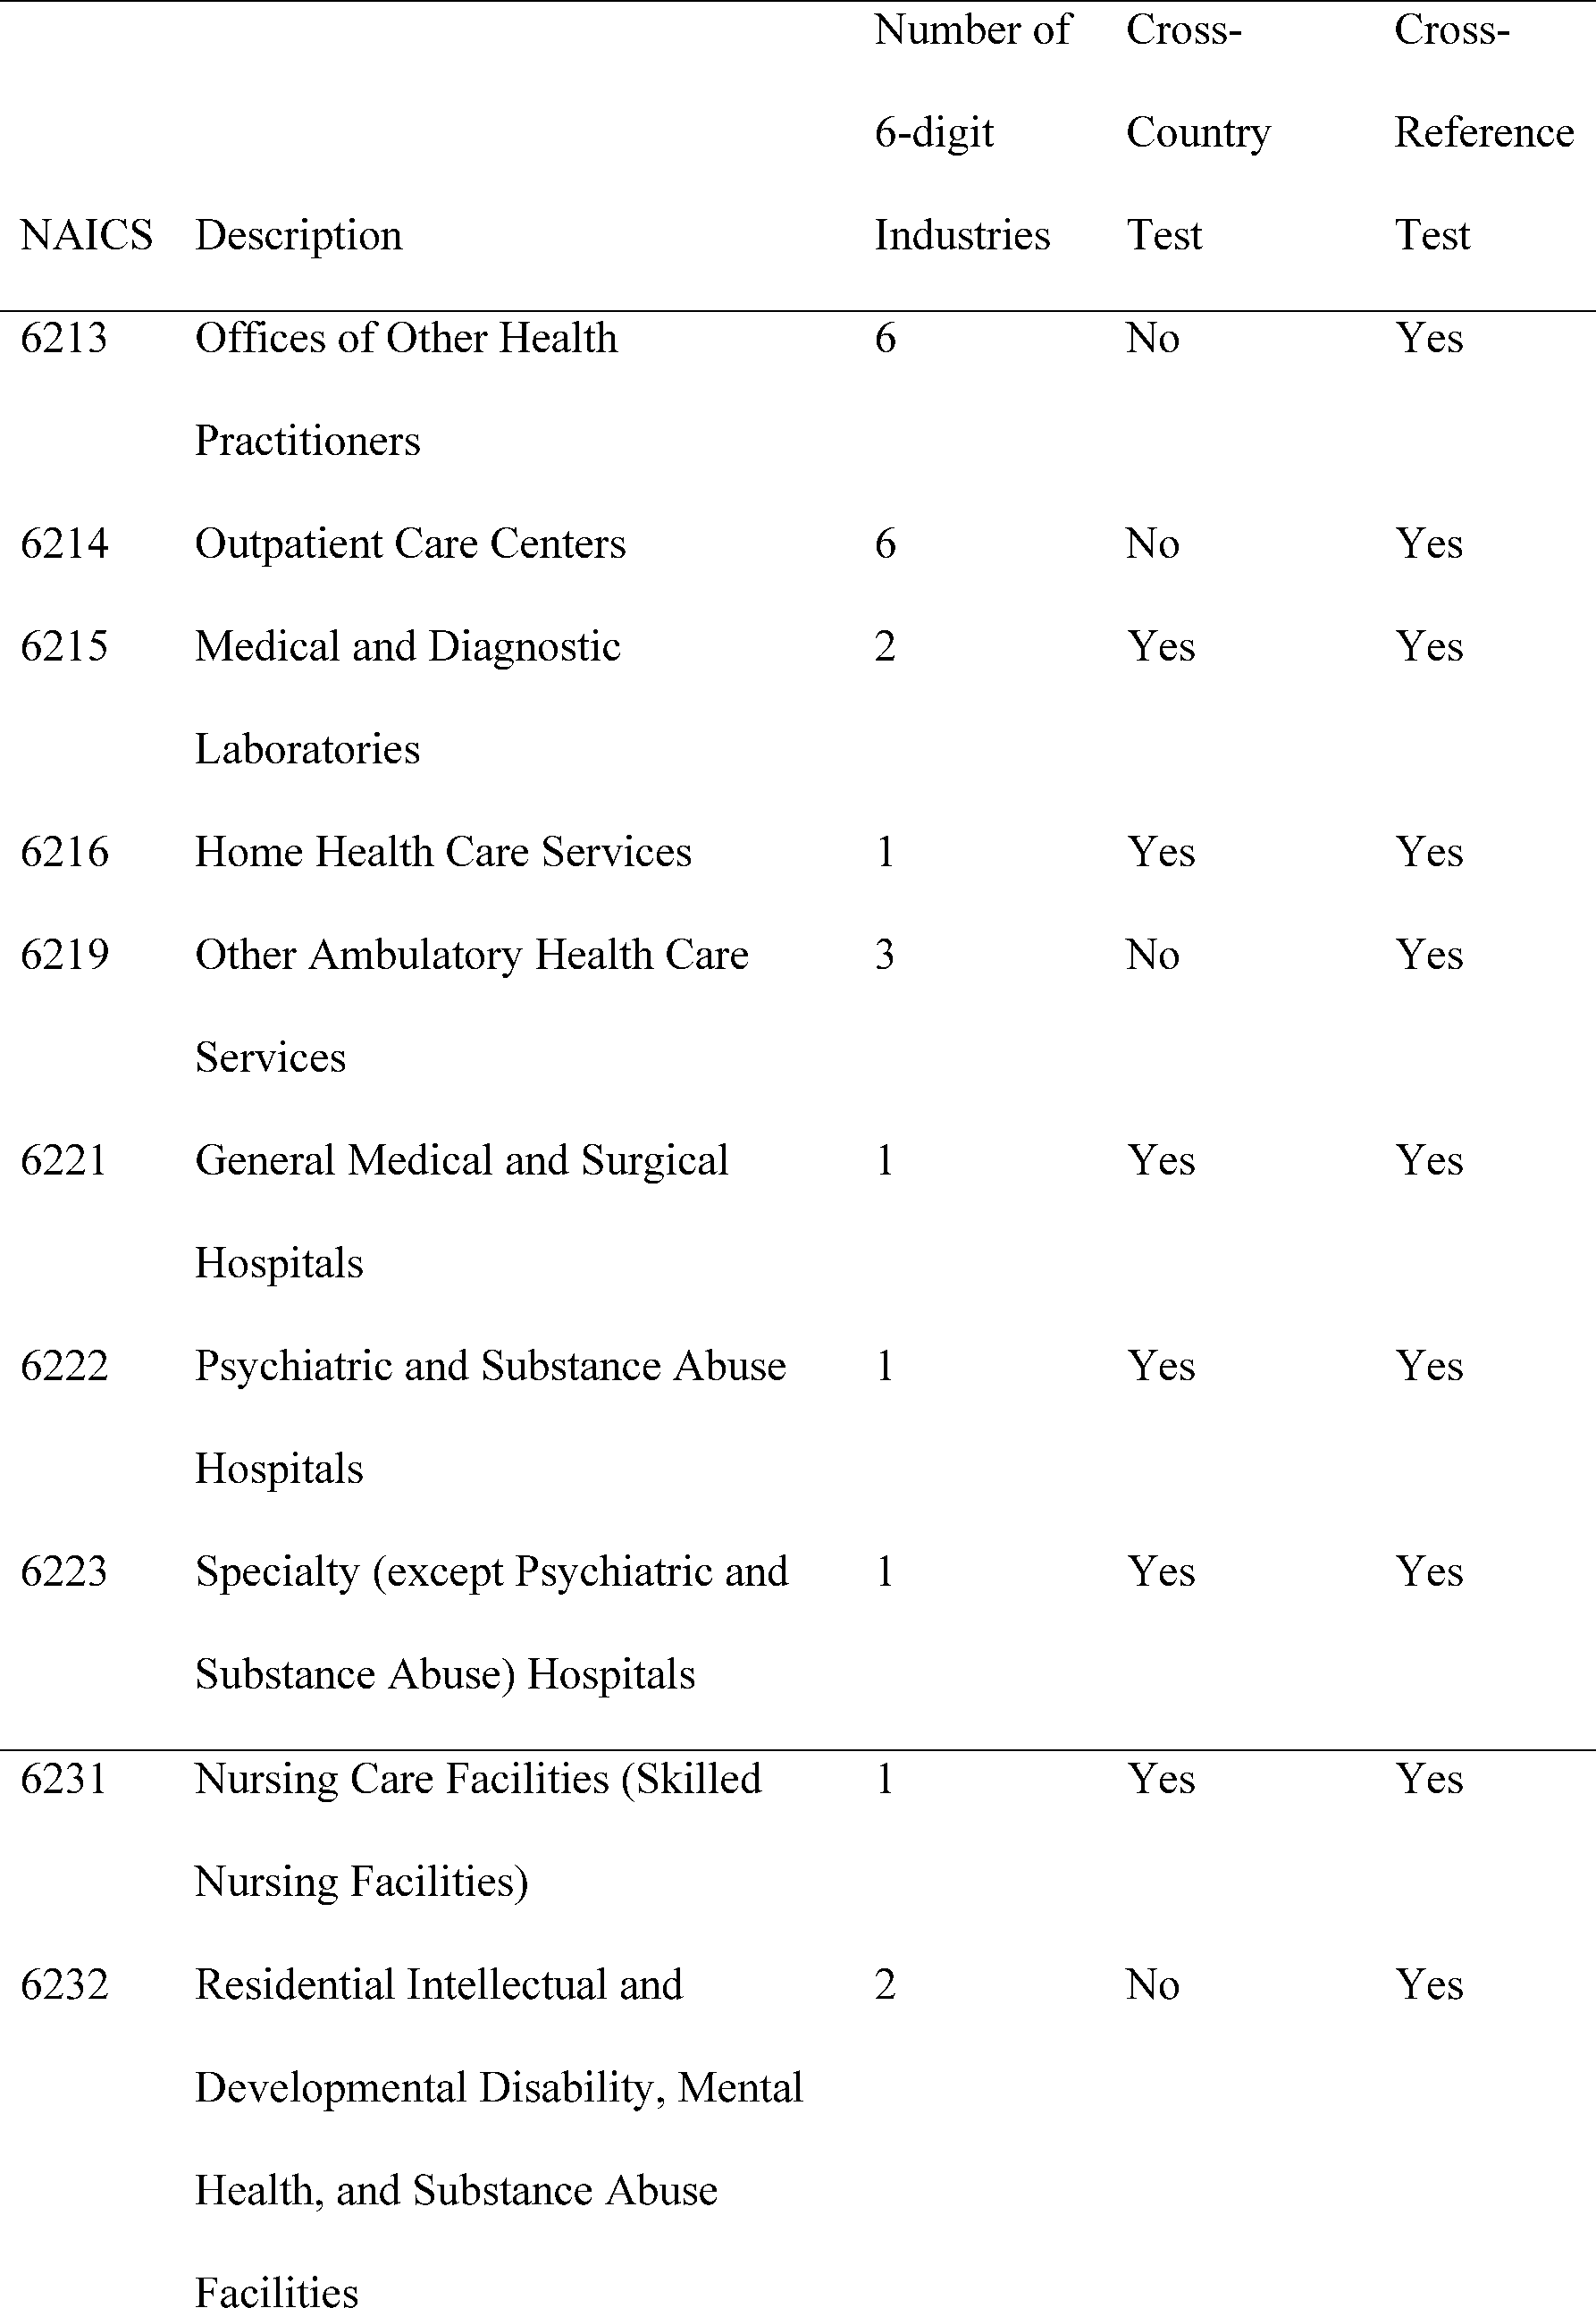
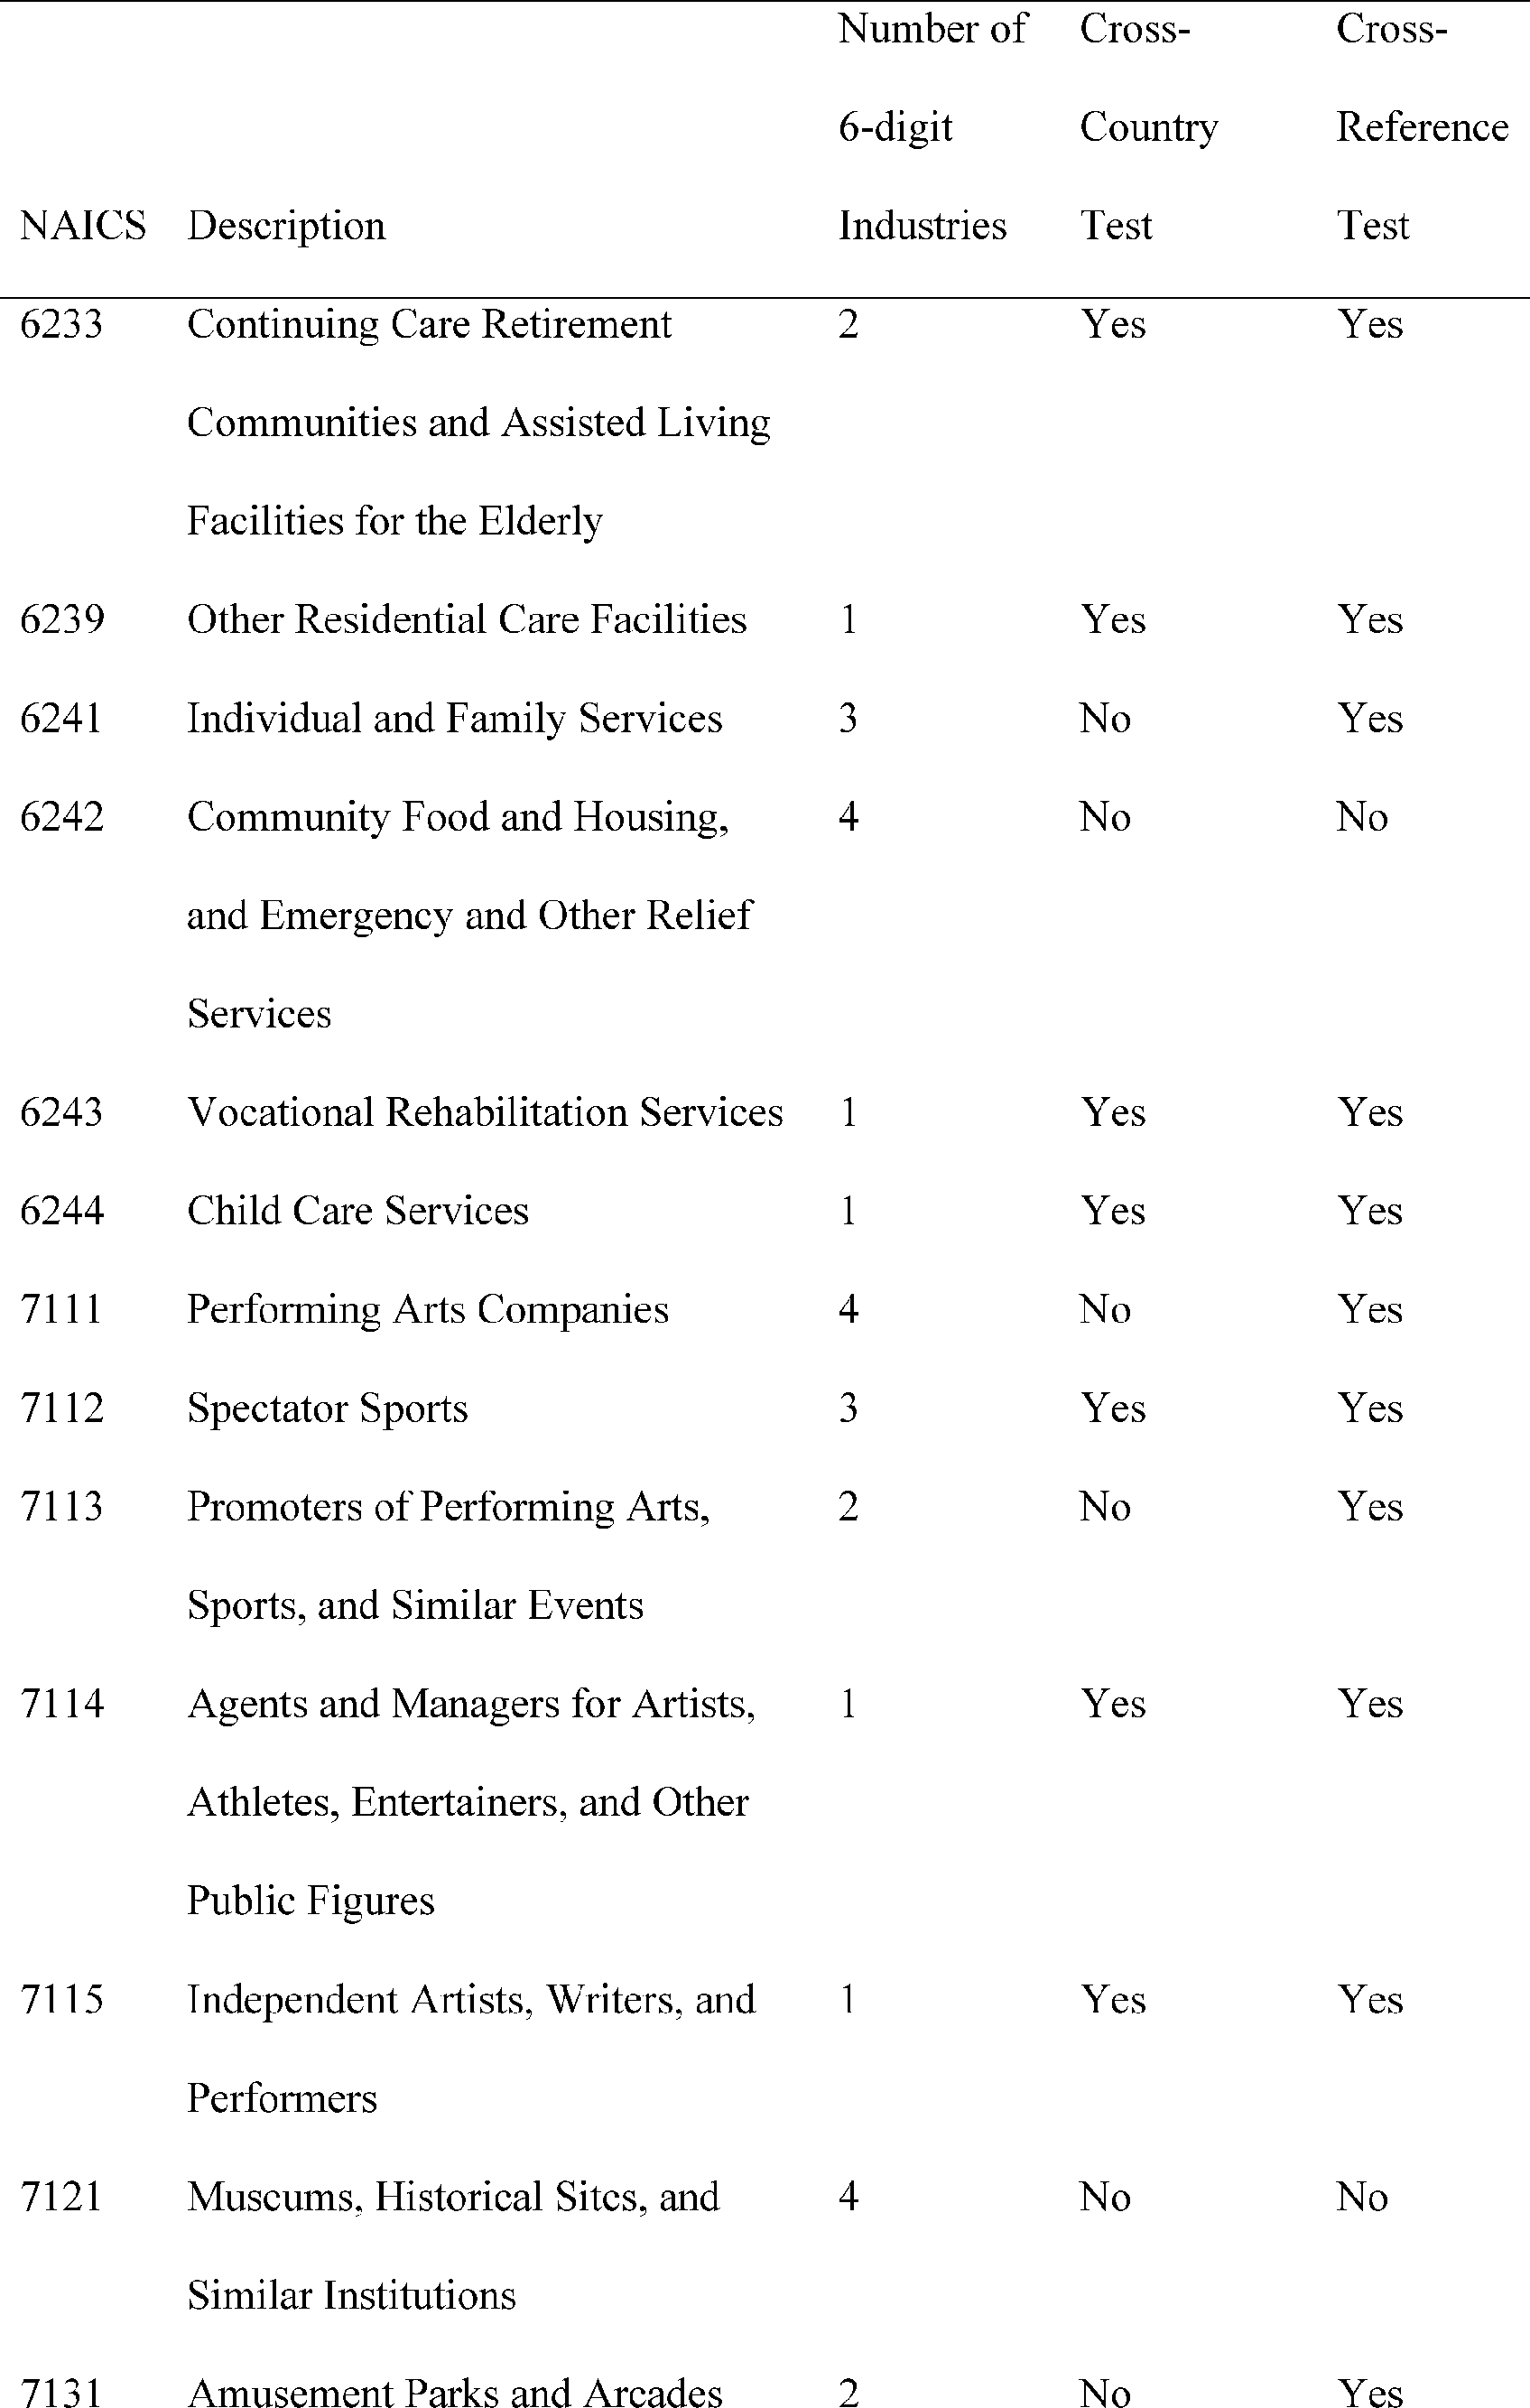
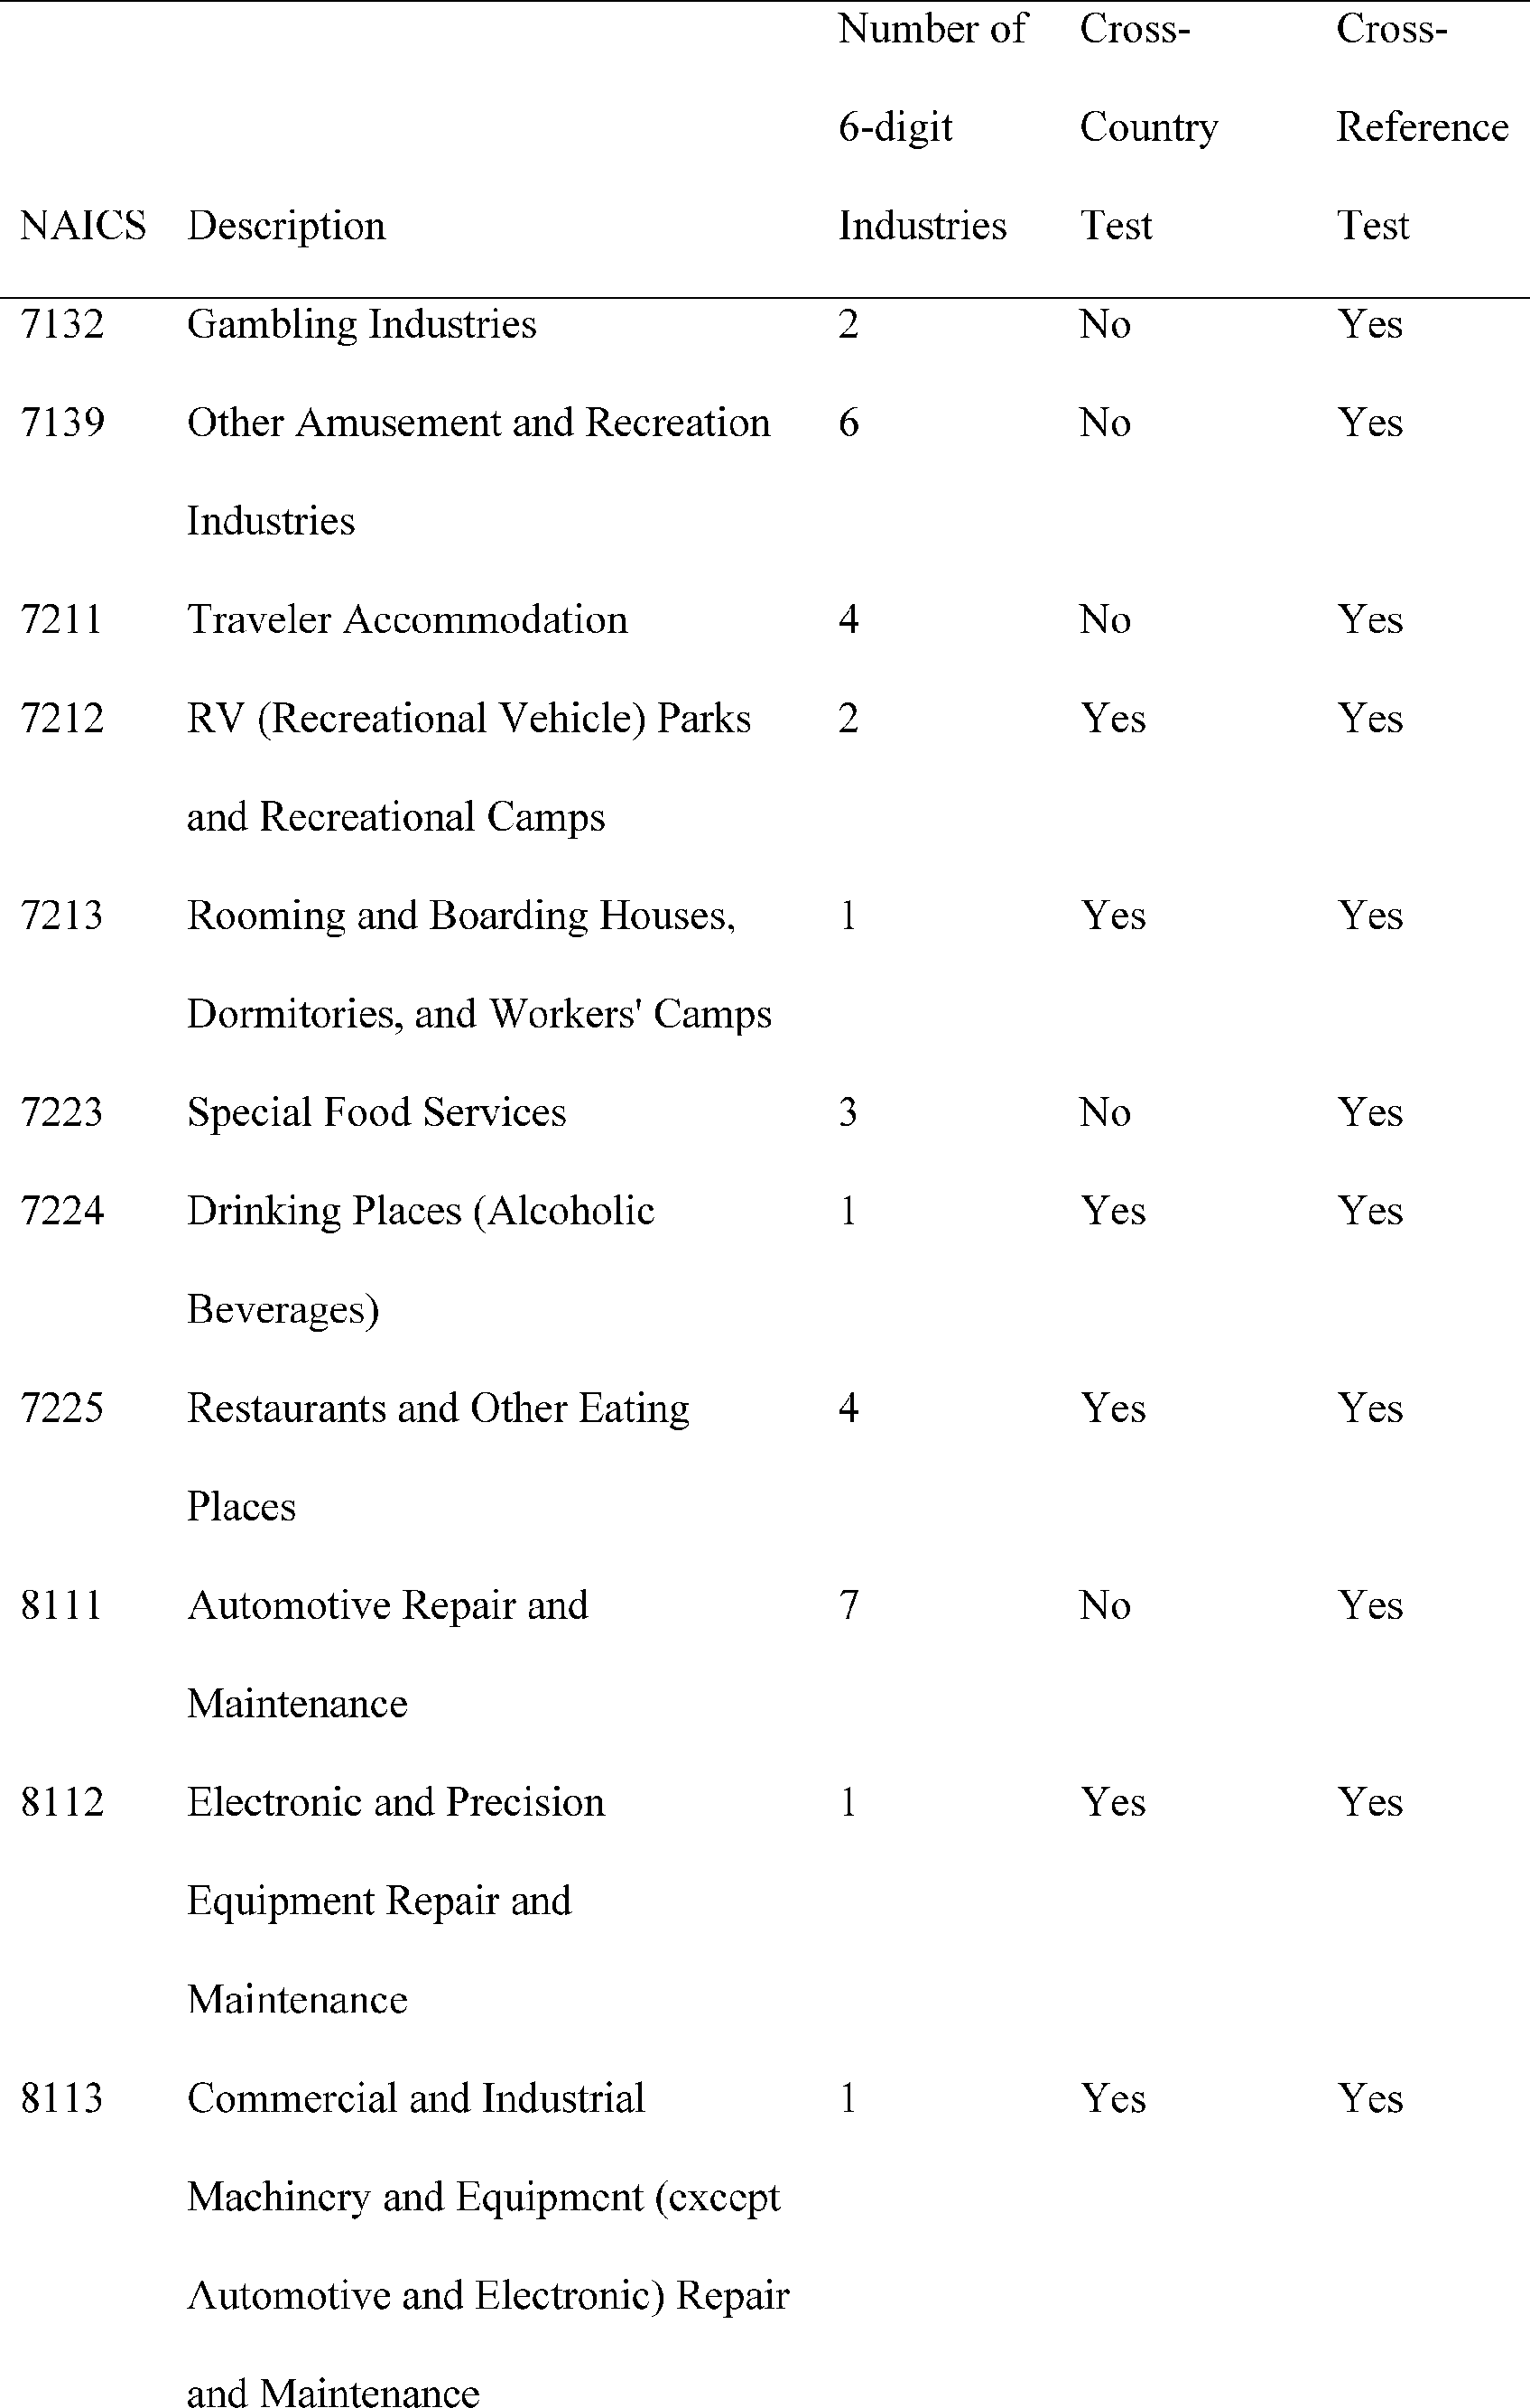
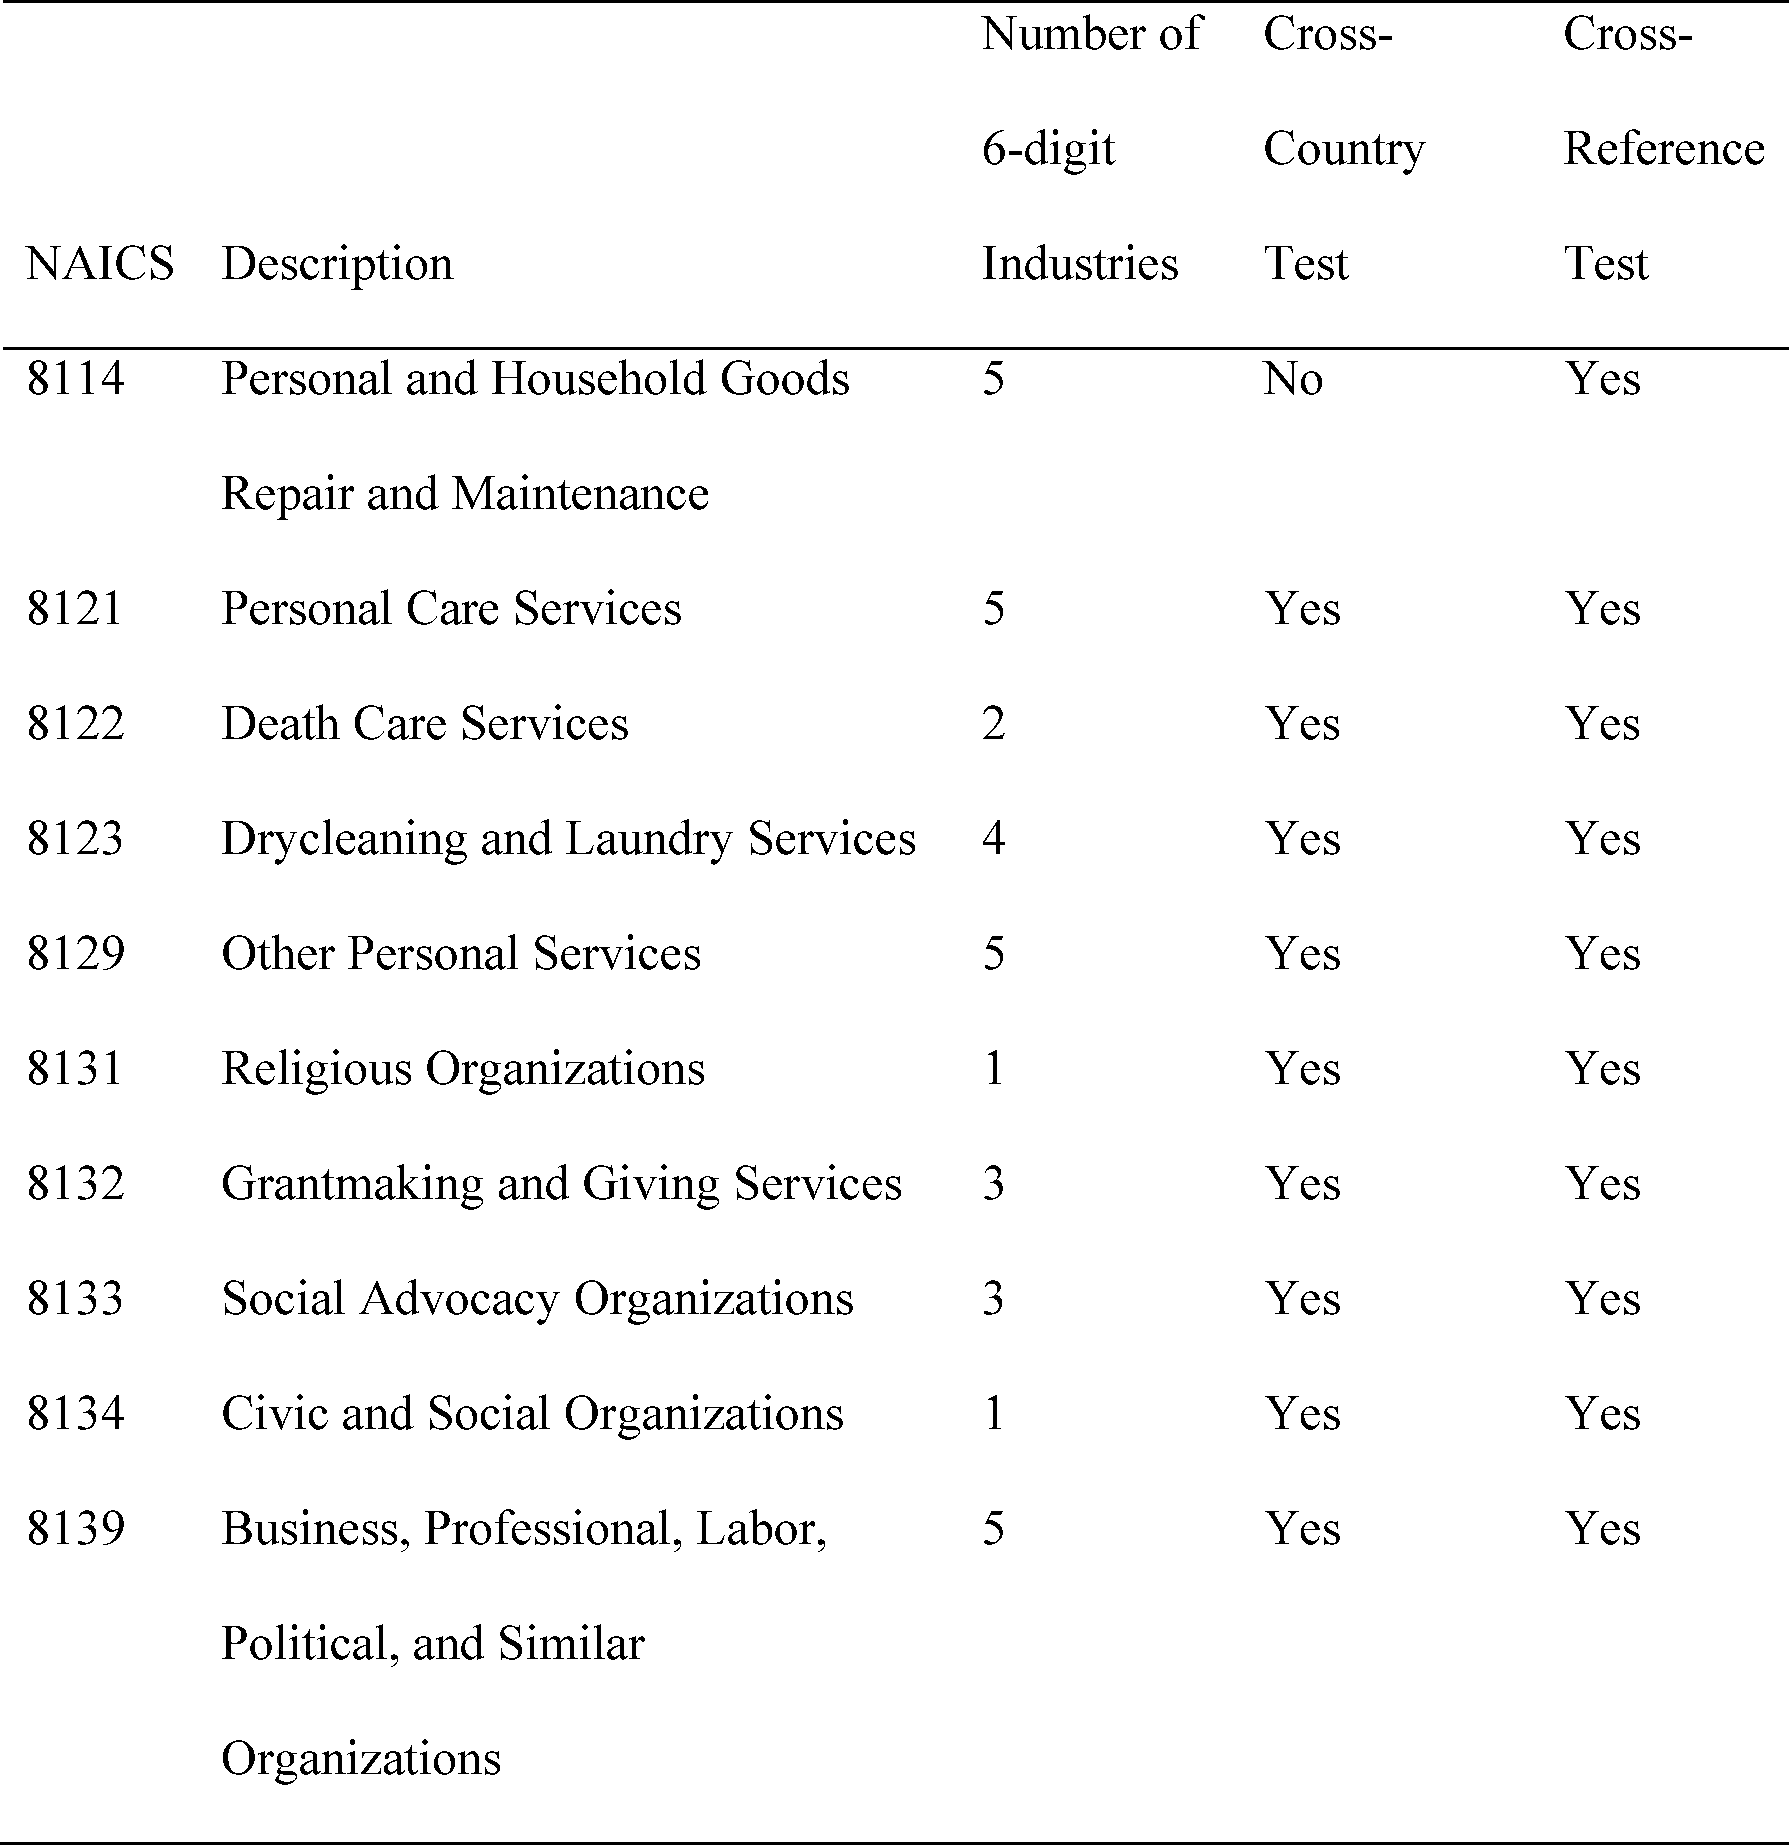
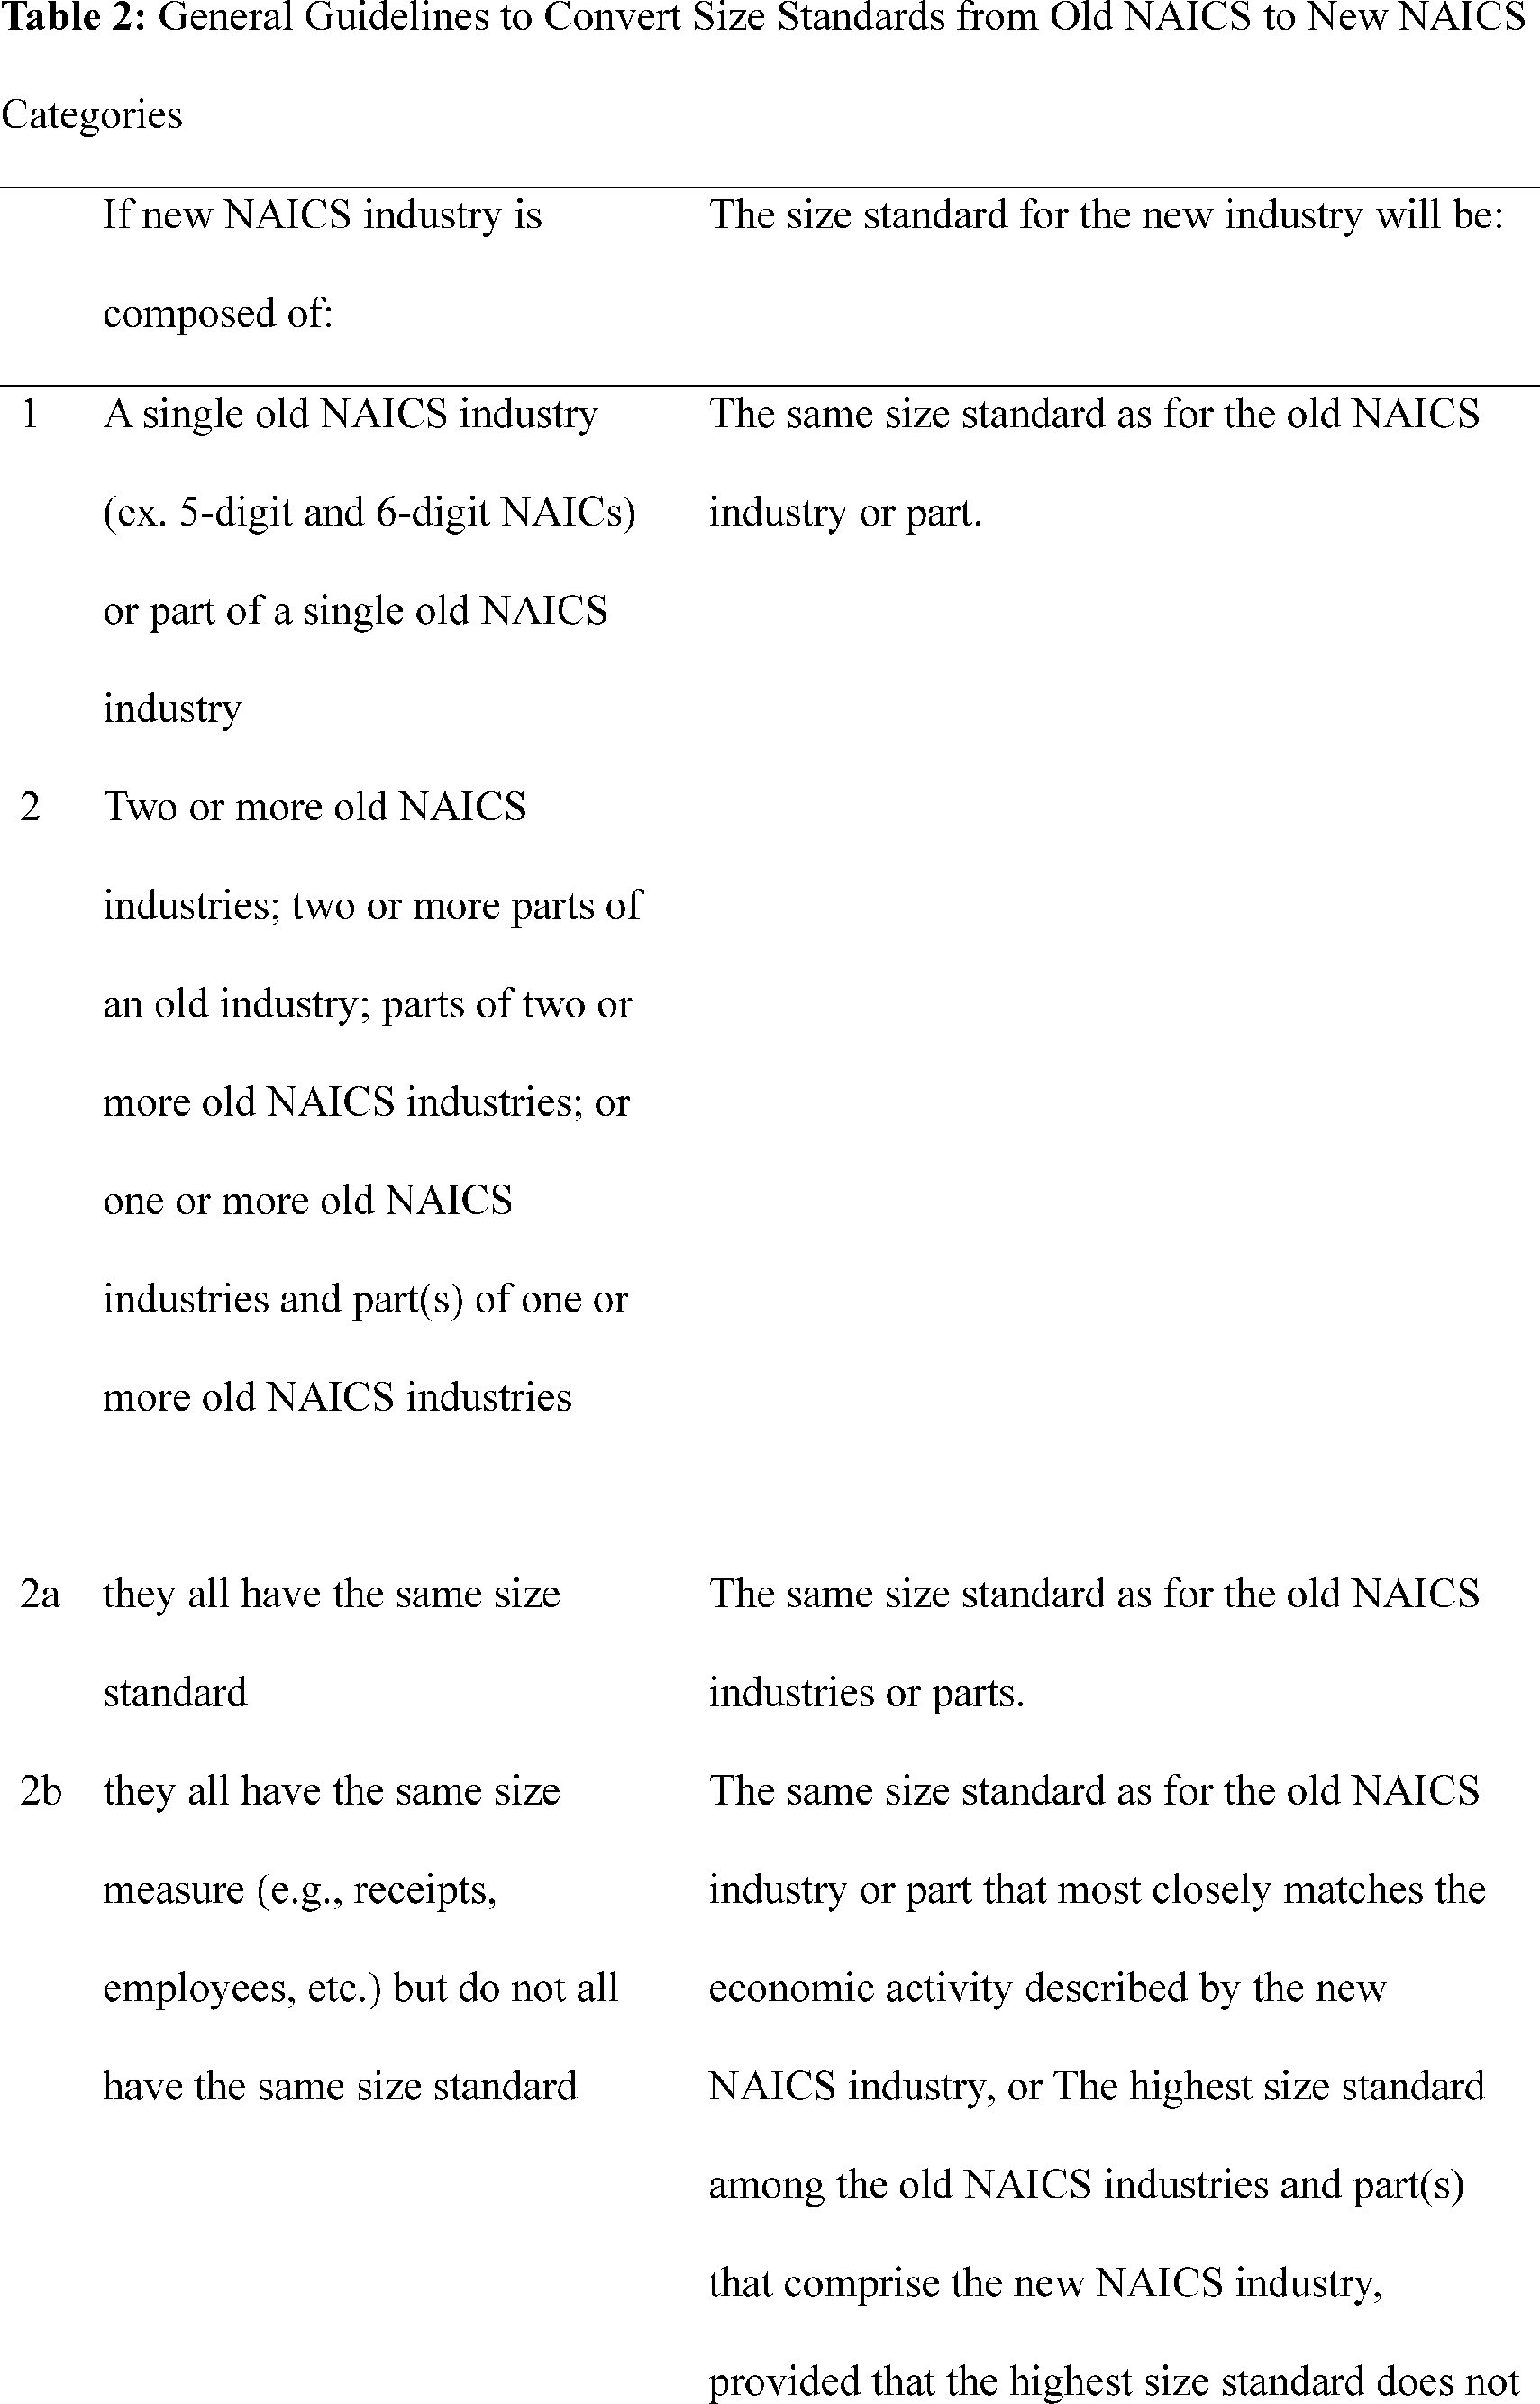
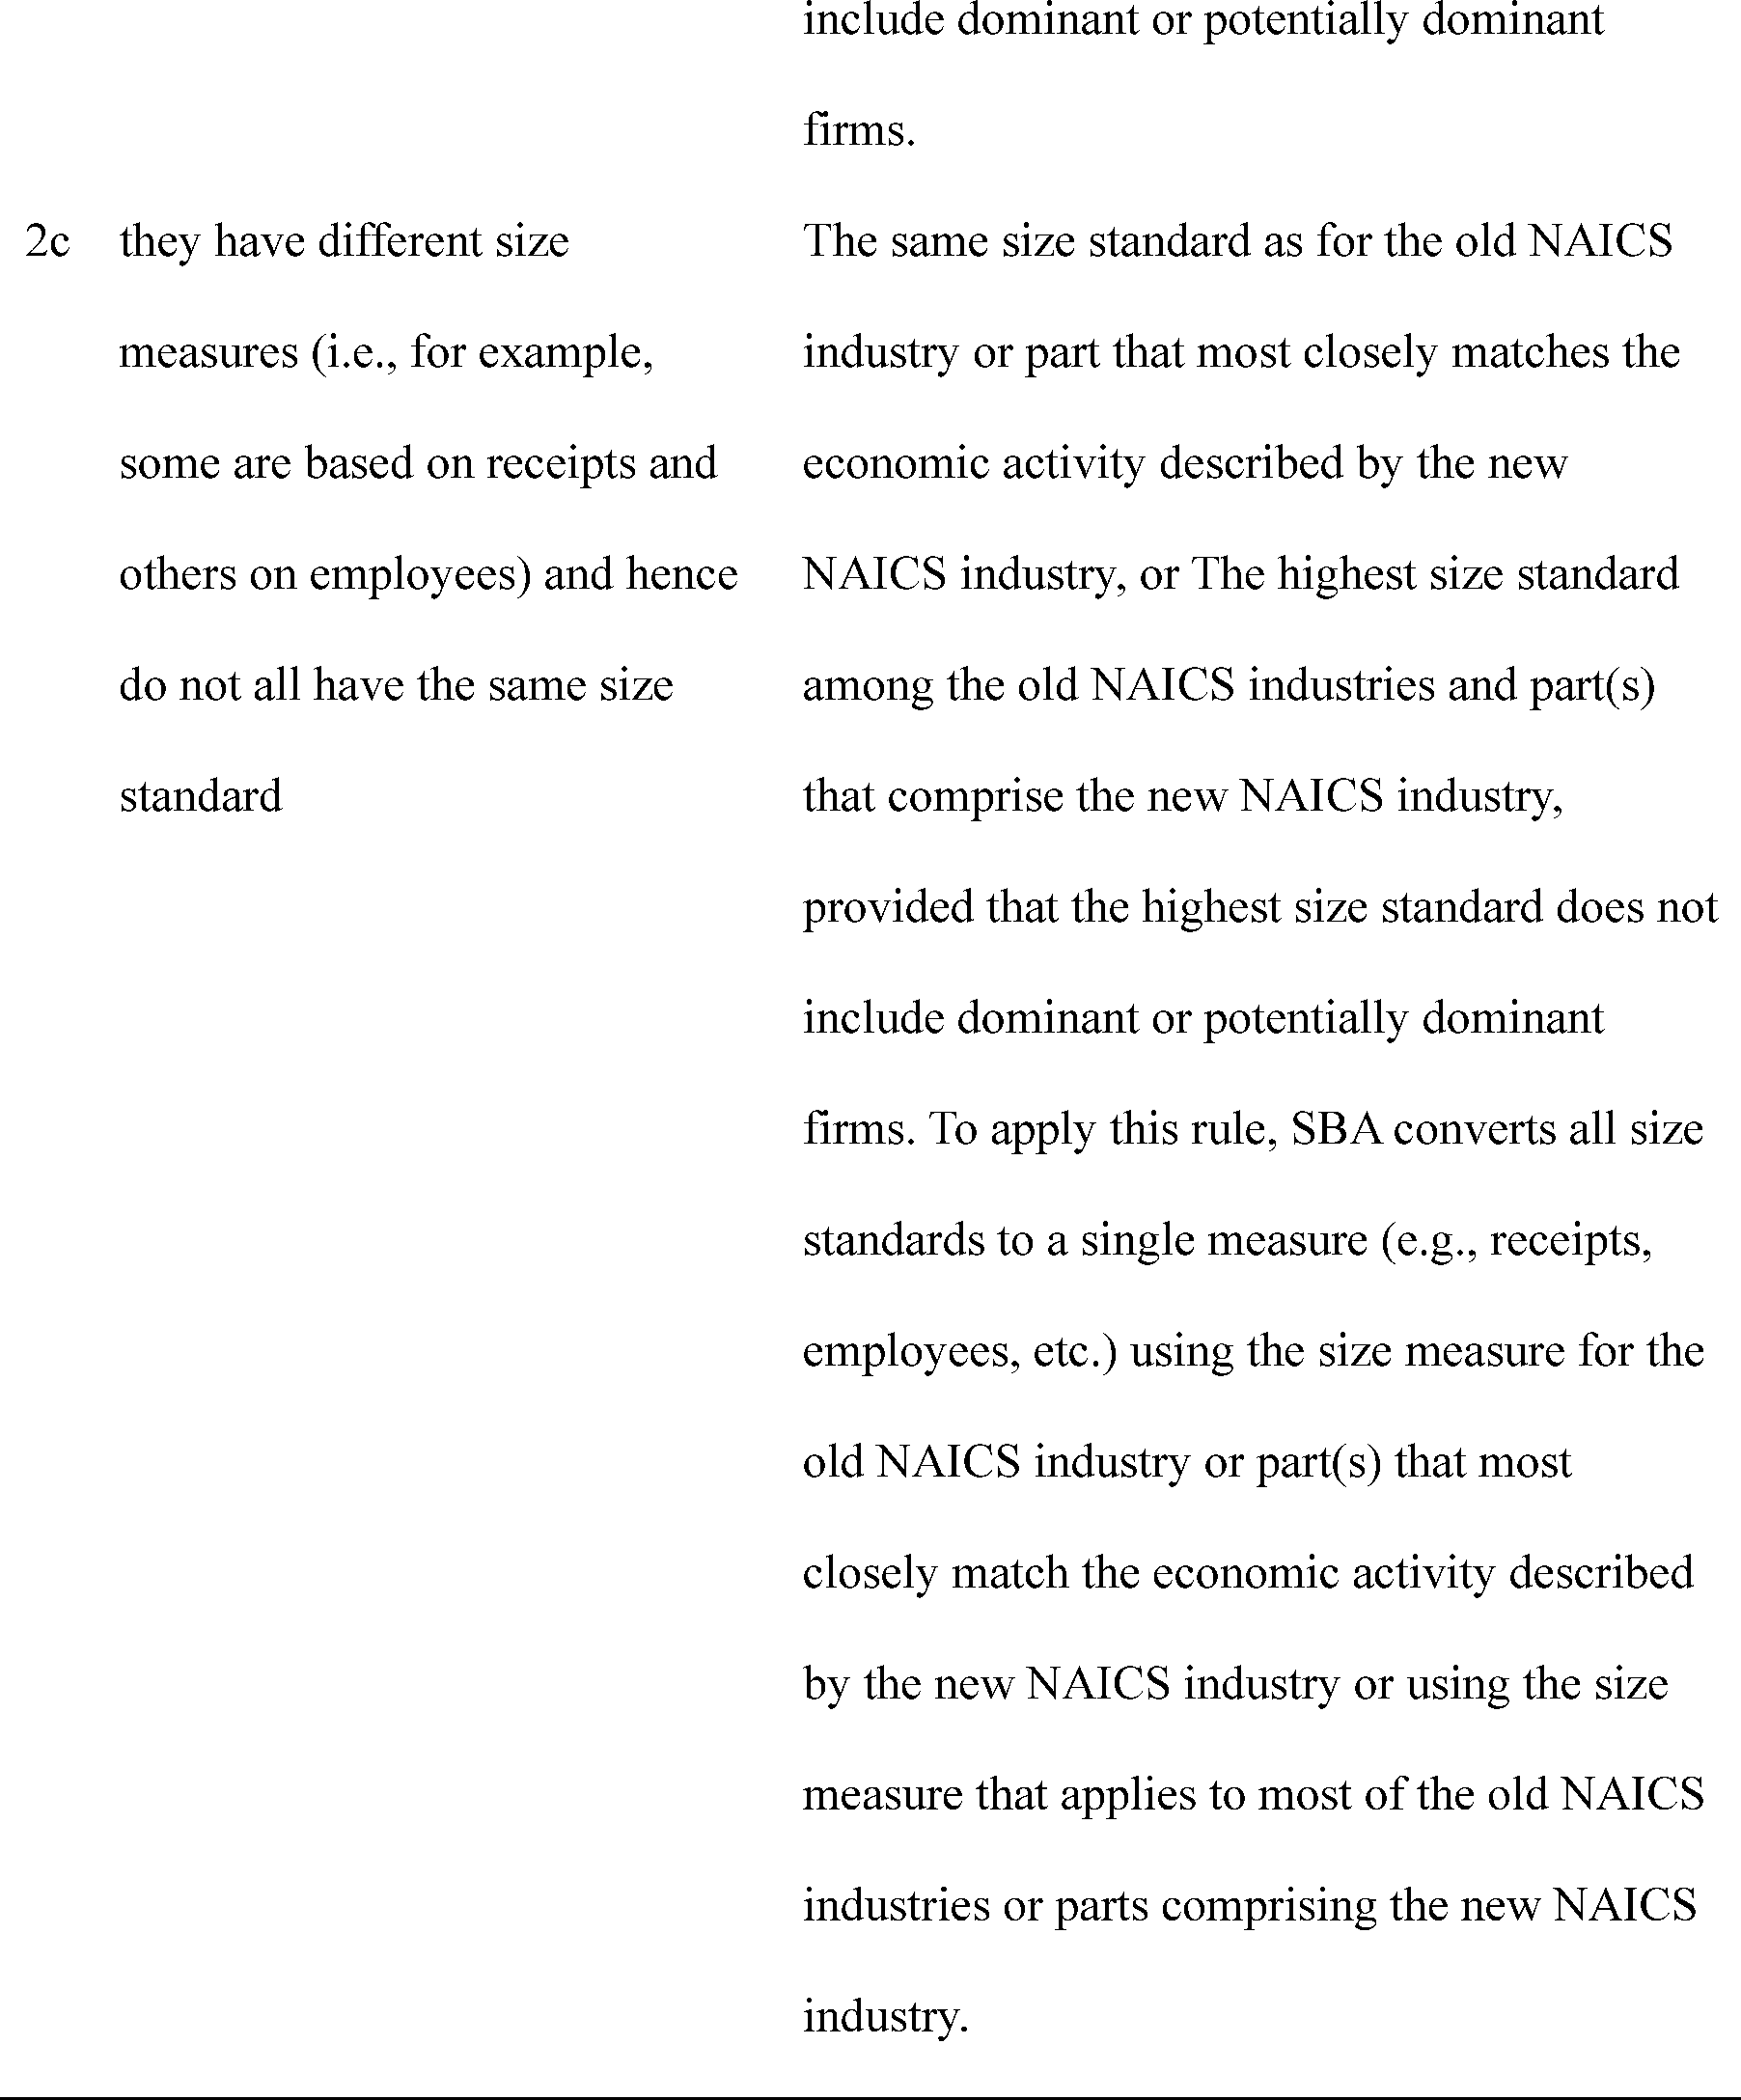
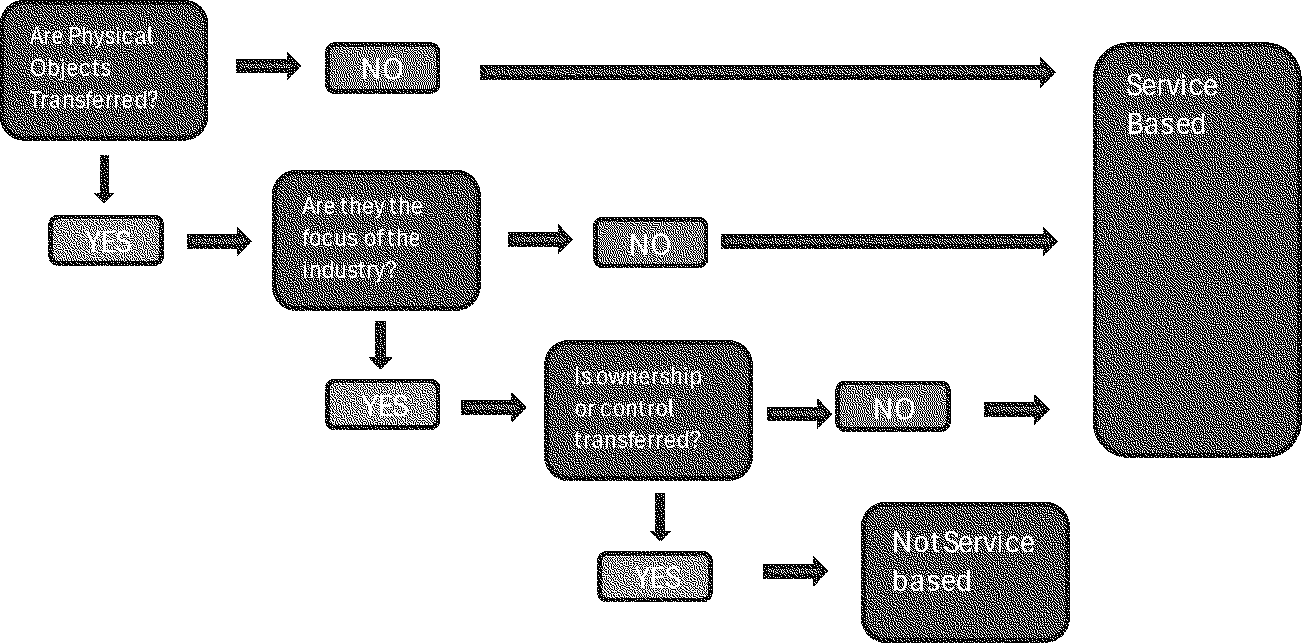
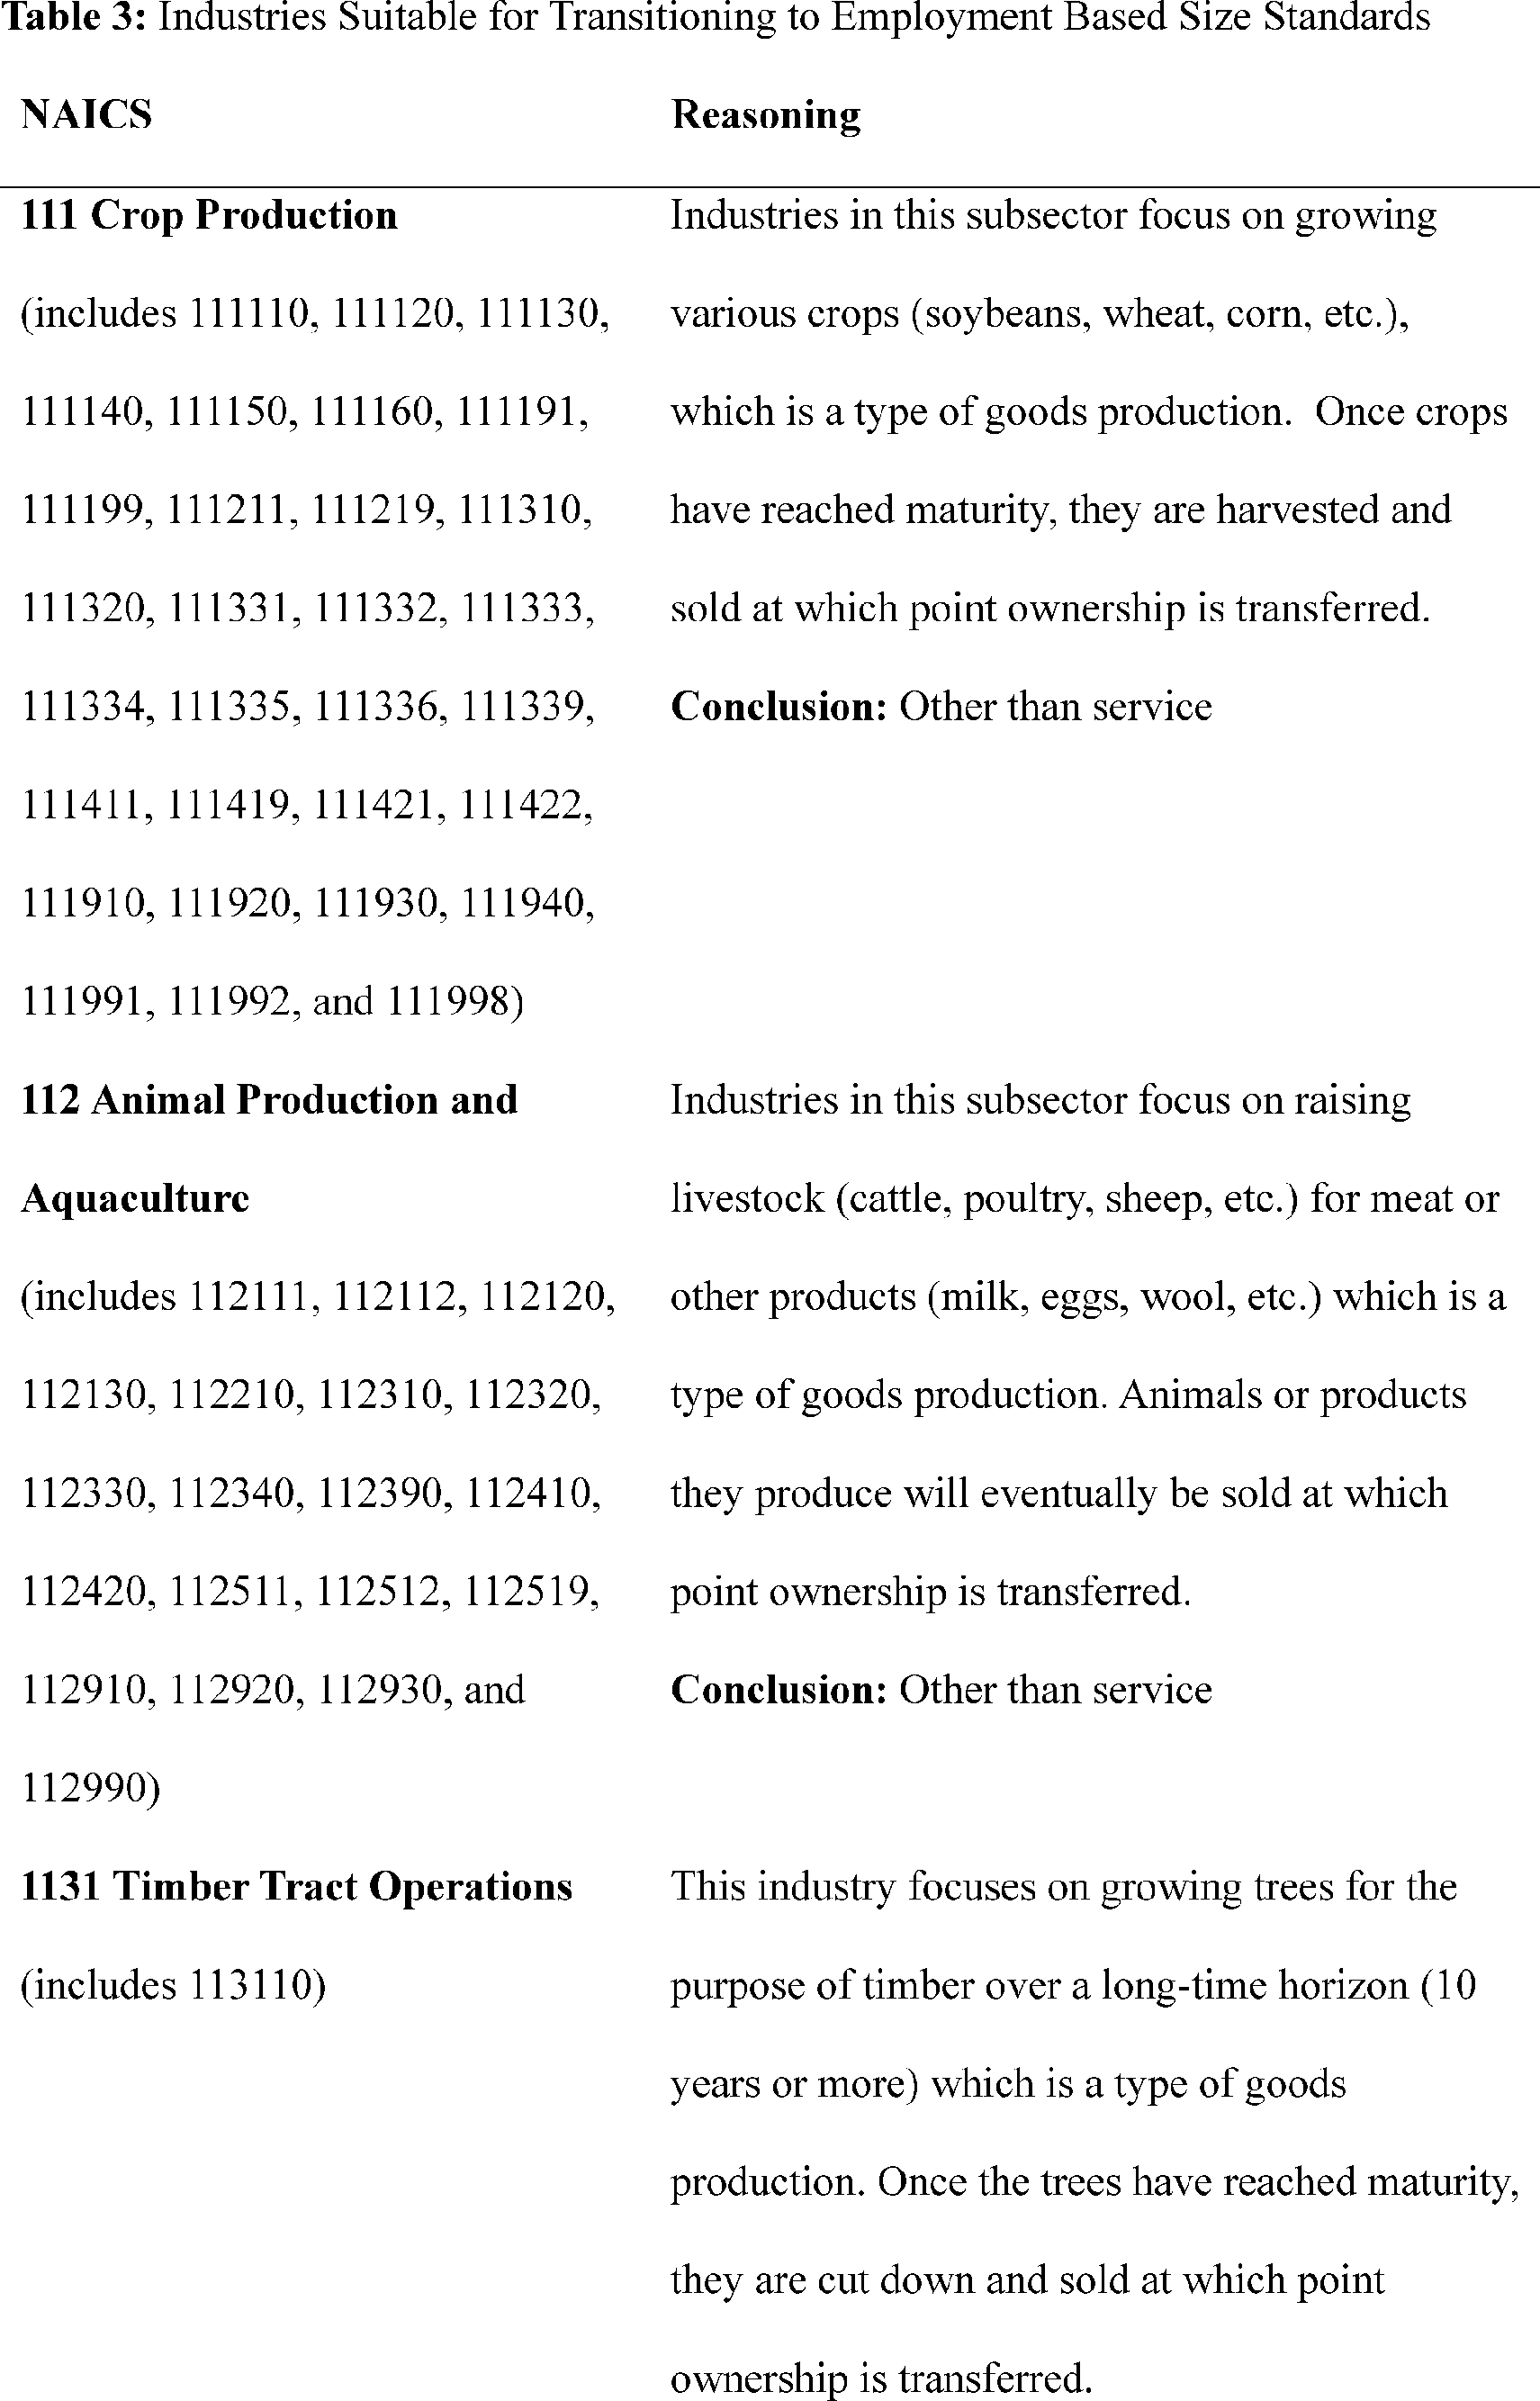
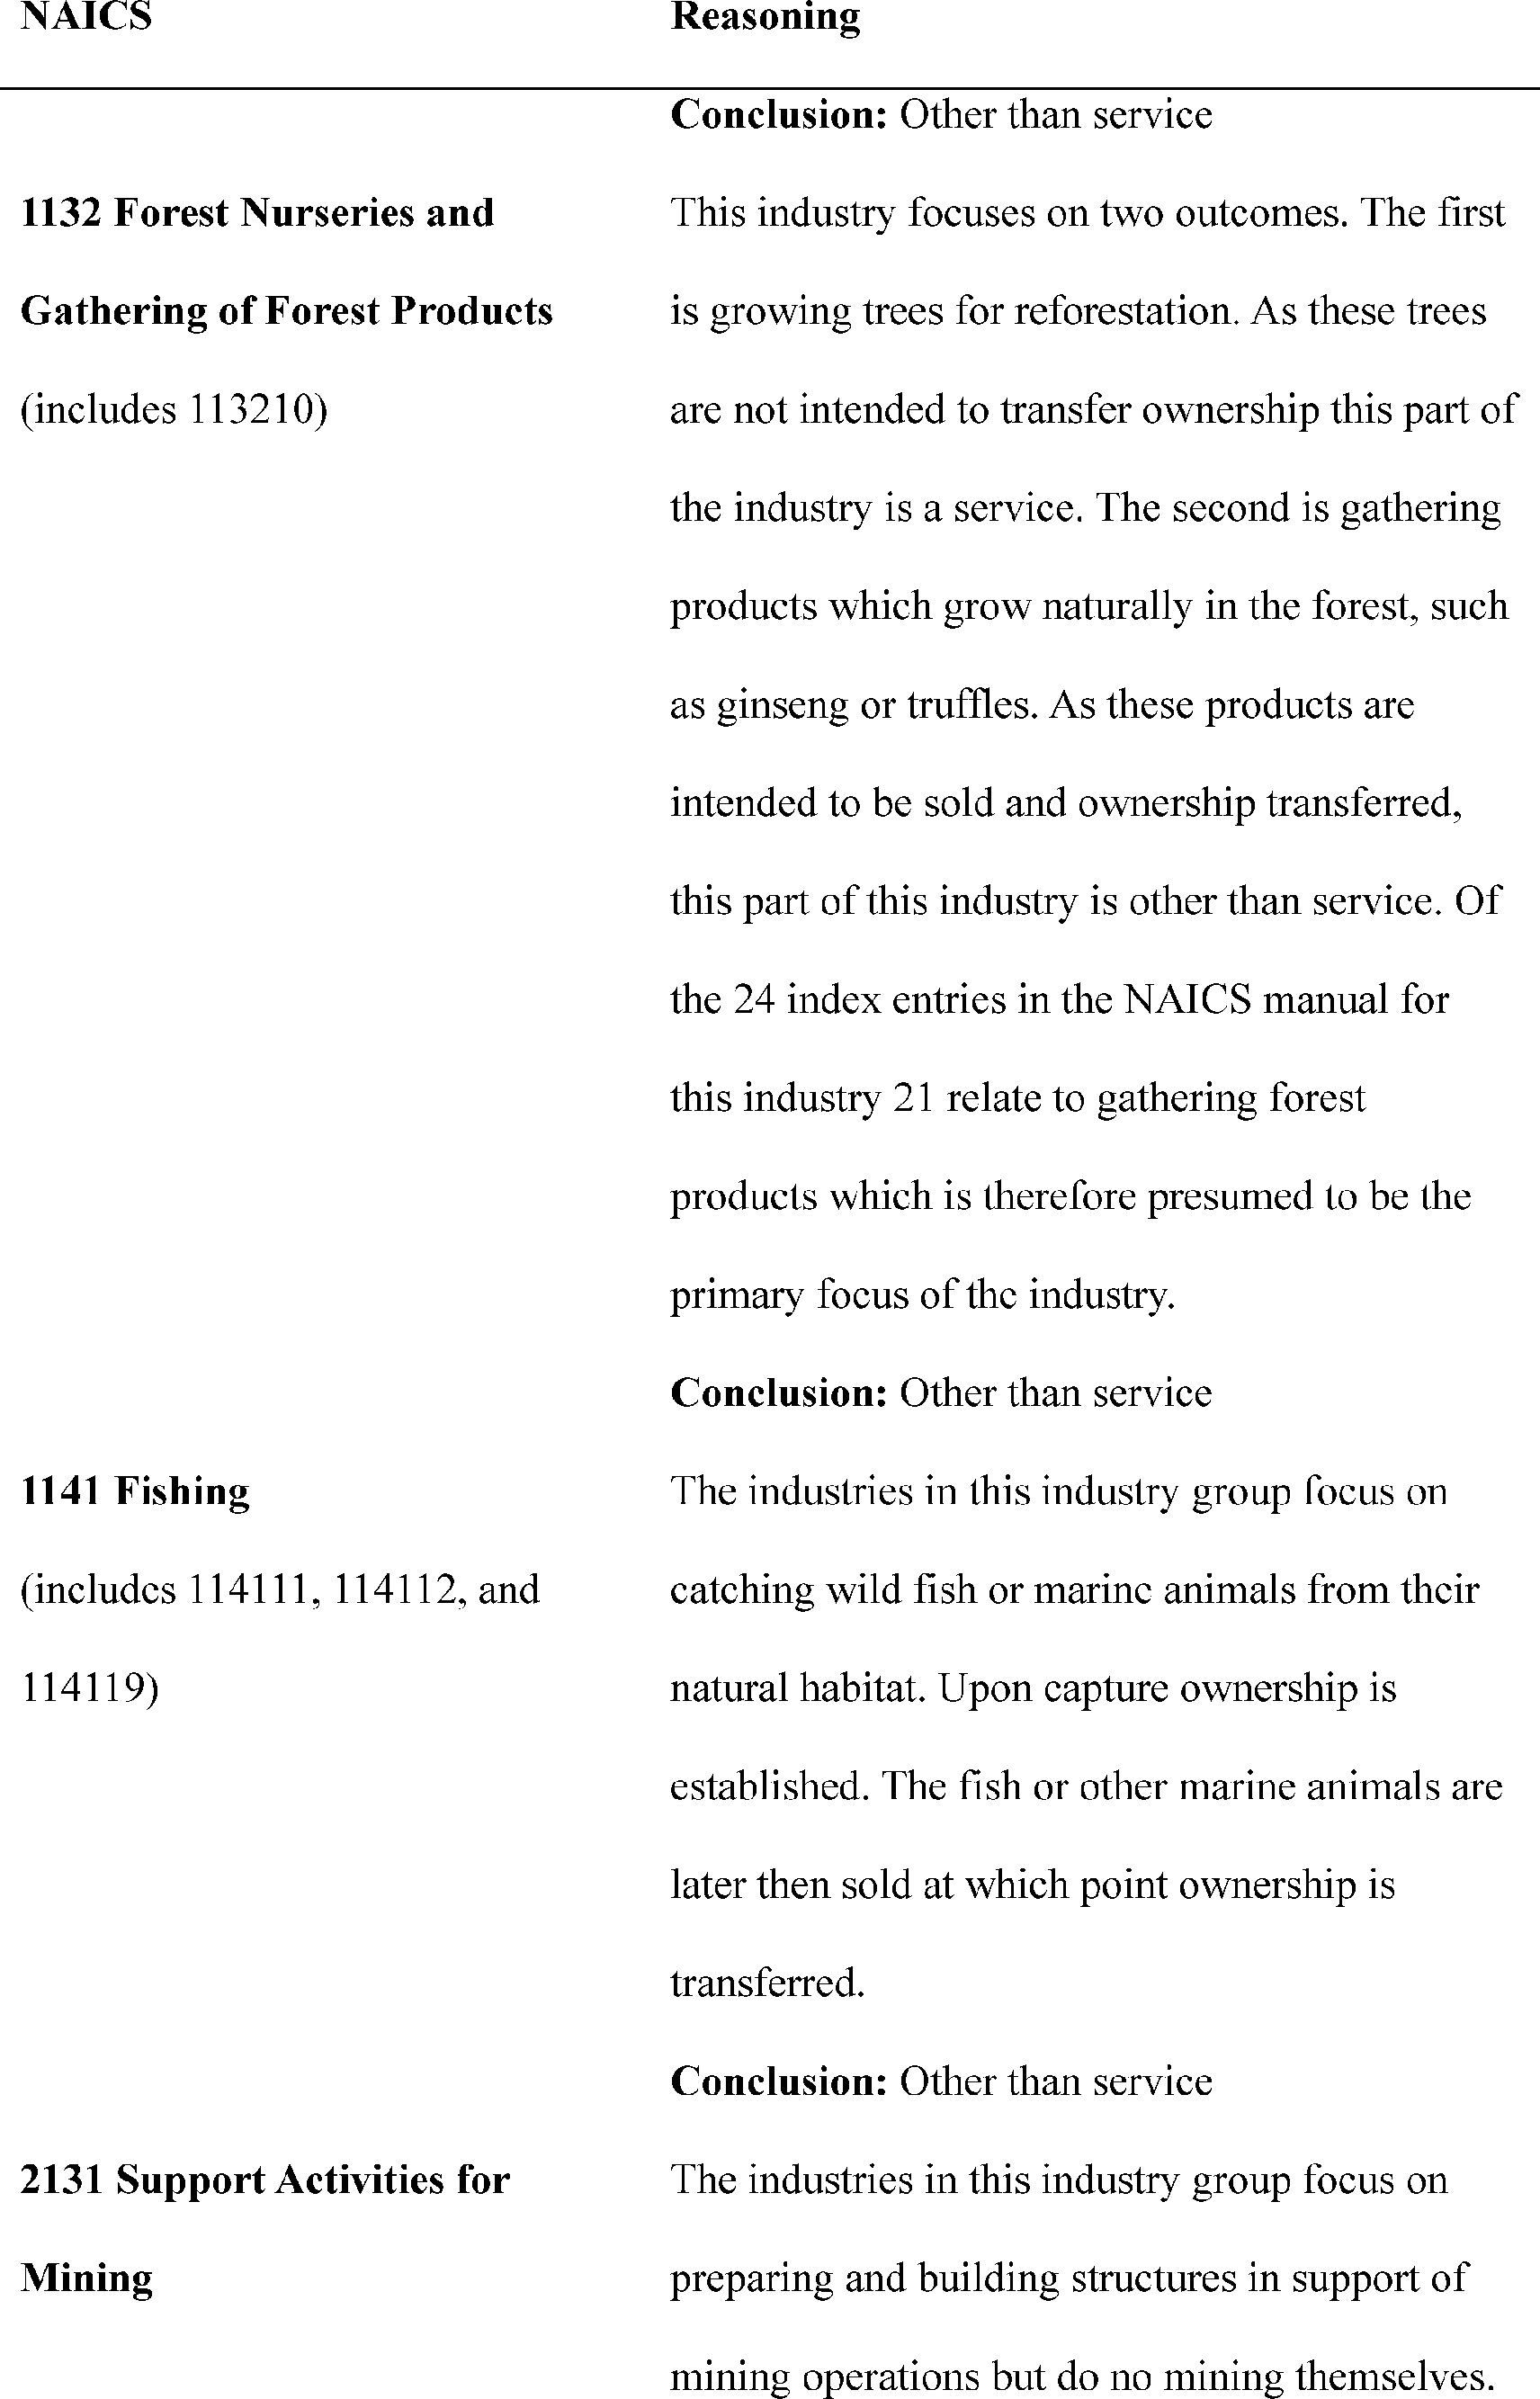
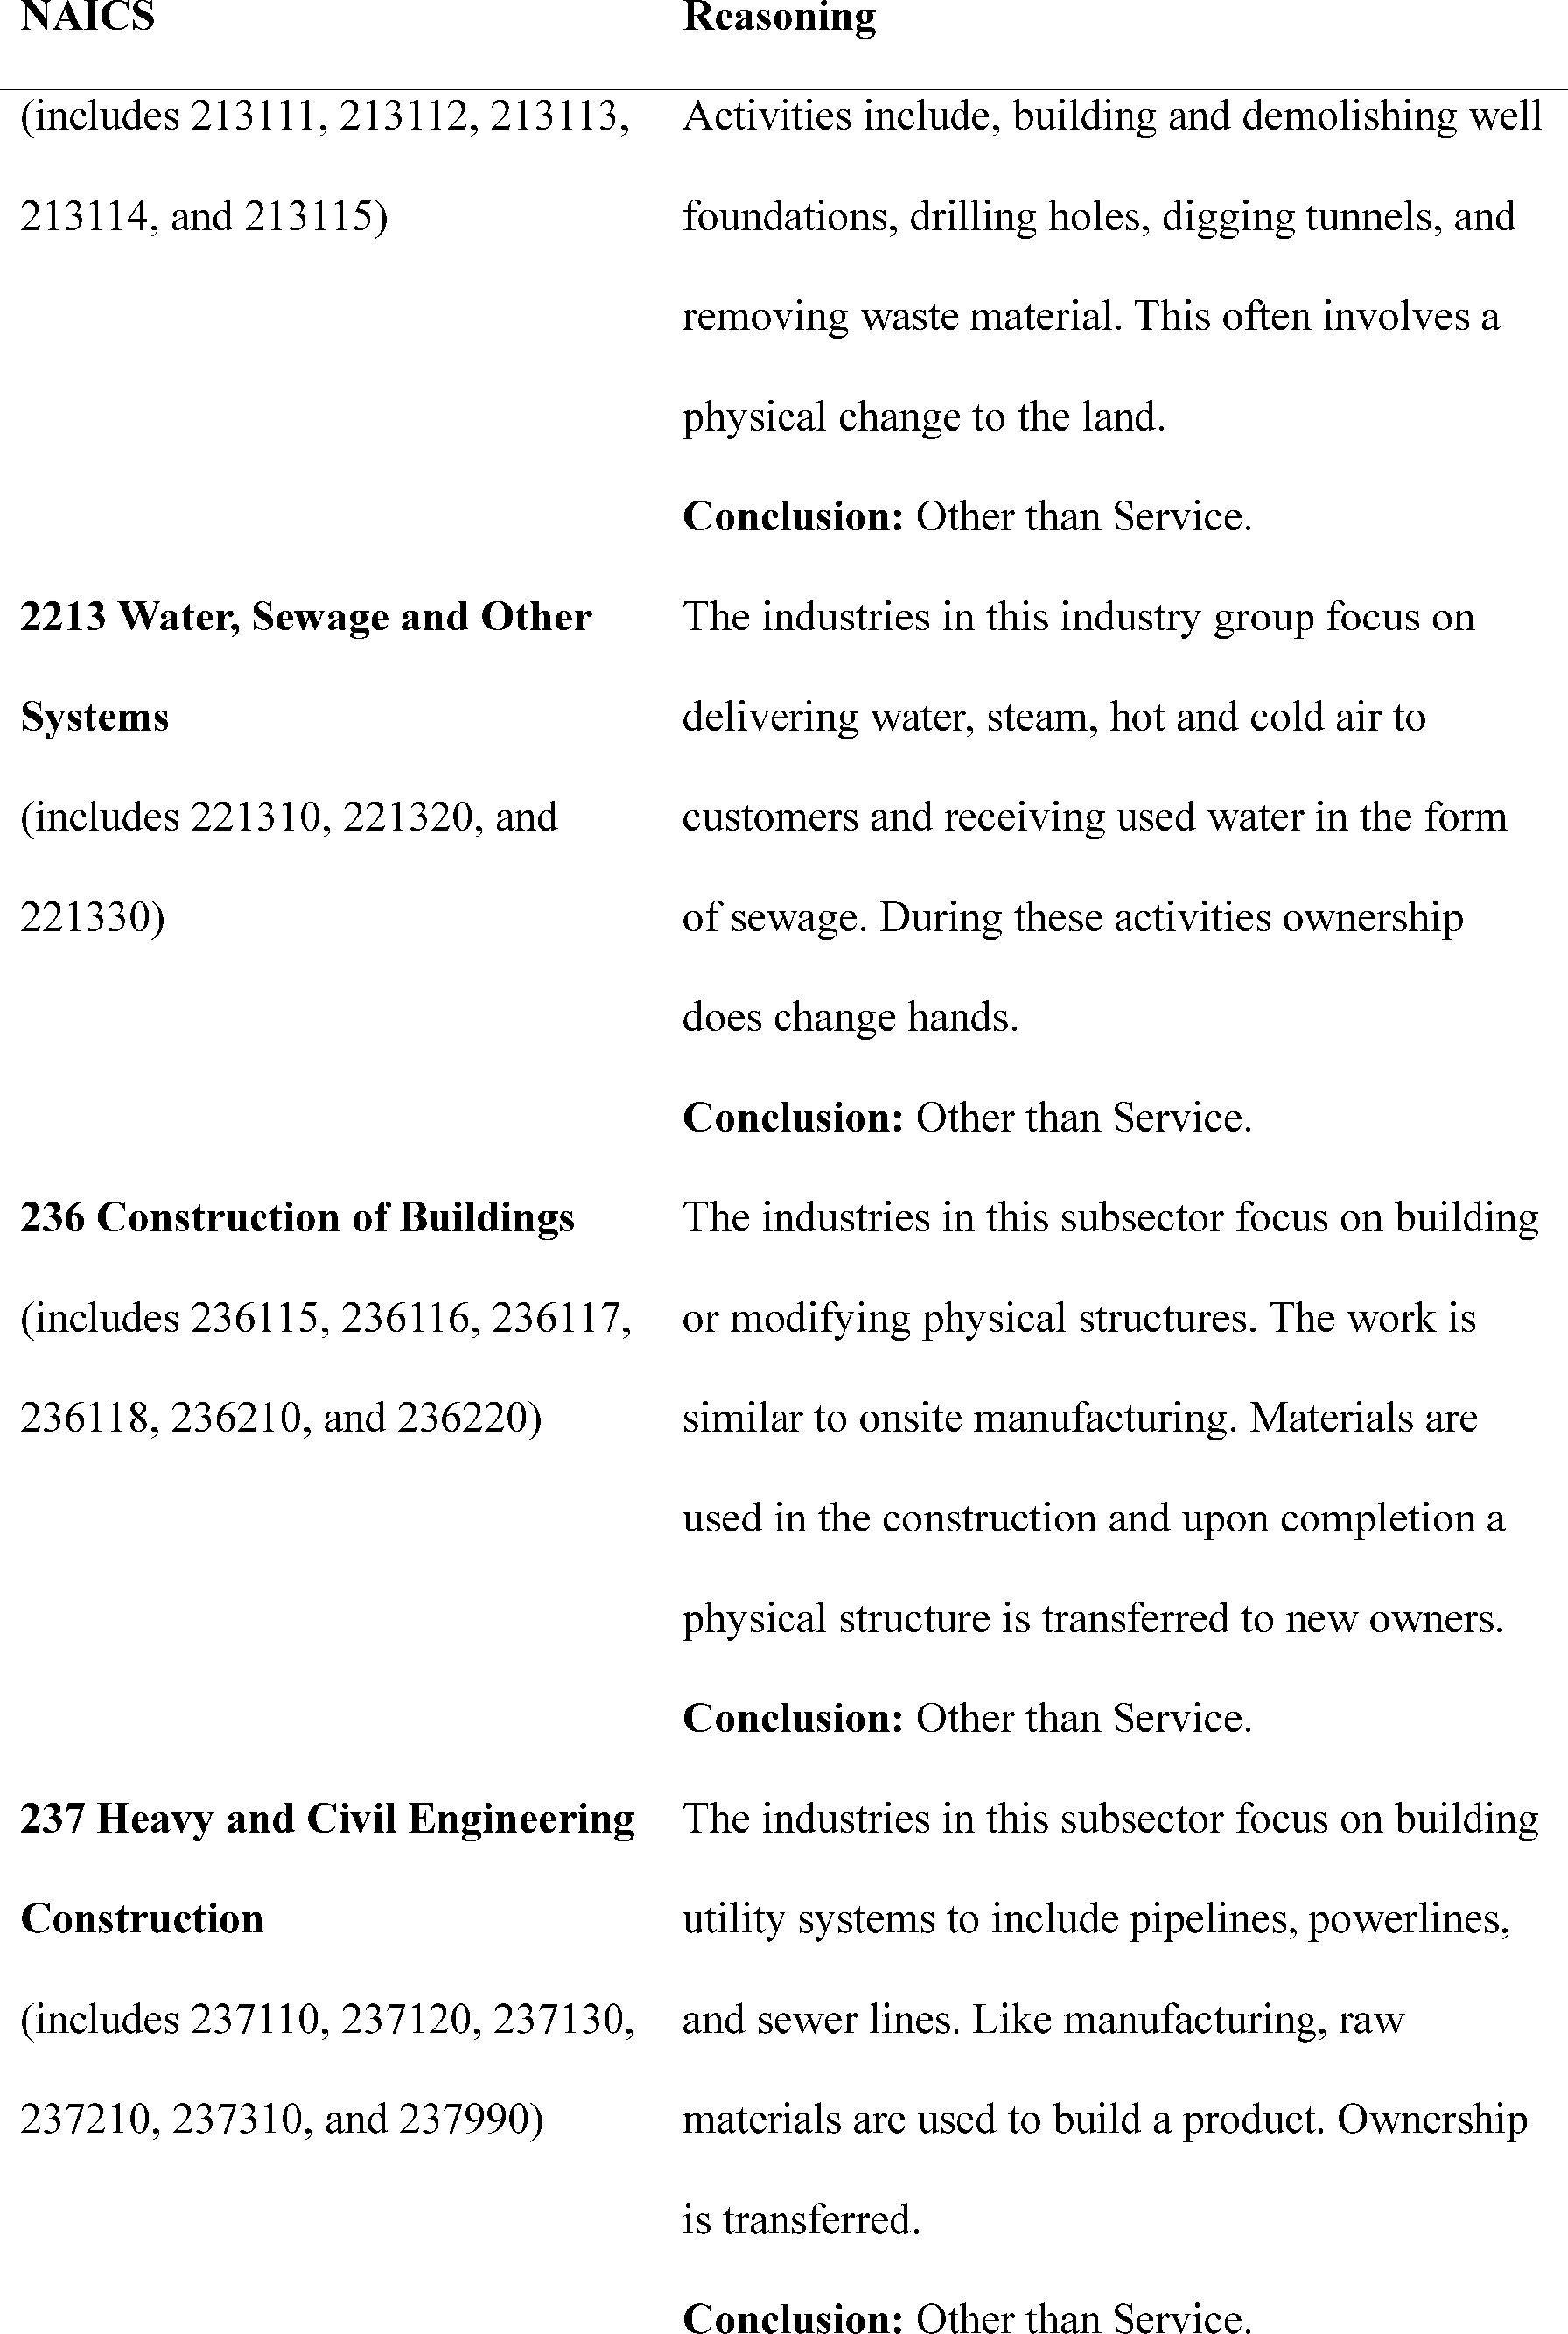
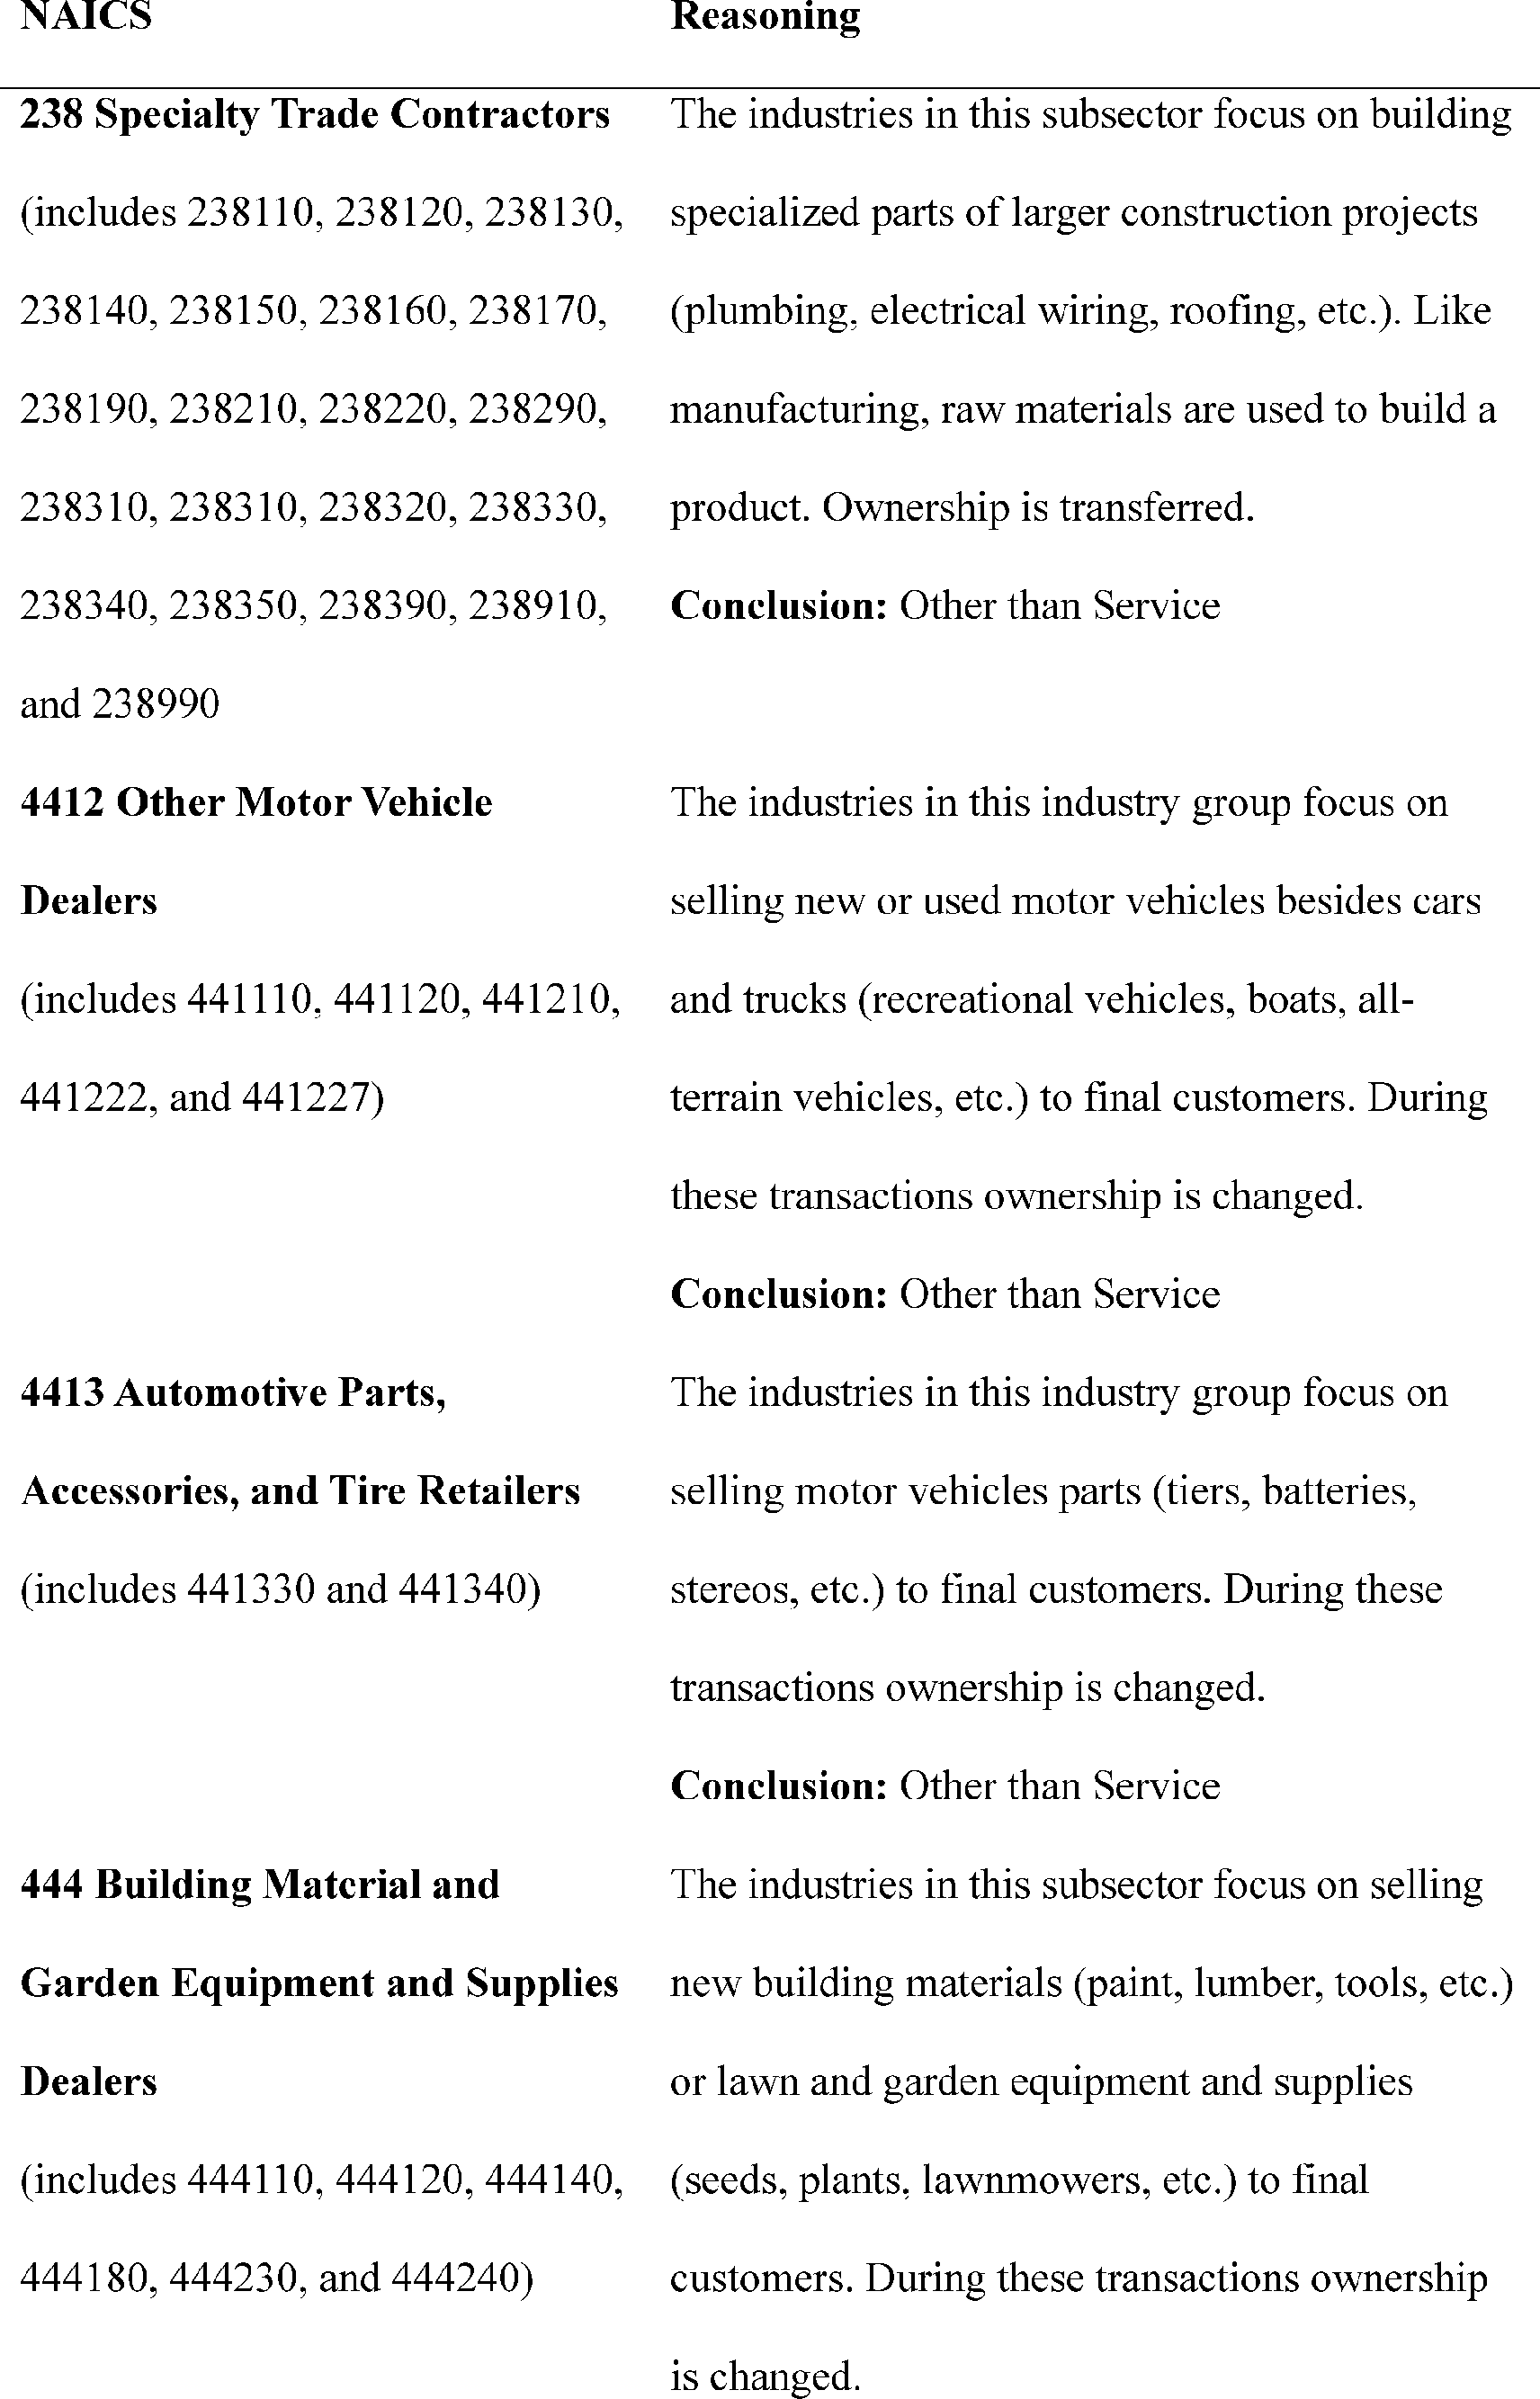
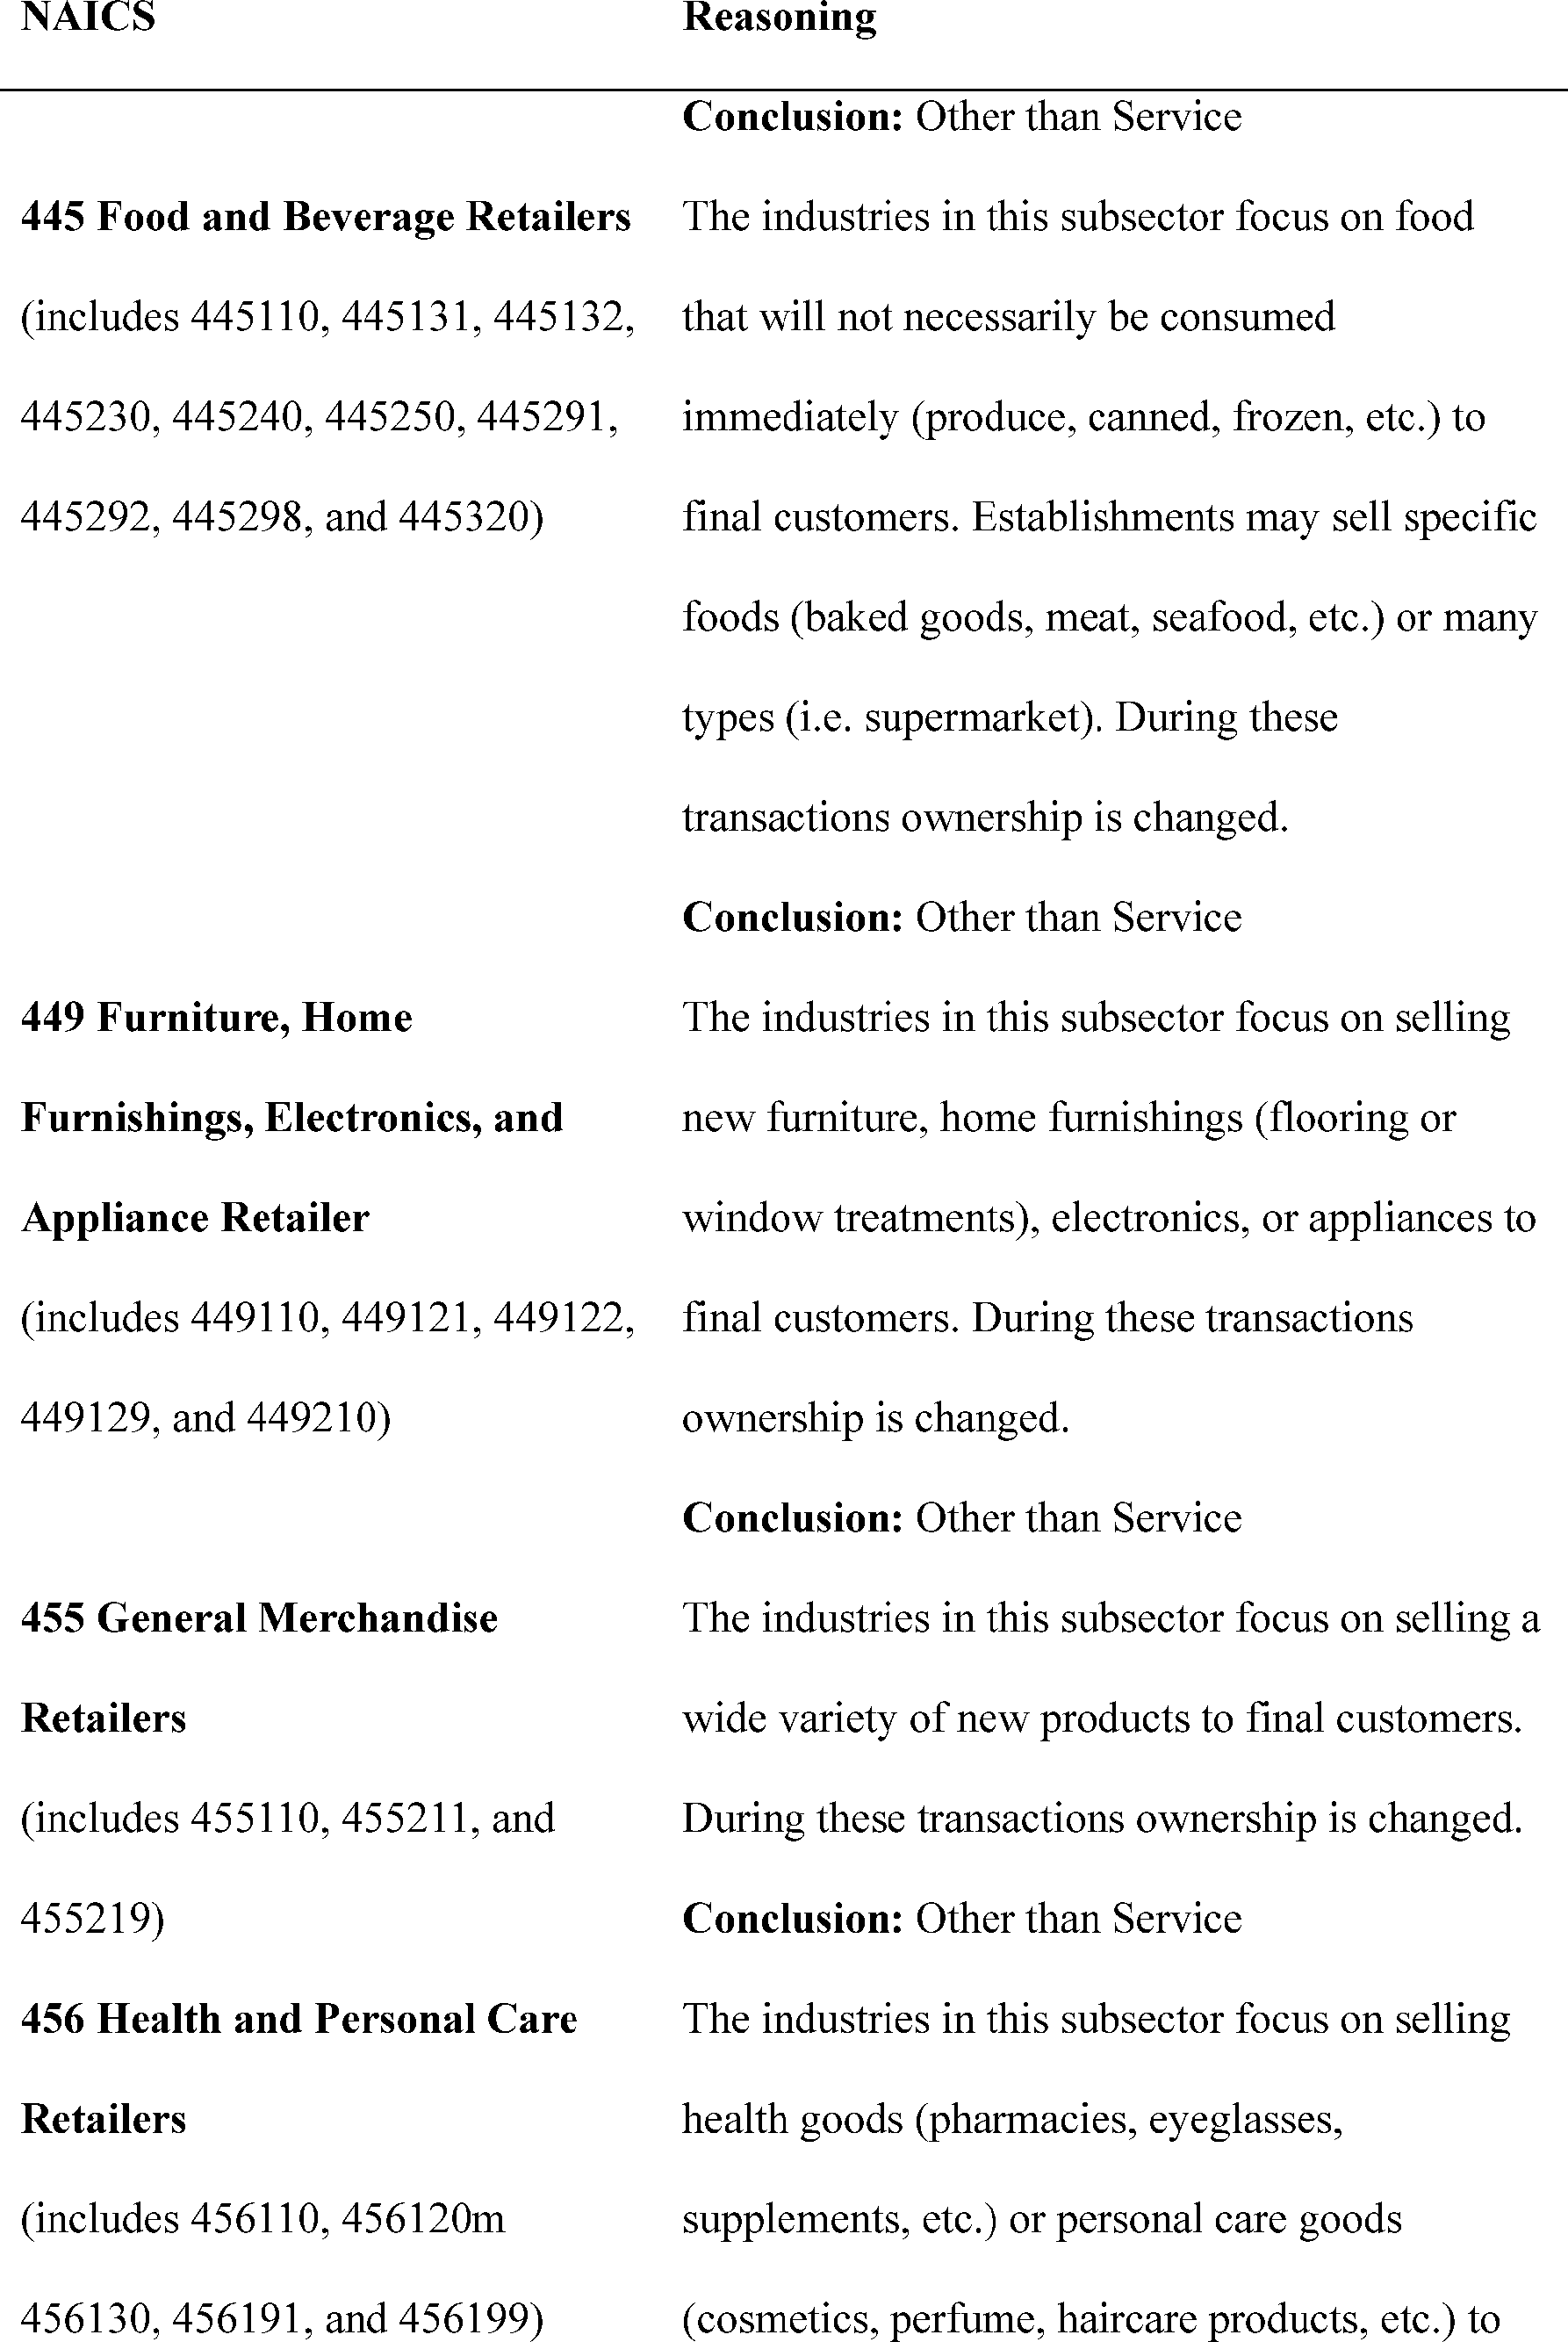
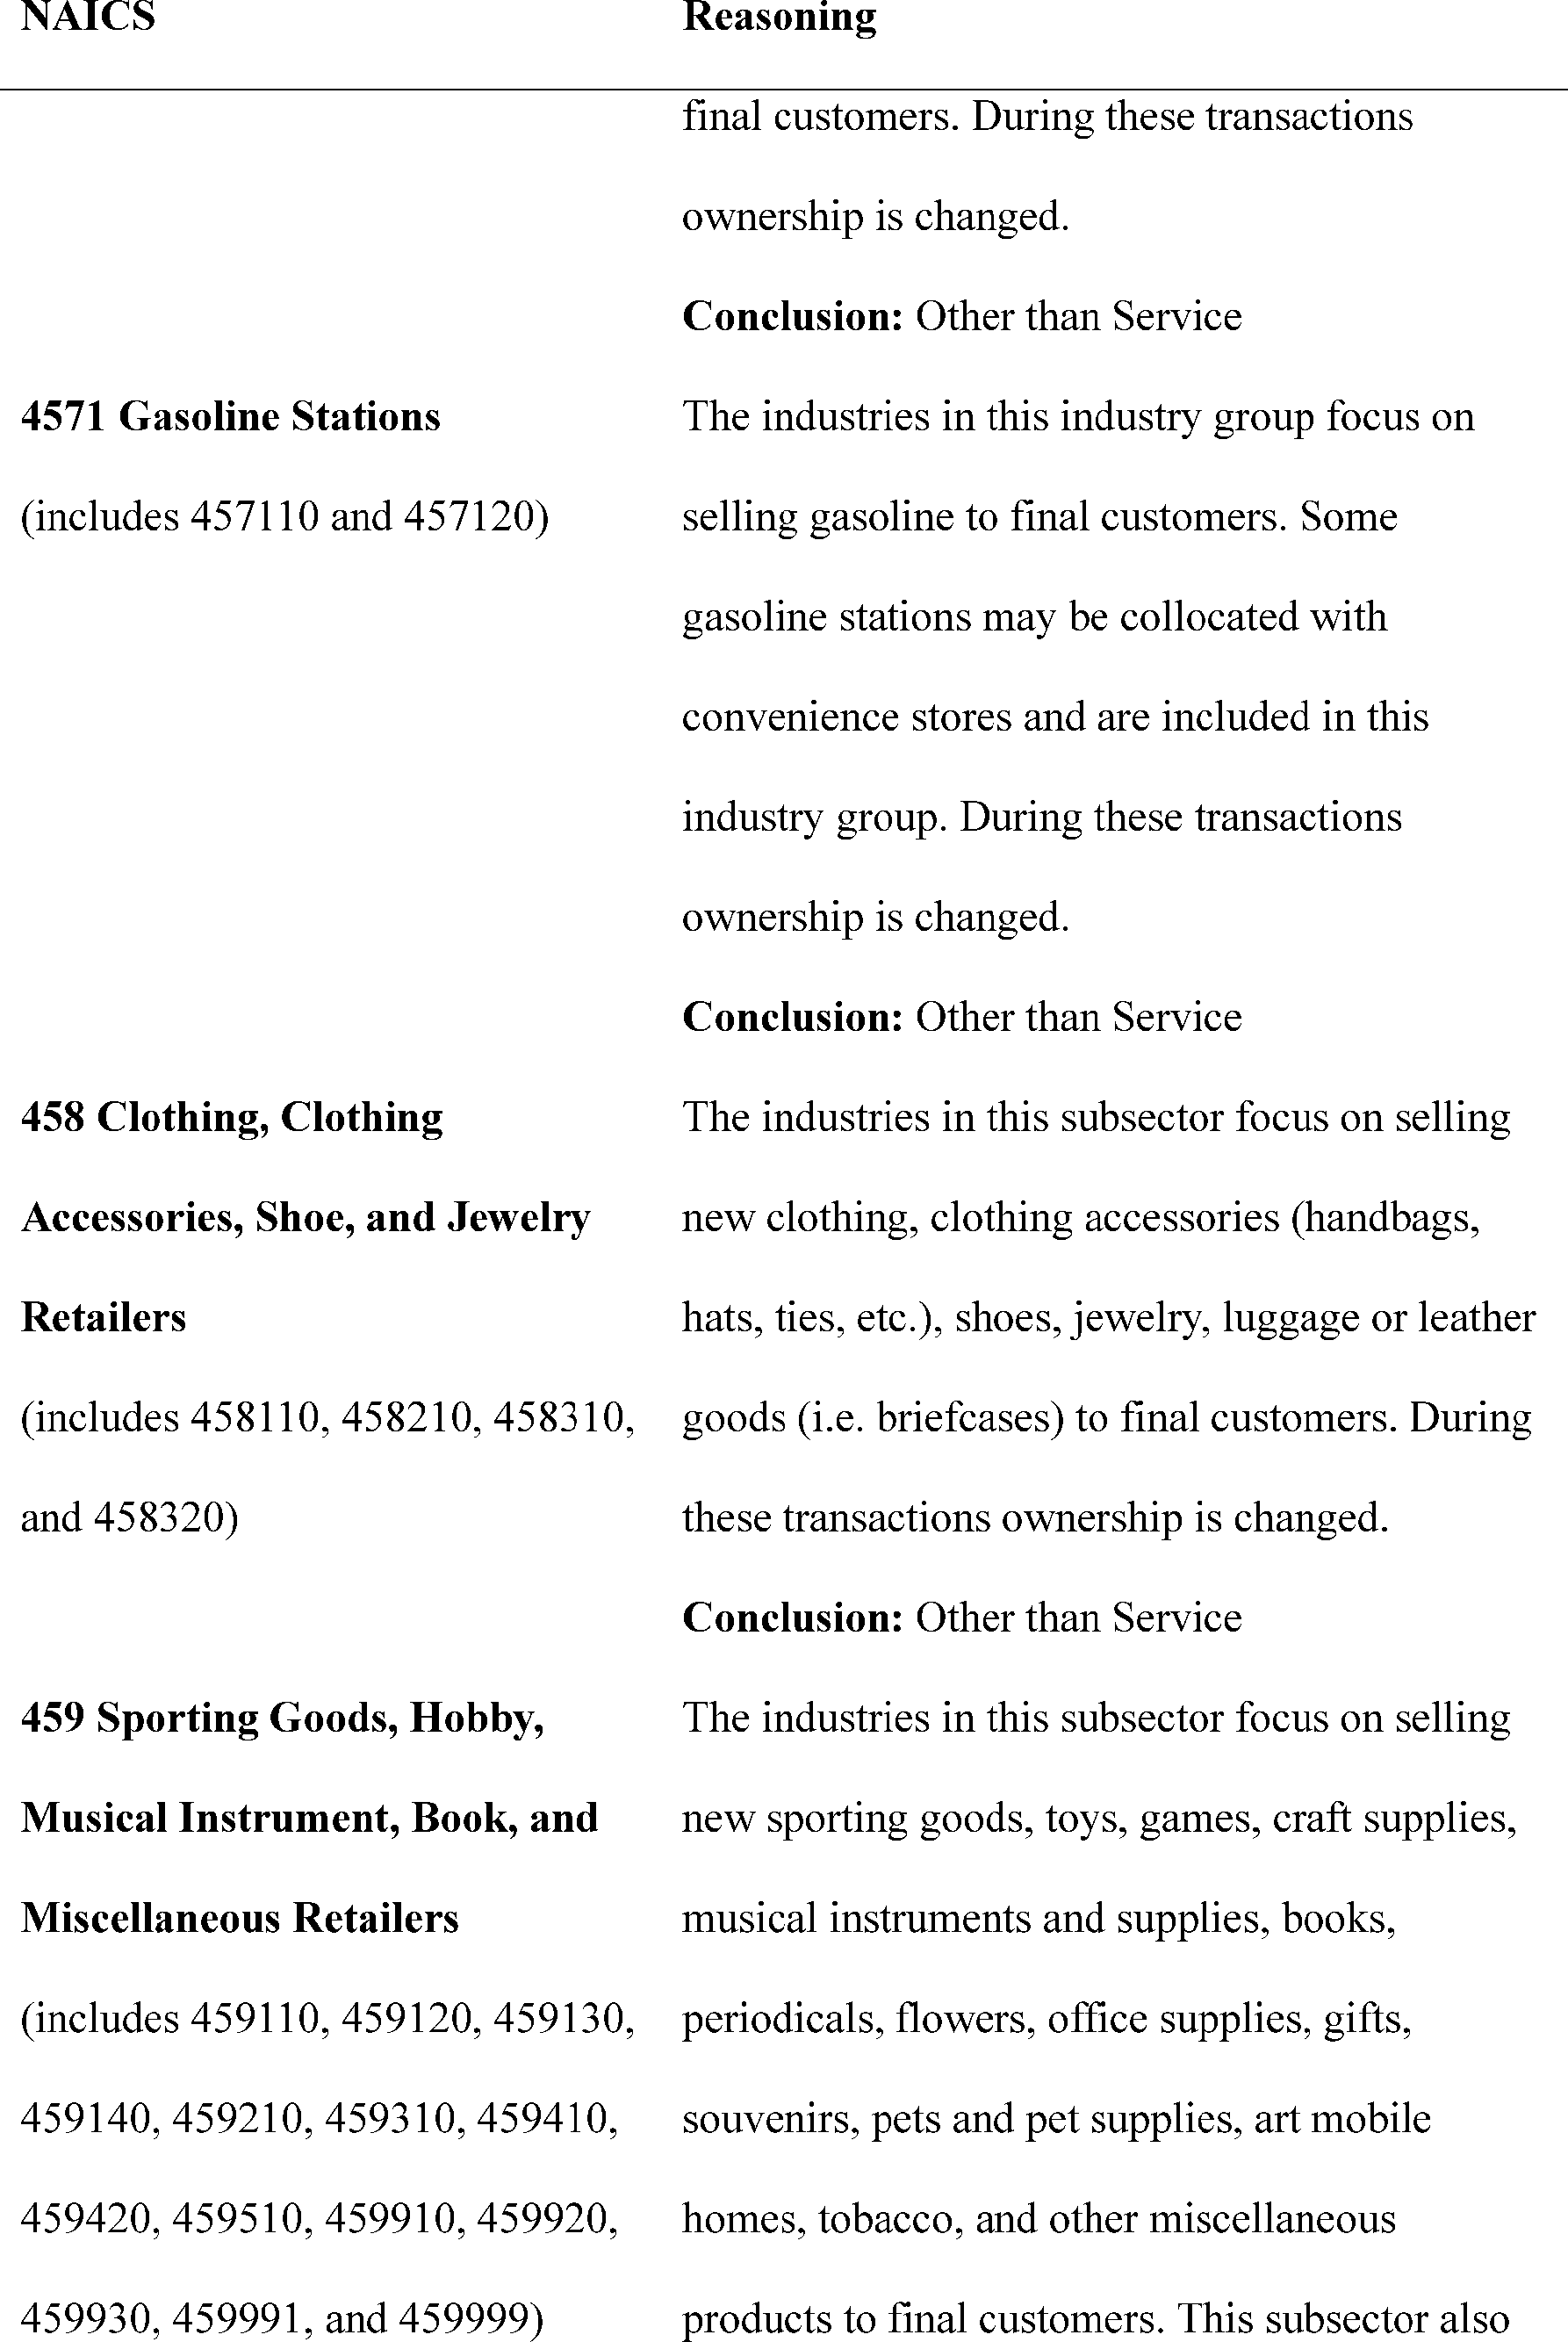
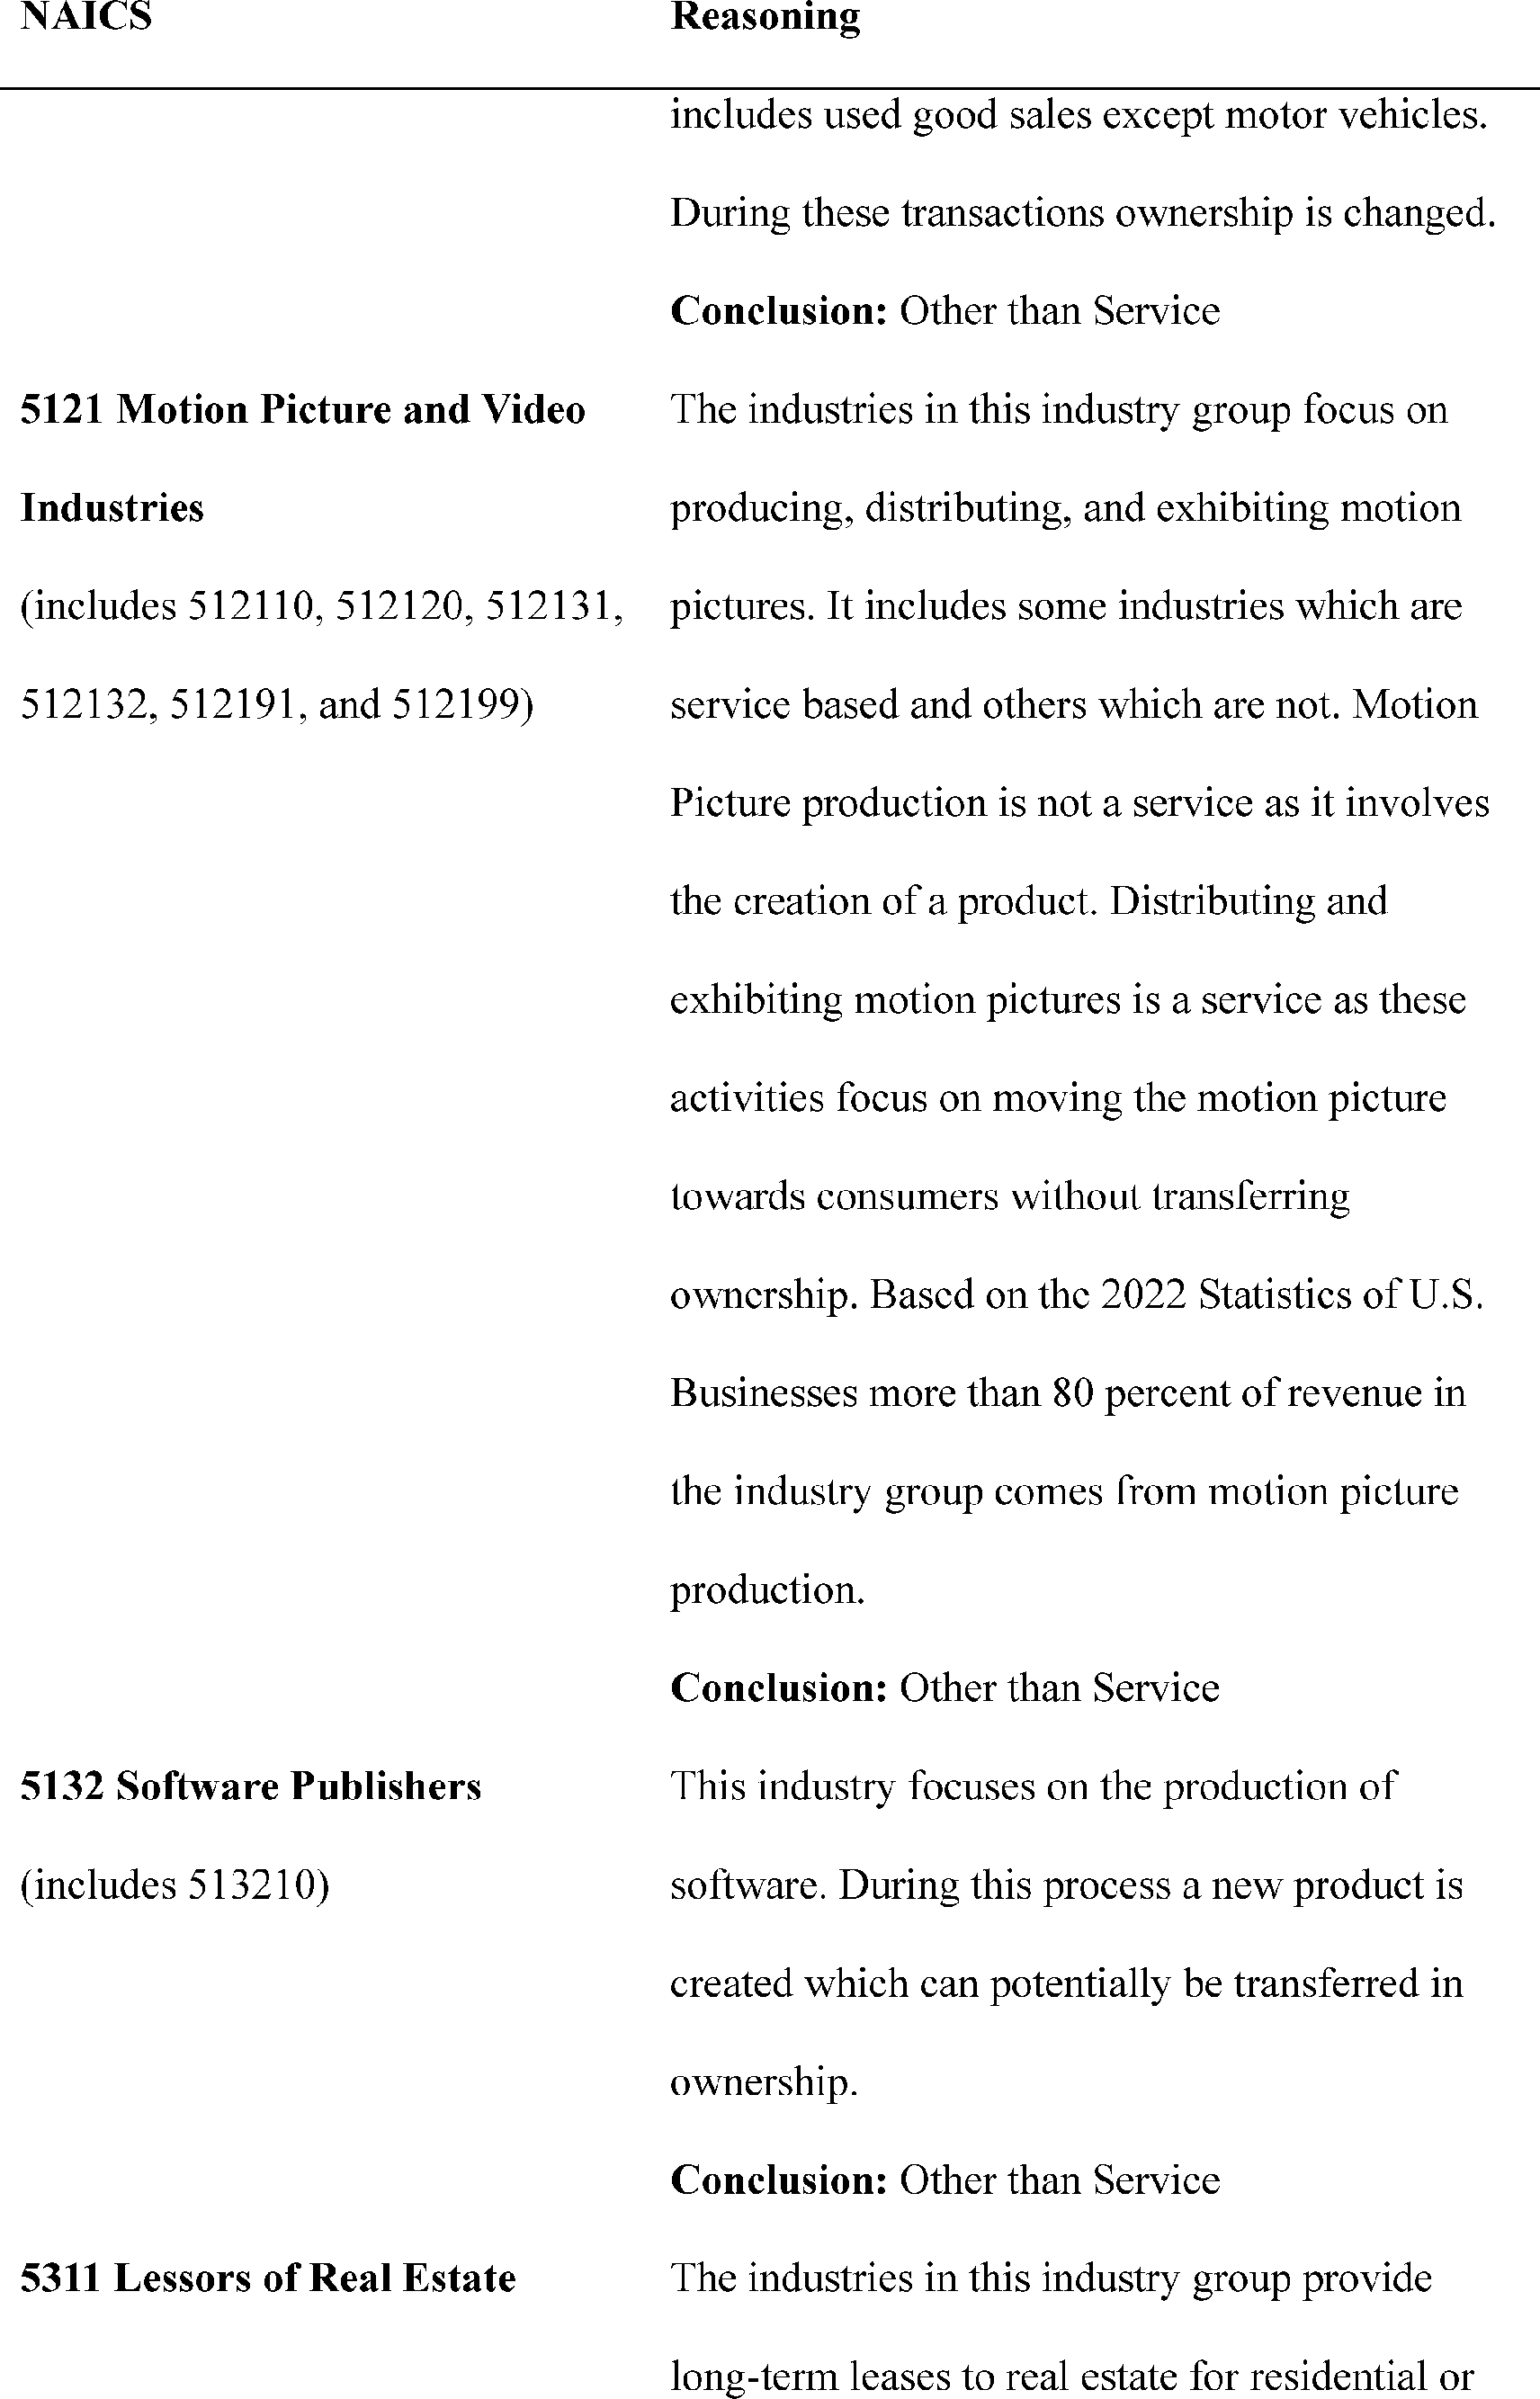
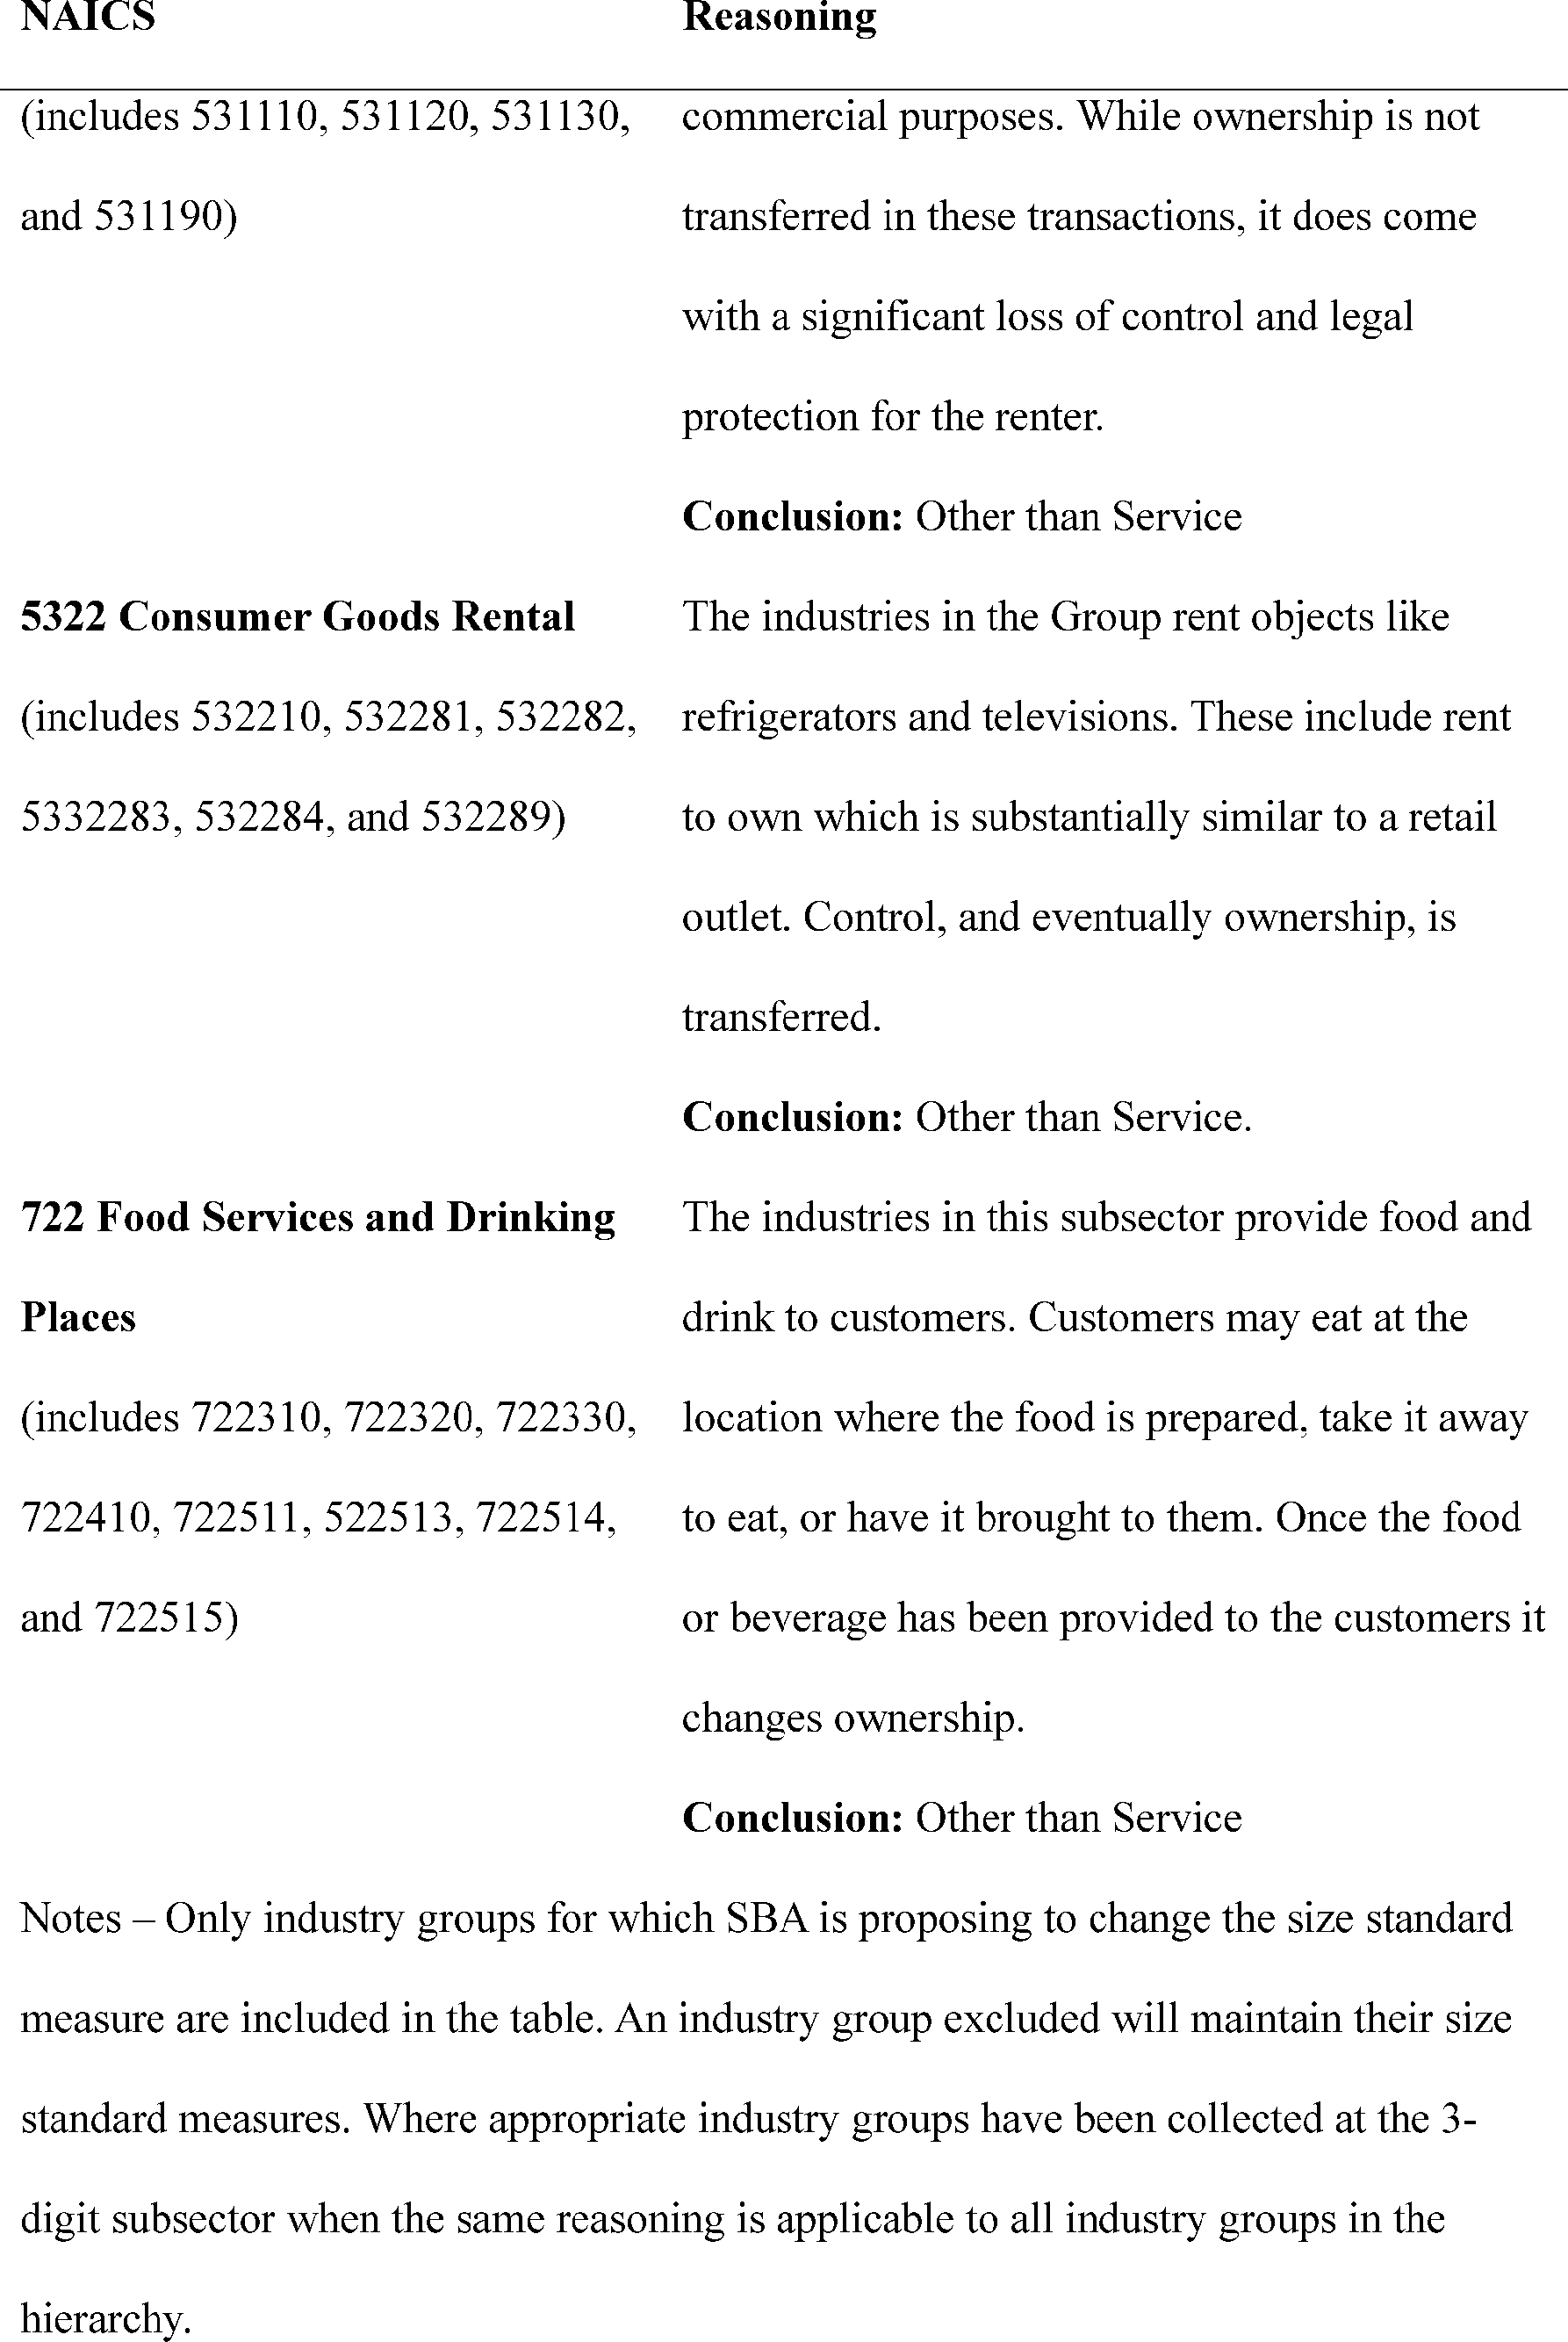
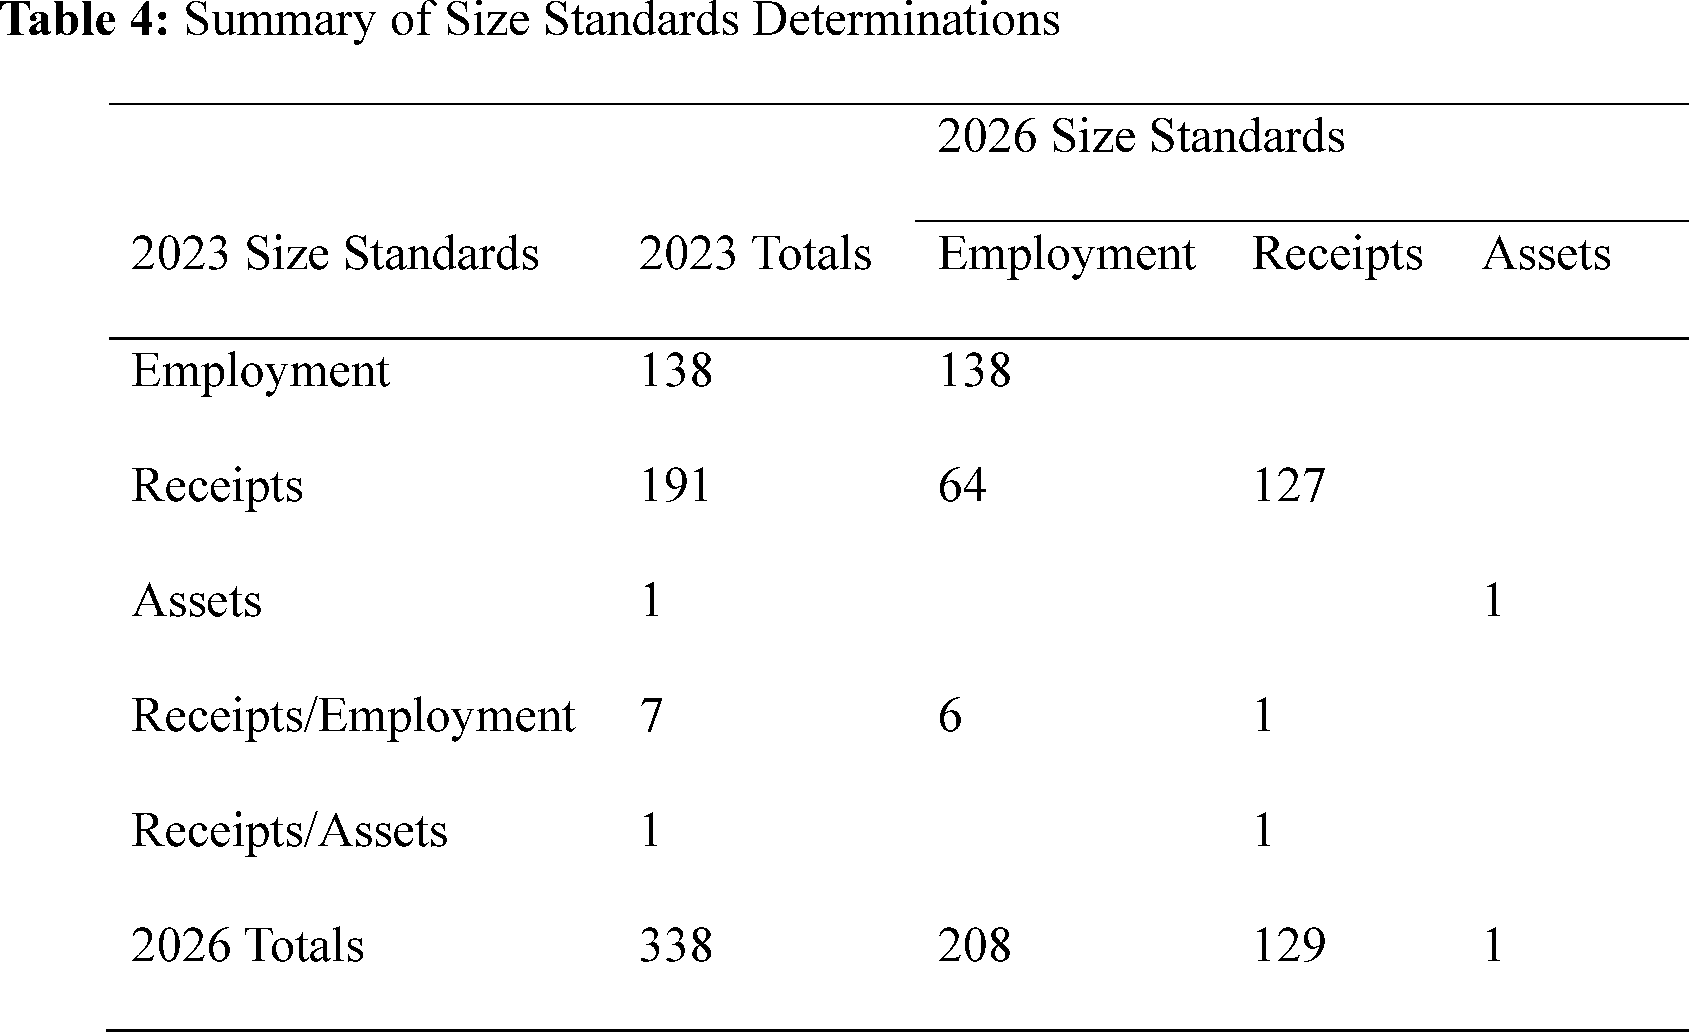

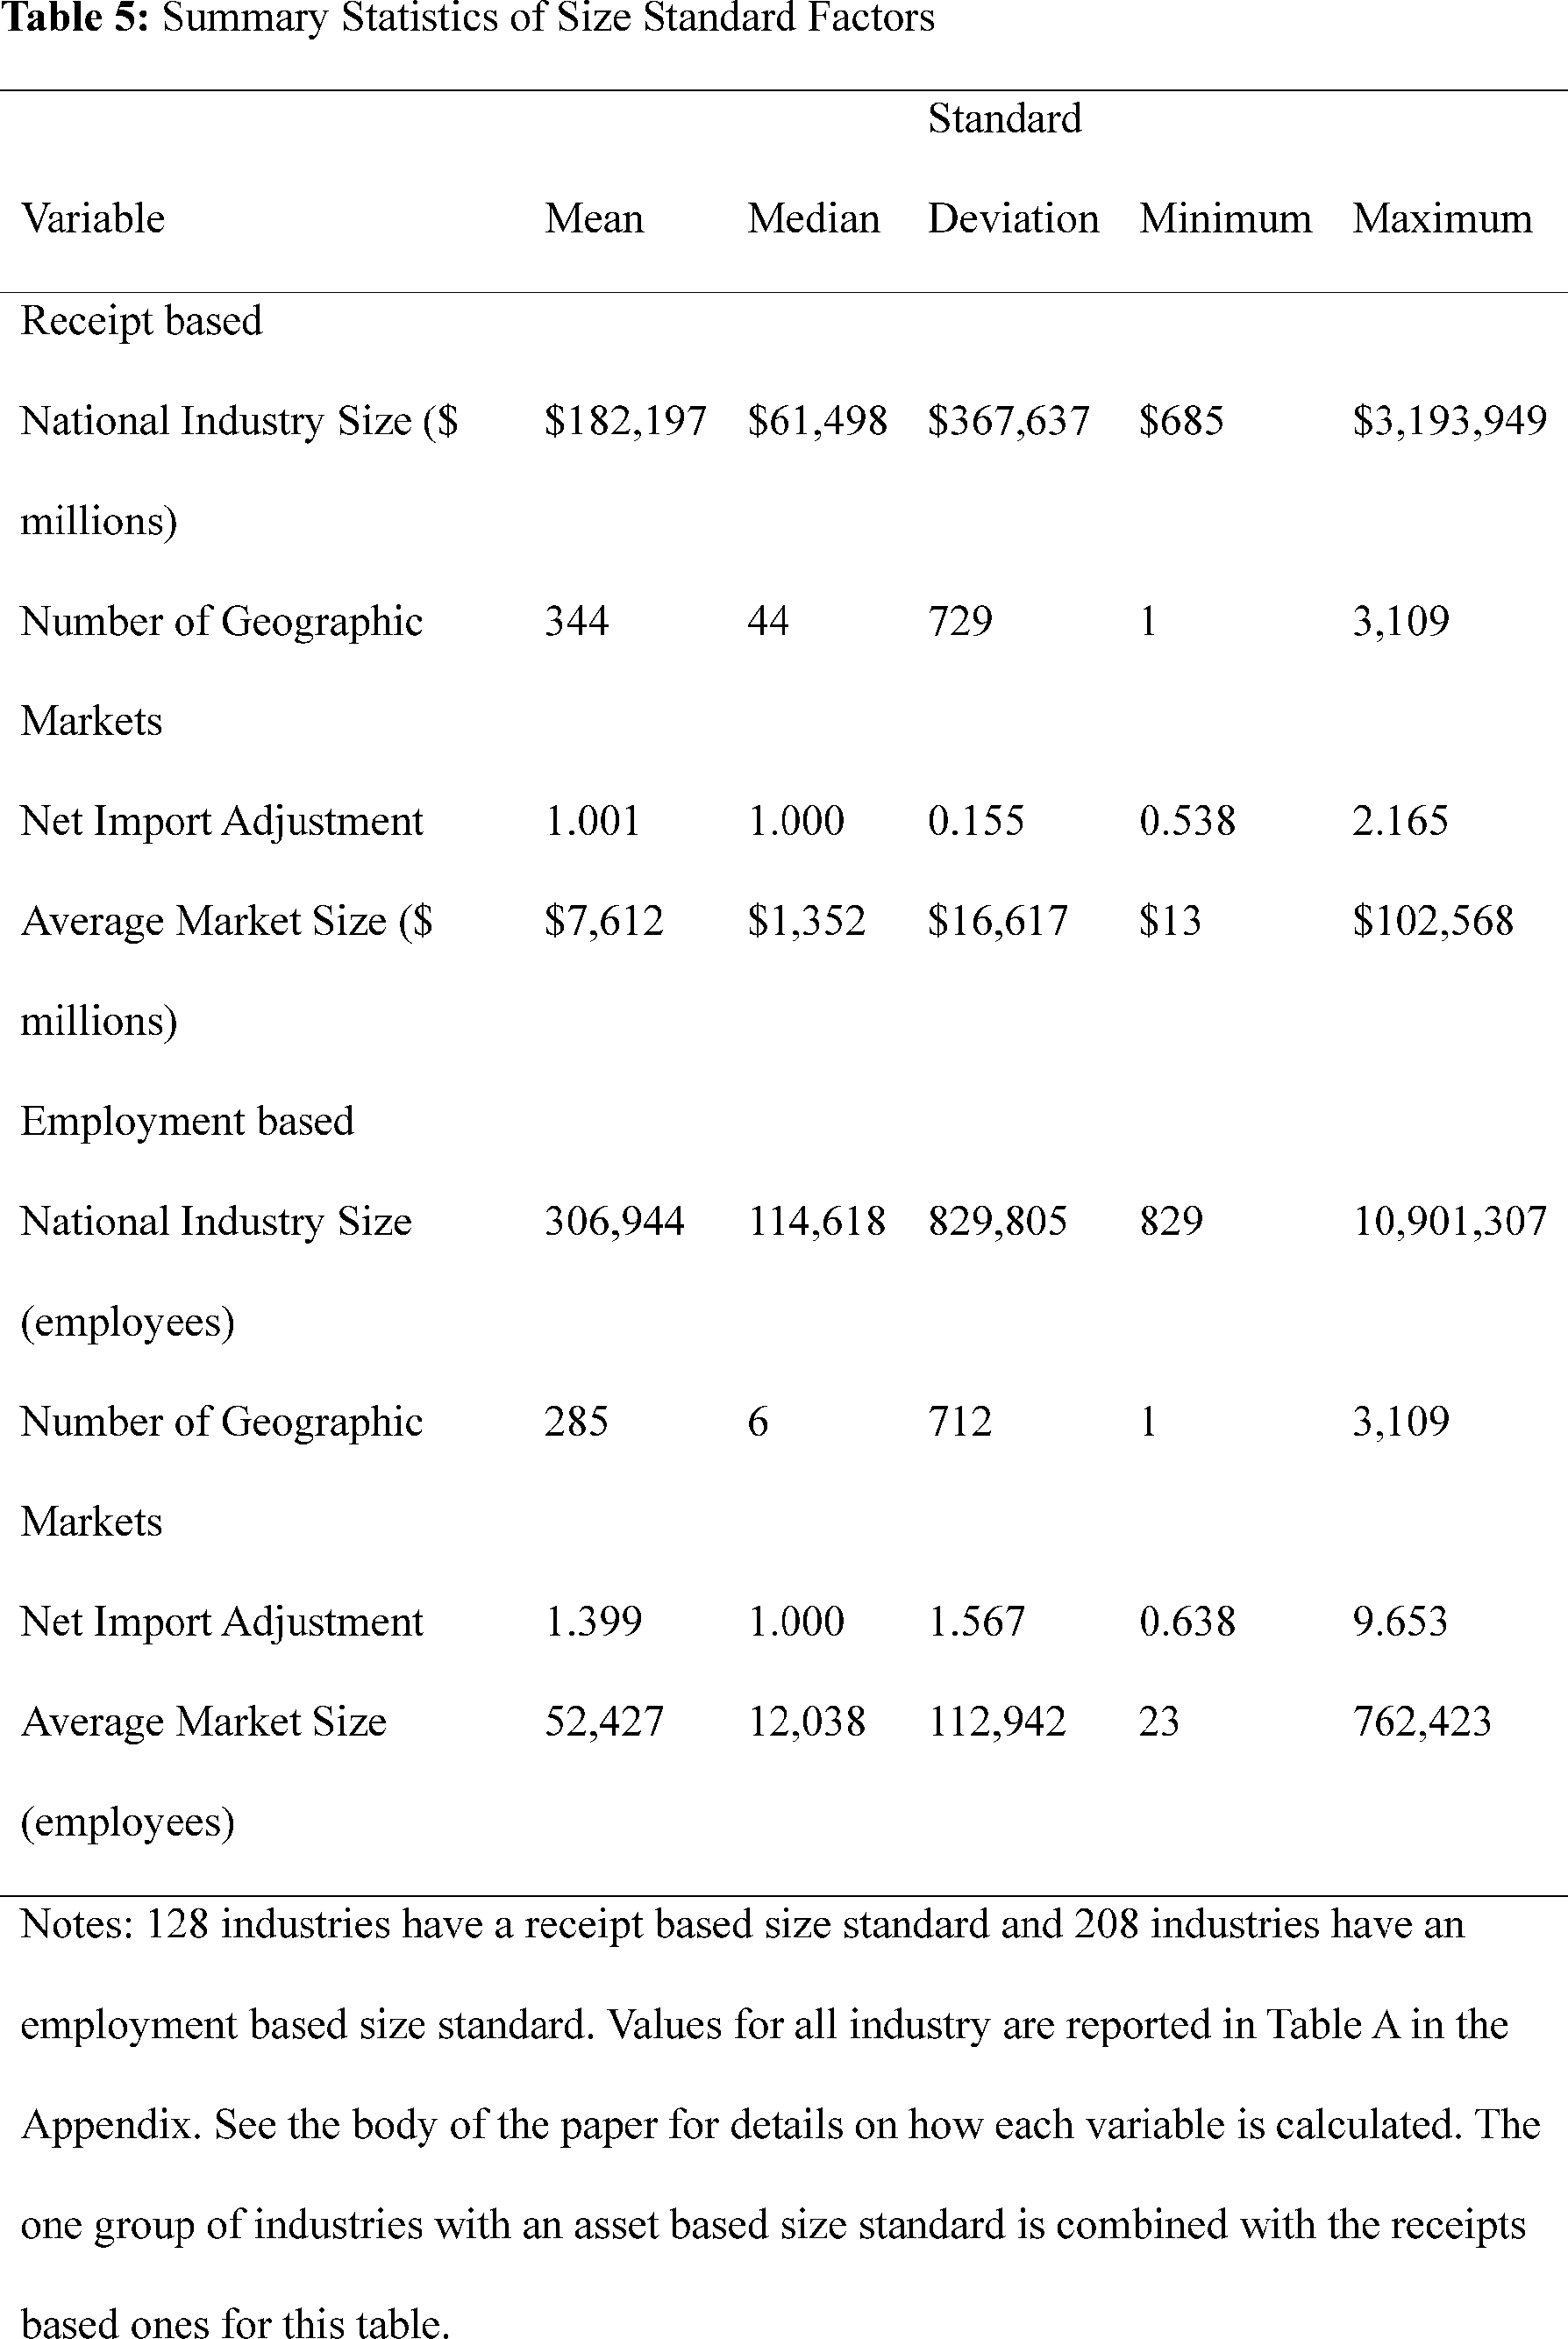








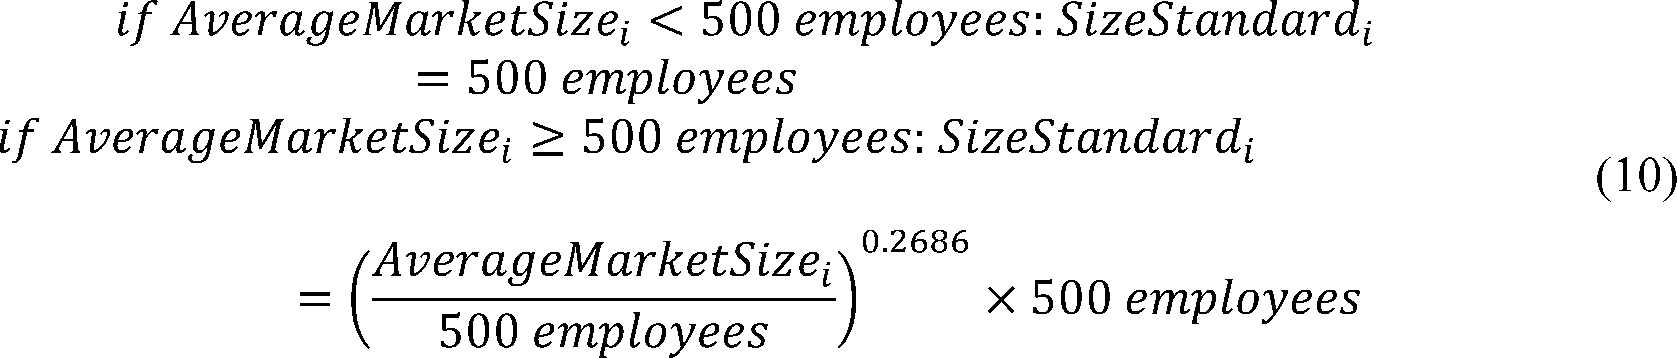
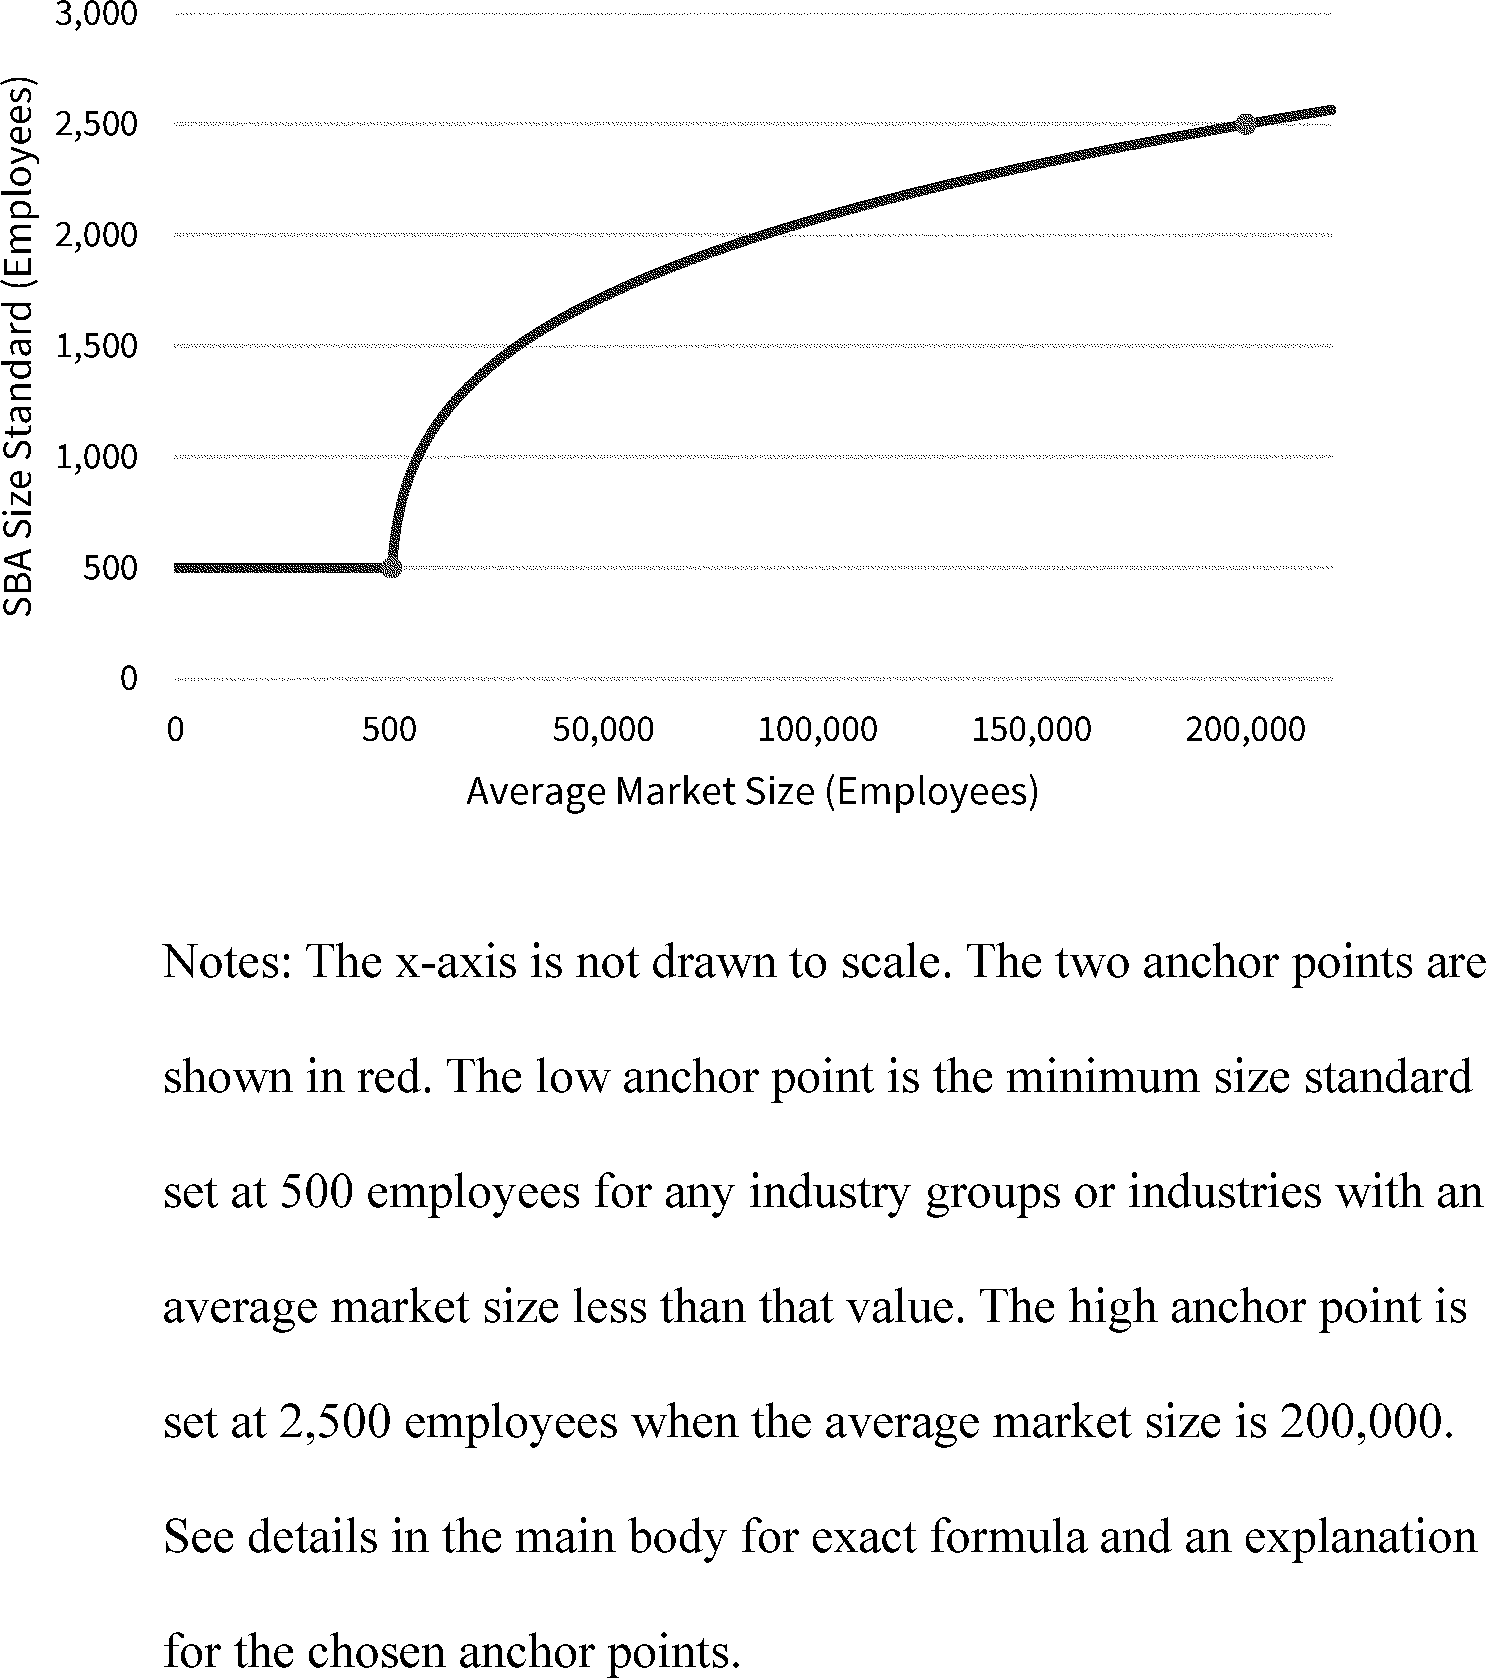

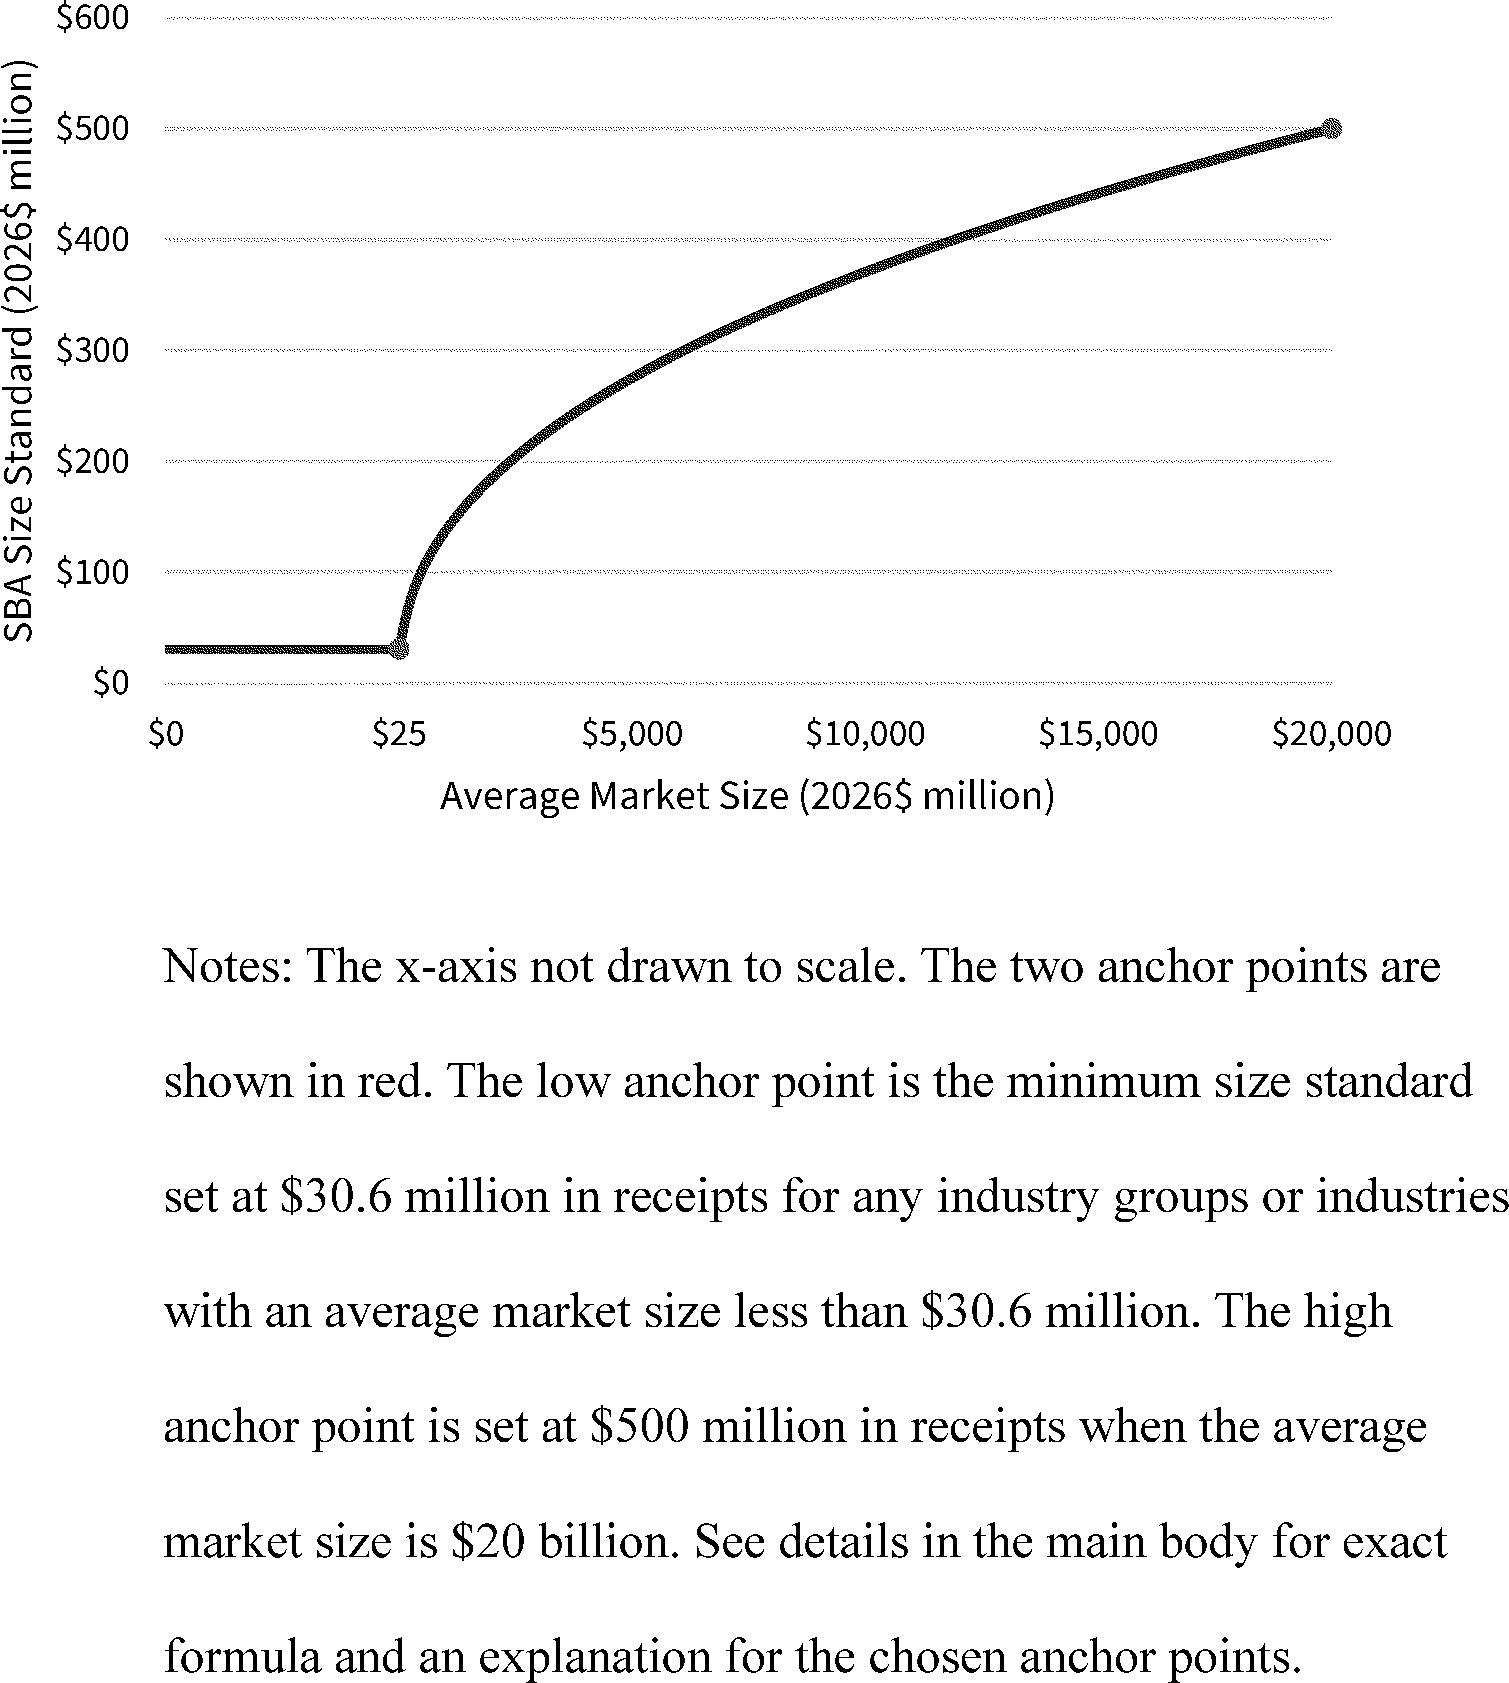
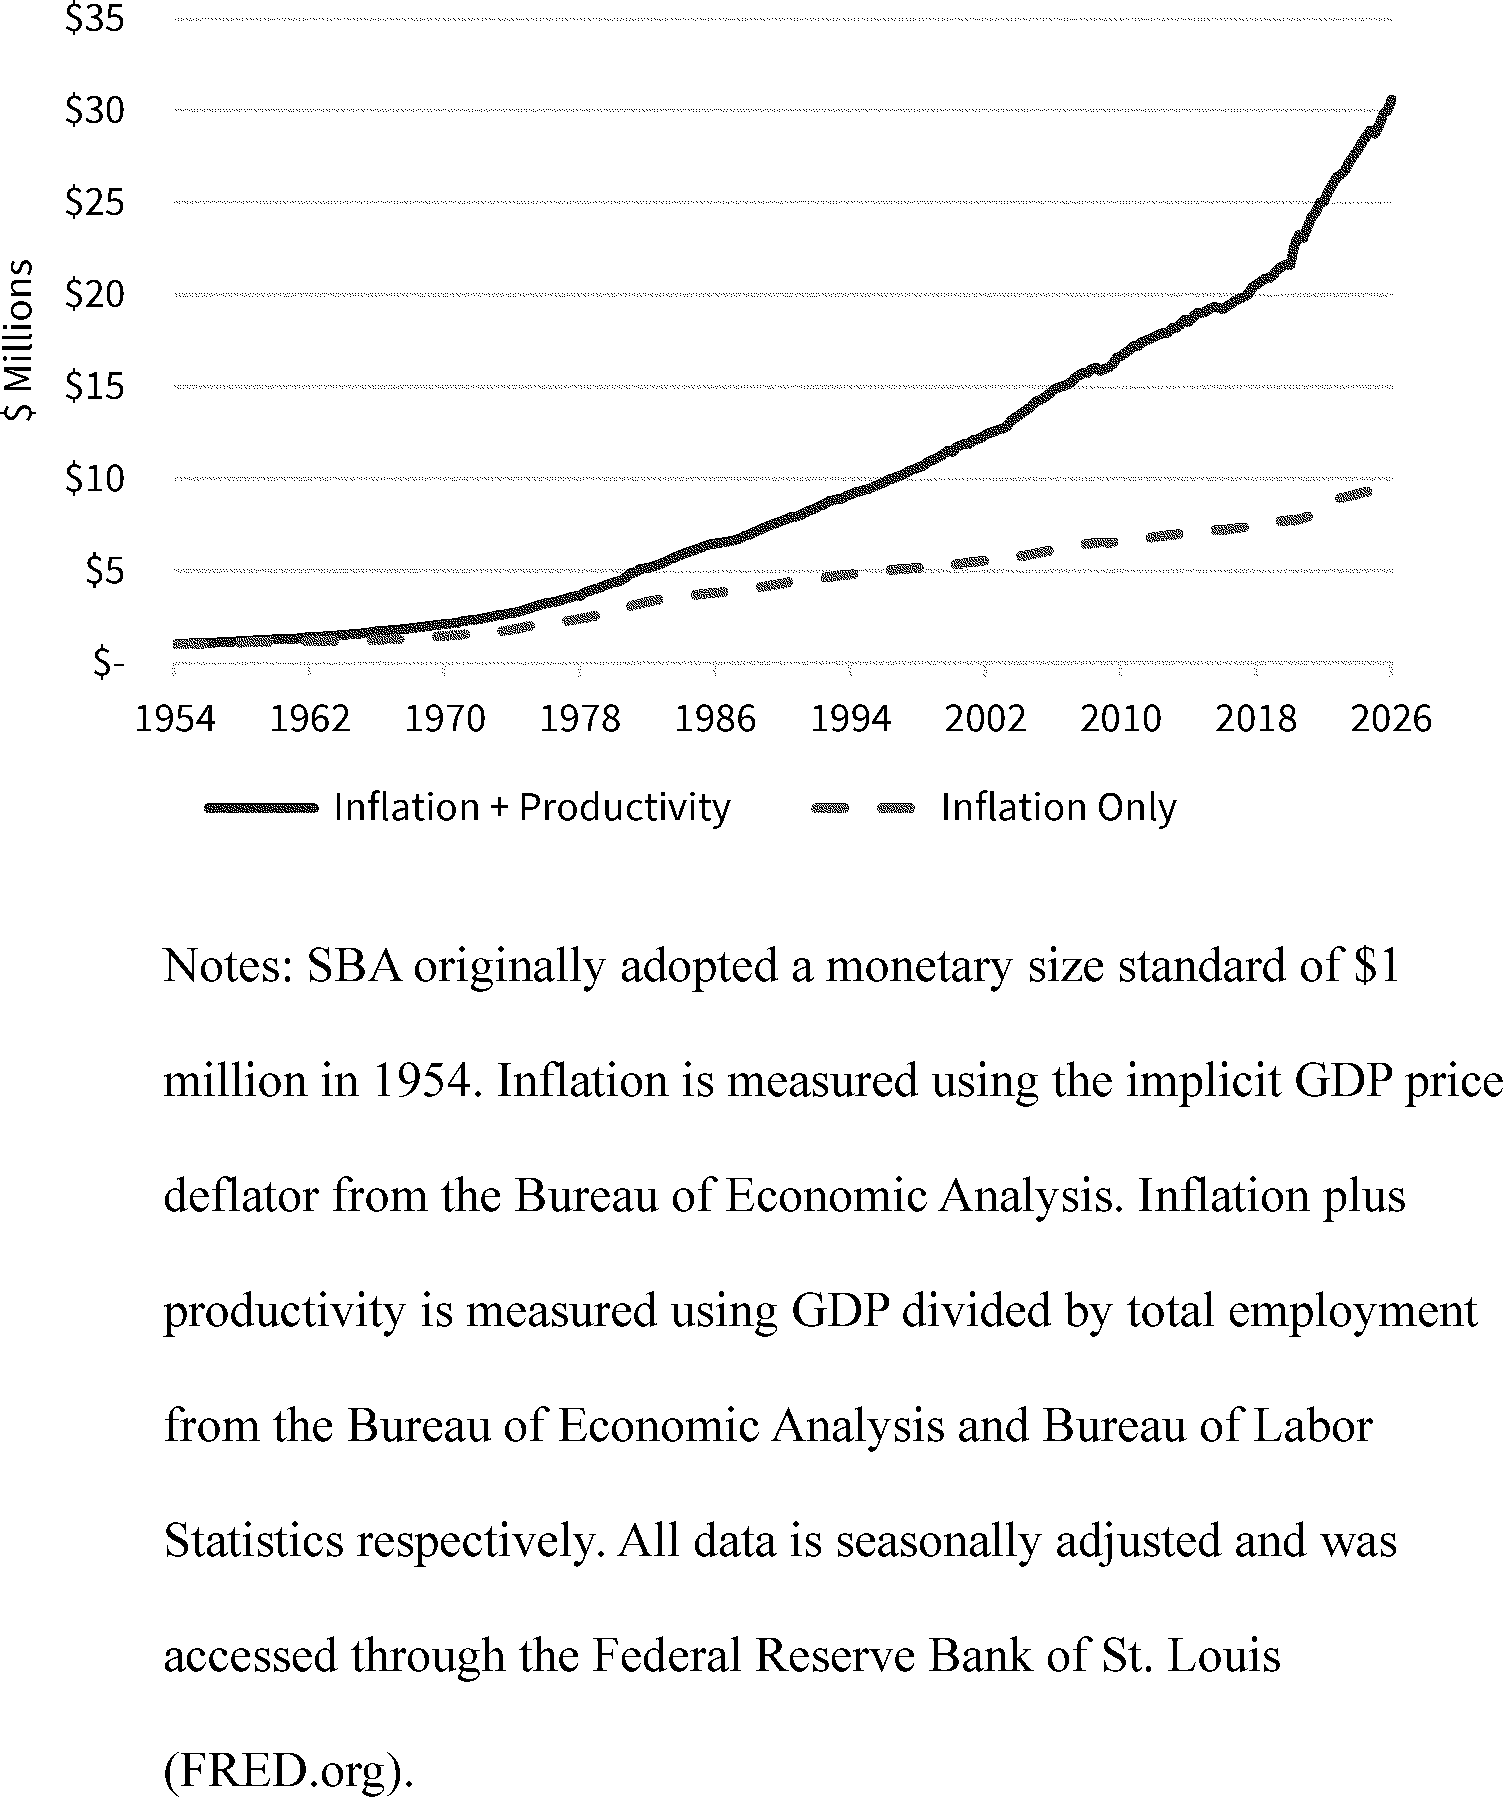

 16 CFR 802.3
 doi.org/10.1257/aer.103.5.1553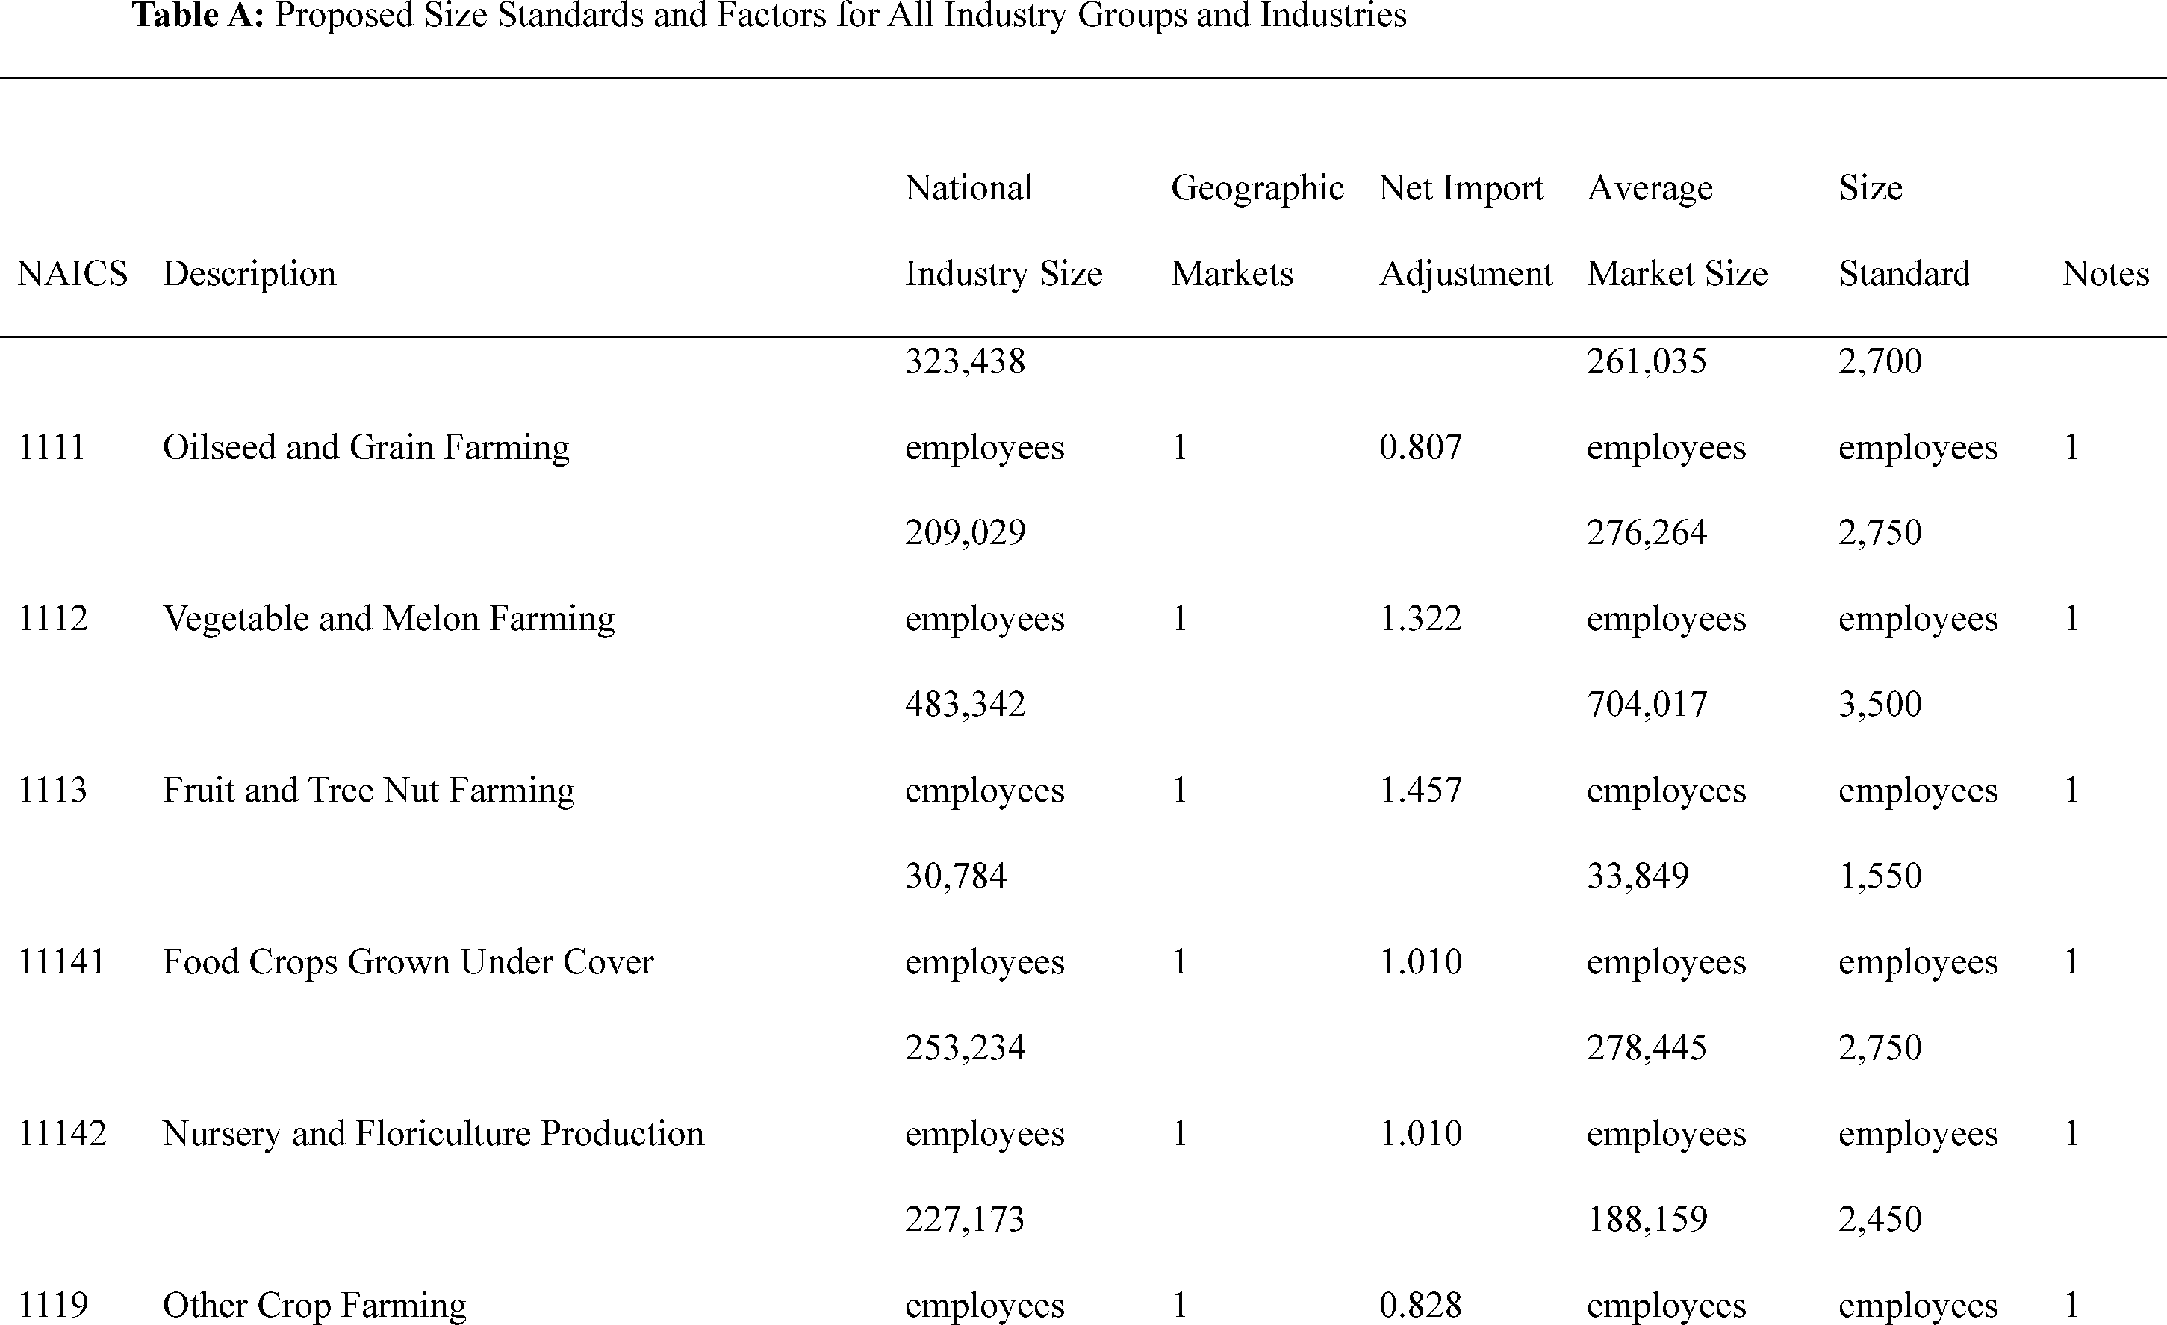
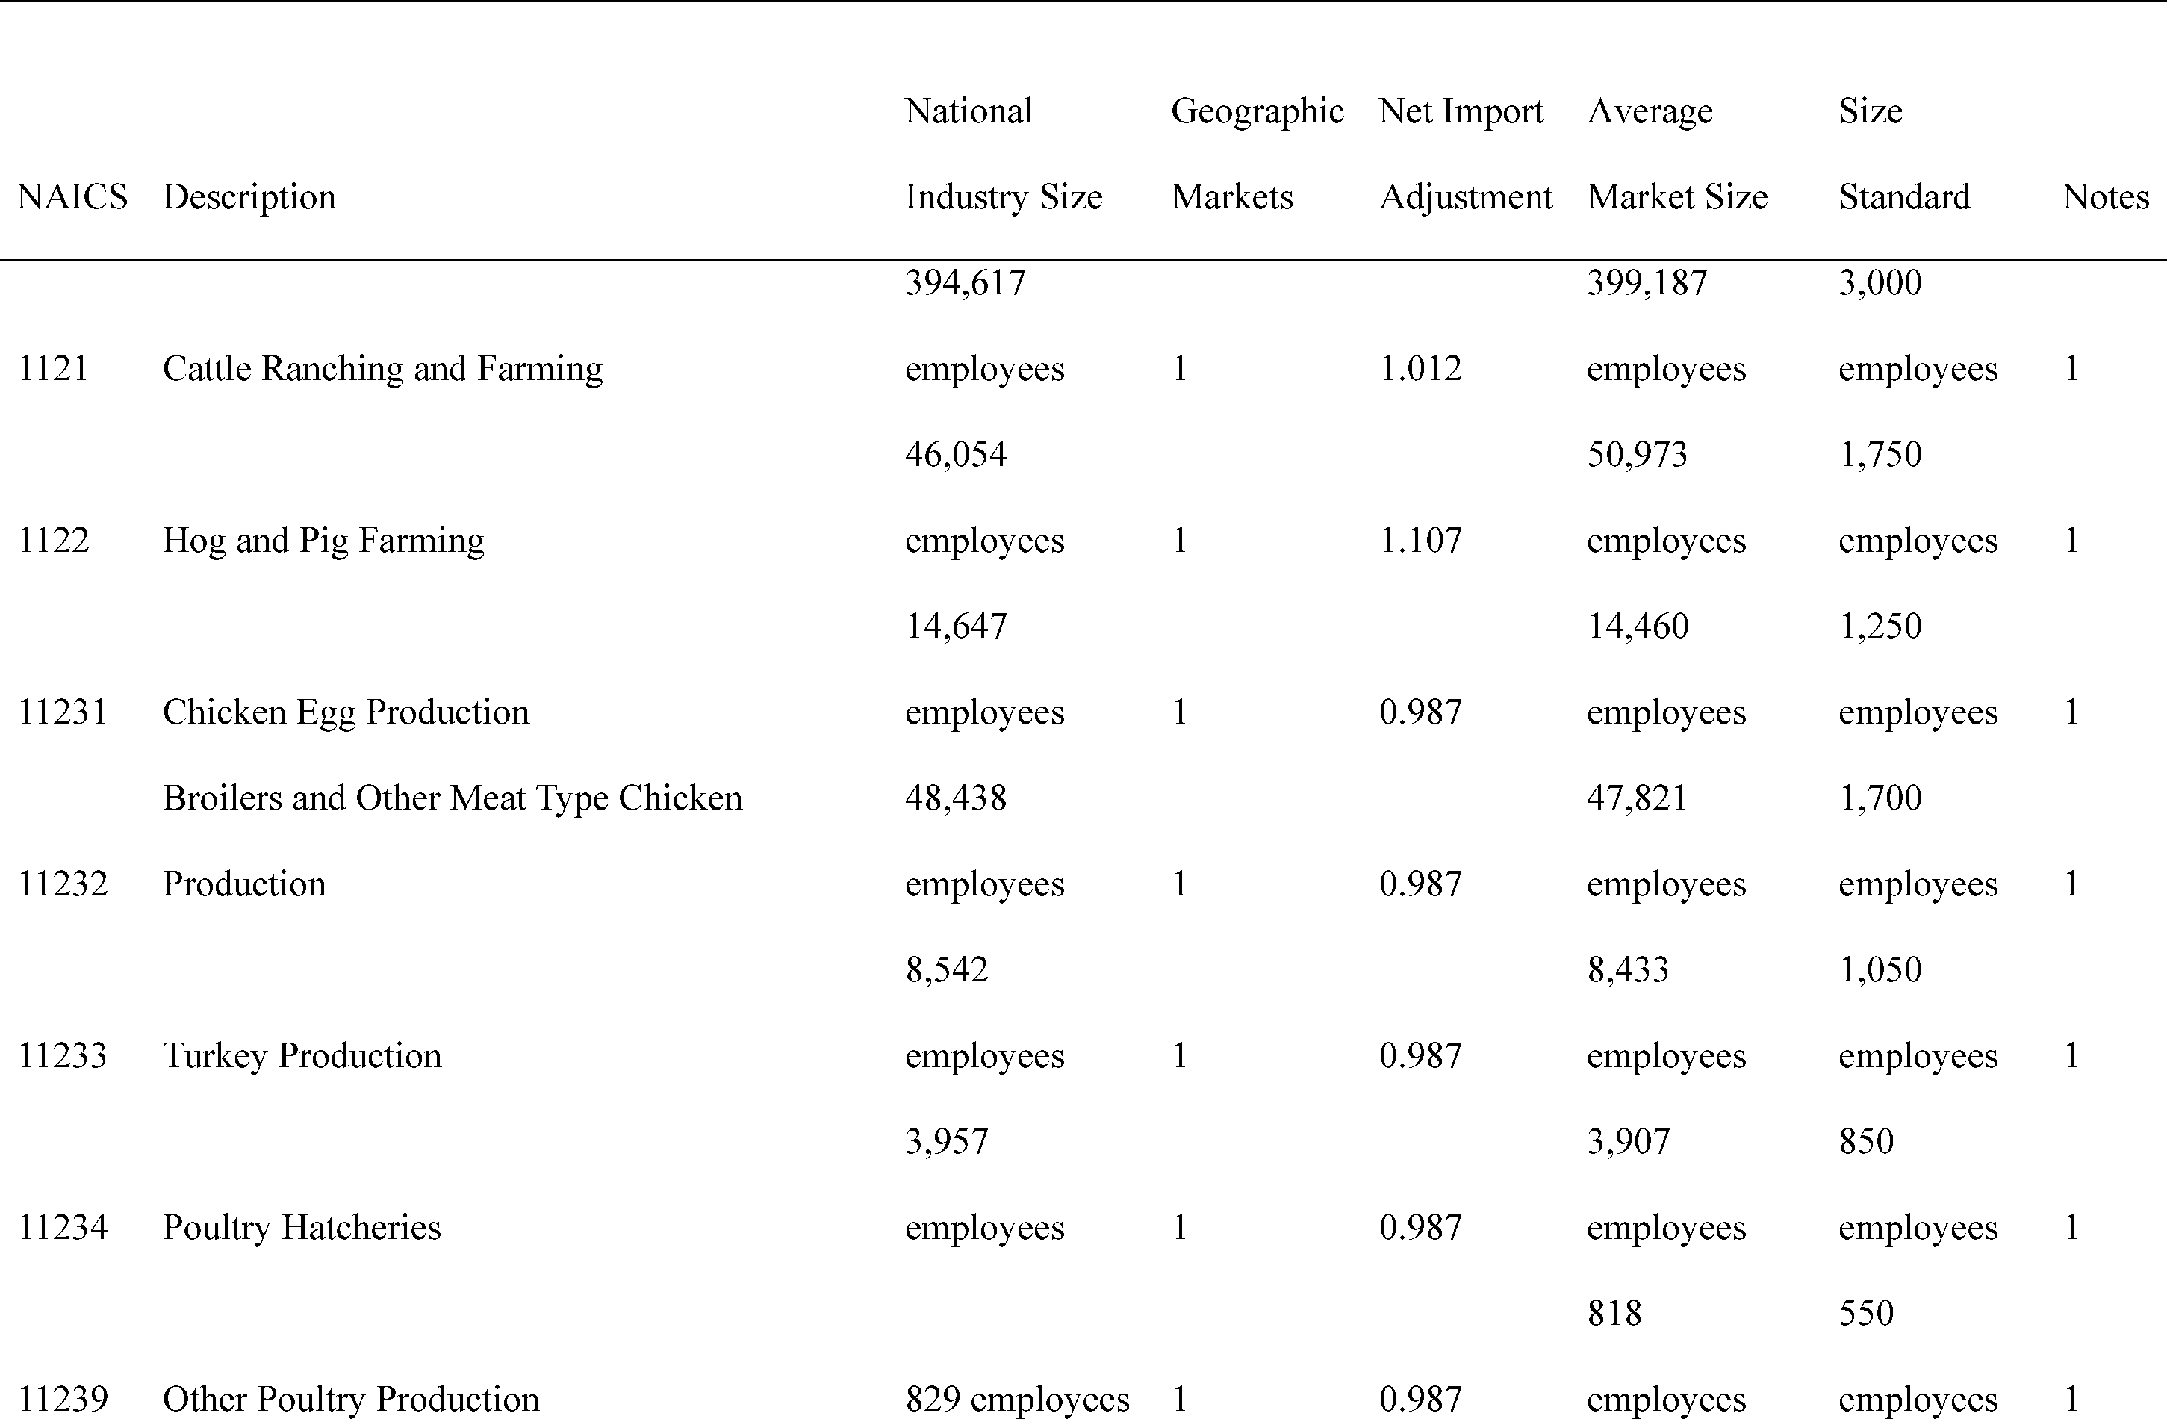
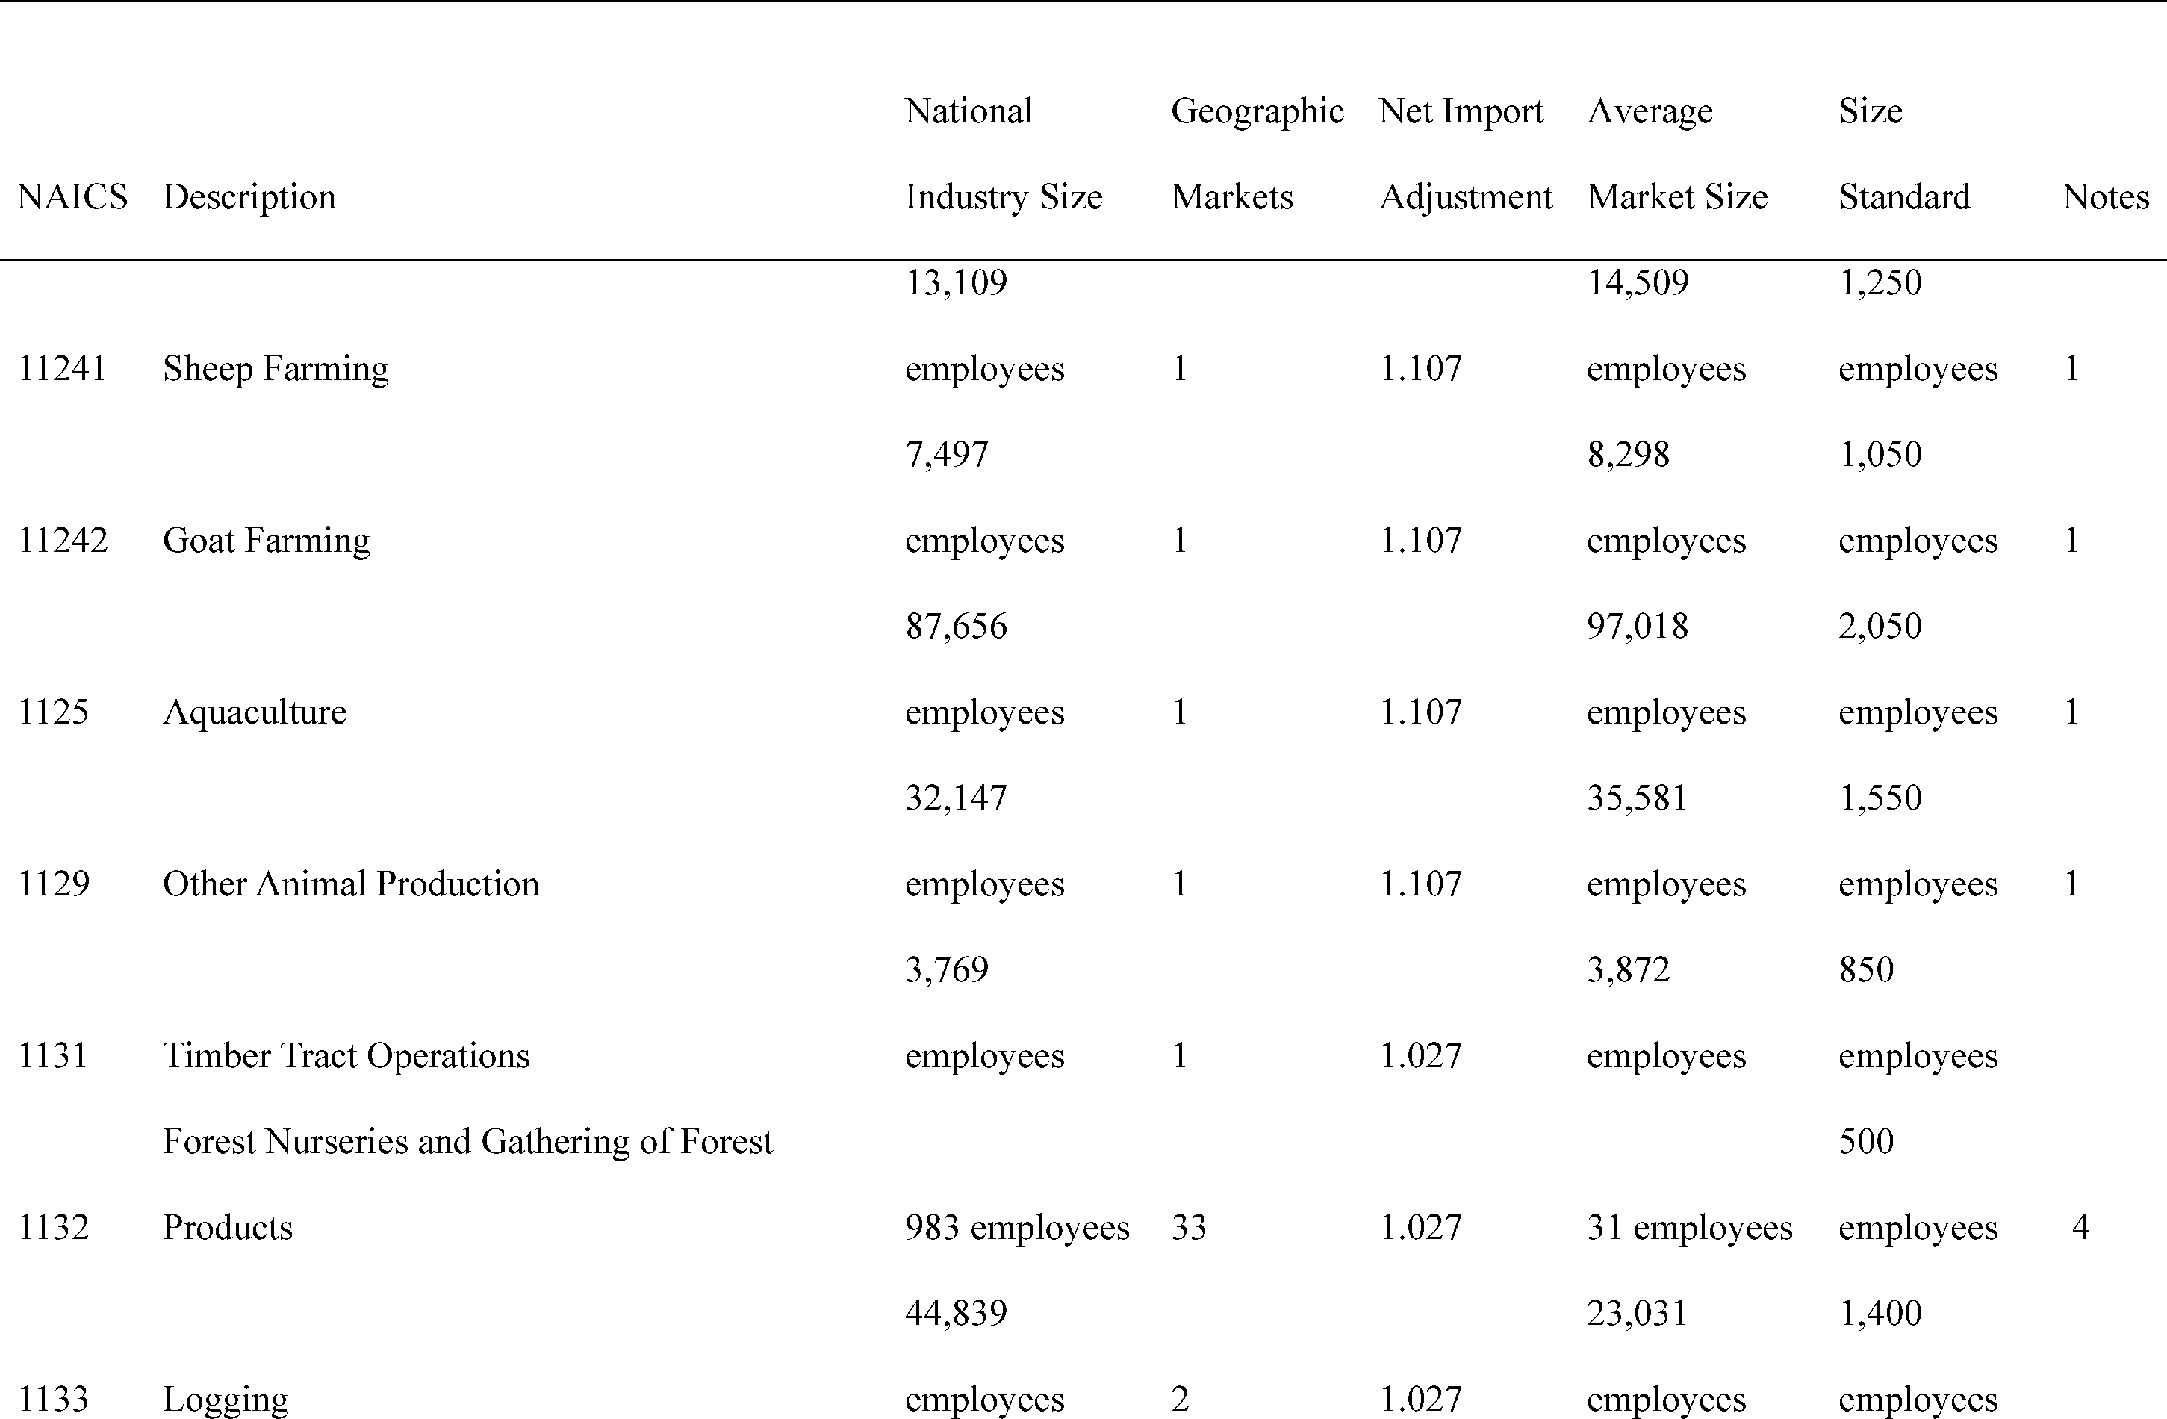
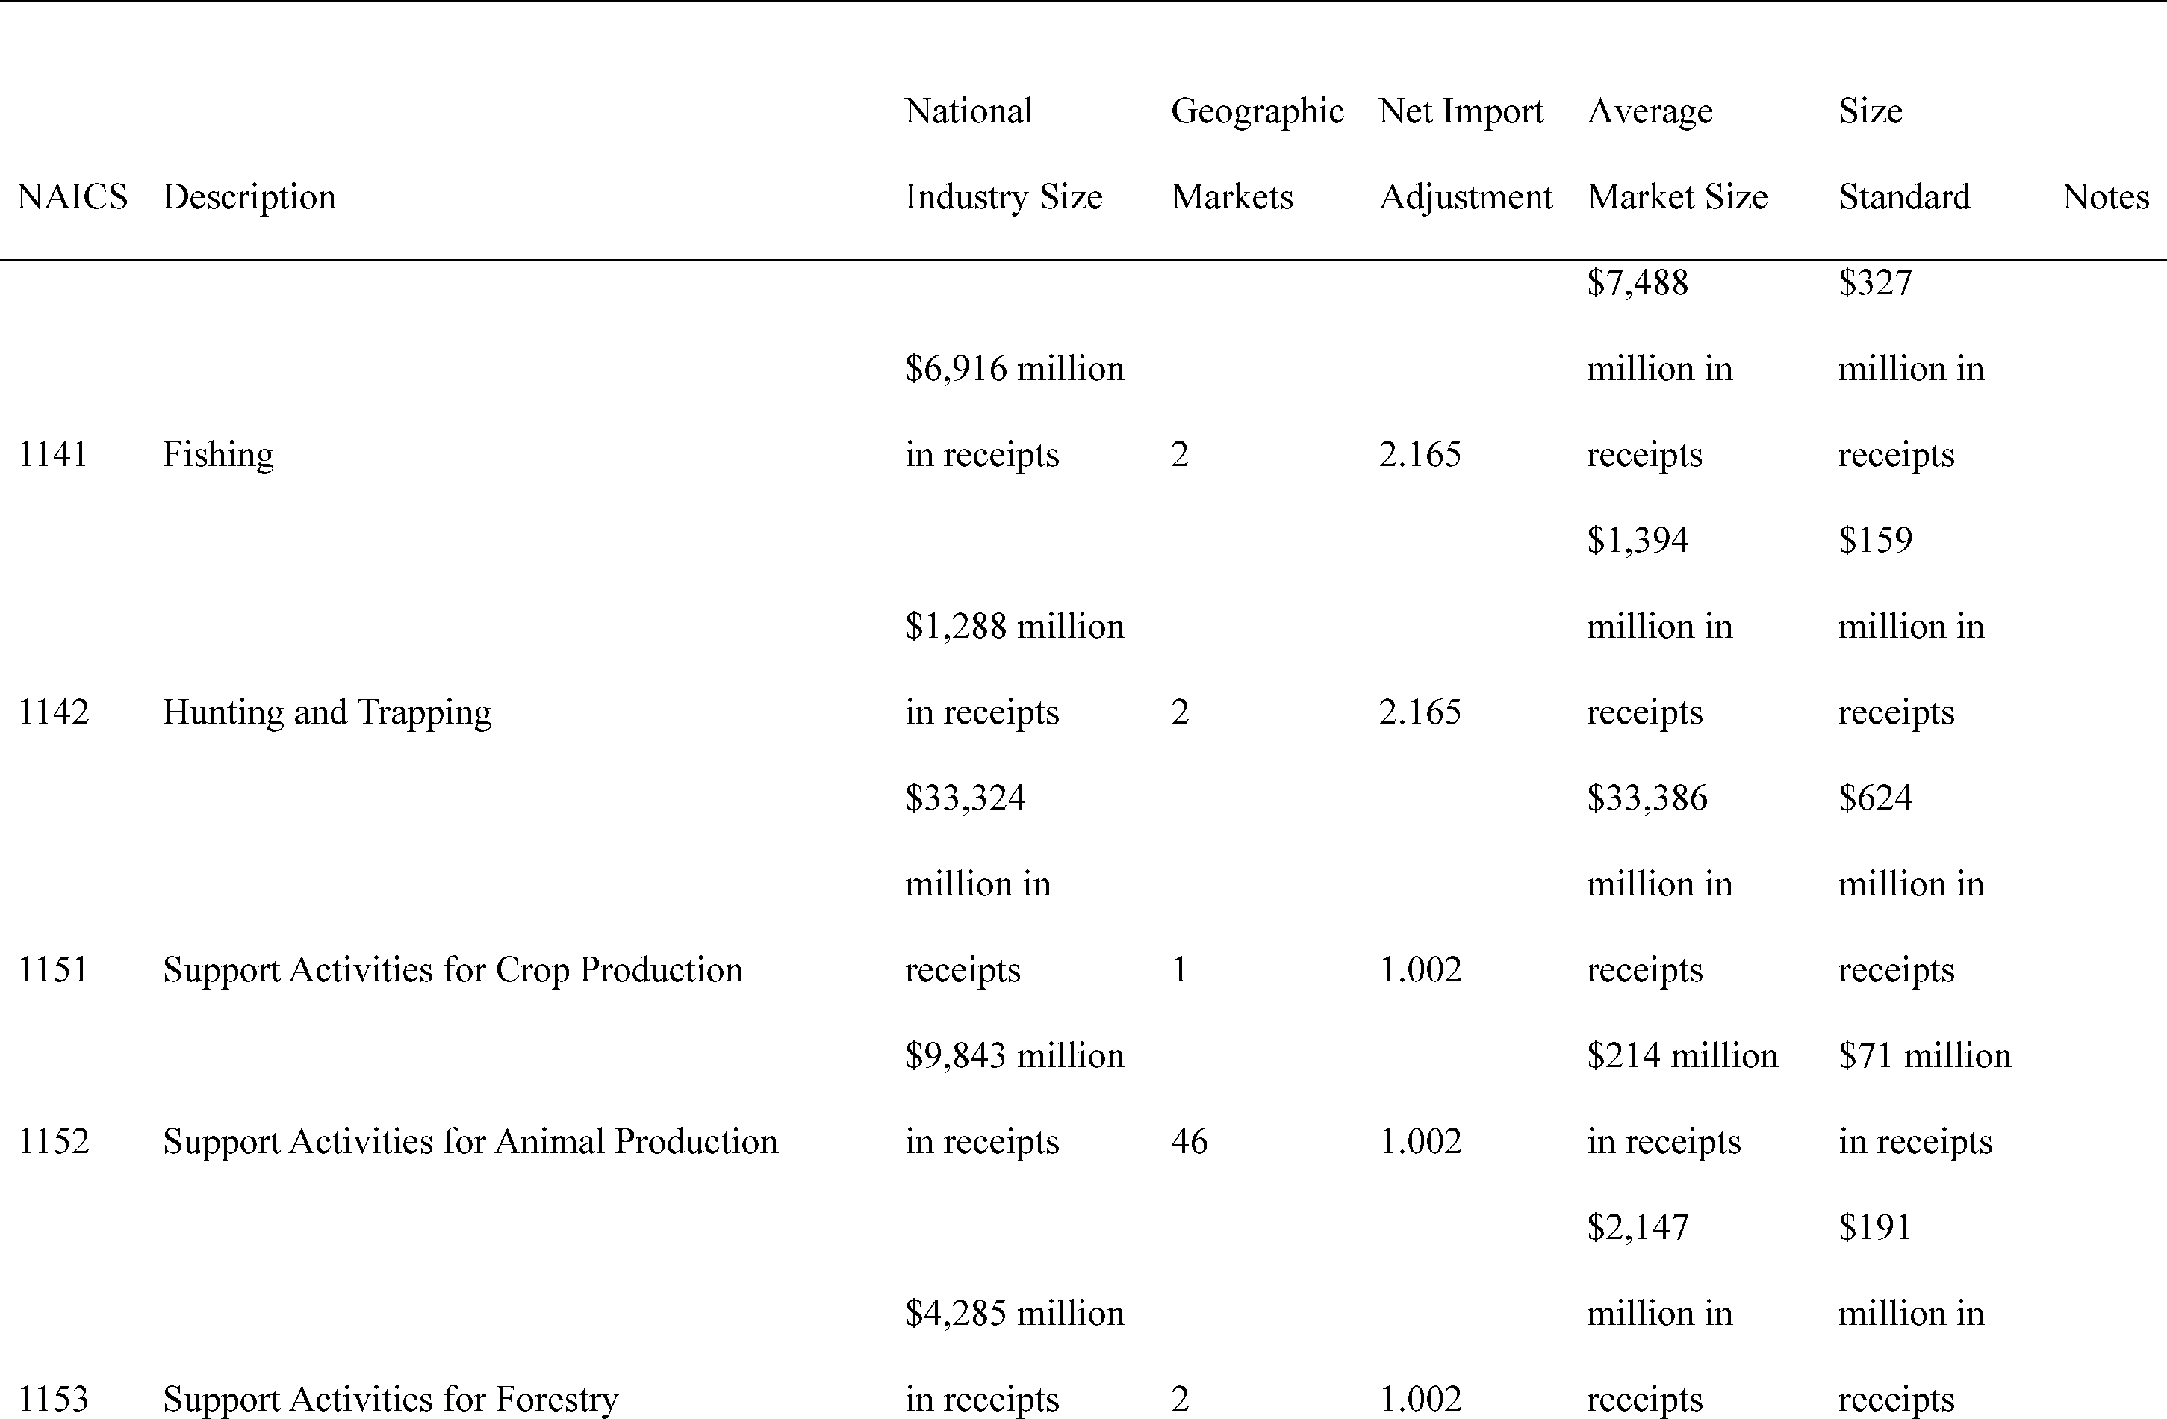
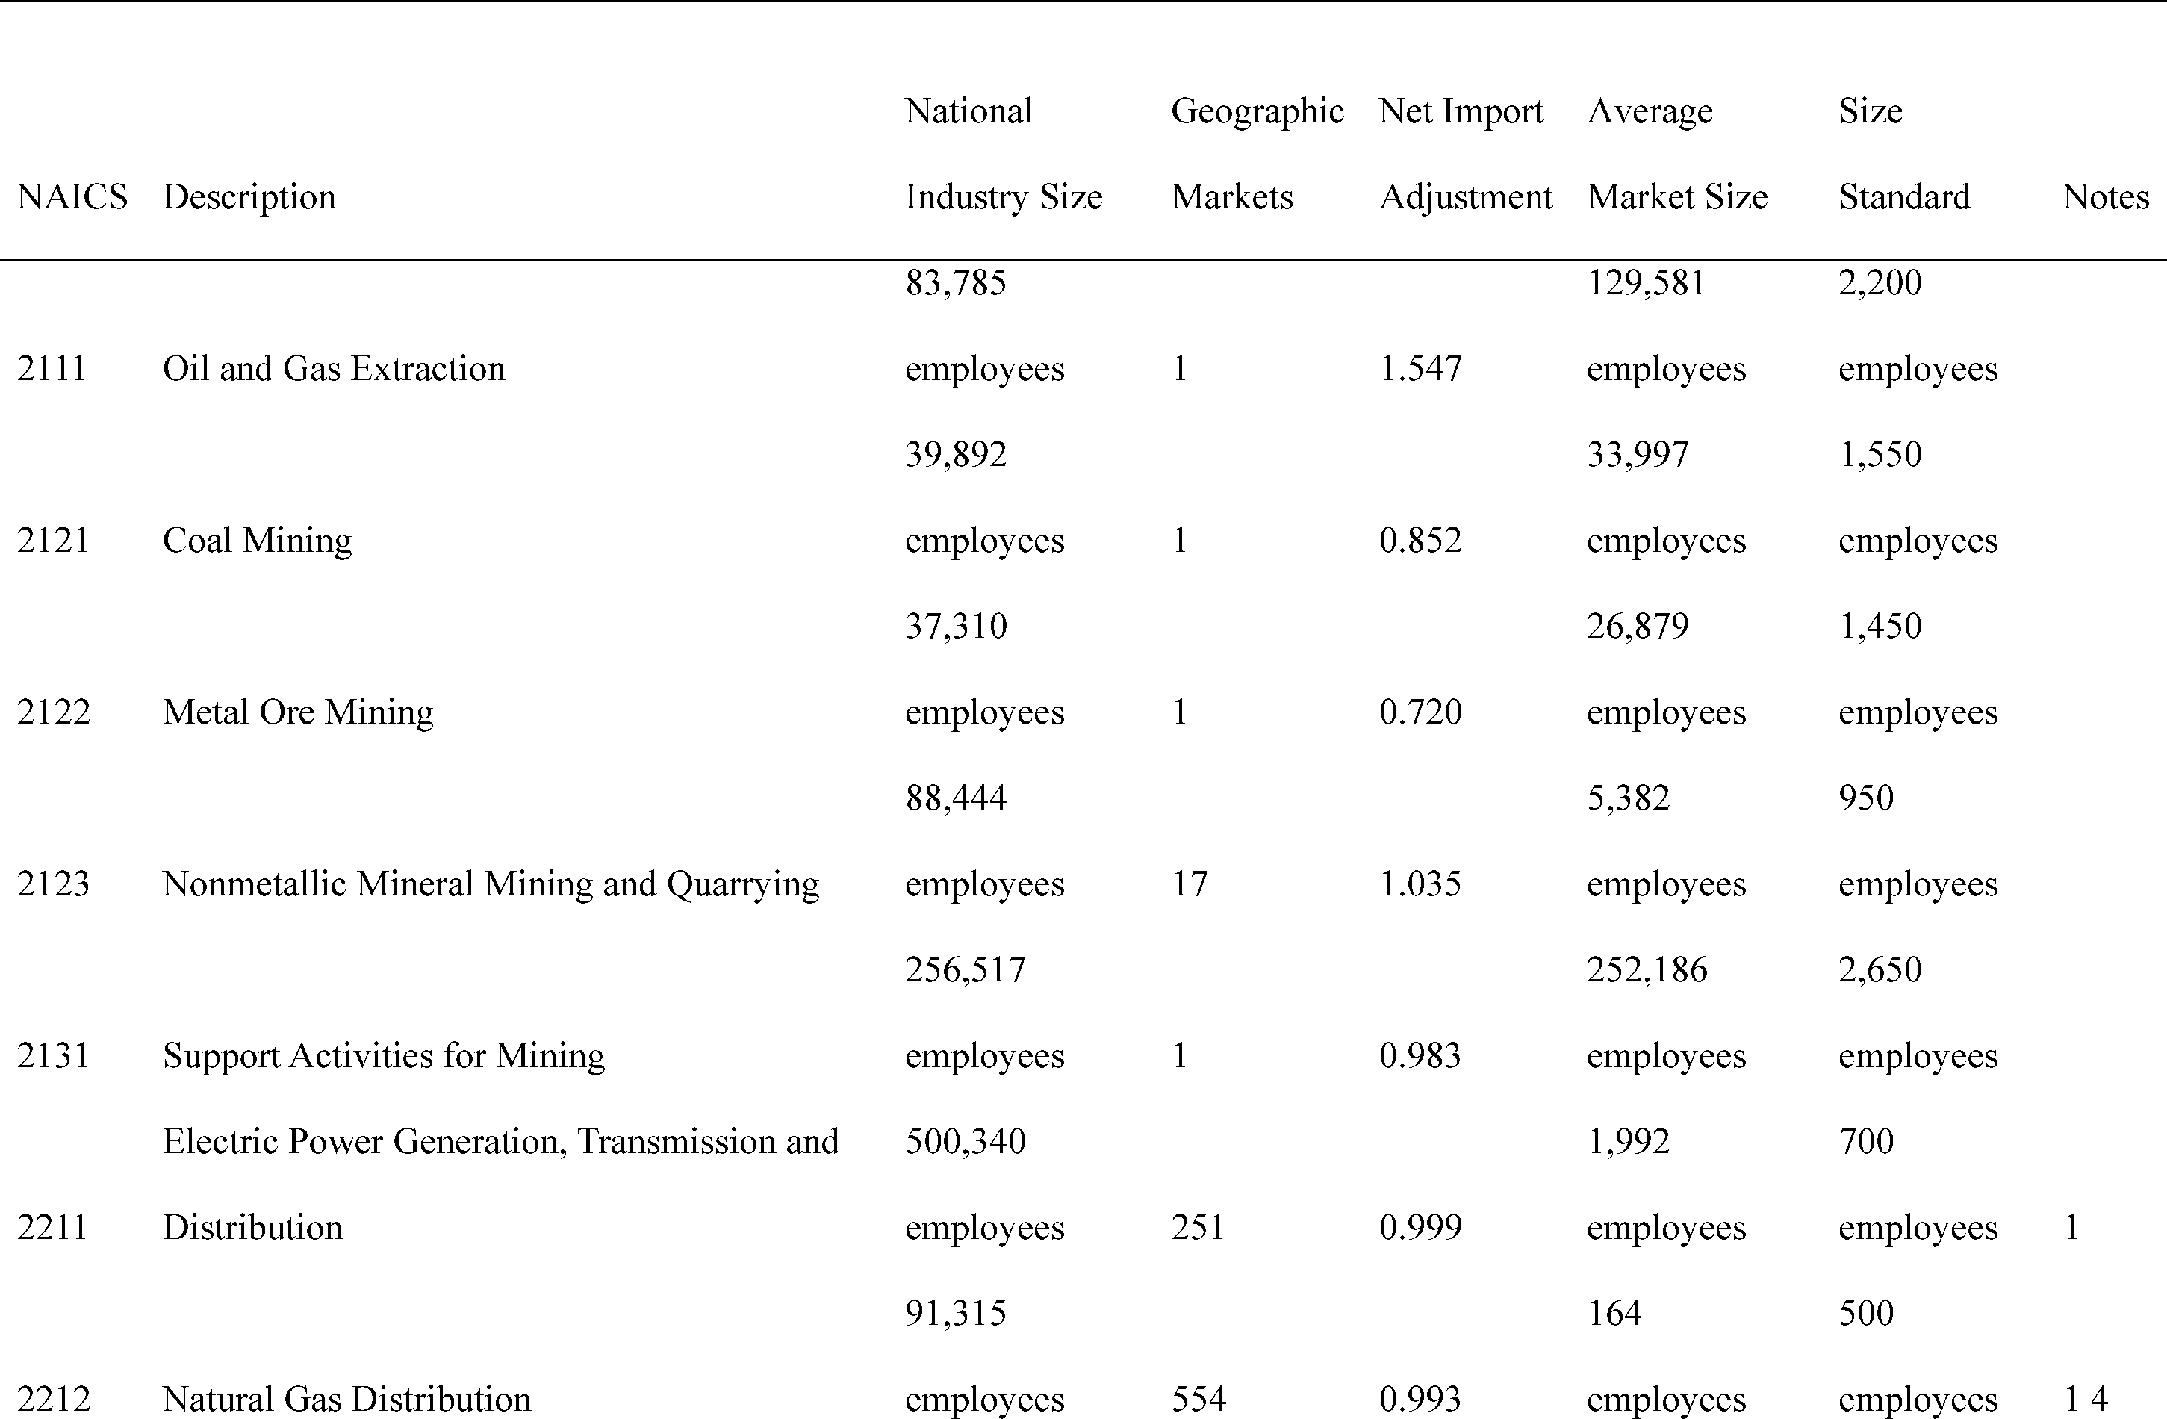
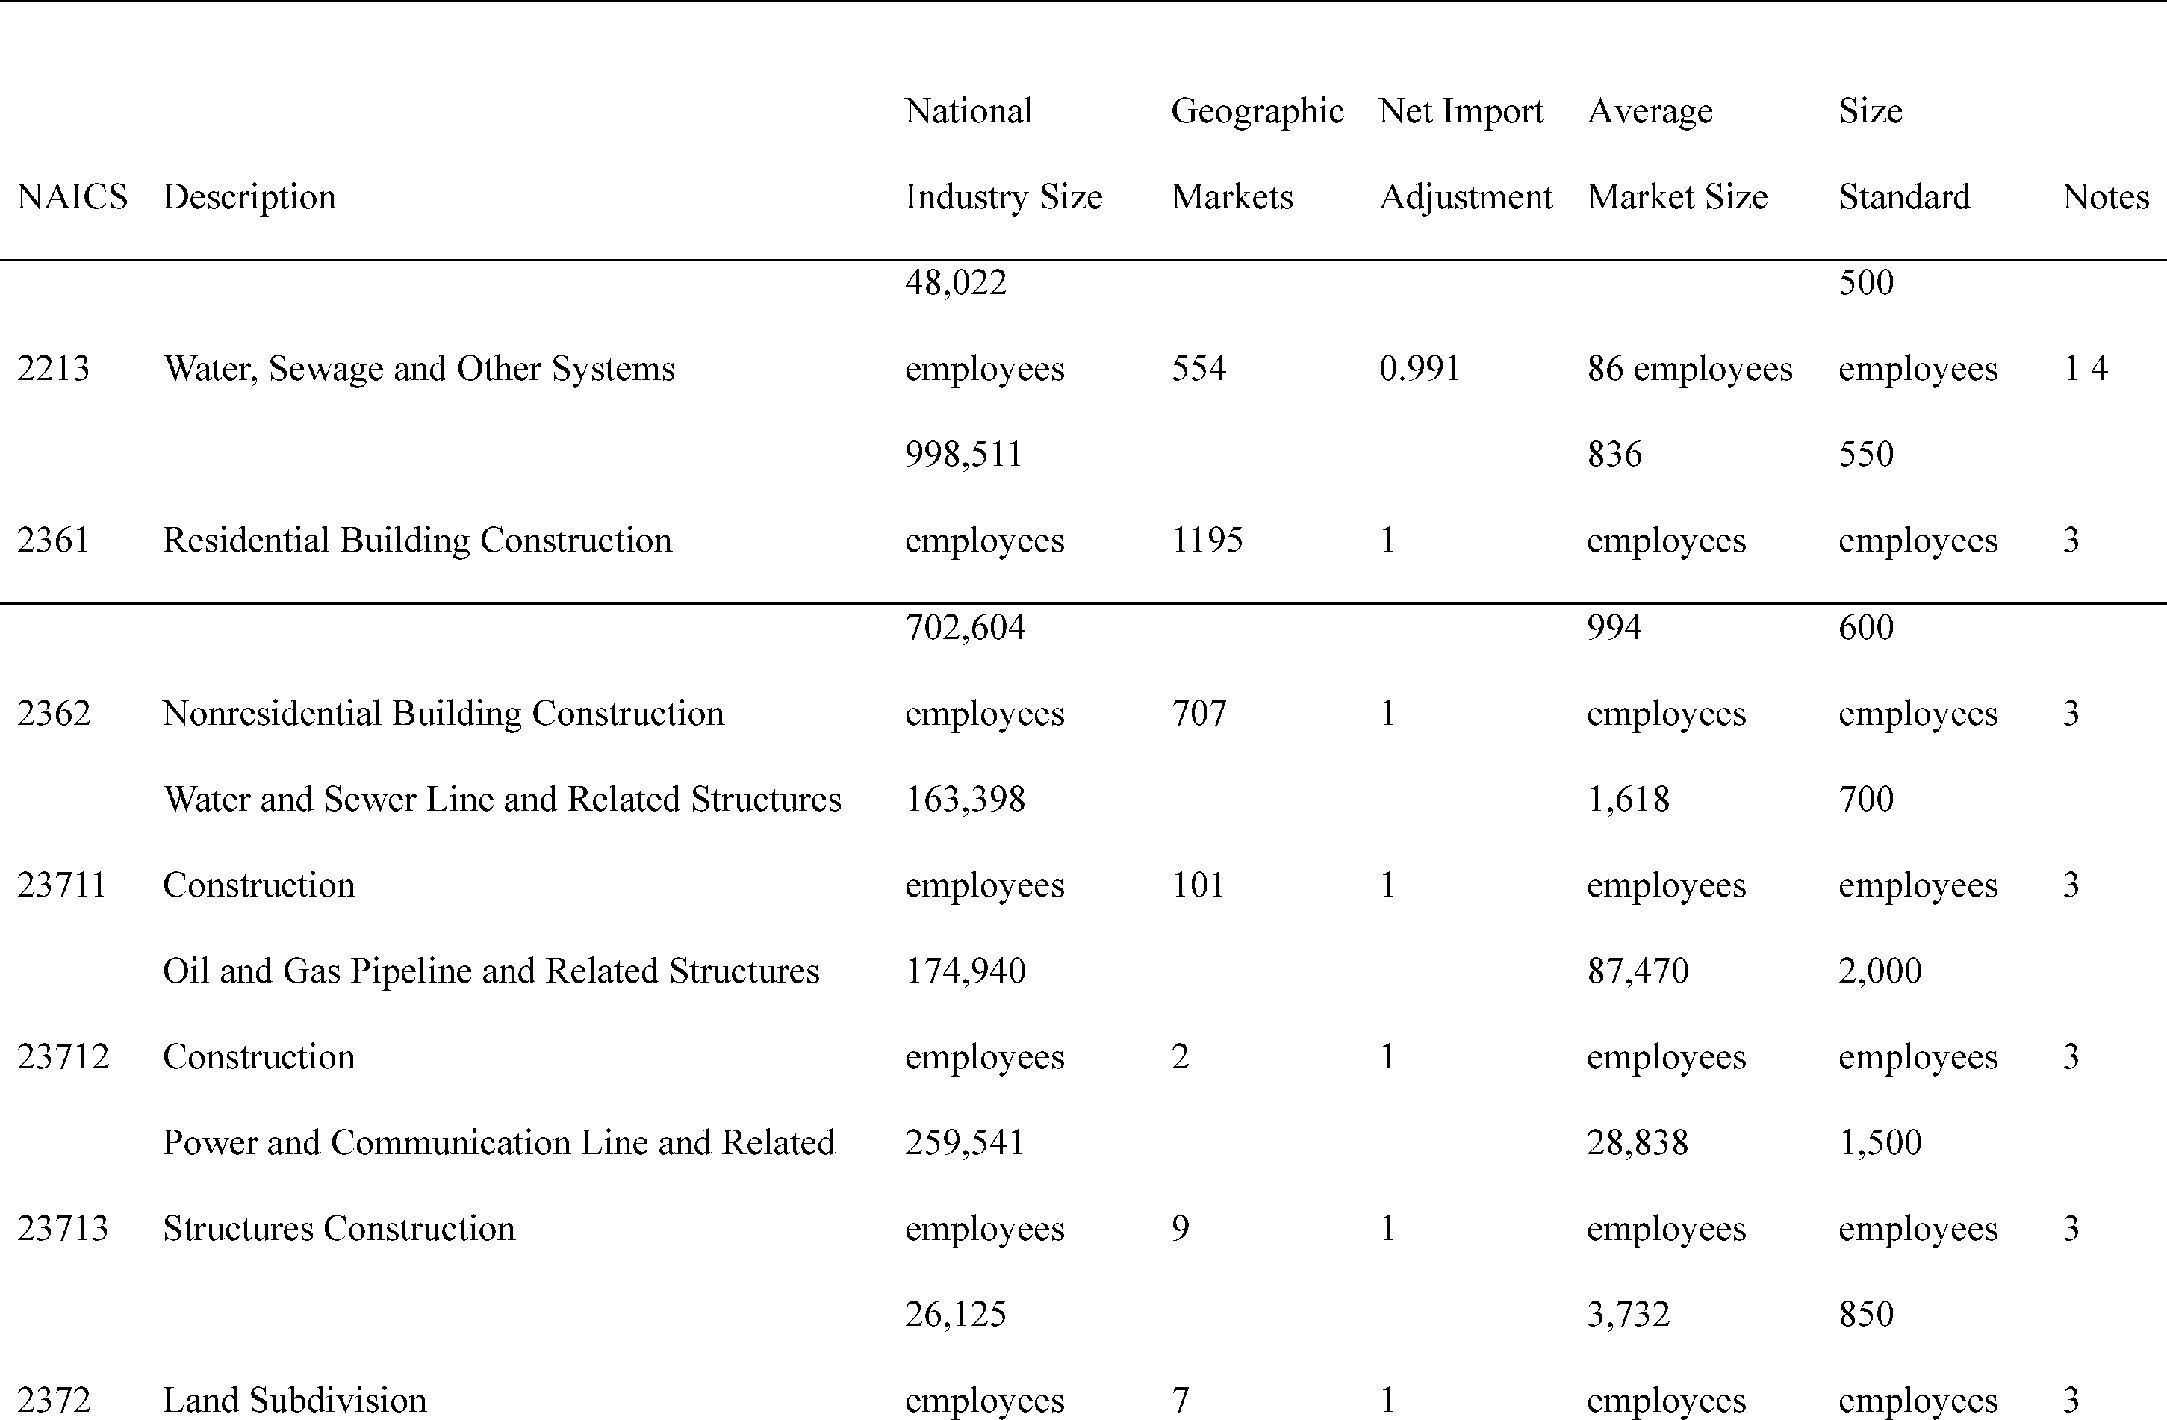
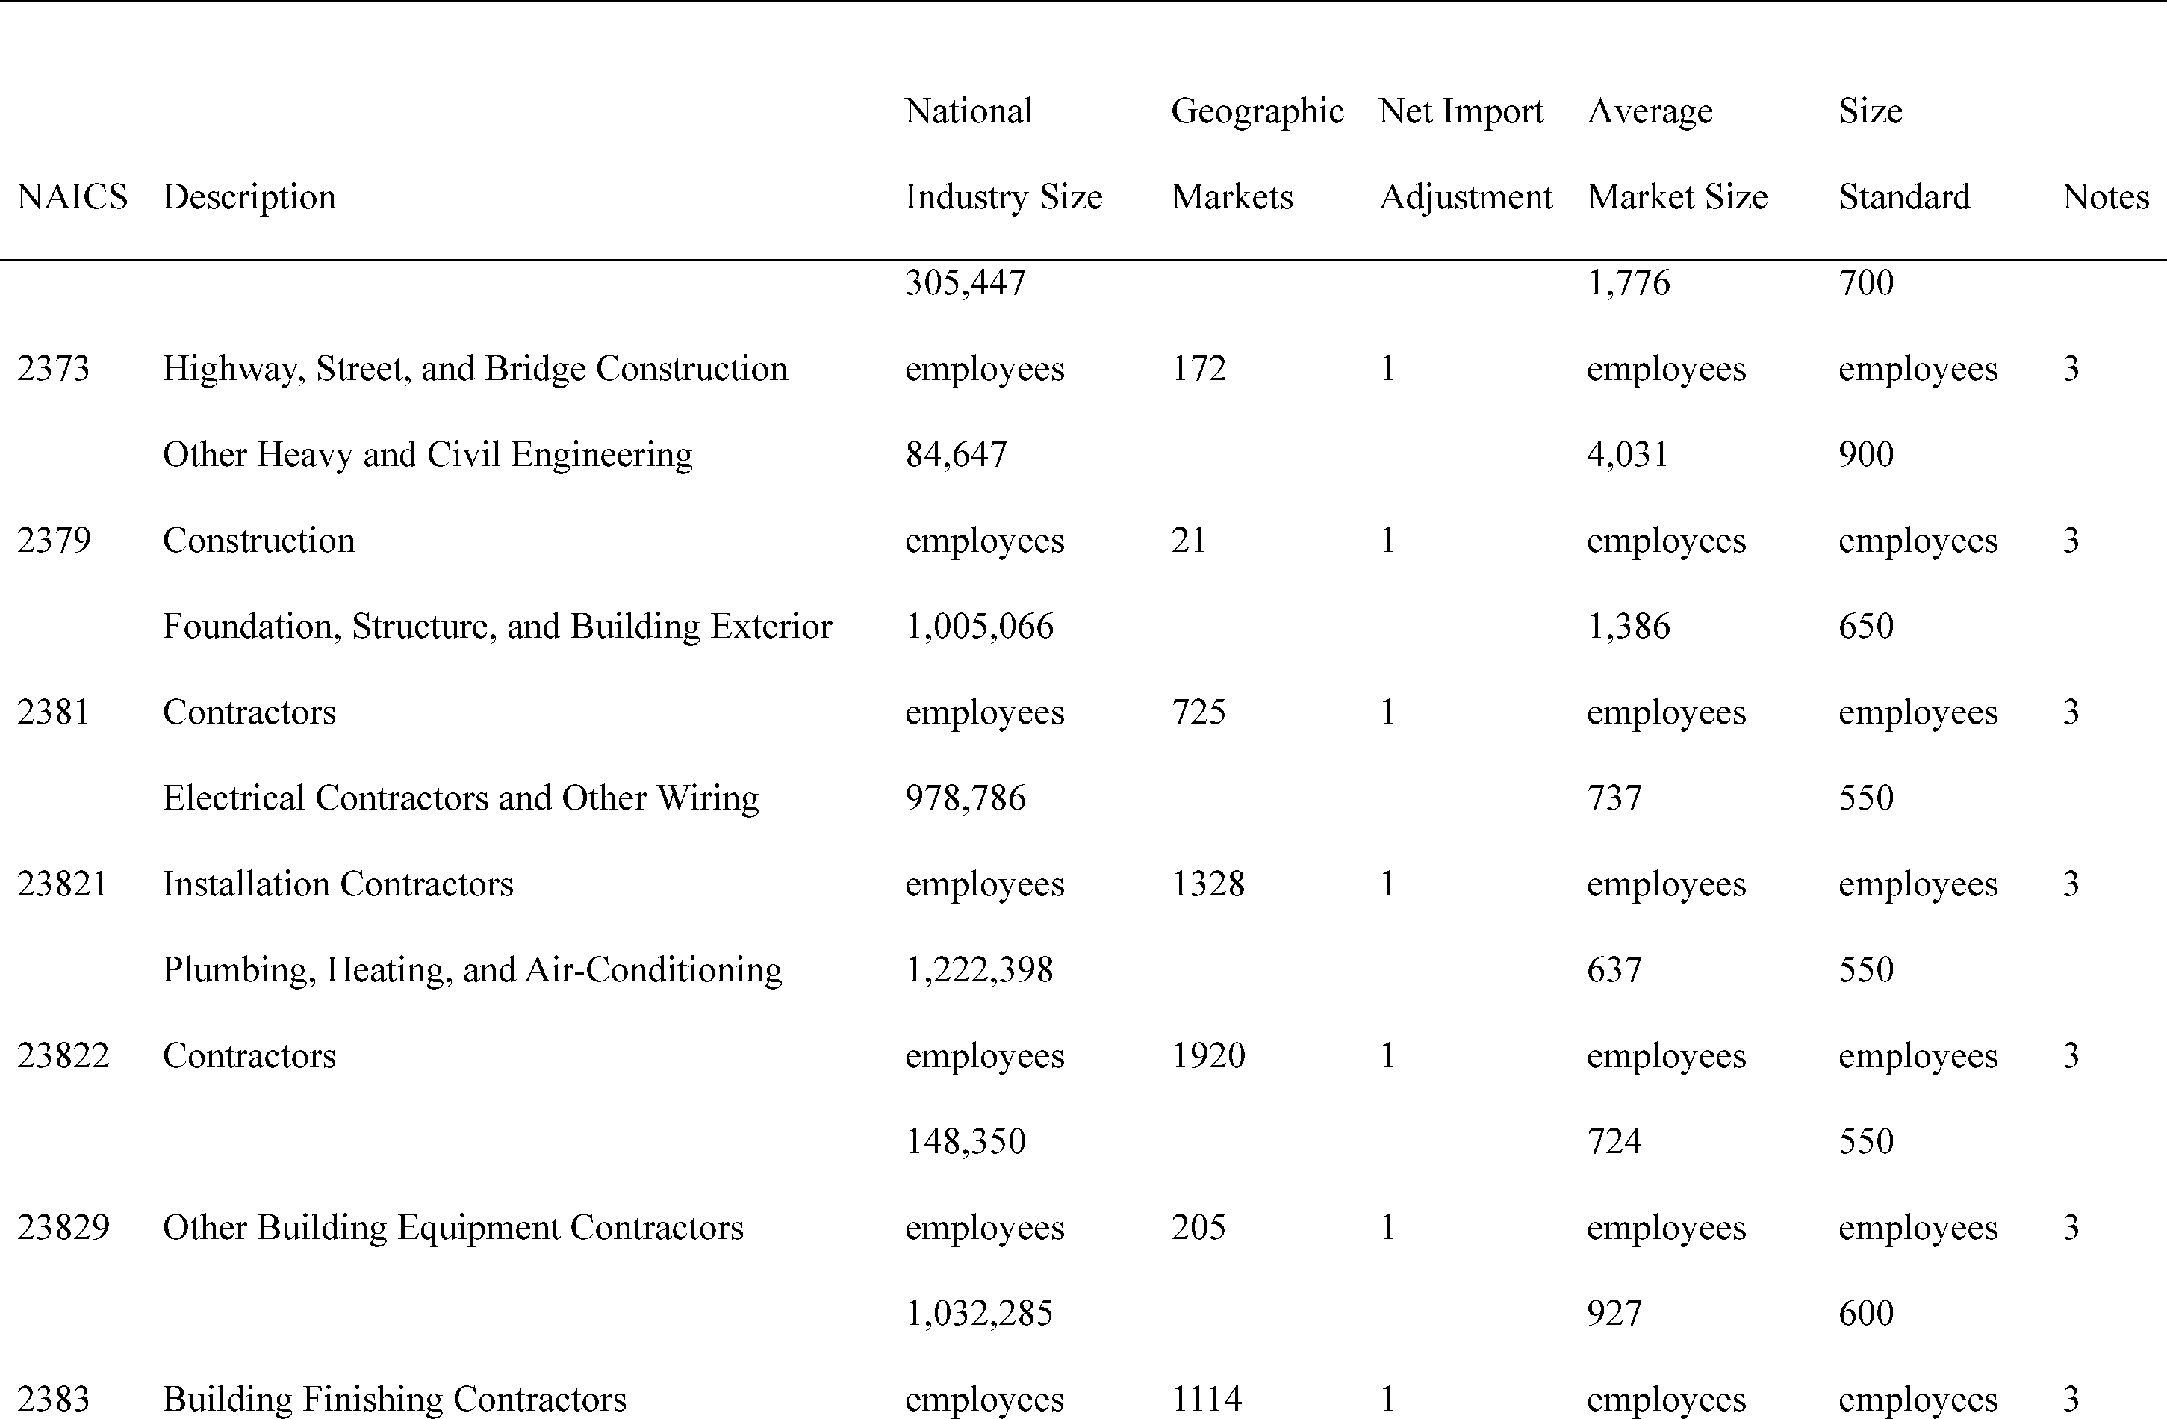
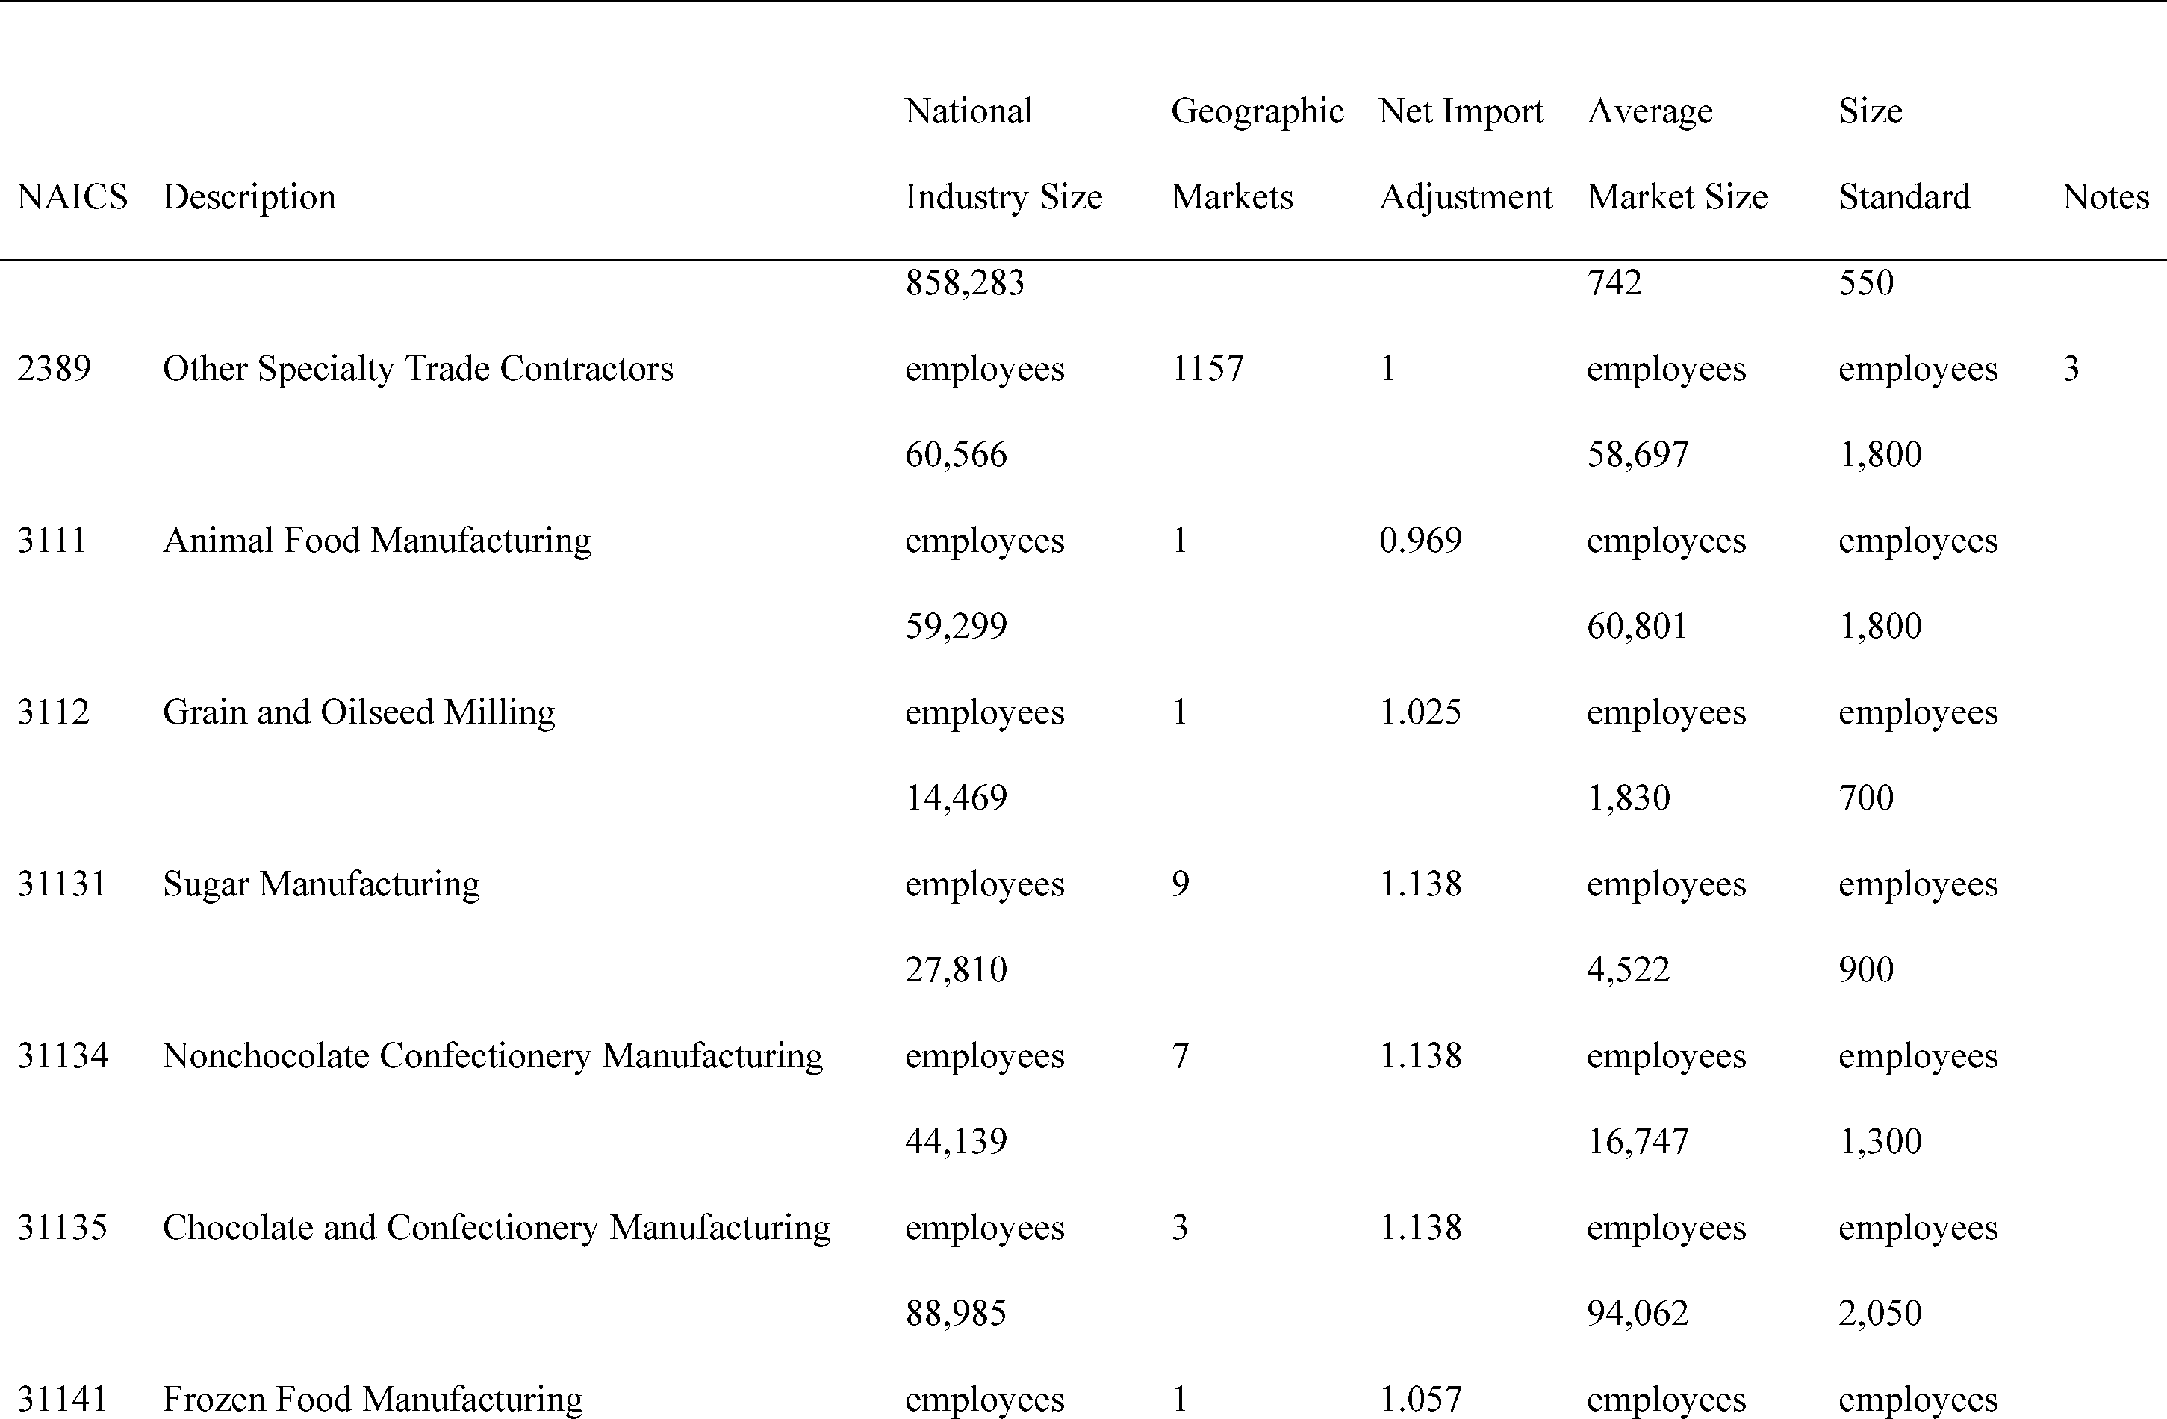
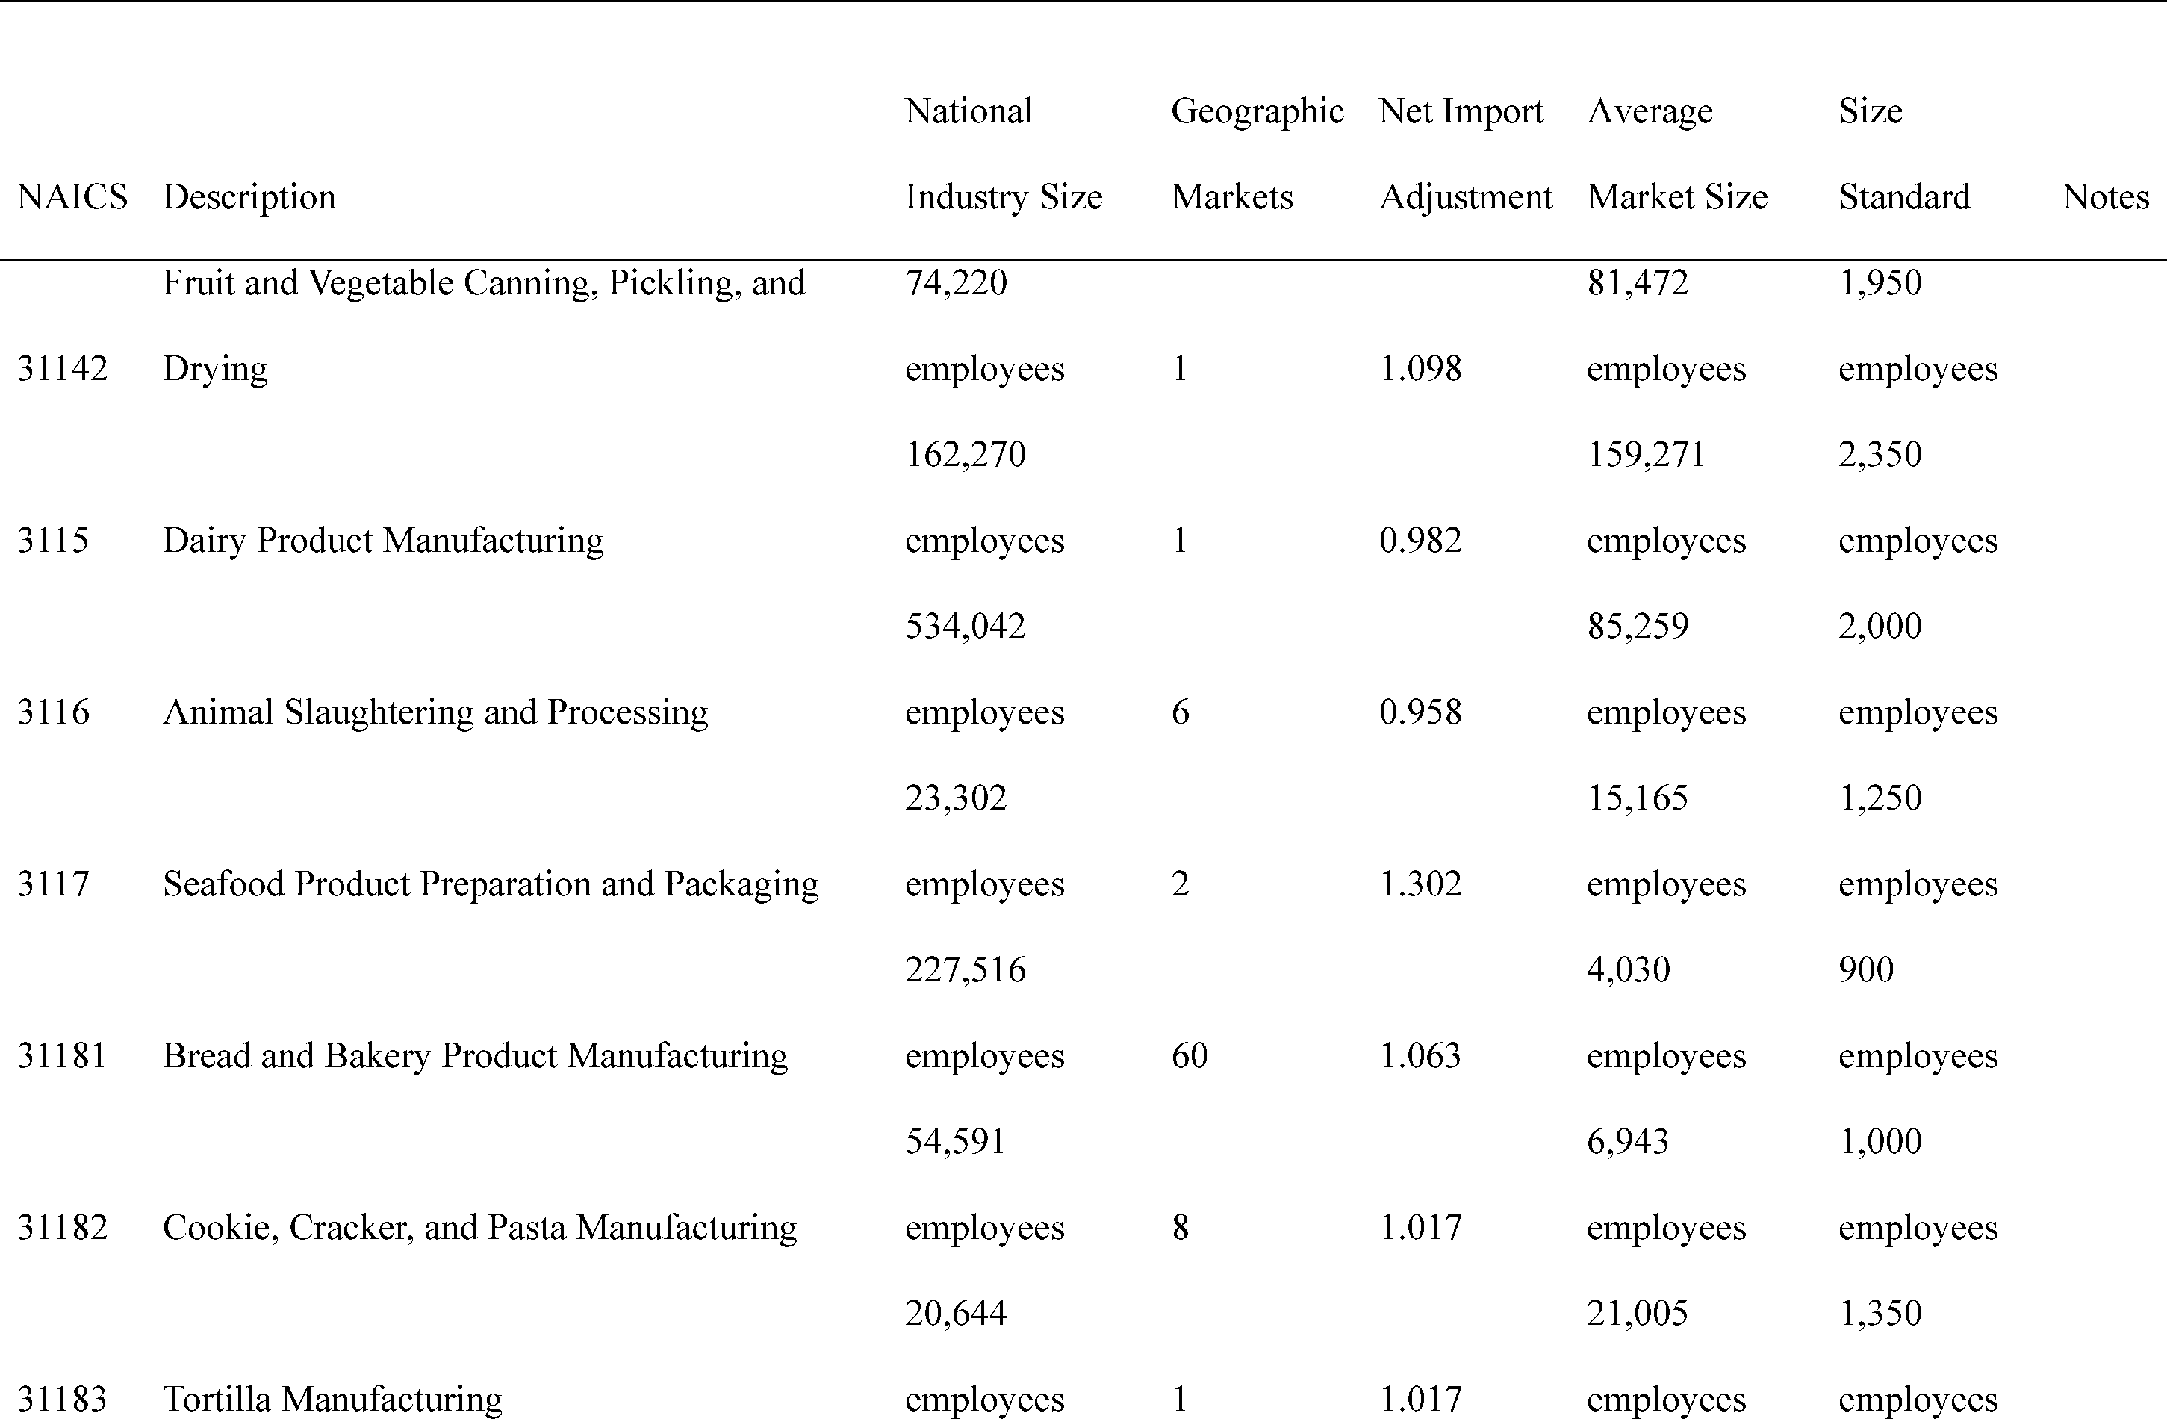
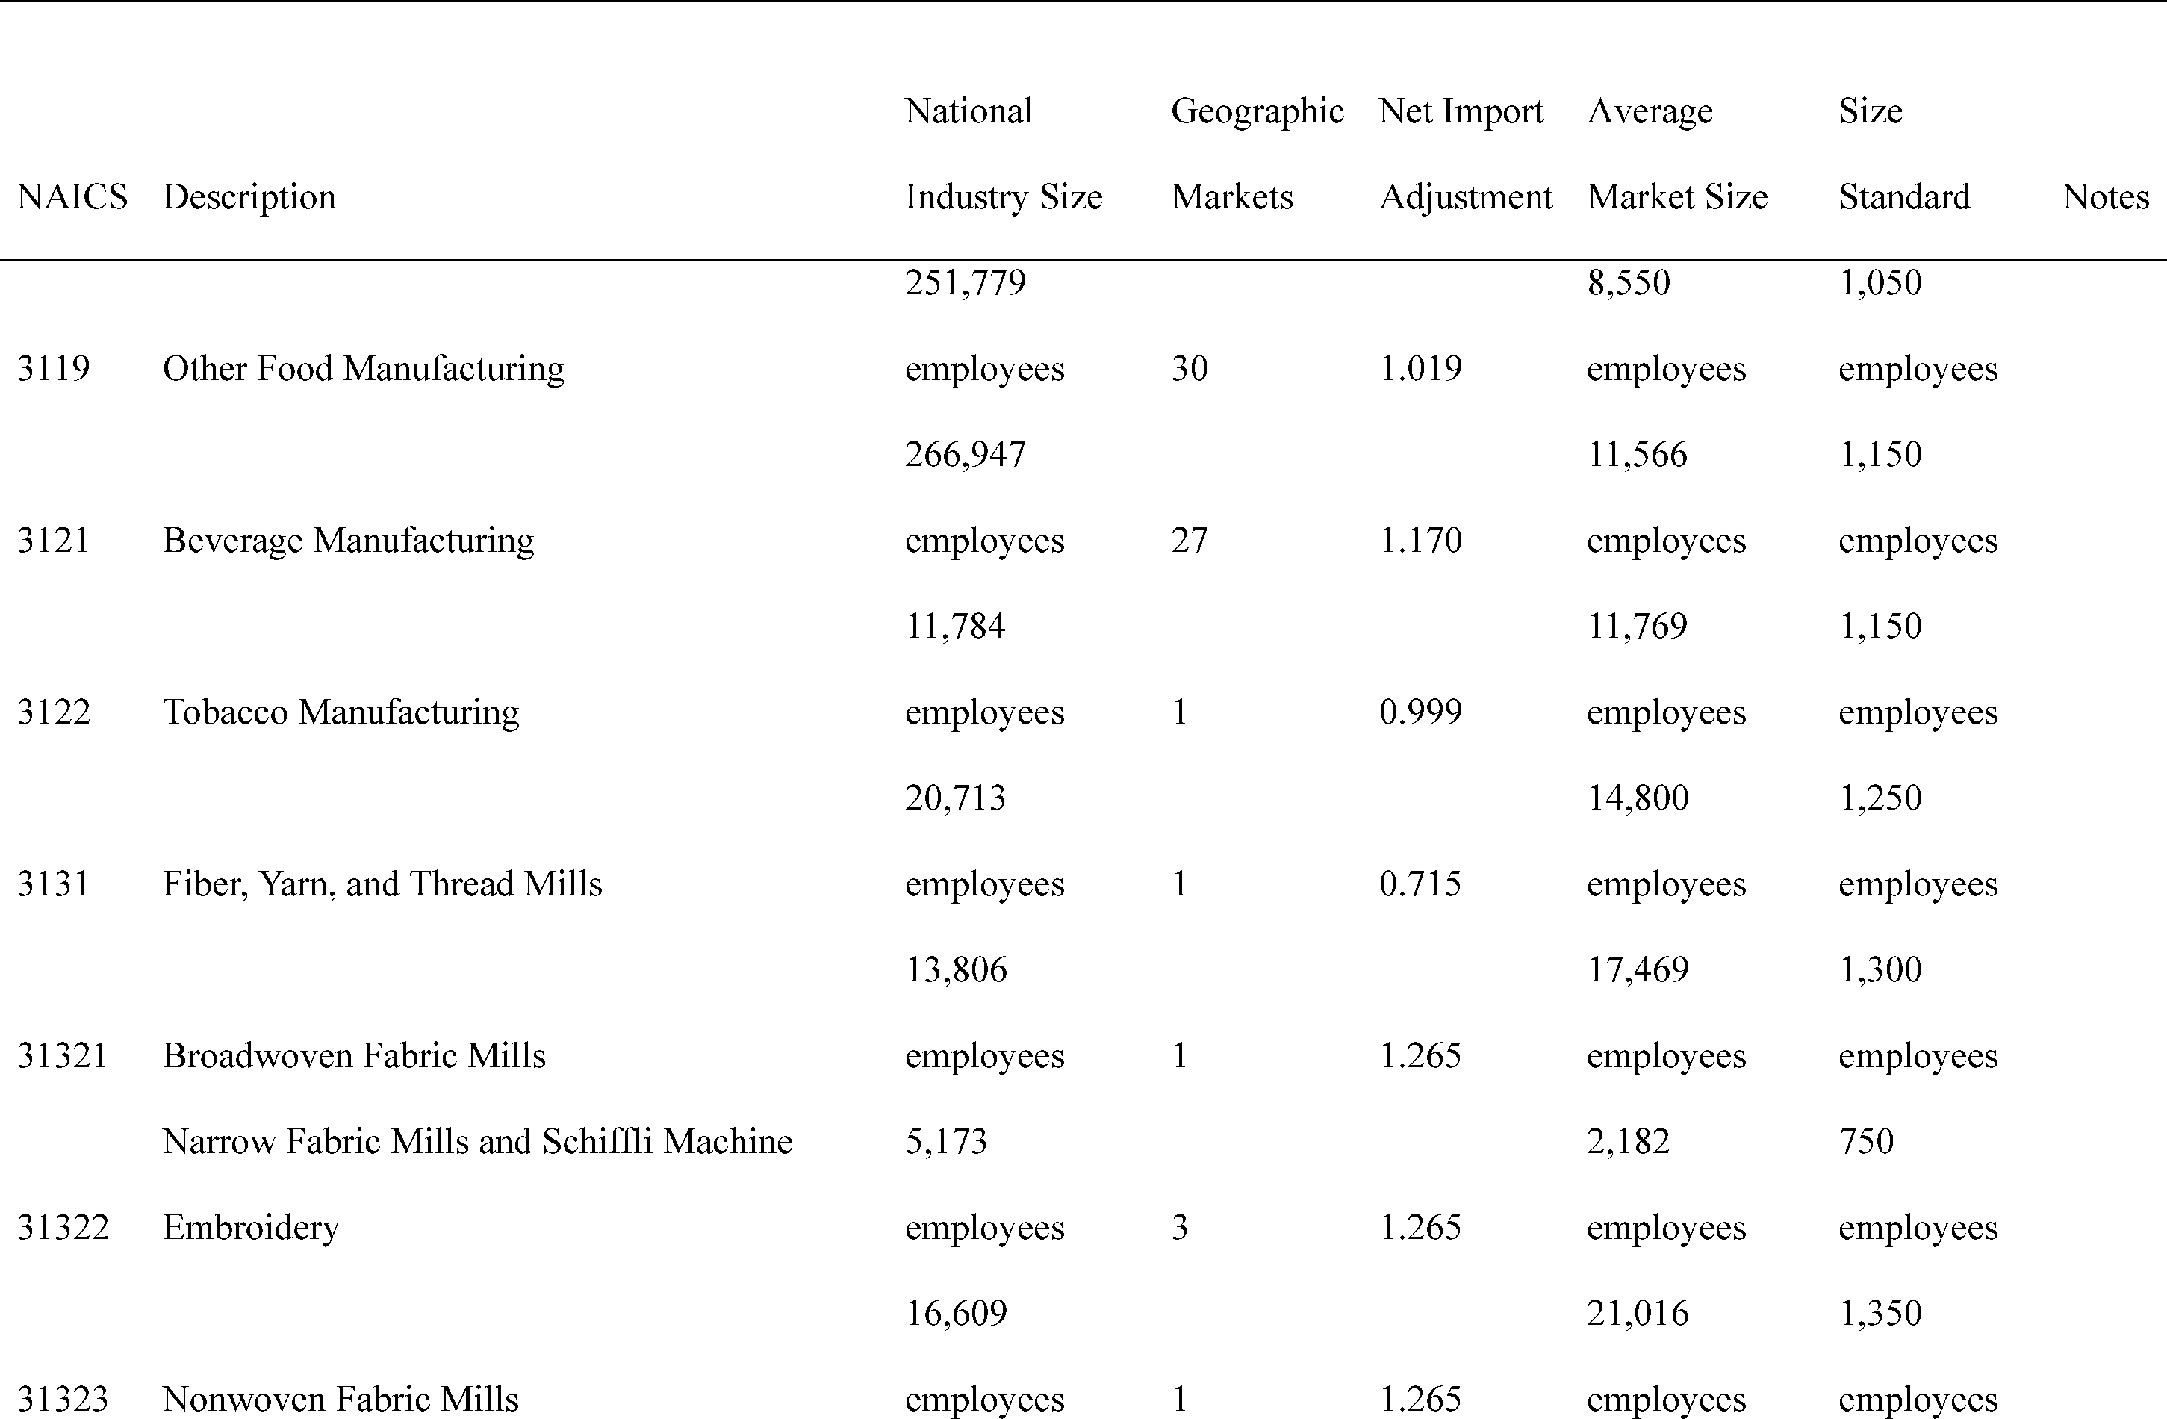
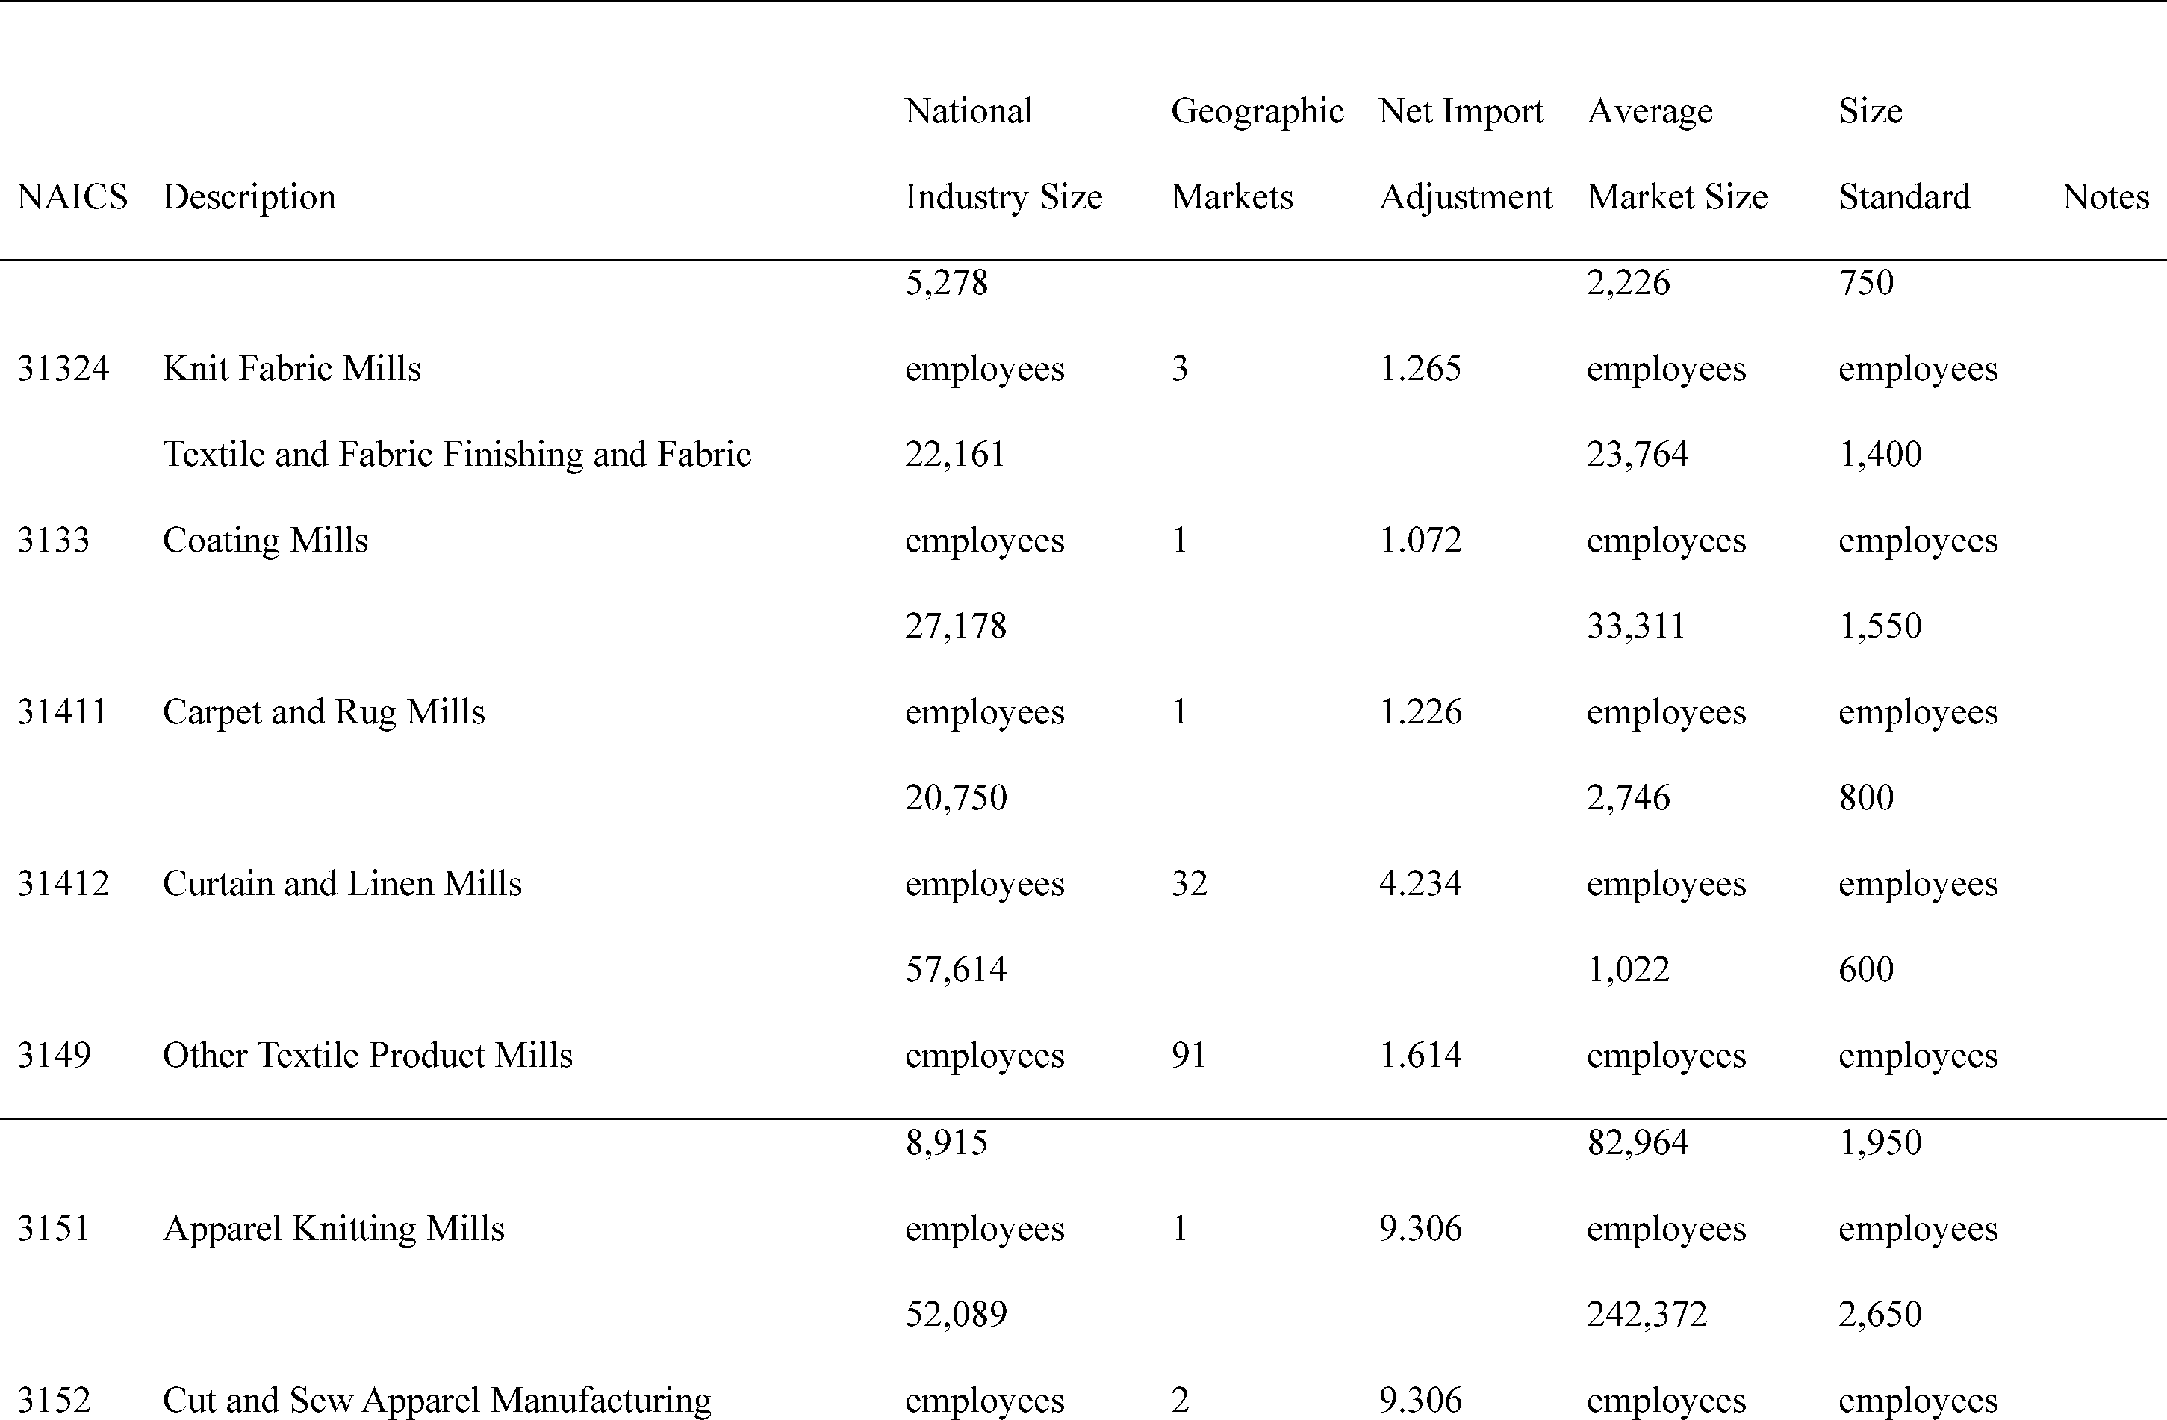
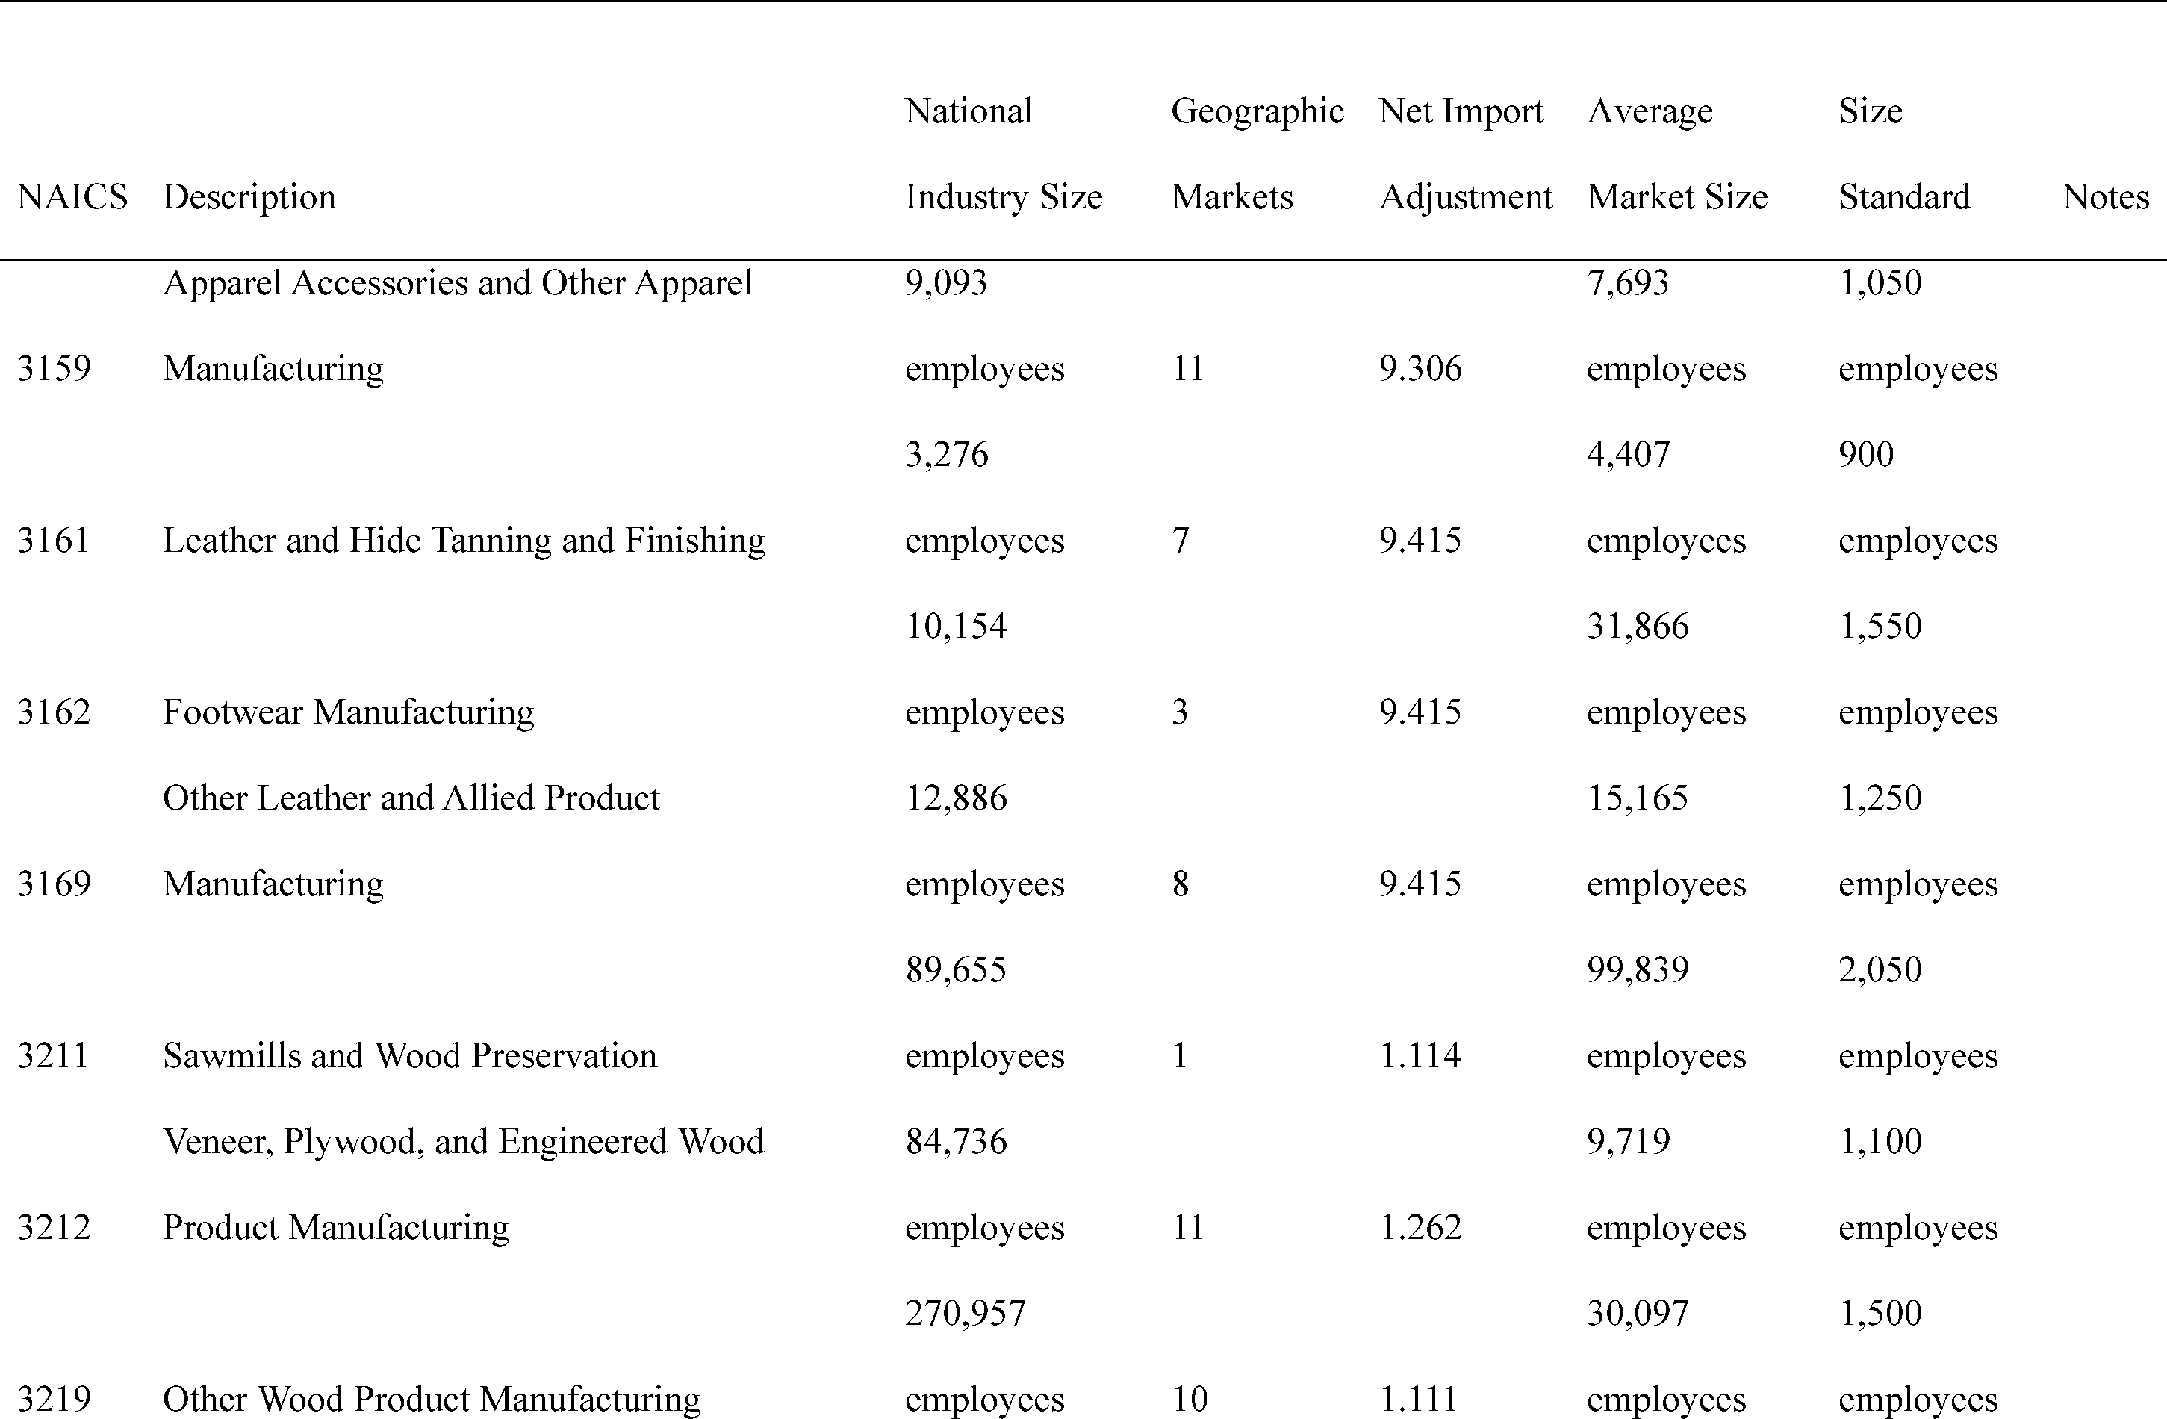
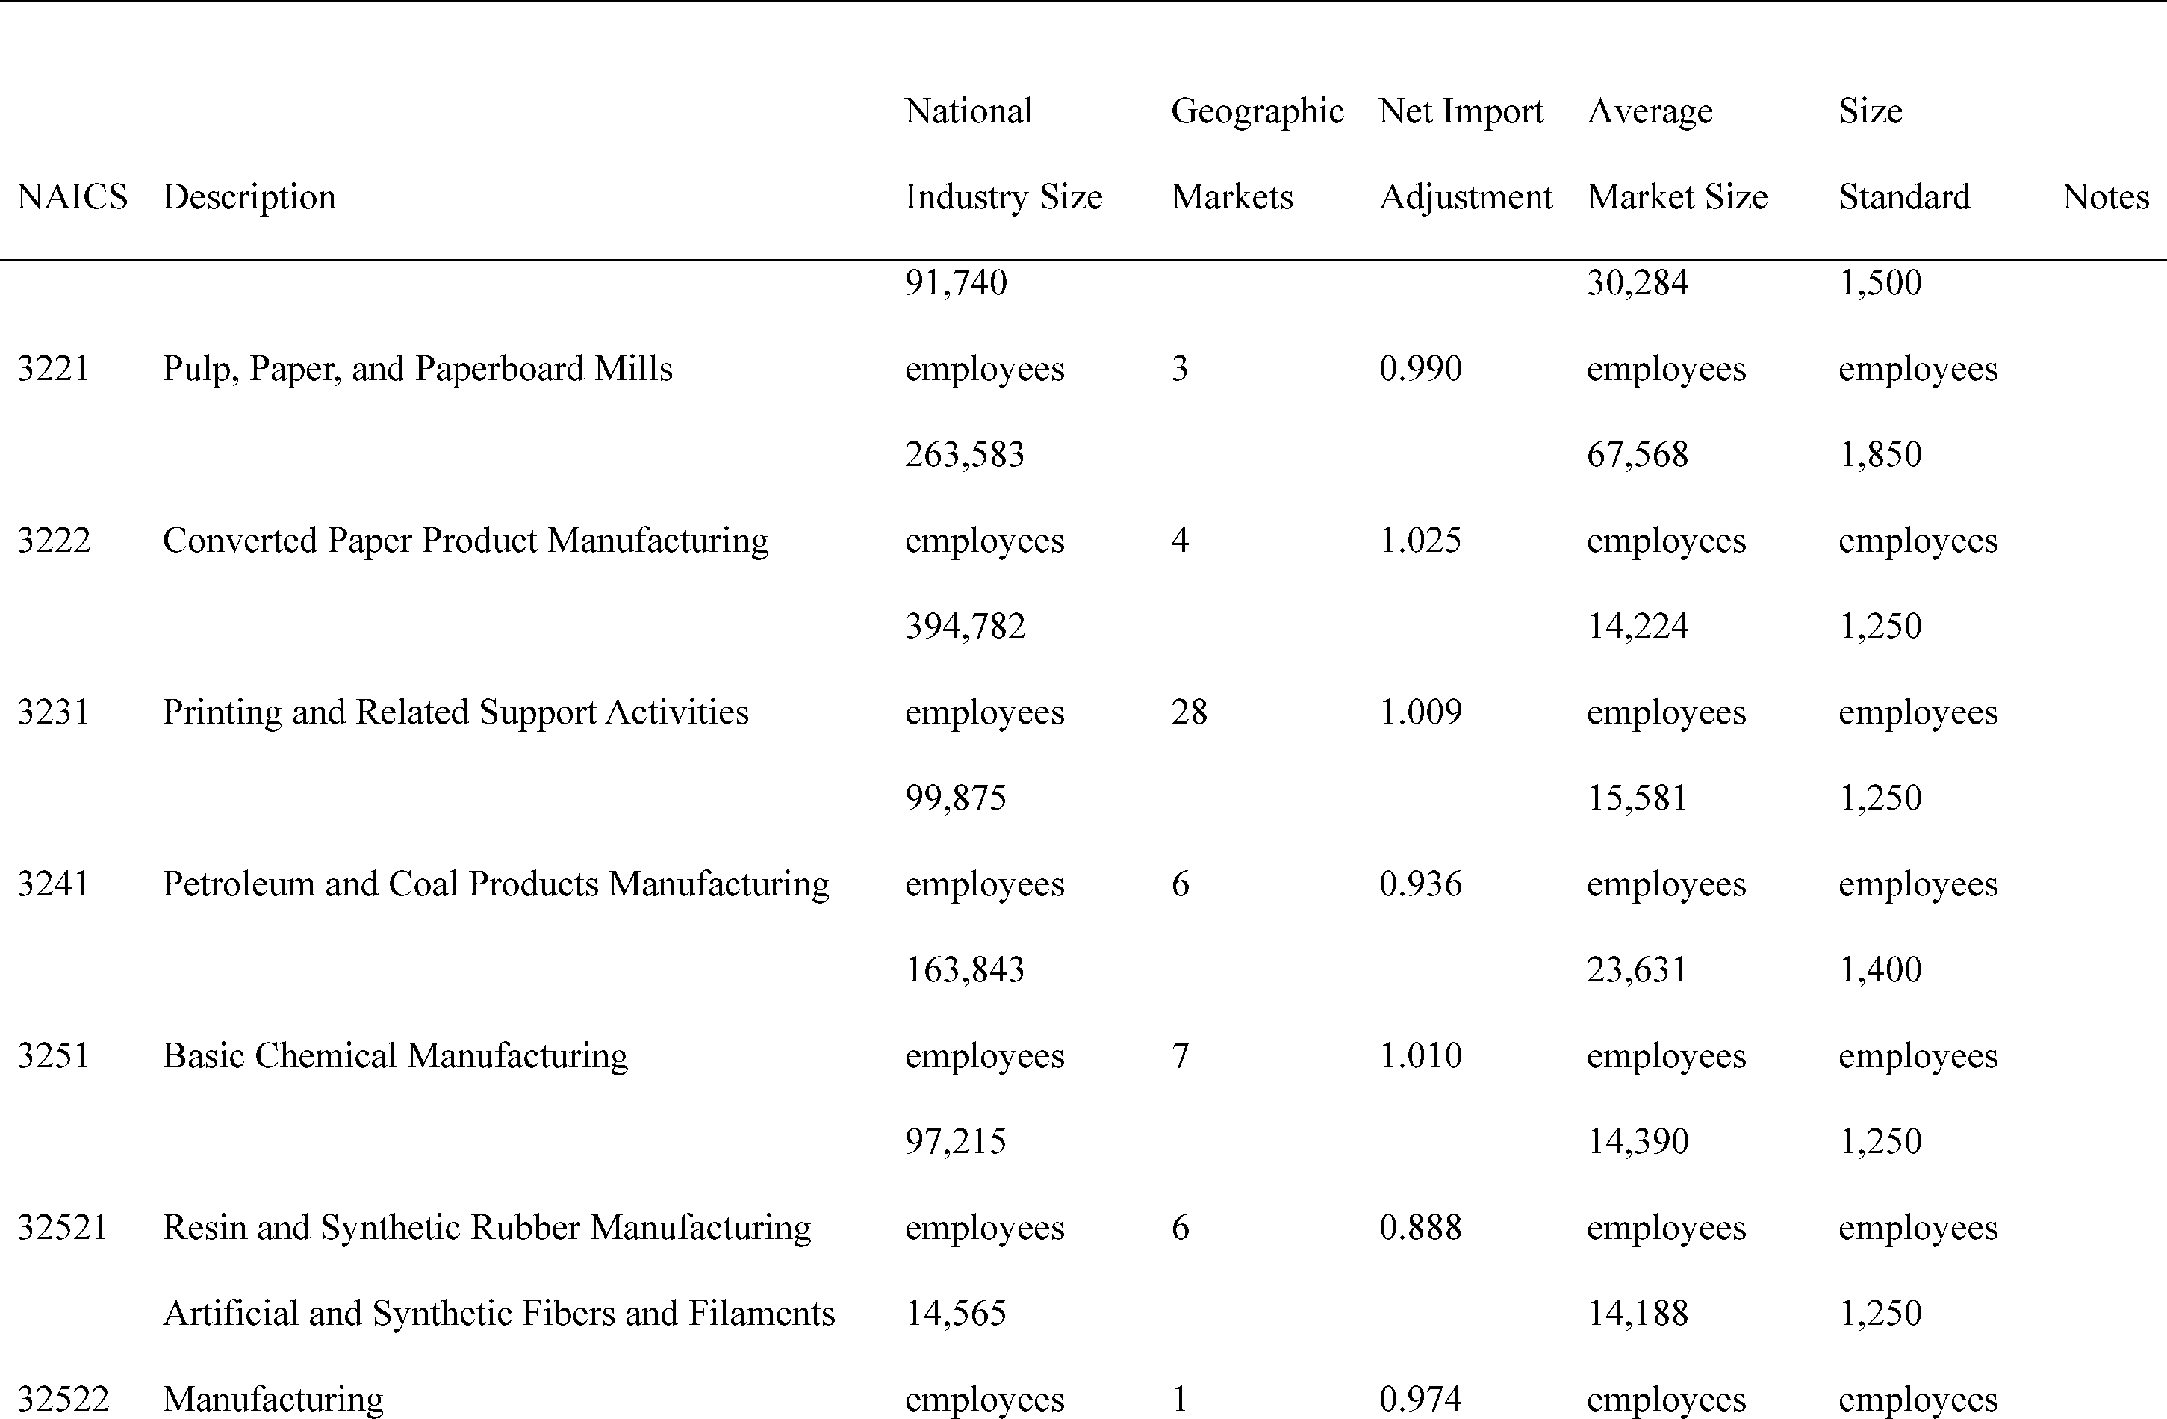
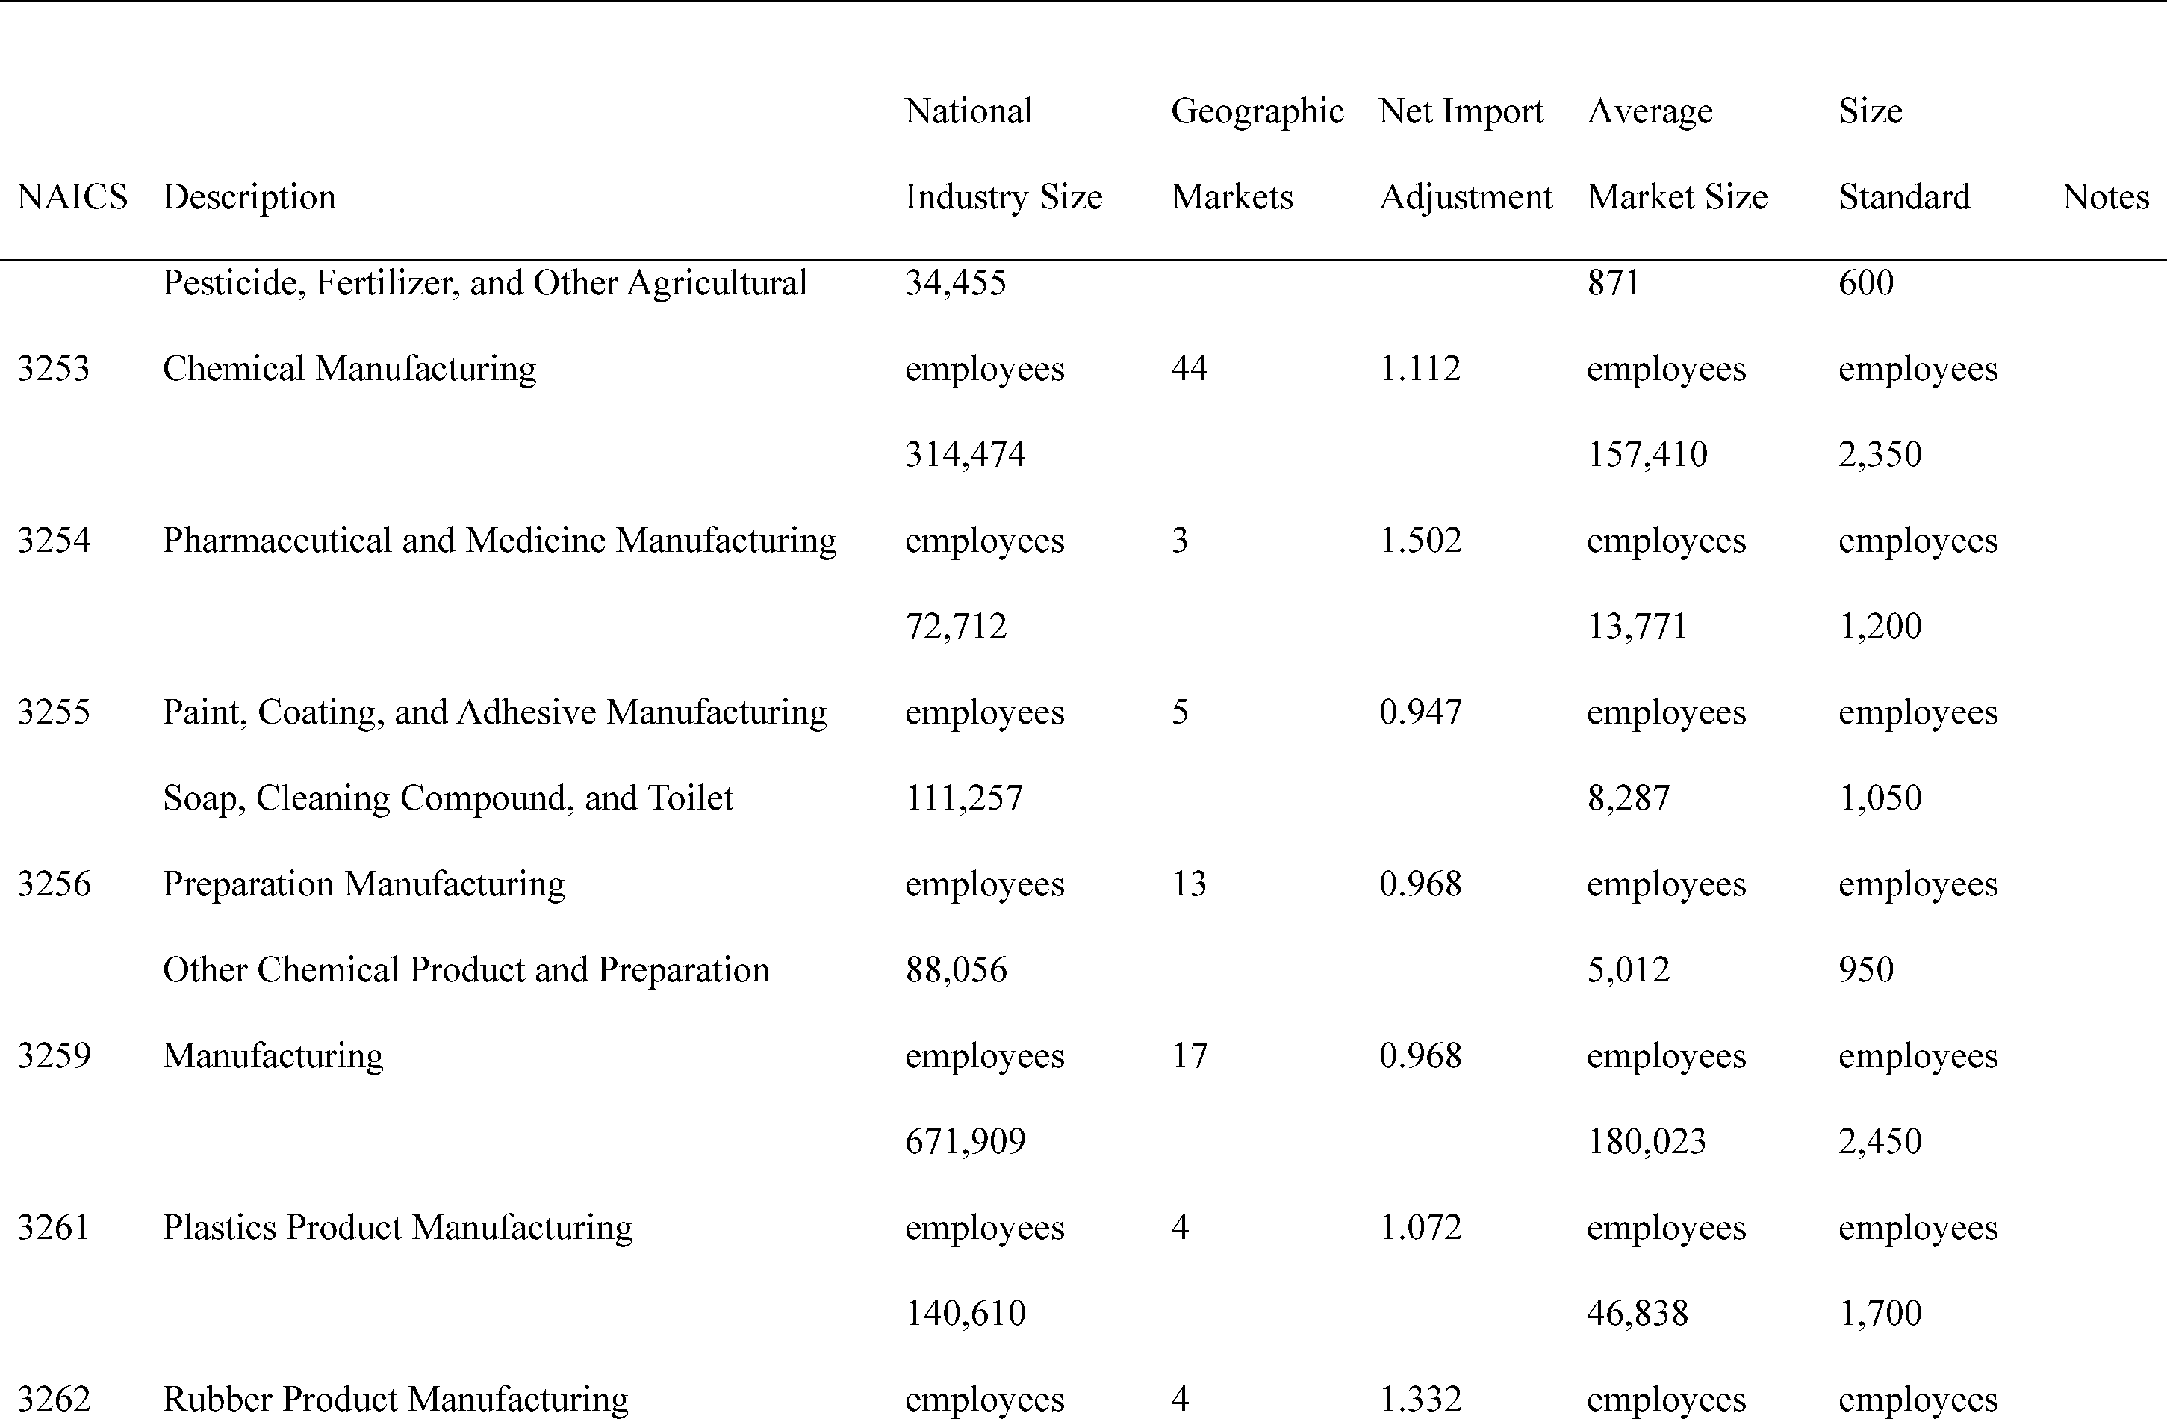
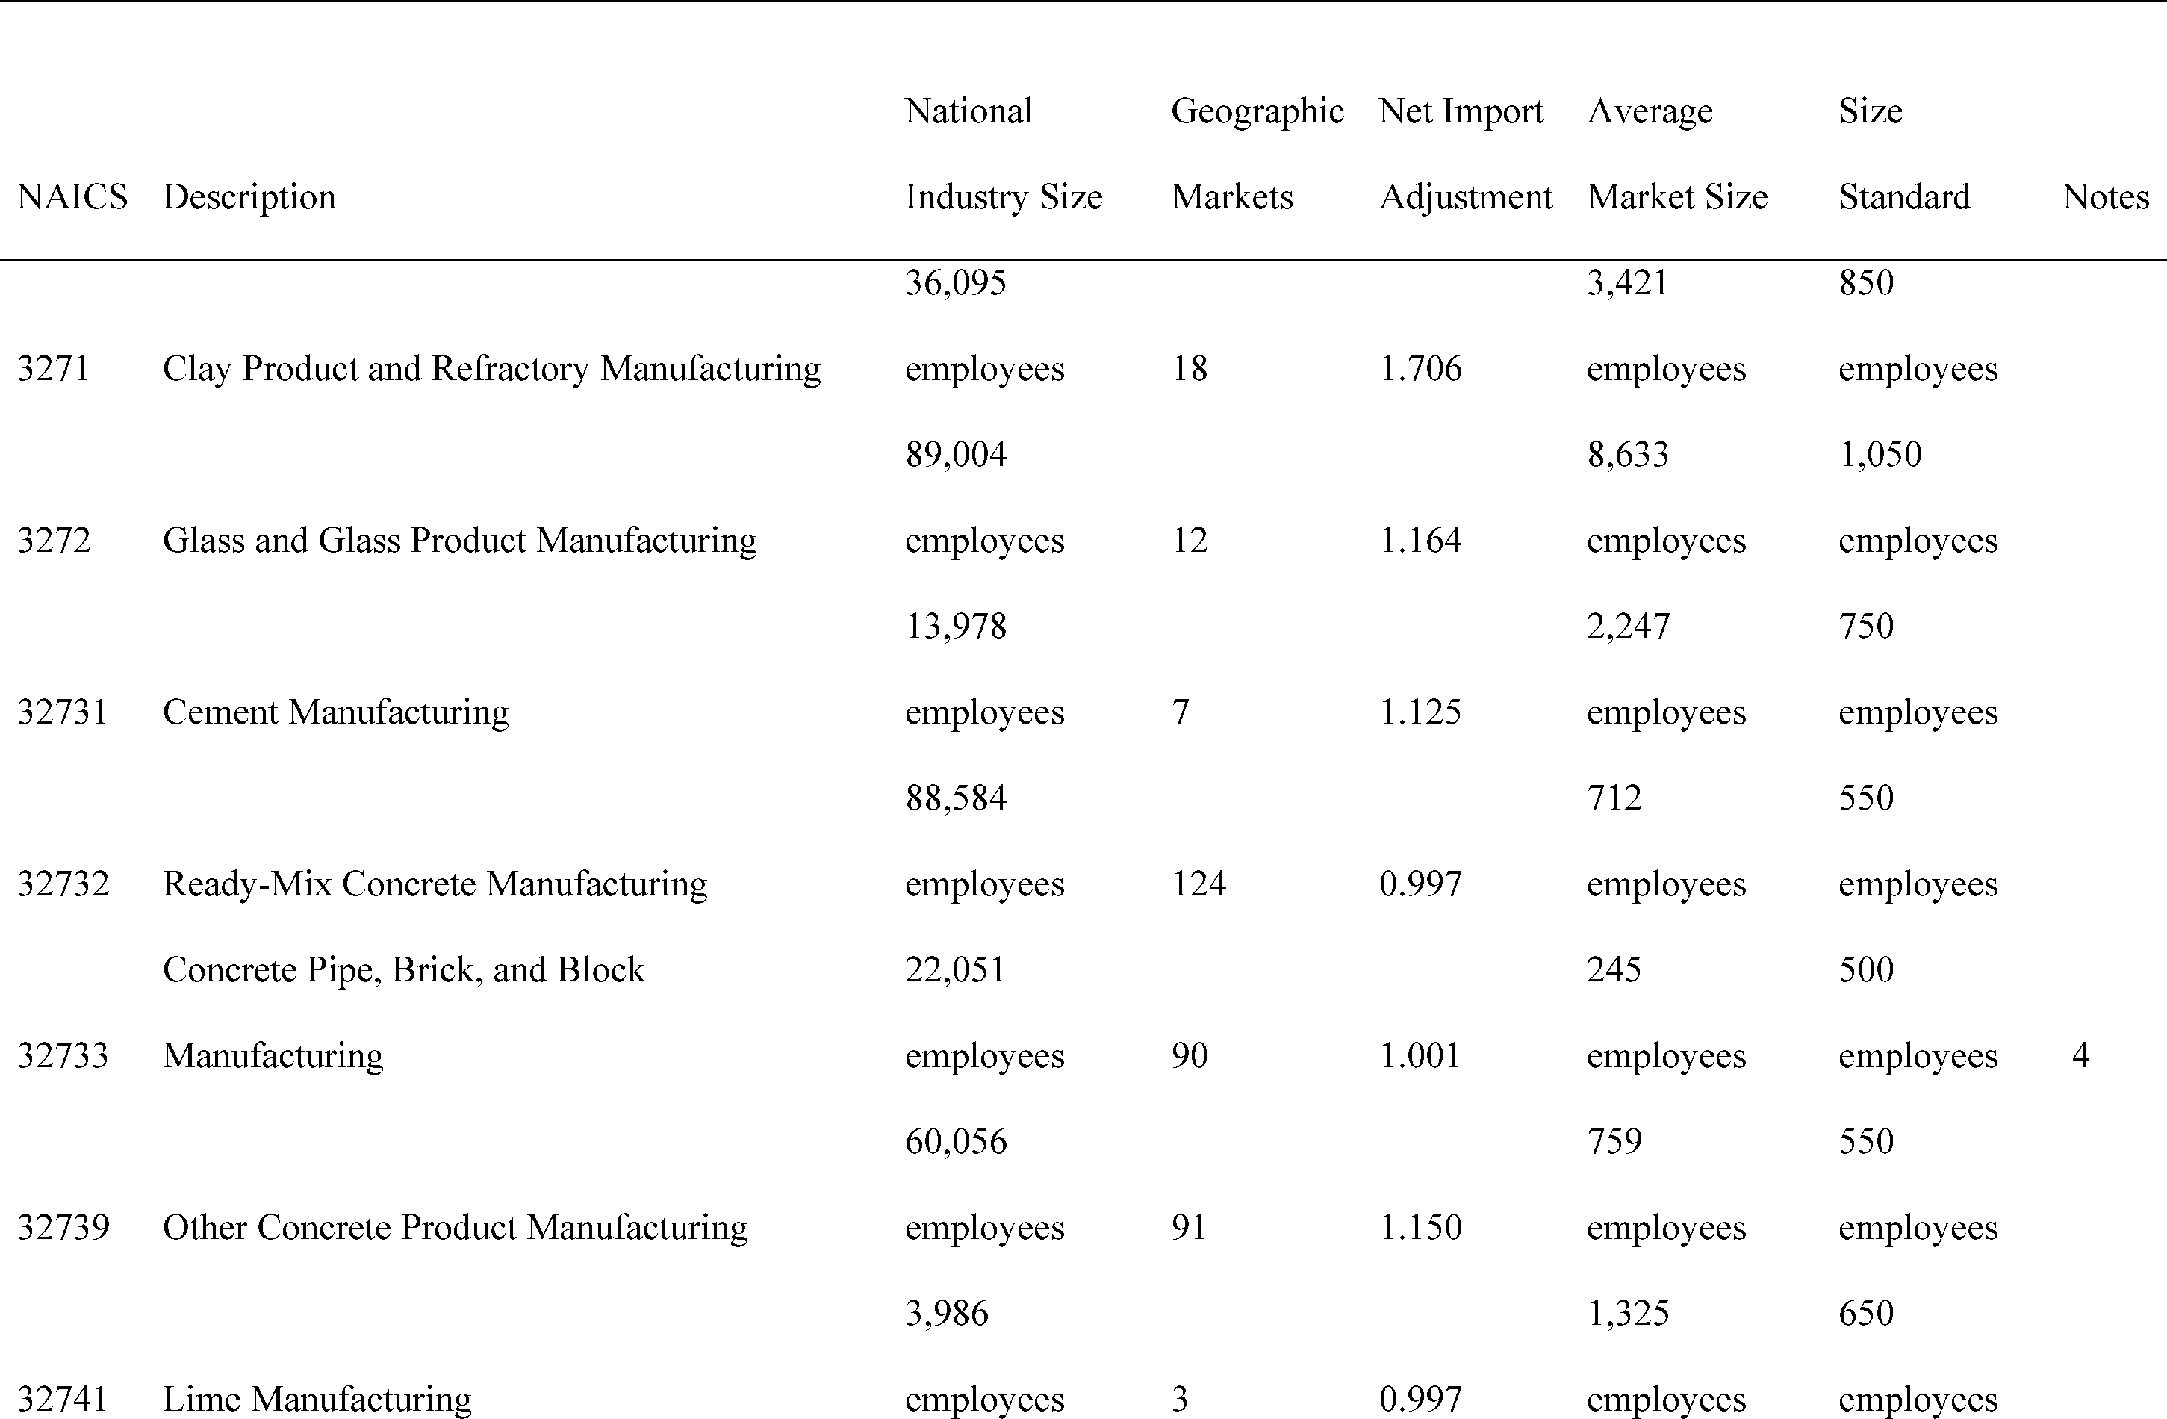
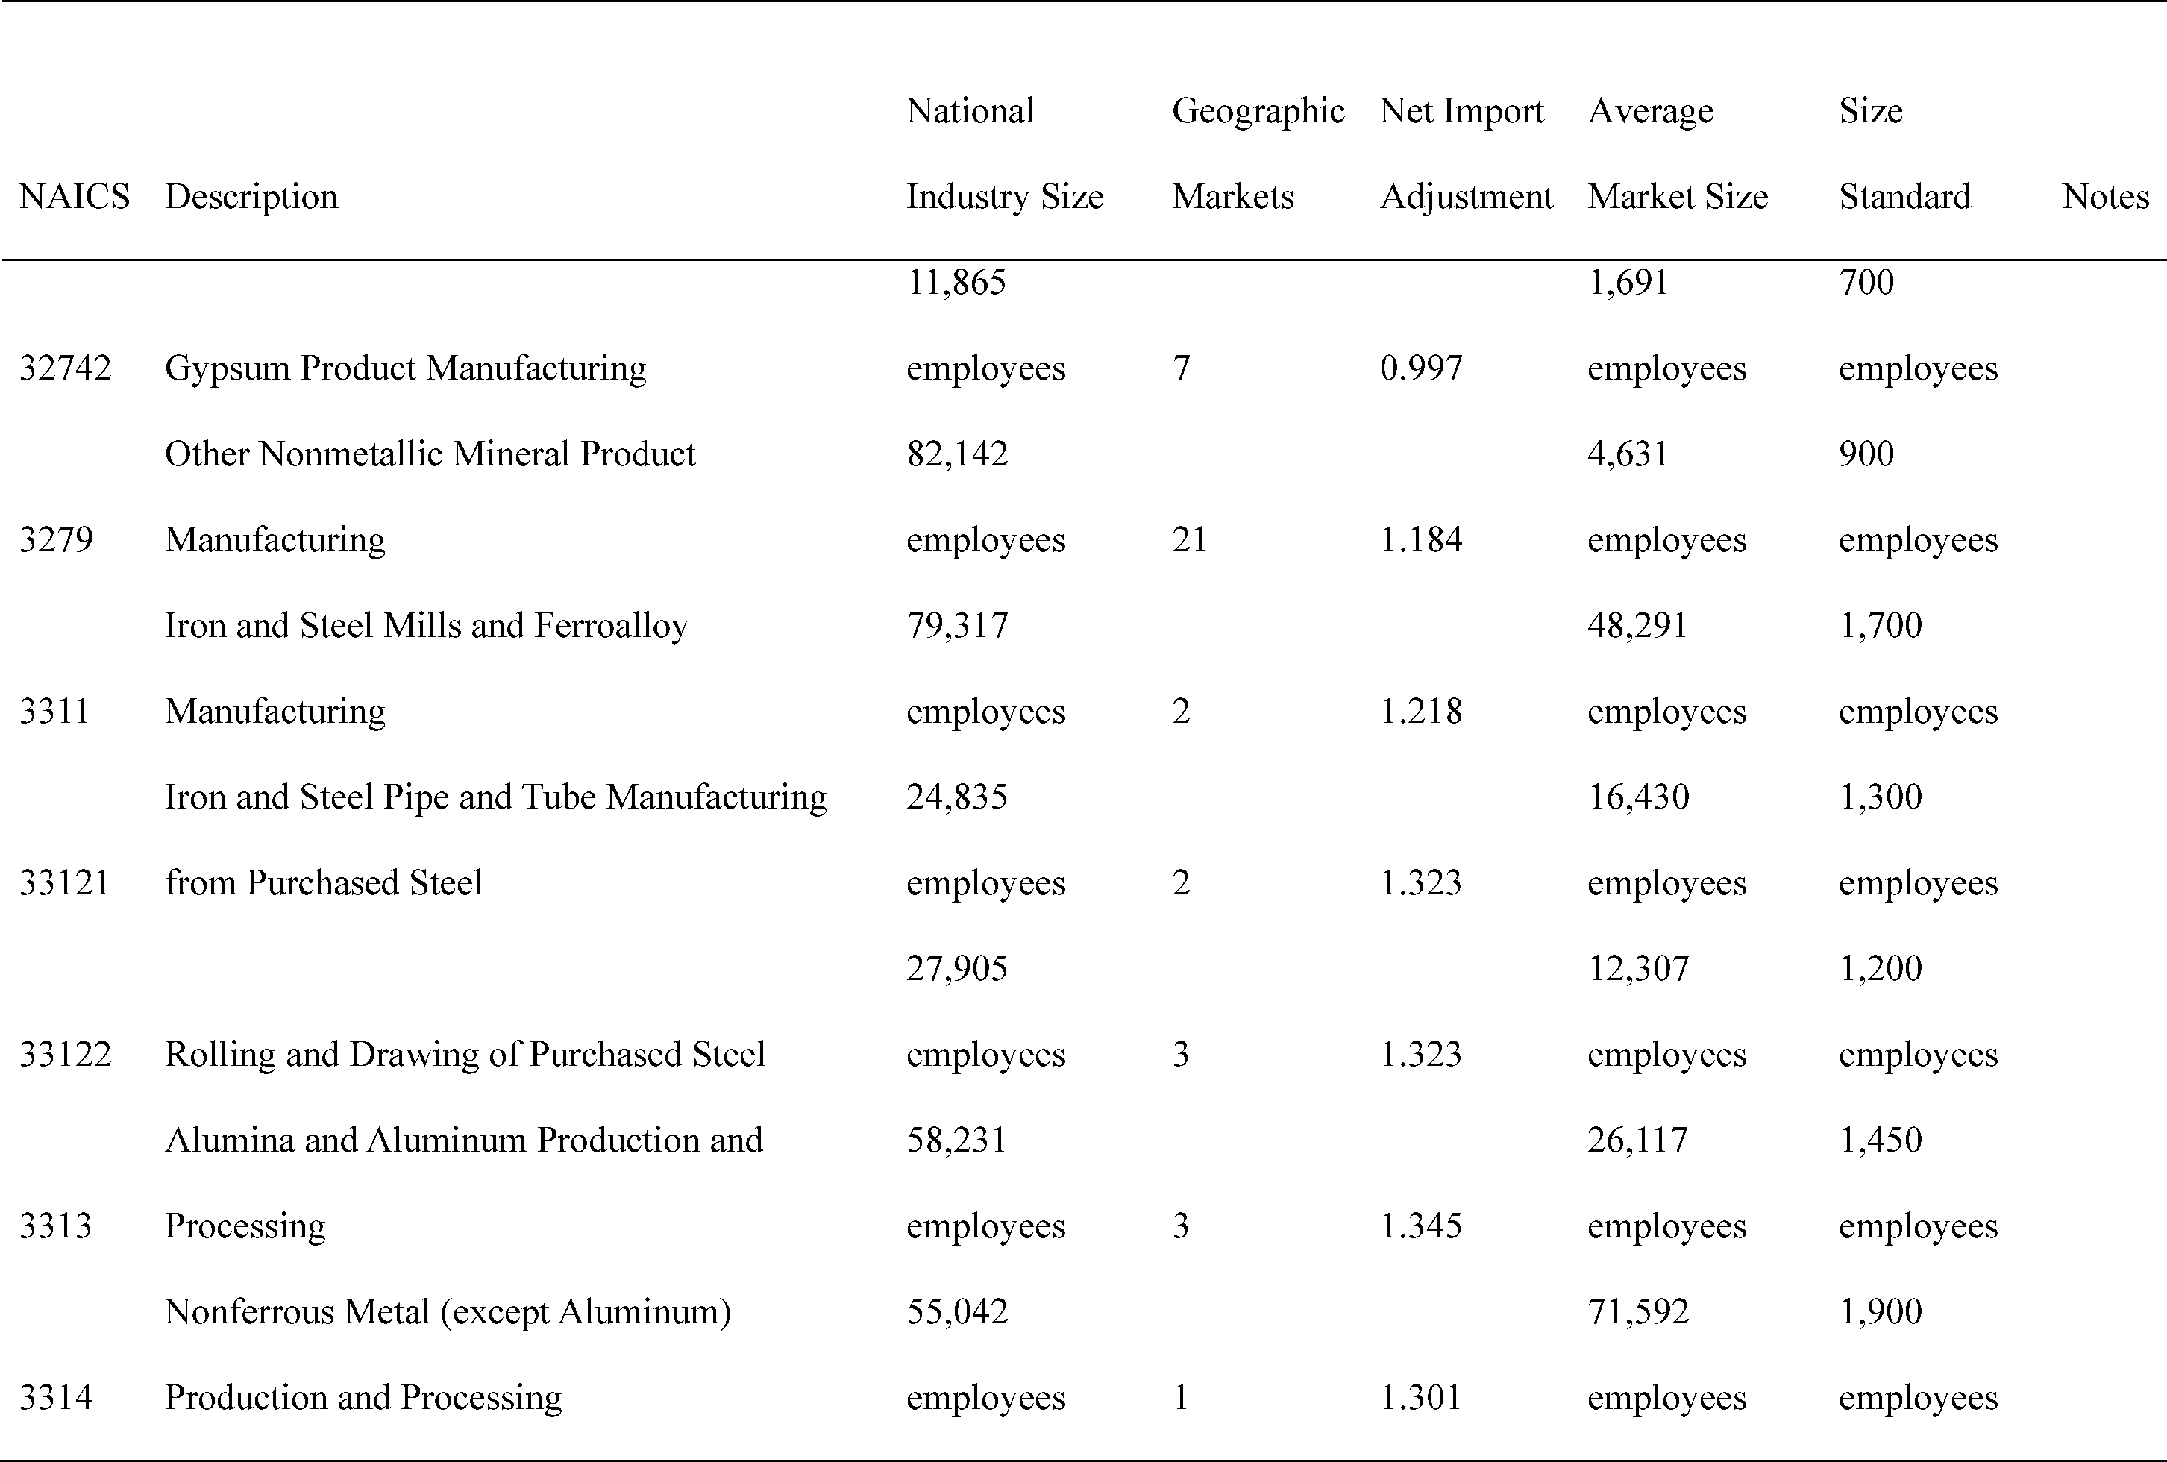
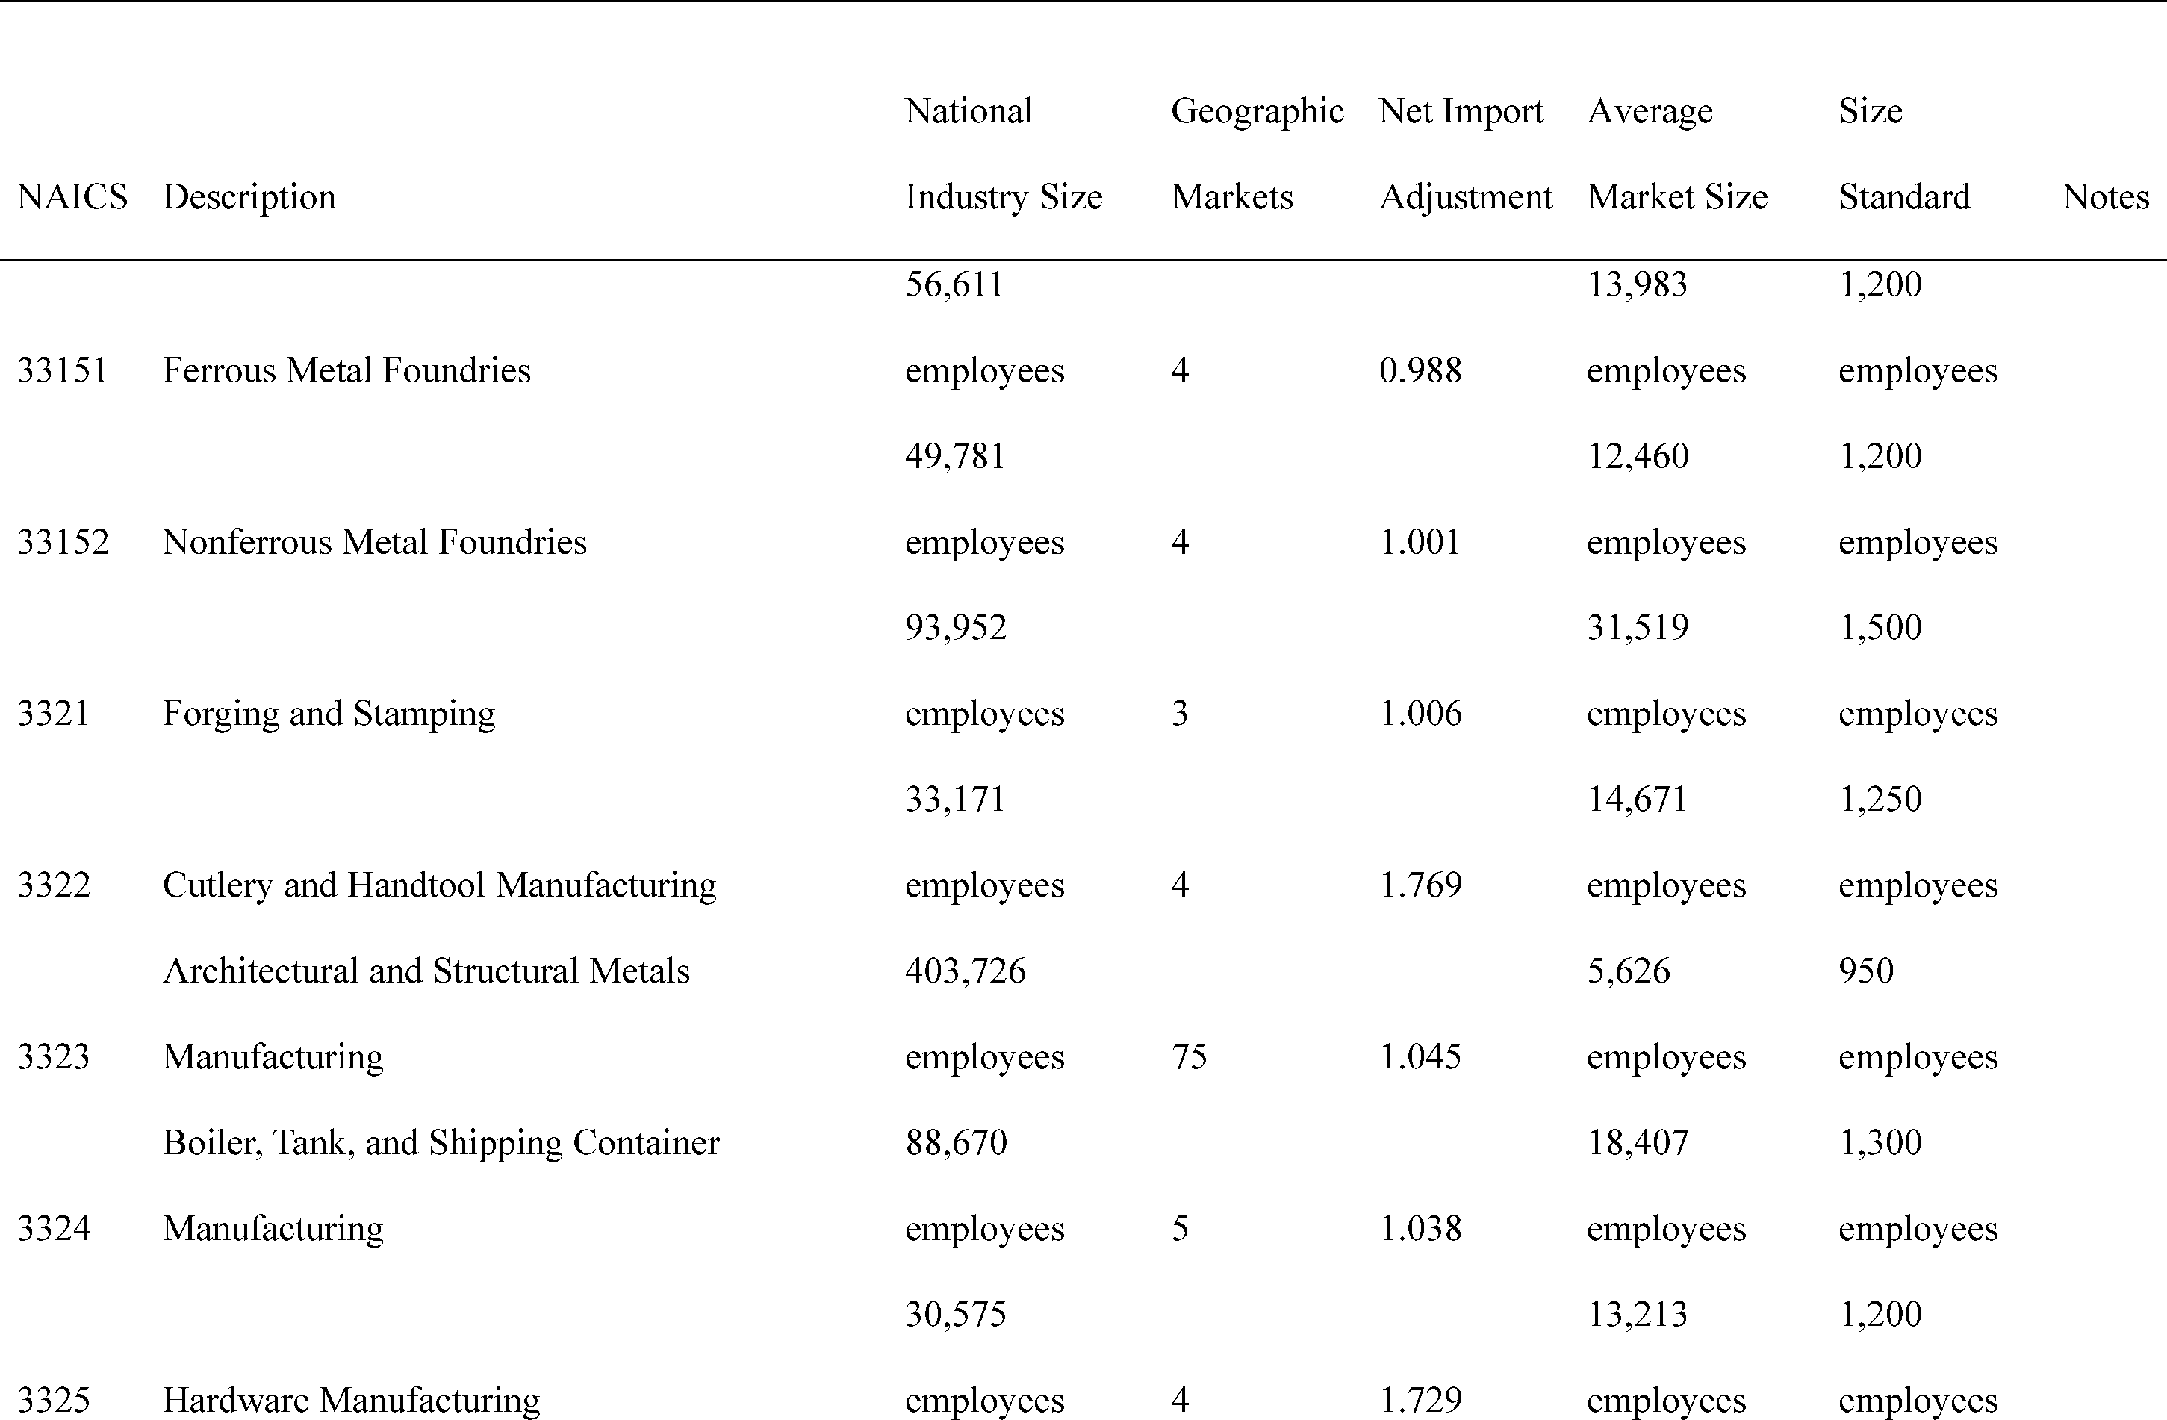
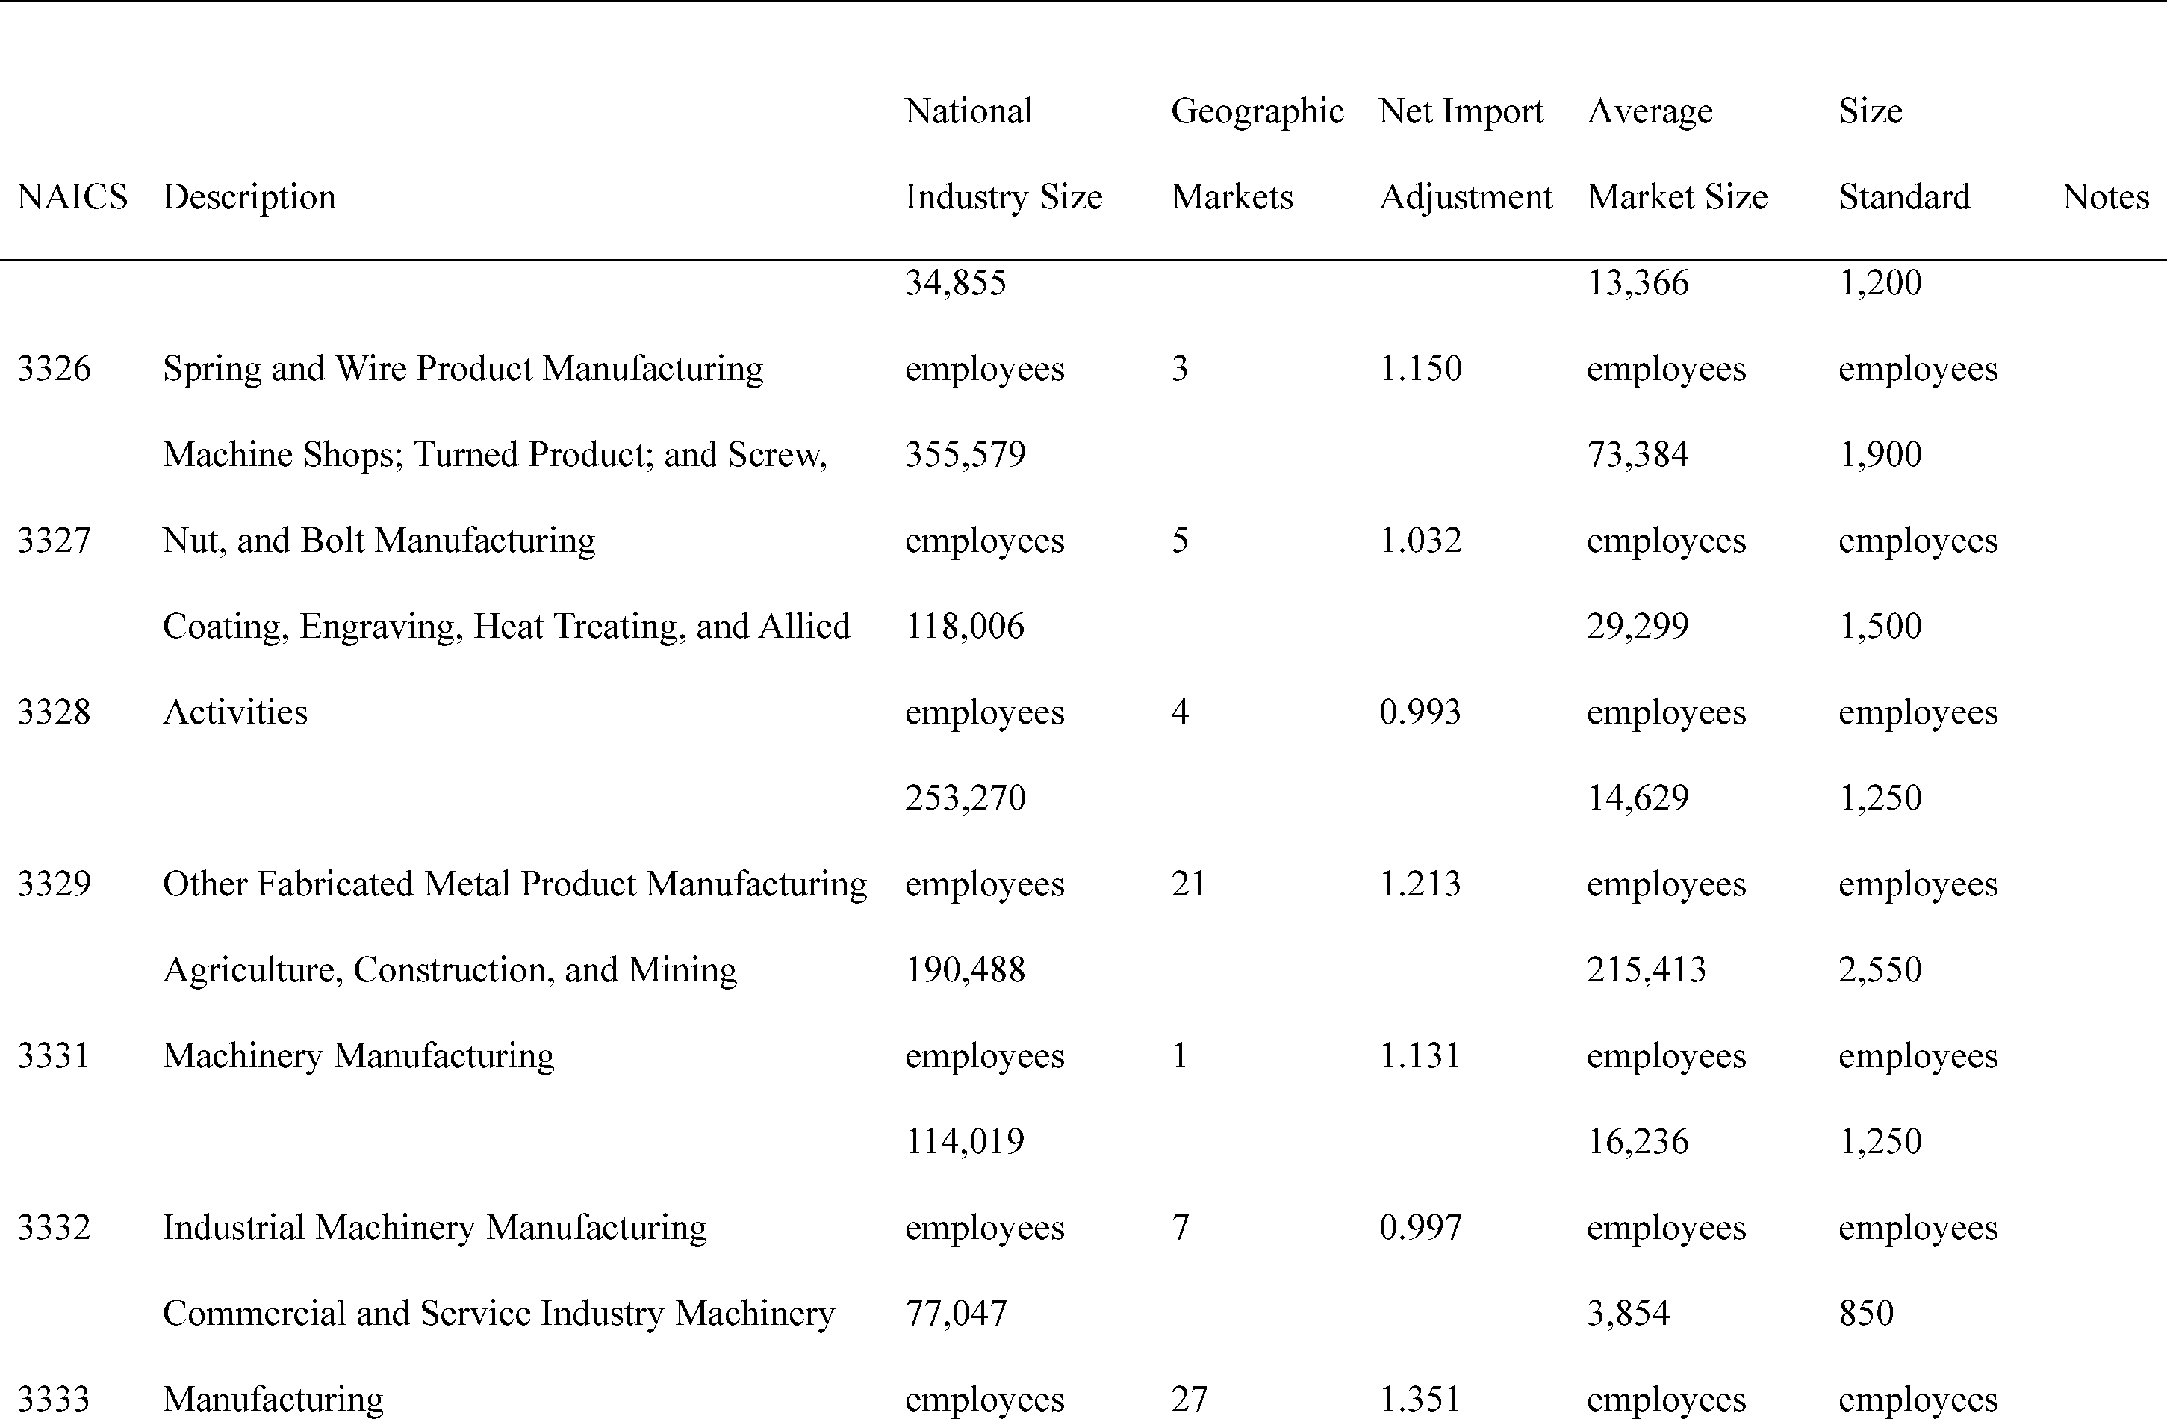
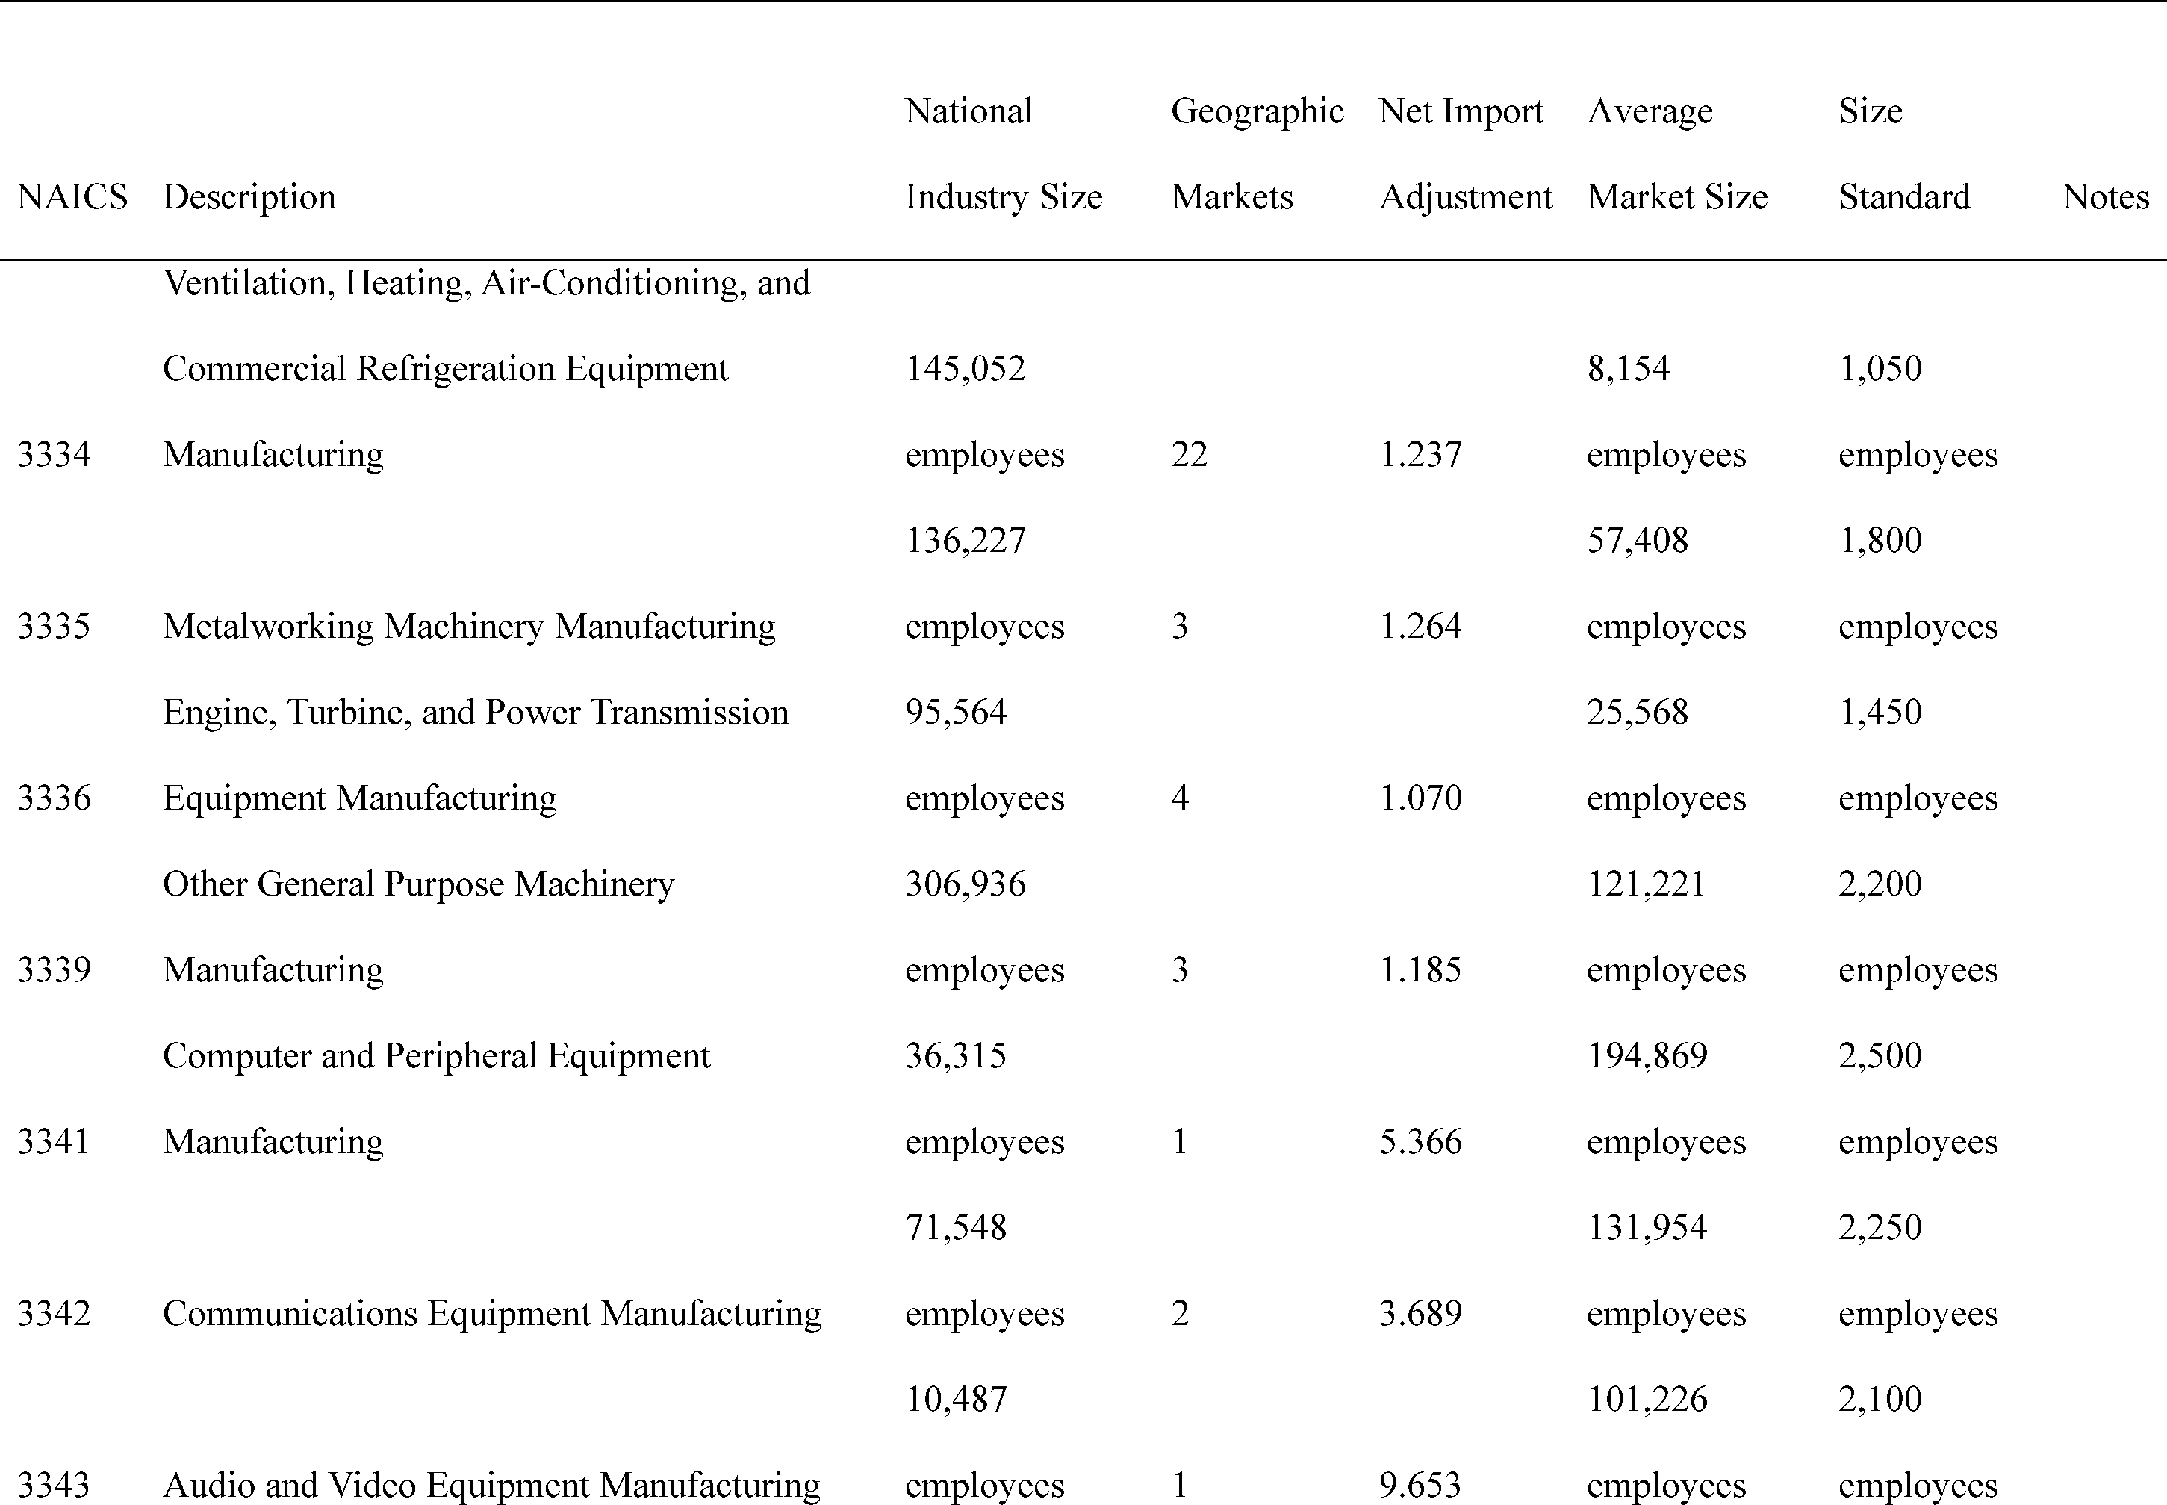
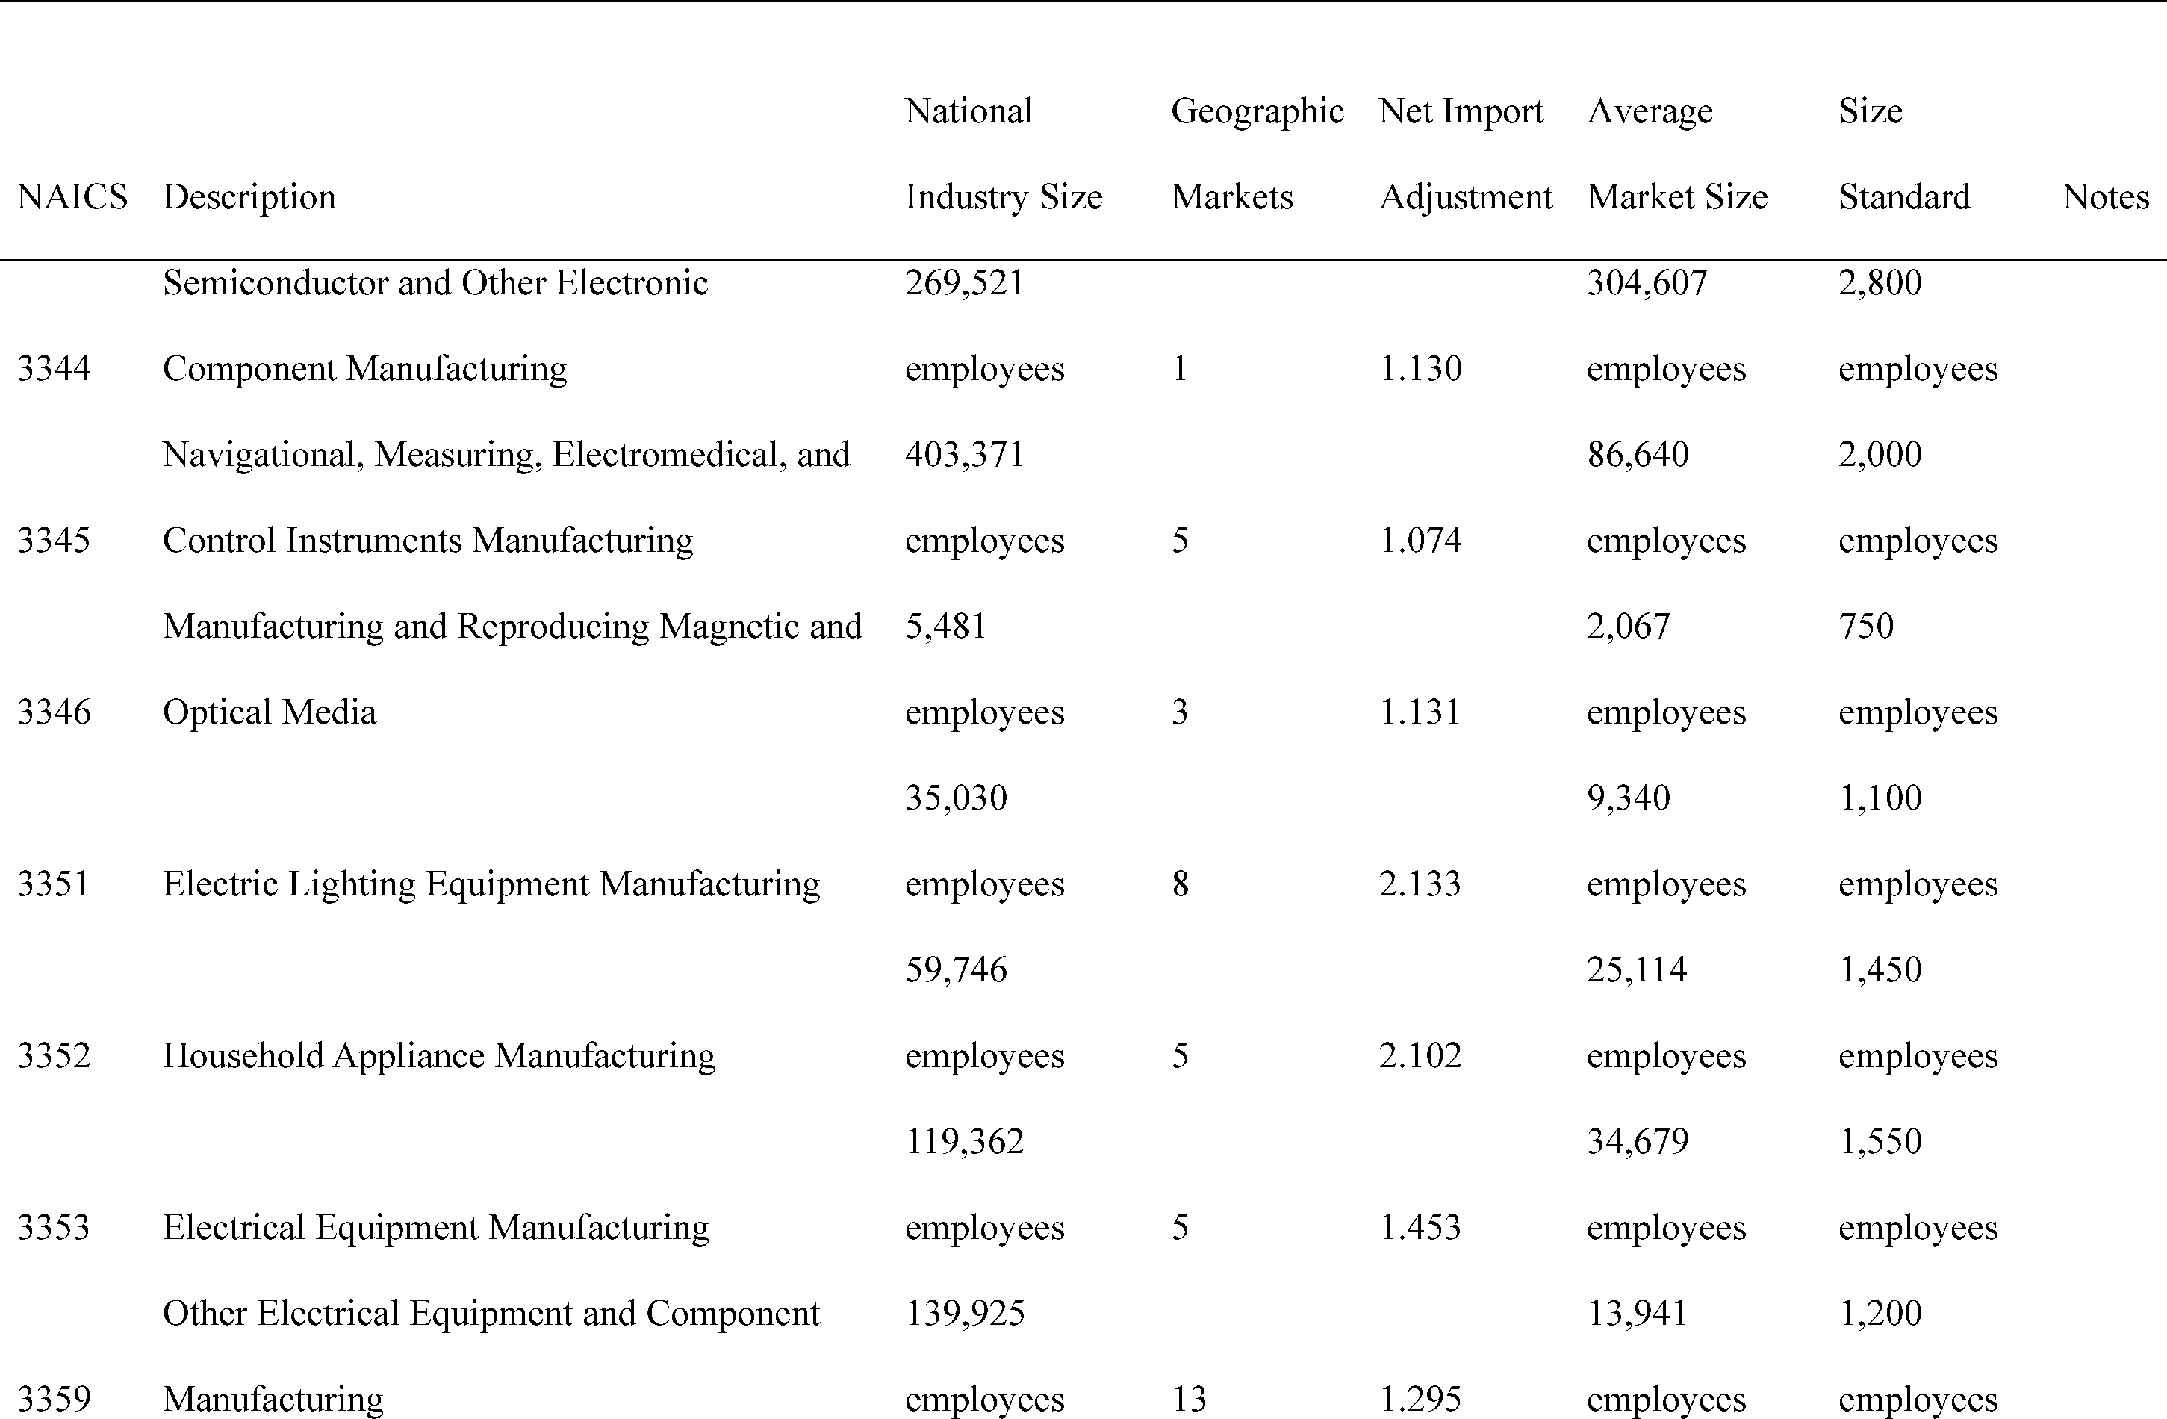
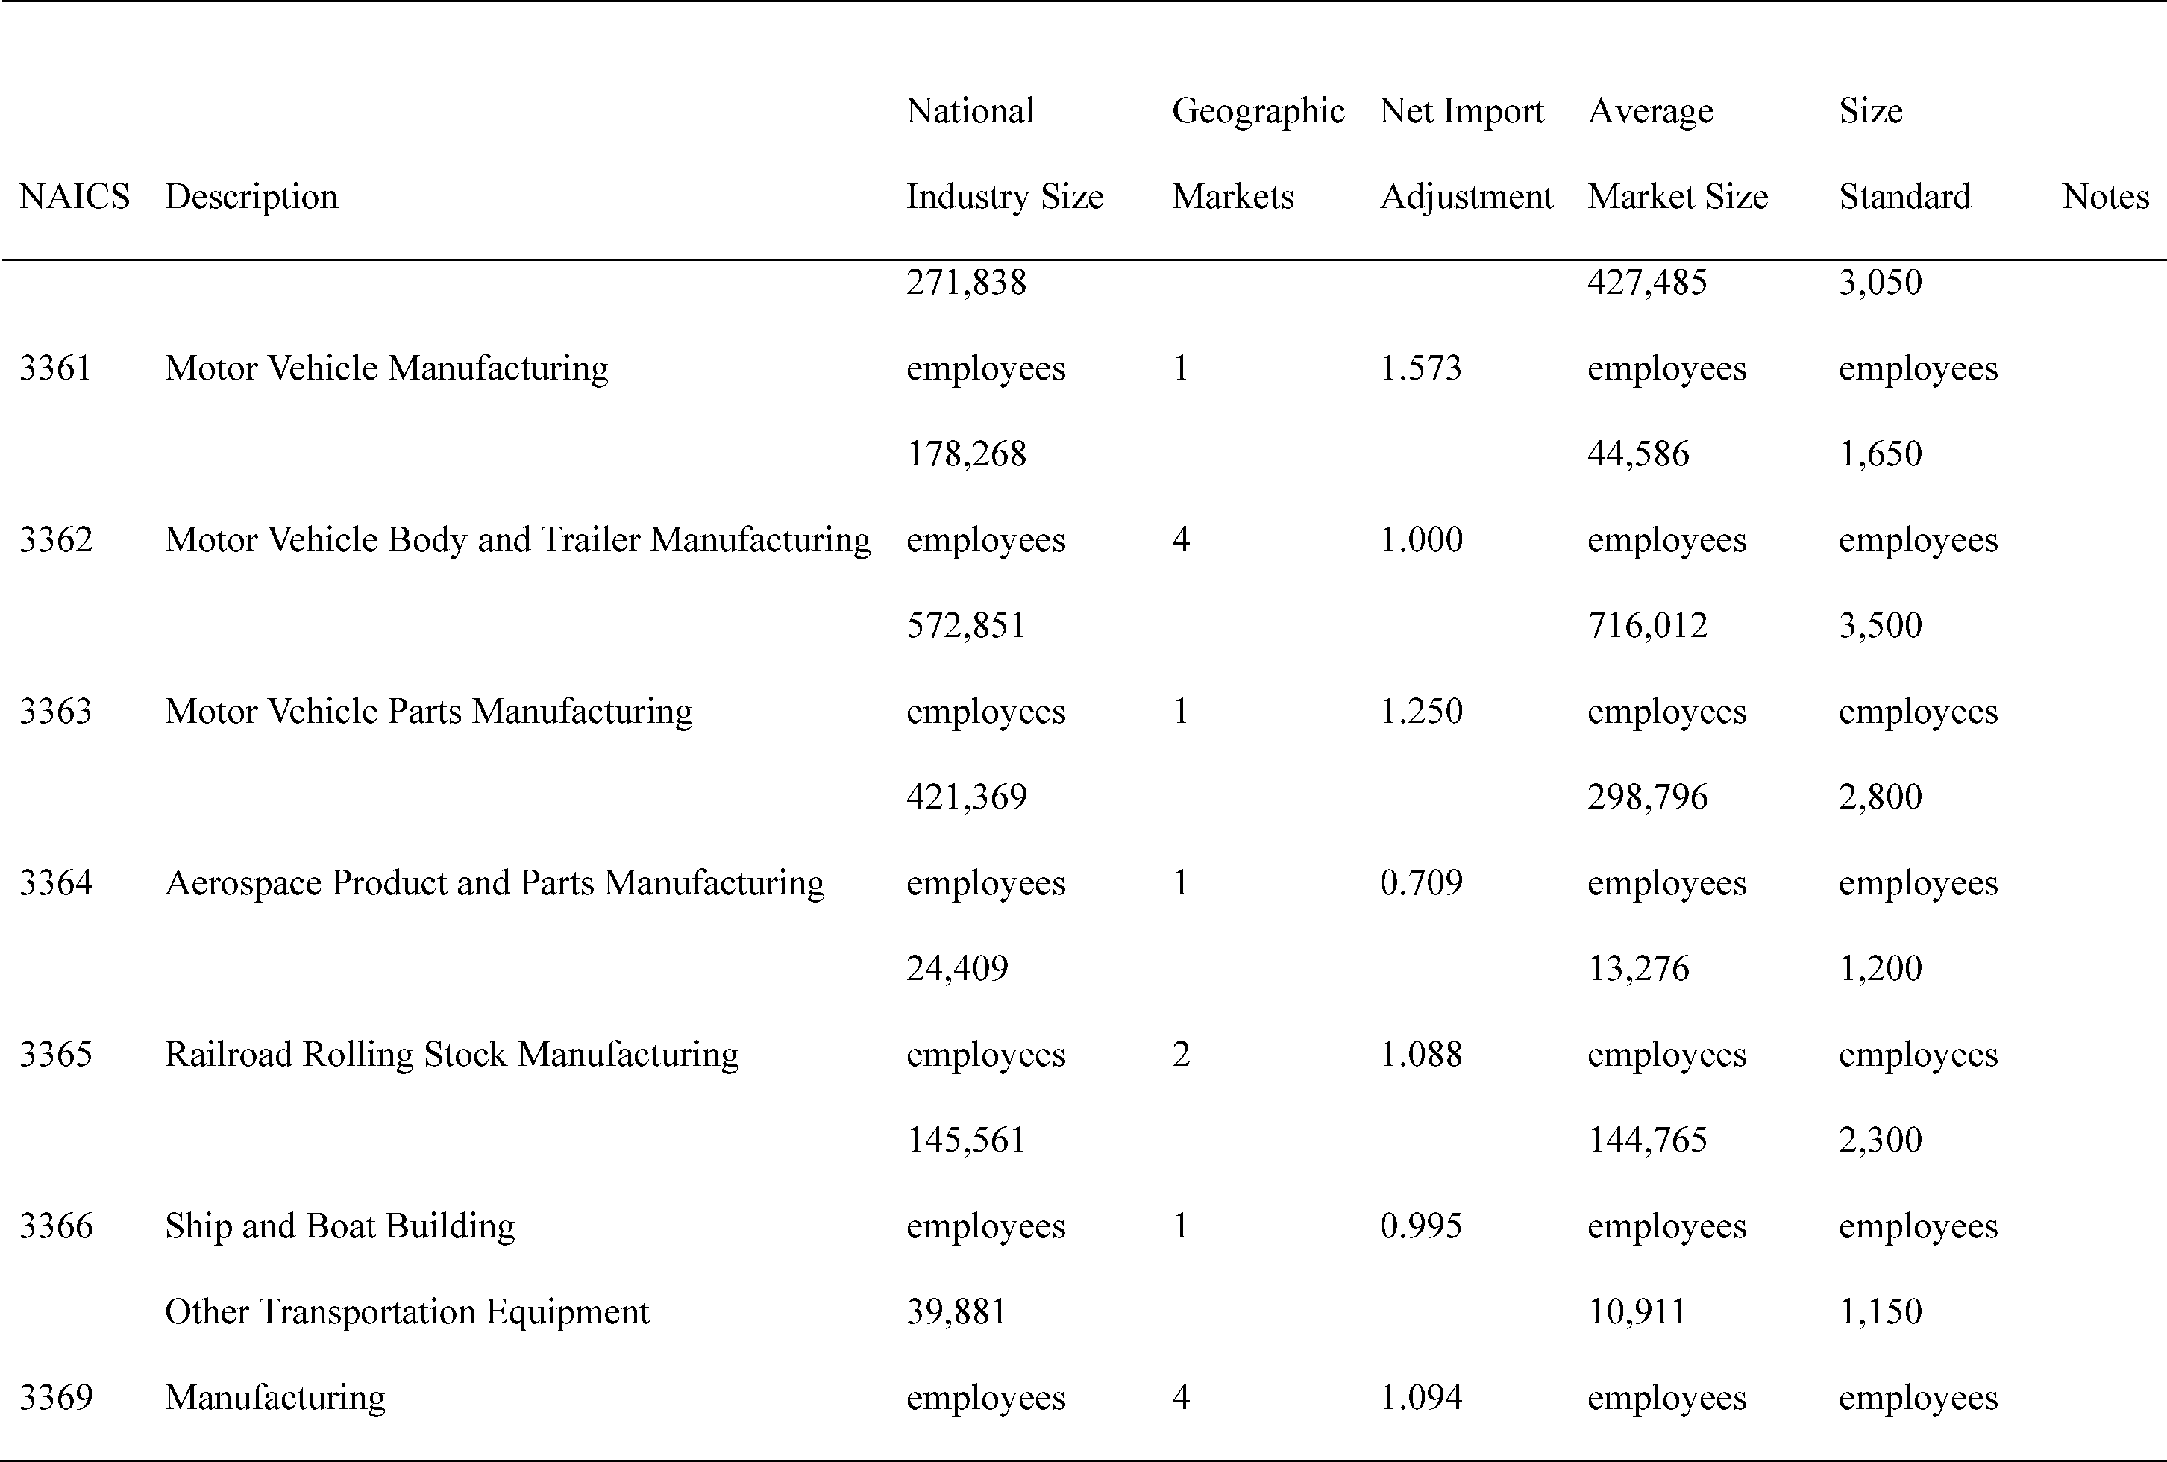
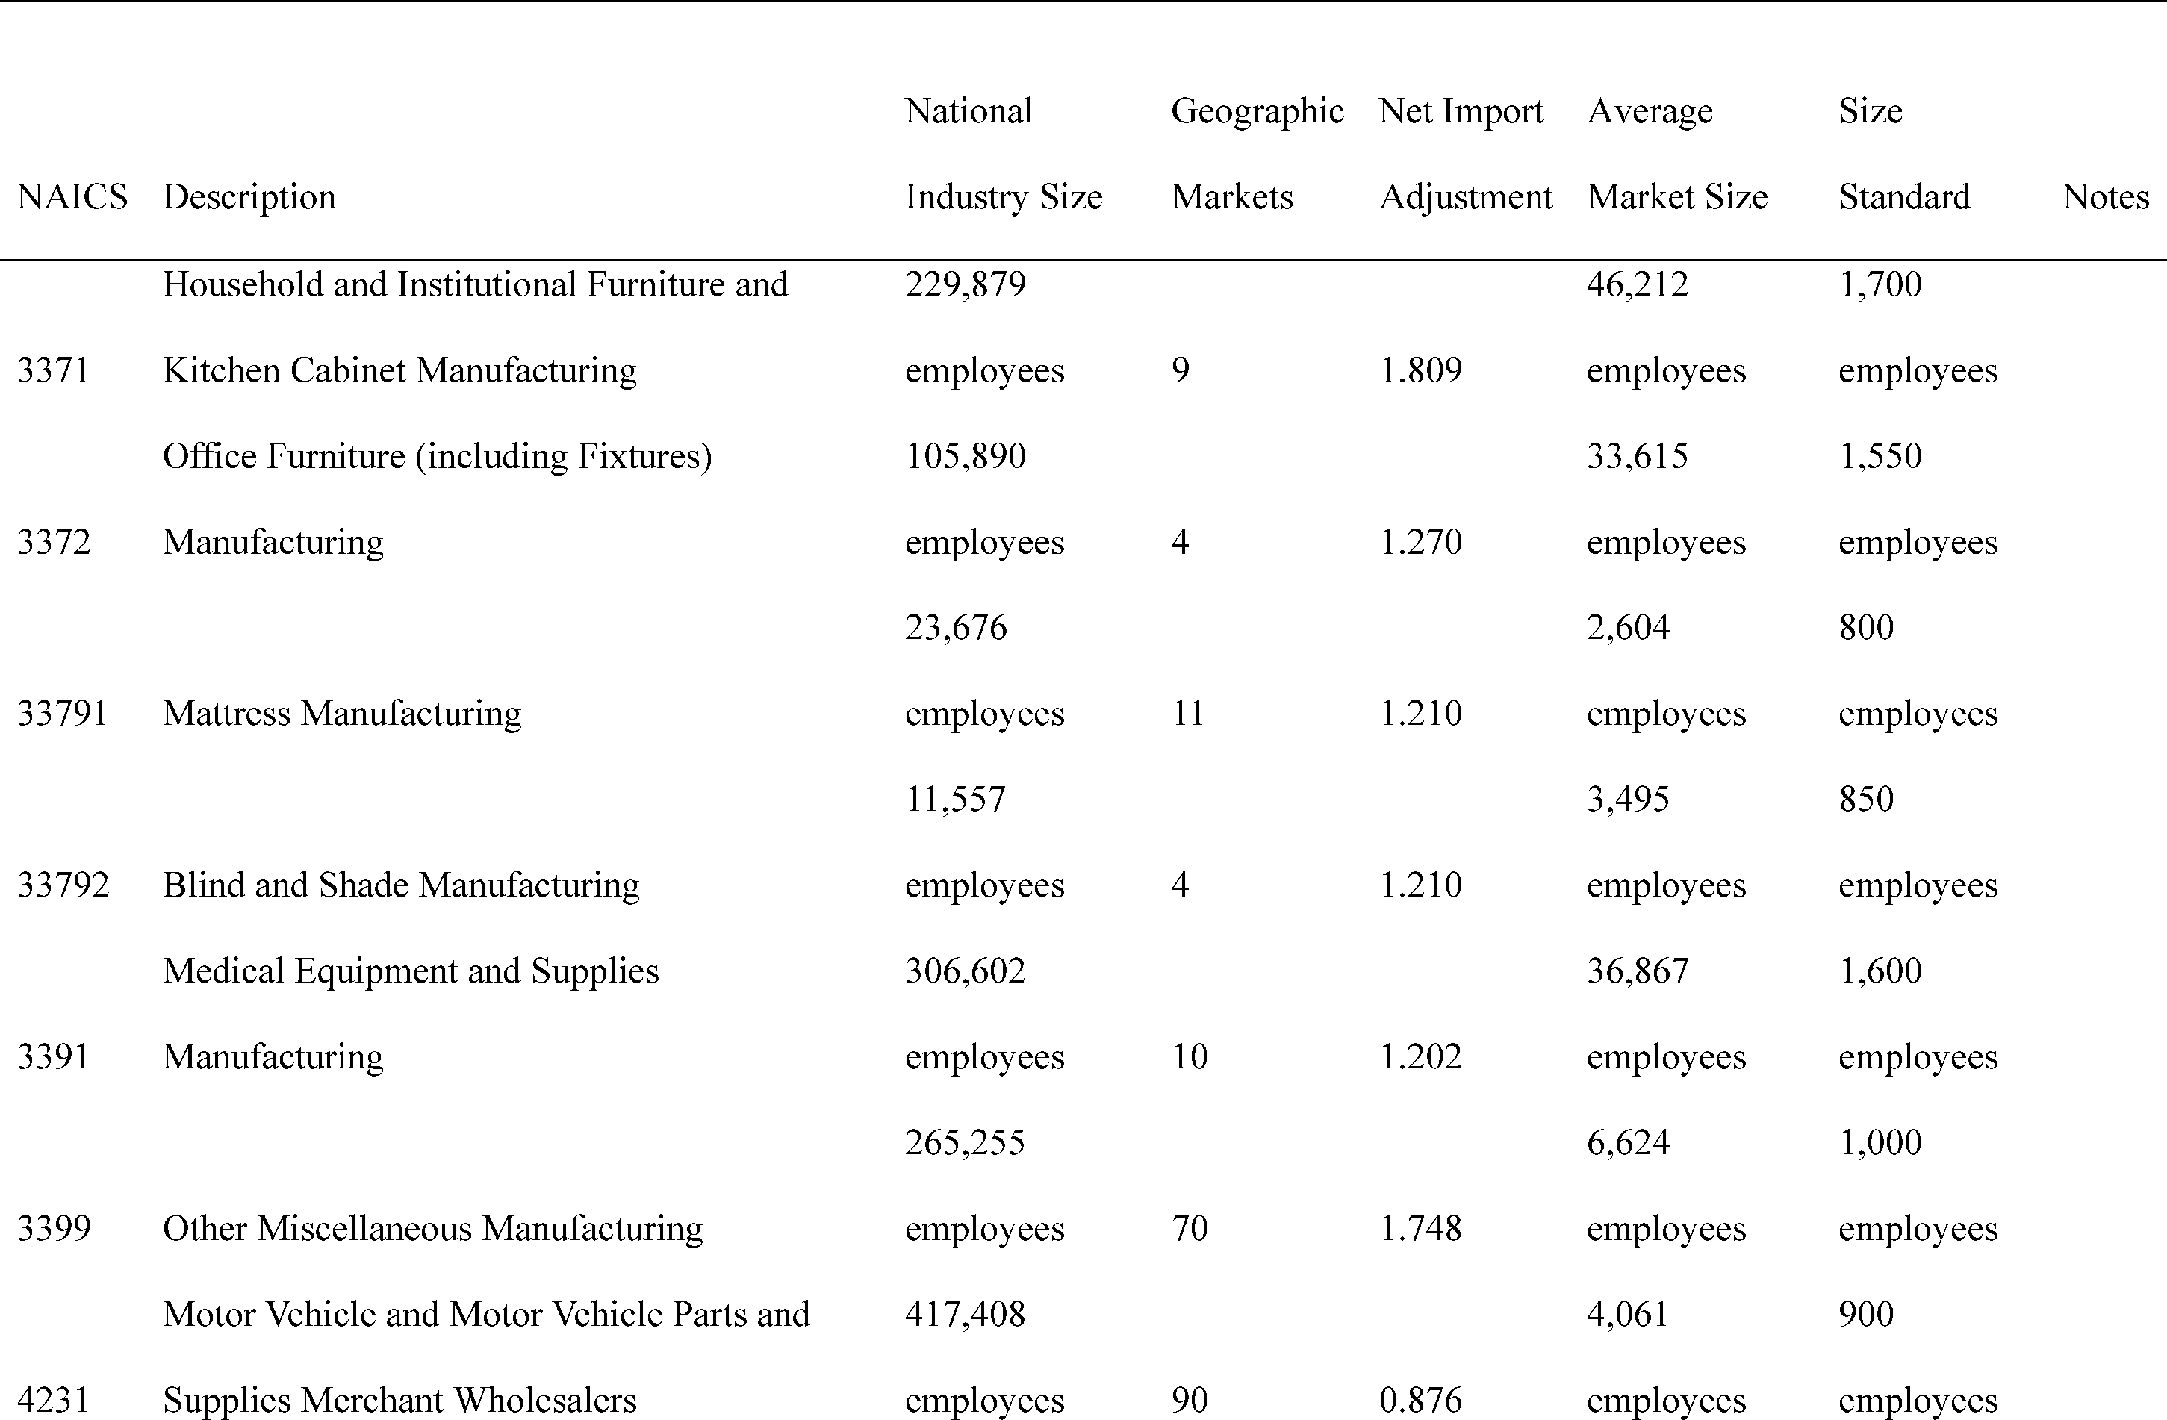
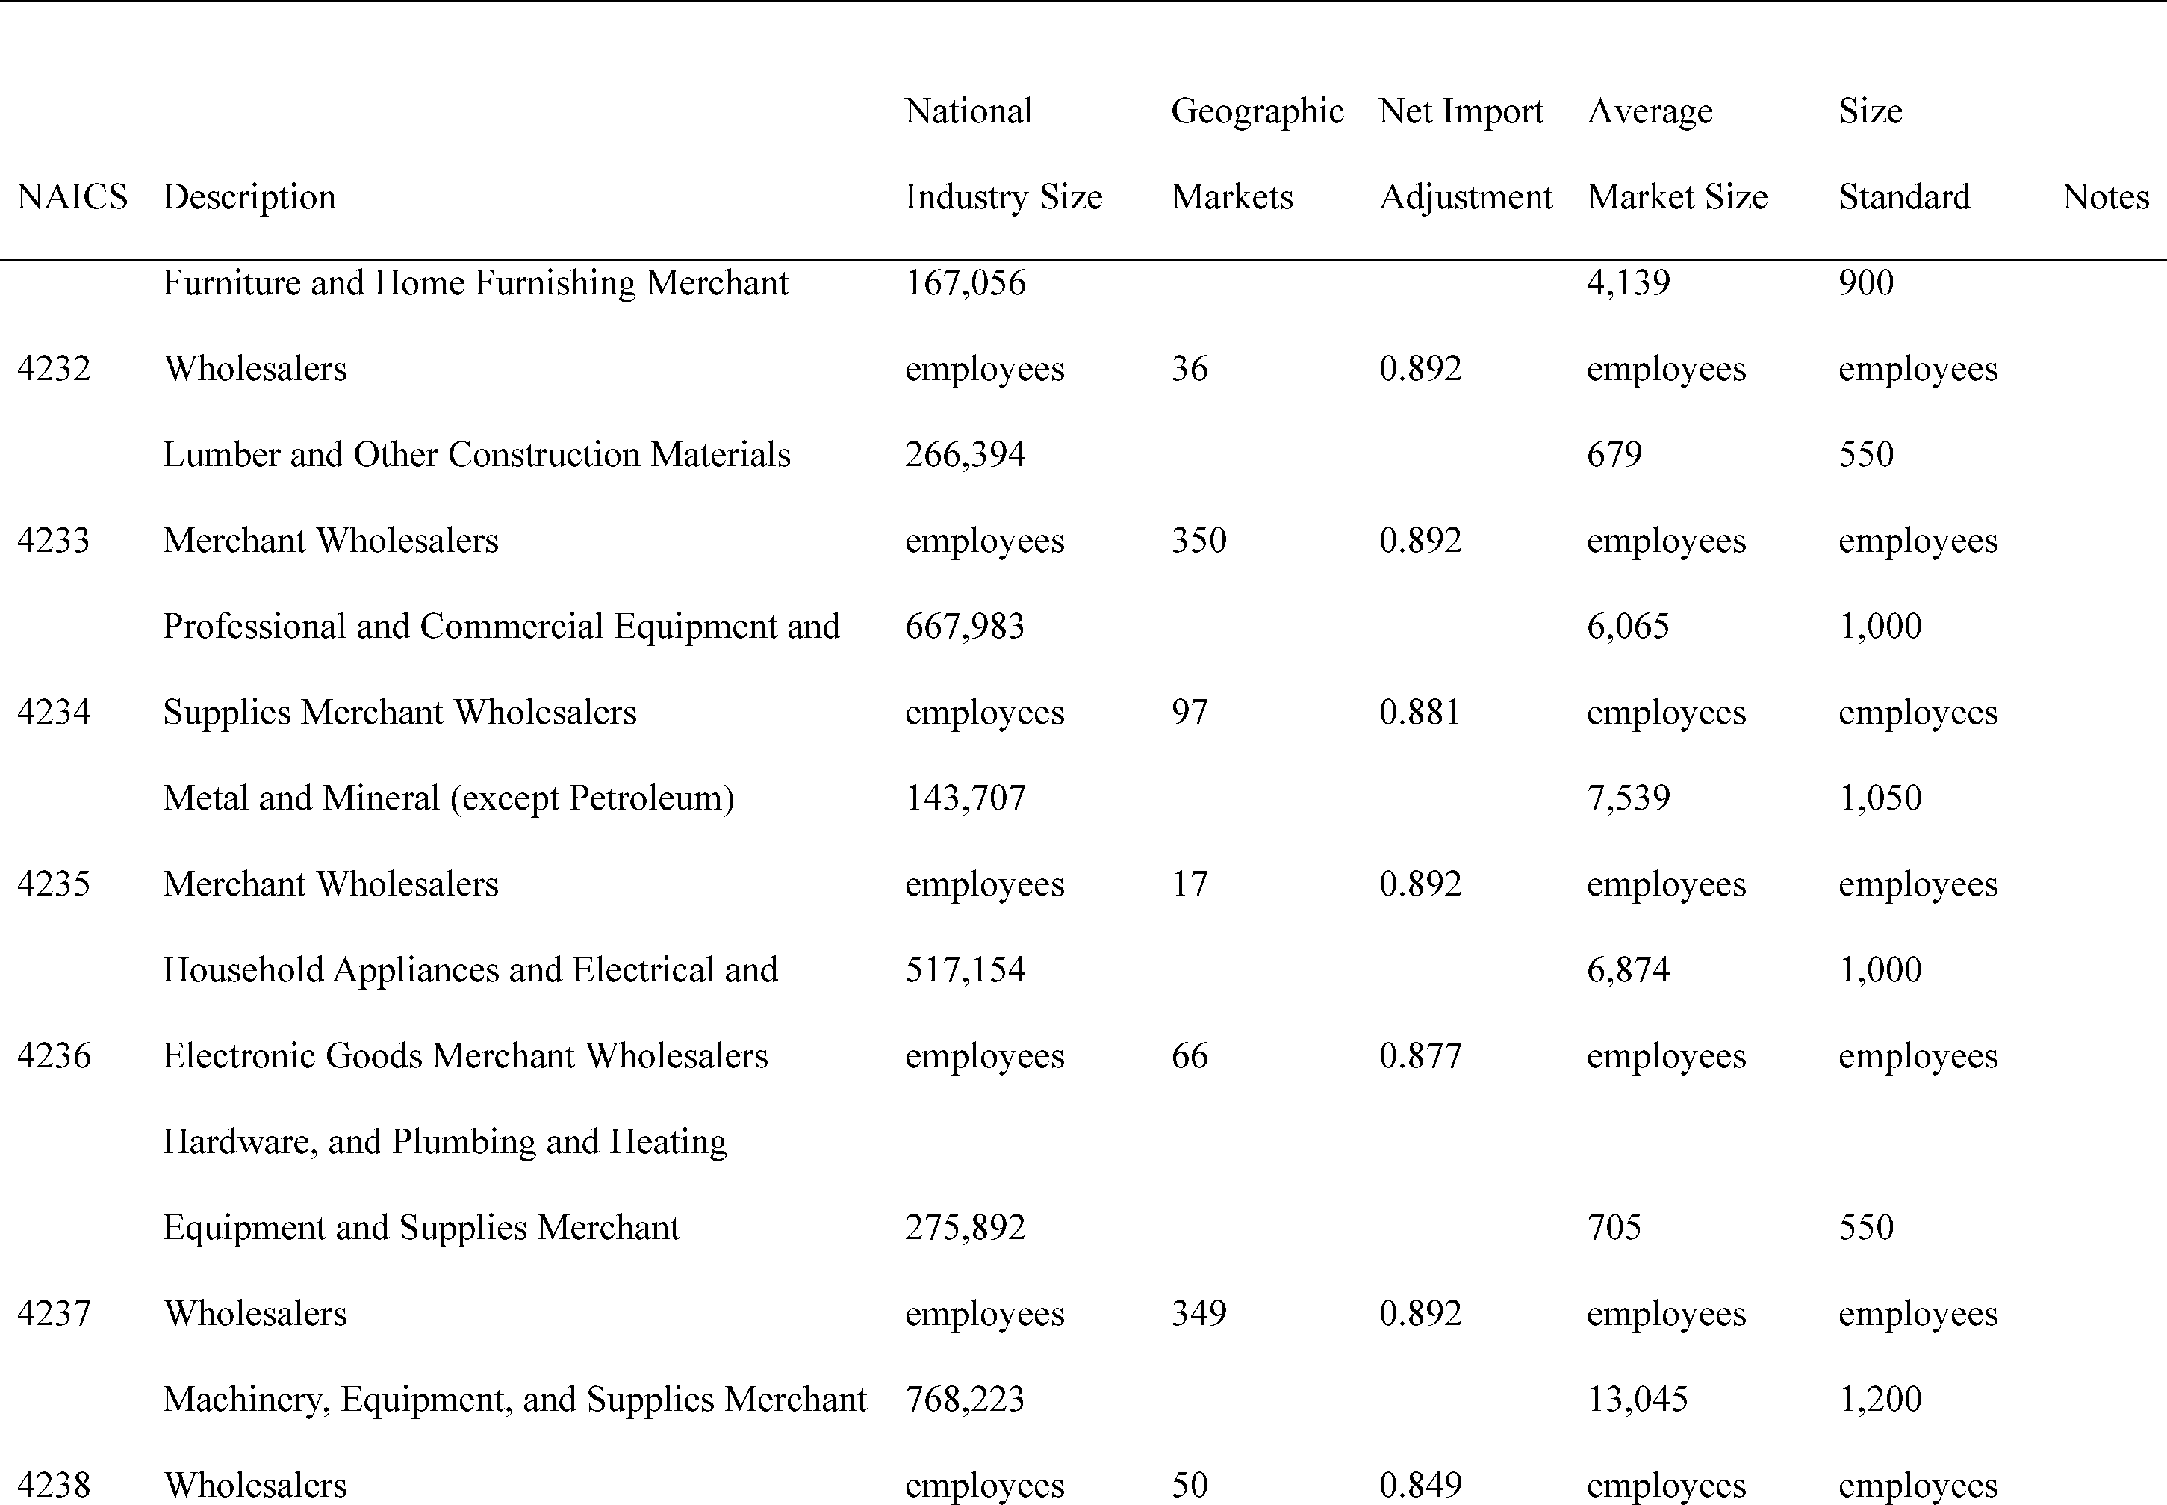
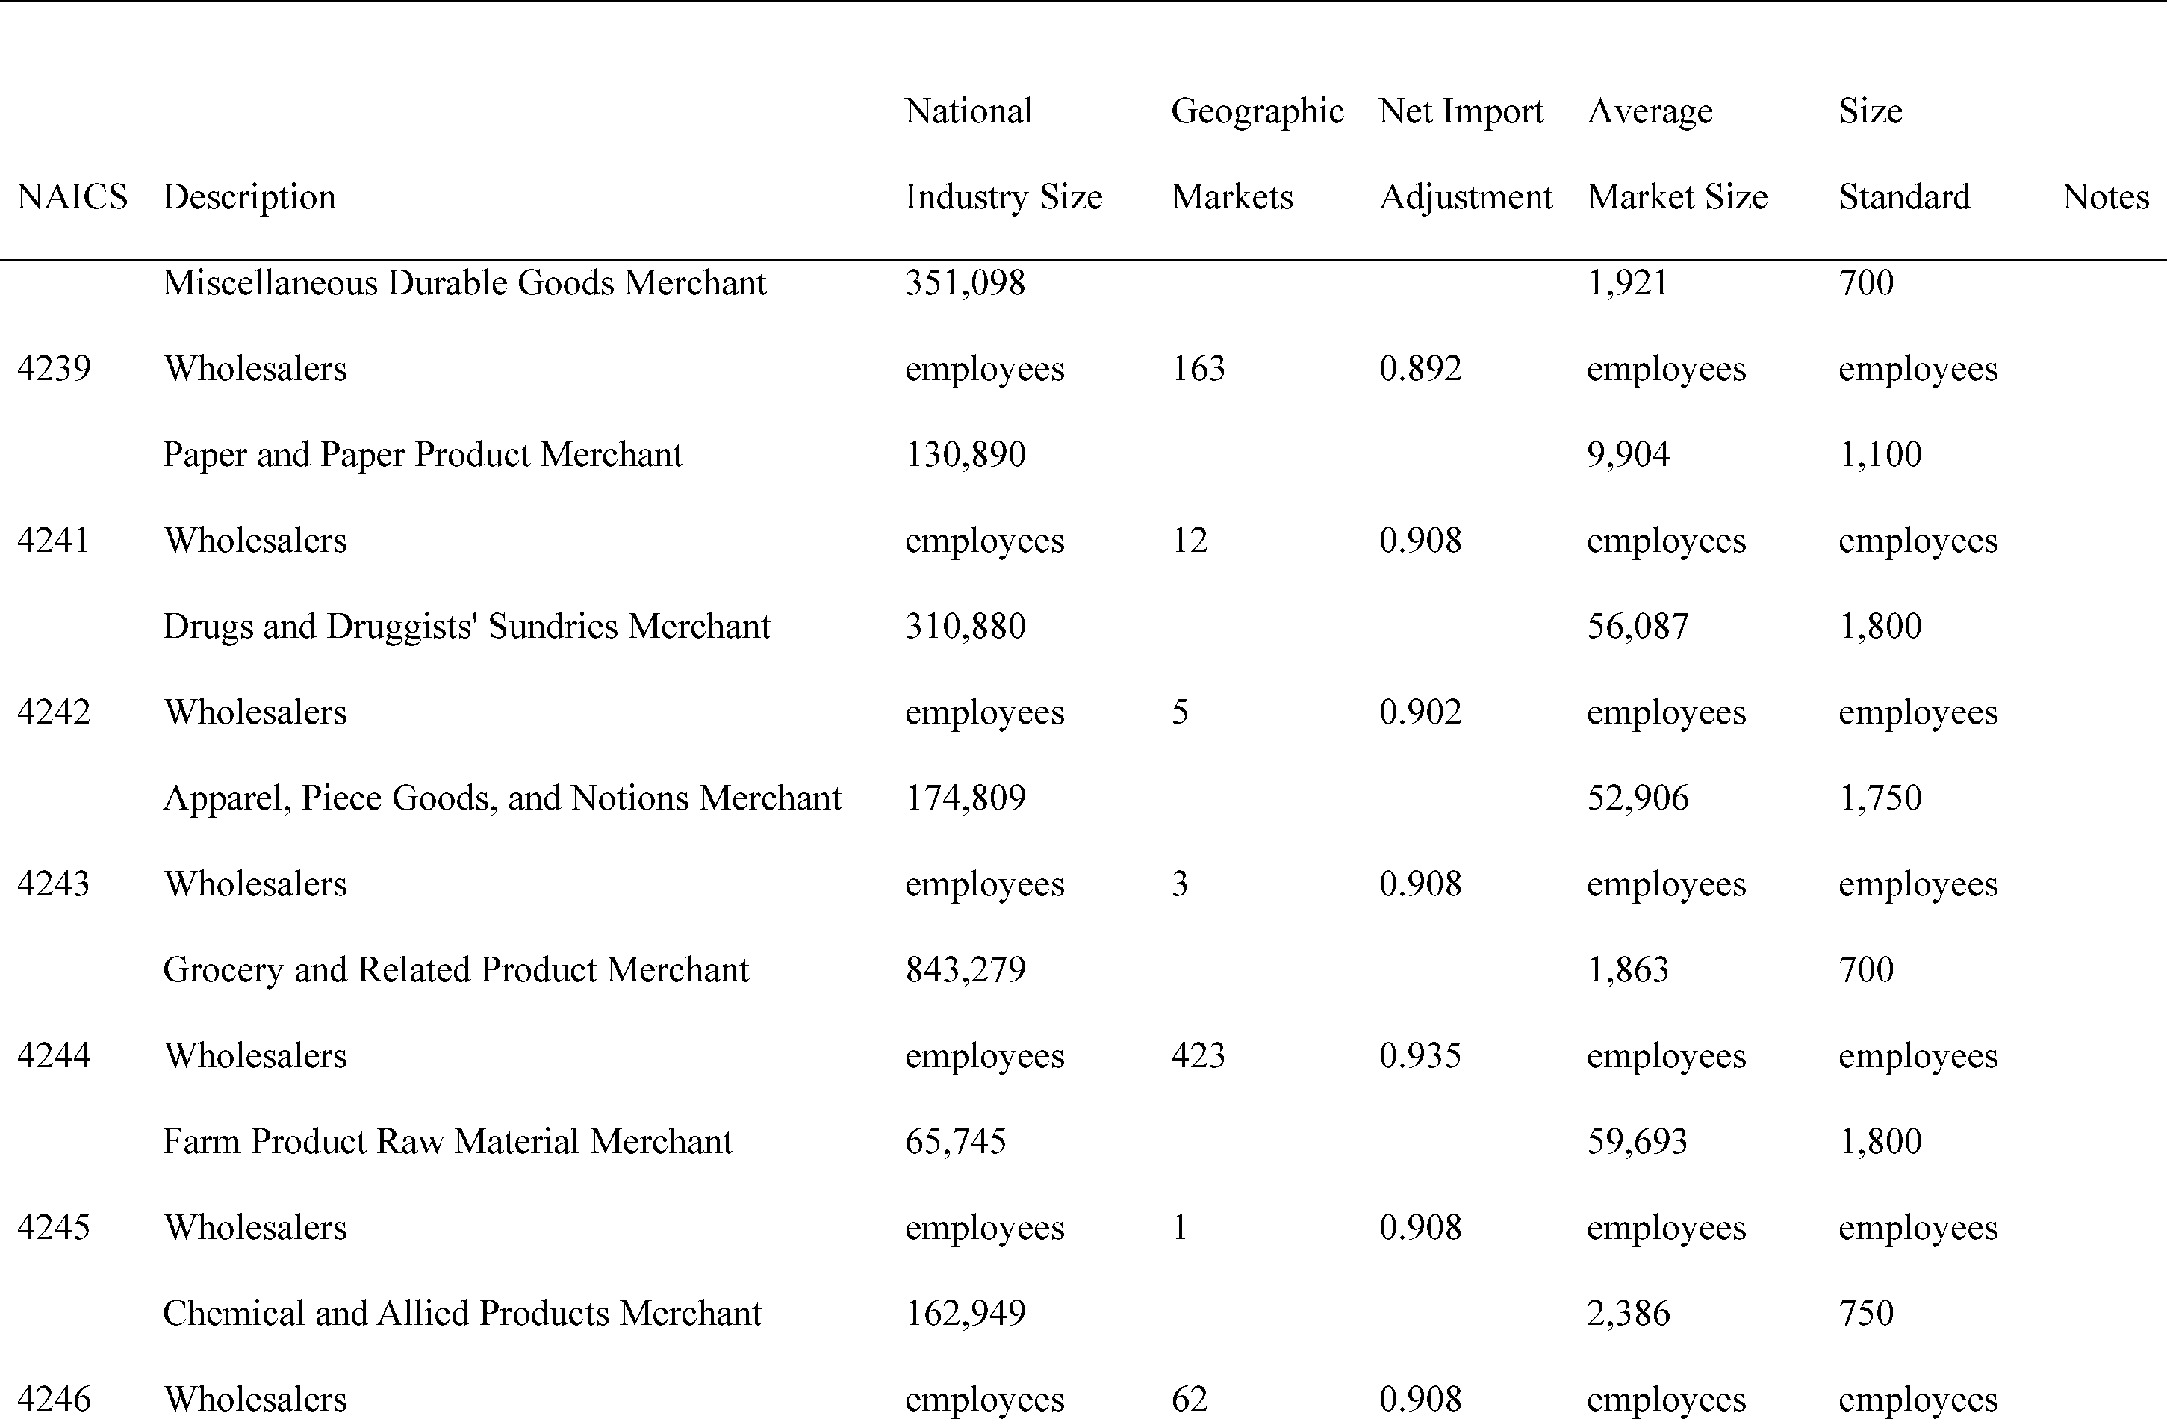
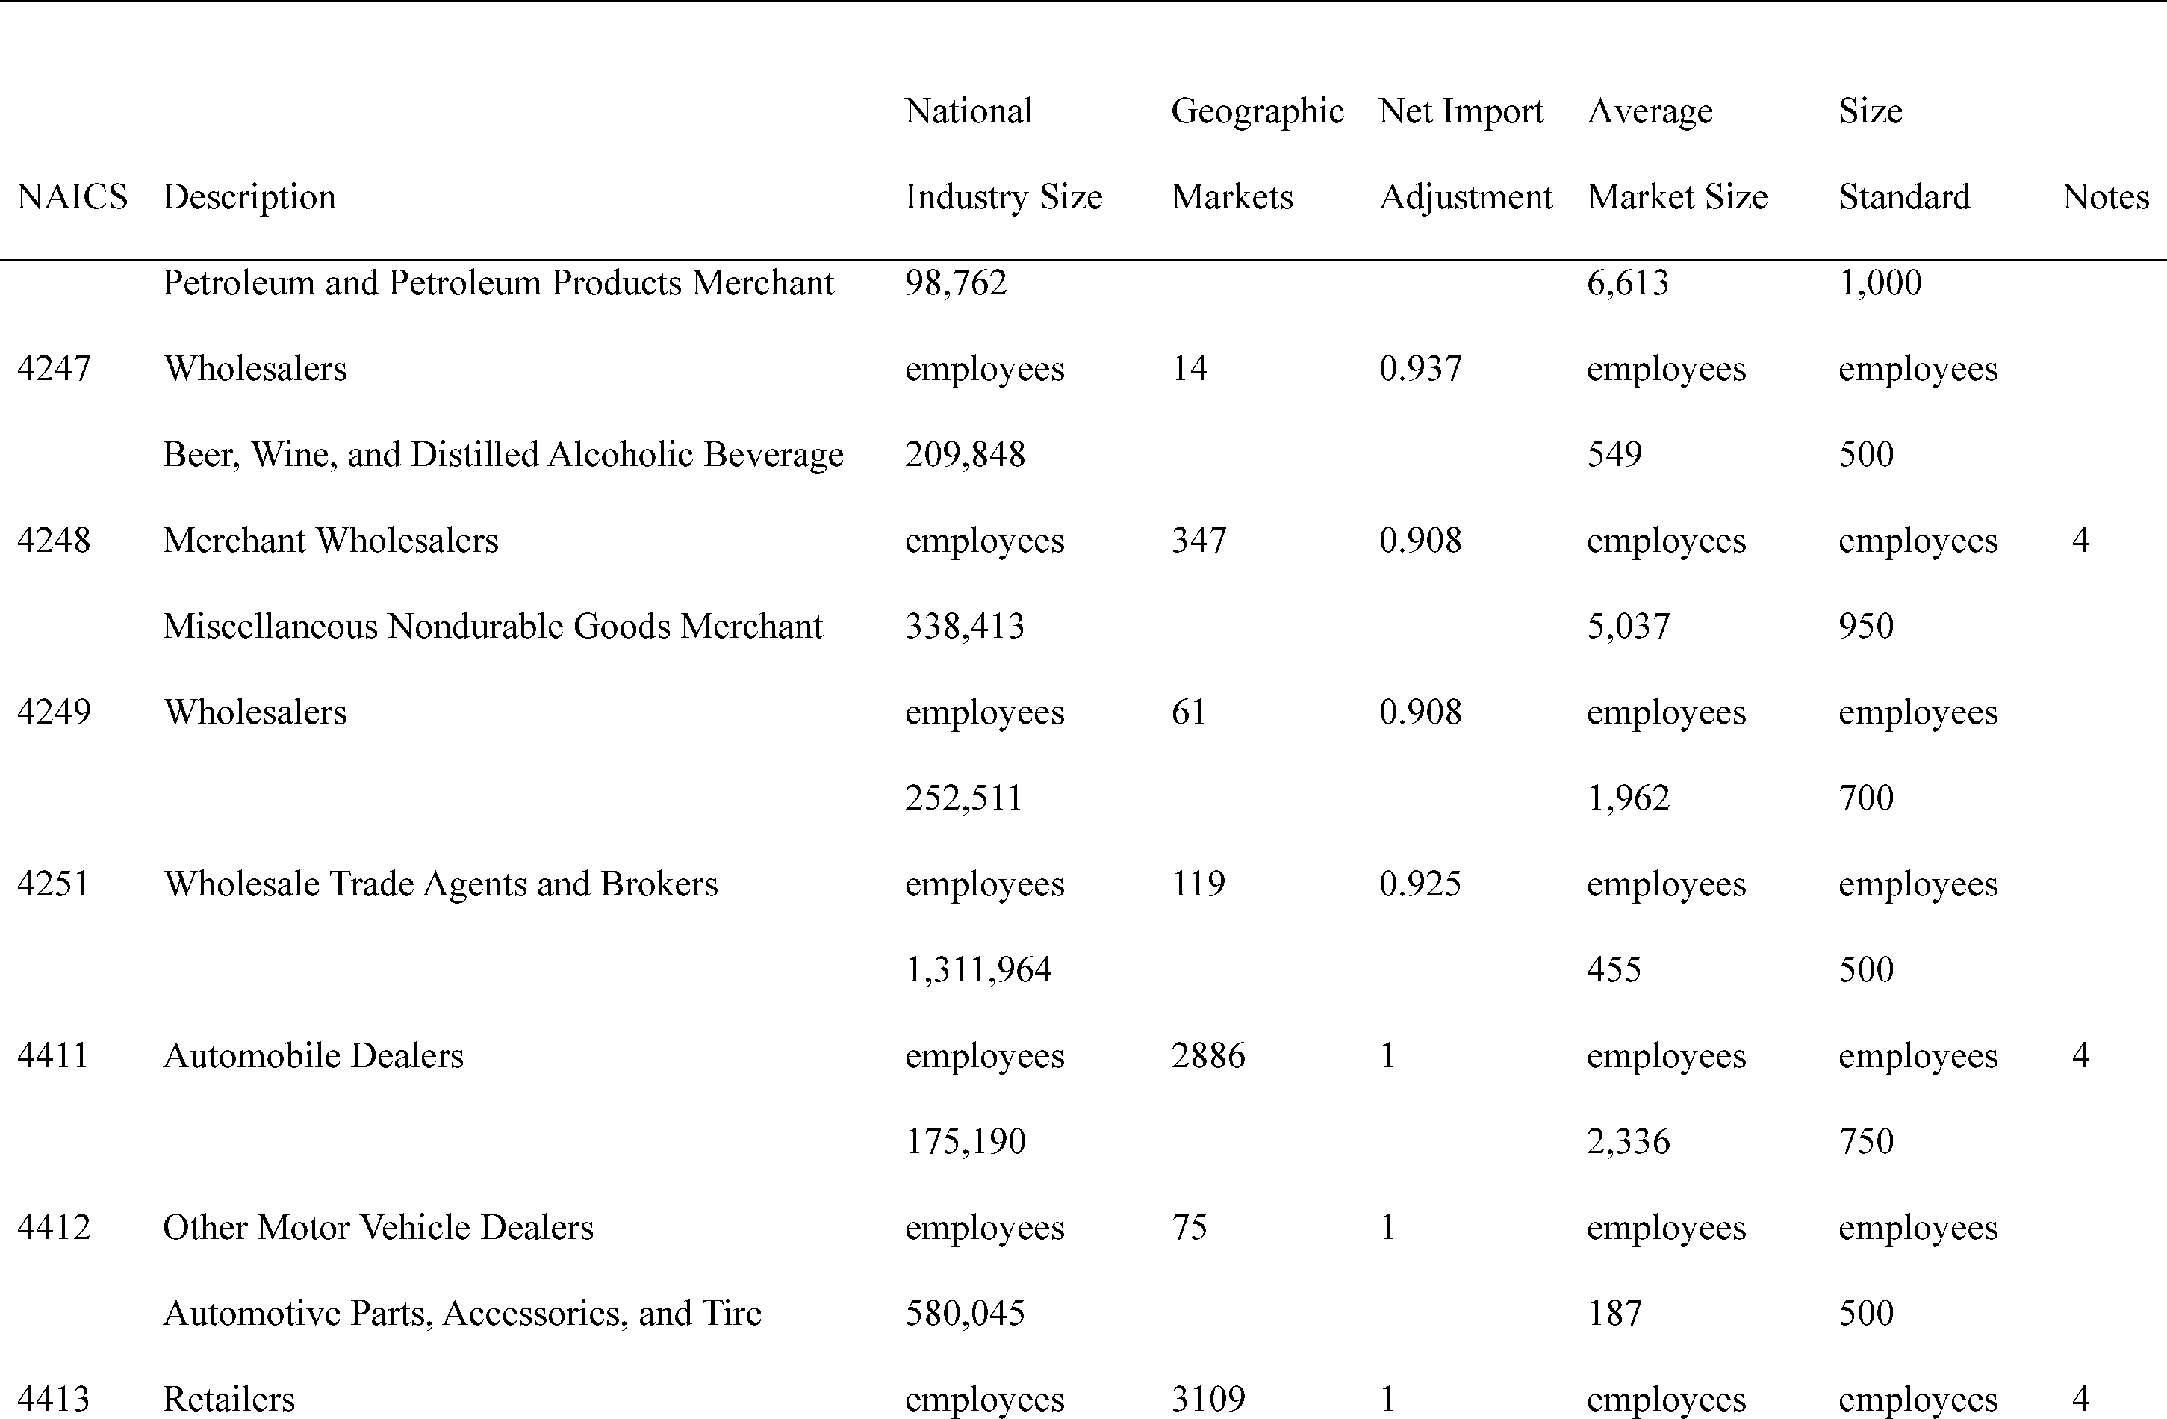
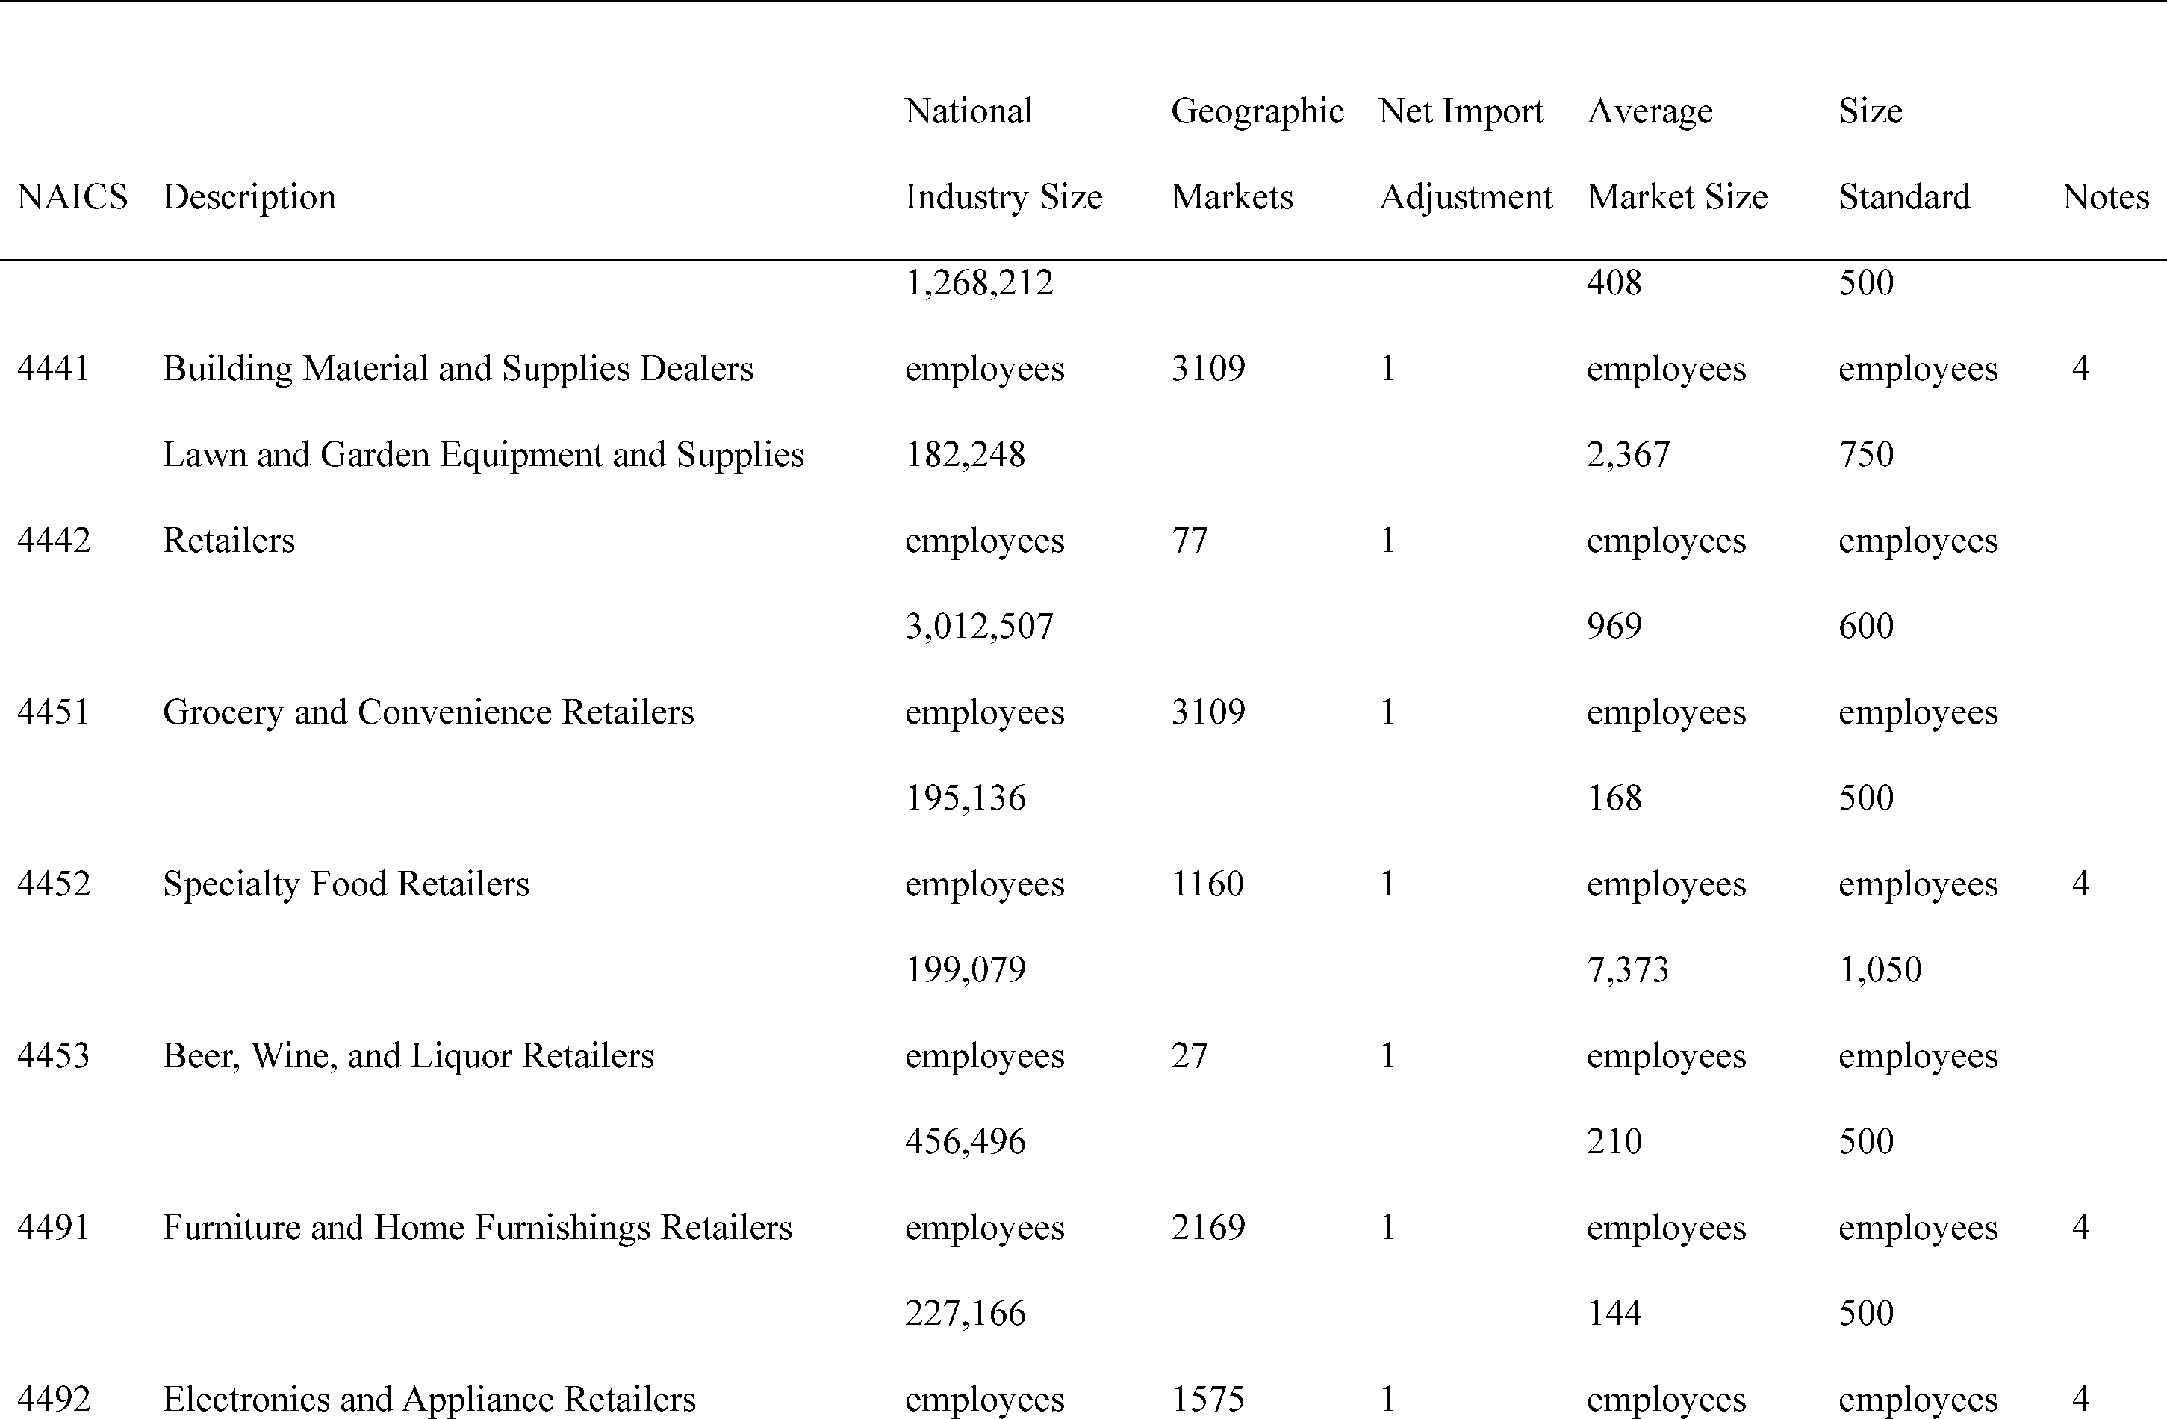
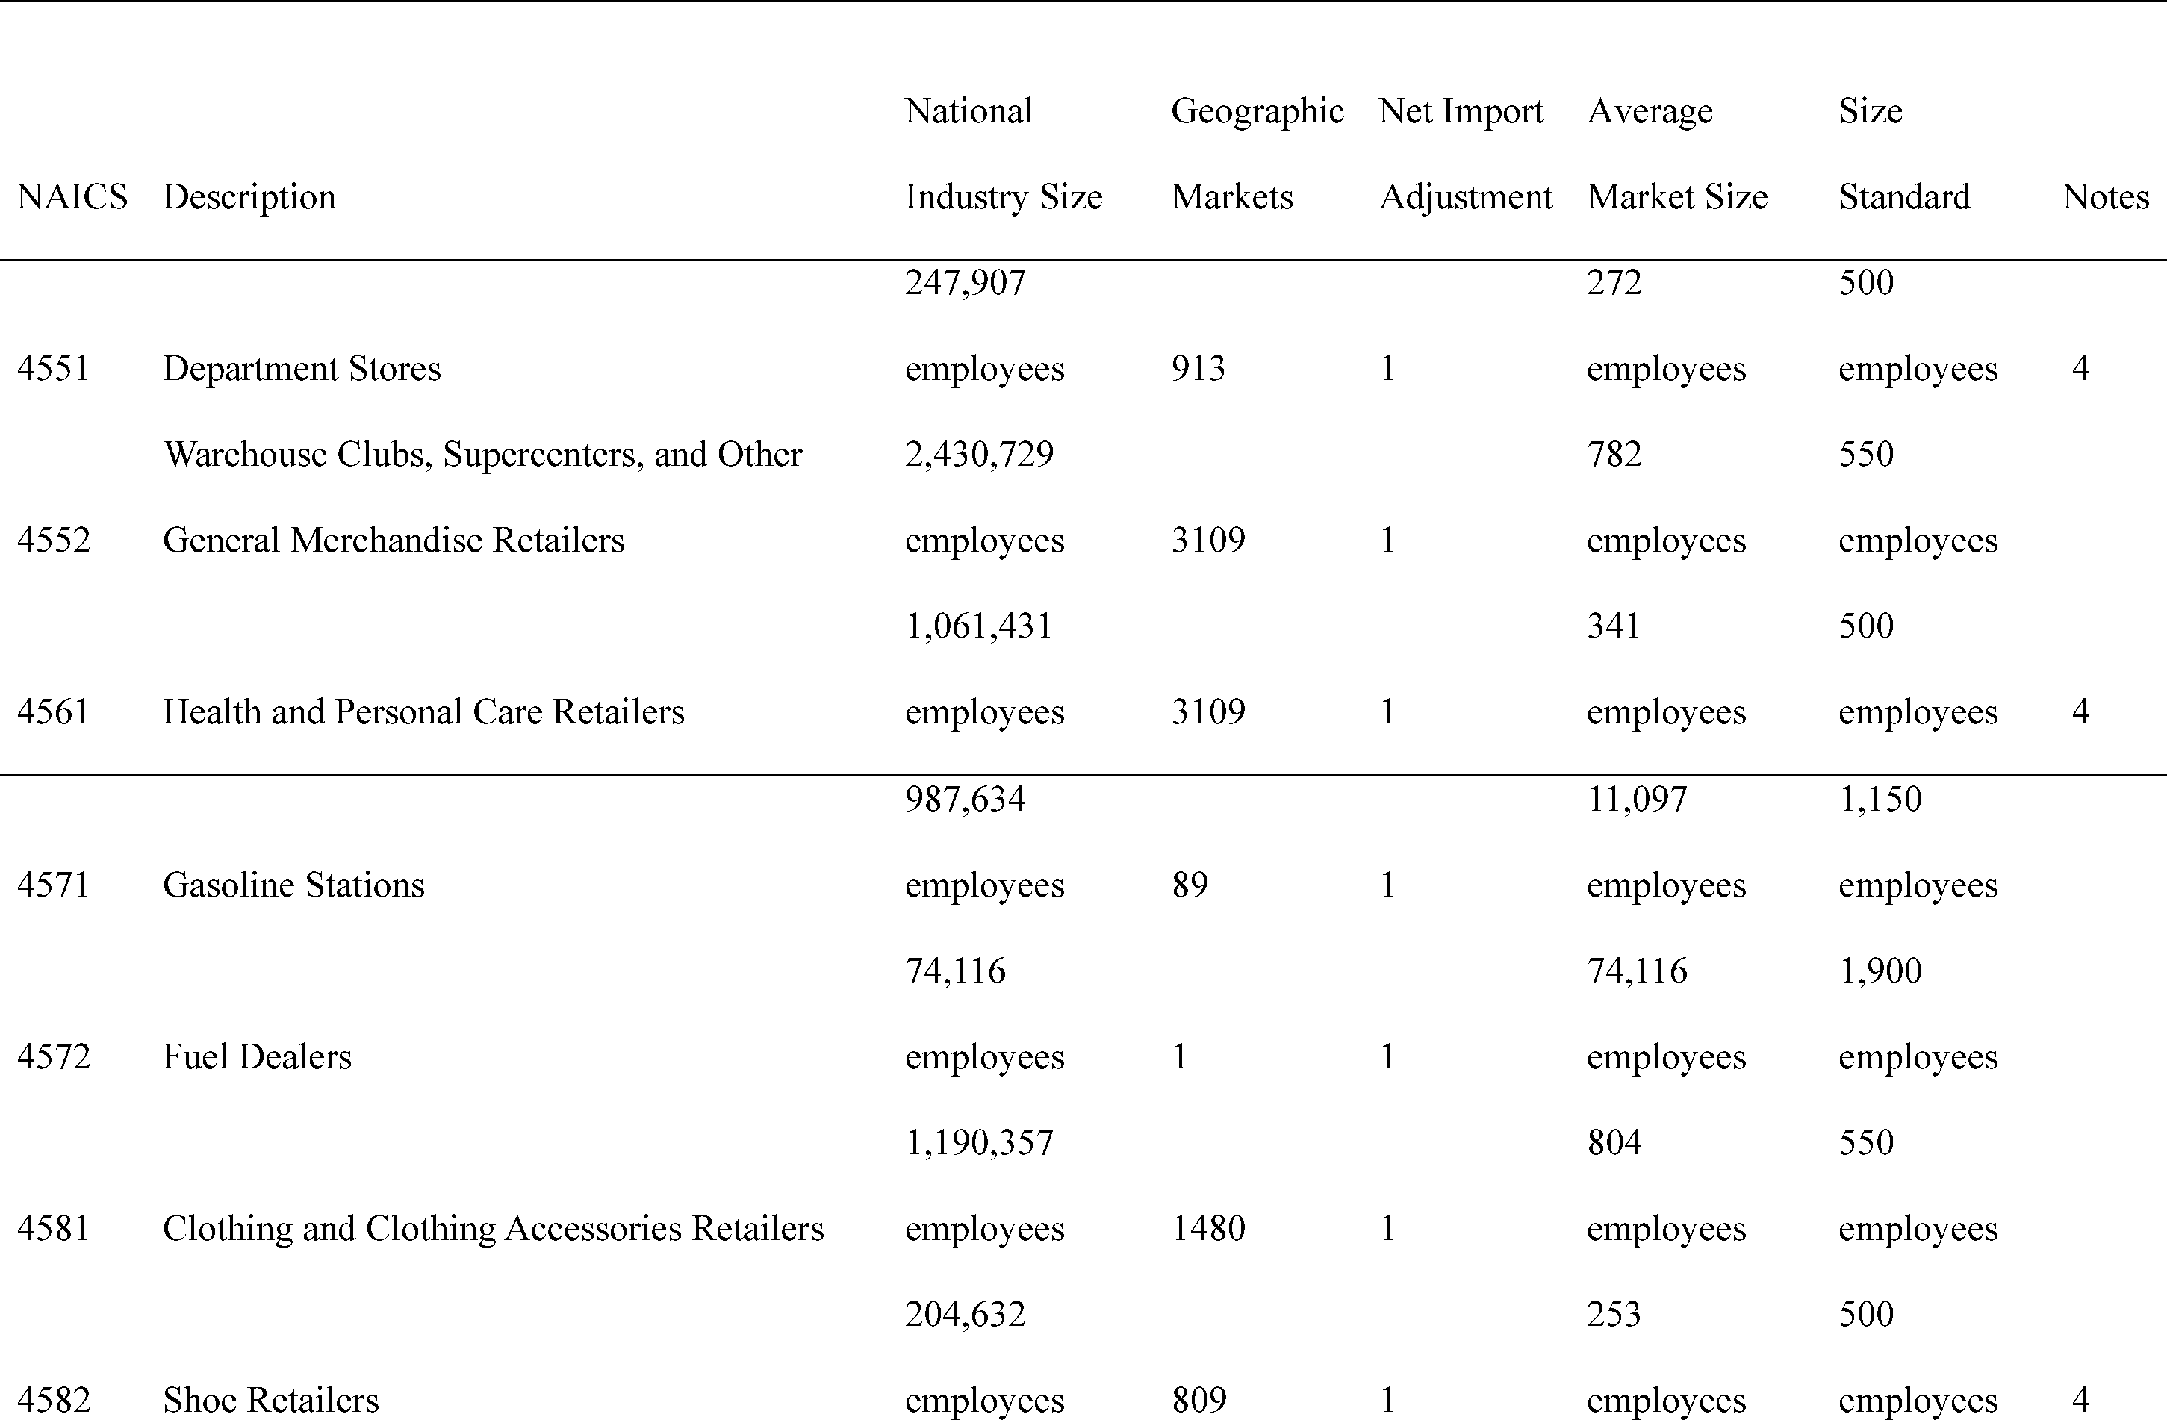
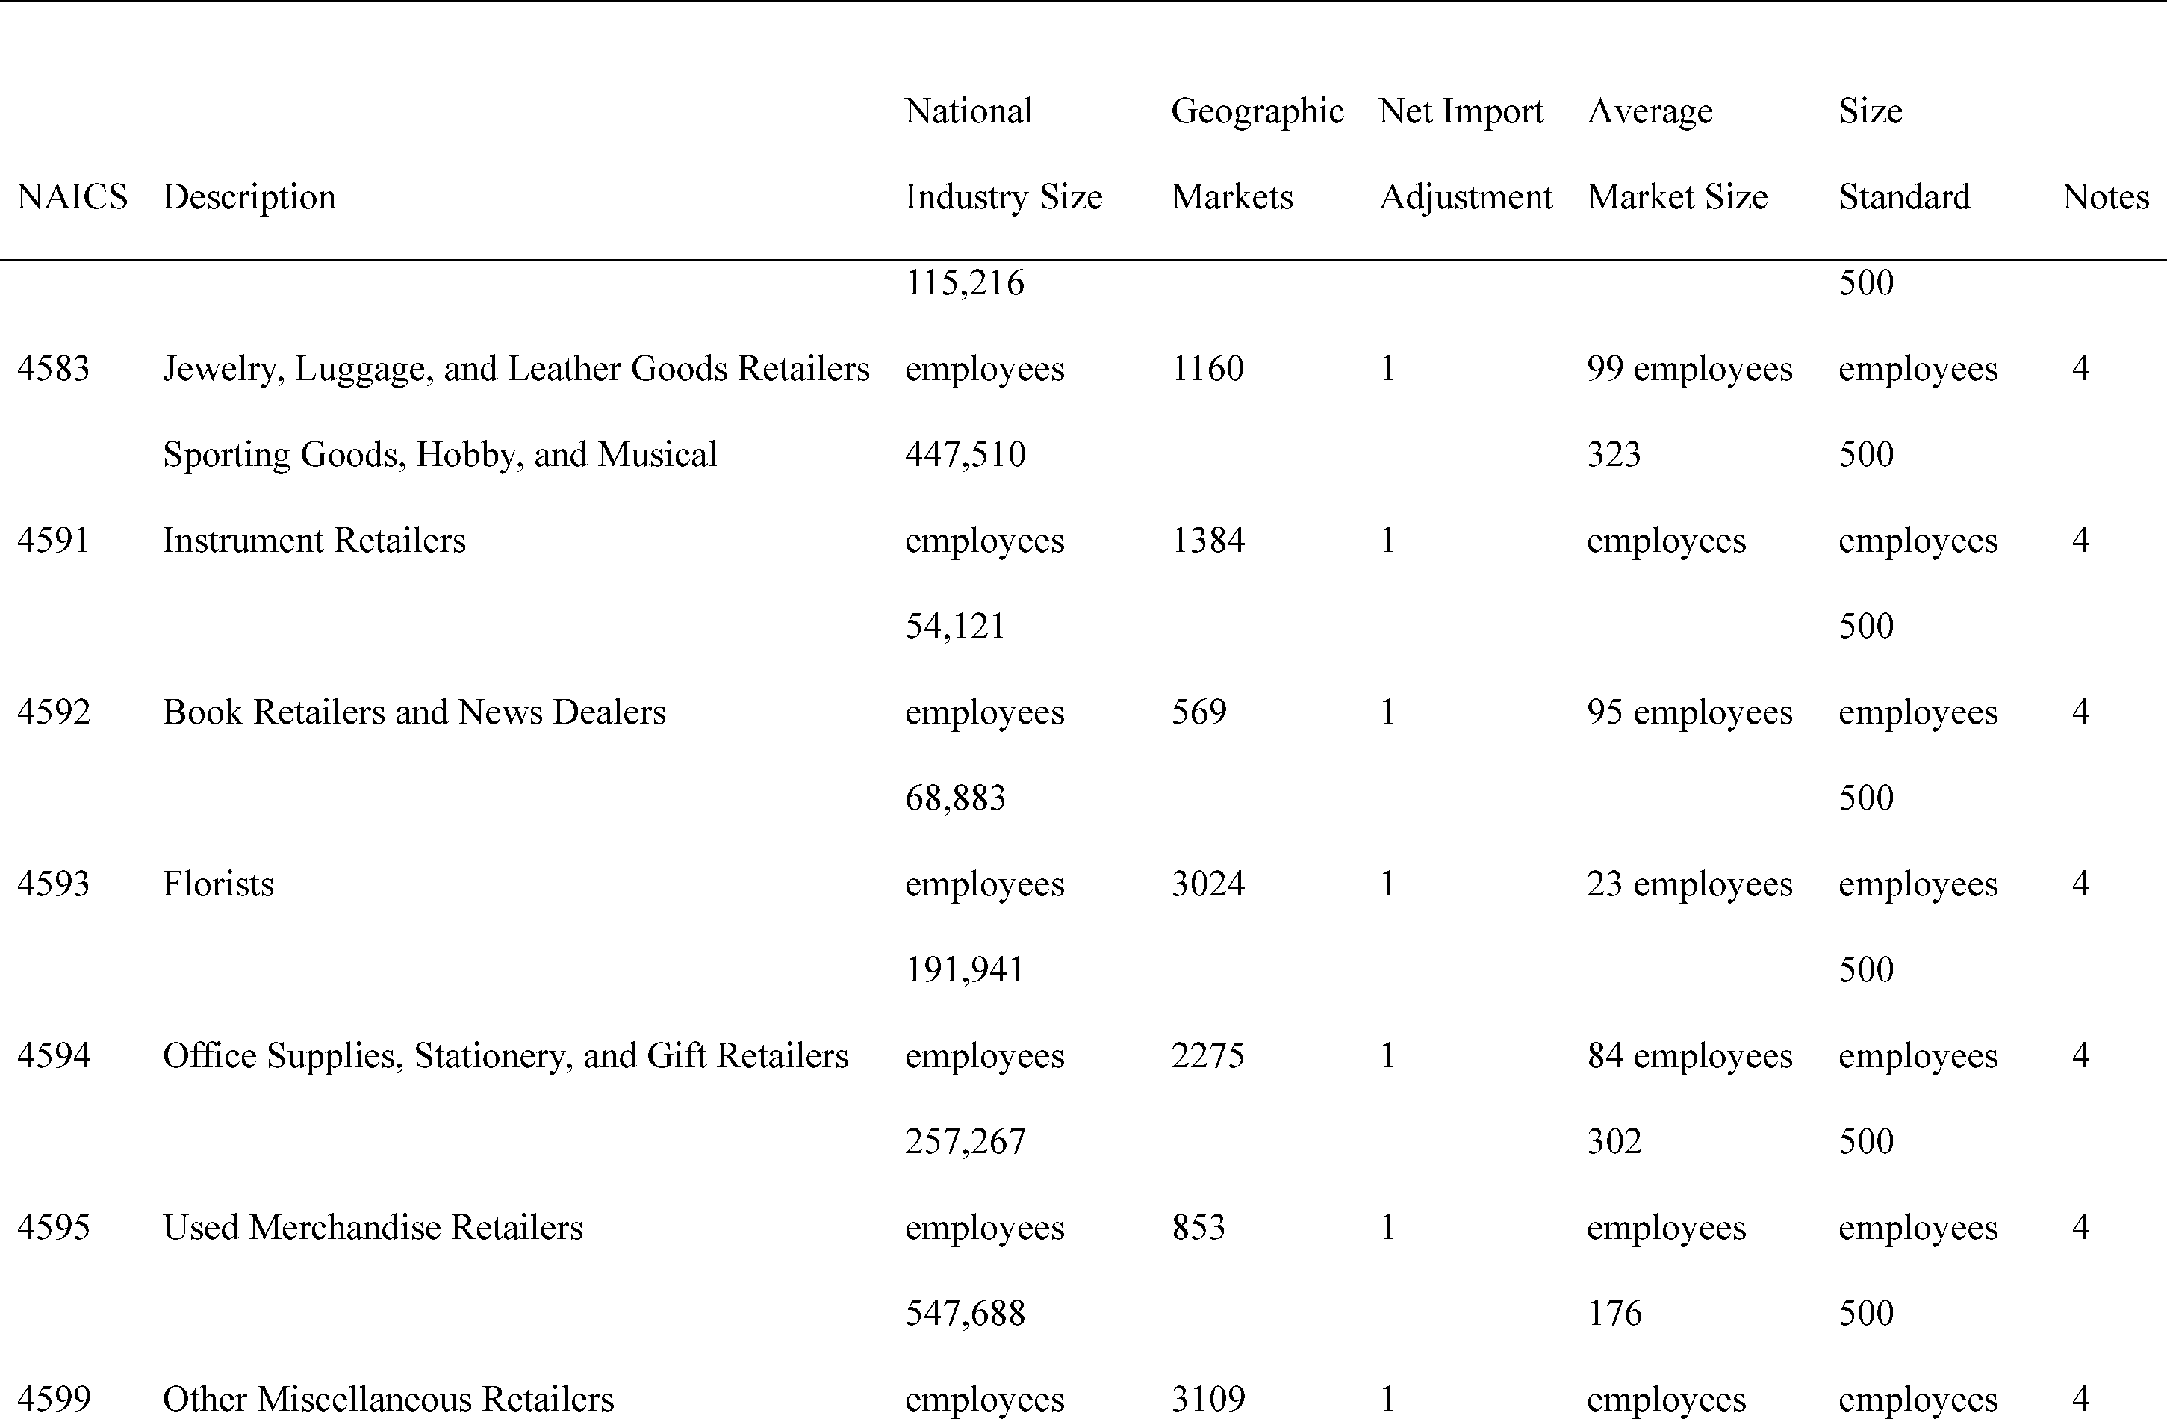
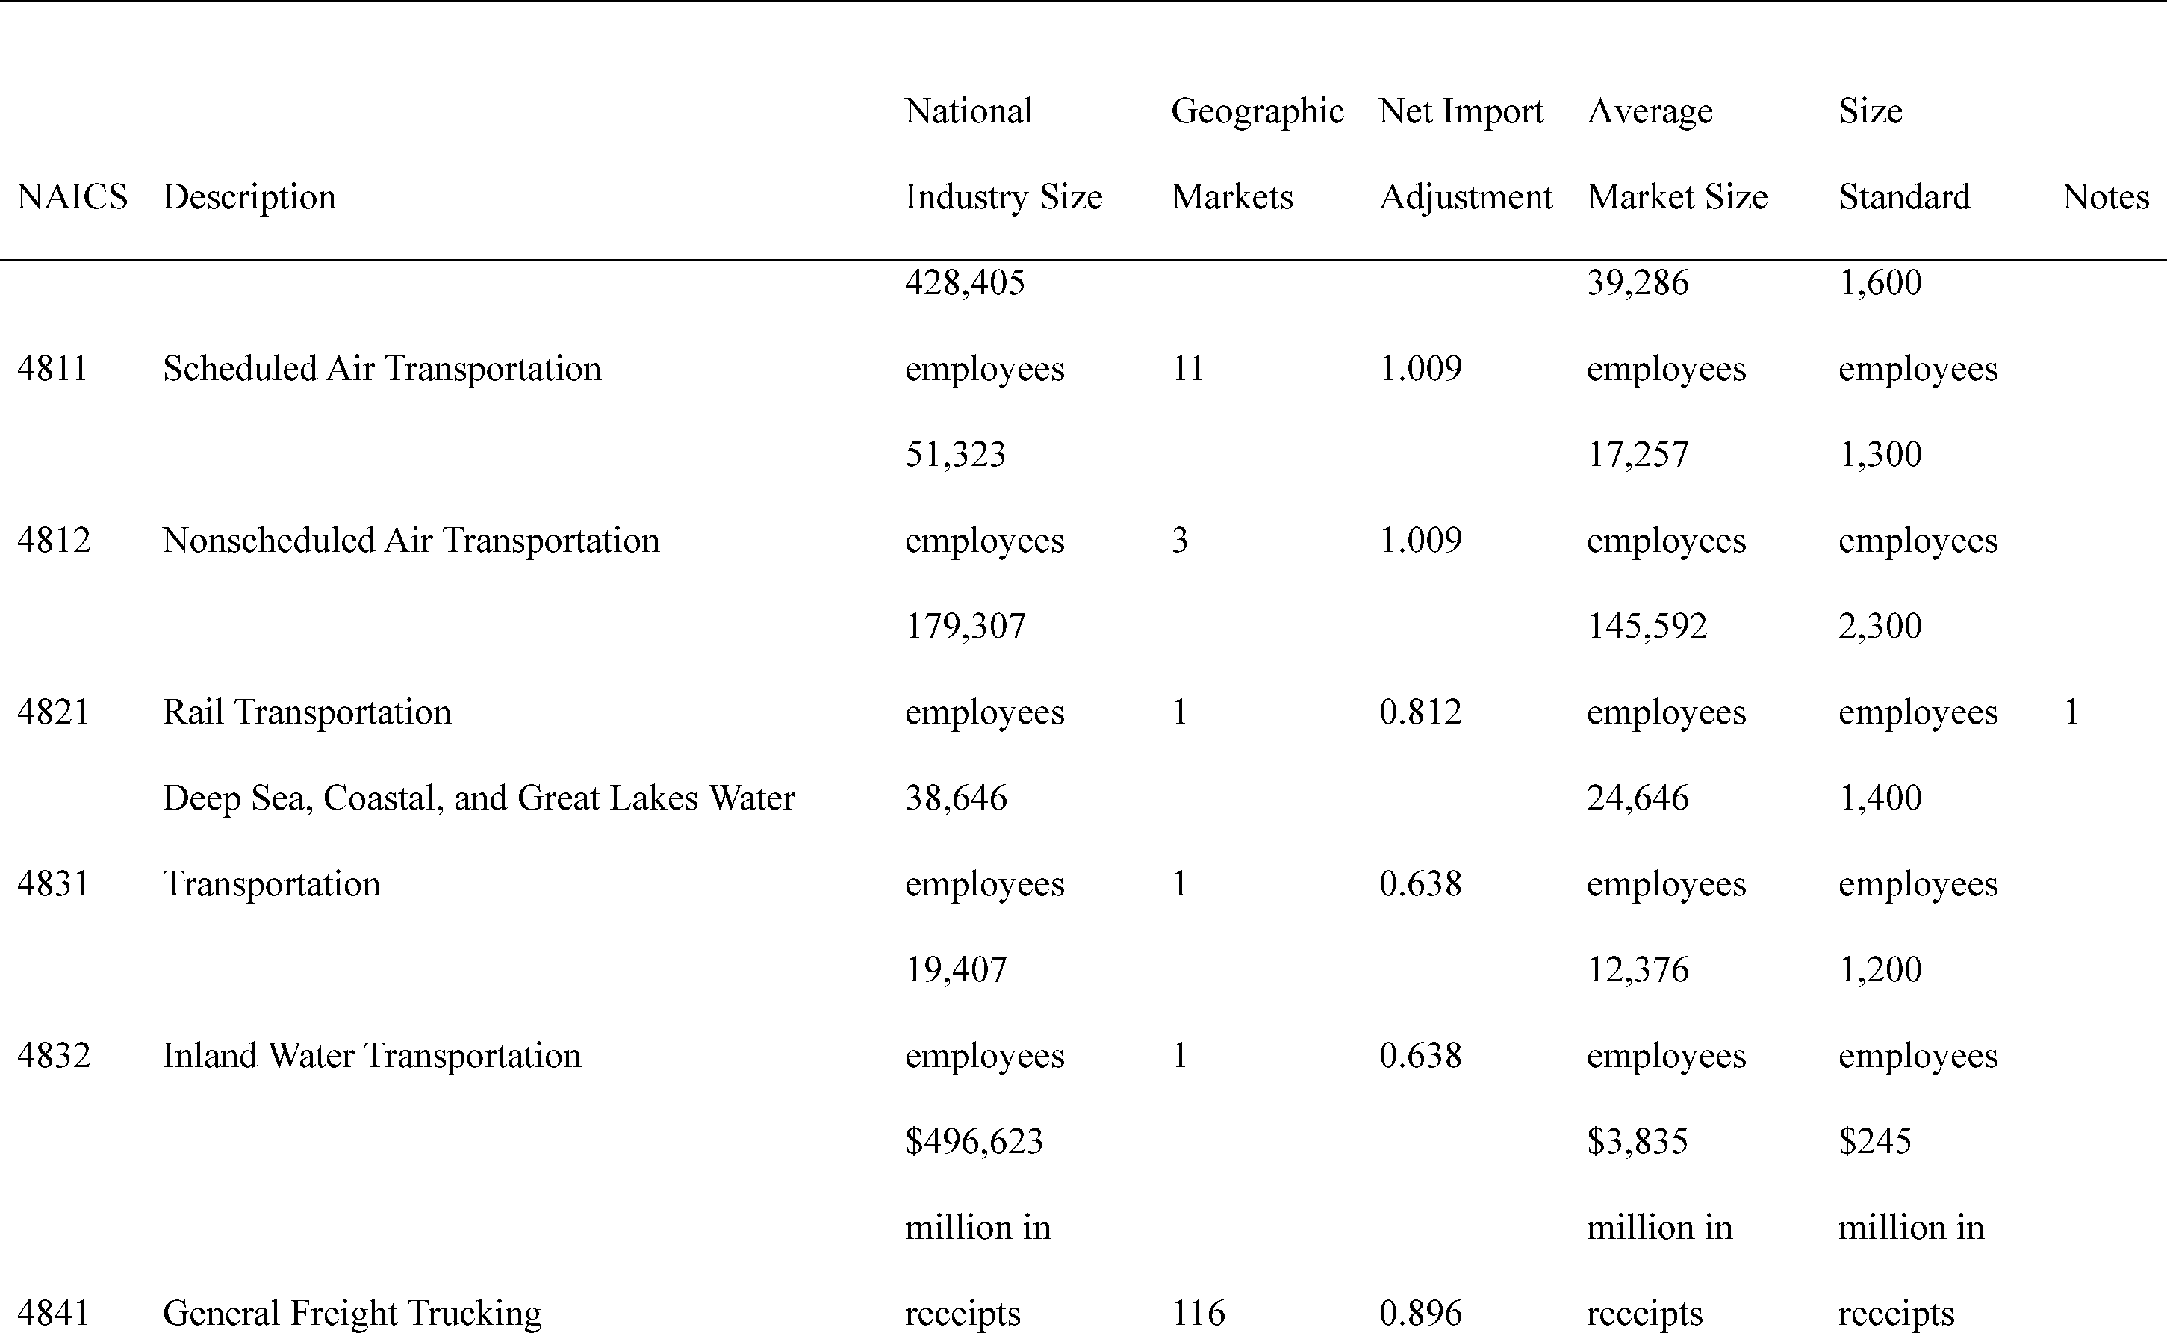
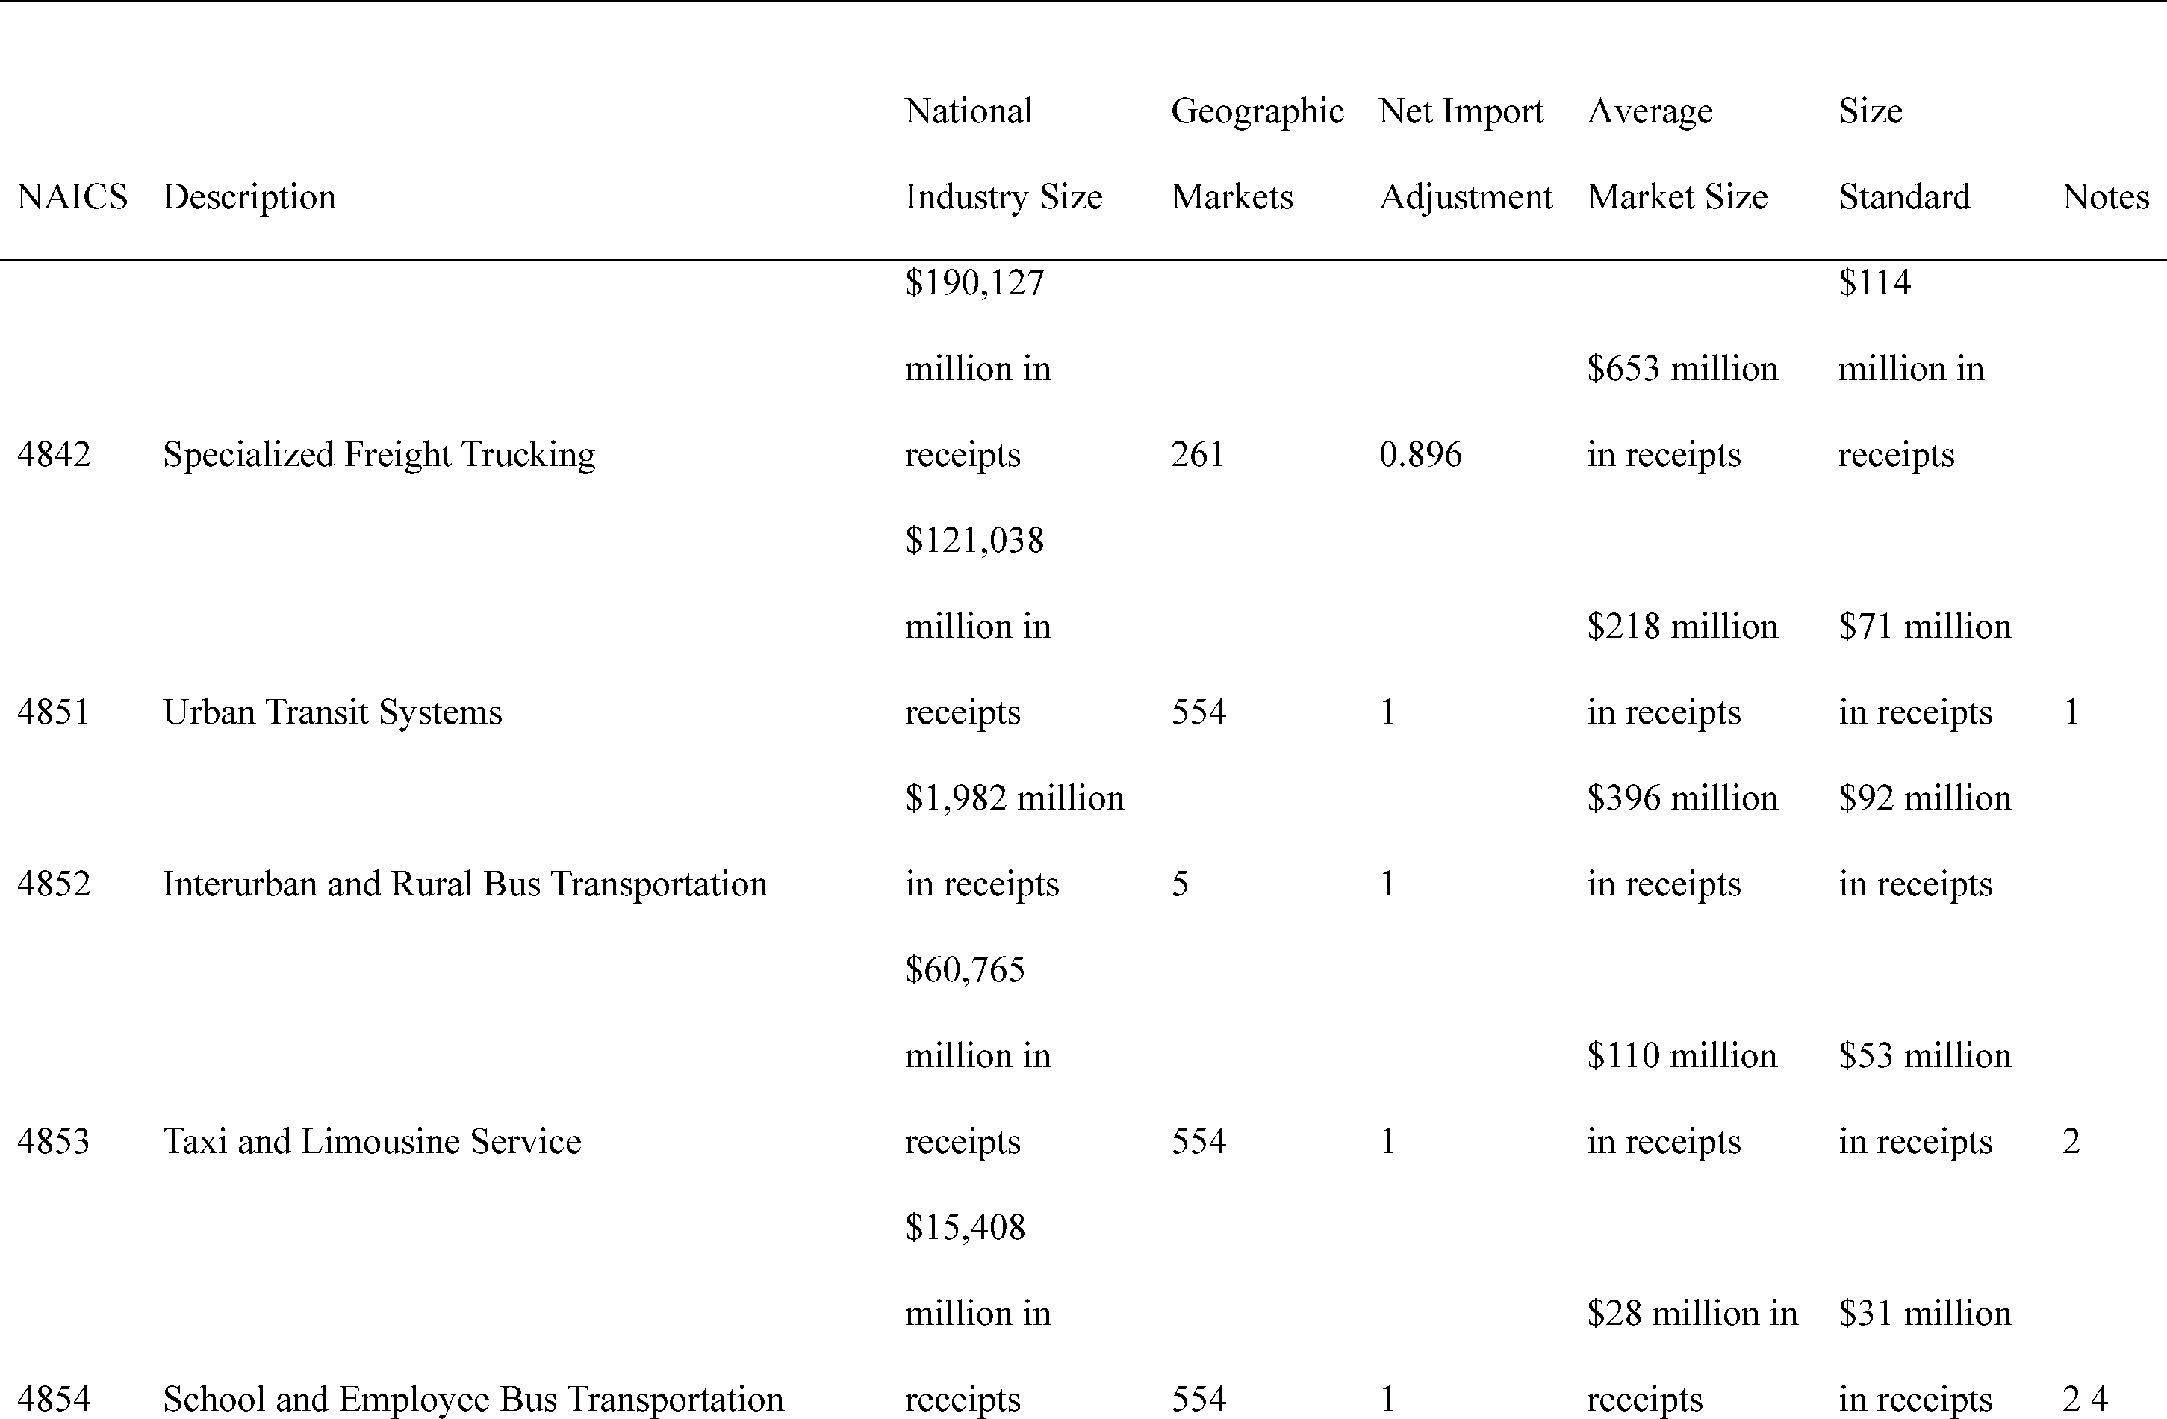
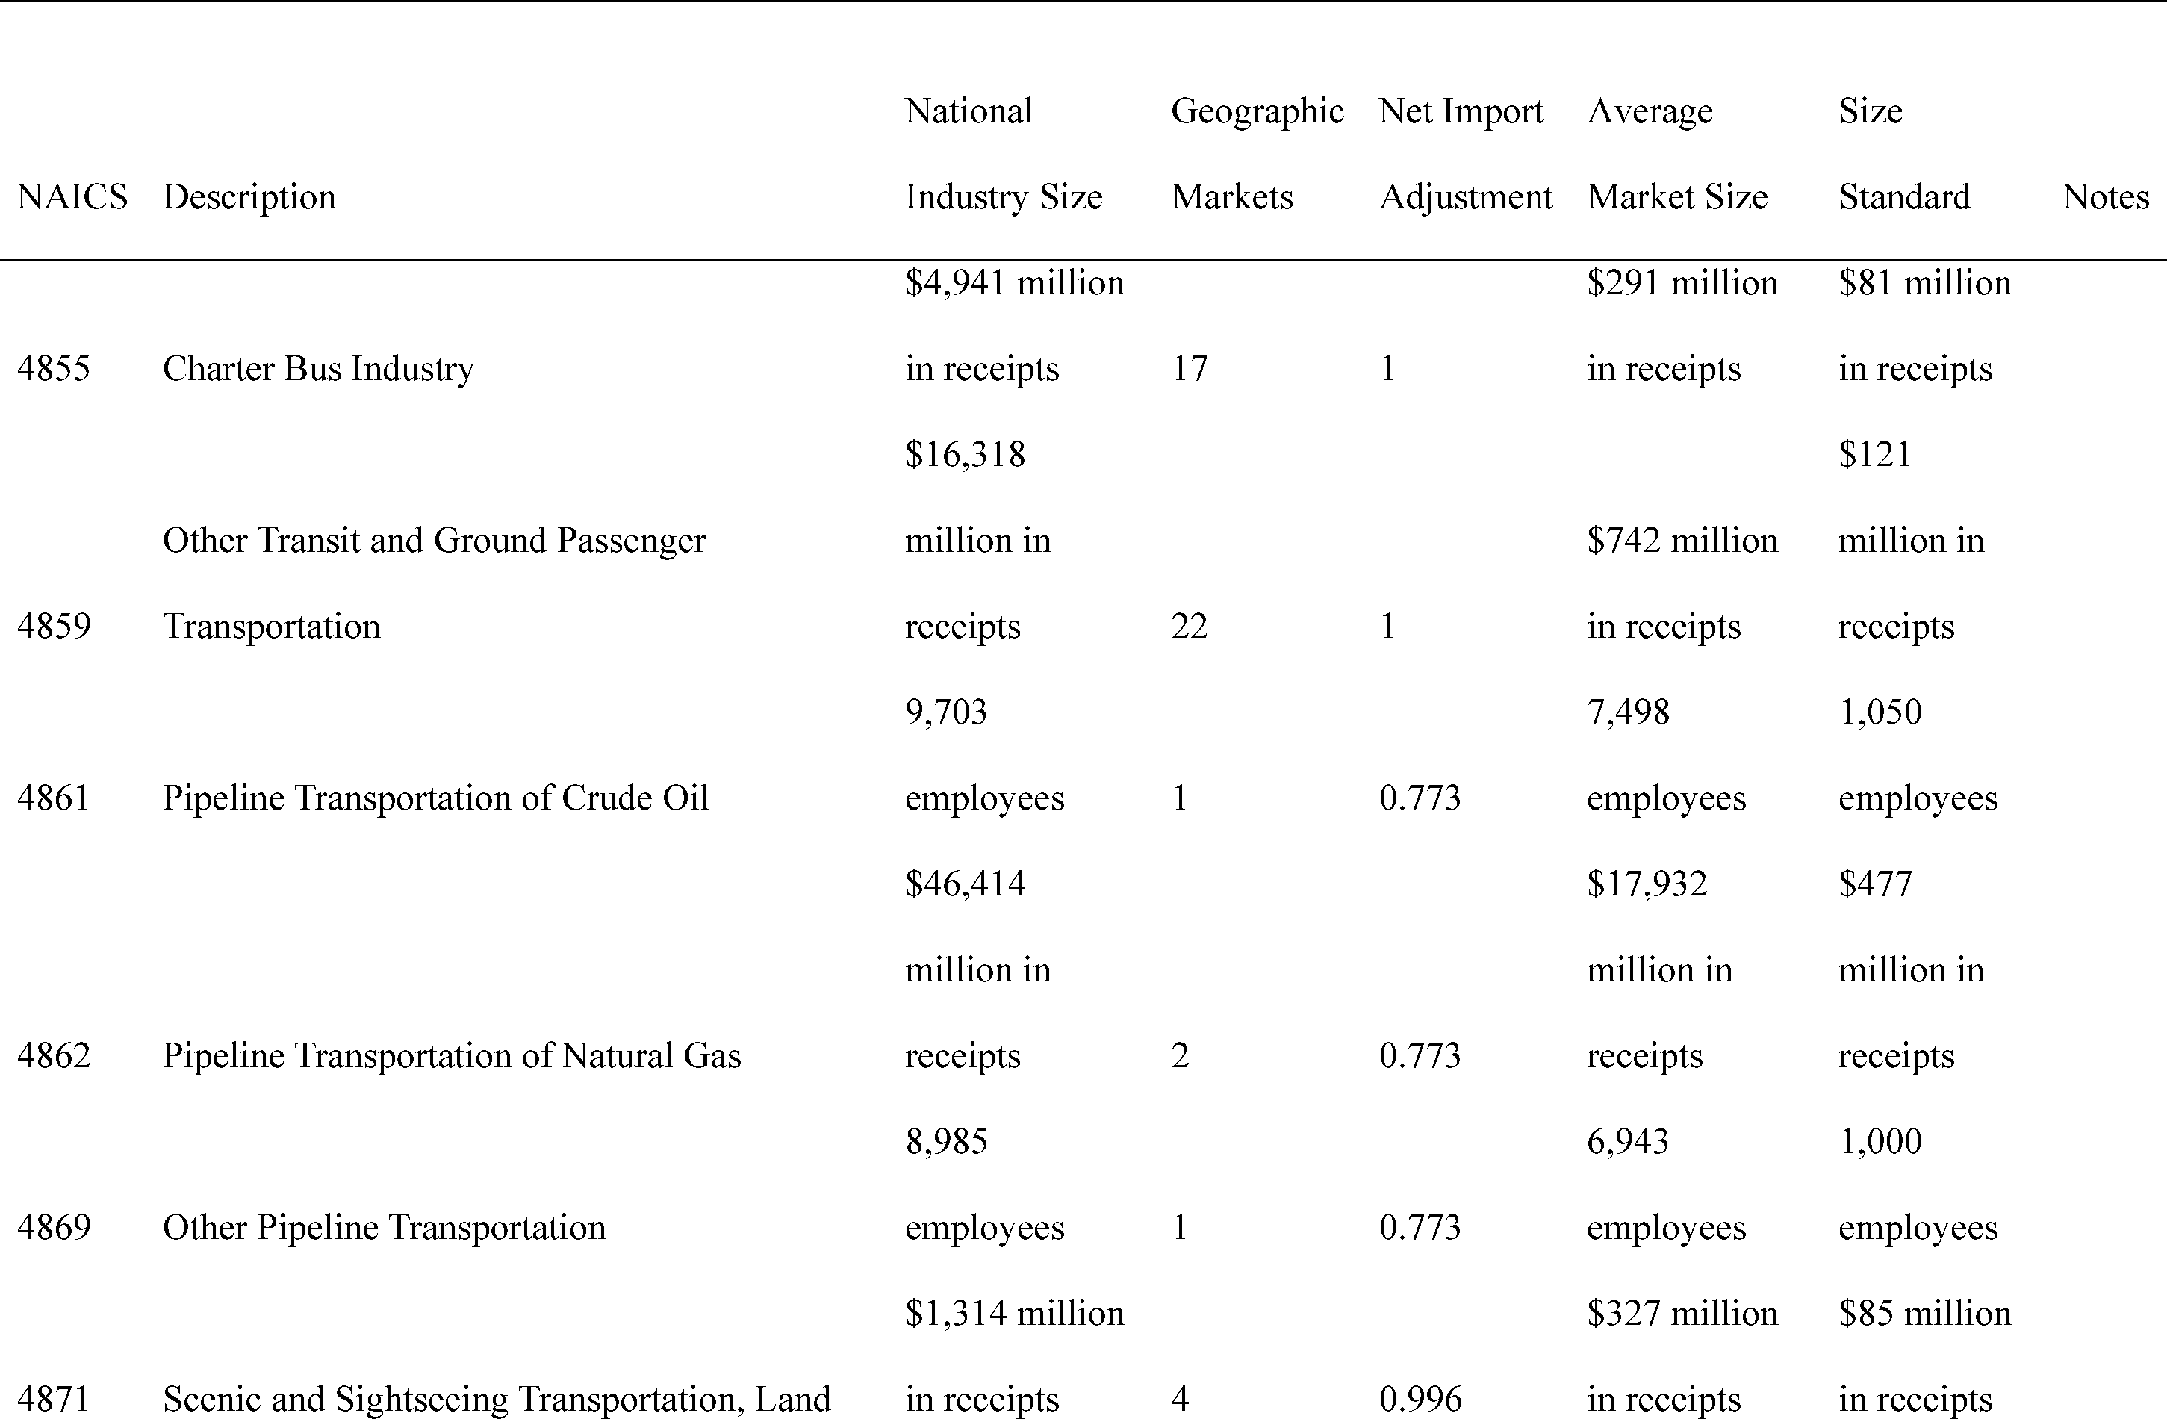
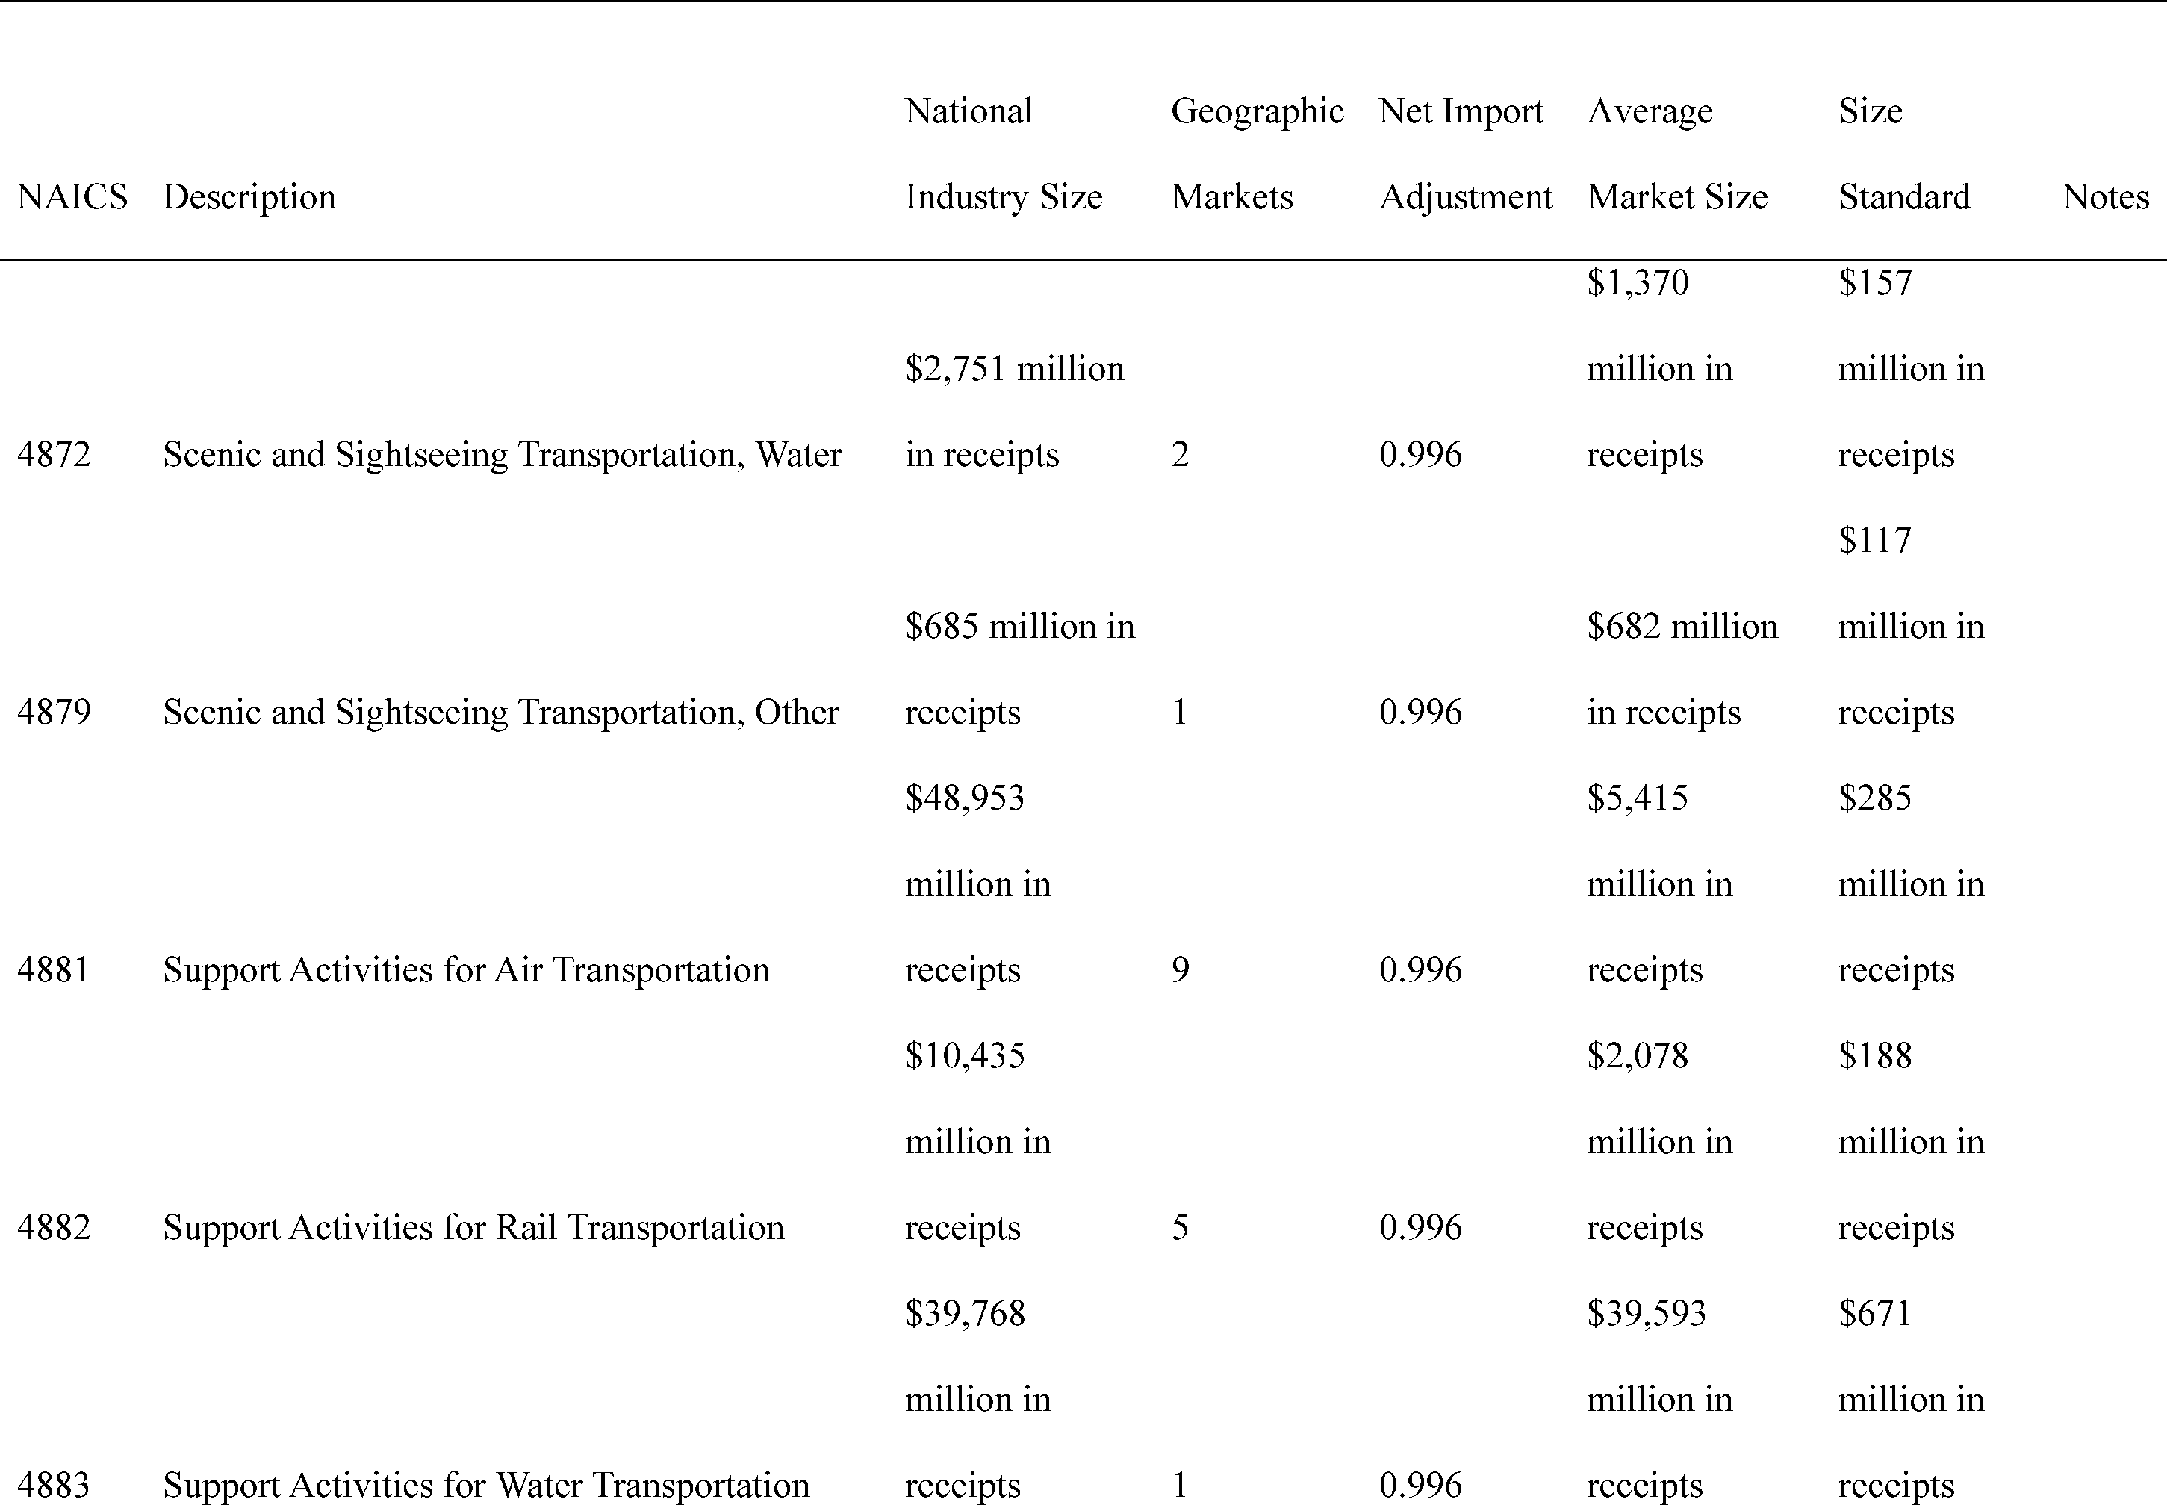
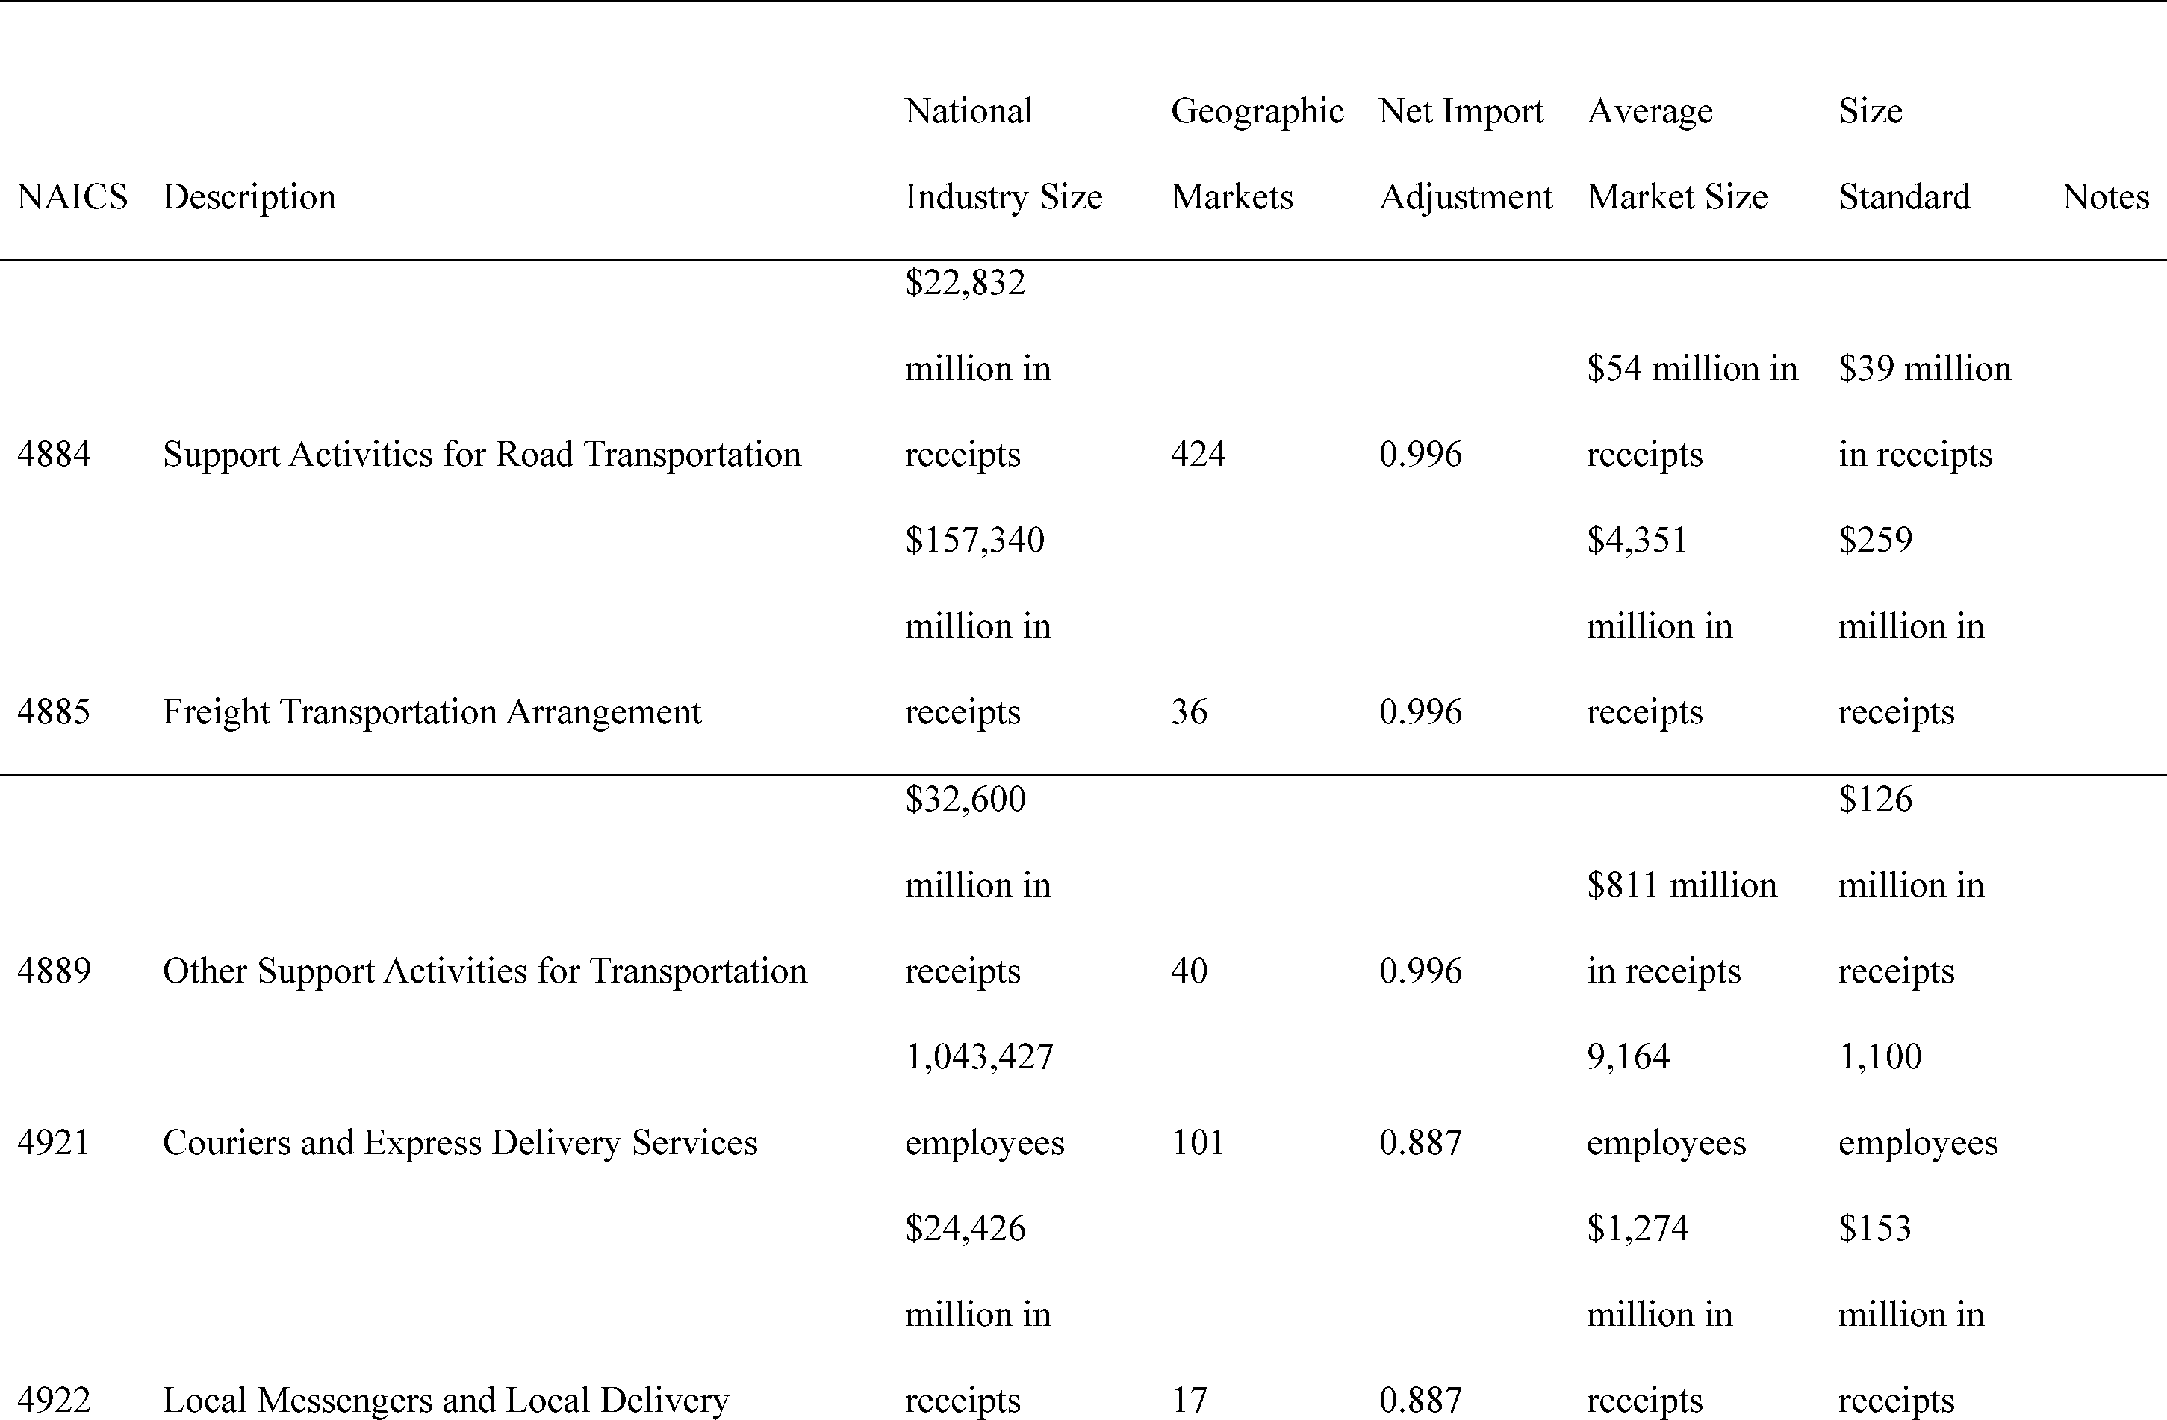
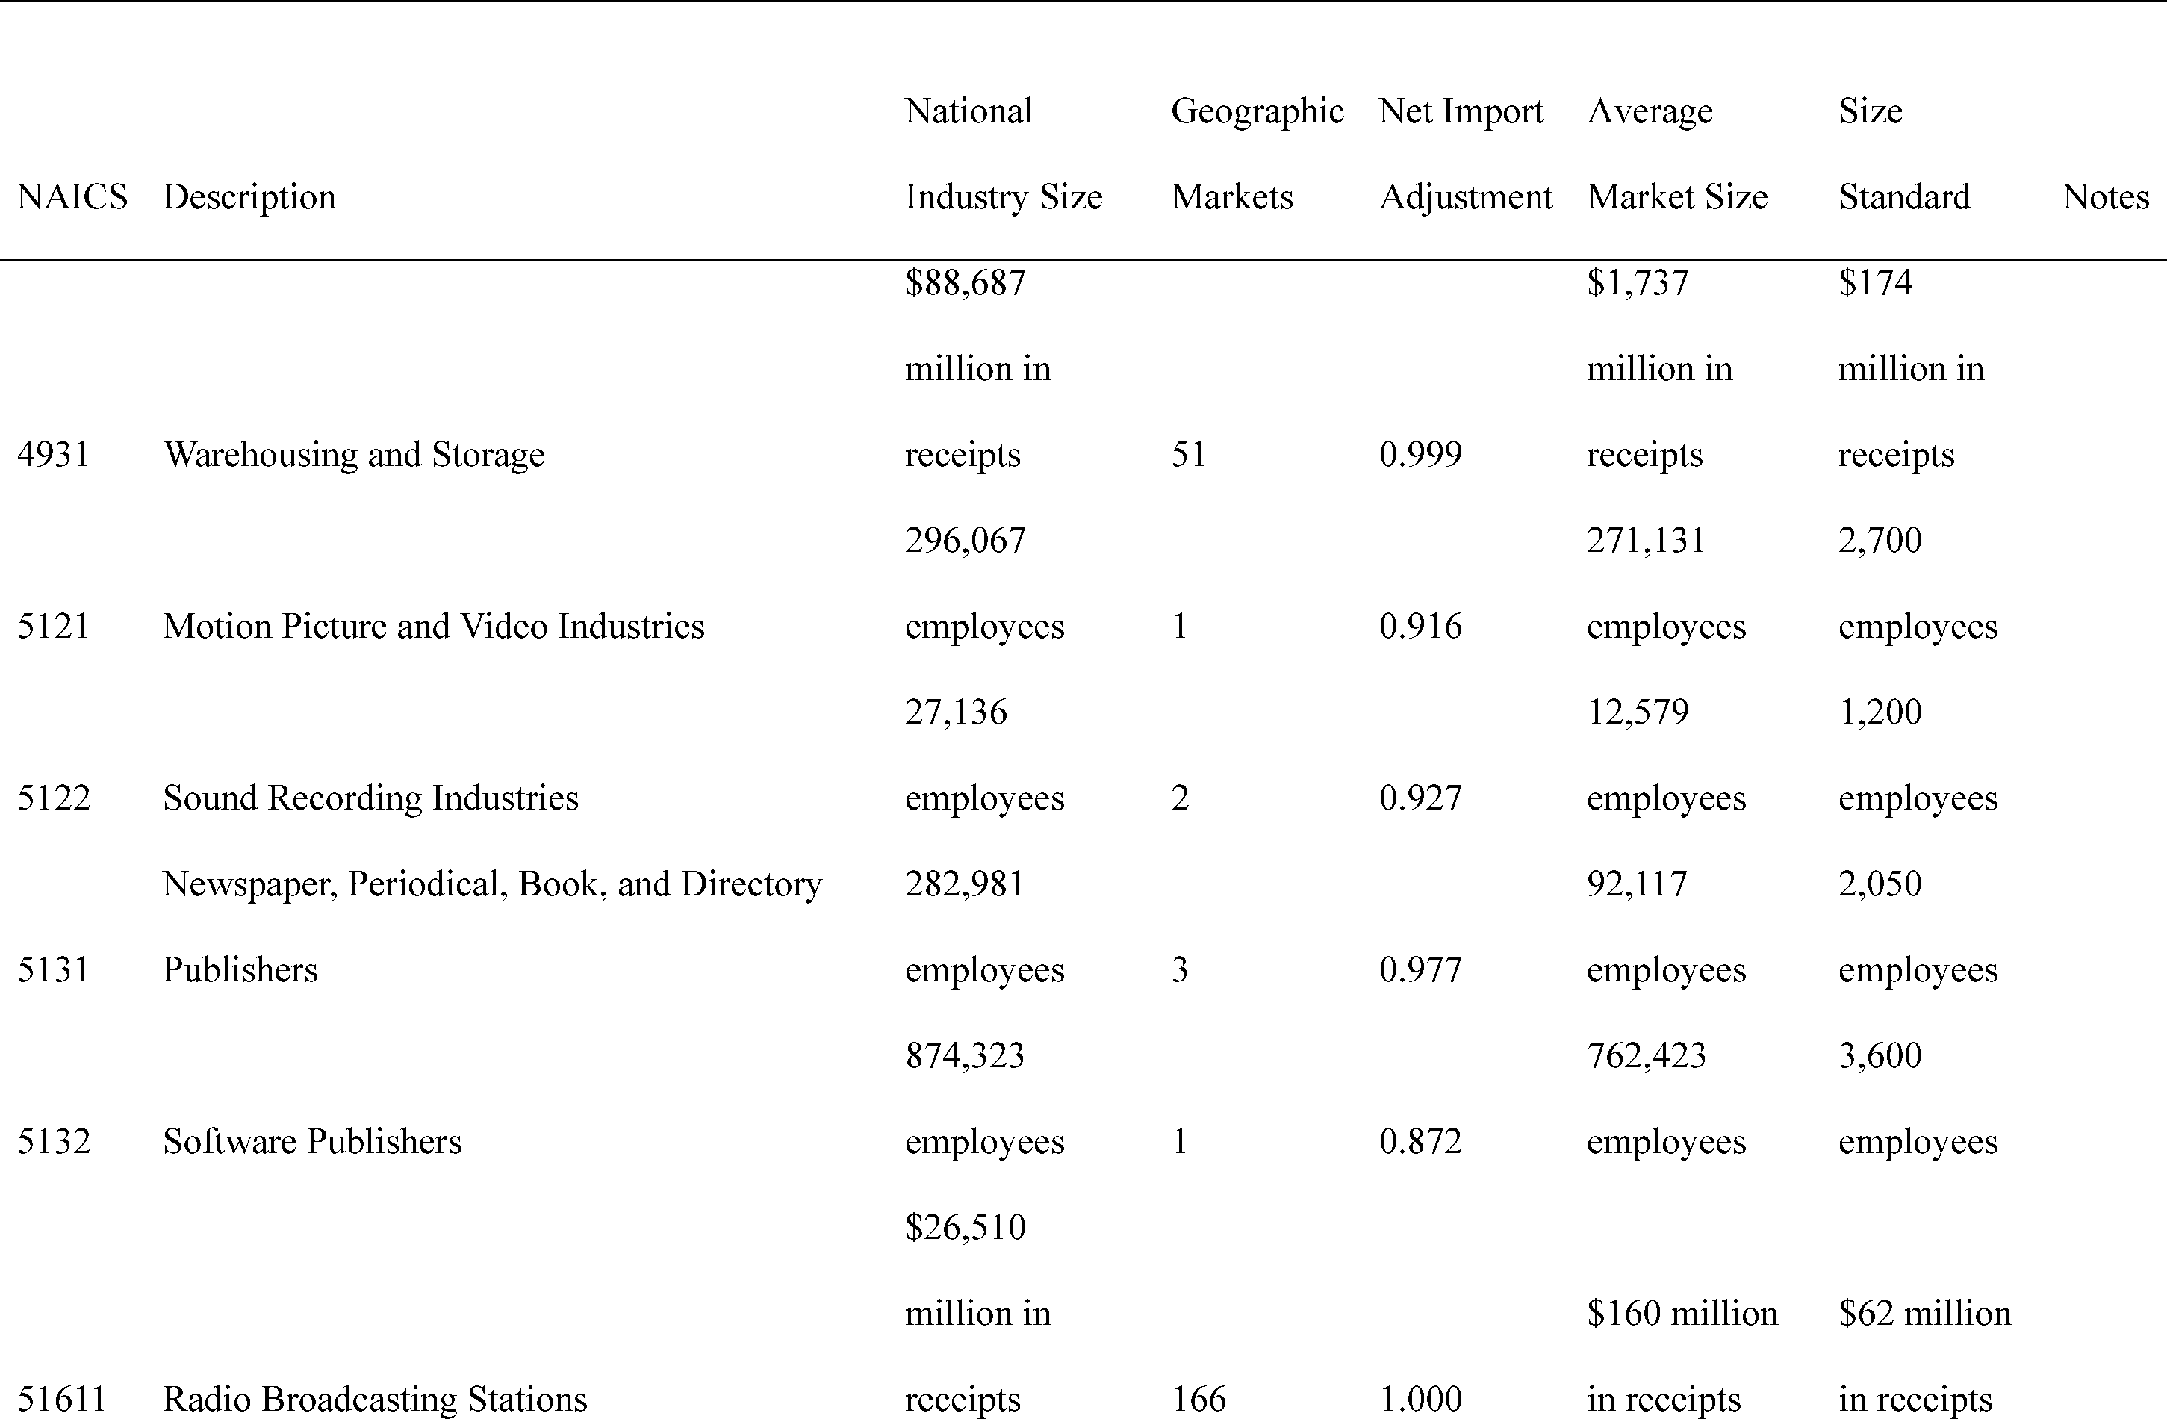
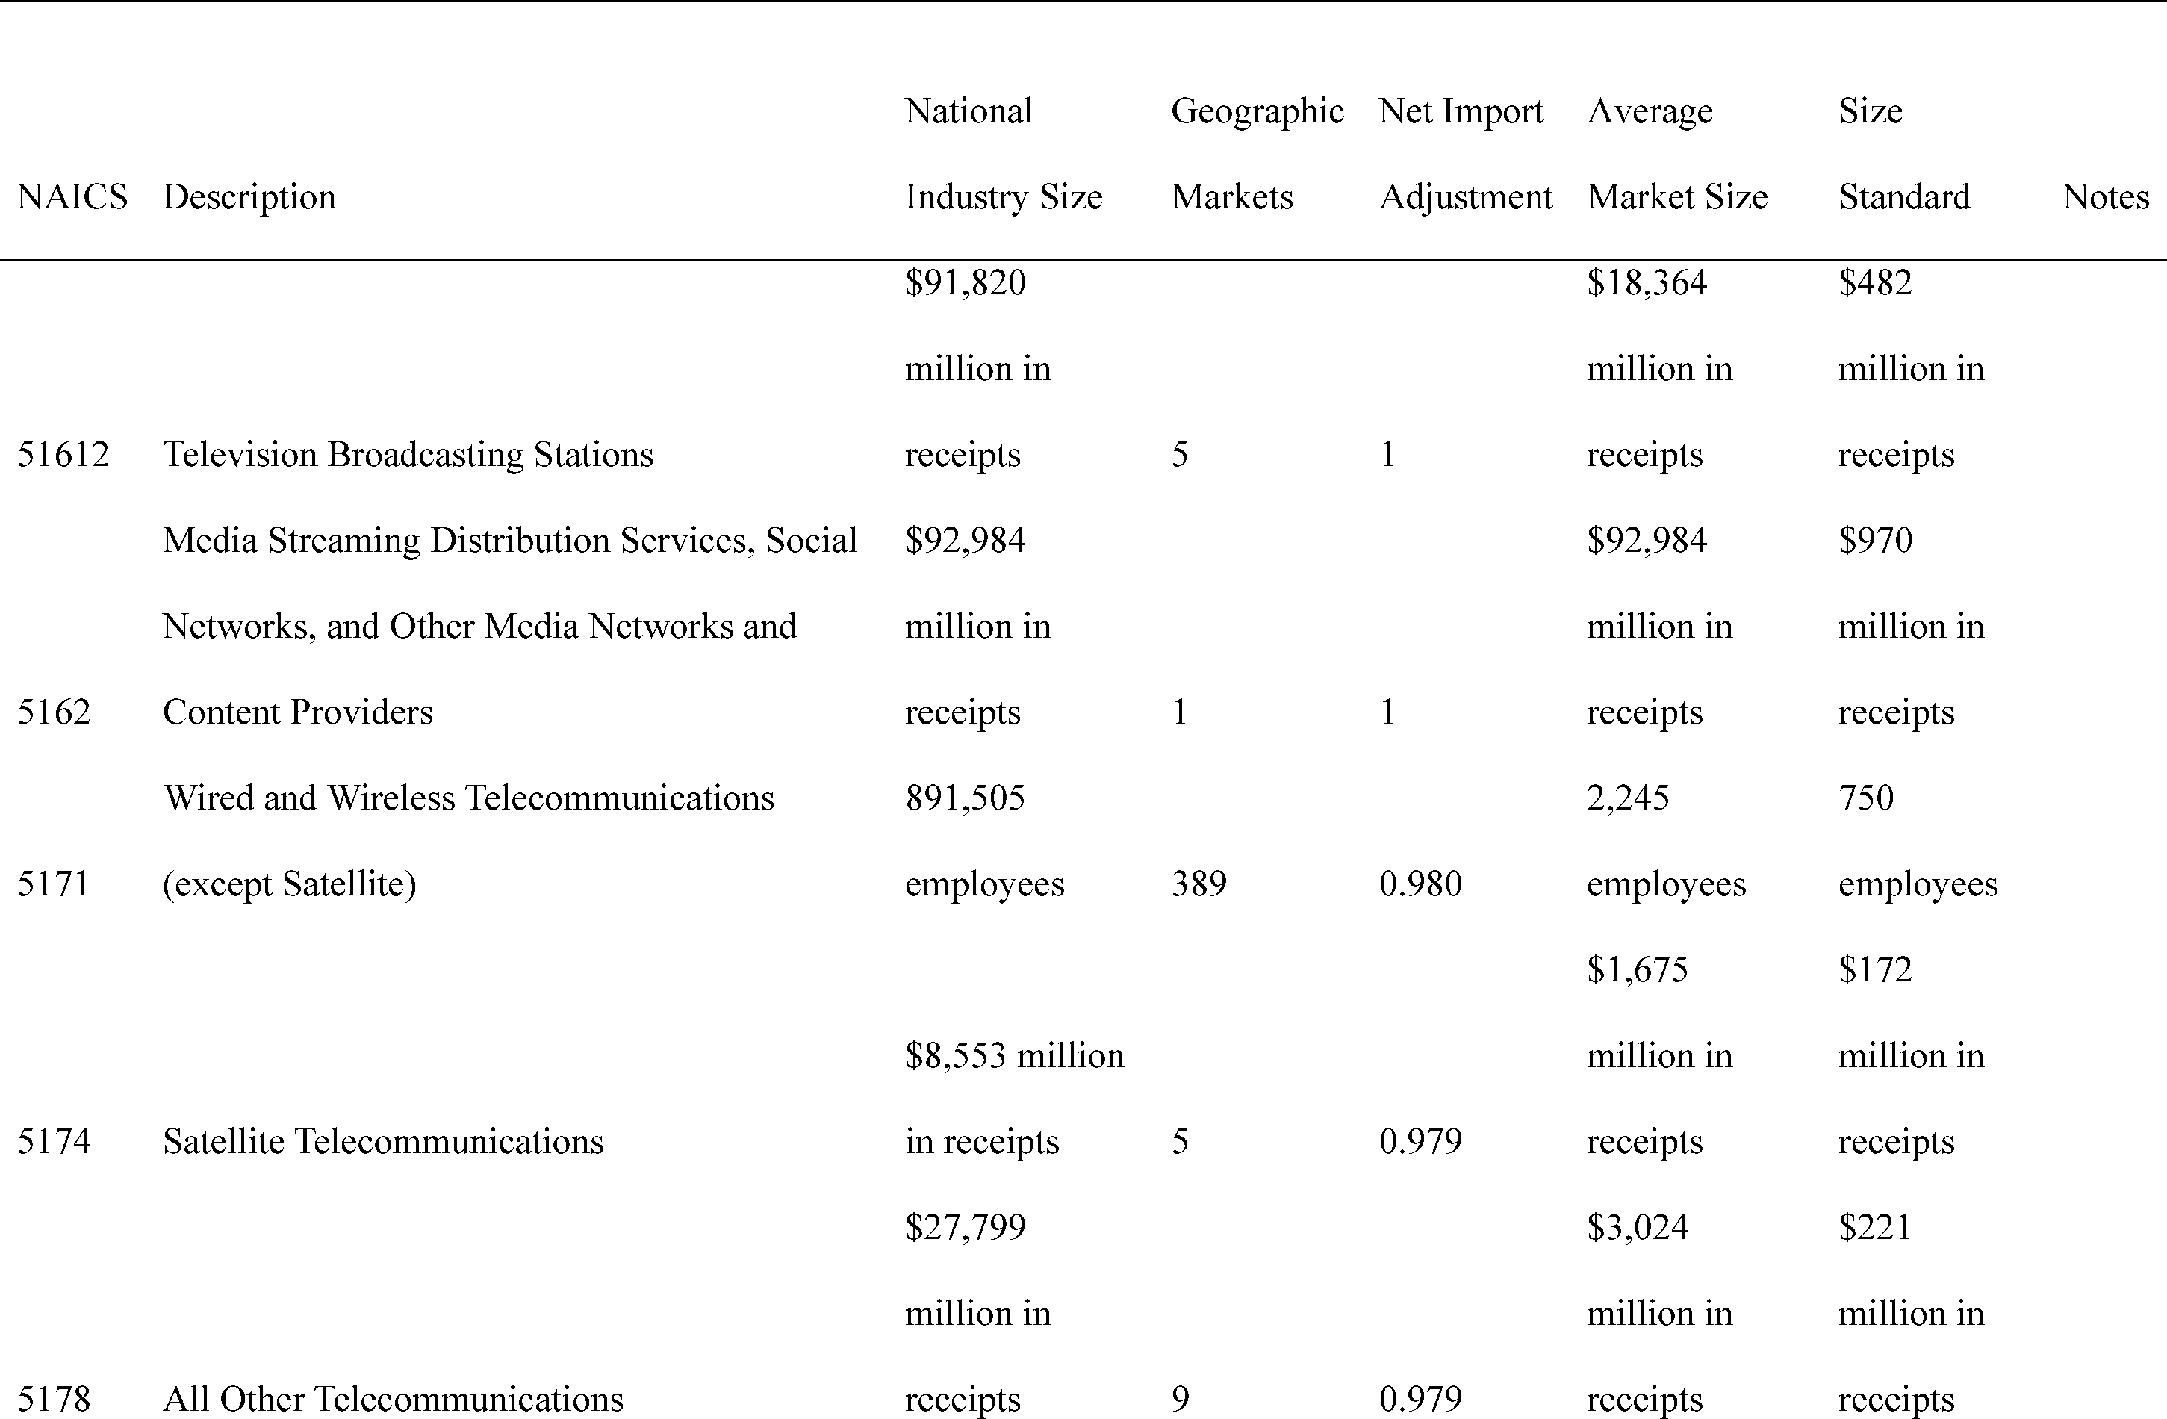
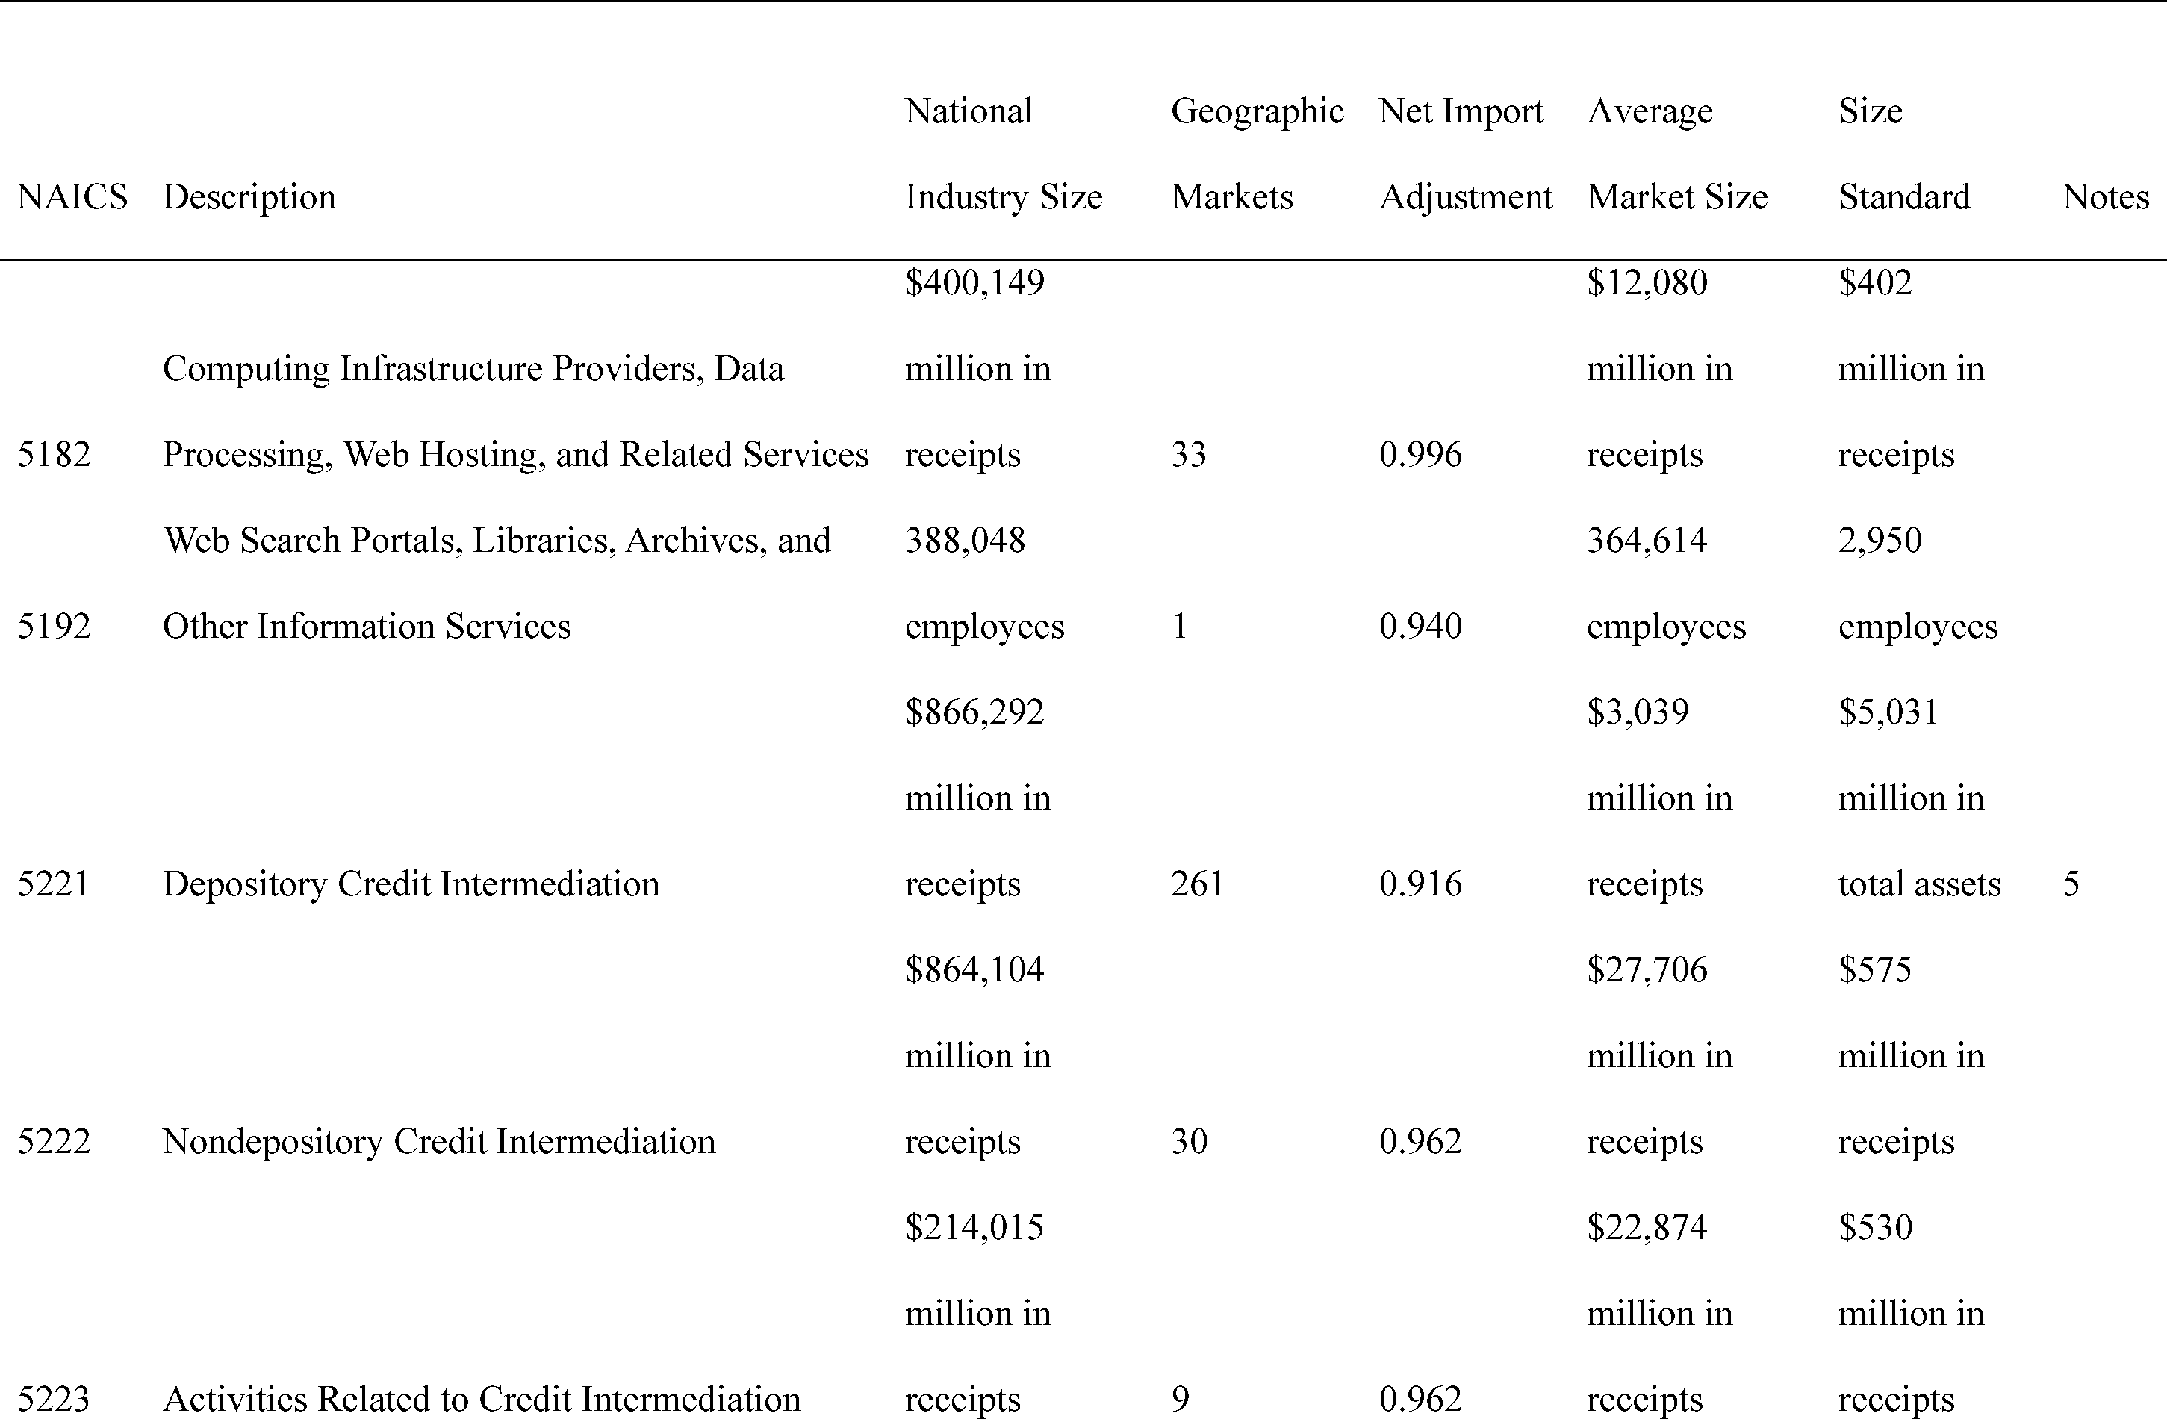
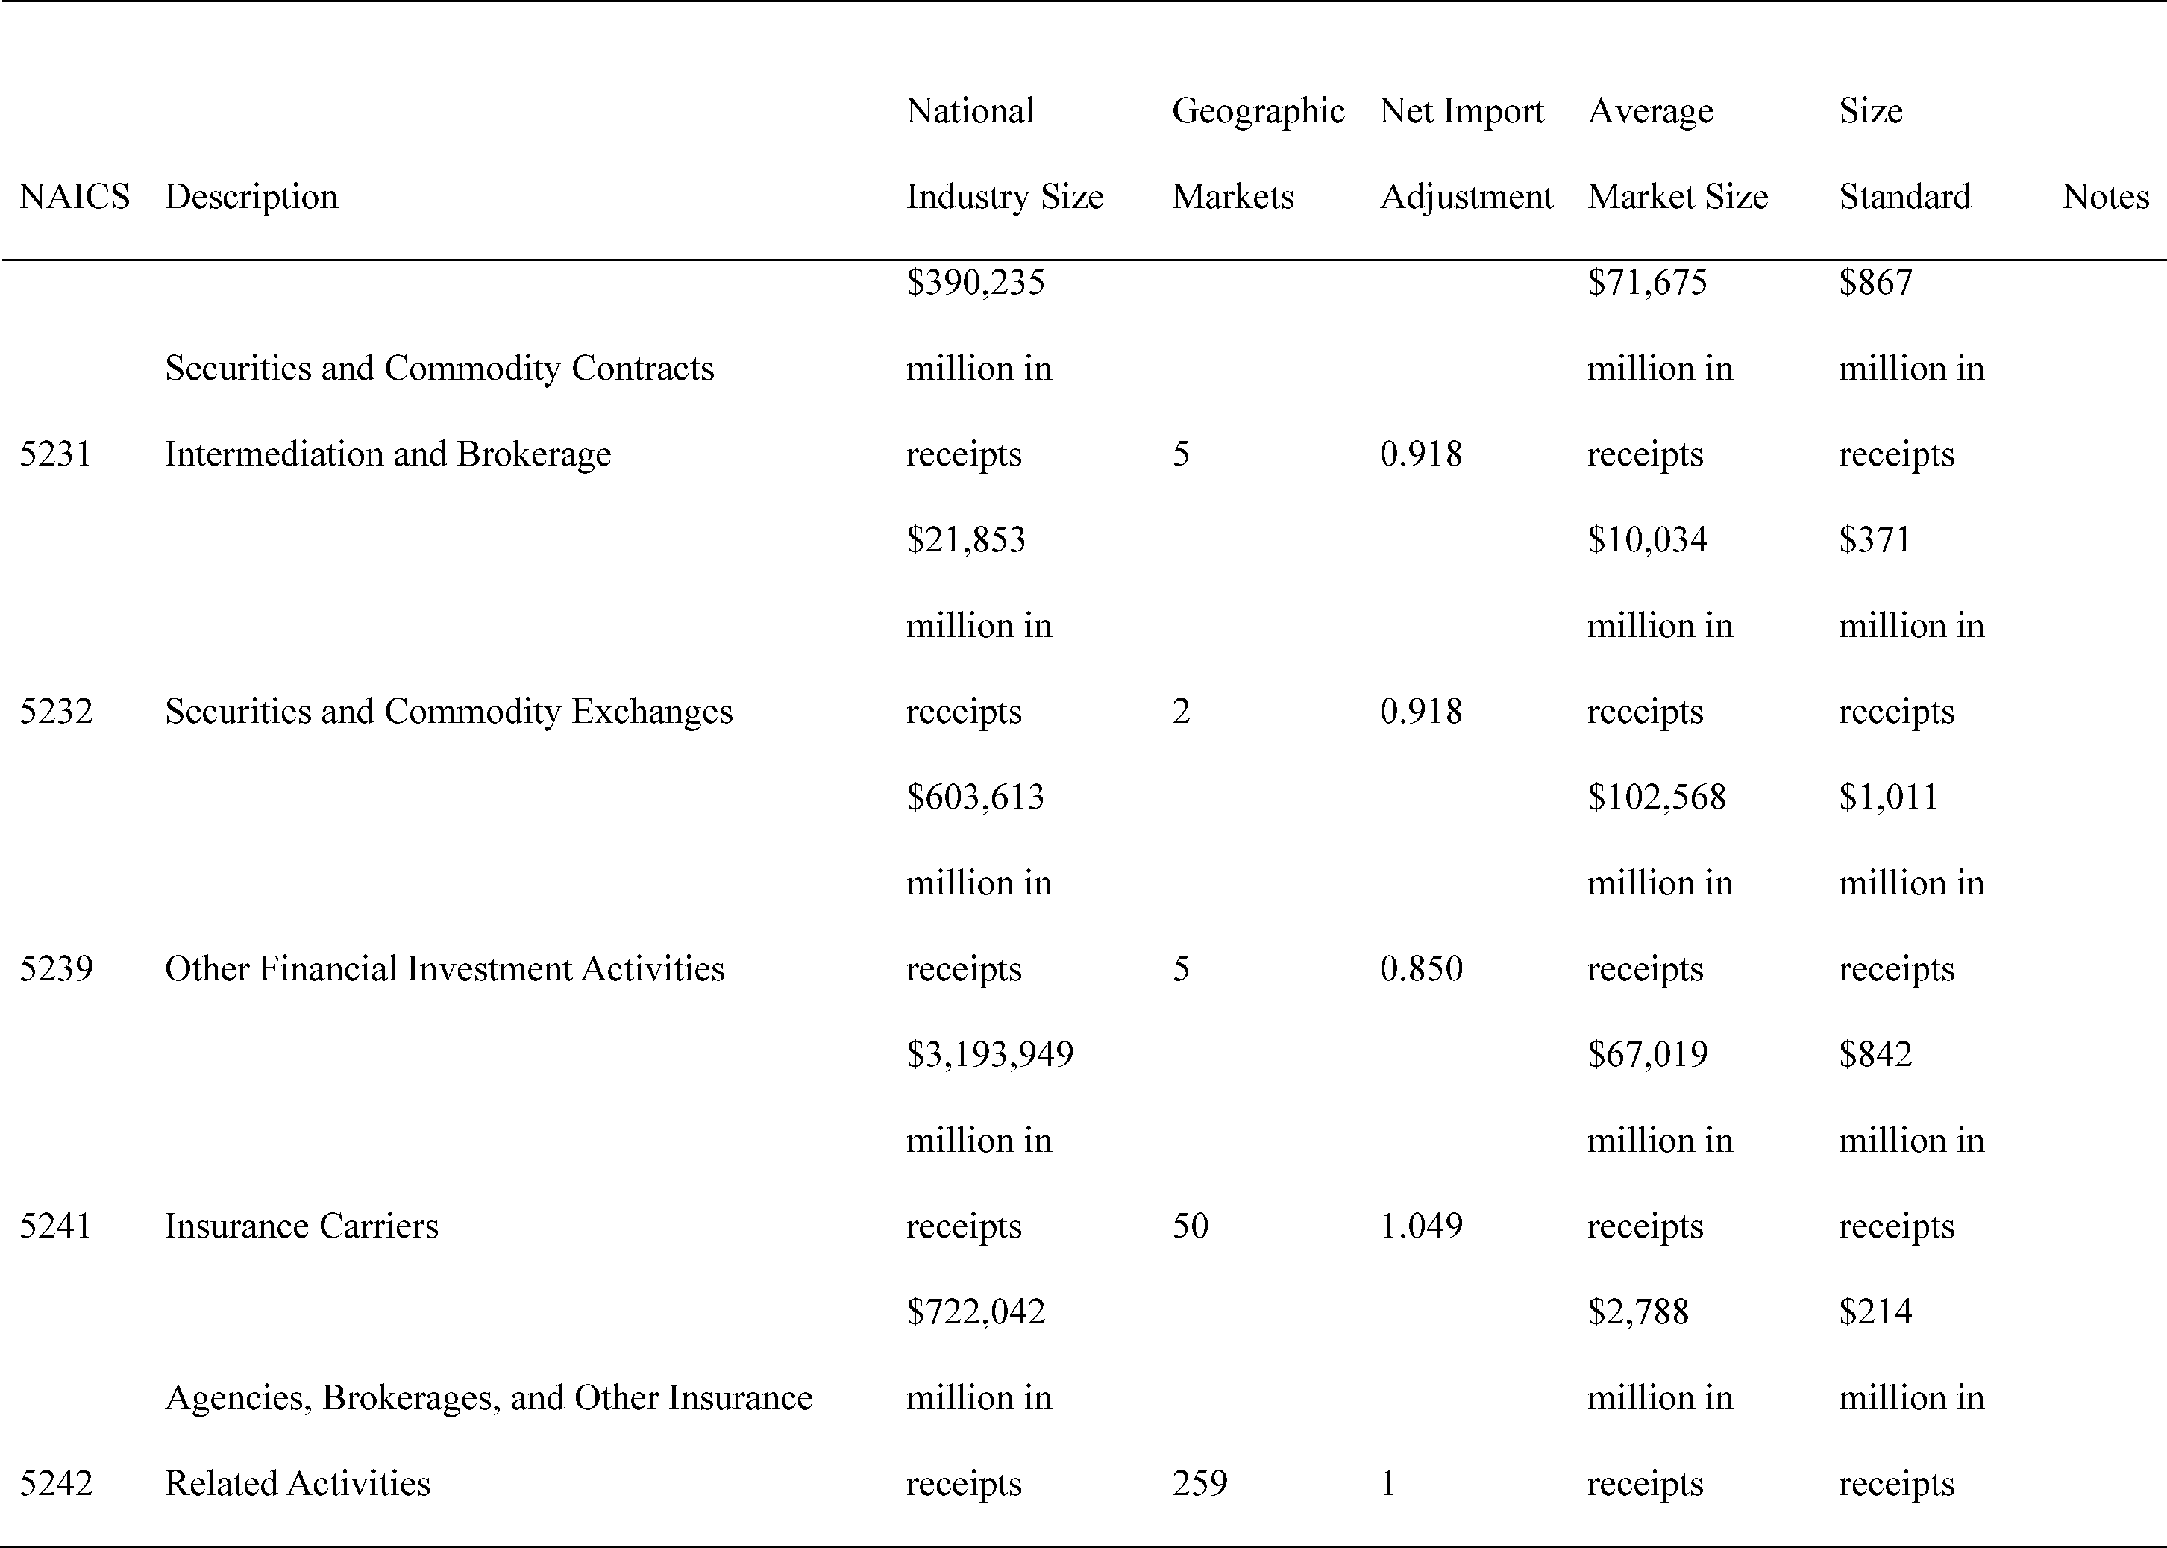
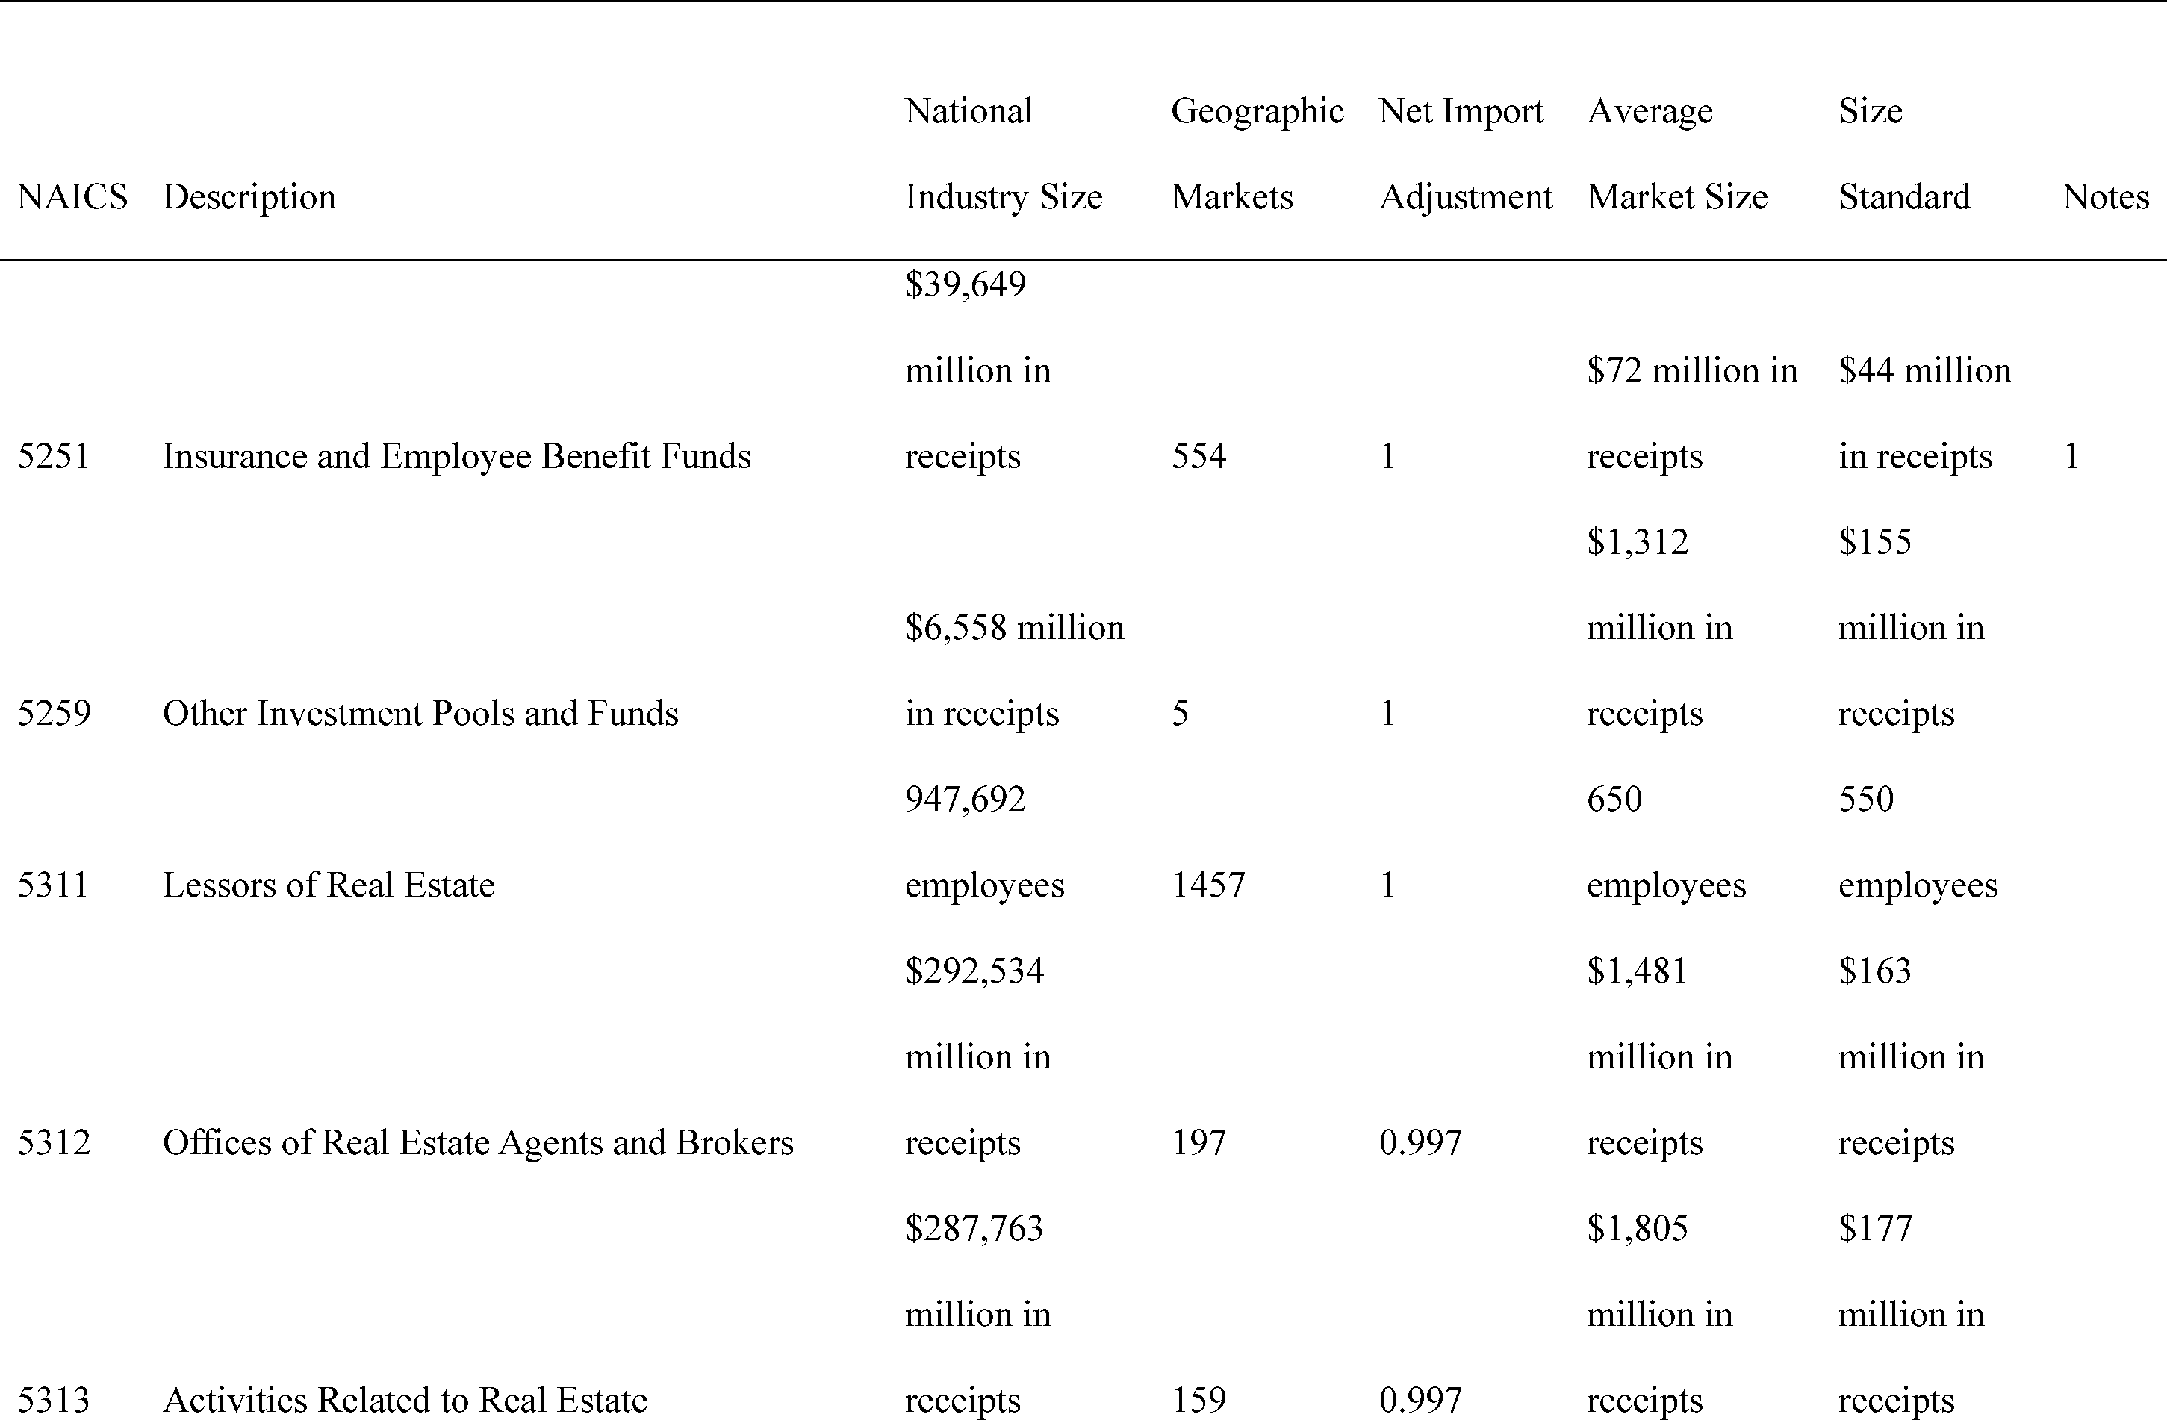
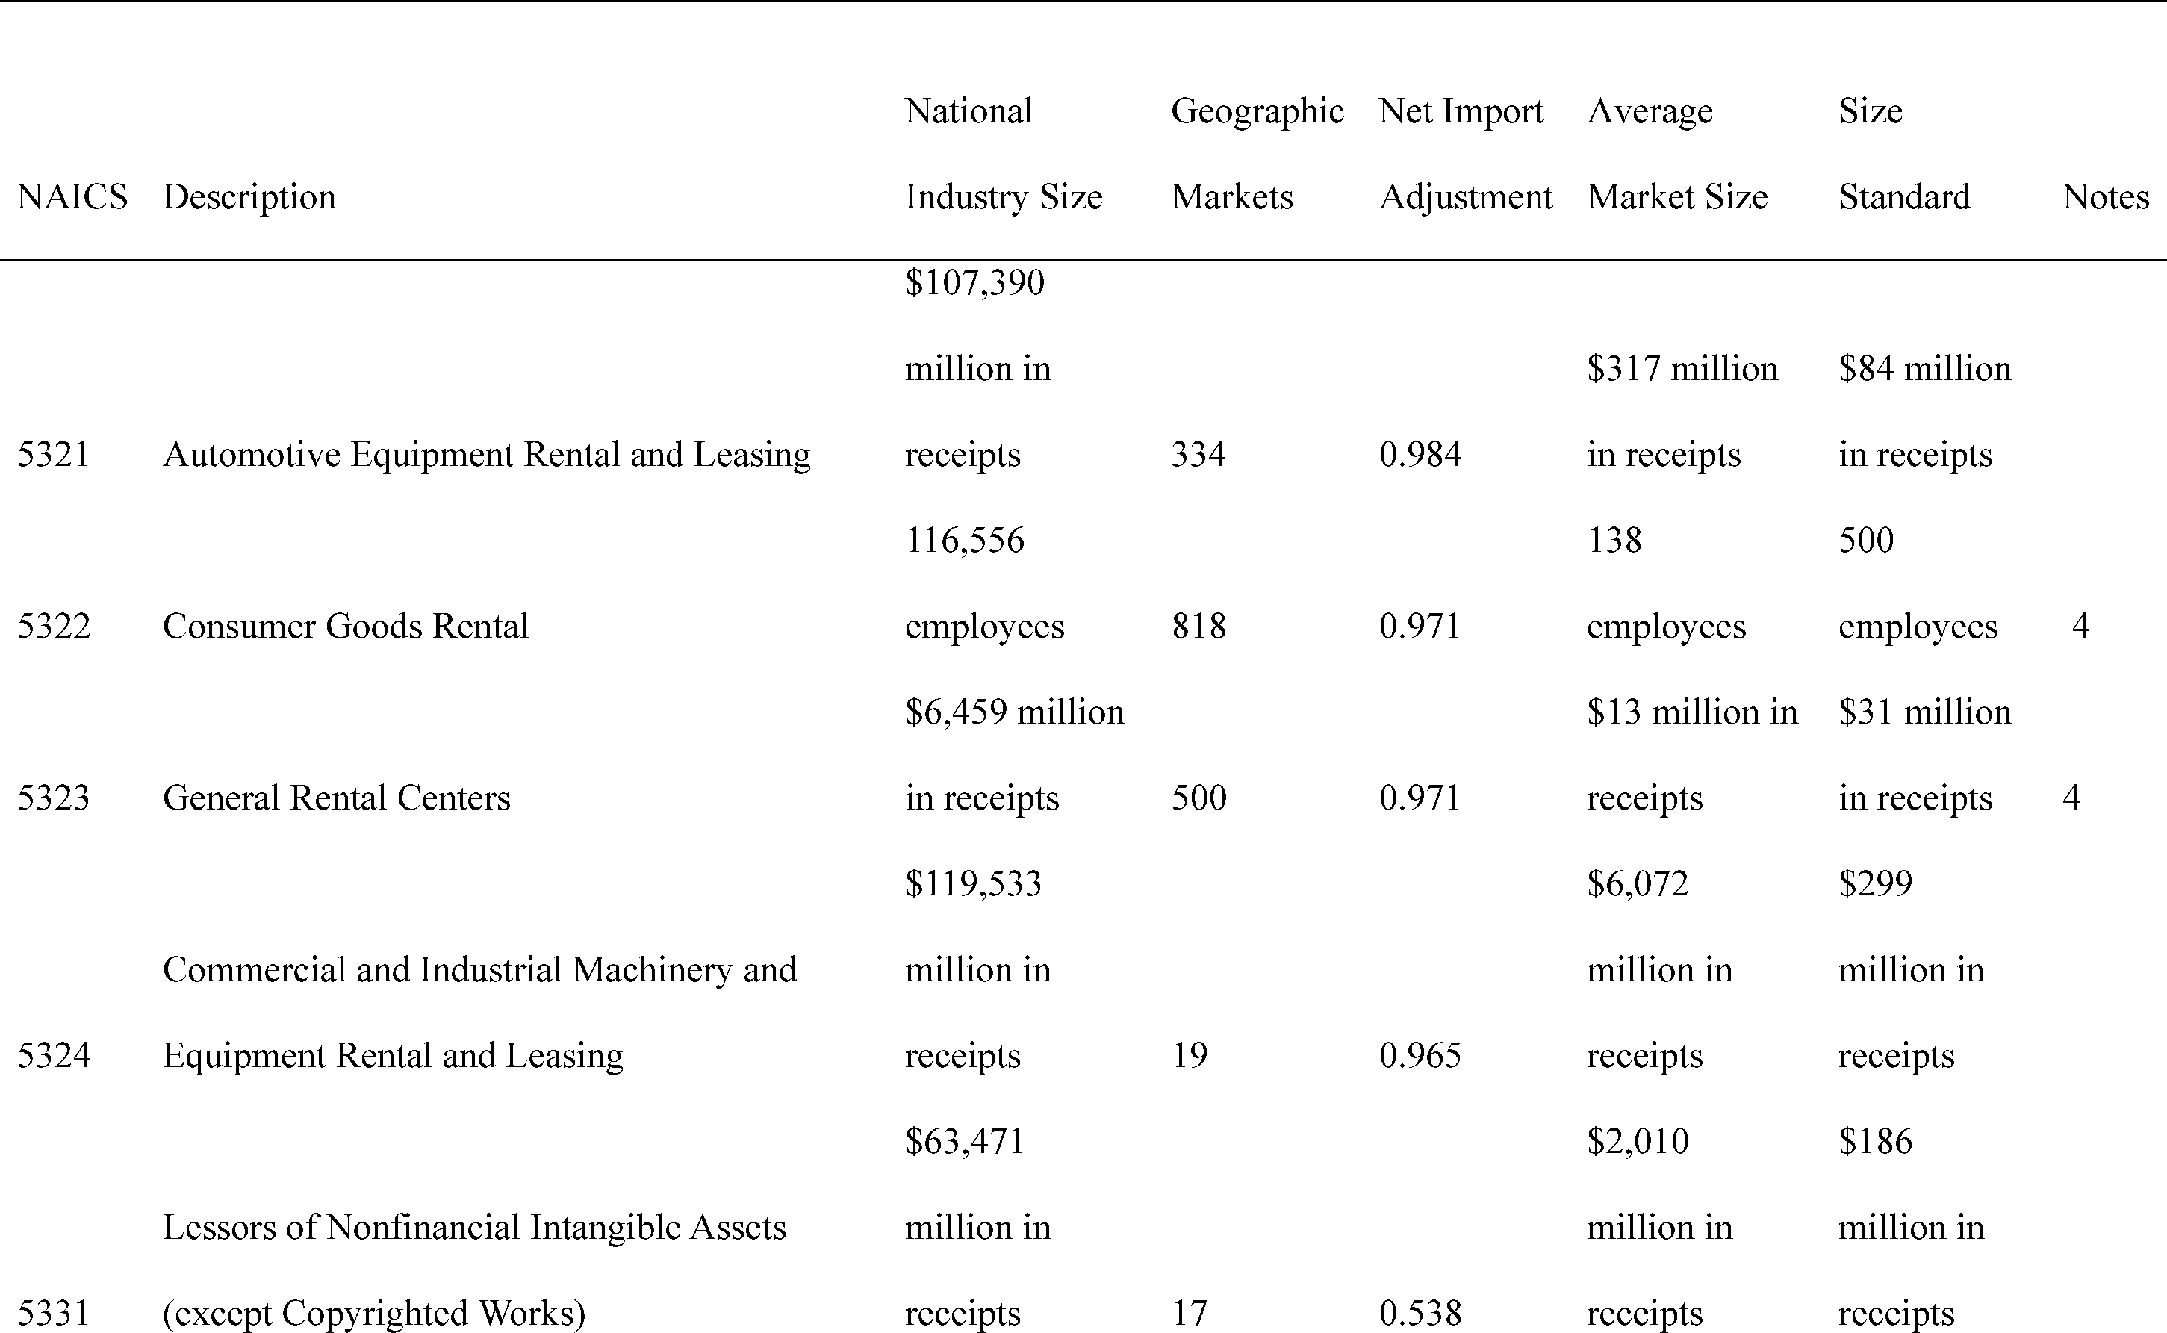
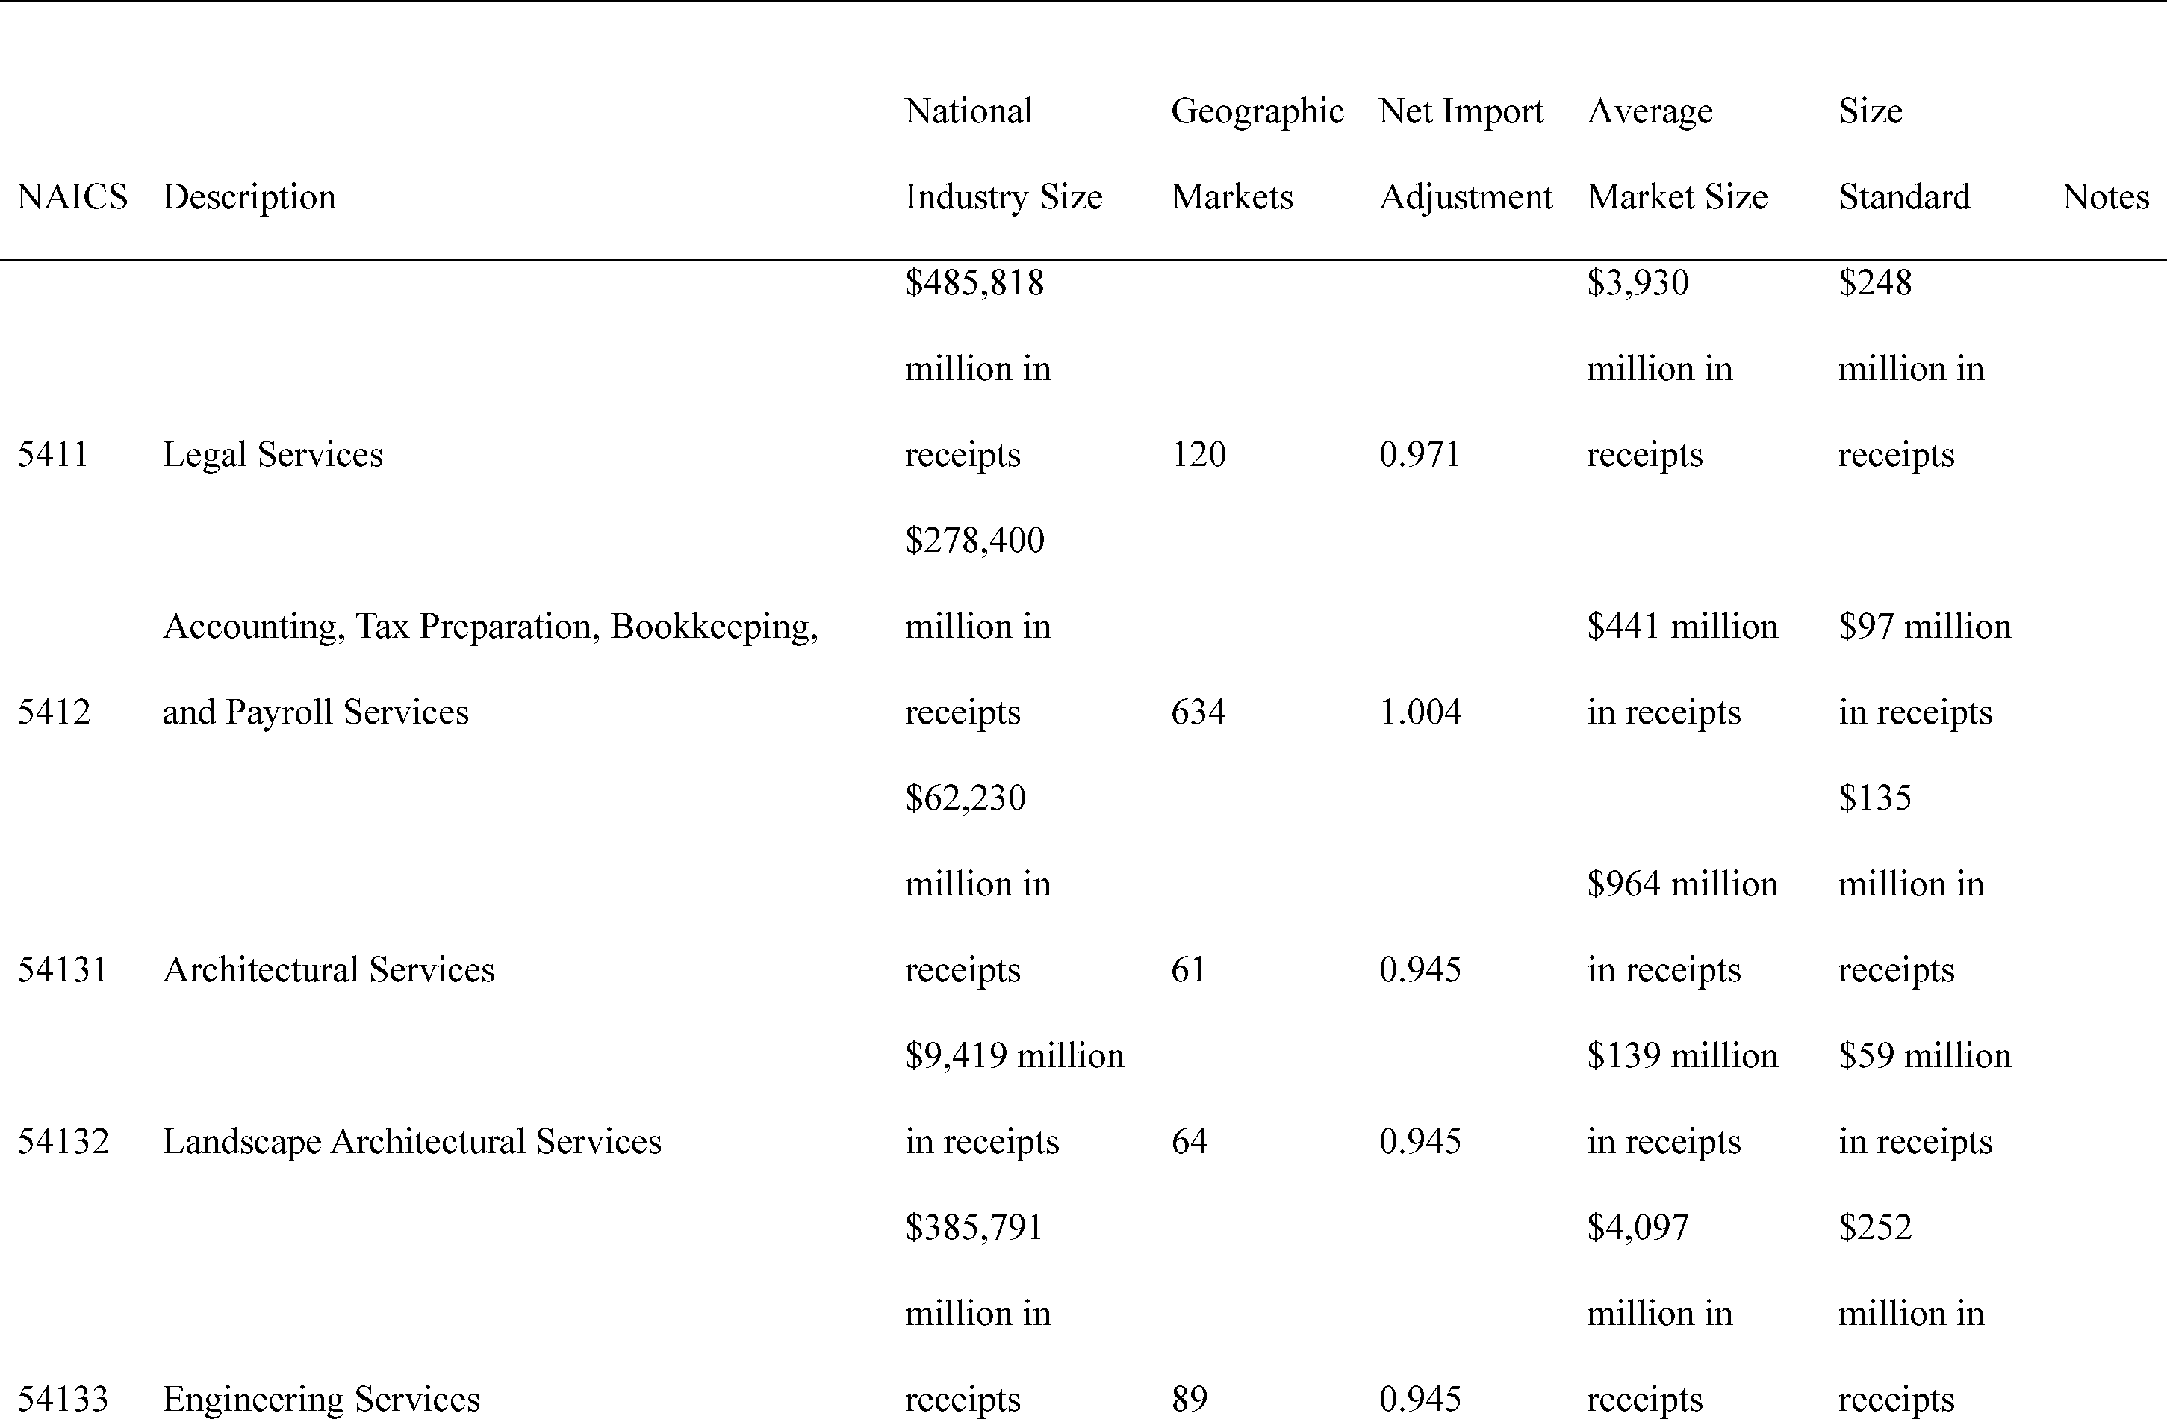
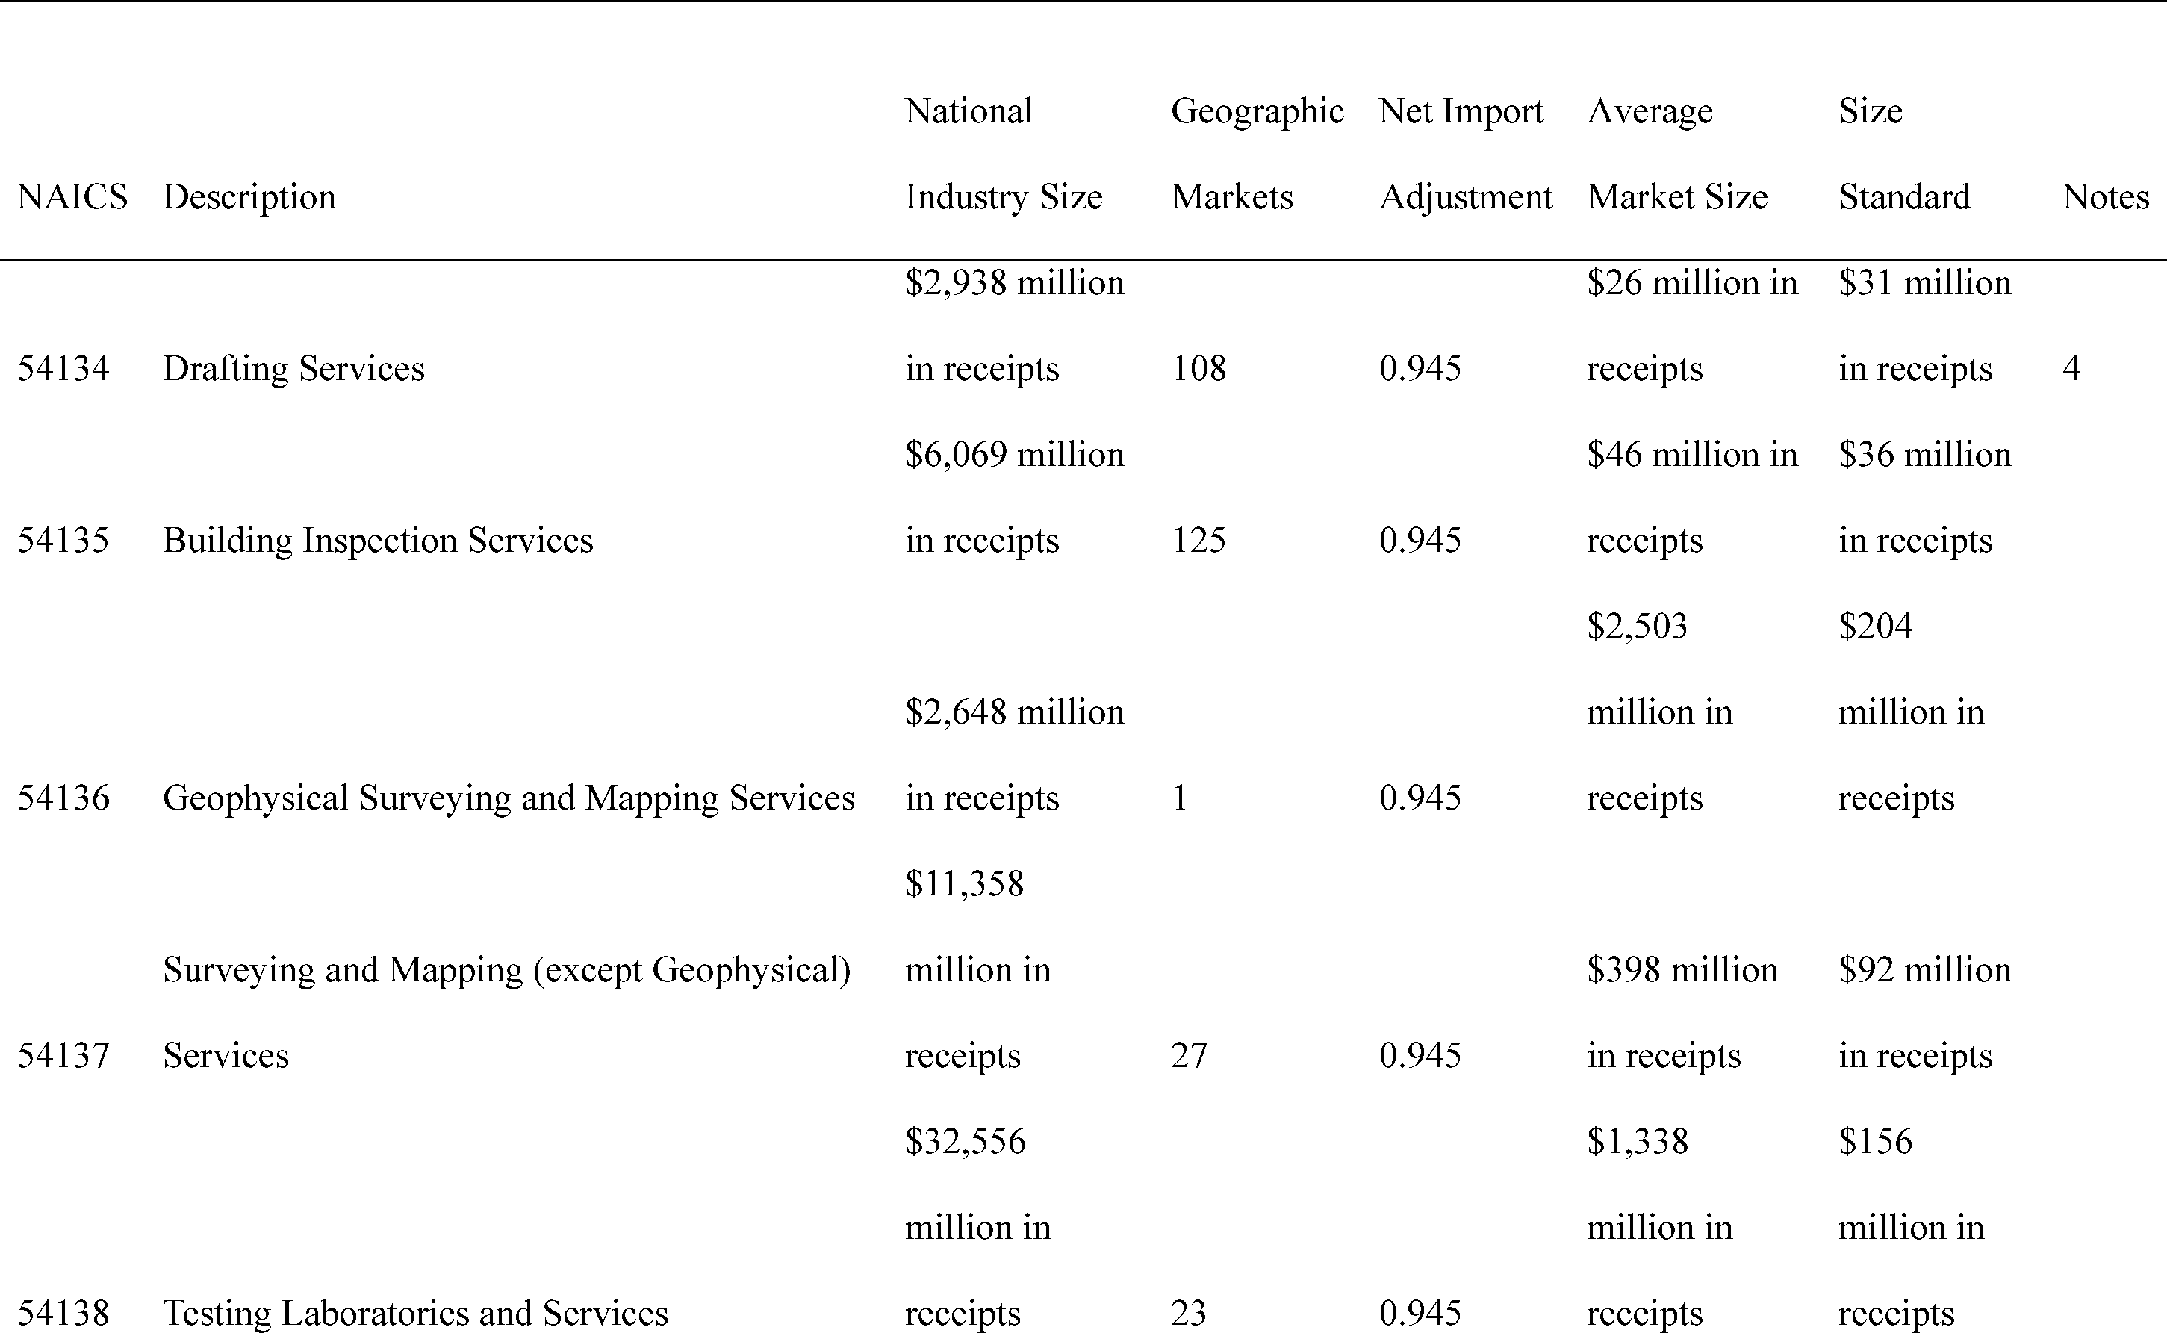
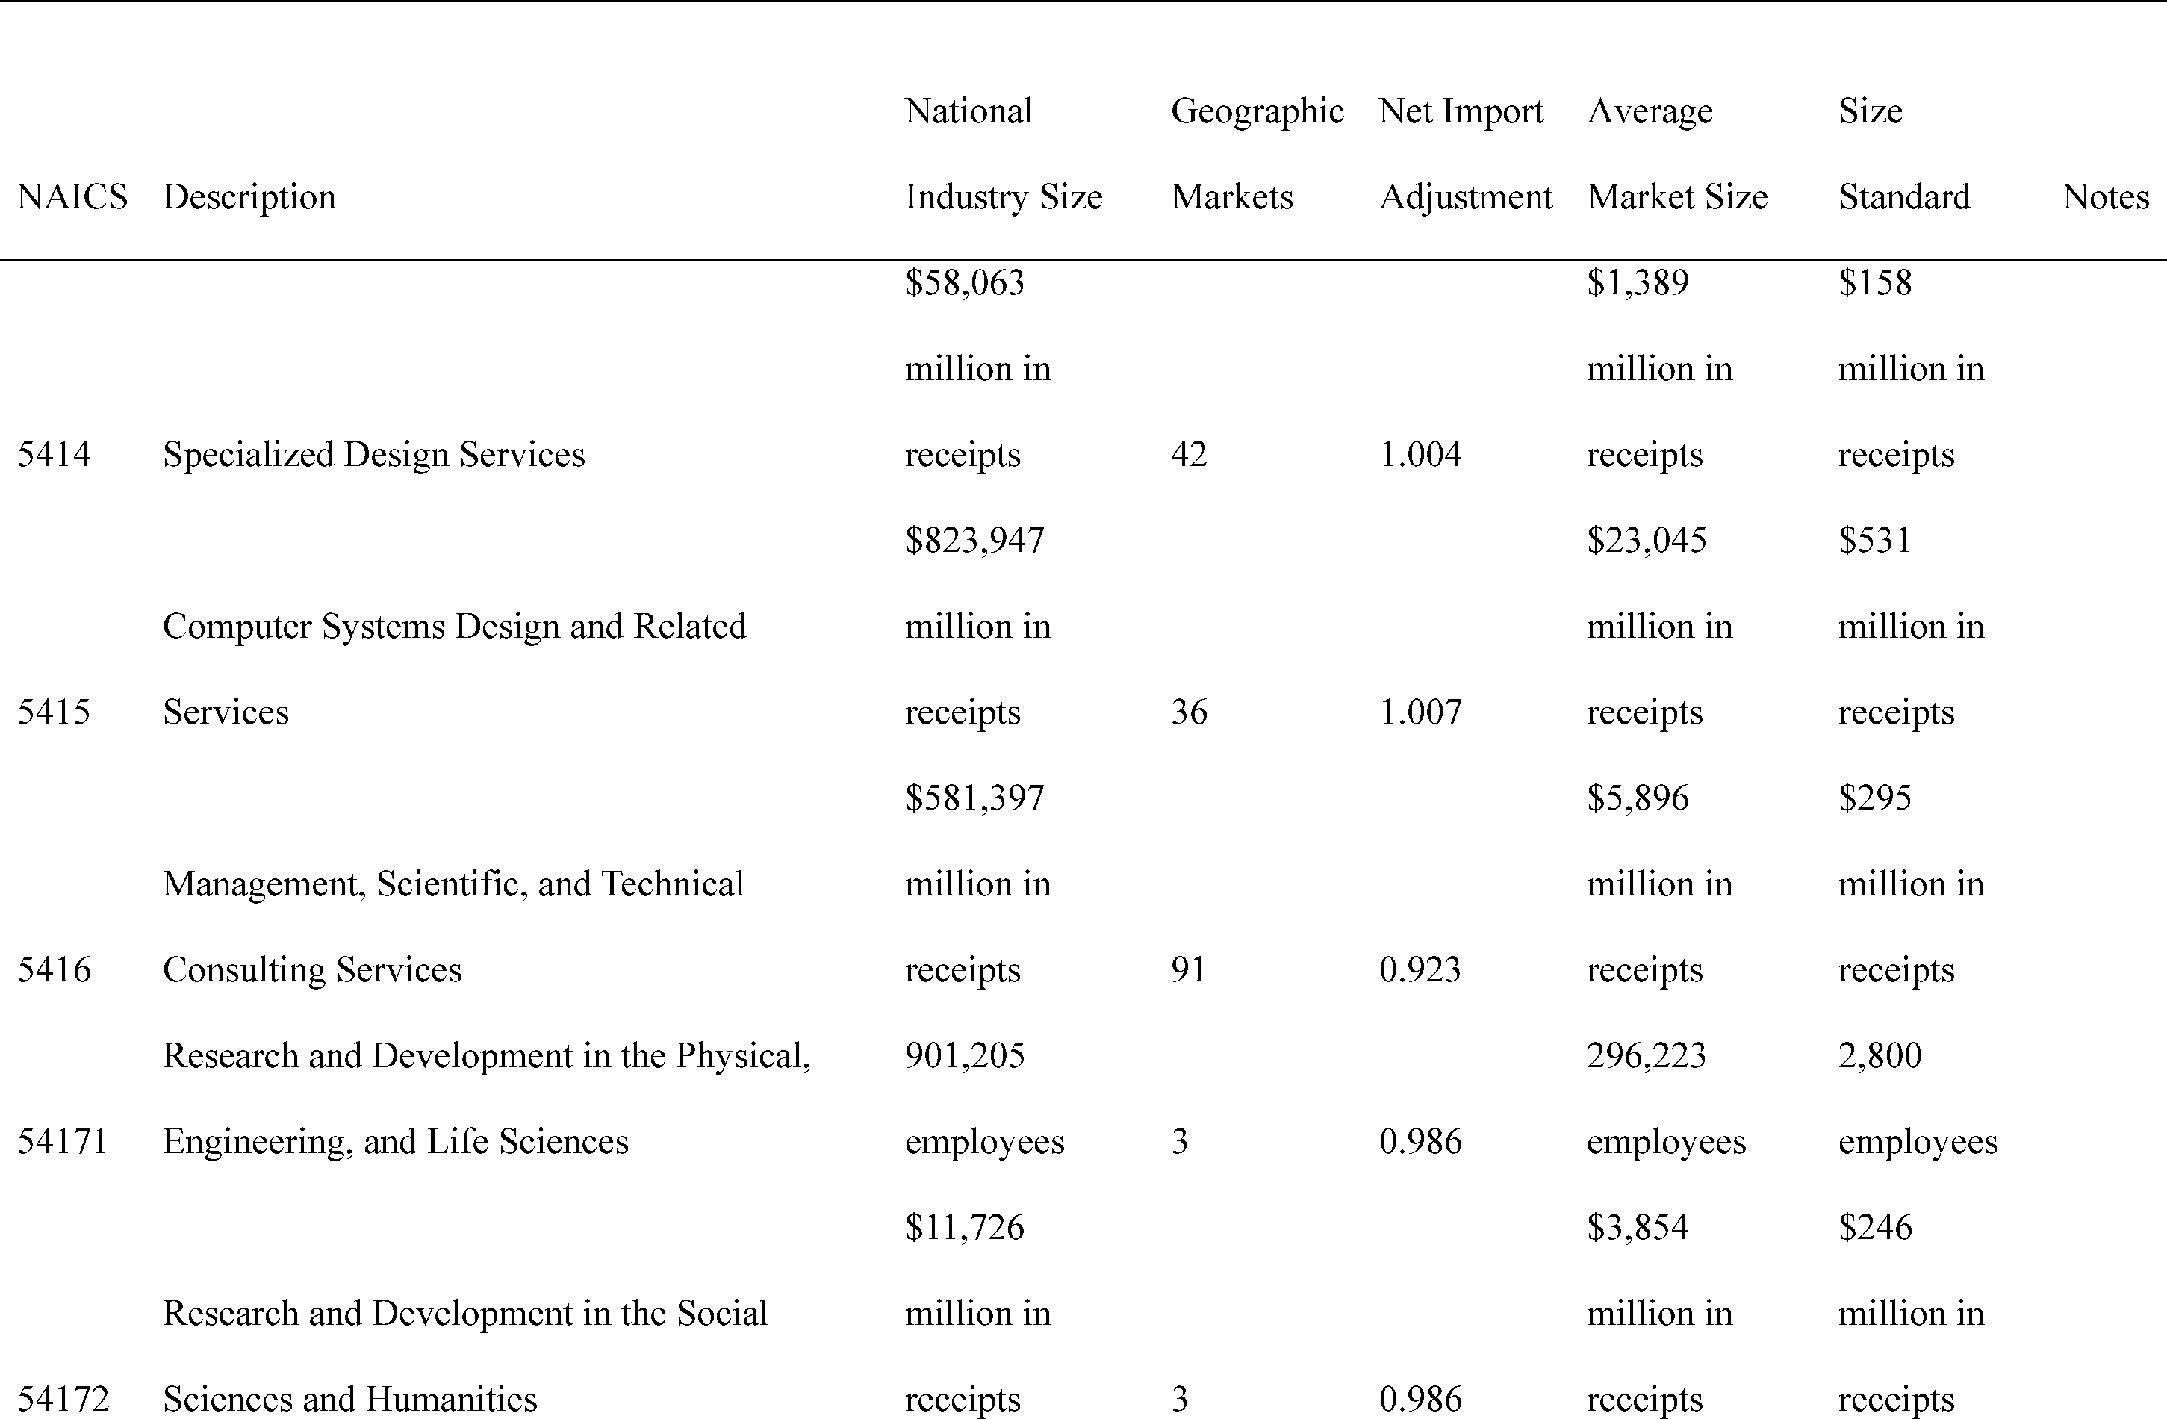
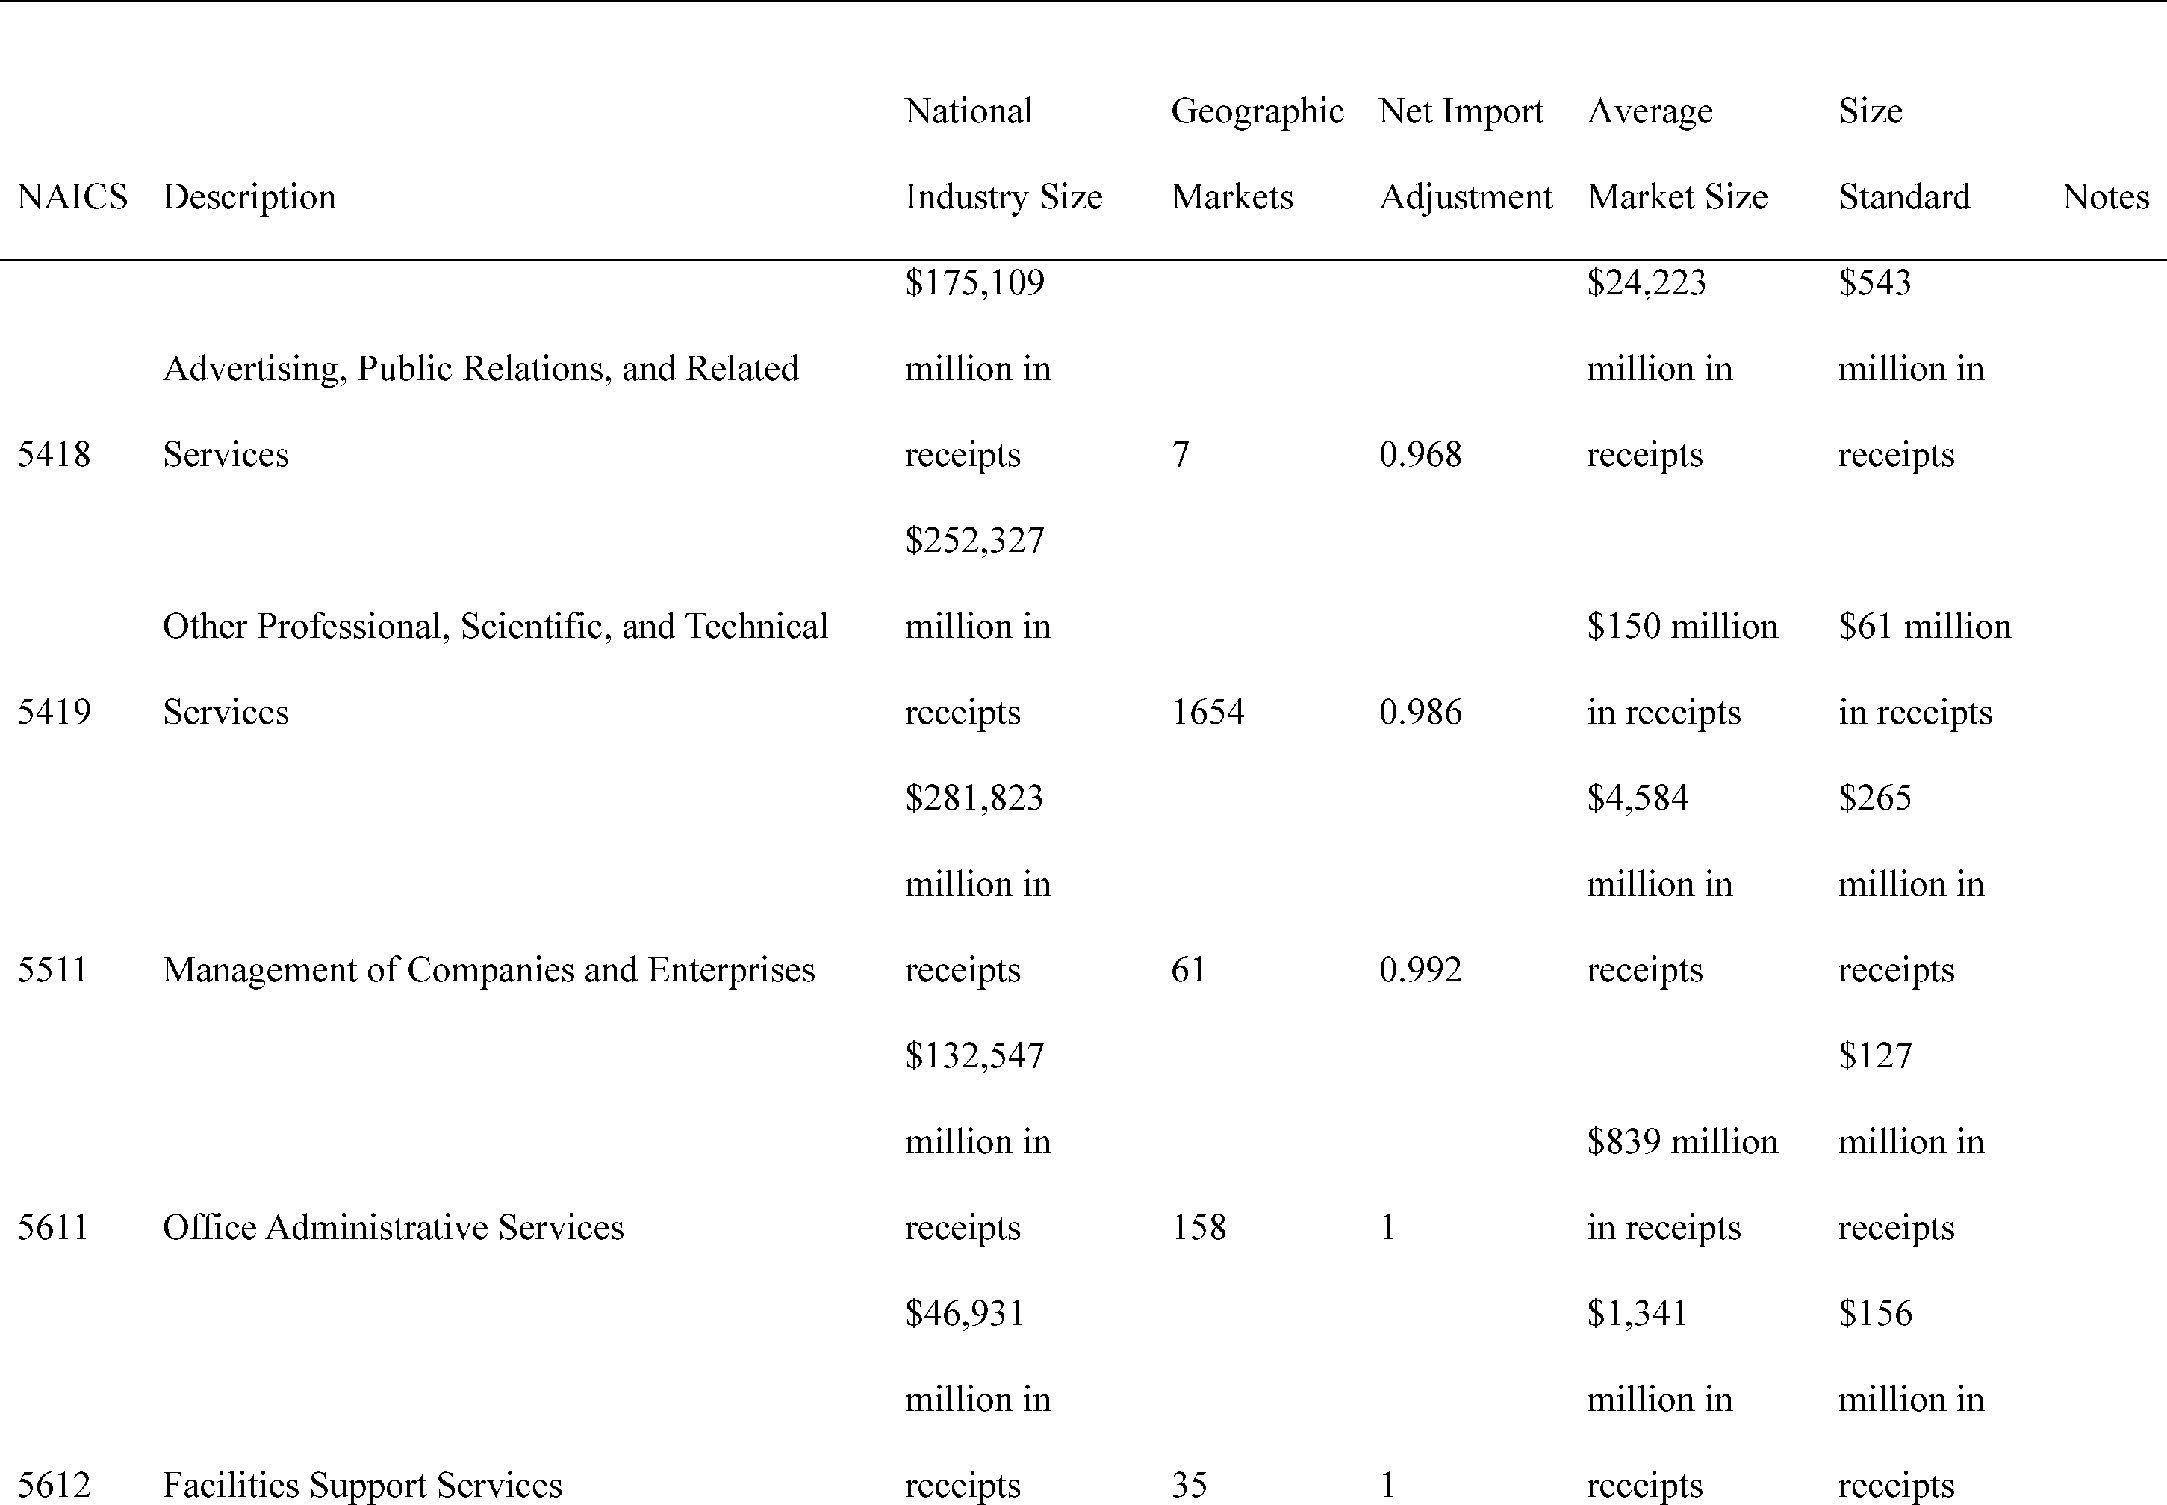
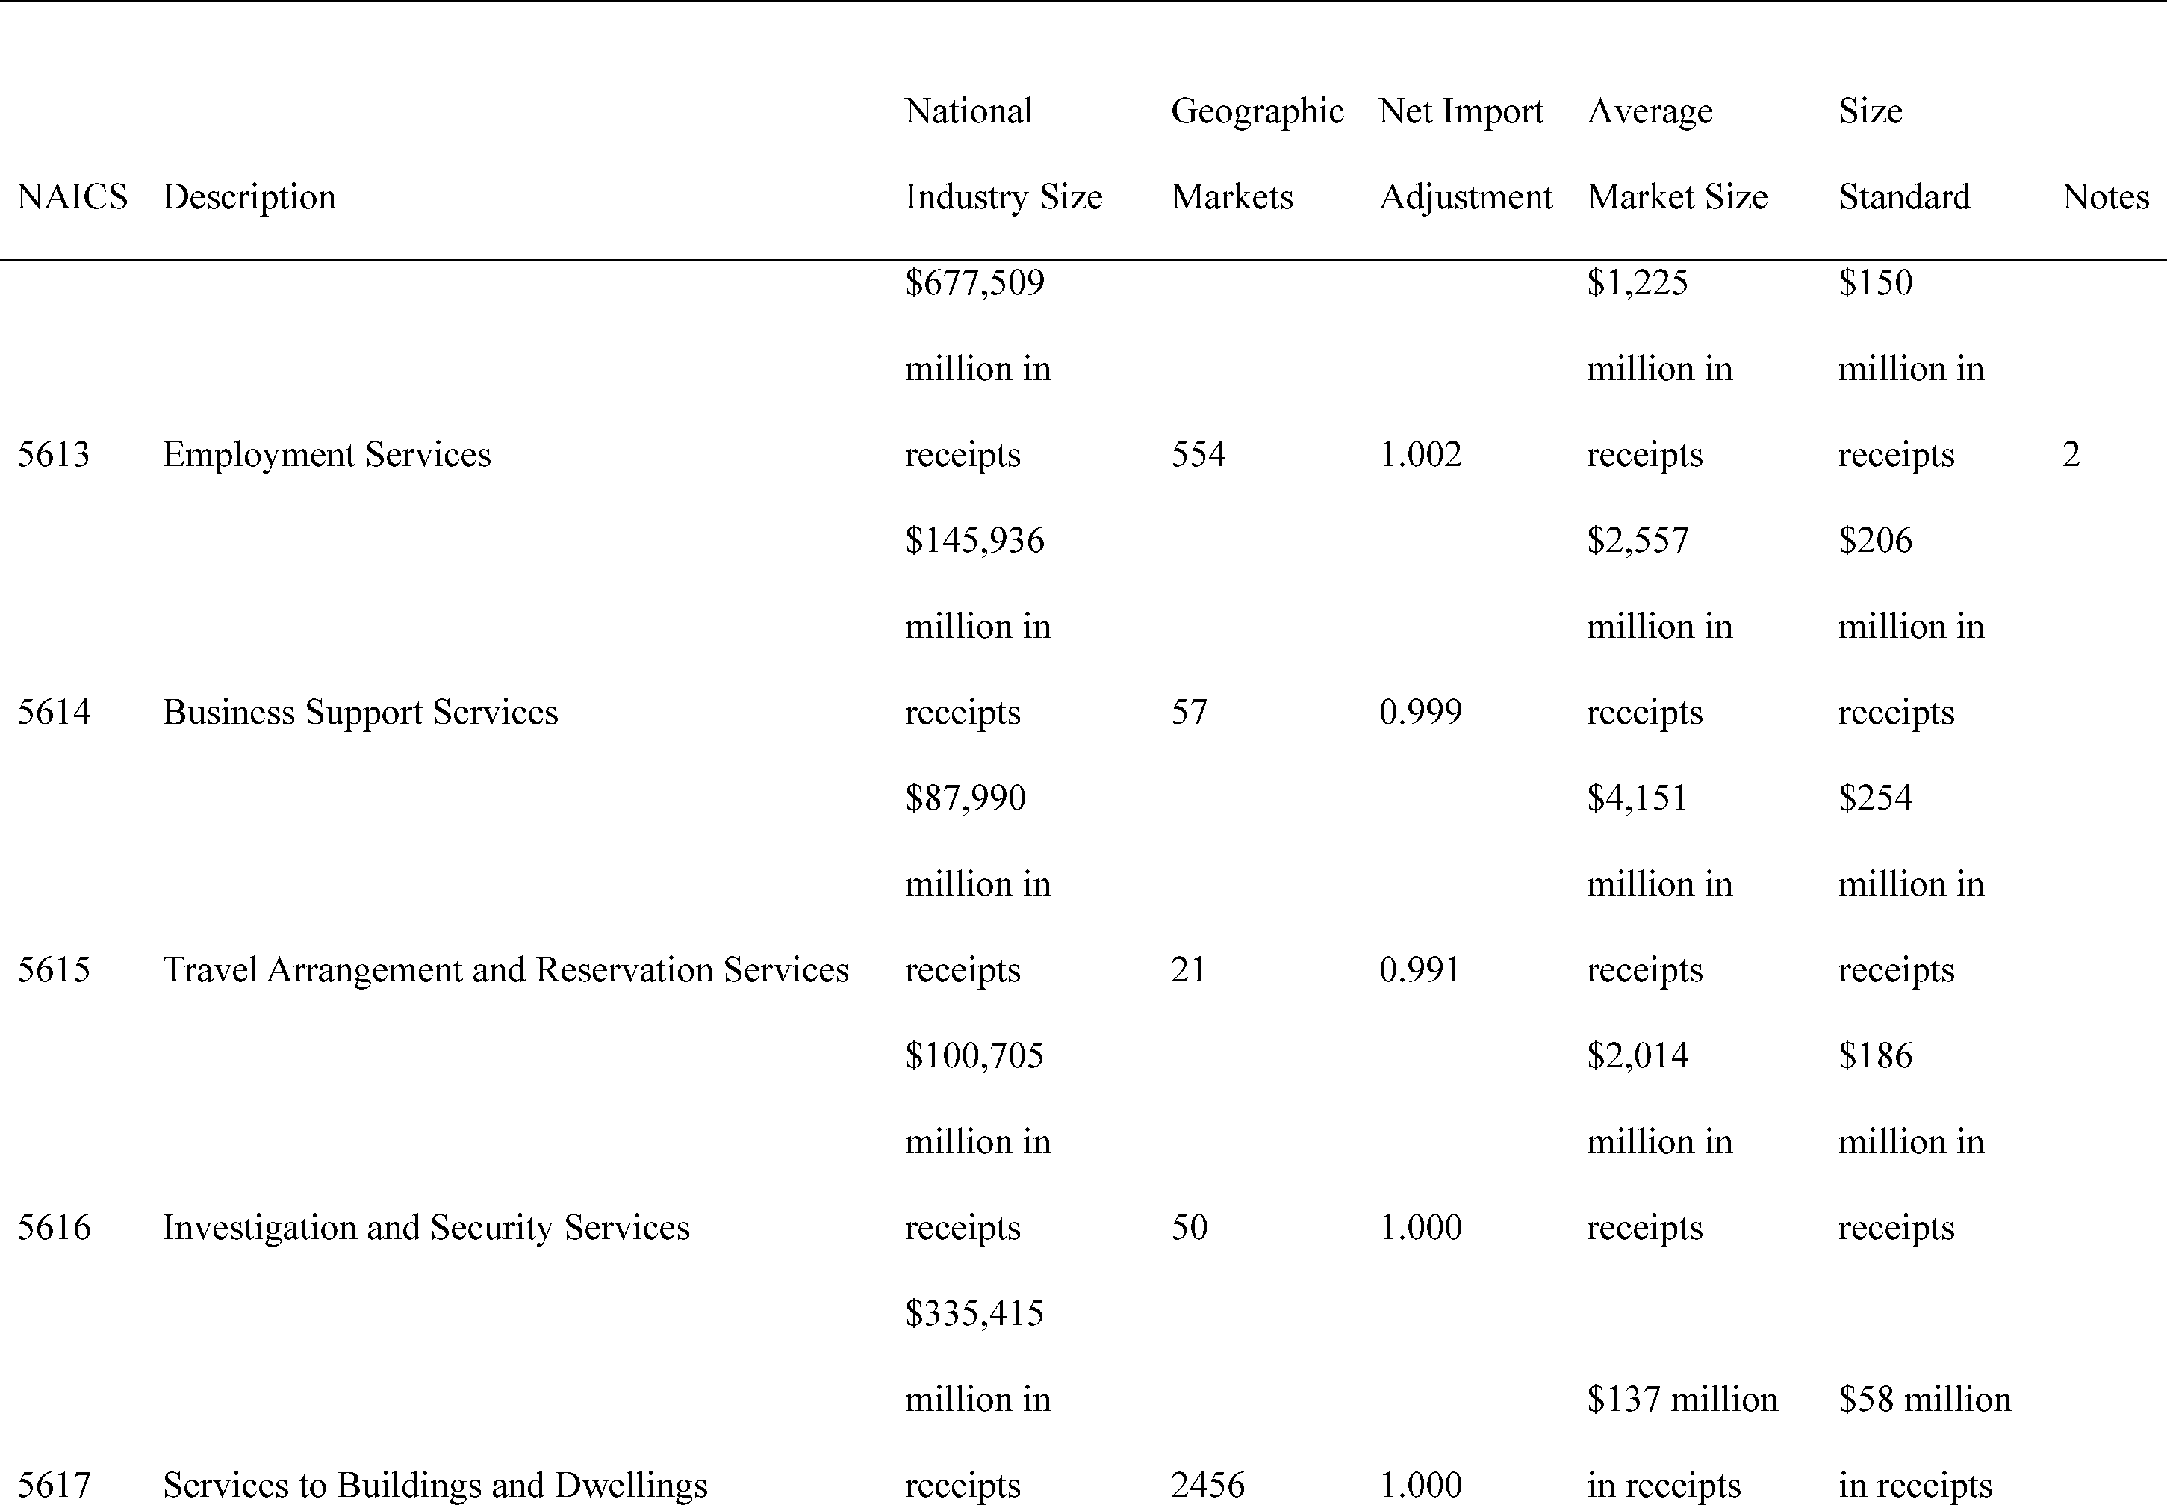
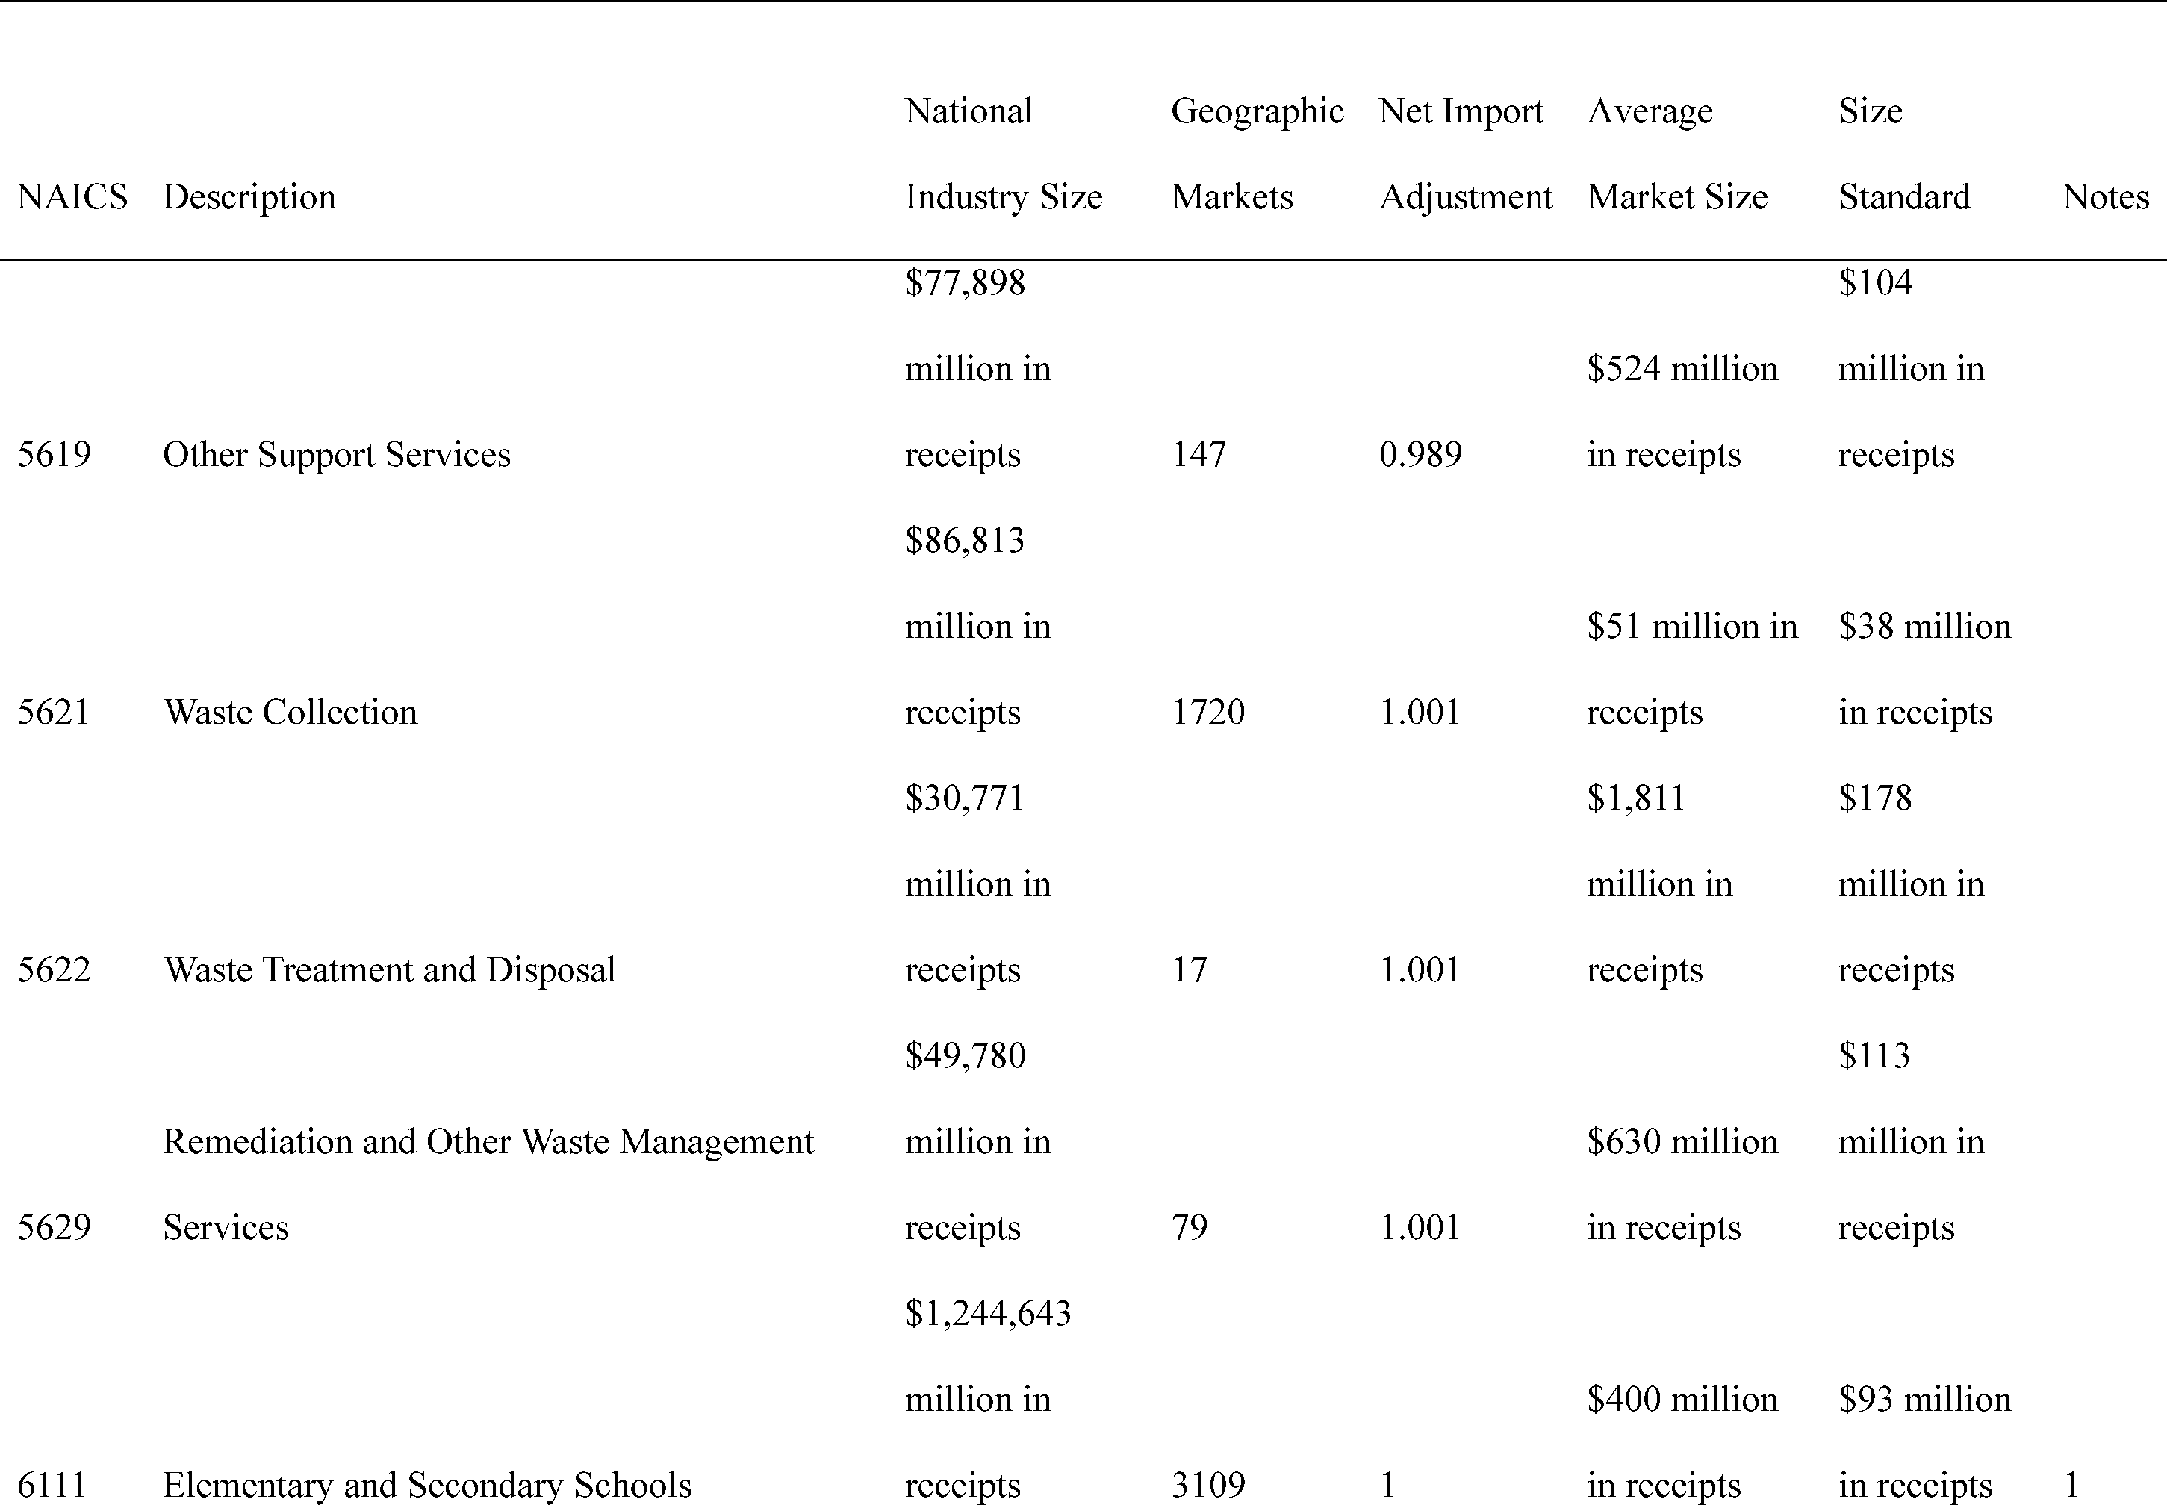
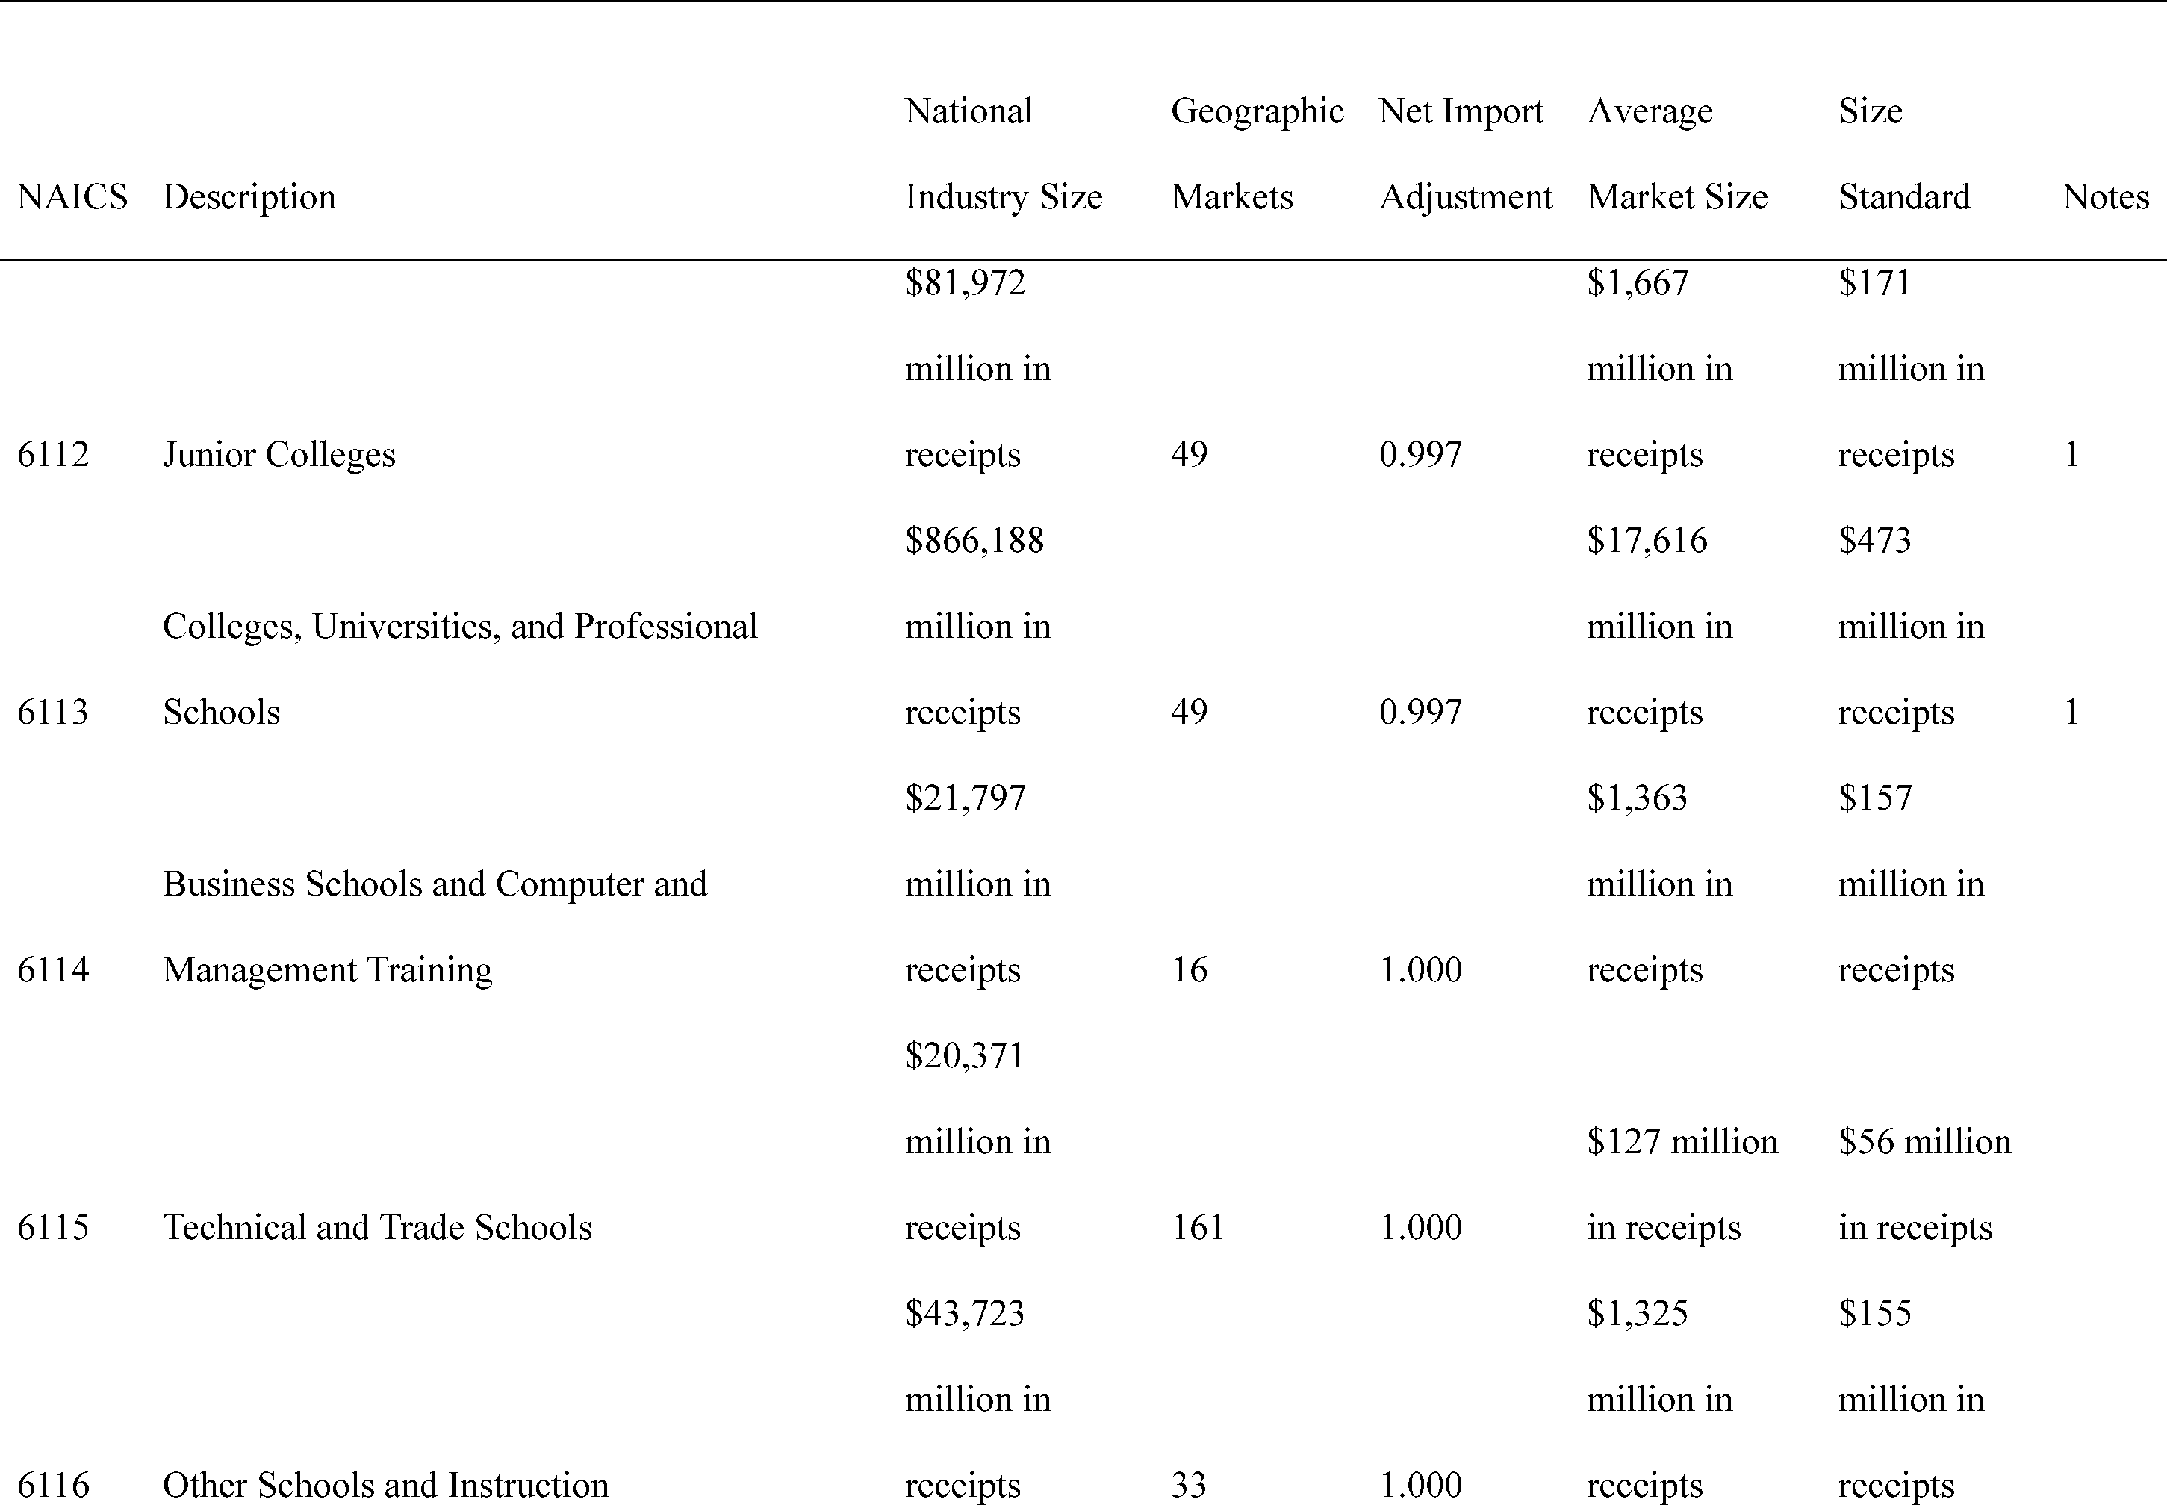
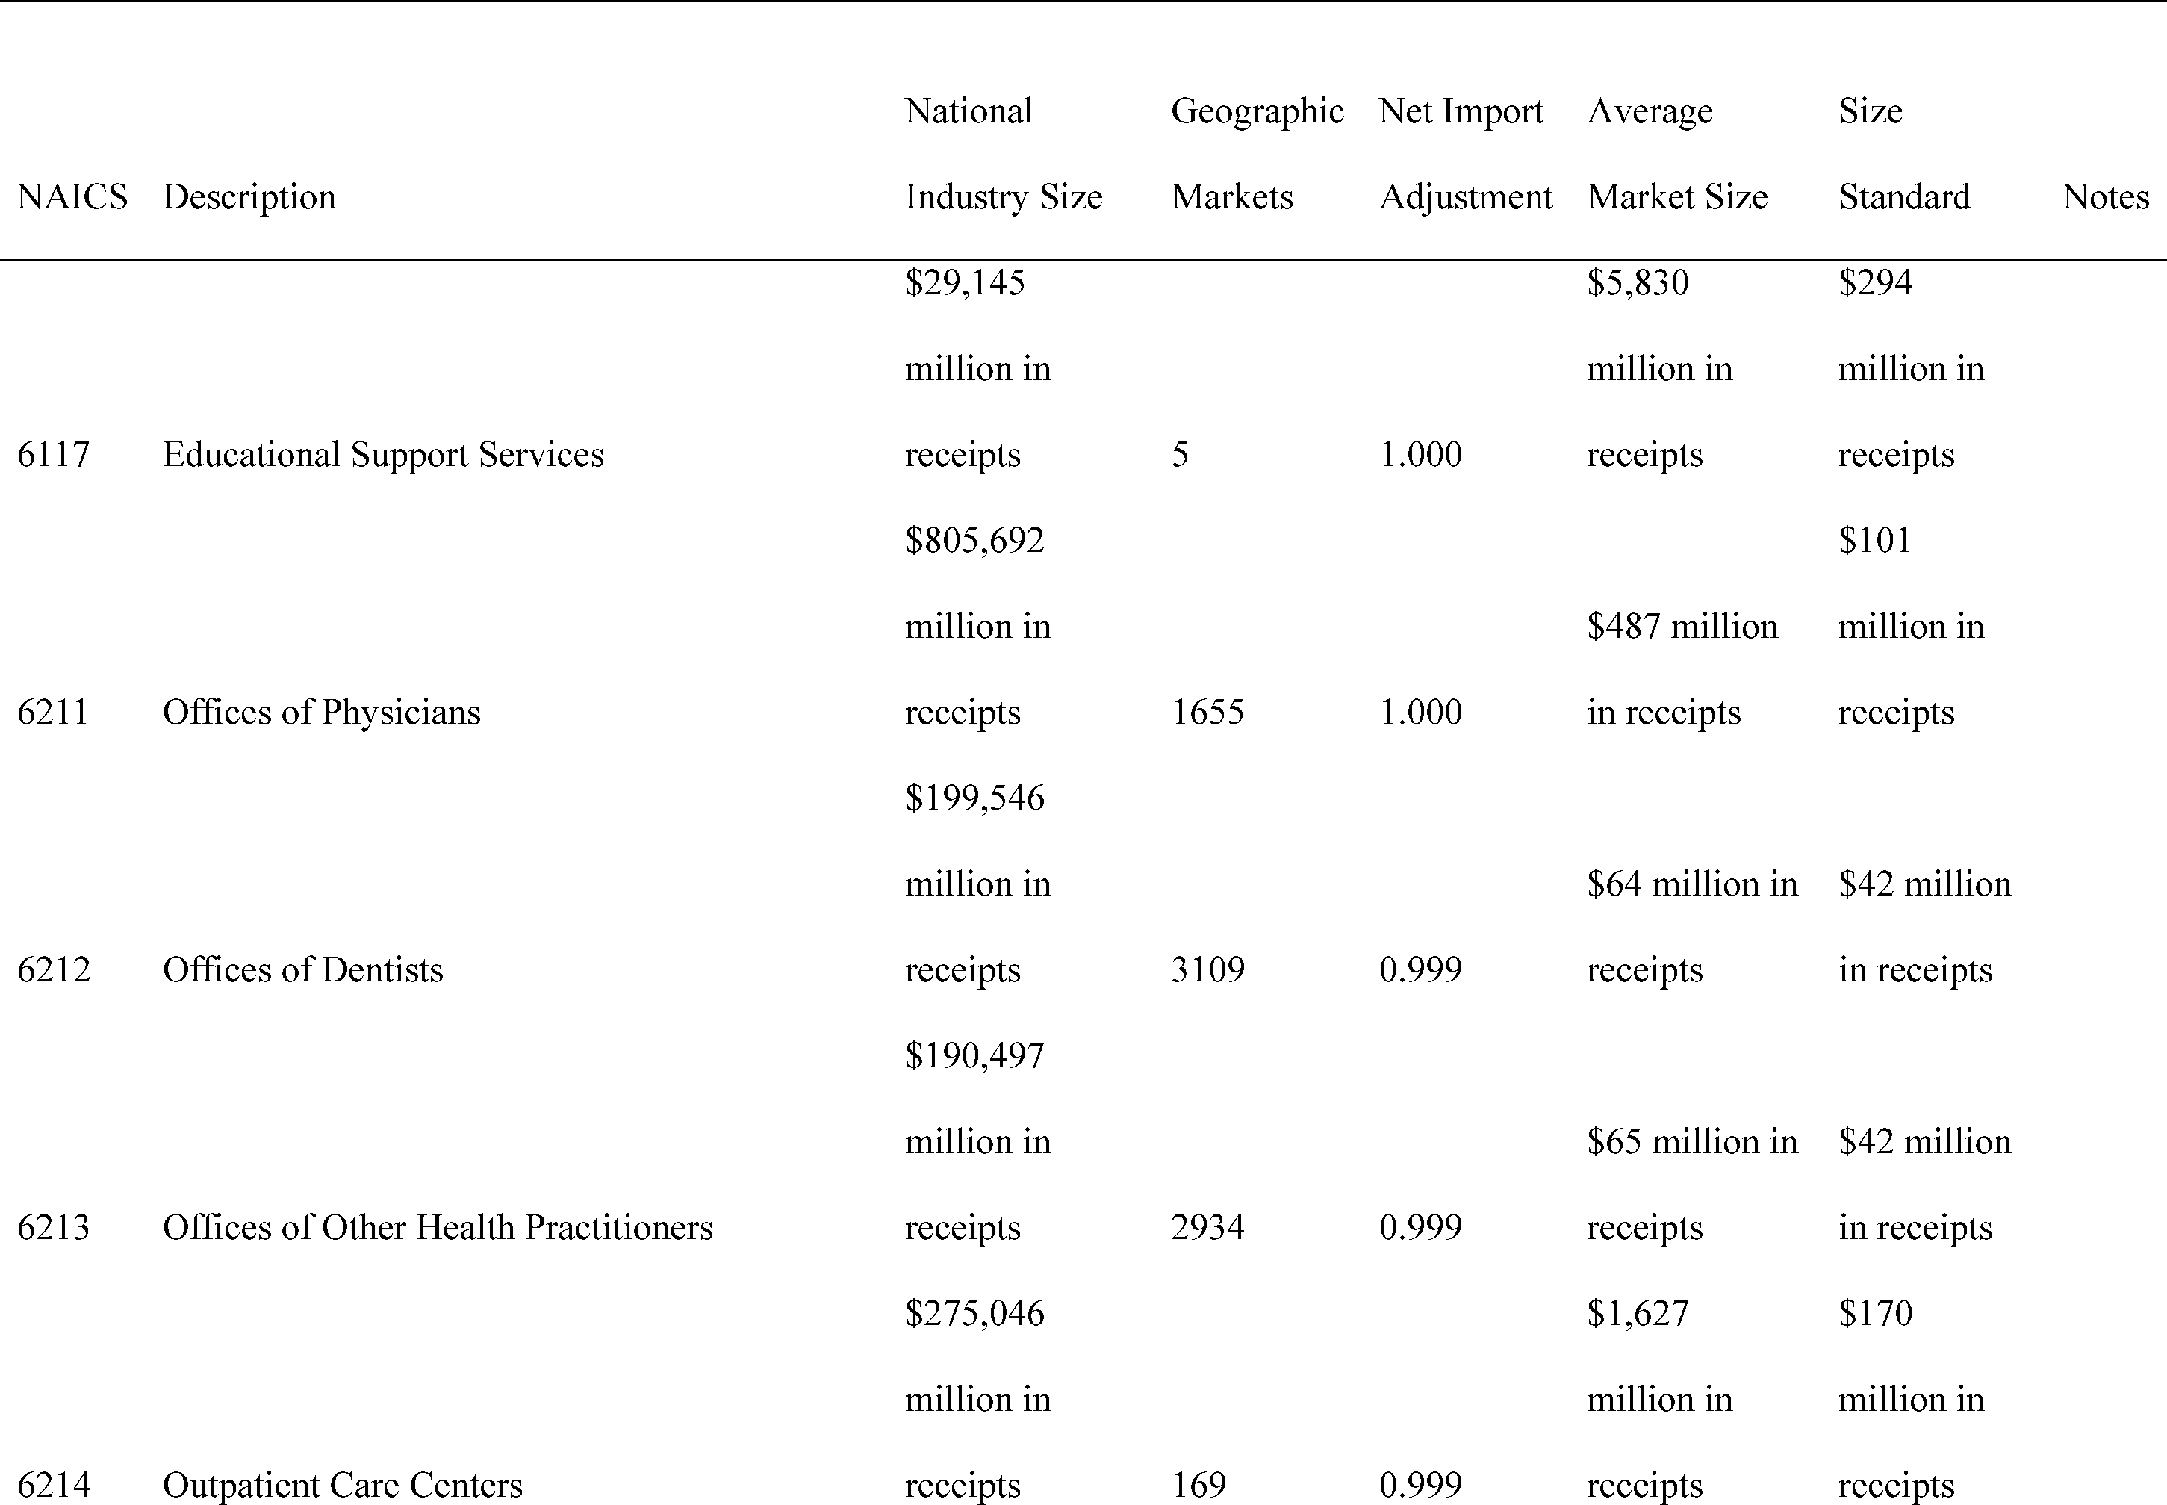
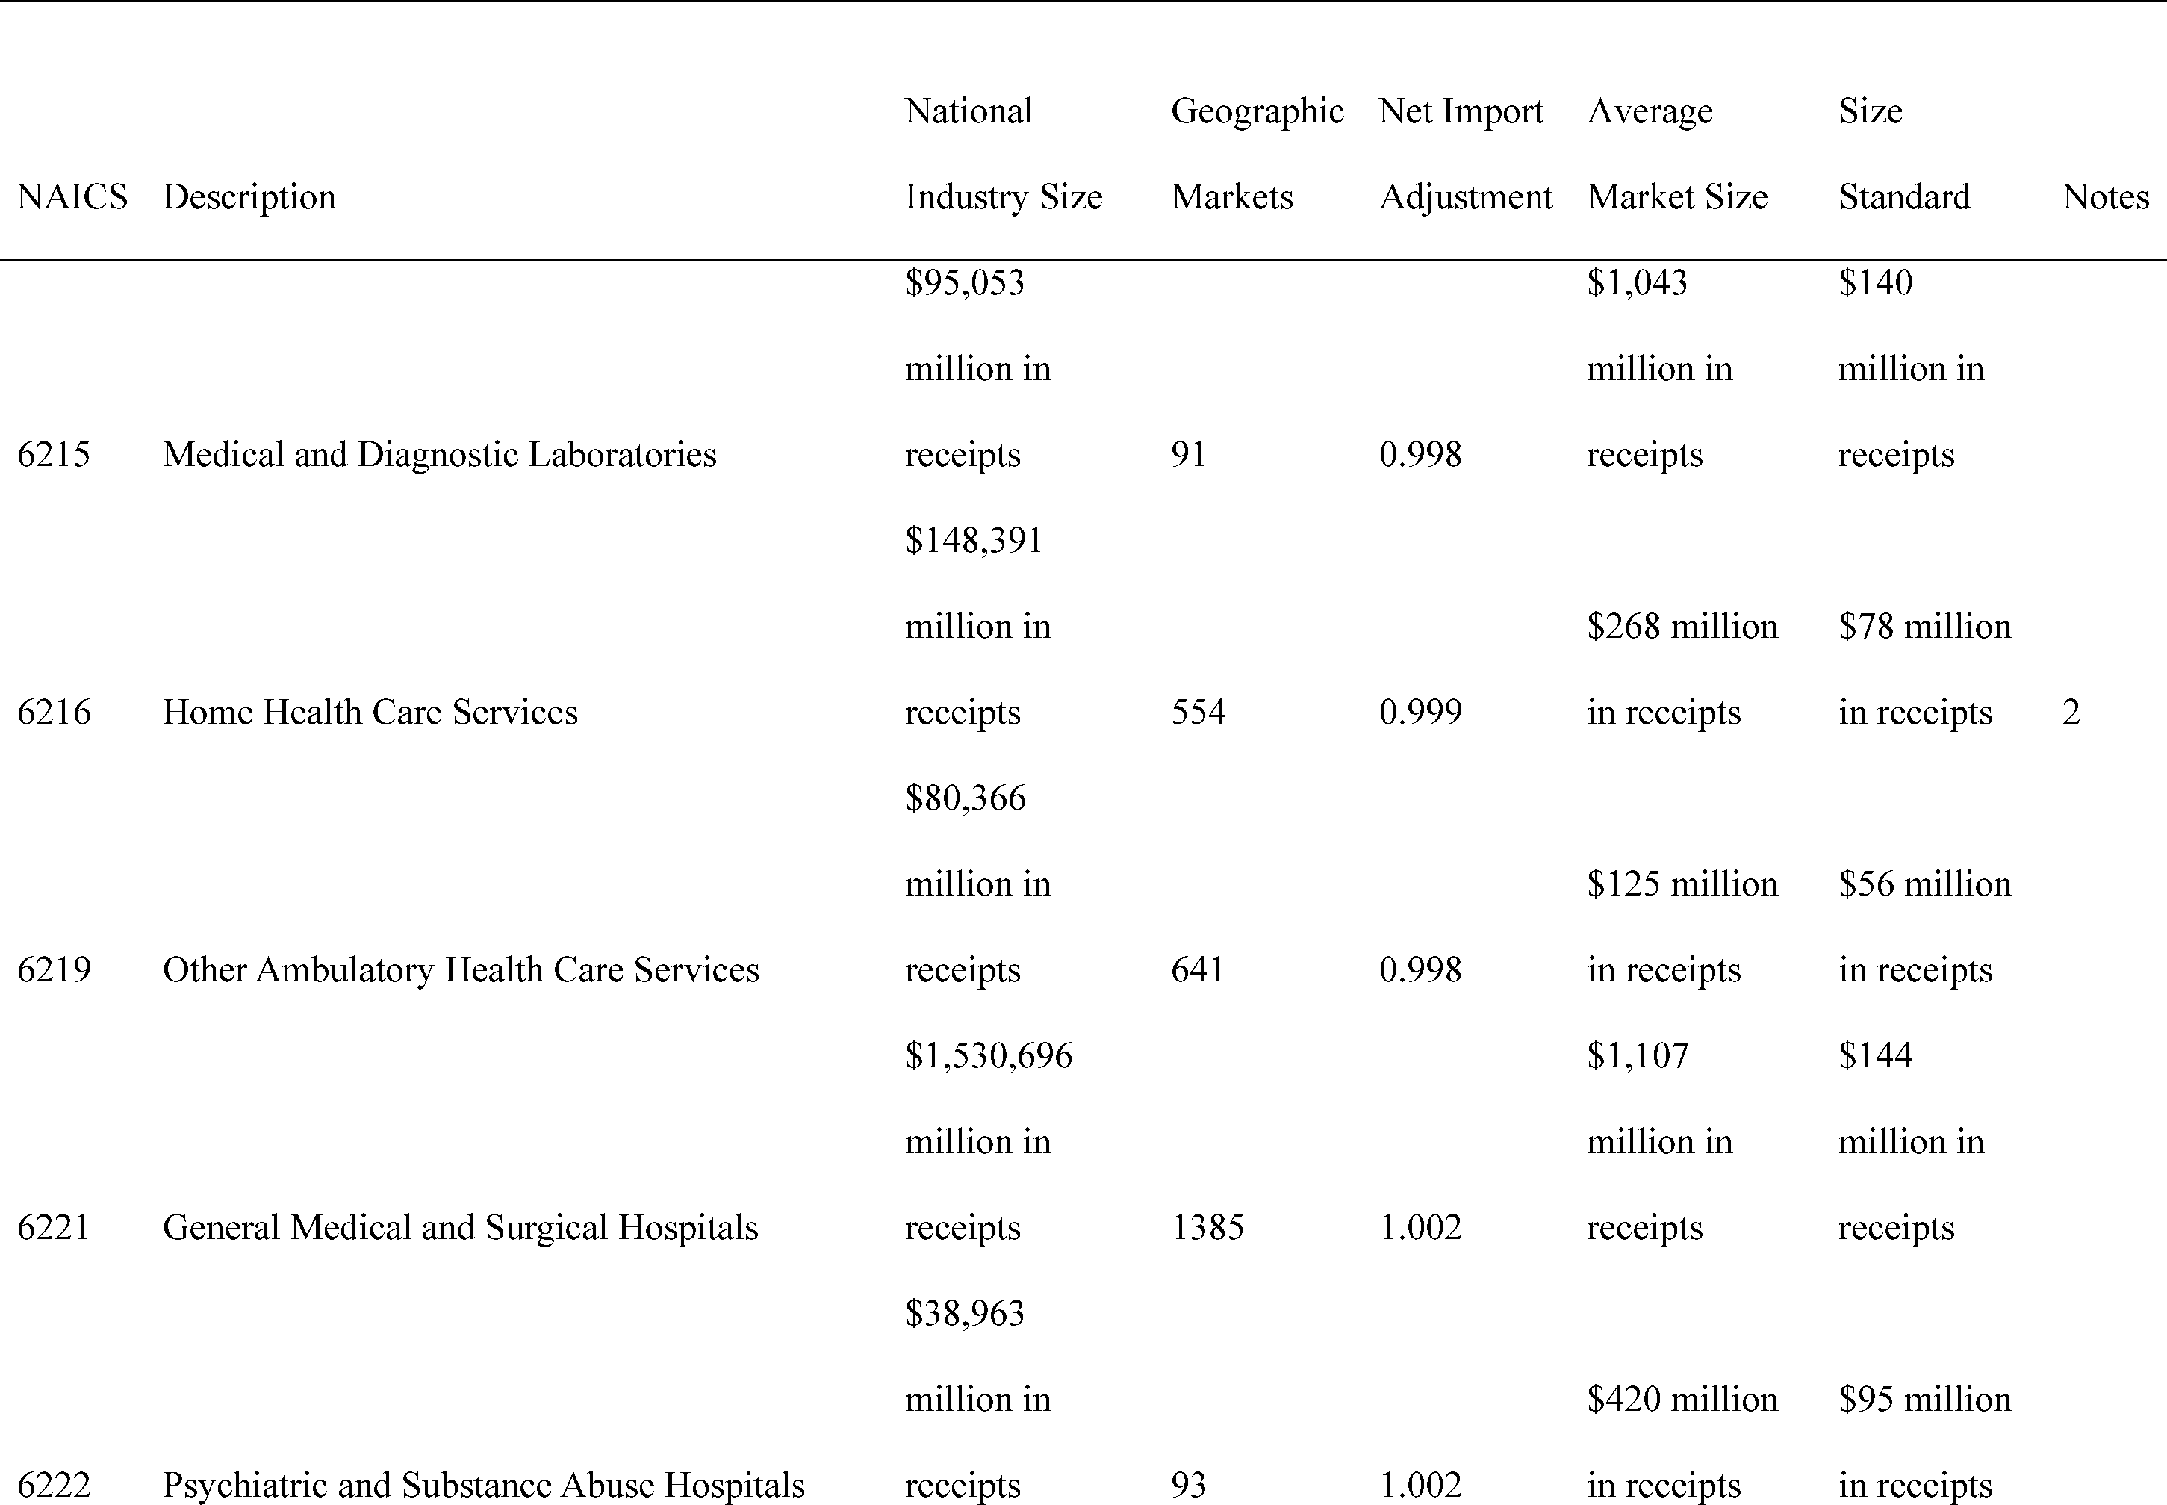
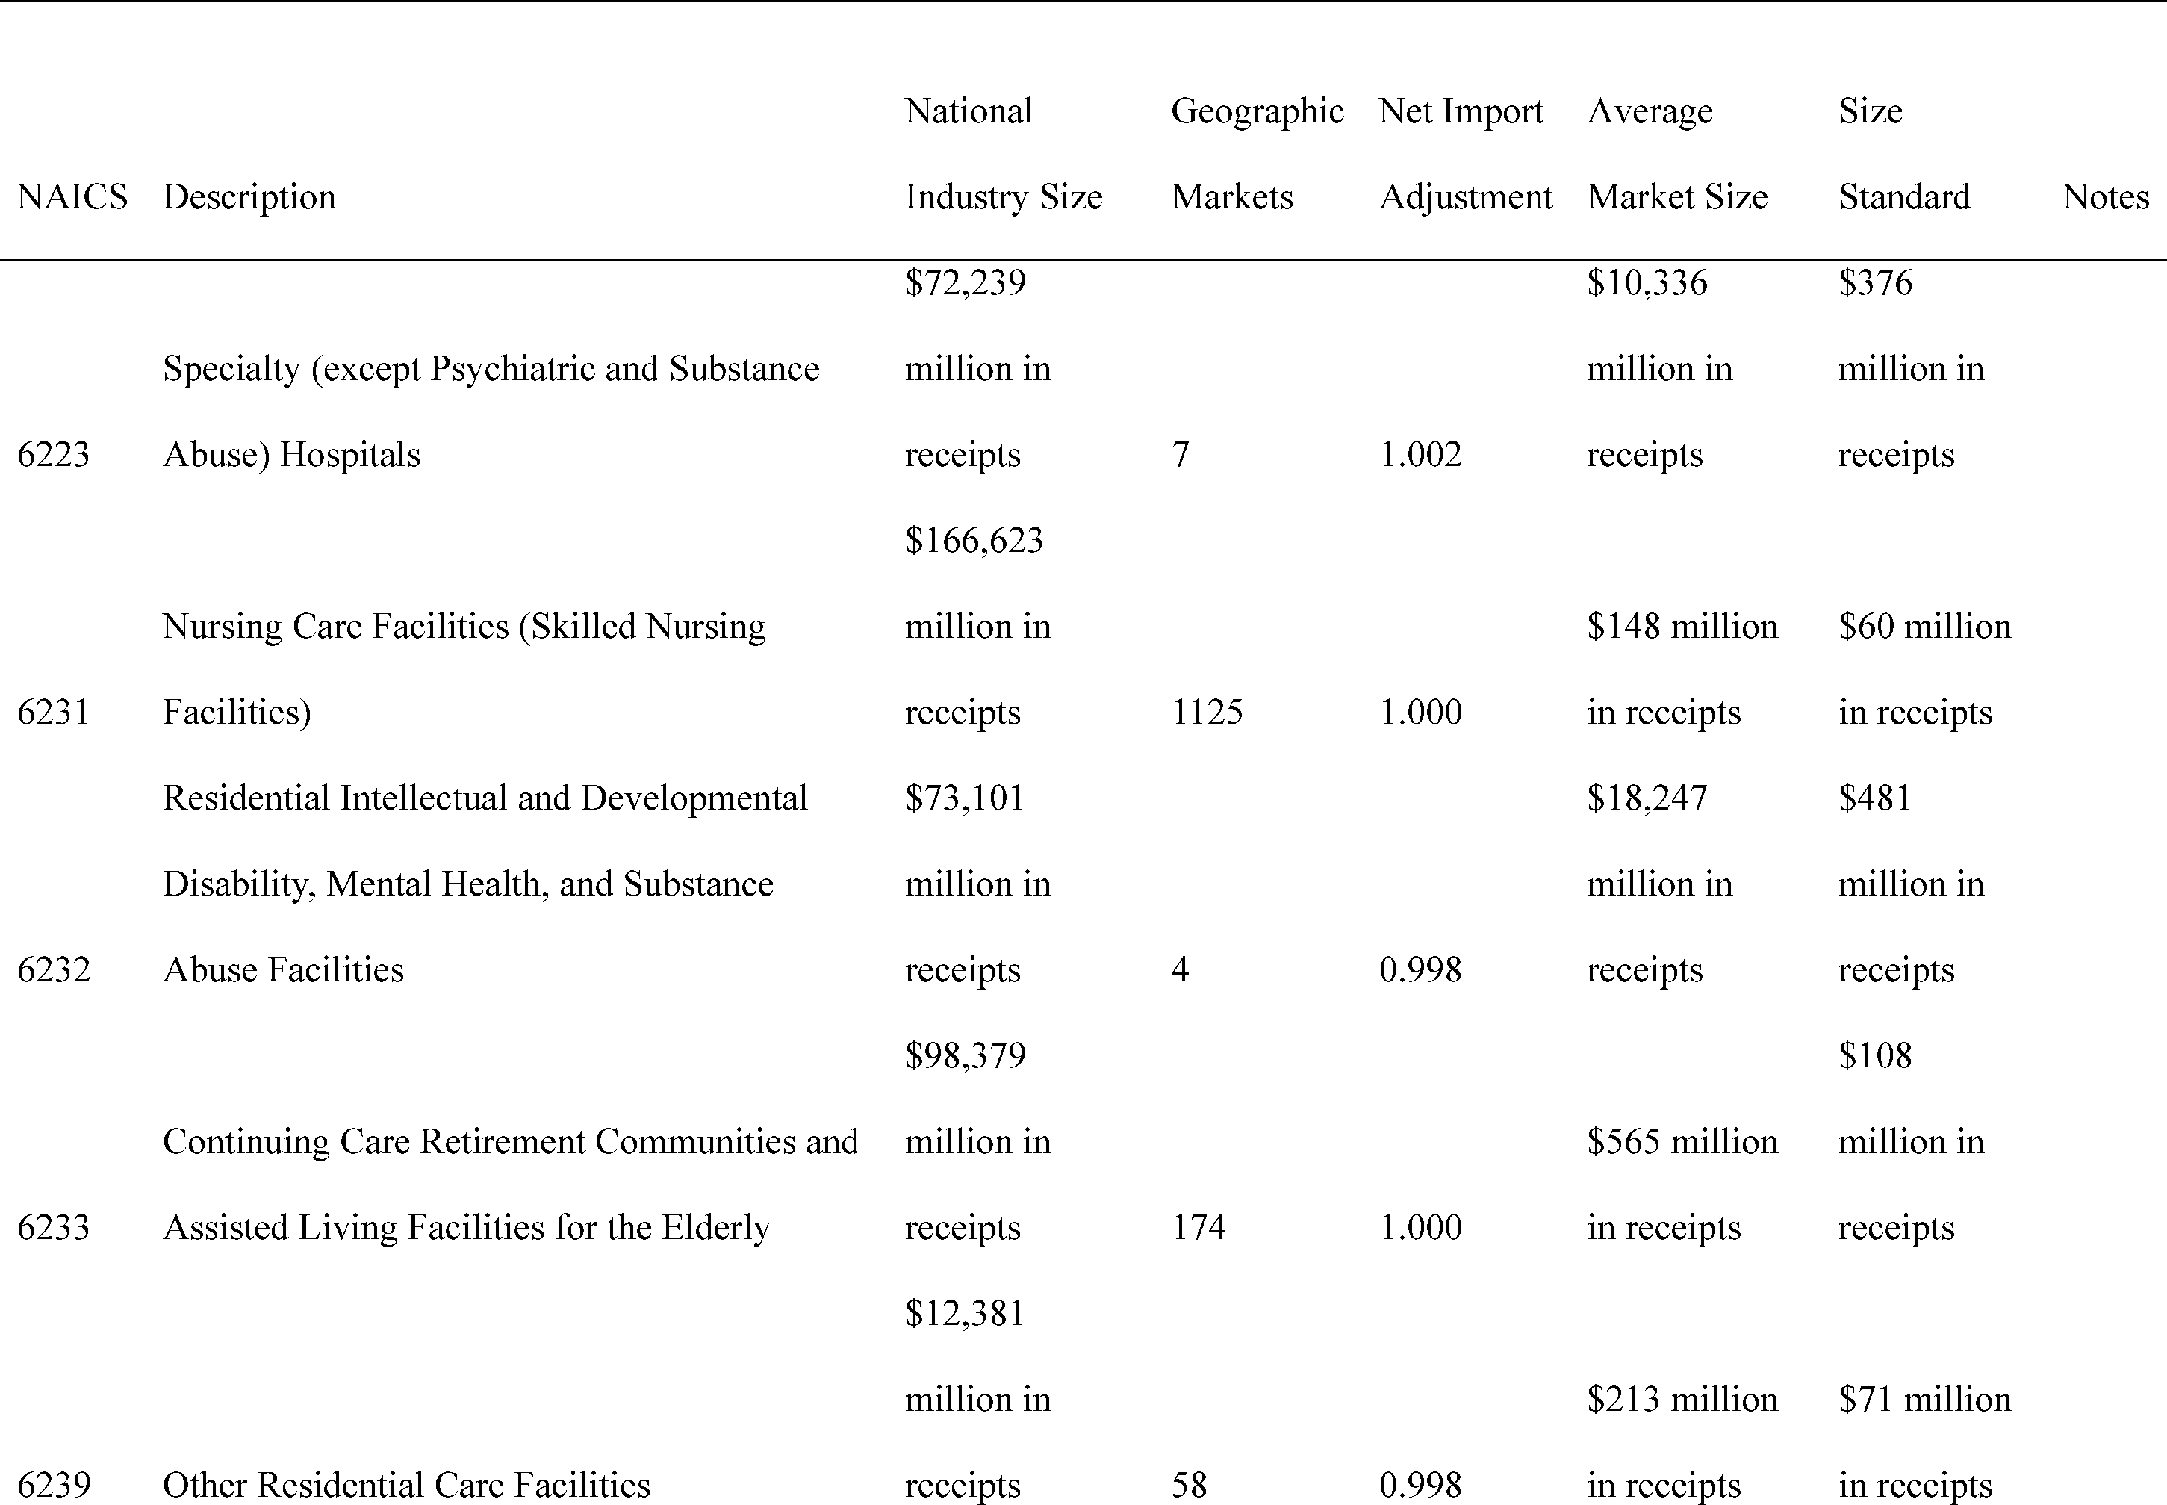
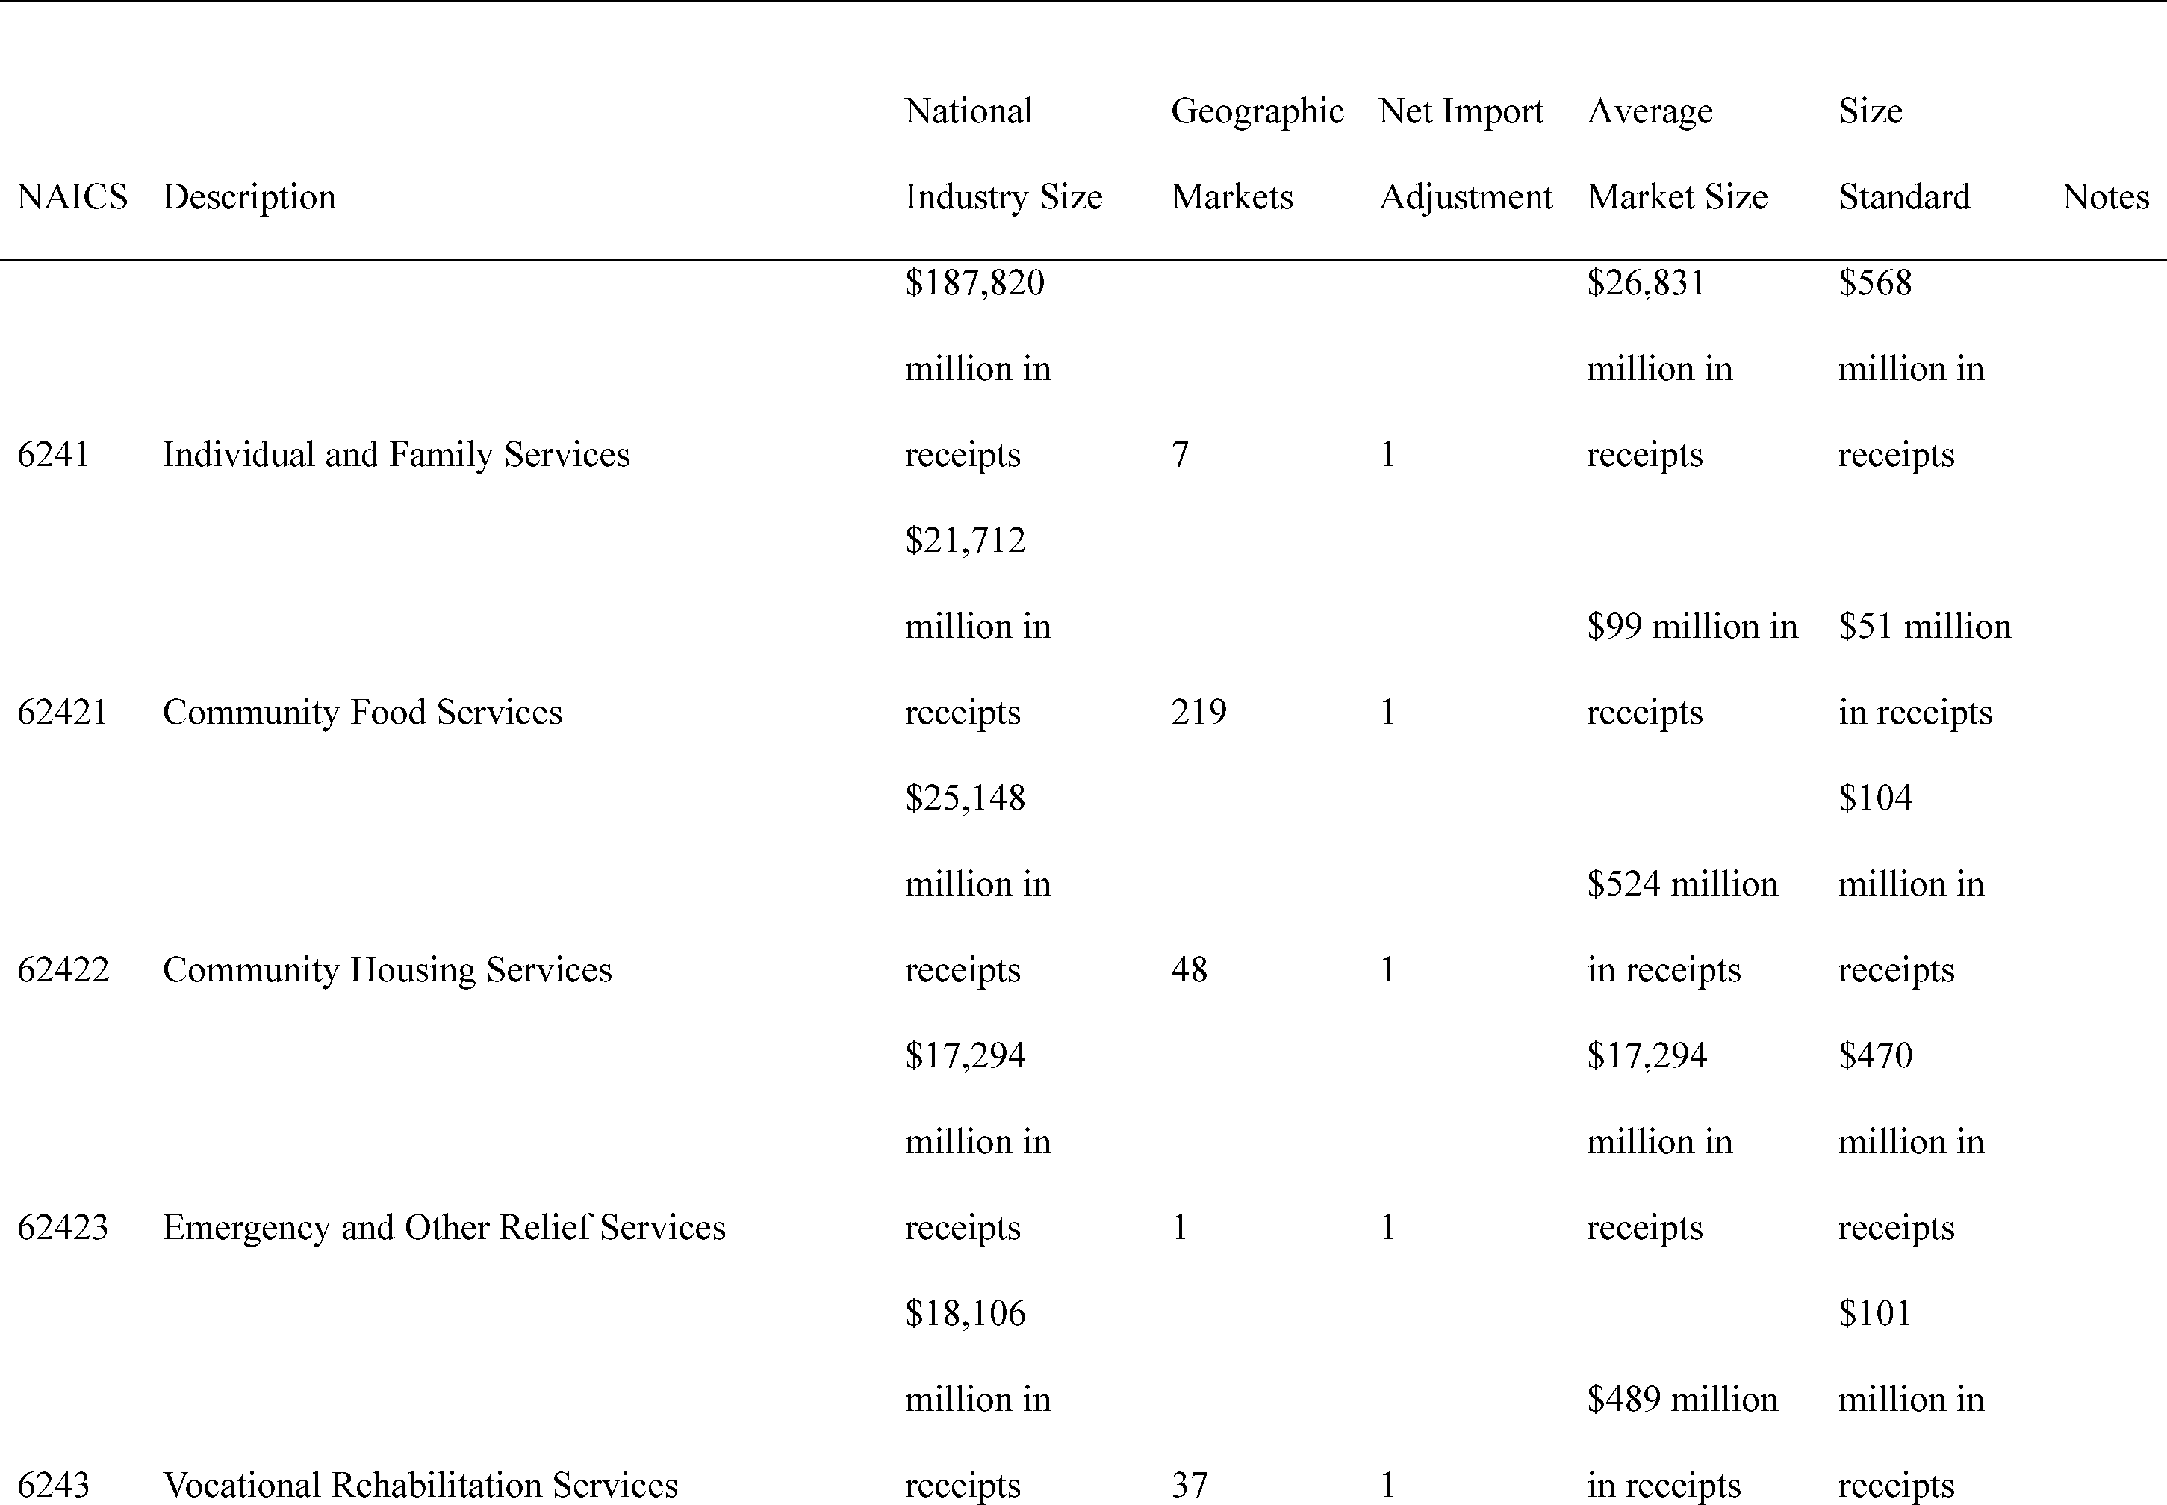
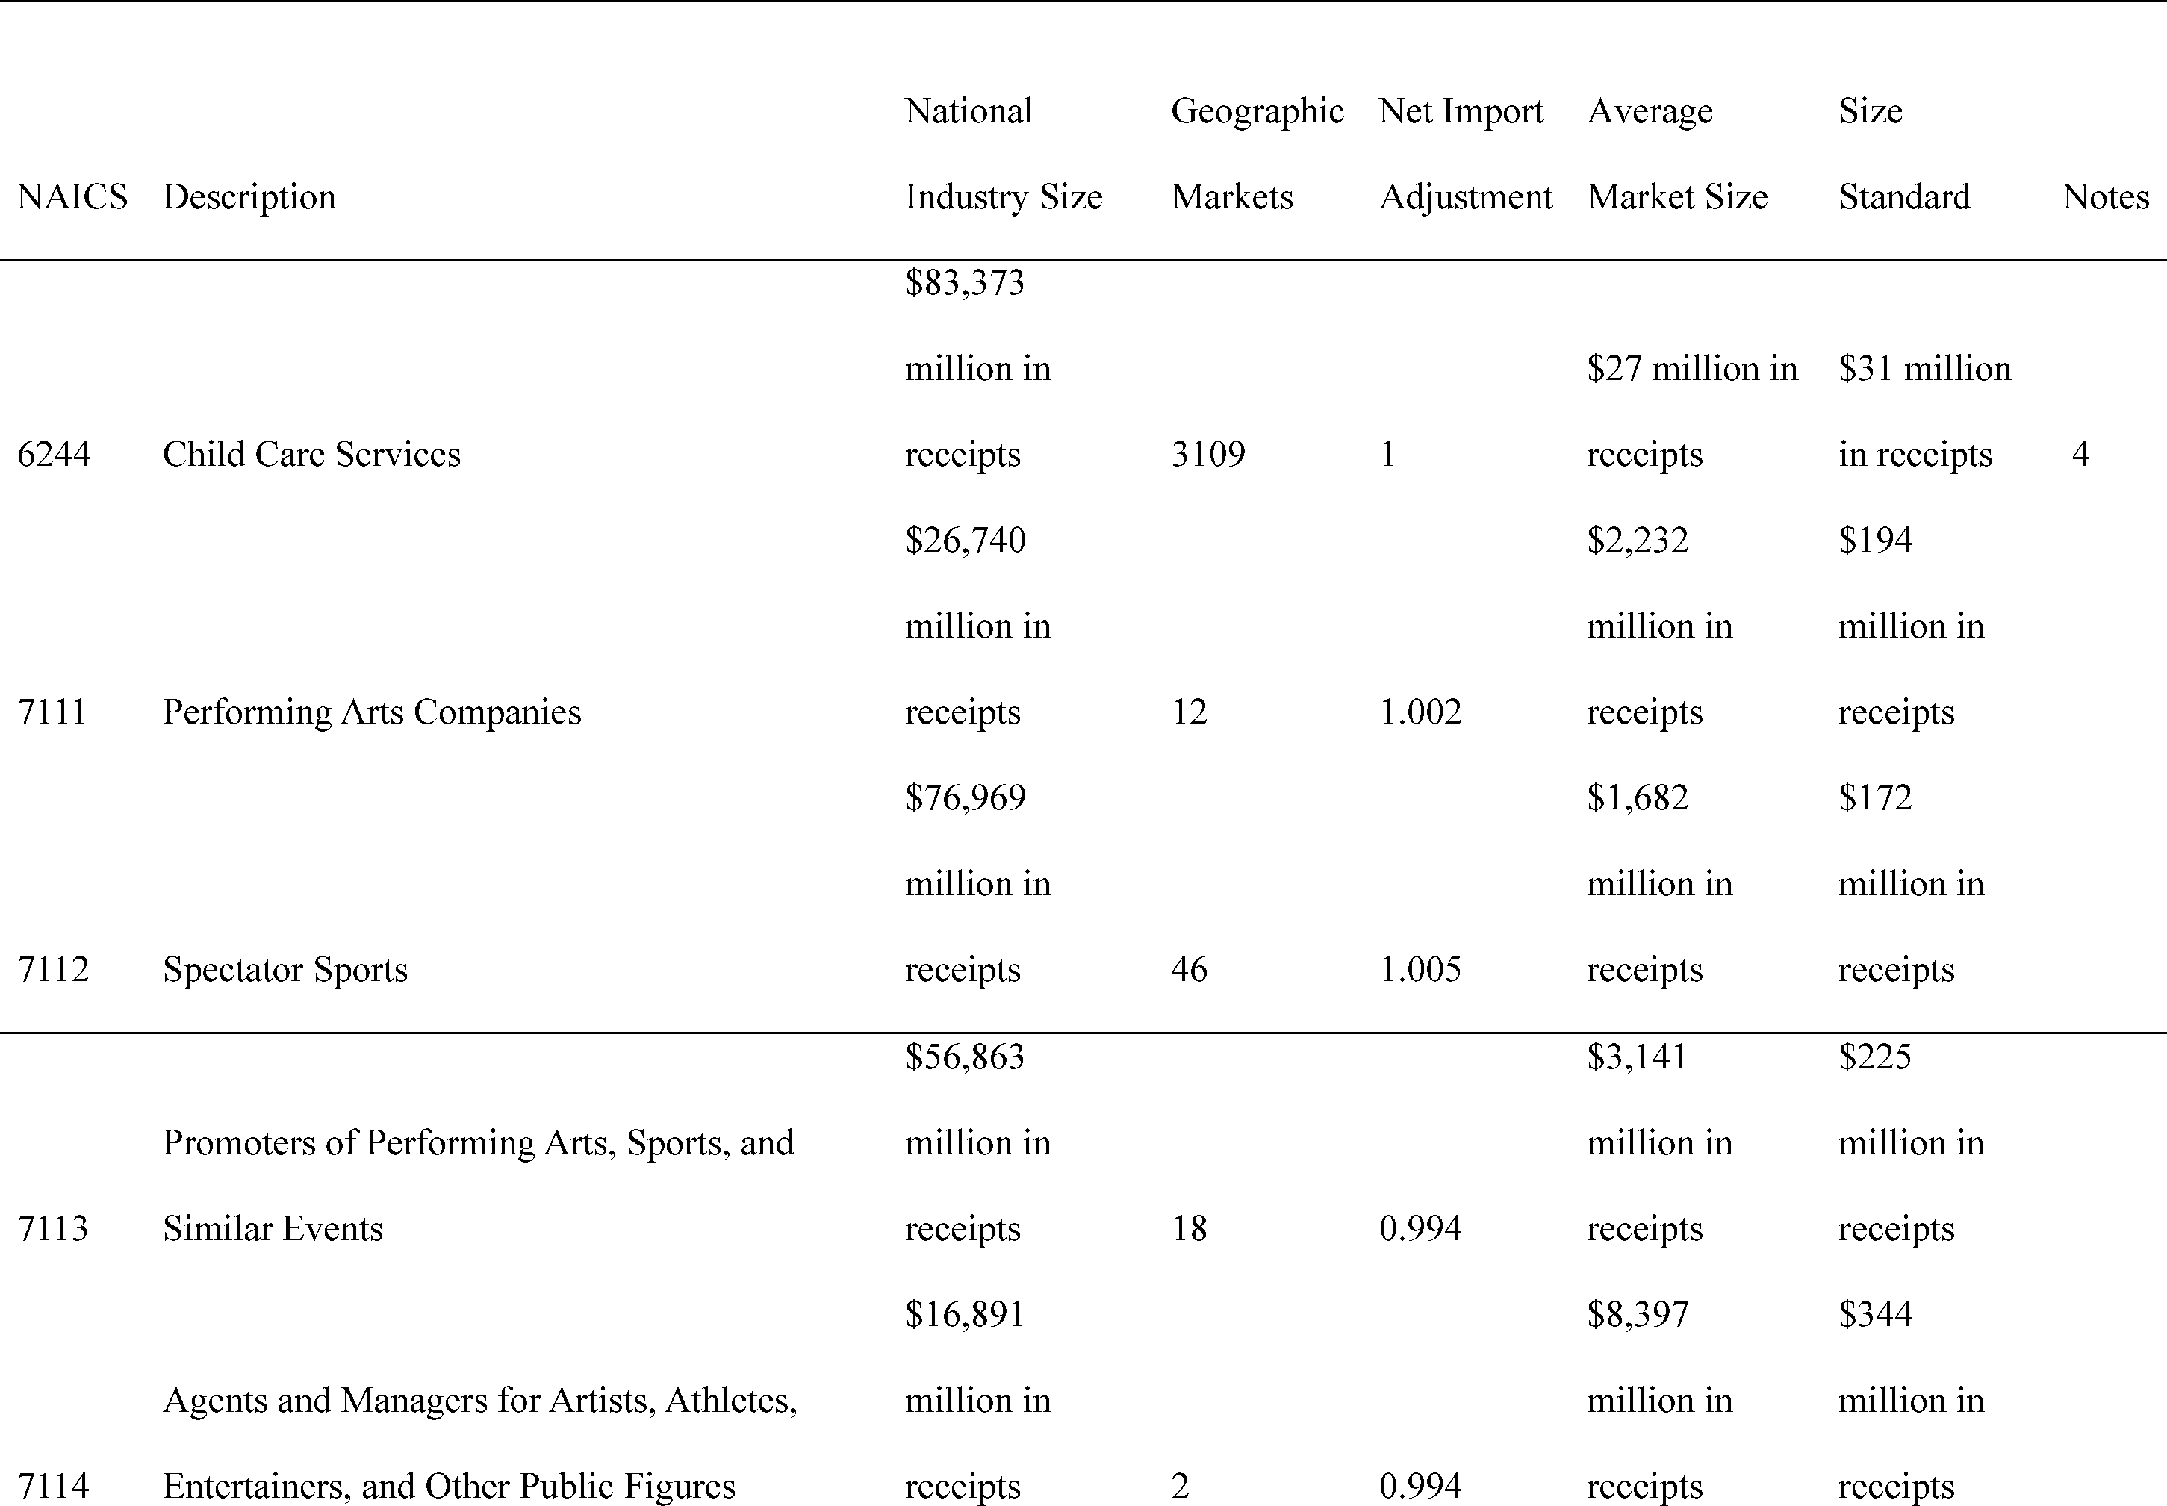
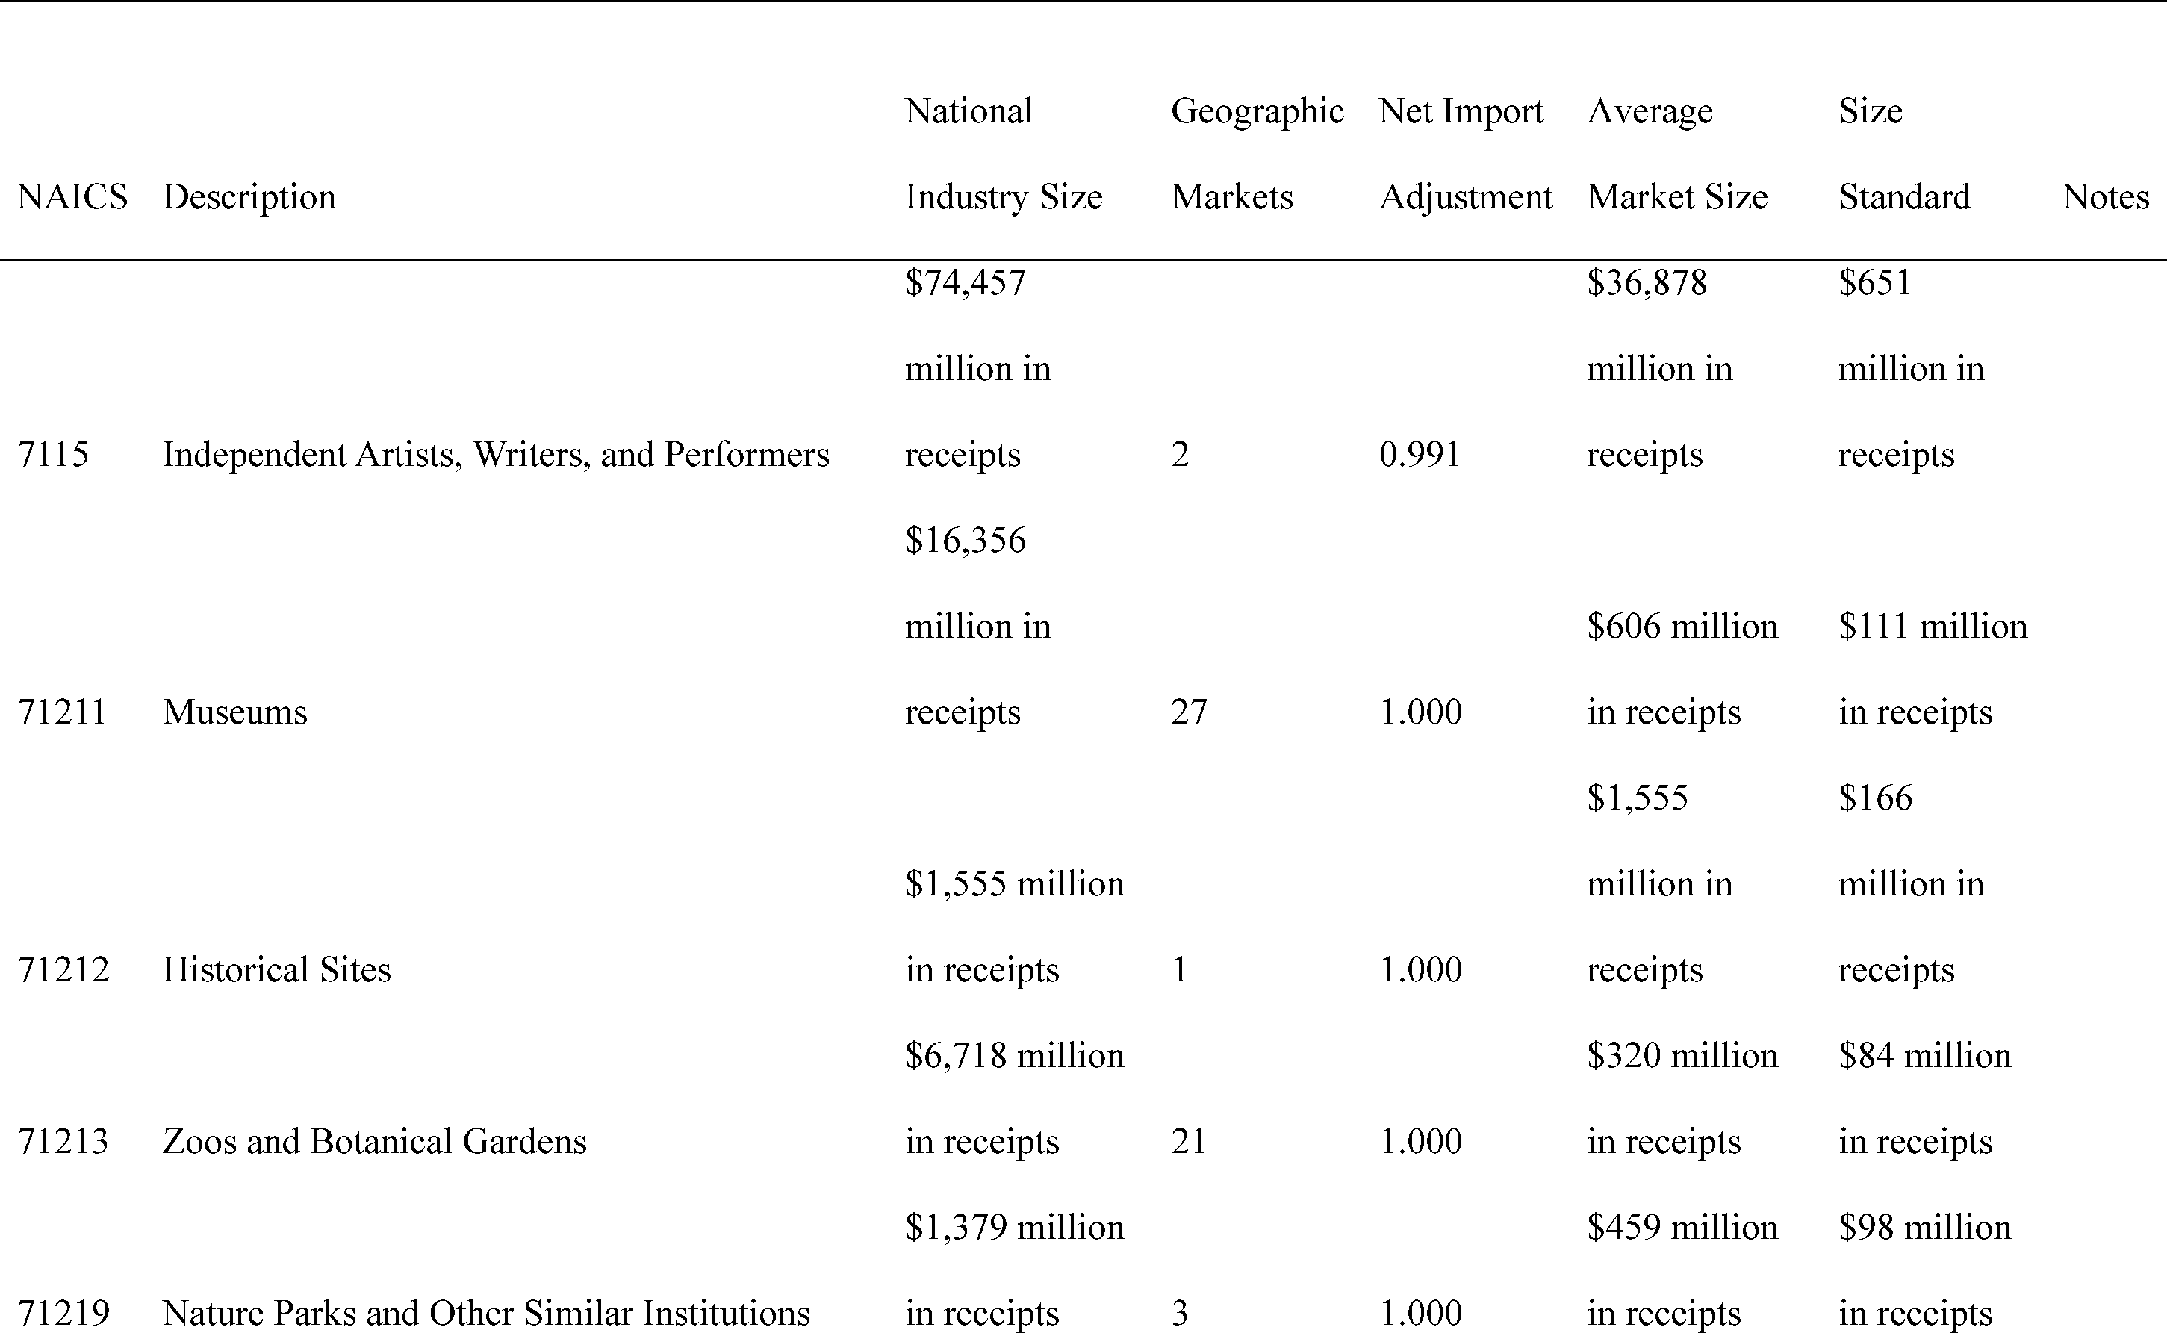
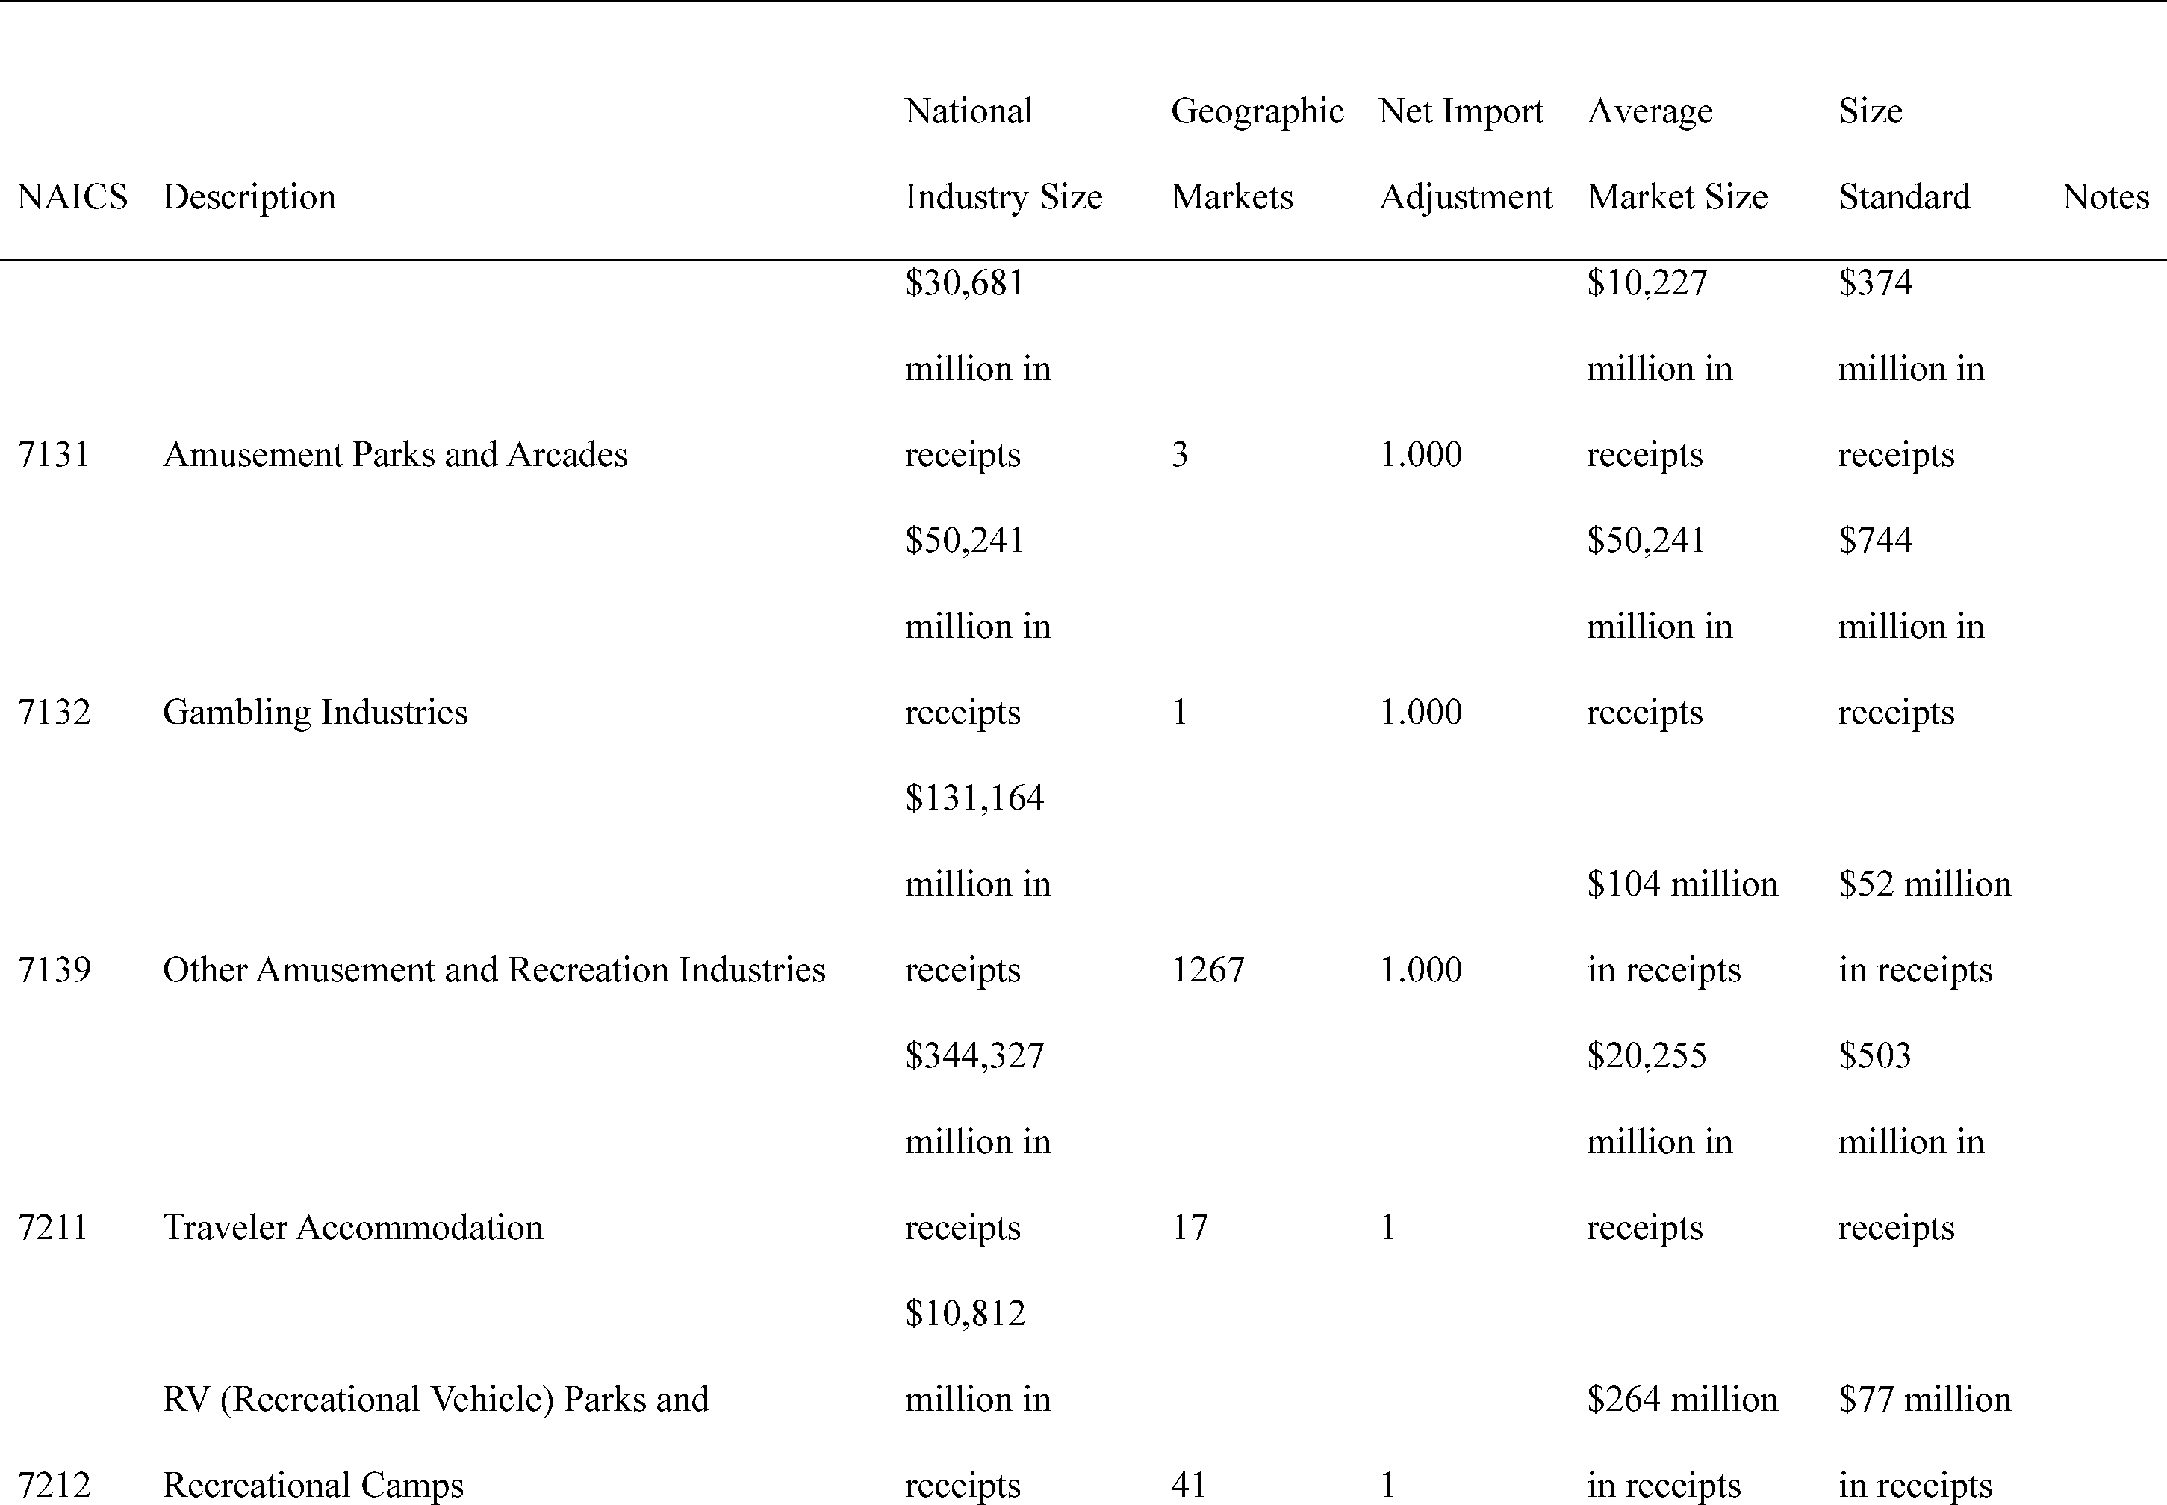
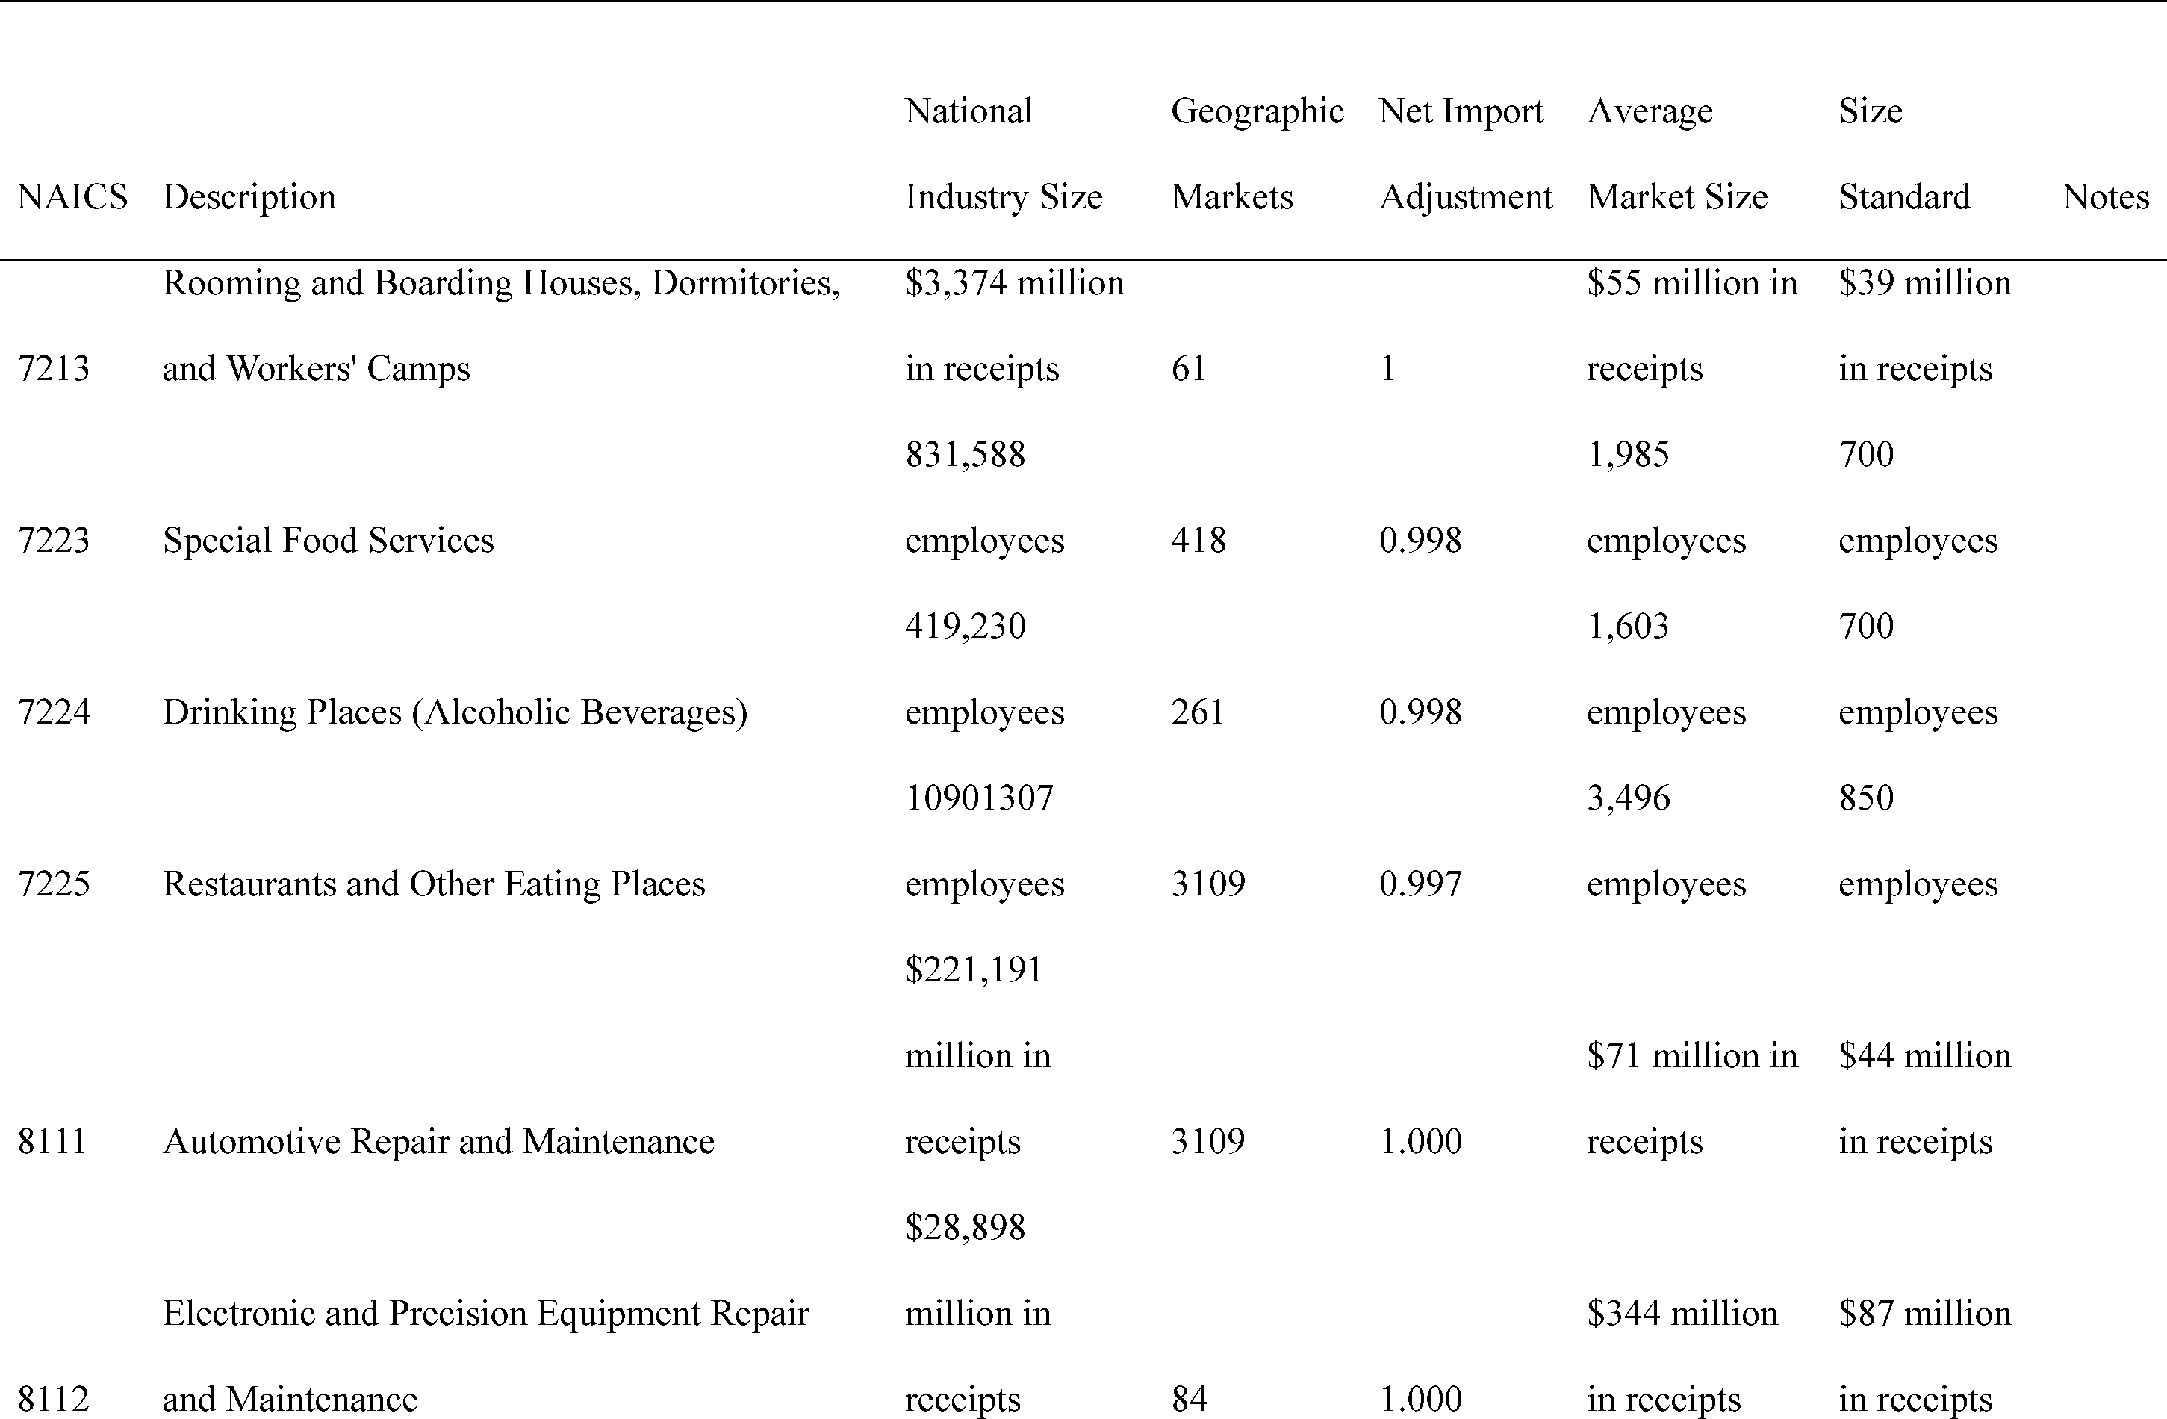
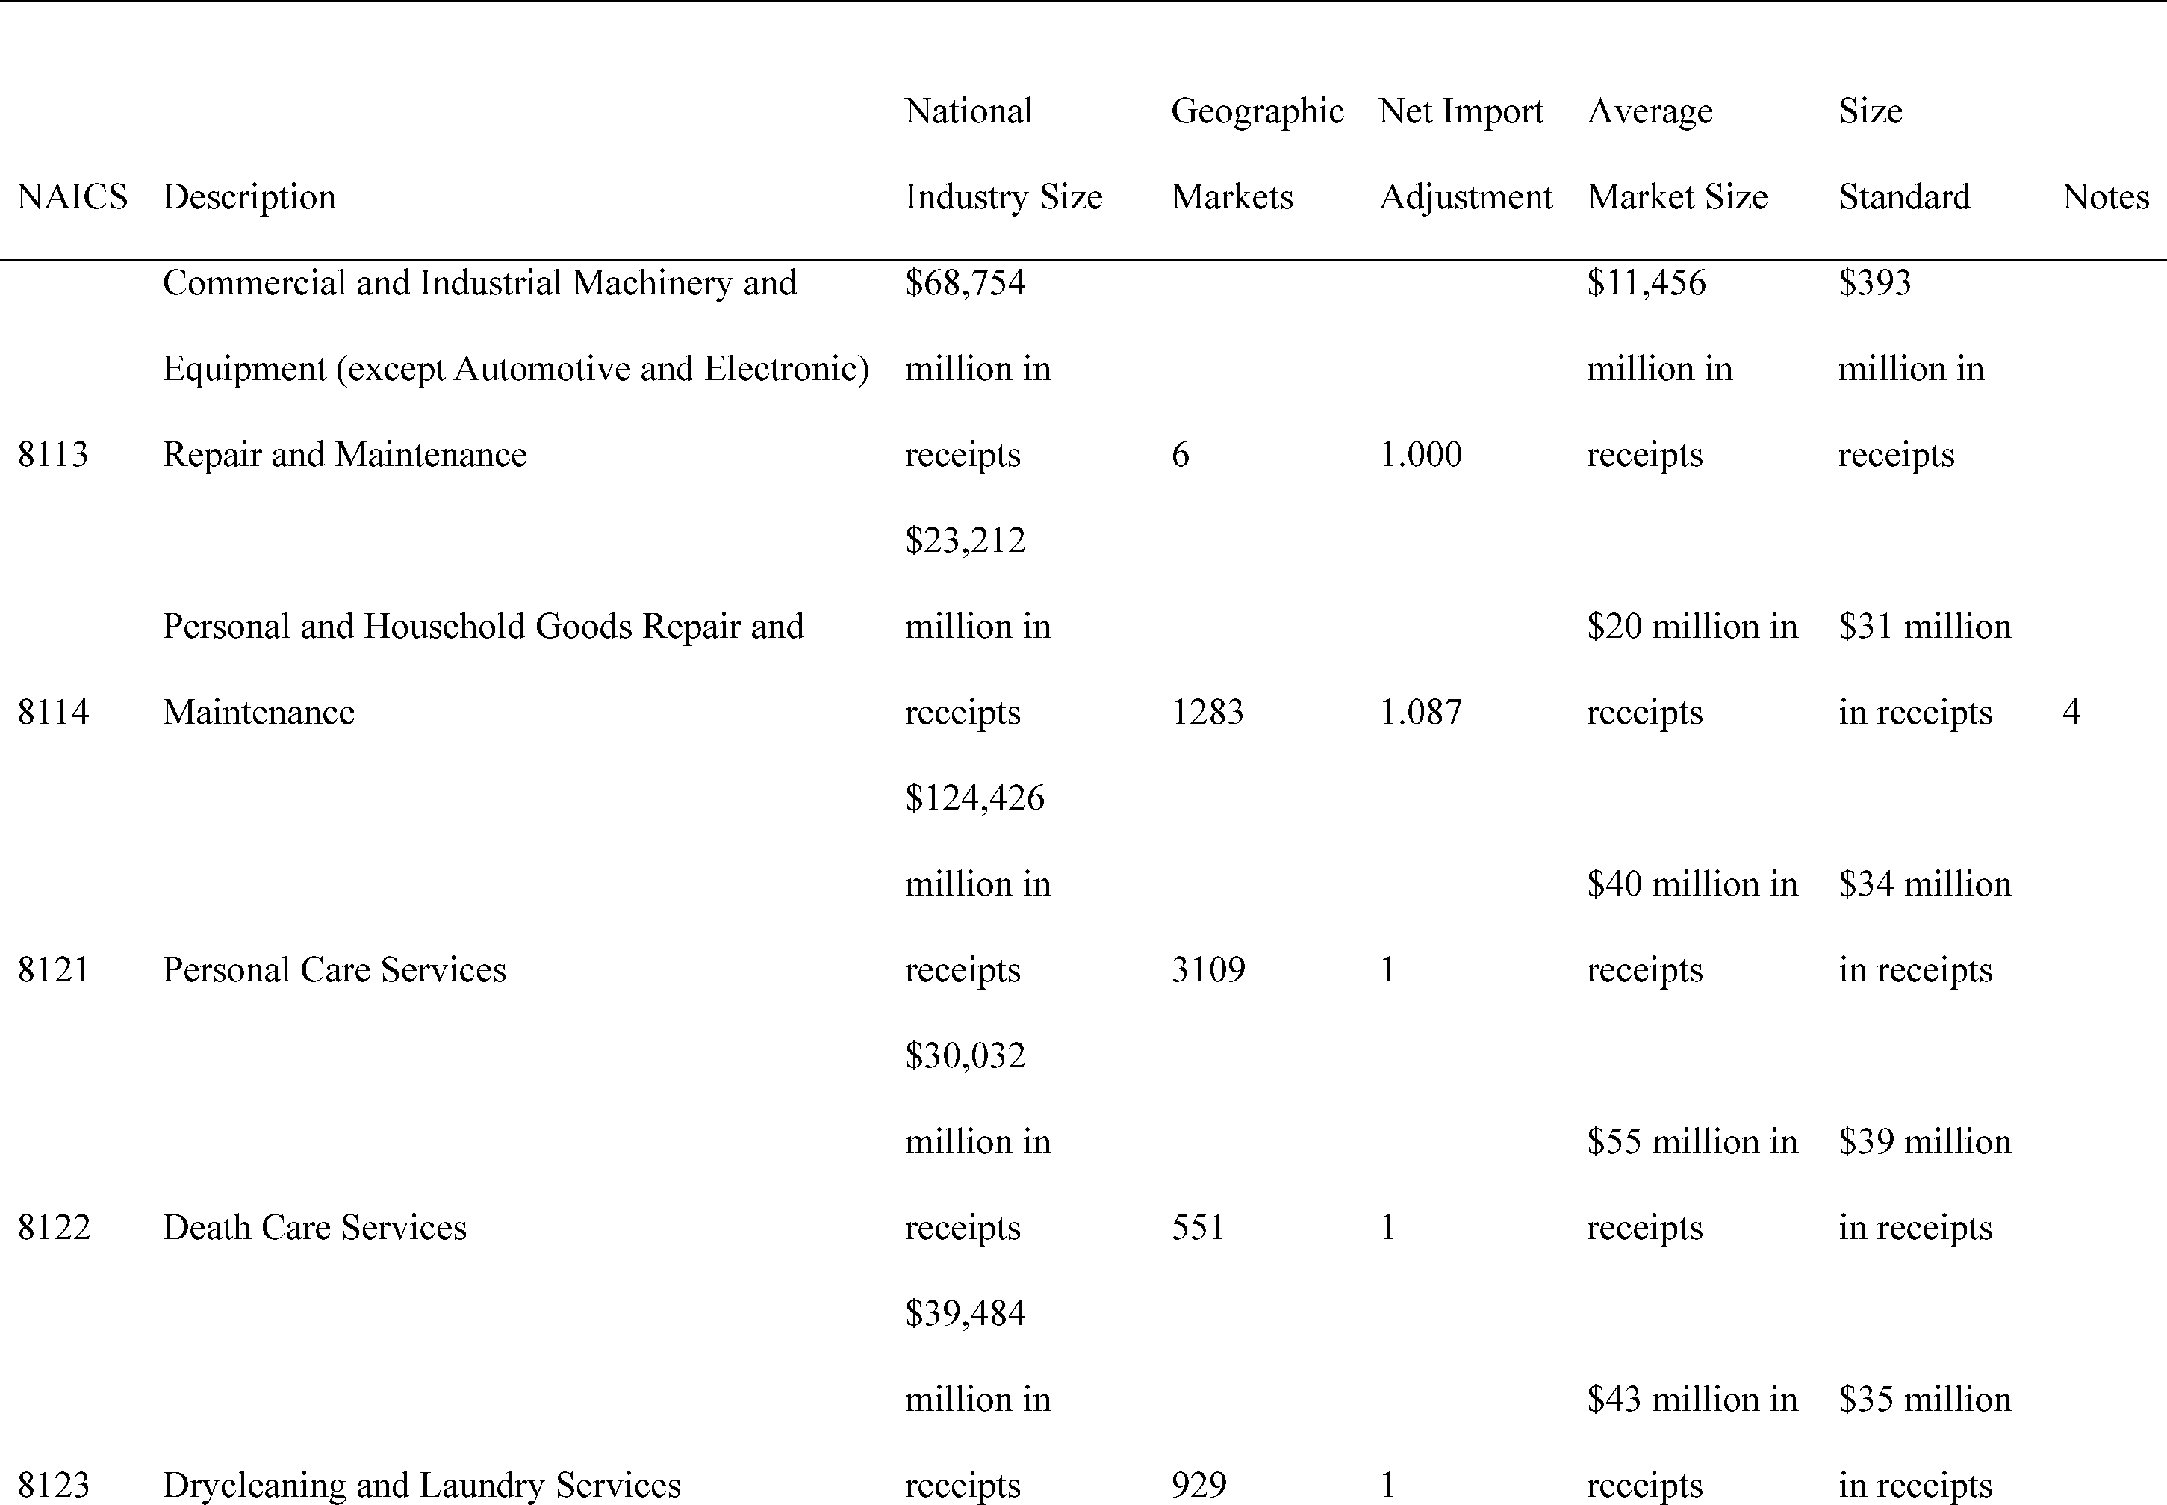
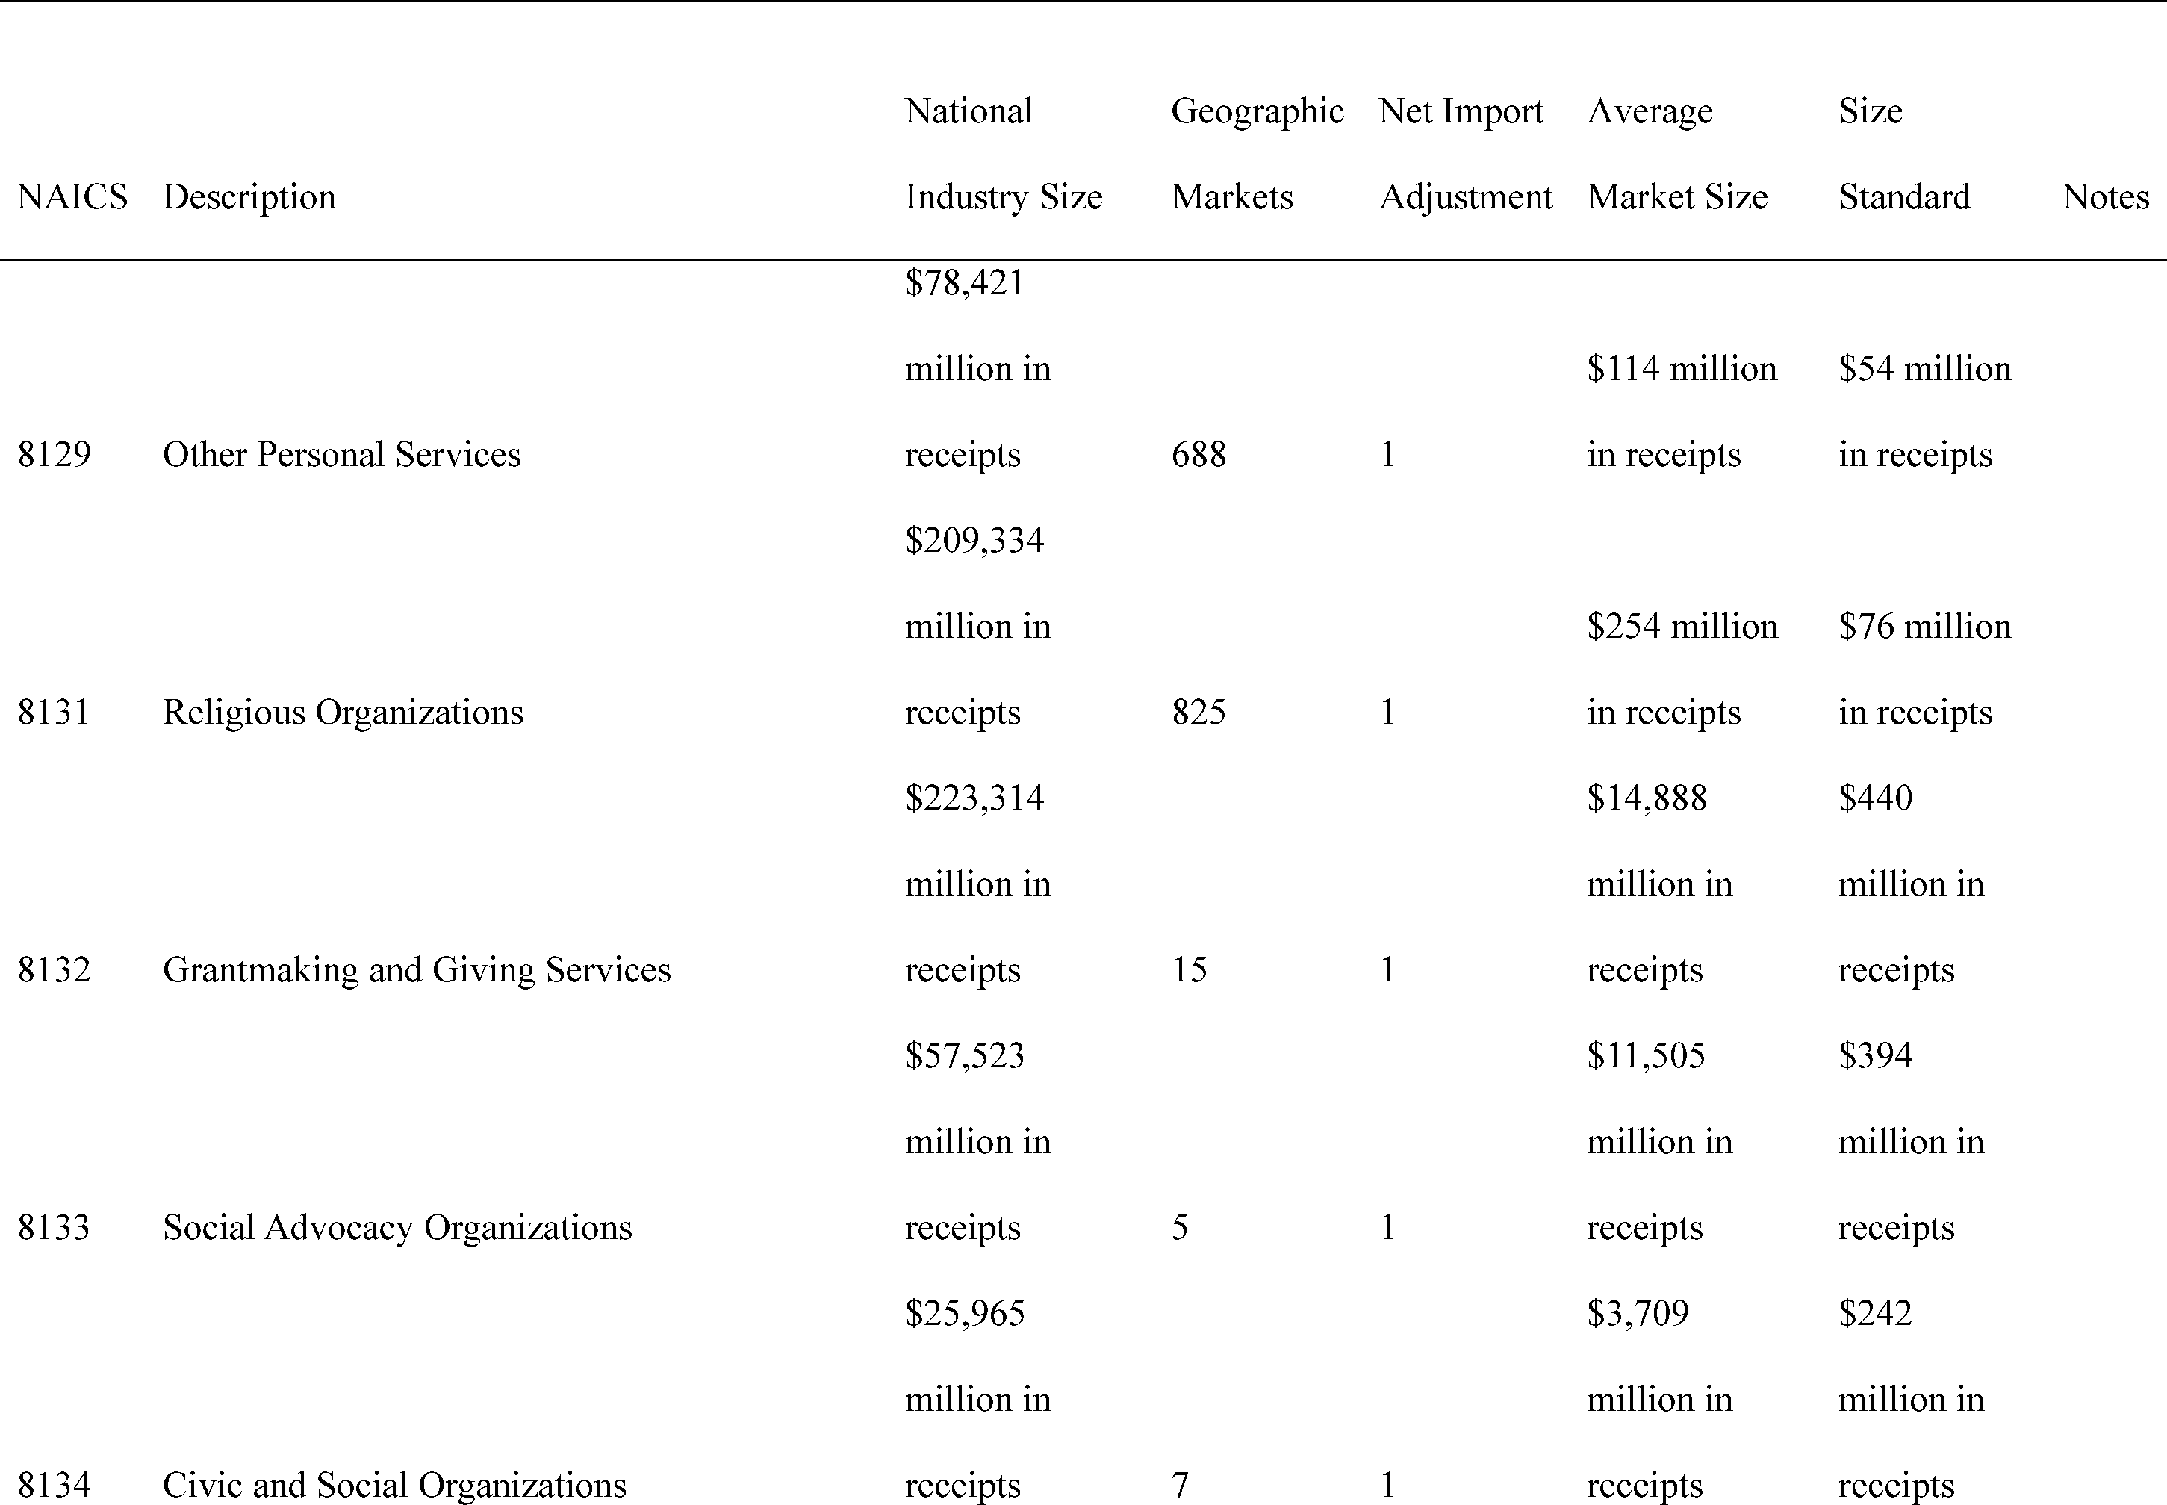
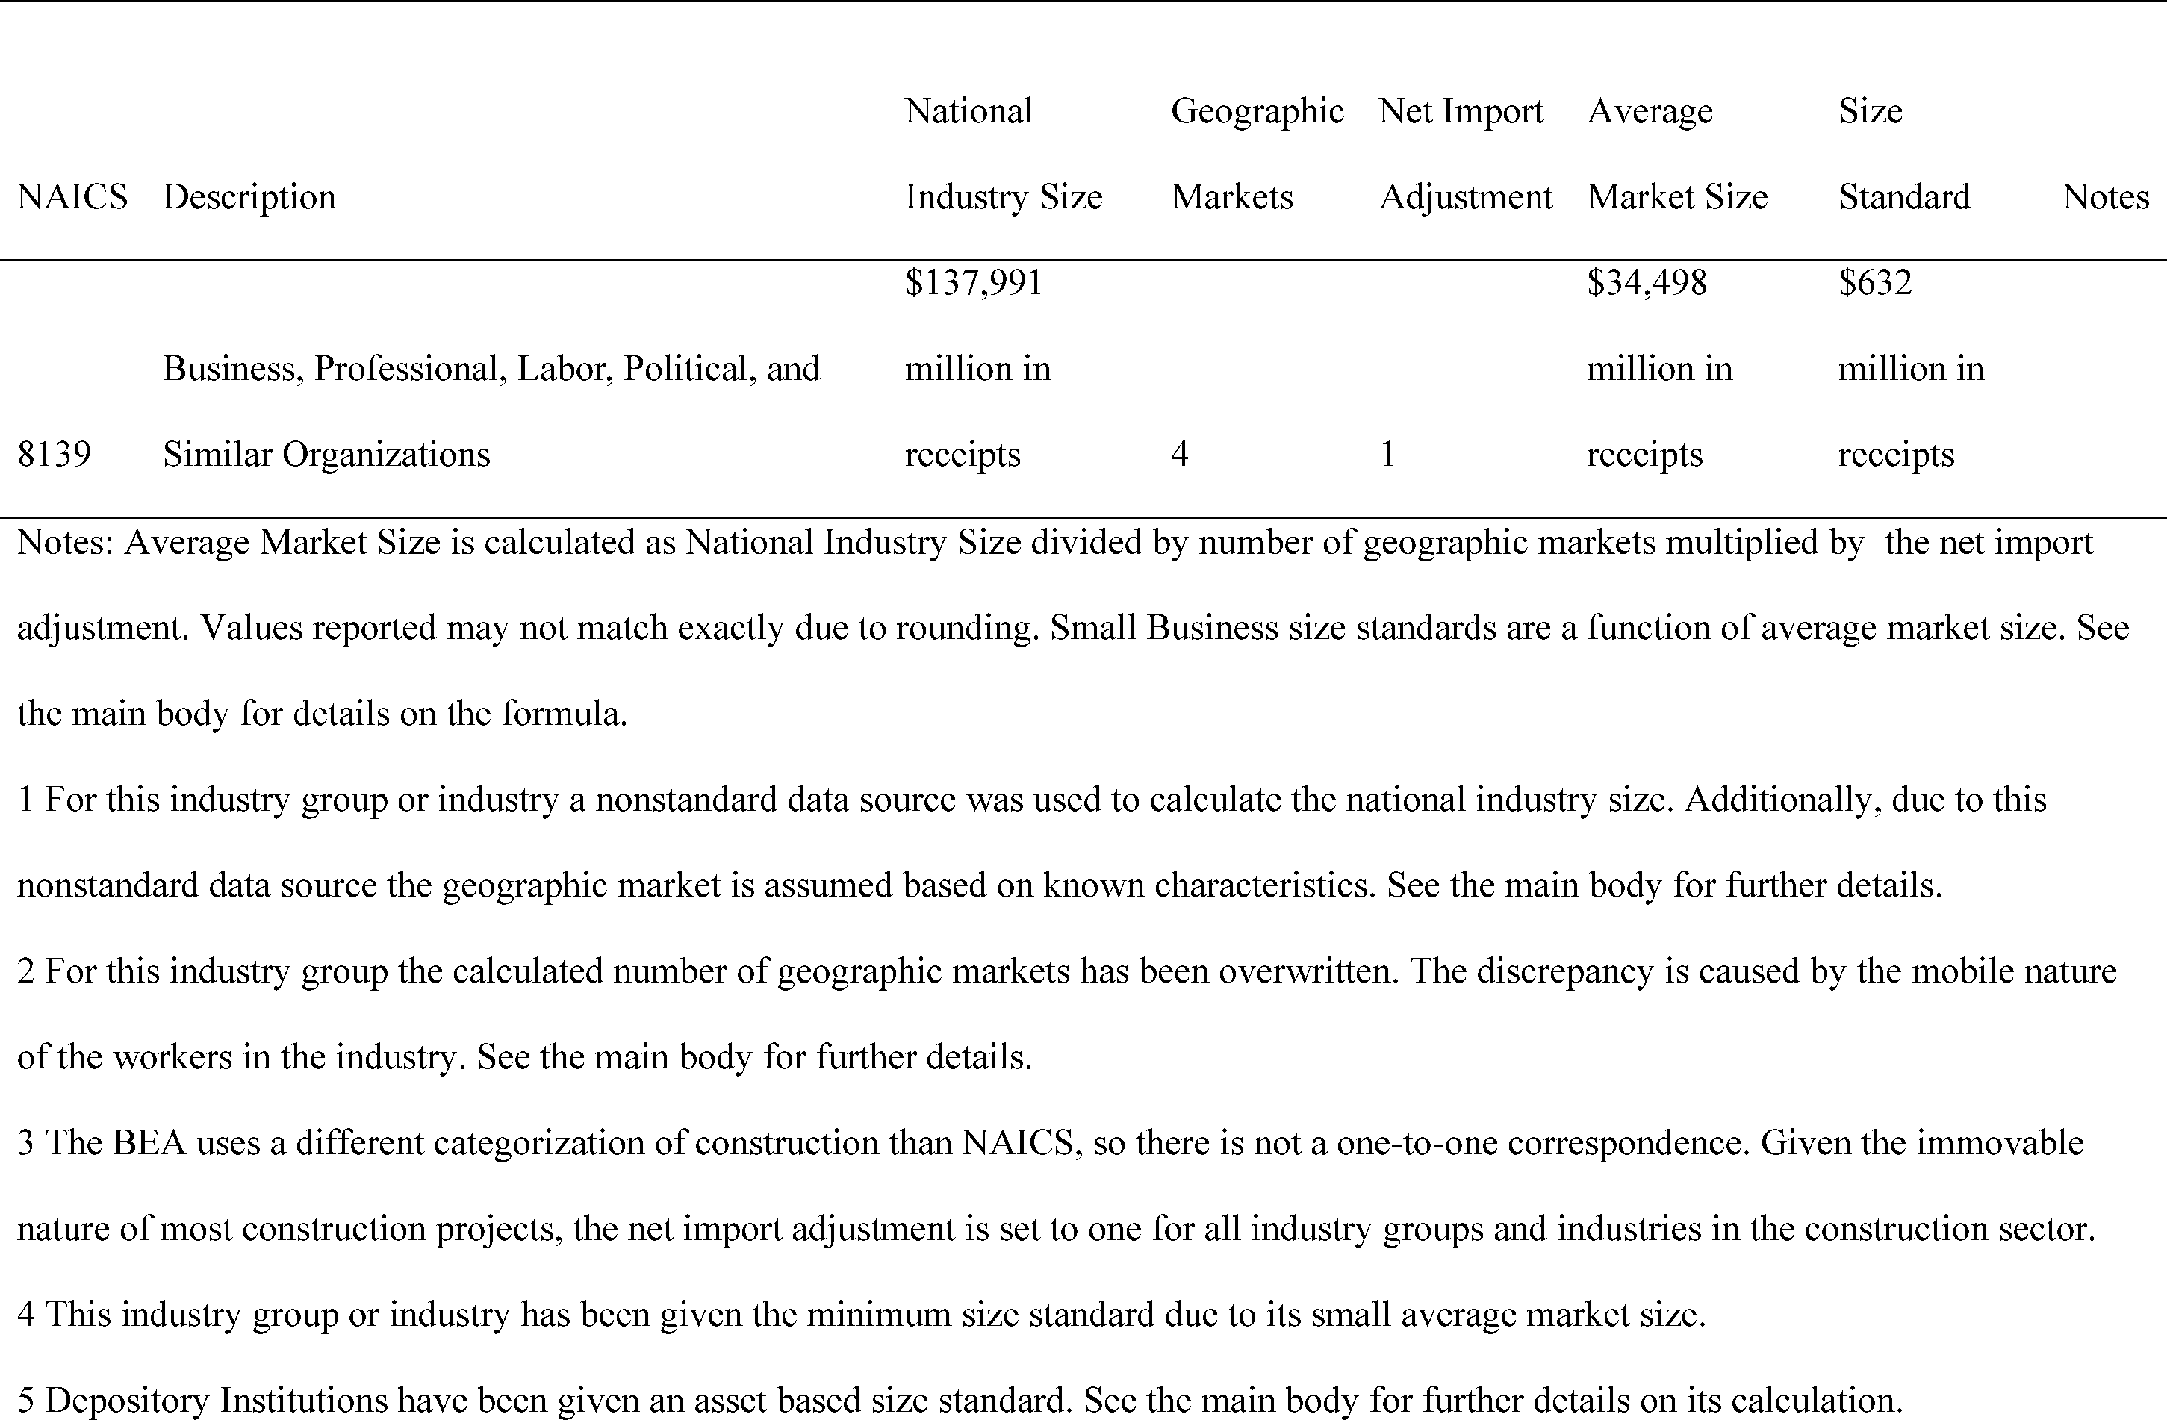
 www.energy.gov/ea/power-marketing-administrations
 www.epa.gov/dwreginfo/information-about-public-water-systems
 nces.ed.gov/ccd/tables/202324_summary_3.asp