The Safer Affordable Fuel-Efficient (SAFE) Vehicles Rule III for Model Years 2022 to 2031 Passenger Cars and Light Trucks
NHTSA, on behalf of the U.S. Department of Transportation (DOT), is substantially recalibrating the Corporate Average Fuel Economy (CAFE) program to bring the program into compl...
National Highway Traffic Safety Administration (NHTSA).
ACTION:
Final rule.
SUMMARY:
NHTSA, on behalf of the U.S. Department of Transportation (DOT), is substantially recalibrating the Corporate Average Fuel Economy (CAFE) program to bring the program into compliance with the law and to remove previous regulatory distortions which have induced manufacturers to make design decisions that have neither aligned with market demand and the needs of American families nor have delivered the consistent improvements in the fuel economy performance of manufacturer fleets, as Congress intended. This recalibration finalizes amendments to fuel economy standards for light-duty vehicles for model years 2022-2026 and MYs 2027-2031. This final rule also finalizes amendments to compliance aspects of the program, including to vehicle classification and other compliance pathways.
DATES:
This rule is effective November 30, 2026. The incorporation by reference of certain publications listed in the regulations is approved by the Director of the Federal Register as of November 30, 2026.
ADDRESSES:
For access to the dockets or to read background documents or comments received, please visit
www.regulations.gov,
or Docket Management Facility, M-30, U.S. Department of Transportation, West Building, Ground Floor, Rm. W12-140, 1200 New Jersey Avenue SE, Washington, DC 20590. The Docket Management Facility is open between 9 a.m. and 4 p.m. Eastern time, Monday through Friday, except Federal holidays.
FOR FURTHER INFORMATION CONTACT:
For technical and policy issues, Joseph Bayer, CAFE Program Division Chief, Office of Rulemaking, National Highway Traffic Safety Administration, 1200 New Jersey Avenue SE, Washington, DC 20590; email:
CAFE_Mbox@dot.gov.
For legal issues, Hannah Fish, NHTSA Office of Chief Counsel, National Highway Traffic Safety Administration, 1200 New Jersey Avenue SE, Washington, DC 20590; email:
CAFE_Mbox@dot.gov.
SUPPLEMENTARY INFORMATION:
Table of Acronyms and Abbreviations
( printed page 61989)
( printed page 61990)
( printed page 61991)
( printed page 61992)
( printed page 61993)
( printed page 61994)
Does this action apply to me?
This final rule affects companies that manufacture or sell new passenger automobiles (passenger cars) and non-passenger automobiles (light trucks), as defined under NHTSA's CAFE regulations.[1]
Regulated categories and entities include:
This list is not intended to be exhaustive but rather provides a guide regarding entities likely to be regulated by this action. To determine whether particular activities may be regulated by this action, you should carefully examine the regulations. You may direct questions regarding the applicability of this action to the persons listed in
FOR FURTHER INFORMATION CONTACT
.
Table of Contents
I. Executive Summary and Overview
A. Executive Summary
B. Overview of the Final Rule
1. Summary of the NPRM
2. Public Participation Opportunities and Summary of Comments
3. Changes to the CAFE Model in Light of Public Comments and New Information
4. Final Standards—Stringency
5. Final Standards—Impacts
6. Final Standards Are Maximum Feasible
II. Technical Foundation for the Final Rule Analysis
A. Why is NHTSA conducting this analysis?
1. What are the key components of NHTSA's analysis?
2. How do statutory requirements shape NHTSA's analysis?
3. What updated capabilities and assumptions does the current Model reflect as compared to the version used in the analysis of the 2024 final rule?
B. What is NHTSA analyzing?
C. What inputs does the compliance analysis require?
1. What inputs does the analysis require for 2022-2026?
2. What inputs does the compliance analysis require for 2027-2031?
a. Technology Options and Pathways
b. Defining Manufacturers' Current Technology Positions in the Analysis Fleet
c. Technology Effectiveness Values
d. Technology Costs
e. Simulating Tax Credits
f. Technology Applicability Equations and Rules
D. Technology Pathways, Effectiveness, and Cost
1. Engine Paths
2. Transmission Paths
3. Hybridization Paths
4. Road Load Reduction Paths
5. Mass Reduction
( printed page 61995)
6. Aerodynamic Improvements
7. Low Rolling Resistance Tires
8. Simulating Air-Conditioning Efficiency and Off-Cycle Technologies
E. Consumer Responses to Manufacturer Compliance Strategies
1. Macroeconomic and Consumer Behavior Assumptions
2. Fleet Composition
a. Sales
b. Scrappage
3. Changes in Vehicle Miles Traveled
4. Changes to Fuel Consumption
F. Simulating Emissions Impacts of Regulatory Alternatives
G. Simulating Economic Impacts of Regulatory Alternatives
1. Private Costs and Benefits
2. External Costs and Benefits
H. Simulating Safety Effects of Regulatory Alternatives
1. Mass Reduction Impacts
2. Sales/Scrappage Impacts
3. Rebound Effect Impacts
4. Value of Safety Impacts
III. Regulatory Alternatives Considered in This Final Rule
A. General Basis for Alternatives Considered
1. MYs 2022-2026
2. MYs 2027-2031
3. Minimum Domestic Passenger Car Standard Analysis Update
B. Regulatory Alternatives Considered
1. No-Action Alternatives for PCs and LTs
a. No-Action Alternative for the MYs 2022-2026 Amendment
b. No-Action Alternative for the MYs 2027-2031 Amendment
2. Action Alternatives for Passenger Cars and Light Trucks
a. Action Alternatives for MYs 2022-2026 Amendment
(1) Alternative 1
(2) Alternative 2
(3) Alternative 3—Preferred Alternative
(4) Alternative 4
(5) Alternative 5
b. Action Alternatives for MYs 2027-2031 Amendment
(1) Alternative 1
(2) Alternative 2
(3) Alternative 3—Preferred Alternative
(4) Alternative 4
(5) Alternative 5
IV. Effects of the Regulatory Alternatives
A. Effects of the Regulatory Alternatives for MYs 2022-2026
B. Effects of the Regulatory Alternatives for MYs 2027-2031
1. Effects on Vehicle Manufacturers
2. Effects on Society
3. Physical and Environmental Effects
4. Sensitivity Analysis
V. Basis for NHTSA's Conclusion That the Final Standards Are Maximum Feasible
A. The Energy Policy and Conservation Act of 1975 (EPCA), as Amended by the Energy Independence and Security Act of 2007 (EISA)
1. Administrative Provisions Governing CAFE Standard Setting
a. Lead Time, Amendatory Authority, and the Number of Model Years for Which Standards May Be Set at One Time
b. Separate Standards for Passenger Automobiles and Non-Passenger Automobiles
c. Minimum Standards for Domestic Passenger Automobiles
d. Attribute-Based Standards Defined by a Mathematical Function
e. 35 Miles per Gallon in 2020
2. Maximum Feasible Standards
a. Technological Feasibility
b. Economic Practicability
c. The Effect of Other Motor Vehicle Standards of the Government on Fuel Economy
d. The Need of the United States To Conserve Energy
(1) Consumer Costs and Fuel Prices
(2) National Balance of Payments
(3) Environmental Effects
(4) Foreign Policy Implications
e. Factors That NHTSA Is Prohibited From Considering
f. Additional Considerations Relevant to NHTSA's Statutory Determination of Maximum Feasibility
B. Other Statutory Requirements
1. Administrative Procedure Act
2. National Environmental Policy Act
C. Evaluating the Statutory Factors and Other Considerations To Arrive at the Final Standards
1. Why is NHTSA's conclusion different from the 2020, 2022, and 2024 final rules?
2. Considerations Justifying the Final Standards
a. Technological Feasibility
b. Economic Practicability
c. Effect of Other Motor Vehicle Standards of the Government on Fuel Economy
d. The Need of the United States To Conserve Energy
e. Synthesis of the Record Supporting Alternative 3 as Maximum Feasible
3. Final Supplemental Environmental Impact Statement Analysis Results
D. Severability
VI. Compliance and Enforcement
A. Background and Overview of Compliance and Enforcement
B. Finalized Changes to the CAFE Program
1. Modification of Vehicle Classification in the CAFE Program
a. Non-Passenger Automobile Definition
b. Finalized Changes to Criteria for Off-Highway Capability
c. Finalized Changes to Criteria for Functional Performance
(1) Automobiles With Three or More Rows of Seating
(2) Light-Duty Work Factor
2. Removal of Credit Trading in the CAFE Program
3. Technical Amendments To Remove References to EPA's Regulations for AC Efficiency and Off-Cycle Fuel Consumption Improvement Values
4. Modification of the Definition of Curb Weight and Manufacturer Reporting Requirements
C. Technical Amendments
1. Technical Amendments To Remove Residual Mention of Fuel Efficiency Standards for Trailers in NHTSA's Vehicle Classification Regulations
2. Technical Amendment To Remove Heavy-Duty Trailers From the List of Heavy-Duty Vehicle Regulatory Categories
3. Technical Amendments To Remove Civil Penalties for Non-Compliance With Fuel Economy Standards From the CAFE Program
4. Additional Technical Amendments
a. Technical Amendments to Part 523
b. Technical Amendments to Part 531
c. Technical Amendments to Part 533
d. Technical Amendments to Part 536
e. Technical Amendments to Part 537
5. Technical Amendment To Modify the Civil Penalty for Non-Compliance With Fuel Economy Standards in Part 578
VII. Regulatory Notices and Analyses
A. Executive Order 12866, “Regulatory Planning and Review”; Executive Order 13563, “Improving Regulation and Regulatory Review”; Executive Order 14192, “Unleashing Prosperity Through Deregulation”; and Executive Order 14219, “Ensuring Lawful Governance and Implementing the President's `Department of Government Efficiency' Deregulatory Initiative.”
B. Environmental Considerations
1. National Environmental Policy Act
2. Clean Air Act as Applied to NHTSA's Final Rule
3. Endangered Species Act (ESA)
4. Other Regulatory Analyses Discussed in the Final SEIS
5. Executive Order 13045: “Protection of Children From Environmental Health Risks and Safety Risks”
F. Executive Order 13175 (“Consultation and Coordination With Indian Tribal Governments”)
G. Unfunded Mandates Reform Act
H. Regulation Identifier Number
I. National Technology Transfer and Advancement Act
J. Incorporation by Reference
K. Department of Energy Review
L. Paperwork Reduction Act
I. Executive Summary and Overview
A. Executive Summary
The relationship between the light-duty vehicle market and the corporate average fuel economy (CAFE) program has gone through several cycles over its almost 50-year history. First created to require conservation of petroleum in response to price shocks caused by the Arab oil embargoes of the 1970s, the CAFE program has led to the desired improvements in fuel economy, but it also has created unintended responses from vehicle manufacturers—often to the detriment of consumers.
Over the CAFE program's history, separate standards for the passenger car and light truck fleets (referred to by law
( printed page 61996)
as passenger automobiles and non-passenger automobiles, and together known as light-duty vehicles) have led manufacturers to reshape the market in unanticipated ways—such as by almost eliminating the production of station wagons (passenger cars that generally have more robust cargo capacity, adding mass and reducing fuel economy) in favor of vehicles like minivans and crossover utility vehicles (considered light trucks, and subject to less stringent standards).
Strict miles-per-gallon-based standards in the early years of the program also led manufacturers to seek significant reductions in vehicle size and mass, leading to increased injury or fatality risk for occupants of smaller vehicles involved in a crash.[2]
NHTSA sought to mitigate these responses by creating attribute-based standards that relate the “footprint” size of vehicles to fuel economy, to some positive effect.
Meanwhile, the U.S. Environmental Protection Agency (EPA) started providing special fuel economy adjustments for technologies that had potential for fuel economy improvements but were not measurable using the laboratory test procedures (
i.e.,
the “two-cycle” tests) for vehicle fuel economy. This included accommodating adjustments to efficiency values if manufacturers implemented preferred air conditioning (AC) technologies and installed special technologies with purported fuel-saving benefits that could not be captured on the aforementioned two-cycle tests, accordingly known as “off-cycle” (OC) technologies (
e.g.,
vehicle stop/start functions that shut off the engine when the vehicle has stopped). These regulatory adjustments have led to widespread adoption of technologies with uncertain real-world benefits, added costs, and, in many cases, consumer backlash.
The creation of a system for inter-manufacturer credit trading—intended to improve the cost effectiveness of the CAFE program by allowing manufacturers that could improve the fuel economy of their fleets more cost effectively to earn credits for exceeding fuel economy standards and sell those credits to manufacturers that would need to incur higher costs to meet fuel economy standards—has also resulted in a windfall for EV-exclusive manufacturers that sell credits to other non-EV manufacturers, which in turn pay for those credits with capital that could be invested toward improving the fuel economy performance or other desirable attributes of their traditional fleets. The enormous fuel economy values assigned to EVs have, heretofore, been included in the baseline fleet fuel economy for CAFE rulemakings upon which stringency increases are applied—thereby significantly increasing the fuel economy requirements for traditional gasoline- or diesel-fueled fleets.[3]
At the same time, the classification system that has long divided the fleet between passenger cars (intended to move passengers) and light trucks (intended to move cargo or operate off highway) no longer lives up to its anticipated use. Indeed, while 68 percent of the light-duty fleet meets the current light truck regulatory definition, the majority of these vehicles (
e.g.,
all-wheel drive (AWD) crossover utility vehicles, vehicles with three or more rows of seating, and vehicles that do not have an approach angle high enough to handle an off-highway obstacle) cannot realistically operate off highway and have little value moving cargo. Instead, most of these vehicles are designed and intended primarily to move passengers but have additional features solely to meet regulatory definitions [4]
—resulting in little added functionality, reduced fuel economy performance, added cost, and a homogenous design lacking in creativity.
While the CAFE program was intended to push manufacturers to improve fuel economy while preserving their ability to design and produce vehicles that meet market demands, the system has spun off its axis and requires recalibration. Instead of allowing manufacturers to design and produce vehicles they believe their customers will want and need, while spreading real-world fuel economy improvements across their fleets, the system has increasingly led manufacturers to try to fit square vehicle pegs in round classification holes to force the adoption of technologies that do not meet the demands of American families simply to obtain on-paper fuel economy improvements that may have little basis in reality. All of this adds inefficiency and cost—pushing even more consumers out of an already unaffordable new car market.
By delegation of authority from the Secretary of Transportation (the Secretary), NHTSA is, in this action, finalizing amendments to the previously promulgated CAFE standards applicable to passenger and non-passenger automobiles produced for MYs 2022-2026 and MYs 2027-2031. Finalizing amended standards beginning with MY 2022 is consistent with the Secretary's direction in the January 28, 2025, memorandum titled “Fixing the CAFE Program” and is also the earliest model year for which NHTSA has not concluded CAFE compliance proceedings; additional discussion regarding NHTSA's finalized amended standards can be found in Section V.
Consistent with the terms of the CAFE program mandated in the Energy Policy and Conservation Act of 1975 (EPCA), as amended by the Energy Independence and Security Act of 2007 (EISA) and other laws (codified in chapter 329 of Title 49 of the U.S. Code), the fuel economy standards finalized herein are based solely on light-duty vehicles powered by gasoline and diesel fuels, a category that includes non-plug-in hybrid vehicles.[5]
In formulating the finalized standards, NHTSA has not considered the imputed fuel-economy performance of EVs or the electric operation of plug-in hybrid
( printed page 61997)
electric vehicles (PHEVs). This approach marks a change from previous rulemakings, as described above, but brings the CAFE program into compliance with statutory restrictions.
This final rule fulfills NHTSA's statutory obligation to set CAFE standards at the maximum feasible level that the agency determines vehicle manufacturers can achieve in each model year, balancing four key factors: technological feasibility, economic practicability, the need of the United States to conserve energy, and the effect of other motor vehicle standards of the Government on fuel economy.[6]
This balancing must take into account current and projected circumstances and cannot consider the availability of alternative fuel technologies (
e.g.,
EVs or PHEV electric operation), or compliance credits.[7]
This action is also consistent with Executive Order (E.O.) 14148, “Initial Rescissions of Harmful Executive Orders and Actions,” [8]
and E.O. 14154, “Unleashing American Energy,” [9]
as well as the Secretarial memorandum titled “Fixing the CAFE Program.” [10]
The standards presented in this final rule differ significantly from those finalized in the 2020, 2022, and 2024 rules. In formulating those prior standards, NHTSA considered both the fuel economy of EVs and PHEVs and compliance credits that could be earned when a manufacturer over-complied with an applicable fuel economy standard. As a result, the fuel economy standards previously established by NHTSA for passenger cars and light trucks for MYs 2022-2026 and MYs 2027-2031 failed to satisfy substantive statutory requirements. NHTSA is finalizing in this rule the “maximum feasible” fuel economy requirements for the model years in question that best reflects the balancing of the four statutory factors and limitations mandated for the CAFE program.
This rulemaking is intended to establish maximum feasible fuel economy standards while bringing the program into compliance with the law. It marks a significant reset. NHTSA has removed from every aspect of the standards development process consideration of factors inconsistent with the statute, including specific technologies and credits, to bring the program back within its statutory constraints. NHTSA discussed extensively its prior consideration of such technologies and credits in the standards development process in the final interpretive rule,
Resetting the Corporate Average Fuel Economy Program,[11]
and in the proposal, and includes a more detailed discussion in Section V, below.
NHTSA has also removed consideration of AC efficiency and OC fuel consumption improvement values (FCIVs) from its standard-setting analysis starting with MY 2028. This change will ensure that NHTSA's CAFE standards are achievable without the implementation of technologies with questionable fuel economy benefits and not demanded by consumers.
The agency is also eliminating the inter-manufacturer credit trading program (which is authorized, but not required, by 49 U.S.C. 32903(f)) beginning with credits earned in MY 2028. This change in the program is long overdue. Although NHTSA does not consider the availability of credits or credit trading in establishing standards, the agency believes that eliminating inter-manufacturer credit trading will encourage manufacturers to provide for steady improvement in fuel economy across their fleets over time, as opposed to relying upon credits acquired from third-party EV manufacturers. NHTSA recognizes that manufacturers have made investments in particular compliance pathways that may include purchasing credits from other manufacturers even though the availability of those credits is uncertain and is, therefore, finalizing this change beginning with credits earned in MY 2028. The finalized change provides additional transition time beyond that proposed in the notice of proposed rulemaking (NPRM), in recognition of any reliance interests in the trading program to achieve compliance, because manufacturers will still be able to purchase and use credits that were earned through MY 2027 for up to five model years after they were first generated (
e.g.,
credits earned in MY 2026 may be purchased and applied through MY 2031, and credits earned in MY 2027 may be purchased and used through MY 2032). However, NHTSA is finalizing standards in this rule at levels that do not consider the use of compliance credits, thus minimizing any impacts that this change may have on manufacturers' decisions about compliance pathways. Moreover, this change will not impact the ability of automakers to
transfer
earned credits between different categories of vehicles in their own fleets or carry their own credits forward and backwards across model years, as prescribed by statute.
The agency is also finalizing a substantial reclassification of the light-duty fleet in this reset of the CAFE program, with the passenger car fleet consisting of vehicles primarily designed to move people, and the light truck fleet consisting of vehicles primarily designed to operate off highway or move cargo. NHTSA recognizes the changes will introduce significant design consideration for manufacturers. Moving a large fraction of vehicles previously classified as light trucks into a manufacturer's passenger vehicle fleet will have a significant effect on the overall fuel economy performance of the manufacturer's passenger fleet; even if based upon the same platform as a passenger car, the additional vehicle height adds significant mass and decreases aerodynamics, and therefore fuel economy. Meanwhile, removal of vehicles from a manufacturer's light truck fleet will leave that fleet consisting of heavier and less aerodynamic vehicles, such as large sports utility vehicles and pickup trucks, thereby decreasing the overall average fuel economy of the light truck fleet. Accordingly, while a manufacturer's combined overall fleet fuel economy may remain the same, both its passenger car and light truck fleets will necessarily achieve lower measured fuel economy. NHTSA has also updated the classification criteria from technology-based to performance-based standards where applicable. This final rule takes these changes into account through amendments to both the footprint curves and standards applicable to various points within the curves. NHTSA intends that, as a result of this update, automobiles classified as non-passenger will exhibit true non-passenger capabilities that display relevant off-highway vehicle attributes such as approach angle and running clearance or include design features that provide higher payload and towing abilities for transporting cargo.
By surveying the measured fuel economy performance of gasoline- and diesel-powered passenger cars and light trucks produced for the U.S. market in MY 2022, NHTSA has created a maximum feasible foundation from which to establish standards for subsequent model years. NHTSA is setting fuel economy standards for passenger automobiles that increase from the newly finalized MY 2022 standards at a rate of 0.90 percent per year through MY 2029 followed by one
( printed page 61998)
percent per year through MY 2031, with MY 2030 stringency acting as a bridge between the vehicle classification updates. For non-passenger automobiles, NHTSA is setting fuel economy standards that increase from the newly finalized MY 2022 standards at a rate of 0.51 percent per year through MY 2029 followed by one percent per year through MY 2031, with MY 2030 stringency acting as a bridge between vehicle classification updates.[12]
The final standards may, in places, be referred to as the “Preferred Alternative(s),” but NHTSA intends “final standards,” “finalized standards,” and “Preferred Alternative(s)” to be used interchangeably for purposes of this document. In addition to the final standards, NHTSA considered a range of regulatory alternatives for each fleet, consistent with the agency's obligations under the Administrative Procedure Act (APA), National Environmental Policy Act (NEPA), and E.O. 12866. In response to public comments and the agency's additional analysis, NHTSA considered a greater number of regulatory alternatives for this final rule than were considered in the NPRM, for each fleet. The regulatory alternatives are as follows:
NHTSA has concluded that the levels of standards represented by Alternative 3 are the maximum feasible level for these model years, as discussed in more detail in Section V of this preamble. NHTSA has determined that the finalized standards satisfy the statutory requirements of maximum feasibility across the full range of gasoline- and diesel-powered vehicles currently on the market. These standards will be appropriately stringent in promoting fuel efficiency in the Nation's light-duty vehicle fleet while remaining technologically feasible and economically practicable to achieve without consideration of EV dedicated fuel economy or PHEV electric operation. The finalized standards also consider the effect of other motor vehicle standards of the Government on
( printed page 61999)
the fuel economy performance of new motor vehicles, as well as the need of the United States to conserve energy. NHTSA has determined that it is both reasonable and consistent with EPCA to weigh the need of the United States to conserve energy such that vehicle fuel economy standards require continuous improvements over time, but at sustainable levels for manufacturers, consumers, and society at large. In particular, the diminishing effects attributable to fuel economy improvements from higher standards moderates against weighing the need of the United States to conserve energy too heavily compared to the other statutory factors.[14]
Manufacturers have limited supplies of capital for technological advancement and are constrained in recovering those investments by what consumers can afford to pay for technological innovations in new vehicles. Maximum feasible fuel economy standards, when set appropriately weighing economic practicability, should not incentivize manufacturers, for example, to add technologies that have questionable real-world fuel economy benefits that consumers reject, at the cost of investments in or application of vehicle safety technologies. Instead, when truly maximum feasible standards apply, manufacturers should be able to develop and apply continually both proven fuel-saving and safety-enhancing technologies in such a manner that allows consumers both to afford and desire the new vehicle.
NHTSA concludes that this decision best comports with statutory requirements, and that the agency should exercise its authority to amend standards set in final rules issued in 2020, 2022, and 2024, respectively. The standards set in those final rules were set higher than maximum feasible levels because NHTSA considered statutorily prohibited factors in establishing those standards.[15]
Those rules resulted in distortions in the marketplace, which this final rule minimizes. These distortions include major non-market-based changes in automobile designs and the introduction of fundamental alterations in production processes not primarily driven by market demand.
Increasing the stringency of standards at modest annual rates, following a reset to eliminate the consideration of impermissible factors that were applied in setting the 2020, 2022, and 2024 standards, and coupled with a re-examination of the shape of the fuel economy target functions and the vehicle classification definitions, best comports with statutory requirements. Moreover, the level, shape, and applicability of the final standards to the passenger and non-passenger automobile fleets are justified by the inappropriate distortions the existing regulations have caused in the marketplace. Those regulations resulted in unnecessary regulatory burdens that did not further statutory purposes because the standards were not attainable for the gasoline- and diesel-powered vehicle fleet.
The final CAFE standards remain vehicle-footprint-based, like the current CAFE standards in effect since MY 2011. The footprint of a vehicle is the area calculated by multiplying the wheelbase times the track width, essentially the rectangular area of a vehicle measured from tire to tire where the tires contact the ground. This means that the standards are defined by mathematical equations that represent constrained linear functions relating vehicle footprint to fuel economy targets for passenger cars and light trucks.[16]
For this final rule, NHTSA has updated the mathematical functions (
i.e.,
the target curves relating footprint to fuel economy) for passenger cars and light trucks based on the latest available data. NHTSA has concluded, based on this data, that the relationship between footprint and fuel economy has shifted from MY 2008 (the model year on which the current curves are based) and it is thus appropriate to modify the mathematical functions accordingly. NHTSA has also updated the functions that would be applied beginning in MY 2030 to reflect changes based on the finalized vehicle classification regulations.
NHTSA estimates that the final standards would correspond to a combined industry fleetwide average of roughly 34.9 mpg in MY 2031 for passenger cars and light trucks.[17]
NHTSA notes that this is a projection because the actual CAFE standards are the footprint target curves for passenger cars and light trucks. This is important because it means that the ultimate fleetwide levels will vary depending on the mix of vehicles that manufacturers produce for sale in those model years. NHTSA also calculates and presents “estimated achieved” fuel economy levels, which differ somewhat from the estimated required levels for each fleet, for each year.[18]
Note that the industry-average required and achieved values presented below reflect the end of the modeled application of AC and FCIV adjustments, beginning in MY 2028, and updated vehicle classification regulatory definitions, which go into effect beginning in MY 2030.
For simplification, NHTSA provides industry-wide mpg estimates corresponding to the finalized standards in the table below but reiterates that the coefficients used to define the mathematical functions comprise the actual standards.
( printed page 62000)
To the extent that manufacturers are simulated to be over-complying with required fuel economy levels being set in MY 2027, NHTSA notes that this is due to factors including previous application of fuel economy technologies required by standards set for prior model years in a manner inconsistent with the statute because the analysis considered alternative fuel (
e.g.,
EV) technology applications. Once standards are established that consider all statutory factors and limitations appropriately, manufacturers that previously applied technologies to meet standards set using an analysis inconsistent with the statute will have relief, while manufacturers that faced certain penalties can continue to improve efficiency to meet maximum feasible standards. NHTSA's review of achieved compliance at the manufacturer level also shows that, while some manufacturers manage to achieve greater over-compliance, other manufacturers are expected to achieve compliance values that will track the levels of the new standards. In addition, NHTSA believes that the finalized standards established for model years prior to the MY 2030 fleet reclassification, which NHTSA also extended from MY 2028 from the proposal in response to manufacturer comments regarding lead time and planning cycles, will allow manufacturers to plan strategically with sufficient lead time to manage that transition within their projected model year sales cycles. For all fleets, average requirements and average achieved CAFE levels will depend ultimately on manufacturer and consumer response to standards, technology developments, economic conditions, fuel prices, and other factors.
NHTSA is also finalizing new minimum domestic passenger car CAFE standards (MDPCS) for MYs 2022-2026 and MYs 2027-2031, which are applied to passenger cars manufactured in the United States. Section 32902(b)(4) of 49 U.S.C. requires NHTSA to project the minimum domestic standard when it promulgates passenger car standards for a model year; these standards are shown in Table I-3 below. NHTSA continues to apply an offset (albeit a smaller one than was first used in the 2020 final rule and applied to the 2022 and 2024 final rules) when calculating the MDPCSs for MYs 2027-2031, reflecting prior differences between passenger car footprints forecast originally by the agency and passenger car footprints as they occurred in the real world. The finalized MDPCS for each model year is shown in the table below.
NHTSA uses the CAFE Compliance and Effects Modeling System (the CAFE Model or the Model) developed and maintained by the Volpe National Transportation Systems Center (Volpe Center or Volpe) as a tool for assessing the likely regulatory effects of the final rule and various regulatory alternatives. The Model does not determine which
( printed page 62001)
standards satisfy the requirements of EPCA, and no model can predict precisely the engineering configurations automakers are likely to introduce in response to evolving trends in market demand. However, the analysis developed using the CAFE Model provides further support for NHTSA's judgment that the standards finalized in this rule are the maximum standards that are technologically feasible and economically practicable for the gasoline- and diesel-powered vehicles covered by the final rule, considering the effect of other motor vehicle standards of the Government on fuel economy, and the need of the United States to conserve energy.
One significant modification from previous standard-setting proceedings and previous applications of the CAFE Model is that NHTSA did not include EVs in the base fleet for analysis purposes and did not consider or model the potential production of EVs as a CAFE compliance strategy for automakers. Section 32902 of chapter 49 directs NHTSA to establish fuel economy standards that are feasible and practicable for gasoline- and diesel-powered vehicles without regard to any reliance on alternatives. Automakers, of course, are free to produce EVs, or any other technologies, in response to market demand, and their production and sale of EVs will earn credit toward compliance with the CAFE standards in accordance with the “petroleum equivalency factor,” or “PEF,” prescribed by the Department of Energy (DOE).[20]
Additional updates to the CAFE Model and its inputs since the 2024 final rule and the 2025 proposal include updating the Market Data Input File to reflect the change in analysis fleet from MY 2022 to MY 2024, updating the modeling capability to allow for vehicle reclassification, updating the Scenarios Input File to set the value of civil penalties at zero,[21]
updating the Parameters Input File to set the monetary value of changes in non-criteria emissions at zero, updating other economic values, such as rebound elasticity and the payback periods, and updating fuel price projections using the 2026 Annual Energy Outlook's (AEO) Alternative Transportation and Electricity Case. These and other updates are described in more detail in Section II and the Final Technical Support Document (Final TSD).
NHTSA estimates that this final rule will reduce the average up-front vehicle costs due to CAFE standards by approximately $1,290, cutting by more than half what consumers might expect to pay as a result of increased requirements under the No-Action Alternative. NHTSA also estimates that this rule will be net beneficial economically for society.[22]
The tables below summarize estimates of the present discounted values of selected impacts viewed from both the model year and calendar year (CY) perspectives,[23]
for each of the regulatory alternatives, relative to the No-Action Alternative.
( printed page 62002)
The current estimates of costs and benefits are important considerations, performed as directed by E.O. 12866, and also serve as an informative data point in NHTSA's consideration of the factors that NHTSA is required to balance by statute when determining maximum feasible standards. NHTSA concludes, for the purposes of this final rule, that Alternative 3 is maximum feasible on the basis of these respective factors. NHTSA also considered several sensitivity cases by varying different inputs and concluded that, even when varying inputs resulted in changes to net benefits, those changes were not significant enough to alter the conclusion that Alternative 3 is maximum feasible.
Finally, NHTSA has computed “annualized” benefits and costs relative to the No-Action Alternative, as follows:
( printed page 62003)
Though NHTSA is prohibited from considering the availability of certain flexibilities in making its determination about the levels of CAFE standards that would be maximum feasible, manufacturers have a variety of flexibilities available to aid their compliance. NHTSA is finalizing certain changes to these flexibilities and other features of the CAFE program as shown in Table I-6, and as described further in Section VI of this preamble. NHTSA is also finalizing a technical amendment to update NHTSA's civil penalty for CAFE shortfalls in accordance with Public Law 119-21. Because NHTSA does not exercise any discretion in making the changes required by Public Law 119-21, NHTSA finds good cause, pursuant to 5 U.S.C. 553(b)(B), to make those changes without prior notice and opportunity for comment as such procedures are unnecessary. Accordingly, NHTSA is publishing this final rule without prior notice and comment. Discussion of this technical amendment is also found in Section VI of this preamble.
( printed page 62004)
( printed page 62005)
( printed page 62006)
The following sections of this preamble discuss a summary of the proposal and comments received, the technical foundation for NHTSA's analysis, the regulatory alternatives considered in this final rule, the estimated effects of the regulatory alternatives, the basis for NHTSA's conclusion that the final standards are maximum feasible, and NHTSA's approach to compliance and enforcement. The extensive record for this action consists of this final rule, a Final TSD, a Final Regulatory Impact Analysis (FRIA), and a Final Supplemental Environmental Impact Statement (Final SEIS), along with extensive analytical documentation, supporting references, and many other resources. Most of these resources are available on NHTSA's website, and other references not available on NHTSA's website can be found in the rulemaking docket, the docket number of which is listed at the beginning of this preamble.[26]
B. Overview of the Final Rule
1. Summary of the NPRM
In the NPRM, NHTSA proposed to amend the CAFE standards for passenger cars and light trucks for MYs 2022-2026 and MYs 2027-2031. NHTSA explained that it was proposing these amended standards to fulfill its statutory obligation to set CAFE standards at the maximum feasible level, and to do so in a manner that provides for a substantial recalibration of the program to comply with statutory constraints. This included explicitly excluding the fuel economy of alternative fuel and dual-fueled vehicles, such as battery-powered EVs and the electric operation of PHEVs, and compliance credits from the standard-setting analysis. The proposal was also consistent with E.O. 14148 and E.O. 14154, and the Secretarial memorandum titled “Fixing the CAFE Program.”
( printed page 62007)
NHTSA indicated that the agency did not incorporate EPA's non-criteria emissions standards into its proposal, as the EPA had then recently proposed to rescind its Endangerment Finding and all resulting greenhouse gas (GHG) emissions standards for light-, medium-, and heavy-duty vehicles and engines. NHTSA also explained that it was removing the consideration of California's Zero Emission Vehicle (ZEV) mandates and manufacturers' voluntary commitments to California from its standard-setting analysis. NHTSA concluded that its prior consideration of these programs and commitments in the analysis for the 2022 and 2024 final rules was inconsistent with the statute because the analysis considered alternative fueled vehicles and distorted the resulting CAFE standards for the model years regulated in those rules.
Based on the agency's updated analysis excluding those factors prohibited from consideration under subsection 32902(h) and considering the most up-to-date data available, NHTSA proposed fuel economy standards that increased from newly proposed MY 2022 standards at a rate of 0.5 percent per year through MY 2026, followed by a rate of 0.35 percent for passenger cars and 0.7 percent for light trucks in MY 2027, and 0.25 percent per year through MY 2031. In Section V of the NPRM, NHTSA outlined its legal justification for tentatively concluding that the proposed standards were maximum feasible, emphasizing its obligation to balance four statutory factors under EPCA: technological feasibility, economic practicability, the effect of other motor vehicle standards of the Government on fuel economy, and the need of the United States to conserve energy. The agency determined that prior CAFE standards established in 2020, 2022, and 2024 were set above the maximum feasible level because they considered factors prohibited by 49 U.S.C. 32902(h). To rectify this, NHTSA proposed to use EPCA's process to amend standards for previous model years not yet administratively closed to bring the CAFE program back into better alignment with statutory restrictions in a manner that does not penalize manufacturers for failing to meet standards established based upon the agency's prior analysis.[27]
When re-evaluating the four statutory factors with EPCA's statutory constraints in mind, NHTSA outlined that considering the factor of technological feasibility does not require the agency to set technology-forcing standards. This is particularly true when the factor of economic practicability cautions against establishing such standards. For economic practicability, the agency focused on consumer acceptance and affordability, and the financial capabilities of the industry to advance the fuel efficiency of gasoline- and diesel-powered vehicles. NHTSA also considered the safety implications of the CAFE program.
NHTSA is also required to weigh the effect of other motor vehicle standards of the Government that affect fuel economy. In so doing, NHTSA determined it could consider only standards of the Federal Government, explicitly excluding California's Advanced Clean Car Rule—which purports to establish separate State-law tailpipe carbon dioxide (CO2
) emissions standards and a ZEV mandate—from its analysis. NHTSA has always considered these programs as related to fuel economy,[28]
and even modeled their impact in previous CAFE rulemakings.[29]
But since EPCA specifically prohibits consideration of alternative fuel vehicle (AFV) technologies when establishing fuel economy standards, and expressly preempts any State laws related to fuel economy standards, NHTSA proposed to exclude consideration of these elements in its proposal. Finally, when assessing the need of the United States to conserve energy, NHTSA tentatively concluded that the dramatic change in exposure to petroleum supply shocks enabled by the recently established abundance of domestic energy resources since the shale oil revolution reduces the weight of this factor. The United States is now the world's largest petroleum producer by a large margin, and is now a net energy exporter; these are circumstances completely unimagined when EPCA was enacted in the 1970s—or even when amended by EISA in 2007. Consequently, while the factor is afforded significant consideration, NHTSA asserted that the need to conserve energy now warranted less stringent standards that increased at smaller, steady, and incremental rates.
Ultimately, NHTSA tentatively concluded that the previous rules distorted the marketplace by leveraging the CAFE program to push automakers to produce EVs faster than market demand would support. The agency stated that this forced transition undermined national security by increasing America's strategic dependence on foreign countries for critical EV battery materials, degraded highway safety by making new vehicles unaffordable and thereby slowing the fleet transition to newer and safer vehicles, and exacerbated the vulnerabilities of America's electricity grid. By eliminating the consideration of these factors, NHTSA tentatively concluded that the proposed reset represented the maximum feasible levels for the gasoline- and diesel-powered fleets.
NHTSA also proposed a substantial reclassification of the light-duty fleet to distinguish passenger cars more appropriately from light trucks, elimination of the inter-manufacturer credit trading program, and removal of AC/OC FCIVs from the standard-setting analysis. The agency justified its vehicle reclassification proposal by discussing the ways past standards incentivized manufacturers to alter vehicle attributes to classify passenger-oriented vehicles as light trucks to obtain the advantages of lower fuel economy standards. Specifically, NHTSA observed that manufacturers classified vehicles as light trucks designed for off-road purposes through existing ground clearance criteria while simultaneously retaining low, aerodynamic approach angles that severely limited real-world off-highway capability. To address this distortion, NHTSA proposed transitioning from technology-based specifications of non-passenger automobiles to performance-based criteria. This proposed change included eliminating axle clearance, a now defunct characteristic defined by a specific suspension technology, as a defining characteristic for high ground clearance and requiring vehicles to meet all four of the remaining clearance characteristics. NHTSA also proposed removing the non-passenger classification criterion for vehicles with three or more rows of seating, stating that this feature primarily indicated a passenger-carrying purpose rather than cargo transport. To ensure that vehicles used for transporting property will be classified correctly without relying on passenger-based design elements, NHTSA proposed adding a new performance-based light-duty work factor (LDWF) metric.
( printed page 62008)
The agency also noted that the combination of inappropriately stringent standards and the credit trading system has increasingly incentivized ICE vehicle manufacturers to purchase credits from EV manufacturers to meet requirements, effectively subsidizing EV production without any increase in the fuel efficiency of the internal combustion fleet. Accordingly, NHTSA proposed to remove the credit trading program starting in MY 2028. By eliminating credit trading, the agency intended to encourage manufacturers to make steady, real-world fuel economy improvements across their own fleets of gasoline- and diesel-fueled vehicles. Finally, NHTSA proposed to eliminate AC/OC FCIVs from the standard-setting analysis, tentatively determining that the current FCIVs based on MY 2008 vehicle assessments, are no longer representative of real-world fuel savings and have created market distortions by incentivizing technologies that failed to provide commensurate fuel economy benefits.
NHTSA sought comment on a range of alternatives, including a No-Action Alternative and three action alternatives for each time period covered by this rulemaking (MYs 2022-2026 and MYs 2027-2031). NHTSA also sought comment on all aspects of the proposal, including the accompanying Draft SEIS and the Paperwork Reduction Act information collections. The agency requested feedback on several foundational legal and compliance assumptions, including whether Congress granted authority under EPCA to consider environmental effects when setting standards, whether an EIS is required under NEPA for standard setting in light of recent case law, and the assumption that manufacturers will make maximum practicable efforts to comply despite the newly enacted $0 CAFE civil penalty rate. Further, NHTSA requested comment on its proposals to end credit trading by MY 2028, the impact of the $0 penalty on credit values, and the agency's determination that FCIVs for AC/OC technologies no longer represent real-world fuel savings and should be removed.
The agency's requests for comments also focused on its economic and consumer behavior modeling. NHTSA sought comment on its updated 36-month payback assumption, sales elasticity estimate of −0.4 (and whether to apply separate short- and long-run elasticities), and the variables and methodology used in its scrappage module. NHTSA also asked whether it should remove the vehicle miles traveled (VMT) constraint across alternatives to account for mode shift, how best to account for the rebound effect, and whether it is accurate to assume drivers internalize 90 percent of the safety risk associated with rebound driving. In addition, NHTSA requested feedback on its estimation of opportunity costs, how best to incorporate vehicle affordability, alternative presentations of lifetime fuel savings that account for multiple vehicle owners, and an alternative cost-benefit analysis approach based upon using revealed consumer preference. The agency even requested feedback on whether manufacturers might simply install larger fuel tanks to limit increases in vehicle refueling frequency, and it requested data to quantify repair and maintenance costs.
Finally, NHTSA sought detailed technical feedback on its fleet data and emissions modeling, including its use of EPA's MOVES5 model for criteria emissions and brake and tire wear (BTW), as well as requests for better macroeconomic data sources or alternative approaches to its labor analysis. To support review of vehicle classification and standard-setting functions, the agency asked for input on its updated footprint curve shape analysis and whether there is a distinguishable overlap between 4WD and AWD technologies when determining off-highway classification. NHTSA also requested that stakeholders identify any missing data or errors in the MY 2024 analysis fleet dataset used as the starting point for the CAFE Model.
NHTSA estimated that the proposal would reduce the average upfront vehicle costs due to CAFE standards by approximately $900, cutting in half the increased cost consumers might expect to pay under the No-Action Alternative. NHTSA also estimated that the proposed standards would be net beneficial for society, projecting positive net benefits of $24.0 billion at a three percent discount rate and $22.2 billion at a seven percent discount rate, using a model year-based analysis.
The proposal was based upon an accompanying Preliminary Regulatory Impact Analysis (PRIA), a Draft Supplemental Environmental Impact Statement (Draft SEIS), a Draft Technical Support Document (Draft TSD), and other technical documentation, including documentation for the CAFE Model and Argonne's CAFE Autonomie modeling.
2. Public Participation Opportunities and Summary of Comments
The NPRM, with an accompanying Draft SEIS, was published on NHTSA's website on December 3, 2025, and in the
Federal Register
on December 5, 2025.[30]
Publication in the
Federal Register
began a 45-day comment period allowing the public to submit comments regarding the NPRM and Draft SEIS on or before January 20, 2026. On January 14, 2026, NHTSA announced a 15-day extension to the comment period for the NPRM and Draft SEIS, ending the comment period on February 4, 2026.[31]
A separate
Federal Register
notice was published on December 12, 2025, that announced a virtual public hearing taking place across multiple days starting on January 7, 2026.[32]
Approximately 78 individuals and organizations signed up to participate in the hearing. The hearing started at 9:00 a.m. EDT on January 7, 2026 and ended at approximately 2:40 p.m., after hearing from the entire list of participants, and resulting in a 70-page transcript.[33]
NHTSA also received many pages of comments from participants, in addition to the hearing transcript, all of which were submitted to the docket for the rule.
NHTSA received a total of 68,294 comments in the docket for the proposed rule (Docket No. NHTS-2025-0491) and 2,695 comments in the docket for the Draft SEIS (Docket No. NHTSA-2025-0490).
NHTSA received comments on the proposal from a diverse range of stakeholders, including vehicle manufacturers, automotive suppliers, trade associations, environmental and public health non-governmental organizations (NGOs), State and local governments, Members of Congress, and individual citizens. Commenters expressed divided views on the agency's proposed recalibration of the CAFE standards and other proposed compliance provisions.
Many vehicle manufacturers, States, energy companies, and energy industry trade associations supported the proposal. Commenters supporting the proposal, such as the U.S. Chamber of Commerce, the Alliance for Automotive Innovation (The Alliance), and the American Petroleum Institute (API), commented in support of NHTSA's realigning the CAFE program with EPCA's statutory limitations. These commenters agreed with NHTSA's decision to exclude the imputed fuel
( printed page 62009)
economy of EVs and the electric operation of PHEVs from the baseline and maximum feasibility determinations. Automakers, ranging from Volkswagen Group of America (Volkswagen) to Jaguar Land Rover (JLR) to Mazda North American Operations (Mazda), commented that the proposed reset would provide a stable and achievable regulatory framework that avoids forcing manufacturers to divert essential capital away from innovation toward meeting unrealistic requirements. Other supporters of the proposal, such as the National Automobile Dealers Association (NADA) and the Congressional Western Caucus, commented that the proposed stringency levels reflect current automotive market realities, and would help lower the upfront purchase price of new vehicles. Fuel industry groups noted the proposal properly re-incentivizes investments and innovation in advanced ICE technologies and compatible liquid fuels.
Conversely, many environmental NGOs, other States, and a group of Members of Congress commented in opposition to the proposal, arguing that EPCA mandates NHTSA to set standards at maximum feasible levels to achieve energy conservation, and that the proposed standards fail to do so. Several stakeholders, including the Southern Environmental Law Center, the American Council for an Energy-Efficient Economy (ACEEE), and Our Children's Trust (OCT), noted that the proposed MY 2031 standard of 34.5 mpg is lower than the 35.4-mpg average achieved by the light-duty fleet in MY 2024. These commenters asserted that NHTSA's exclusion of EVs and PHEVs in its baseline analysis relies on an incomplete and artificially low status quo, resulting in standards that are significantly weaker than what automakers are capable of producing. Furthermore, a coalition of Attorneys General argued that the proposal's rationale is pretextual and improperly shaped by Executive Orders aimed at promoting fossil fuel use at the expense of zero-emission technologies.
Opponents also highlighted alleged economic and environmental harms associated with less stringent standards. The National Association of Clean Air Agencies (NACAA) and the U.S. Conference of Catholic Bishops (USCCB) noted that, although the proposal claims to reduce average upfront vehicle costs, these savings would be more than offset by increased long-term fuel expenditures, which disproportionately impact lower-income households. Environmental groups and individual citizens emphasized that the proposed standards would lead to increased emissions of so-called GHGs and criteria pollutants, exacerbating climate change and harming public health and national parks. In addition, opponents commented that reducing the stringency of CAFE standards would undermine American innovation, global competitiveness, and job growth in the advanced electric powertrain sector.
In other areas, commenters expressed views on the specific compliance and structural changes proposed. For example, one individual commenter supported the proposal to eliminate the inter-manufacturer credit trading program, agreeing that manufacturers should achieve compliance within their own fleets. SEMA, PMI, and Manufacturers of Emission Controls Association (MECA) voiced support for the agency's proposed modifications to vehicle classifications within the CAFE program. Other commenters raised concerns about the timing and effects of the proposed vehicle reclassification.
NHTSA appreciates the robust public participation and the extensive, detailed feedback provided by a diverse range of stakeholders regarding the proposed recalibration of the CAFE standards. After a comprehensive review of comments and underlying data associated with those comments, in addition to other information the agency updated for the analysis, NHTSA has carefully reconsidered the stringency of the proposed standards. The agency balanced the statutory factors specified by EPCA—with particular focus on the need of the United States to conserve energy and the economic practicability of the standards. Based on this thorough evaluation, the agency has determined that somewhat more stringent standards than originally proposed represent maximum feasible fuel economy levels, capturing additional energy savings while maintaining a sustainable compliance pathway for manufacturers. Accordingly, in this final rule, NHTSA is adopting the NPRM's proposed Alternative 3 standards as the final light-duty vehicle fuel economy standards for the model years in question, subject to certain adjustments.
In addition to adjusting the final mathematical standards, NHTSA evaluated feedback concerning the structural and compliance changes detailed in the proposal, such as the elimination of the inter-manufacturer credit trading program and the modifications to vehicle classification provisions. In response to substantive comments highlighting the need for adequate industry lead time and regulatory certainty to prevent market disruptions, the agency has modified its original timeline and deferred the implementation of the vehicle reclassification proposal to MY 2030. The agency has also made adjustments in the final standards to mitigate the unintended consequences of the transition to the reclassified fleets. In addition, the final rule provides that, while manufacturers will no longer be able to generate tradable credits starting with MY 2028, credits generated through MY 2027 will remain tradable and applicable for up to five model years as provided in existing regulations.
NHTSA received numerous other substantive comments concerning its technical analysis, baseline assumptions, legal interpretations, and economic modeling. Detailed responses to these issues, along with the agency's final legal and technical determinations, are integrated and discussed throughout the relevant sections of this final rule preamble and accompanying documentation.
3. Changes to the CAFE Model in Light of Public Comments and New Information
As with all prior CAFE rules, NHTSA appreciates all comments received on the NPRM, because they are critical for gathering additional information that can inform the agency about aspects or effects of the proposal that the agency may not have considered at the time the proposal was issued. Comments can identify potential necessary analytical corrections, or provide understanding of stakeholder positions. The views, data, requests, and suggestions contained in the comments helped NHTSA to make appropriate adjustments to the agency's proposals to ensure that the final standards are reasonable throughout the timeframe covered by the rulemaking. For this final rule, the agency made substantive changes and corrections based on the suggestions and recommendations from commenters, as well as new information obtained since the time the proposal was developed. These changes reflect DOT's long-standing commitment to ongoing refinement and improvement of its approach to estimating the potential impacts of new CAFE standards. Through further consideration and deliberation, and also in response to public comments received, NHTSA has made a number of changes to the CAFE Model since the 2025 NPRM, including those that are listed below and detailed in Section II, as well as in the Final TSD and FRIA that accompany this final rule.
Following the 2024 final rule, NHTSA made several updates to the CAFE
( printed page 62010)
Model specifically for the proposed rule. Within the Market Data Input File, the agency updated its analysis fleet from MY 2022-2024, incorporated vehicle reclassification functionality, and included advanced truck credits for MY 2024, though the agency noted these credits sunset after that single year. To align with its recalibrated standard-setting approach, NHTSA updated the Model's algorithms and settings to remove statutorily prohibited inputs, to allow toggling between constrained and unconstrained analyses, to enable vehicle reclassification modeling, and to exclude PHEV electricity usage when those vehicles are operating in gasoline-only mode. The Scenarios Input File was also modified to phase out AC/OC FCIVs, to adjust the phase-out timeframe for 45X, 30D, and 45W tax credits, and to set civil penalties to zero. In addition, the agency updated numerous economic assumptions: it shifted the base dollar year from 2021 to 2024, implemented a bracketed costing approach for five levels of mass reduction, set the social cost of carbon to zero, and updated the rebound elasticity, payback period, and value of travel time. Default MOVES5 assumptions were used for emissions rates, and numerous other updates were made based on the 2025 AEO.
For the final rule analysis, NHTSA implemented further refinements based on public comments, newly identified issues, and minor errors. The Market Data Input File was revised to address stakeholder feedback and to reflect a change in the implementation year for vehicle reclassification. The Scenarios Input File was updated to incorporate changes stemming from the petroleum equivalency factor (PEF) interim final rule and to adjust the 45X battery tax credit implementation through 2032. Furthermore, economic and emissions parameters were refreshed using the 2026 AEO, GREET 2025 emissions rates, and updated MOVES5 inputs.
NHTSA also made several structural modifications to the CAFE Model software itself for the final rule. These included expanding emissions reporting to distinguish between domestic and global quantities, refining battery tax credit calculations to utilize per-vehicle battery capacity based on Argonne simulation data, and adjusting the calculation of forgone consumer sales surplus so as properly to include vehicle and battery tax credits while fixing a minor calculation error. In addition, the agency improved its insurance cost calculations by transitioning from a sales-weighting method to weighting based on the surviving fleet at each vehicle age. NHTSA also made various adjustments to enable additional sensitivity case analyses, which are discussed in FRIA Chapter 9. Ultimately, these extensive updates reflect NHTSA's longstanding commitment to continually improving how it estimates the potential impacts of new CAFE standards, with further details provided throughout this preamble and associated technical documents.
4. Final Standards—Stringency
NHTSA is setting CAFE standards for passenger automobiles and non-passenger automobiles manufactured for sale in the United States in MYs 2022-2026 and MYs 2027-2031. Passenger automobiles are generally sedans, station wagons, and some crossovers and sport utility vehicles (CUVs and SUVs), and non-passenger automobiles are generally 4WD SUVs designed for offroad use, pickups, and passenger/cargo vans.[34]
NHTSA is setting fuel economy standards for passenger automobiles that increase from the newly finalized MY 2022 standards at a rate of 0.90 percent per year through MY 2029 followed by one percent per year through MY 2031, with MY 2030 stringency acting as a bridge between the vehicle classification updates. For non-passenger automobiles, NHTSA is setting fuel economy standards that increase from the newly finalized MY 2022 standards at a rate of 0.51 percent per year through MY 2029 followed by one percent per year through MY 2031, with MY 2030 stringency acting as a bridge between vehicle classification updates.[35]
The final standards, like the proposed standards, are defined by a mathematical equation that relates vehicle footprint to fuel economy targets for both passenger cars and light trucks.[36]
Graphical representations of the target curves for passenger cars and light trucks for MY 2022-2031 are presented in Figure I-1 and Figure I-2 below. NHTSA underscores that the equations and coefficients defining the curves are, in fact, the CAFE standards, and not the mpg numbers that the agency currently estimates could result from manufacturers' complying with the standards. To give context for what the passenger automobile footprint curve is showing in Figure I-1, for MY 2022 the smallest passenger automobile footprint is 43 sq. ft., and the target fuel economy is 39.6 mpg. For MY 2031 the smallest footprint vehicle is 46 sq. ft. and has a target of 43.05 mpg.
( printed page 62011)
For the non-passenger automobile footprint curve shown in Figure I-2, the largest footprint is 74 sq. ft., and the target fuel economy would be 21.7 mpg for MY 2022. And in MY 2031, for the same largest footprint, the target is 23.0 mpg. The smallest footprint non-passenger automobile targets would be 37.3 mpg at 42 sq. ft., and 29.5 mpg at 52 sq. ft., for MYs 2022 and MY 2031 respectively.
( printed page 62012)
NHTSA has also amended the minimum domestic passenger car standard (MDPCS) for MY 2022-2031. Section 32902(b)(4) of 49 U.S.C. requires NHTSA to project the MDPCS when it promulgates passenger car standards for a model year, as a result the MDPCSs are established as specific mpg values. NHTSA used a direct estimate for MY 2022-2026 and estimated from analysis values for MYs 2027-2031. NHTSA retained the proposed 0.7-percent offset to the MDPCS values estimated from the analysis for MYs 2027-2031 to account for recent projection errors as part of estimating the total passenger car fleet fuel economy. The final MDPCS values for MYs 2022-2031 are presented above in Table I-3.
5. Final Standards—Impacts
As with past rulemakings, NHTSA has used the CAFE Model to estimate the effects of the final CAFE standards and other regulatory alternatives under consideration. Some inputs to the CAFE Model are derived from other models, such as Argonne National Laboratory's (Argonne) “Autonomie” vehicle simulation tool and Argonne's “GREET” fuel-cycle emissions analysis model, the National Energy Modeling System (NEMS) of the U.S. Energy Information Administration's (EIA's), and EPA's Motor Vehicle Emission Simulator (MOVES) vehicle emissions model. Given the temporal scope of the NHTSA's analysis (through MY 2050, with driving of MY 2031 vehicles accounted for through CY 2070), these inputs are subject to a multitude of uncertainties including future population and economic growth, future gasoline and electricity prices, future petroleum market characteristics (
e.g.,
imports and exports), future manufacturer responses to standards and fuel prices, future buyer responses to changes in vehicle prices and fuel economy levels, and future emission rates for “upstream” processes (
e.g.,
fuel refining and finished fuel transportation). As a result, NHTSA underscores that all results of this analysis are subject to some degree of uncertainty but represent the agency's best estimates based on the information currently before the agency and on the agency's reasonable judgment.
NHTSA estimates that this final rule would increase the eventual average of manufacturers' CAFE requirements to about 34.9 mpg by MY 2031 rather than an average of about 49.3 mpg under the No-Action Alternative (
i.e.,
the standards issued in 2024). For passenger cars, the average in MY 2031 is estimated to reach 40.2 mpg, and for light trucks, 26.4 mpg. This compares with 65.8 mpg and 45.4 mpg for passenger cars and light trucks, respectively, under the No-Action Alternative. NHTSA notes that the significant downward shift in required fuel economy stringency beginning in MY 2030 is reflective of the fleet reclassification that moves lighter crossovers from the light truck fleet to the passenger car fleet—necessarily reducing the fuel economy performance of both fleets.
A key indicator of individual, or consumer, cost effects for the analysis is the per-vehicle regulatory cost. The regulatory cost represents the sum of vehicle costs caused by changes in vehicle technology and any fines incurred by manufacturers due to shortfalls in meeting the standards. Under current law there are no fines for manufacturer shortfalls, and therefore, only technology costs are incurred in this analysis. As summarized in Table I-8, NHTSA projects that under the final rule, technology costs, summed over the entire fleet, could decrease by $15.3 billion relative to the No-Action Alternative for MY 2031, assuming all manufacturers will attempt to meet standards with all practicable effort. If those savings are passed on to consumers, NHTSA estimates that per-vehicle costs for new vehicles would be reduced by $1,289 for MY 2031, on average, compared to the No-Action Alternative.
Under all regulatory alternatives considered, including the Final Preferred Alternative, absolute fleetwide fuel consumption is projected to decline over time. While the Final Preferred Alternative is estimated to result in a 4.6-percent increase in gasoline consumption through CY 2050 when measured against the No-Action baseline, this relative difference does not negate the broader, macro-level reductions in aggregate fuel use. Rather, due to continuous technological improvements and the steady retirement of older, less efficient vehicles through fleet turnover, the long-term energy conservation trajectory of the light-duty fleet remains intact under the finalized standards. Figure I-3 shows the total change in gasoline energy use in comparison to the No-Action Alternative.37
( printed page 62013)
NHTSA measures and reports benefits and costs from changes in fuel economy and efficiency standards from two different perspectives. First, the agency's “model year” perspective focuses on the benefits and costs of establishing alternative CAFE standards for MYs 2027-2031, and measures these over the lifetime of vehicles in each separate model year. The “calendar year” perspective includes the annual impacts attributable to all vehicles in the registered passenger car and light truck fleet estimated to be in service in each calendar year covered in the analysis. For this final rule, this calendar year perspective covers each of CYs 2024-2050. Compared to the model year perspective, the calendar year perspective includes model years of vehicles produced after those model years for which standards are being finalized, under the assumption that the MY 2031 standards remain in place for MY 2032 and beyond. The strengths and limitations of each accounting perspective are discussed in detail in FRIA Chapter 5.
With benefits and costs discounted at three percent and estimates attributable to vehicles produced during and prior to MY 2031 over the course of their lives, NHTSA estimates that monetized reduction of costs and benefits would be approximately $137.5 billion and $95.8 billion, respectively, relative to the No-Action baseline. This results in an estimated present value of aggregate monetized net benefits to society of approximately $41.8 billion. With benefits and costs discounted at seven percent, NHTSA estimates approximately a reduction of approximately $96.9 billion in monetized costs and $60.5 billion in monetized benefits, such that the present value of aggregate net monetized benefits to society would be approximately $36.3 billion.
With benefits and costs discounted at three percent and calculated for the full on-road light-duty fleet over CYs 2024-2050, NHTSA estimates that the monetized reduction of costs and benefits would be approximately $502.7 billion and $343.5 billion, respectively, such that the present value of aggregate monetized net benefits to society would be approximately $159.2 billion. With benefits and costs discounted at seven percent, NHTSA estimates reductions of
( printed page 62014)
$283.1 billion in monetized costs and $185.3 billion in monetized benefits, such that the present value of aggregate net monetized benefits to society could be approximately $97.8 billion.
6. Final Standards Are Maximum Feasible
NHTSA's conclusion, after consideration of the factors described in this document and information in the administrative record for this action, is that that maximum feasible standards for passenger automobiles for MYs 2022-2031 are the newly finalized MY 2022 standards, increasing at a rate of 0.90 percent per year through MY 2029 followed by one percent per year through MY 2031, with the MY 2030's adjusted stringency acting as a bridge between the vehicle classification updates. Maximum feasible standards for non-passenger automobiles are an increase from the newly finalized MY 2022 standards at a rate of 0.51 percent per year through MY 2029 followed by one percent per year through MY 2031, again with the adjusted MY 2030 stringency acting as a bridge between vehicle classification updates.[38]
DOT is committed to improving the affordability of light-duty vehicles while maintaining a reasonable level of fuel economy, removing market distortions caused by overly aggressive prior standards and program elements, such as FCIVs, and inappropriate classification criteria, and resetting the CAFE program in compliance with the statute. NHTSA has concluded that, in light of present and forecast economic, technological, and energy circumstances, the Alternative 3 proposed in the NPRM, subject to certain adjustments described below, will best achieve the standards which are technologically feasible, are economically practicable, accurately consider the effect of other motor vehicle standards of the Government on fuel economy, and appropriately address the need of the United States to conserve energy, as mandated by Congress.
II. Technical Foundation for the Final Rule Analysis
A. Why is NHTSA conducting this analysis?
When NHTSA promulgates new regulations or amends its existing regulations, it generally presents an analysis that estimates the impacts of those regulations, including the impacts of other regulatory alternatives it considered during the rulemaking. These analyses derive from statutes such as the APA [39]
and the NEPA,[40]
from Executive Orders (such as E.O. 12866),[41]
and from other administrative guidance (
e.g.,
Office of Management and Budget (OMB) Circular A-4).[42]
NHTSA's authorizing statute for fuel economy regulations, the Energy Policy and Conservation Act of 1975 (EPCA), as amended, contains several requirements governing the scope and nature of fuel economy standard setting.[43]
Among these, some have been in place since EPCA was first signed into law in 1975, some were added in the Alternative Motor Fuels Act of 1988 (AMFA) [44]
and in the Energy Policy Act of 1992,[45]
and others were added in 2007 when Congress passed EISA.[46]
Most recently, the One Big Beautiful Bill Act (OB3) amended EPCA's civil penalty provisions.[47]
These statutes contain a variety of requirements for which NHTSA seeks to account in its analysis. NHTSA captures all of these requirements by presenting an analysis that spans a meaningful range of regulatory alternatives; that quantifies a range of technological, economic, and environmental impacts; and that does so in a manner that accounts for various express statutory requirements for the CAFE program (
e.g.,
passenger cars and light trucks must be regulated separately; and the standard for each fleet must be set at the maximum feasible level in each model year). NHTSA's standards are thus supported, though not dictated, by extensive analysis of potential impacts of the regulatory alternatives under consideration. Together with this preamble, a Final TSD, a FRIA, and a Final SEIS provide a detailed enumeration of related analysis methods, estimates, assumptions, and results. These additional analyses can be found in the rulemaking docket for this final rule and on NHTSA's website.[48 49]
This section provides further detail on the key features and components of NHTSA's standard-setting (also known as “constrained”) analysis. NHTSA's standard-setting analysis reflects statutory limitations on what NHTSA
( printed page 62015)
can consider when determining maximum feasible CAFE standards. In determining maximum feasible fuel economy levels, “the Secretary of Transportation—(1) may not consider the fuel economy of dedicated automobiles; (2) shall consider dual-fueled automobiles to be operated only on gasoline or diesel fuel; and (3) may not consider, when prescribing a fuel economy standard, the trading, transferring, or availability of credits.” [50]
NHTSA also conducts an “unconstrained” CAFE Model analysis to evaluate, as required by NEPA, the reasonably foreseeable environmental effects of its proposed action and a reasonable range of alternatives that meet the purpose and need for the proposed action.[51]
The technical assumptions for EIS simulations are discussed in the Final SEIS Appendix D.
This section also describes how NHTSA's analysis has been constructed specifically to reflect other governing law applicable to CAFE standards, reviews how NHTSA's analysis has been updated to adhere to relevant statutory provisions, and describes additional technical work recently conducted by the agency. The analysis for this final rule aids NHTSA in implementing its statutory obligations, including the weighing of various considerations, by informing decision-makers about the estimated effects of different regulatory alternatives.
1. What are the key components of NHTSA's analysis?
NHTSA's analysis makes use of a range of data (
i.e.,
observations of things that have occurred), estimates (
i.e.,
things that are unknown or may occur in the future), and models (
i.e.,
methods for making estimates). Two examples of
data
include (1) records of actual odometer readings used to estimate annual mileage accumulation at different vehicle ages and (2) CAFE compliance data used as the foundation for the “reference fleet” containing, among other things, production volumes and fuel economy levels of specific configurations of specific vehicle models produced for sale in the United States. Two examples of
estimates
include (1) forecasts of future gross domestic product (GDP) growth used, with other estimates, to forecast future vehicle sales volumes and (2) technology cost estimates, which include estimates of the technologies' “direct cost,” marked up by a “retail price equivalent” factor, to estimate the ultimate cost to consumers of a given fuel-saving technology, and an estimate of “cost learning effects” (
i.e.,
the tendency that it will cost a manufacturer less to apply a technology as the manufacturer gains more experience doing so).
In coordination with the DOT Volpe National Transportation Systems Center (Volpe or the Volpe Center), NHTSA uses the CAFE Compliance and Effects Modeling System (CAFE Model or the Model) to simulate and analyze manufacturers' potential responses to new CAFE standards and to estimate various impacts of those responses. NHTSA has used the CAFE Model to perform analyses supporting every CAFE rulemaking since 2001. Working together, NHTSA and Volpe ensure that the CAFE Model's operation reflects the statutory directives discussed in more detail in the remainder of this section.
The CAFE Model first estimates how vehicle manufacturers might respond to a given regulatory scenario; from that potential compliance solution, the system estimates what impact that response will have on fuel consumption, emissions, safety impacts, and economic externalities. The following section summarizes information necessary to understand the analysis, while Final TSD Chapter 2 and the CAFE Model Documentation present additional details on the Model's operation.
The CAFE Model may be characterized as an integrated system of models that estimate the impact of various policy options. For example, one model estimates manufacturers' responses, another estimates resultant changes in total vehicle sales, and still another estimates resultant changes in fleet turnover (
i.e.,
scrappage). More importantly, the modeling system does not determine the form or stringency of the standards, which must be developed in consideration of statutory factors that must be balanced by policy-makers. Instead, the CAFE Model applies inputs specifying the form and stringency of standards to be analyzed and produces outputs showing the impacts of manufacturers working to meet those standards, which become part of the basis for comparing different potential stringencies. A regulatory scenario, meanwhile, involves specification of the form, or shape, of the standards (
e.g.,
flat standards, or linear or logistic attribute-based standards), scope of passenger car and light truck regulatory classes, and stringency of the standards for each model year to be analyzed. For example, a regulatory scenario may define standards for a particular class of vehicles that increase in stringency by a given percent per year for a given number of consecutive years.
Manufacturer compliance simulation and the ensuing effects estimation, collectively referred to as compliance modeling, encompass numerous subsidiary elements. Compliance simulation begins with a detailed user-provided initial forecast of the vehicle models offered for sale during the simulation period.[52]
The compliance simulation then attempts to bring each manufacturer into compliance with the standards defined by the regulatory scenario contained within an input file developed by the user.
Estimating impacts involves calculating resulting changes in new vehicle costs, estimating a variety of costs (
e.g.,
for fuel expenditures or reduced or increased technology costs) and effects (
e.g.,
gallons of fuel used by the fleet) occurring as vehicles are driven over their lifetimes before eventually being scrapped, and estimating the monetary value of these effects. Estimating impacts also involves consideration of consumer responses (
e.g.,
the impact of vehicle fuel economy, operating costs, and vehicle price on consumer demand for light-duty vehicles). Both basic analytical elements involve the application of many inputs. Many of these inputs are developed outside of the Model and not by the Model. For example, the Model applies fuel price projections from DOE's EIA; it does not estimate fuel prices.
NHTSA also uses EPA's Motor Vehicle Emission Simulator (MOVES) model to estimate “vehicle” or “downstream” emission factors for criteria pollutants [53]
and uses four DOE and DOE-sponsored models to develop inputs to the CAFE Model, including three developed and maintained by DOE's Argonne National Laboratory (Argonne). The agency uses the NEMS from EIA to estimate fuel prices [54]
and uses Argonne's Greenhouse gases, Regulated Emissions, and Energy use in Transportation (GREET) Model to
( printed page 62016)
estimate emissions rates from fuel production and distribution processes.[55]
DOT also sponsors Argonne to run its Autonomie full-vehicle modeling and simulation system to estimate the fuel economy impacts for over a million combinations of technologies and vehicle types.[56]
The Final TSD and FRIA describe details of the agency's use of these models. In addition, as discussed in the Final SEIS accompanying this final rule, NHTSA relied on a range of models to estimate various environmental impacts.
To prepare for the analysis supporting this final rule, DOT continued to refine and expand the capabilities of the CAFE Model. As examples, and as discussed in more detail below, the reference fleet uses mid-MY 2024 compliance data (the most recent available high-quality data at the time of the analysis) and includes the capability (in addition to capabilities integrated into the modeling system) to account for changes to regulatory vehicle classification definitions. The analysis also employs separate input files for the modeling runs that NHTSA uses for its standard-setting analysis (
i.e.,
the constrained analysis), which excludes the 49 U.S.C. 32902(h) factors that NHTSA cannot consider, and the modeling runs that NHTSA uses for its analysis of impacts under NEPA (
i.e.,
the unconstrained analysis), which does not exclude the 49 U.S.C. 32902(h) factors, and those input files have been updated accordingly. Common to both analyses are routine updates to dollar year values (
e.g.,
2021$ to 2024$) and routine updates to gas price projections. Some other updates, like updates to manufacturer credit banks, are confined to the unconstrained analysis only and are discussed further in the Final SEIS Appendix D. The values of many inputs remain uncertain, and NHTSA has conducted sensitivity analyses around selected inputs to attempt to capture some of that uncertainty. These changes reflect the agency's long-standing commitment to ongoing refinement of its approach to estimating the potential impacts of new CAFE standards. These and other updated analytical inputs are outlined in Section II below and discussed in detail in the Final TSD and FRIA.
2. How do statutory requirements shape NHTSA's analysis?
Multiple requirements govern the scope and nature of CAFE standard setting; the specific requirements regarding the technical characteristics of CAFE standards and the analysis thereof include, but are not limited to, the following:
Corporate Average Standards:49 U.S.C. 32902 requires that standards apply to the average fuel economy levels achieved by each manufacturer's fleet of vehicles produced for sale in the United States. The CAFE Model calculates the CAFE fuel economy of each manufacturer's fleet based on estimated production volumes and characteristics, including fuel economy levels, of distinct vehicle models that could be produced for sale in the United States.
Separate Standards for Passenger and Non-Passenger Automobiles:49 U.S.C. 32902 requires DOT to set separate CAFE standards for passenger automobiles and non-passenger automobiles. The CAFE Model accounts for passenger and non-passenger automobiles separately, including differentiated standards and compliance.
Attribute-Based Standards:49 U.S.C. 32902 requires DOT to define CAFE standards (separately for passenger and non-passenger automobiles) as mathematical functions expressed in terms of one or more attributes related to fuel economy. This means that, for a given manufacturer's fleet of vehicles produced for sale in the United States in a given regulatory class and model year, the applicable minimum CAFE requirement (
i.e.,
the numerical value of the requirement) is computed based on the applicable mathematical function as well as the mix and attributes of vehicles in the manufacturer's fleet. The CAFE Model accounts for such functions and vehicle attributes explicitly.
Separately Defined Standards for Each Model Year:49 U.S.C. 32902 requires DOT to set CAFE standards (separately for passenger and non-passenger automobiles) at the maximum feasible levels in each model year. The CAFE Model represents each model year explicitly and accounts for the production relationships between model years. For example, a new engine first applied to a given vehicle model/configuration in MY 2030 will most likely be retained in MY 2031; that same vehicle model reflects the fact that manufacturers do not apply brand-new engines to a given vehicle model every year.
Separate Compliance for Domestic and Imported Passenger Car Fleets:49 U.S.C. 32904 requires the U.S. EPA to determine CAFE compliance for each manufacturer's fleet of domestic passenger cars and imported passenger cars separately. A passenger car is domestic or import based on the definitions provided in 49 U.S.C. 32904. The CAFE Model accounts explicitly for this requirement when simulating manufacturers' potential responses to CAFE standards.
Minimum CAFE Standards for Domestic Passenger Car Fleets:49 U.S.C. 32902 requires that domestic passenger car fleets also meet a minimum CAFE standard, which is calculated as 92 percent of the average fuel economy projected by the Secretary for the combined domestic and non-domestic passenger automobile fleets manufactured for sale in the United States by all manufacturers in the model year. This projection is published at the time the standard is promulgated. The CAFE Model accounts explicitly for this requirement.
Statutory Basis for Stringency:49 U.S.C. 32902 requires DOT to set CAFE standards for passenger and non-passenger automobiles at the maximum feasible levels, determined by considering technological feasibility, economic practicability, the need of the U.S. to conserve energy, and the impact of other motor vehicle standards of the Federal Government on fuel economy. The analysis and balancing of these factors necessarily change in light of current and projected economic and market conditions. Accordingly, NHTSA has continued to expand and refine its qualitative and quantitative analysis to account for these statutory factors considering such conditions. For example, the simulations of technology effectiveness reflect the agency's judgment that it would not be economically practicable, appropriate, or cost effective for a manufacturer to “split” an engine shared among many vehicle models/configurations into myriad versions each optimized to a single vehicle model/configuration.
Civil Penalties for Noncompliance:49 U.S.C. 32912 (and implementing regulations) prescribe a rate (in dollars per tenth of a mile per gallon) at which the Secretary is to levy civil penalties if a manufacturer fails to comply with a
( printed page 62017)
CAFE standard for a given fleet in a given model year. When civil penalties are applicable, the CAFE Model will calculate civil penalties for CAFE shortfalls. Statutory civil penalties were set to $0 by OB3, Public Law 119-21 (July 4, 2025), so NHTSA did not use the CAFE Model to calculate civil penalties for the NPRM or this final rule.
Dual-Fueled and Dedicated Alternative Fuel Vehicles:
For purposes of calculating CAFE levels used to determine passenger and non-passenger automobile fleet compliance, 49 U.S.C. 32905 and 32906 specify methods for calculating the fuel economy levels of vehicles operating on alternative fuels to gasoline or diesel fuels. The CAFE Model can account for these requirements explicitly for each relevant vehicle model. However, 49 U.S.C. 32902 also prohibits consideration of the fuel economy of dedicated AFV models (or the non-gasoline or non-diesel calculated fuel economy of dual-fueled AFVs) when NHTSA determines what levels of passenger and non-passenger automobile CAFE standards are maximum feasible. The CAFE Model is therefore run in a manner that excludes dedicated AFV technologies and limits the consideration of a dual-fueled AFV's fuel economy to their gasoline or diesel operation only. NHTSA operates the Model with this limitation when performing the analysis that is used to inform the setting of standards. The CAFE Model can also be run without this analytical constraint, and the agency does so in the NEPA analysis, as described below.
Creation and Use of Compliance Credits:49 U.S.C. 32903 provides that manufacturers may earn CAFE “credits” by achieving a CAFE level beyond that required of a given fleet in a given model year and specifies how these credits may be used to offset the amount by which a different fleet falls short of its corresponding requirement. These provisions allow credits to be “carried forward” a maximum of five model years and “carried back” a maximum of three model years, transferred between regulated classes, and traded between manufacturers. However, credit use is also subject to specific limits: the statute caps the amount of credits that can be transferred between a manufacturer's fleets and prohibits manufacturers from applying traded or transferred credits to offset a failure to achieve the minimum standard for domestic passenger automobiles. The CAFE Model has the capability to simulate manufacturers' potential use of credits carried forward from prior model years or transferred from other fleets; [57]
however, this capability is not used in the standard-setting analysis because 49 U.S.C. 32902 prohibits consideration of manufacturers' potential application of CAFE compliance credits when setting maximum feasible CAFE standards for passenger and non-passenger automobiles.
National Environmental Policy Act (NEPA):
The Final SEIS accompanying this final rule documents changes in fuel use and emissions as estimated using the CAFE Model and also documents corresponding estimates—based on the application of other models documented in the Final SEIS—of environmental impacts of the regulatory alternatives under consideration.
3. What updated capabilities and assumptions does the current Model reflect as compared to the version used in the analysis of the 2024 final rule?
DOT has continued its ongoing effort to refine and expand the capabilities of the CAFE Model for use in analyzing regulatory alternatives as considered in the NPRM and in this final rule. Any analysis of regulatory actions that will be implemented several years in the future, and whose benefits and costs accrue over decades, requires many assumptions. Over such time horizons, many, perhaps even most, of the relevant assumptions in such an analysis are inevitably uncertain. To help address this, NHTSA updates the assumptions used in each successive CAFE analysis to reflect the current state of the world more accurately and to apply the best current estimates of future conditions. Accordingly, since the 2024 final rule, DOT made the following changes to the CAFE Model and its inputs for the NPRM:
Updated the Market Data Input File to reflect the change in analysis fleet from MY 2022 to MY 2024;
Updated algorithms and settings to remove statutorily prohibited inputs from the standard-setting analysis and to select between different types of analyses (i.e.,
constrained and unconstrained);
Updated the base dollar year from 2021$ to 2024$;
Updated the capability to exclude PHEV electricity usage when PHEV fuel economy operation is in gasoline-only mode for standard setting;
Updated the modeling capability to allow for vehicle reclassification;
Updated the Market Data Input File to include vehicle reclassification;
Updated the Model to use a bracketed costing approach to determine prices for the five levels of mass reduction;
Updated the Scenarios Input File to phase out AC and OC fuel consumption improvement values (FCIVs);
Updated the Market Data Input File to include advanced truck credits for MY 2024 vehicles, noting that those credits sunset after MY 2024 and are therefore only applicable to that 1 year;
Updated the Parameters Input File to set the social cost of carbon at zero;
Updated the Parameters Input File for changes in other economic variables;
Updated the Scenarios Input File with an adjusted 45X, 30D, and 45W tax credit phase-out timeframe;
Updated the Scenarios Input File to set civil penalties to zero;
Updated selected economic assumptions:
Rebound elasticity;
Payback period;
Value of travel time per vehicle; and
Numerous other updates based on the 2025 AEO.
Updated emission rates based on default MOVES5 assumptions.
NHTSA has made further updates for the final rule analysis in response to comments received on the proposal, minor errors and omissions identified, and new information. These changes include:
Updating the Market Data Input File based on comments received and other identified issues:
Refresh and redesign years updated based on OEM announcements; [58]
U.S. dealership labor hours updated based on new data;
( printed page 62018)
Vehicle platforms realigned to segregate EV variants; [60]
E85 fuel shares shifted to gasoline; and
Miscellaneous data entry anomalies addressed.
Updating the Market Data Input File based on the changes to the vehicle reclassification implementation year.
Updating the Scenarios Input File based on the changes to the PEF interim final rule.[61]
Updating the Scenarios Input File with an adjustment to the 45X battery tax credit implementation through 2032.
Updating economic and emissions assumptions in the Parameters Input File:
Numerous updates based on the 2026 AEO; and
Updating selected emission rates based on GREET 2025 and updated input assumptions to MOVES5.
Modifying the CAFE Model to expand capabilities and implement minor corrections:
Update emissions calculations to report domestic quantities in addition to global quantities;
Adjust calculations of forgone consumer sales surplus to include vehicle and battery tax credits and correct a minor error in calculation;
Refine battery tax credit calculations to use per-vehicle battery capacity based on Argonne simulation data;
Improve insurance cost calculation by transitioning from sales-weighting to weights based on the surviving fleet at each age; and
Various adjustments to allow for additional sensitivity case analysis, as discussed in FRIA Chapter 9.
These and other updated analytical inputs are discussed in the remainder of this section and in detail in the Final TSD.
B. What is NHTSA analyzing?
NHTSA is analyzing the effects of different potential CAFE standards on industry, consumers, and society at large. These different potential standards are described as “regulatory alternatives,” and, among the regulatory alternatives, NHTSA selects one set of final standards (
i.e.,
one set consists of a standard for passenger cars and a standard for light trucks). EPCA, as amended by EISA, expressly requires that CAFE standards for passenger cars and light trucks be based on one or more vehicle attributes related to fuel economy and be expressed in the form of a mathematical function.[62]
Thus, the standards (and the regulatory alternatives) for passenger cars and light trucks take the form of fuel economy targets expressed as functions of vehicle footprint (the product of vehicle wheelbase and average track width) that are separate for passenger cars and light trucks.
Under the footprint-based standards, the function defines a fuel economy performance target for each unique footprint combination within a car or truck model type. Using the functions, each manufacturer thus will have an average fuel economy standard for each year that is unique to each of its regulatory fleets (
i.e.,
passenger automobiles and non-passenger automobiles, consistent with 49 U.S.C. 32902(b)), based on the footprint and production volumes of the vehicle models produced by that manufacturer. The functions are negatively sloped, so that vehicles with larger footprints will generally be subject to lower mpg targets than vehicles with smaller footprints. This is because vehicles with smaller footprints are typically more capable of achieving higher levels of fuel economy, because they tend not to require as much energy to propel the mass necessary to perform their driving task. The standards with which a manufacturer must comply are determined by its final model year production figures. A manufacturer's calculation of its fleet average standards, as well as its fleets' average performance at the end of the model year, will thus be based on the production-weighted average target and performance of each model in its fleet.[63]
For passenger cars, consistent with prior rulemakings, NHTSA proposed to define fuel economy targets as shown in Equation II-1.
Equation II-1: Passenger Car Fuel Economy Footprint Target Curve
Where:
TARGETFE
is the fuel economy target (in mpg) applicable to a specific vehicle model type with a unique footprint combination,
a
is a minimum fuel economy target (in mpg),
b
is a maximum fuel economy target (in mpg),
c
is the slope (in gallons per mile (or gpm) per square foot) of a line relating fuel consumption (the inverse of fuel economy) to footprint, and
d
is an intercept (in gpm) of the same line.
Here,
MIN
and
MAX
are functions that take the minimum and maximum values, respectively, of the set of included values. For example,
MIN
[40, 35] = 35 and
MAX
(40, 25) = 40, such that
MIN
[
MAX
(40, 25), 35] = 35.
For light trucks, also consistent with prior rulemakings, NHTSA proposed to define fuel economy targets as shown in Equation II-2.
TARGETFE
is the fuel economy target (in mpg) applicable to a specific vehicle model type with a unique footprint combination, and
a, b,c,
and
d
are as for passenger cars, but take values specific to light trucks.
Though the general model of the target function equation is the same for passenger cars and light trucks, and the same for each model year, the parameters of the function equation differ for cars and trucks.
The parameters defining the general curve shapes have remained the same since the 2012 final rule. NHTSA periodically reconsiders whether to update the mathematical functions but in each prior instance had concluded that the existing curves continued to represent the relationship between footprint and fuel economy reasonably. Consistent with the agency's past practice of reviewing the mathematical functions prior to each rulemaking, NHTSA re-examined the curve shapes for the proposal and then subsequently again for this final rule.
For the proposal, NHTSA performed descriptive statistical analyses using manufacturer-reported data for the MY 2022 and MY 2024 fleets. NHTSA used the MY 2022 fleet for analysis of curve shapes relevant to the MY 2022-2027 standards and used the MY 2024 “reclassified” fleet for analysis of curve shapes relevant to the MY 2028-2031 standards. NHTSA used these separate fleets because the proposed updates to NHTSA's vehicle classification regulations proposed to begin in MY 2028 had material impacts on the relationship between fuel economy and footprint for each regulatory class, as expressed by the standards-defining functions.
To estimate the relationship between fuel economy and footprint and to maintain general consistency with analyses of past rules (and the conformance to statutory prohibitions), the agency excluded all diesel engine vehicles and all plug-in EVs, which include plug-in hybrid electric vehicles, battery electric vehicles (BEV), and fuel cell electric vehicles (FCEV), and applied weighting and other adjustments to the fuel consumption and footprint data. Table II-1 summarizes the methodological approaches that NHTSA considered for reassessing the footprint curves.
( printed page 62020)
NHTSA stated its belief in the proposal that the ordinary least-squares (OLS) regression framework continued to be an appropriate method for estimating the relationship of footprint to fuel economy. While the agency relied on the minimum absolute deviation (MAD) regression framework in the 2010 final rule to address the effects of “outlier” vehicles in the fleet, the agency addressed outlier vehicles in
( printed page 62021)
this reconsideration through technology-based exclusions (
i.e.,
by excluding diesels, PHEVs, BEVs, and FCEVs, as mentioned above) and data normalization through the application of controls, including curb weight (CW) to footprint, horsepower (HP) to CW, and both together, depending on the regulatory fleet under consideration, as it has in each of its CAFE rulemakings since 2012.
The curves presented in the proposal also reflected updated fleet data to reset the “cutpoints,” or the places at the lowermost and uppermost bounds of vehicle footprint distributions where the standards remain flat (
i.e.,
the mpg target does not continue to increase as footprint decreases, and vice versa). Since the 2012 final rule, the cutpoints had remained unchanged in subsequent proposed and final revisions to the standards until the proposed rule—passenger car cutpoints were set at 41 square feet (lower) and 56 square feet (upper), and light truck cutpoints were set at 41 square feet (lower) and 74 square feet (upper). NHTSA proposed to set the passenger car lower cutpoint at 45 square feet and an upper cutpoint at 57 square feet and also proposed to set the light truck lower cutpoint at 52 square feet and an upper cutpoint at 70 square feet for light trucks, after reviewing up-to-date fleet data.
NHTSA also discussed in the proposal how the agency considers a variety of technical and policy issues when determining the footprint curve shape in any CAFE rulemaking. For example, standards that decrease with increasing footprint could create incentives for manufacturers to upsize vehicles, since small changes in vehicle footprint would result in a significant change in the vehicle's fuel economy target; conversely, gradually increasing standards could create a significant amount of additional technology burden for larger vehicles to meet fuel economy targets like those of smaller vehicles. That said, NHTSA performed an analysis for the 2024 final rule showing that vehicle footprints, within vehicle types, have been stable on a sales-weighted basis since MY 2012.[65]
The biggest increase to within-type footprints was for the sedan/wagon category, which increased by 3.4 percent (or about 2 square feet) from 2012 (for reference, a 1.5-square foot increase would equate to about a 2-inch increase in the track width of a MY 2022 Toyota Corolla). NHTSA concluded that the disconnect between vehicle class-level characteristics and what was being perceived at the fleet level (
i.e.,
vehicles seemingly getting larger) was traceable to the increase in the share of fleet vehicles classified as light trucks relative to the share of passenger cars. Available data indicate that the use of footprint as an attribute did not appear to lead to manufacturers significantly altering the size of their vehicles within vehicle classes.
The footprint curve updates presented in the proposal were intended to ensure that the agency appropriately captures the footprint-to-fuel-economy relationship using the most current data. As NHTSA discussed in the Draft TSD, the observed relationship between footprint and fuel economy for both the passenger car and light truck fleets is on average “flatter” (
i.e.,
on average, the fuel economy did not vary as much across footprint levels) than the MY 2008 fleet used to create the footprint curves for the past several rules. While the technical concerns and policy trade-offs associated with the curve shapes still hold to some extent, NHTSA concludes it is more likely, as shown from the agency's 2024 analysis and the updated discussion in Section VI, that any shift in vehicle attributes present in the market over time has not been due to the shapes of curves or the use of footprint as the relevant attribute.
NHTSA sought comments on this conclusion, as well as the updated footprint curve shape analysis.
Hyundai Motor North America (Hyundai) commented in support of the continued use of footprint as the attribute for the development of attribute-based standards to ensure certainty and continuity in the design of CAFE standards.[66]
JLR criticized the design of standards due to the relative lack of separation between the passenger car and light truck curves in the mid-50s ft[2]
range.[67]
In contrast, the International Council on Clean Transportation (ICCT) argued that maintaining two separate curves for passenger cars and light trucks leaves open an incentive for manufacturers to redesign vehicles to be in a regulatory class subject to less stringent standards.[68]
NHTSA is continuing to set separate standards for passenger cars and light trucks. As discussed in more detail in Section V, based on the plain language of EPCA, as amended, NHTSA consistently has interpreted the statutory requirement to set separate standards for passenger and non-passenger automobiles as preventing NHTSA from setting a single combined CAFE standard. NHTSA believes that the reclassification of the passenger car and light truck fleets (discussed in more detail in Section VI) will provide a better structure to address the incentives issue raised by ICCT. With the reclassification, the distinction between passenger cars and light trucks will be sharpened, as vehicles will be classified as light trucks based on their offroad and cargo-hauling capabilities, characteristics that involve a footprint-to-fuel-consumption profile that differs more significantly from that of passenger cars. In combination with the setting of fuel economy standards that are realistic and achievable for a wider range of passenger car models, this reclassification will minimize, if not eliminate, any regulation-induced incentive manufacturers may have to modify or add features to vehicles so that they can be classified as light trucks to get the benefit of less stringent CAFE requirements.
As explained further below, in this final rule, NHTSA has decided to push back implementation of the reclassification until MY 2030, instead of MY 2028 as initially proposed, and has also decided to make adjustments in the methodology for transitioning the standards from MY 2029 to MY 2030 in a manner that will limit the immediate regulatory impact of the reclassification, in particular for vehicles that are unlikely to change their classification. These adjustments will help to separate the fuel economy curves of the two classes along the lines advocated by JLR in its comments, while still allowing the curves to be closer in the footprint ranges where passenger cars and light trucks are most similar in design.
The Institute for Policy Integrity at the New York University School of Law (IPI) criticized several features of NHTSA's estimation strategy, including the assumption of a linear relationship between footprint and fuel consumption levels and the agency's choice of control variables.[69]
IPI also supported the use of production weighting to limit the influence of statistical outliers in the curve estimation, while ICCT argued that using production weights tends to
( printed page 62022)
increase the slope of the footprint curve after vehicles are reclassified. ICCT also argued that current technology deployment for larger vehicles and production volumes is not representative of the future state of the market, making production weighting less suitable for designing policy in future years.[70]
NHTSA agrees with IPI that the risk of outliers influencing the estimated relationship represents a significant source of potential bias in estimating the slope parameter and thus is continuing to use production weights. In response to ICCT's comment, NHTSA examined versions of the fleet with greater technology deployment on the upper end of the footprint curve and found that, after including control variables, the slope of the relationship was similar to that found in the observed data. While production volumes may change in future years as ICCT argues, so too may the models offered for sale by manufacturers. NHTSA will continue to monitor the market and determine whether it is suitable to update its estimated relationship in future rulemakings.
NHTSA disagrees with IPI's contention that estimating a linear relationship between levels of fuel consumption and footprint is inappropriate. NHTSA examined the residuals of its regressions and did not find a statistically significant relationship between footprint and the residuals when production weighting was used. Had a linear model been inappropriate as IPI contended, it is likely that a relationship between the explanatory variable and residuals would have been significant. NHTSA also investigated IPI's contention that using controls could cause instability in its model's results through collinearity of its explanatory variables. To do so, NHTSA examined the variance inflation factor (VIF) [71]
for a linear model including footprint, horsepower to curb weight, and curb weight to footprint. The VIF measures how much the variance of an estimated regression coefficient is increased due to collinearity. Values above five indicate a cause for concern with collinearity, while a VIF of one indicates no correlation between a predictor and the other explanatory variables, and values between indicate some correlation but not enough to threaten stability. NHTSA found that for each of the datasets it used to set standards (MY 2022 and MY 2024 fleets for passenger cars and light trucks) the VIF was below two for each of the three explanatory variables. As a result, NHTSA is not changing its set of control variables.
The Alliance and Stellantis both criticized the proposed light truck upper cutpoint of 70 ft,[2]
arguing that there is a significant volume of production above this cutpoint that require design features to accommodate their higher towing and payload capacity.[72]
These commenters argued that placing a cutpoint at 70 ft,[2]
a lower footprint level than the existing cutpoint, would unfairly penalize these vehicles and discourage their production. The Alliance also argued that the changes NHTSA proposed would require significant lead time in order to address vehicle design changes necessary to comply with the standards under the new classification system.[73]
After considering comments, NHTSA has pushed back the year in which it is changing its vehicle classification system from MY 2028 to MY 2030. NHTSA agrees with The Alliance that manufacturers should be given additional time to update production plans in advance of the change in classification. NHTSA used the MY 2022 fleet for analysis of curve shapes relevant to the MY 2022-2029 standards and used the MY 2024 “reclassified” fleet for analysis of curve shapes relevant to the MY 2030-2031 standards. NHTSA updated its MY 2024 reclassified fleet for the final rule to account for changes in its classification system after considering comments. This required NHTSA to re-estimate the coefficients used for the later period, and to re-evaluate its choice of cutpoints.
For cutpoint placement, NHTSA continued to examine regions of the footprint curve where the local relationship (LOESS) [74]
between footprint and fuel consumption varied from the overall linear relationship. These regions represent areas in which the tradeoff between footprint and fuel consumption no longer remains stable and thus are suitable bounds for constraining the level of the standards. For the final rule, the agency examined footprint levels at which the linear relationship diverged from a 95 percent confidence surrounding the local fit. The agency has shifted passenger car cutpoints inward by 1 square foot each to 46 sq. ft. for the lower cutpoint and 56 sq. ft. for the upper cutpoint. The light truck lower cutpoint remains the same as proposed in the NPRM at 52 sq. ft.
Though the 70 sq. ft. upper cutpoint was determined using the 95 percent confidence interval, NHTSA is finalizing a 74 sq. ft. upper cutpoint for light trucks. The agency reviewed comments as well as the cutpoint placement justification in the 2012 final rule. As discussed by commenters, reducing the upper cutpoint to 70 sq. ft. would disproportionately affect targets for several large footprint light trucks that require greater power to provide workplace utility. In the agency's engineering judgment, retaining a 74 sq. ft. cutpoint better balances fuel economy needs with commercial use cases.[75]
The required CAFE level applicable to a passenger car (either domestic or import) or light truck fleet in a given model year is determined by calculating the production-weighted harmonic average [76]
of fuel economy targets applicable to specific vehicle model configurations in the fleet, as shown in Equation II-3.
Equation II-3: Calculation for Required CAFE Level
( printed page 62023)
Where:
CAFErequired
is the CAFE level the fleet is required to achieve,
i
refers to specific vehicle model configurations in the fleet,
PRODUCTIONi
is the number of model configuration
i
produced for sale in the United States, and
TARGETFE, i
is the fuel economy target (as defined above) for model configuration
i.
Additional details about the specific values defining the mathematical functions and visual representations of the fuel economy target curves are presented in Section III, below.
C. What inputs does the compliance analysis require?
The first step in the agency's analysis of the effects of different levels of fuel economy standards is the compliance simulation. As used throughout this rulemaking, “compliance simulation” means the simulation of how manufacturers could comply with different levels of CAFE standards by adding fuel economy-improving technology to an existing fleet of vehicles, using the CAFE Model. The CAFE Model uses a variety of data, including data provided by manufacturers, to simulate final fleet sales and performance.[77]
At the most basic level, a model is a set of equations, algorithms,[78]
or other calculations used to make predictions about a complex system. A model may consider various inputs, such as technology costs or other relevant factors, and use those inputs to generate output predictions. NHTSA used two separate approaches for this rulemaking to amend the existing CAFE standards, one for the analysis for amending the MY 2022-2026 standards and one for the analysis for amending the standards for MYs 2027-2031. The sections below discuss the inputs each of those analyses used.
1. What inputs does the analysis require for 2022-2026?
For the MYs 2022-2026 analysis, NHTSA performed two exercises: first, the agency re-evaluated the statistical model used to determine the shape (
i.e.,
slope, intercept, and cutpoints) of the target functions for passenger cars and light trucks. Then, based on its preferred choice of shape, NHTSA evaluated the compliance position of manufacturers in MYs 2022-2024 under alternative stringencies and compared results to the manufacturers achieved average fuel economy in these years. For both exercises, NHTSA relies on compliance data from manufacturer mid-year compliance reports. For its curve fitting analysis, NHTSA uses vehicle model level data on vehicle attributes, including footprint, HP, CW, and 2-cycle fuel economy. NHTSA also uses mid-year estimates of model sales from manufacturer compliance data. NHTSA's curve fitting analysis is described in greater detail in Final TSD Chapter 1. For NHTSA's comparison of achieved fuel economy and finalized standards levels, the agency uses compliance data at the model level for vehicle footprint, 2-cycle fuel economy, and mid-year estimates of vehicle sales.
For MYs 2022-2024, NHTSA uses each standard to calculate vehicle model target function values for each vehicle model in the standard-setting fleet.[79]
Consistent with past rulemakings, the agency uses piecewise linear functions of vehicle footprint, which map to a target value of fuel consumption rate in gallons per mile.[80]
NHTSA determines a vehicle's target fuel economy level in mpg for a given set of standards and then takes the reciprocal of this value. NHTSA determines the CAFE standards for each manufacturer at the regulatory class level under each alternative by taking the sales-weighted harmonic mean of the relevant models produced by the manufacturer in each regulatory class in each model year. The agency repeats these calculations for each model year under consideration to determine a single value for each regulatory class in which the manufacturer produced vehicles.
NHTSA also computes the MDPCS for each model year by taking the sales-weighted harmonic mean of the model-level target function values for all vehicles in the passenger car fleet in that model year and multiplying the value by 92 percent.[81]
NHTSA determines each manufacturer's achieved fuel economy in mpg separately for each regulatory class using the sales-weighted average of the 2-cycle fuel economy values of all models produced by the manufacturer in the relevant regulatory class. NHTSA then compares this achieved value to the corresponding regulatory class standard for each manufacturer in each model year to determine whether the fleet of vehicles to which it corresponds would comply with each standard. To determine the total number of vehicles out of compliance, NHTSA determines compliance for each manufacturer's regulatory fleet in each model year under each finalized alternative. If a fleet is determined to be out of compliance, the agency sums the total number of vehicles sold in the non-compliant fleet.
As discussed in more detail in Section IV, NHTSA analyzes the difference between each manufacturer's fleet CAFE compliance value and the standard. NHTSA considered using the CAFE Model to simulate behavior for the MYs 2022-2026 compliance period to estimate how manufacturers and consumers could have responded to different CAFE standards. However, for MYs 2022-2026, production is closed or is in process at the time of this final rule's publishing. This type of analysis overestimates the ability of manufacturers to optimize in response to the finalized standards for these years and likely leads to different results from the actual outcomes. Thus, simulating a response and any monetized costs or benefits deriving from that response do not represent real economic effects from the final change in policy.
2. What inputs does the compliance analysis require for 2027-2031?
For the MYs 2027-2031 amendment analysis, NHTSA used the CAFE Model to simulate manufacturers' potential responses to new CAFE standards and to estimate the various impacts of those responses on manufacturers and society. The Model considers various inputs, such as technology effectiveness data, technology costs, and other relevant factors, and uses those inputs to generate output predictions.
NHTSA attempts to ensure that the technology inputs and assumptions that go into the CAFE Model are based on sound science and reliable data and that NHTSA's reasons for using those inputs and assumptions are transparent and understandable to stakeholders. This section and the following section discuss at a high level how the agency generates the technology inputs and assumptions that the CAFE Model uses for the compliance simulation.[82]
The
( printed page 62024)
Final TSD, CAFE Model Documentation, CAFE Analysis Autonomie Documentation,[83]
and other technical reports supporting this final rule discuss the agency's technology inputs and assumptions in more detail.
NHTSA incorporates technology inputs and assumptions either directly in the CAFE Model or in the CAFE Model's various input files. The compliance simulation algorithm is at the heart of the CAFE Model's approach on applying technologies to a manufacturer's vehicles to project how the manufacturer could meet CAFE standards. The compliance simulation algorithm consists of several equations that direct the Model to apply fuel economy-improving technologies to vehicles in a way that simulates how manufacturers might apply those technologies to their vehicles in the real world. The compliance simulation algorithm projects a cost-effective pathway for manufacturers to comply with different levels of CAFE standards, considering the technology present on manufacturers' vehicles now and what technology could be applied to their vehicles in the future. Embedded in the CAFE Model is the universe of technology options that the Model can consider and rules about the order in which it can consider those options, as well as estimates of how effective fuel economy-improving technology is on different types of vehicles (
e.g.,
sedan or pickup truck).
Technology inputs and assumptions are also located in all four of the CAFE Model Input Files. The Market Data Input File is a spreadsheet file that characterizes the fleet of vehicles used as the starting point for the CAFE Model. There is one row describing each vehicle model and model configuration manufactured for the United States market in a model year (or years) and input and assumption data that links those vehicles to technology and economic, environmental, and safety inputs and assumptions. The Technologies Input File identifies 69 technologies the agency uses in the analysis, along with information used to inform the compliance simulation and effects estimates, including phase-in caps to identify when and how widely each technology can be applied to specific types of vehicles, most of the technology costs (hybrid vehicle battery costs are provided in a separate file), and the fuel share percentage for PHEV to capture the charge sustaining operation. The Scenarios Input File provides the coefficient values defining the standards for each regulatory alternative [84]
and other relevant information applicable to modeling each regulatory scenario.[85]
Finally, the Parameters Input File contains mainly economic and environmental data.[86]
NHTSA generates these technology inputs and assumptions in several ways, including using data submitted by vehicle manufacturers pursuant to their CAFE reporting obligations; public data on vehicle models from manufacturer websites, press materials, marketing brochures, and other publicly available information; collaborative research, testing, and modeling with other Federal agencies, like Argonne; and research, testing, and modeling with independent organizations, like IAV GmbH Ingenieurgesellschaft Auto und Verkehr (IAV), Southwest Research Institute (SwRI), National Academy of Sciences (NAS), and FEV North America. NHTSA also considers the work done to develop inputs and assumptions for prior rules to the extent it is still relevant and applicable; feedback from stakeholders on prior rules and from meetings conducted before the commencement of this final rule; and NHTSA's own engineering judgment. NHTSA uses the term “engineering judgment” throughout this rulemaking to refer to decisions made by a team of NHTSA engineers and analysts. This judgment is based on their experience working in the automotive industry and other relevant fields and assessment of all the data sources described above. Most importantly, the agency uses engineering judgment to assess how best to represent vehicle manufacturers' potential responses to different levels of CAFE standards within the boundaries of the agency's modeling tools, as “a model is meant to simplify reality in order to make it tractable.” [87]
In other words, NHTSA uses engineering judgment to concentrate potential technology inputs and assumptions from millions of discrete data points from hundreds of sources into four external input files and three datasets integrated into the CAFE Model. How the CAFE Model decides to apply technology (
i.e.,
the compliance simulation algorithm) has been developed using engineering judgment considering factors that manufacturers consider when they add technology to vehicles in the real world. The specific technology inputs and assumptions are discussed in more detail in the following sections and in the associated technical documentation.
a. Technology Options and Pathways
NHTSA begins the compliance analysis by defining the range of fuel economy-improving technologies that the CAFE Model could add to a manufacturer's vehicles in the U.S. market. These are technologies that the agency believes are representative of what vehicle manufacturers currently use on their vehicles, and that vehicle manufacturers could use on their vehicles in the timeframe for the finalized standards (MYs 2027-2031). The technology options include engines, transmissions, hybridization, and road load technologies, which include mass reduction, aerodynamic improvement (aerodynamic drag technology (AERO)), and tire rolling resistance (ROLL) reduction technologies.[88]
Adding a technology to the range of options that the CAFE Model can consider requires several data elements, including a broadly applicable technology definition, estimates of how effective that technology is at improving fuel economy on different vehicle types (
e.g.,
sedan or pickup truck), and the cost to apply that technology to each. Each technology the agency selects is designed to be representative of a wide range of specific technology applications used in the automotive industry. Some manufacturers' systems may perform better or worse than NHTSA's modeled systems, and some
( printed page 62025)
may cost more or less than NHTSA's modeled systems. However, selecting representative technology definitions for the agency's analysis ensures the agency captures a reasonable level of costs and benefits that would result from any manufacturer applying the technology.
NHTSA has been refining the technology options it considers since first developing the CAFE Model in 2002. In this context, “refining” means both adding and removing technology options depending on current technology availability and projected future availability in the U.S. market, while balancing a reasonable amount of modeling and analytical complexity. In recent years, the agency has refined internal combustion engine (ICE) technology options, particularly the TURBO and high compression ratio (HCR) pathways, to reflect better the diversity of engines in the current fleet. The agency includes several hybrid technologies to represent appropriately the diversity of current and anticipated future technology options while ensuring NHTSA's analysis remains consistent with statutory limitations prohibiting the consideration of EVs in establishing standards and considering only the gas or diesel operation of dual-fueled automobiles.
The technology options do not include technologies NHTSA has determined will not be available in the rulemaking timeframe. As with past analyses, the agency does not include technologies unlikely to be feasible in the rulemaking timeframe, engine technologies designed for markets other than the United States market or required to use unique gasoline,[89]
or technologies for which appropriate data are not available for the range of vehicles that the agency models in the analysis (
i.e.,
technologies that are still in the research and development phase and not ready for mass-market production). Each technology section below and Chapter 3 of the Final TSD discuss these modeling decisions in detail.
The CAFE Model does not dictate or predict the technologies manufacturers must use to comply; rather, the CAFE Model outlines a technology pathway that manufacturers could use to meet the standards in a cost-effective way. While NHTSA estimates the costs and benefits for different levels of CAFE standards based on a simulation of the technology manufacturers could apply in the rulemaking timeframe, it is entirely possible and reasonable that manufacturers may use different technology options to meet the agency's standards in the real world and may even use technologies that NHTSA does not include in the analysis. This is because NHTSA's standards do not mandate the application of any technology. Rather, NHTSA's standards are performance-based: manufacturers can and do use a range of compliance solutions that include technology application and encouraging sales shifts from one vehicle model or trim level to another.[90]
The agency has determined that the 69 technology options included in the analysis strike a reasonable balance between representing the diversity of technology used by the entire industry and simplifying reality to make modeling workable.[91]
Chapter 3 of the Final TSD and Section II.D below describe the technologies that NHTSA uses for the analysis. Each technology has a name that loosely corresponds to its real-world technology equivalent. NHTSA abbreviates the name to a short signifier for the CAFE Model to read. The agency organizes those technologies into groups based on technology type: basic and advanced engines, transmissions, hybridization, and road load technologies, which include mass reduction, aerodynamic improvement, and low rolling resistance tire technologies.
NHTSA then organizes the groups into pathways. The pathways instruct the CAFE Model how and in what order to apply technology. In other words, the pathways define mutually exclusive technologies (
i.e.,
those that cannot be applied at the same time) and define the direction in which vehicles can advance as the Model evaluates which technologies to apply. The respective technology chapters in the Final TSD and Section 4 of the CAFE Model Documentation include a visual of each technology pathway. In general, the paths are tied to ease of implementation of additional technology and how closely the technologies are related.
As an example, NHTSA's “Turbo Engine Path” consists of five different engine technologies that employ different levels of turbocharging technology. A turbocharger is essentially a small turbine driven by exhaust gases produced by the engine. As these gases flow through the turbocharger, they spin the turbine, which in turn spins a compressor that pushes more air into an engine's cylinders. Having more air in the engine's cylinders allows the engine to burn more fuel, which then creates more power, without needing a physically larger engine. In the agency's analysis, an engine that is turbocharged “downsizes,” or becomes smaller. Choosing to turbocharge an engine allows a manufacturer to maintain similar levels of performance to a larger, non-turbocharged engine with a smaller engine that uses less fuel to do the same amount of work. Allowing basic engines to be downsized and turbocharged instead of just turbocharged keeps the vehicle's utility and performance constant so that NHTSA can measure the costs and benefits of different levels of fuel economy improvements, rather than the change in different vehicle attributes. This concept of performance neutrality is discussed further below.
The Model allows only forward movement along the technology pathways, adding more advanced technology as the Model moves through the technology tree. This ensures that a vehicle that uses a more advanced technology cannot downgrade to a less advanced version of the technology and ensures that a vehicle does not switch to technology that is significantly technically different. This progressive order also realistically represents how manufacturers often start with the lowest and most cost-effective technologies and generally advance along particular technology pathways. As an example, if a vehicle in the compliance simulation begins with a TURBOD engine—a turbocharged engine with cylinder deactivation—it cannot adopt a TURBO0 engine.[92]
Similarly, this vehicle with a TURBOD engine cannot adopt an advanced cylinder deactivation on a dual-overhead camshaft (ADEACD) engine.[93]
As an example of NHTSA's rationale for ordering technologies on the technology
( printed page 62026)
tree, an engine could potentially be changed from TURBO0 to TURBO2 without redesigning the engine block or requiring significantly different expertise to design and implement. A change to ADEACD likely would require a different engine block that might not fit in the engine bay of the vehicle without a complete redesign and different technical expertise requiring years of research and development. This change, which would strand capital and impact parts sharing, is why the advanced engine paths restrict most movement between them. The concept of stranded capital is discussed further in Section II.C.2.f.
NHTSA also considers two categories of technology that the agency could not simulate as part of the CAFE Model's technology pathways for the regulatory alternatives for some of standard-setting years. “Off-cycle” and AC efficiency are two types of technologies that improve vehicle fuel economy but are not accounted for using 2-cycle testing. To account for the benefits of these technologies, EPA has allowed manufacturers to generate FCIVs when they add these technologies, which are used to improve a manufacturers' fleet average fuel economy used for complying with the CAFE standards. As an example, manufacturers can generate FCIVs for technology like active seat ventilation and solar reflective surface coatings that make the cabin of a vehicle more comfortable for the occupants without using less efficient accessories like heat or AC. Instead of including OC and AC efficiency technologies in the technology pathways, NHTSA includes the improvement as a defined benefit that gets applied to a manufacturer's entire fleet in applicable model years instead of to individual vehicles. The defined benefit that each manufacturer receives in the analysis for using OC and AC efficiency technology on their vehicles is located in the Market Data Input File. Chapter 3.7 of the Final TSD provides more discussion on how OC and AC efficiency technologies are developed and modeled. As discussed further in preamble Section II.D.8, NHTSA is removing consideration of FCIVs from its standard-setting analysis beginning with MY 2028. Preamble Section VI contains discussion of how manufacturers generate FCIVs under the limits for FCIVs under EPA's regulations.
To illustrate how NHTSA simulates technology application, throughout this section NHTSA follows the hypothetical vehicle mentioned above that begins the compliance simulation with a TURBOD engine. The agency's hypothetical vehicle, Generic Motors' Ravine Runner F Series, is a roomy, top-of-the-line SUV. The Ravine Runner F Series starts the compliance simulation with technologies from most technology pathways; specifically, after looking at Generic Motors' website and marketing materials, the agency determines that it has technology that loosely fits within the following technologies that the agency considers in the CAFE Model: it has a turbocharged engine with cylinder deactivation, a fairly advanced 10-speed automatic transmission, a 12V start-stop system, the least advanced tire technology, a fairly aerodynamic vehicle body, and it employs a fairly advanced level of mass reduction. NHTSA tracks the technologies on each vehicle using a “technology key,” which is the string of technology abbreviations for each vehicle. The vehicle technologies and their abbreviations that the agency considers in this analysis are shown in Final TSD Chapter 2. The technology key for the Ravine Runner F Series is “TURBOD; AT10L2; SS12V; ROLL0; AERO5; MR3.”
b. Defining Manufacturers' Current Technology Positions in the Analysis Fleet
The Market Data Input File is one of four Excel input files that the CAFE Model uses for compliance and effects simulation. The Market Data Input File's “Vehicles” tab (or worksheet) houses one of the most significant compilations of technology inputs and assumptions in the analysis, which is a characterization of the fleet of vehicle models each manufacturer produced for sale in the United States for MY 2024. This provides the starting point from which the CAFE Model adds fuel economy-improving technology. NHTSA calls this fleet the “analysis fleet.” The analysis fleet includes a number of inputs necessary for the Model to add fuel economy-improving technology to each vehicle for the compliance analysis and to calculate the resulting impacts for the effects analysis.
The “Vehicles” tab contains a separate row for each vehicle model. Vehicle models are vehicles that share the same fuel economy value and vehicle footprint based on EPA's regulations for calculating fuel economy. This means that vehicle “trims” with different configurations that affect the vehicle's certification fuel economy value are considered unique models distinguished in separate rows in the Vehicles tab. For example, the agency's Ravine Runner example vehicle comes in three different configurations—the Ravine Runner FWD, Ravine Runner AWD, and Ravine Runner F Series—which would be reported separately under EPA's regulations for compliance purposes and would therefore result in three separate rows in the “Vehicles” tab.
In each row, NHTSA also designates a vehicle's engine, transmission, and platform codes.[94]
Vehicles that have the same engine, transmission, or platform code are deemed to “share” that component in the CAFE Model. Parts sharing helps manufacturers achieve economies of scale, deploy capital efficiently, and make the most of shared research and development expenses, while still presenting a wide array of consumer choices to the market. The CAFE Model has been developed to treat vehicles, platforms, engines, and transmissions as separate entities, which allows the modeling system to evaluate technology improvements on multiple vehicles that may share a common component concurrently. Sharing also enables realistic propagation, or “inheriting,” of previously applied technologies from an upgraded component down to the vehicle “users” of that component that have not yet realized the benefits of the upgrade. Section 2.1 and Section 4.4 of the CAFE Model Documentation contain additional information about the initial state of the fleet, as well as technology evaluation and inheriting within the CAFE Model.
Figure II-1 below shows how an example of how the different configurations of the hypothetical Ravine Runner would be separated. NHTSA sees by the Platform Codes that these Ravine Runners all share the same platform, but only the Ravine Runner FWD and Ravine Runner AWD share an engine. Even so, all three fuel economy values are different, which is common for vehicles that differ in drive type (drive type meaning whether the vehicle has AWD, 4-wheel drive (4WD), front-wheel drive (FWD), or rear-wheel drive (RWD)). Though it is simpler to aggregate vehicles by model, ensuring that NHTSA captures model variants at the level they would be reported for compliance improves the accuracy of the analysis and the potential that estimated costs and benefits from different levels of standards are appropriate. NHTSA includes information about other vehicle
( printed page 62027)
technologies at the farthest right side of the Vehicles tab, and in the “Engines,” “Transmissions,” and “Platforms” worksheets, as discussed further below.
Moving
from left to right on the Vehicles tab, after including general information about vehicles and their compliance fuel economy value, NHTSA includes sales and manufacturer's suggested retail price (MSRP) data, regulatory class information (
e.g.,
domestic passenger automobile, import passenger automobile, or non-passenger automobile), and information about how NHTSA classifies vehicles for the effectiveness and safety analyses. Each of these data points is important to different parts of the compliance and effects analysis, so that the CAFE Model can accurately average the technologies required across a manufacturer's regulatory fleet to meet its CAFE standard or estimate the impacts of higher fuel economy standards on vehicle sales.
Next, NHTSA includes vehicle information necessary for applying different types of technology; for example, designating a vehicle's body style allows NHTSA to apply aerodynamic technology appropriately, and designating starting CW values allows the agency to apply mass reduction technology more accurately. Importantly, this section also includes vehicle footprint data, which is needed because NHTSA sets footprint-based standards.
NHTSA also sets product design cycles, which are the years in which the CAFE Model can apply technologies to vehicles. Manufacturers often introduce fuel-saving technologies at a “redesign” of their product or adopt technologies at “refreshes” in between product redesigns. As an example, the redesigned third generation Chevrolet Silverado was released for MY 2019 and featured a new platform, updated drivetrain, increased towing capacity, reduced weight, improved safety, and expanded trim levels, to name a few improvements. For MY 2022, the Chevrolet Silverado received a refresh (or facelift as it is commonly called), with an updated interior, infotainment, and front-end appearance.[96]
Setting these product design cycles provides realistic durations of product stability and ensures that the CAFE Model simulates the opportunities manufacturers have to apply technologies in line with refresh and redesign cycles.
During modeling, all improvements from technology application are initially realized on a component and then propagated (or inherited) down to the vehicles that share that component. As such, new component-level technologies are initially evaluated and applied to a platform, engine, or transmission during their respective redesign or refresh years. Any vehicles that share the same redesign or refresh schedule as the component apply these technology improvements during the same model year. The rest of the vehicles inherit technologies from the component during their refresh or
( printed page 62028)
redesign year (for engine- and transmission-level technologies) or during a redesign year only (for platform-level technologies). Section 4.4 of the CAFE Model Documentation contains additional information about technology evaluation and inheriting within the CAFE Model.
The CAFE Model also considers the potential safety effect of mass reduction technologies and crash compatibility of different vehicle types. Mass reduction technologies lower the vehicle's CW, which may change crash compatibility and safety, depending on the type of vehicle. NHTSA assigns each vehicle in the Market Data Input File a “safety class” that best aligns with the CAFE Model's analysis of vehicle mass, size, and safety, and include the vehicle's starting CW.[97 98]
The CAFE Model includes procedures to consider the direct labor impacts of manufacturers' responses to CAFE regulations, considering the assembly location of vehicles, engines, and transmissions; the percent U.S. content (based on the percent U.S. and Canadian content, as reported by manufacturers to NHTSA); and the dealership employment associated with new vehicle sales. Estimated labor information, by vehicle, is included in the Market Data Input File. Sales volumes included in and adapted from the market data also influence total estimated direct labor projected in the analysis. Chapter 6.2.5 of the Final TSD contains additional discussion of the labor utilization analysis.
NHTSA then assigns the technologies to individual vehicles. This initial linkage of vehicle technologies is how the CAFE Model knows how to advance a vehicle down each technology pathway. Assigning CAFE Model technologies to individual vehicles is dependent on the mix of information the agency has about any particular vehicle and trends about how a manufacturer has added technology to that vehicle in the past, equations and models that translate real-world technologies to their counterparts in NHTSA's analysis (
e.g.,
drag coefficients and body styles can be used to determine a vehicle's AERO level), and the agency's engineering judgment.
As discussed further below, the agency uses information directly from manufacturers to populate some fields in the Market Data Input File, like vehicle HP ratings and vehicle weight. NHTSA also uses manufacturer data as an input to various other models that calculate how a manufacturer's real-world technology equates to a technology level in the agency's model. For example, the agency calculates initial mass reduction, aerodynamic drag reduction, and ROLL levels by looking at industry-wide trends and calculating—through models or equations—levels of improvement for each technology. The models and algorithms that the agency uses are described further below and in detail in Chapter 3 of the Final TSD. Other fields, like vehicle refresh and redesign years, are projected forward based on historic trends.
Recall the Ravine Runner F Series example with the technology key “TURBOD; AT10L2, SS12V; ROLL0; AERO5; MR3.” For this example, Generic Motor's publicly available specification sheet for the Ravine Runner F Series says that it uses Generic Motor's Turbo V6 engine with proprietary Adaptive Cylinder Management Engine (ACME) technology. Generic Motor's ACME improves fuel economy and lowers emissions by operating the engine using only three of the engine's cylinders in most conditions and using all six engine cylinders when more power is required. Based on this information, NHTSA would conclude that this engine is turbocharged and uses a form of cylinder deactivation, meaning it would be appropriately classified as TURBOD. Generic Motors uses this engine in several of their vehicles, and the specifications of the engine can be found in the Engines Tab of the Market Data Input File, under a six-digit engine code.[99]
This is a relatively easy engine to assign based on publicly available specification sheets, but some technologies are more difficult to assign. Manufacturers use different trade names or terms for different technology, and the way that the agency assigns the technology in the agency's analysis may not necessarily line up with how a manufacturer describes the technology. NHTSA must use some engineering judgment to determine how discrete technologies in the market best fit the technology options that the agency considers in the agency's analysis. The agency discusses factors used to assign each vehicle technology in the individual technology subsections below.
In addition to the Vehicles Tab that houses the analysis fleet, the Market Data Input File includes information that affects how the CAFE Model might apply technology to vehicles in the compliance simulation. Specifically, the Market Data Input File's “Manufacturers” tab includes a list of vehicle manufacturers considered in the analysis and several pieces of information about their economic and compliance behaviors. For this analysis, the compliance simulation assumes that manufacturers continue to apply technology to the extent practicable to reach compliance. This modeling change is made by indicating in the “Manufacturers” tab that all manufacturers will comply with NHTSA's standards and is consistent with the recent amendment to EPCA that set civil penalties (
i.e.,
fines) to $0 effective for MY 2022 vehicles and beyond.[100]
The CAFE Model's compliance simulation algorithm is discussed in Section II.C.2.f.
Finally, NHTSA designates a “payback period” for each manufacturer. The payback period represents an assumption that consumers are willing to buy vehicles with more fuel economy technology because the fuel economy technology saves them money on gas in the long run. For the past several rulemaking analyses using the CAFE Model the agency has assumed that in the absence of CAFE or other regulatory standards, manufacturers apply technology that “pays for itself”—by saving the consumer money on fuel—in 30 months, or 2.5 years. NHTSA has updated the agency's payback period for this rulemaking to assume a full 3-year payback period based on an examination of empirical economics literature. This is discussed in detail in Section II.E.1.a below, and in the Final TSD and FRIA.
Before the agency begins building the Market Data Input File for any analysis, NHTSA must consider what model year vehicles comprise the analysis fleet. There is an inherent time delay in the data the agency can use for any analysis because NHTSA receives compliance data after a model year has been completed.
For this rulemaking, NHTSA uses data from manufacturers' 2024 mid-model year compliance reports. Though the agency possesses a limited amount of more recent data, NHTSA is not using
( printed page 62029)
that data for this rulemaking because the dataset is not complete.
At the time NHTSA starts building the analysis fleet, data received from vehicle manufacturers [101]
offers the best snapshot of vehicles for sale in the United States in a model year. The mid-model year reports include information about individual vehicles at the vehicle configuration level. NHTSA uses the vehicle configuration, certification fuel economy, sales, regulatory class, and additional technology data from these reports as the starting point to build a “row” (
i.e.,
a vehicle model, with all necessary information about the vehicle) in the Market Data Input File's Vehicles Tab. Additional technology data comes from publicly available information, including vehicle specification sheets, manufacturer press releases, owner's manuals, and websites. NHTSA also generates some assumptions in the Market Data Input File for data fields where there is limited data, like refresh and redesign cycles for future model years, and technology levels for certain road load reduction technologies like mass reduction and aerodynamic drag reduction.
For this analysis, the light-duty analysis fleet consists of every vehicle model in MY 2024 in nearly every configuration that has a different compliance fuel economy value. This results in nearly 4,000 individual rows in the Vehicles Tab of the Market Data Input File.
The next section discusses how the agency's analysis evaluates how effectively adding technology to a vehicle in the analysis fleet improves that vehicle's fuel economy value.
c. Technology Effectiveness Values
The CAFE Model uses technology effectiveness values to allow it to know which technologies to apply. Without these values, it does not know how effective any particular technology is at improving a vehicle's fuel economy value. Accurate technology effectiveness estimates require information about (1) the vehicle type and size; (2) other technologies on the vehicle or being added to the vehicle at the same time; and (3) and how the vehicle is driven. Any oversimplification of these complex factors could make the effectiveness estimates less accurate.
To build a database of technology effectiveness estimates that includes these factors, NHTSA partners with Argonne. Argonne has developed and maintains a modeling and simulation tool called Autonomie that generates technology effectiveness estimates for the CAFE Model. The Autonomie Model is a mathematical representation of an entire vehicle, including its individual technologies (such as the engine and transmission), overall vehicle characteristics (such as mass and aerodynamic drag), and environmental conditions (such as ambient temperature and barometric pressure). The Autonomie Model simulates vehicle behavior over time.
NHTSA simulates a vehicle model's behavior over the two-cycle tests used to measure vehicle fuel economy.[102]
The two-cycle test is carried out by operating a vehicle on a dynamometer. Using a dynamometer is like running a car on a treadmill following a program—or more specifically, two programs. The programs are the Federal Test Procedure (FTP) and the Highway Fuel Economy Test (HFET). The FTP and HFET are also commonly referred to as the urban cycle and highway cycle, respectively. For the FTP drive cycle, the vehicle meets certain speeds at certain times during the test, or in technical terms, the vehicle must follow a designated speed trace.[103]
The FTP is meant to simulate stop-and-go city driving, and the HFET is meant to simulate steady flowing highway driving at about 50 miles per hour (mph). The agency also uses Society of Automotive Engineers (SAE) recommended practices to simulate hybridized drive cycles,[104]
which involves the test cycles mentioned above as well as additional test cycles to measure battery energy consumption and range. For PHEVs, this analysis utilizes only the gasoline (charge-sustaining) mode for the drive cycles.
Measuring every vehicle's fuel economy value by using the same test cycles ensures that the fuel economy certification results are repeatable for each vehicle model and comparable across all the different vehicle models. When performing physical vehicle cycle testing, sophisticated test and measurement equipment is calibrated according to strict industry standards, which ensures repeatability and comparability of the results. Testing variables can include dynamometers, environmental conditions, types and locations of measurement equipment, and precise testing procedures. These physical tests provide the benchmarking empirical data used to develop and verify Autonomie's vehicle control algorithms and simulation results. Autonomie's inputs are discussed in more detail later in this section.
Full-vehicle modeling and simulation are also essential to measuring how all technologies on a vehicle interact. For example, if technology A improves a particular vehicle's fuel economy by 5 percent and technology B improves a particular vehicle's fuel economy by 10 percent, an analysis using single or limited point estimates may erroneously assume that applying both of these technologies together would achieve a simple additive fuel economy improvement of 15 percent. Single point estimates generally do not provide accurate effectiveness values because they do not capture complex relationships among technologies. Technology effectiveness often differs significantly depending on the vehicle type (
e.g.,
sedan or pickup truck) and the way in which the technology interacts with other technologies on the vehicle, as different technologies may provide different incremental levels of fuel economy improvement if implemented alone or in combination with other technologies. Any oversimplification of these complex factors could lead to less accurate technology effectiveness estimates.
In addition, because manufacturers often add several fuel-saving technologies simultaneously when redesigning a vehicle, it is difficult to isolate the effect of adding any one individual technology to the full-vehicle system. Modeling and simulation offer the opportunity to isolate the effects of individual technologies by using a single or small number of initial vehicle configurations and incrementally adding technologies to those configurations. This provides a consistent reference point for the incremental effectiveness estimates for each technology and for combinations of technologies for each vehicle type.
( printed page 62030)
Vehicle modeling also reduces the potential for overcounting or undercounting technology effectiveness.
Argonne does not build an individual vehicle model for every single-vehicle configuration in NHTSA's light-duty Market Data Input File. This would be nearly impossible, because Autonomie requires very detailed data on hundreds of different vehicle attributes (
e.g.,
the weight of the vehicle's fuel tank, the weight of the vehicle's transmission housing, the weight of the engine, or the vehicle's 0-60 mph time) to build a vehicle model. For practical reasons, NHTSA cannot acquire 4,000 vehicles and obtain these measurements every time the agency promulgates a new rule, and the agency cannot acquire vehicles that have not yet been built. Rather, Argonne builds a discrete number of vehicle models representative of the most popular vehicles on sale in the current fleet. The agency refers to the vehicle model's type and performance level as the vehicle's “technology class.” By assigning each vehicle in the Market Data Input File a “technology class,” NHTSA can connect it to the Autonomie effectiveness estimate that best represents how effective the technology would be on the vehicle, accounting for vehicle characteristics like body style (
e.g.,
sedan or pickup truck) and performance metrics. Because each vehicle technology class has unique characteristics, the effectiveness of technologies and combinations of technologies is different for each technology class.
There are 10 technology classes for this analysis: small car (SmallCar), small performance car (SmallCarPerf), medium car (MedCar), medium performance car (MedCarPerf), small SUV (SmallSUV), small performance SUV (SmallSUVPerf), medium SUV (MedSUV), medium performance SUV (MedSUVPerf), pickup truck (Pickup), and high towing pickup truck (PickupHT).
NHTSA uses a two-step process that involves two algorithms to give vehicles a “fit score” that determines which vehicles best fit into each technology class. At the first step, the agency determines the vehicle's size. At the second step, NHTSA determines the vehicle's performance level. Both algorithms consider several metrics about the individual vehicle and compare that vehicle to other vehicles in the analysis fleet. This process is discussed in detail in Final TSD Chapter 2.2.
Consider NHTSA's example Ravine Runner F Series, which is a medium-sized performance SUV. The exact same combination of technologies on the Ravine Runner F Series operate differently in a compact car or pickup truck because they are different vehicle sizes. The example Ravine Runner F Series also achieves slightly better performance metrics than other medium-sized SUVs in the analysis fleet. By “performance metrics,” the agency means power, acceleration, handling, braking, and so on. For the performance versus standard technology classification, the agency considers the vehicle's estimated 0-60 mph time compared to an average 0-60 mph time for the vehicle's technology class. Accordingly, the “technology class” for the Ravine Runner F Series in the agency's analysis is “MedSUVPerf,” because it meets the criteria of a “performance” 0-60 mph acceleration time.
Table II-2 shows how vehicles in different technology classes that use the exact same fuel economy technology have very different absolute fuel economy values. Note that the Autonomie absolute fuel economy values are not used directly in the CAFE Model; NHTSA calculates the ratio between two Autonomie absolute fuel economy values (one for each technology key for a specific technology class) and applies that ratio to an analysis fleet vehicle's starting fuel economy value.
Depending on the technology, when two technologies are added to the vehicle together, they may not result in an additive fuel economy improvement. This is an important concept to understand because in Section II.D, NHTSA presents technology effectiveness estimates for every single combination of technology that could be applied to a vehicle. In some cases, technology effectiveness estimates show that a combined technology has a different effectiveness estimate than if the individual technologies were added together individually. However, this is expected and not an error.
Continuing NHTSA's example from above, turbocharging technology and dynamic cylinder deactivation (DEAC) technology both improve fuel economy by reducing the engine displacement and accordingly burning less fuel. Turbocharging allows a manufacturer to use a smaller engine that can offer performance equivalent to a larger naturally aspirated engine, and its fuel efficiency improvements are, in part, due to the reduced displacement. DEAC effectively makes an engine with a particular displacement intermittently offer some of the fuel economy benefits of a smaller displacement engine by deactivating cylinders when the work demand does not require the full engine displacement and reactivating them as-needed to meet higher work demands; the greater the displacement of the deactivated cylinders, the greater the fuel economy benefit. Therefore, a manufacturer upgrading to an engine that uses both a turbocharger and DEAC technology, like the TURBOD engine in the example above, would not see the full combined fuel economy improvement from that specific combination of technologies. Table II-3 shows a vehicle's fuel economy value when using the first-level DEAC technology and when using the first-level turbocharging technology, compared to the agency's example vehicle that uses both of those
( printed page 62031)
technologies combined with a TURBOD engine.
As expected, the percent improvement in Table II-3 between the first and second rows is 1.7 percent and between the third and fourth rows is 0.3 percent, even though the only difference within the two sets of technology keys is the DEAC technology (note that the agency only compares technology keys within the same technology class). This is because there are complex interactions between all fuel economy-improving technologies. The agency models these individual technologies and groups of technologies to reduce the uncertainty and improve the accuracy of the CAFE Model outputs.
Some technologies that NHTSA discusses in Section II.D include advanced engine and hybrid powertrain technology—with some combinations that do not pair well. As an example, NHTSA does not see a particularly high effectiveness improvement from applying advanced engines to existing parallel strong hybrid (
e.g.,
P2) architectures.[105]
In this instance, the P2 powertrain improves fuel economy, in part, by allowing the engine to spend more time operating at efficient engine speed and load conditions. This reduces the advantage of adding advanced engine technologies, which also improve fuel economy, by broadening the range of speed and load conditions for the engine to operate at high efficiency. This redundancy in fuel-saving mechanisms results in a lower effectiveness when the technologies are added to each other. Again, NHTSA expects that different combinations of technologies will provide different effectiveness improvements on different vehicle types. These examples all illustrate relationships observed using only full-vehicle modeling and simulation.
Just as NHTSA's CAFE Model analysis requires a large set of technology inputs and assumptions, the Autonomie modeling uses a large set of technology inputs and assumptions. Figure II-2 below shows the suite of fuel consumption input data used in the Autonomie modeling to generate the fuel consumption input data NHTSA uses in the CAFE Model.
( printed page 62032)
As shown in Figure II-2 above, full-vehicle benchmarking is a major source of data for the Autonomie model. For full-vehicle benchmarking, vehicles are instrumented with sensors and tested on both the road and chassis dynamometers (
i.e.,
the full-vehicle treadmills used to exercise the vehicle to provide means to calculate a vehicle's fuel economy values) under different conditions and duty-cycles. Vehicles are selected for benchmarking with the goal of selecting a mix of vehicles most representative of vehicle fleet and available technologies, taking into account sales volume, cost, and availability. Some examples of full-vehicle benchmark testing performed in conjunction with the agency's partners at Argonne include a 2019 Chevrolet Silverado, a 2021 Toyota Rav4 Prime, and a 2022 Hyundai Sonata Hybrid.[106]
NHTSA has produced a report for each vehicle benchmarked, which can be found in the docket. As discussed further below, full-vehicle benchmarking data are used as inputs to the engine modeling and Autonomie full-vehicle simulation modeling. Component benchmarking is like full-vehicle benchmarking, but instead of testing a full vehicle, the agency instruments a single production component or prototype component with sensors and tests it on a similar duty-cycle as a full vehicle. Examples of components NHTSA benchmarks include engines, transmissions, axles, electric motors, and batteries. Component benchmarking data are used as an input to component modeling, where a production or prototype component is changed in fit, form, or function and modeled in the same scenario. As an example, NHTSA might model a decrease in the size of holes in fuel injectors to see the fuel atomization impact or see how it affects the fuel spray angle.
NHTSA uses a range of models to perform component modeling. As shown in Figure II-2, battery pack modeling using Argonne's BatPaC Model [107]
and engine modeling are two of the most significant component models used to generate data for the Autonomie modeling. NHTSA discusses BatPaC in detail in Section II.D, but briefly, BatPaC is the battery pack modeling tool used to estimate the cost of vehicle battery packs for all hybridized vehicles, which is based on the materials chemistry, battery design, and manufacturing design of the plants manufacturing the battery packs.
Engine modeling is used to generate engine fuel map models that define the fuel consumption rate for an engine equipped with specific technologies when operating over a variety of engine load and engine speed conditions. Some performance metrics captured in engine modeling include power, torque, airflow, volumetric efficiency, fuel consumption, turbocharger performance and matching, pumping losses, and more. Each engine map model has been developed ensuring the engine will still operate under real-world constraints using a suite of other models. Some examples of these models that ensure the engine map models capture real-world operating constraints include simulating heat release through a predictive combustion model, simulating knock characteristics through a kinetic fit knock model,[108]
and using physics-based heat flow and friction models, among others. NHTSA simulates these constraints using data gathered from component benchmarking as well as engineering and physics calculations.
Argonne also compiles a database of vehicle attributes and characteristics reasonably representative of the vehicles in that technology class used to build the vehicle models. Relevant vehicle attributes may include a vehicle's fuel efficiency, HP, 0-60 mph acceleration time, and stopping distance, among others, while vehicle characteristics may include whether the vehicle has AWD, 18-inch wheels, summer tires, and so on. Argonne has identified representative vehicle attributes and characteristics for the light-duty fleet from publicly available information and automotive benchmarking databases, such as A2Mac1,[109]
Argonne's Downloadable Dynamometer Database (D[3]
),[110]
EPA compliance and fuel economy data,[111]
EPA guidance on 2-cycle tests,[112]
and industry partnerships.[113]
The resulting vehicle technology class baseline assumptions and characteristics database consists of over 100 different attributes like vehicle height and width and weights for individual vehicle parts.
Argonne then assigns “reference” technologies to each vehicle model. The reference technologies are the technologies on the first step of each CAFE Model technology pathway, and they closely (but not exactly) correlate to the technology abbreviations that NHTSA uses in the CAFE Model. As an example, the first Autonomie vehicle model in the MedSUVPerf technology class starts out with the least advanced engine, which is DOHC (a dual-overhead cam engine) in the CAFE Model, or eng01 in the Autonomie modeling. The vehicle has the least advanced transmission (AT5), the least advanced mass reduction level (MR0), the least advanced aerodynamic body style (AERO0), and the least advanced ROLL level (ROLL0). The first vehicle model is also defined by initial vehicle attributes and characteristics that consist of data from the suite of sources mentioned above. Again, these attributes are meant to represent the average of vehicle attributes found on vehicles in a certain technology class.
Then, just as a vehicle manufacturer tests its vehicles to ensure they meet specific performance metrics, Autonomie ensures that the built vehicle model meets its performance metrics. NHTSA includes quantitative performance metrics in the agency's Autonomie modeling to ensure that the vehicle models can meet real-world performance metrics that consumers observe and that are important for vehicle utility and customer satisfaction. The four performance metrics that NHTSA uses in the Autonomie modeling for light-duty vehicles are low-speed acceleration (the time required to accelerate from 0 to 60 mph), high-speed passing acceleration (the time required to accelerate from 50 to 80 mph), gradeability (the ability of the vehicle to maintain constant 65 mph speed on a 6-percent upgrade), and towing capacity for light-duty pickup trucks. The agency has been using these performance metrics for the last several CAFE Model analyses, and vehicle manufacturers have agreed that these performance metrics are representative of the metrics considered in the automotive industry.[114]
Argonne simulates the vehicle model driving the two-cycle tests (
i.e.,
running its treadmill “programs”) to ensure that it meets its applicable performance metrics (
i.e.,
NHTSA's MedSUVPerf does not have to meet the towing capacity performance metric because it is not a pickup truck). These metrics are based on commonly used metrics in the automotive industry, including SAE J2807 tow requirements.[115]
Additional details about how NHTSA sizes light-duty powertrains in Autonomie to meet defined performance metrics can be found in the CAFE Analysis Autonomie Documentation.
If the vehicle model does not initially meet one of the performance metrics, then Autonomie's powertrain sizing algorithm increases the vehicle's engine power. The increase in power is achieved by increasing engine displacement (which is the measure of the volume of all cylinders in an engine), which might involve an increase in the number of engine cylinders, which may lead to an increase in the engine weight. This iterative process then determines if the baseline vehicle with increased engine power and corresponding updated engine weight meets the required performance metrics. The powertrain sizing algorithm stops once all the baseline vehicle's performance requirements are met.
( printed page 62034)
Some technologies require extra steps for performance optimization before the vehicle models are ready for simulation. Specifically, the sizing and optimization process is more complex for hybridized vehicles which include hybrid electric vehicle (HEVs) and PHEVs, compared to vehicles with only ICE engines, as discussed further in the Final TSD Chapter 3.3.4. As an example, a PHEV powertrain that can travel a certain number of miles on its battery energy alone (referred to as all-electric range (AER)), or as performing in electric-only mode) is also sized to ensure that it can meet the performance requirements of the SAE standardized drive cycles mentioned above in electric-only mode. Autonomie follows EPA's regulatory guidance and uses the SAE J1711 test procedure to model the incremental effectiveness of adding PHEV technology to a vehicle. The procedure from this guidance is divided into several phases that model “charge sustaining,” “charge depleting,” and “cold operation” [116]
calculations for different test cycles. This is described in detail in the CAFE Analysis Autonomie Documentation.[117]
Final TSD Chapter 3.3.4 and the CAFE Analysis Autonomie Documentation contain more information on PHEV effectiveness.
Every time a vehicle model in Autonomie adopts a new technology, the vehicle weight is updated to reflect the weight of the new technology. For some technologies, the direct weight change is easy to assess. For example, when a vehicle is updated to a higher geared transmission, the weight of the original transmission is replaced with the corresponding transmission weight (
e.g.,
the weight of a vehicle moving from a 6-speed automatic (AT6) to an 8-speed automatic (AT8) transmission is updated based on the 8-speed transmission weight). For other technologies, like engine technologies, calculating the updated vehicle weight is more complex. As discussed earlier, modeling a change in engine technology involves both the new technology adoption and a change in power (because the reduction in vehicle weight leads to lower engine loads and a resized engine). When a vehicle adopts new engine technology, the associated weight change to the vehicle is accounted for based on a regression analysis of engine weight versus power.[118]
In addition to using performance metrics commonly used by automotive manufacturers, NHTSA instructs Autonomie to mimic real-world manufacturer decisions by resizing engines only at specific intervals in the analysis and in specific ways. When a vehicle manufacturer is making decisions about how to change a vehicle model to add fuel economy-improving technology, the manufacturer could entirely
redesign
the vehicle, or the manufacturer could
refresh
the vehicle with relatively more minor technology changes. NHTSA discusses how the agency's modeling captures vehicle refreshes and redesigns in more detail below, but the details are easier to understand if the agency starts by discussing some straightforward yet important concepts. First, most changes to a vehicle's engine happen when the vehicle is redesigned and not refreshed, as incorporating a new engine in a vehicle is a 10- to 15-year endeavor at a cost of $750 million to $1 billion.[119]
However, manufacturers will use that same basic engine, with only minor changes, across multiple vehicle models. NHTSA models engine “inheriting” from one vehicle to another in both the Autonomie modeling and the CAFE Model. During a vehicle refresh, one vehicle may inherit an already redesigned engine from another vehicle that shares the same platform. In the Autonomie modeling, when a new vehicle adopts fuel-saving technologies that are inherited, the engine is not resized (
i.e.,
the properties from the reference vehicle are used directly). While this may result in a small change in vehicle performance, manufacturers have consistently told NHTSA that the high costs for redesign and the increased manufacturing complexity that would result from resizing engines for small technology changes preclude them from doing so. In addition, when a manufacturer applies mass reduction technology (
i.e.,
makes the vehicle lighter), the vehicle can use a less powerful engine because there is less weight to move. However, Autonomie will use a resized engine only at certain mass reduction application levels, as a representation of how manufacturers update their engine technologies. Again, this is intended to reflect manufacturers' comments that it would be unreasonable and unaffordable to resize powertrains for every unique combination of technologies. NHTSA has determined that the agency's rules about performance neutrality and technology inheritance result in a fleet that is essentially performance neutral.
With respect to performance neutrality, the Union of Concerned Scientists (UCS) commented that “. . . the Autonomie modeling is a one-way ratchet, requiring that each and every parameter must have equal or better performance.” [120]
This statement is not true, as shown by the data presented in Figure 15 of its comment, which show plots of 0-60 time vs. 2-cycle mpg for several vehicle technology classes based on the Autonomie data.[121]
In that figure, there are data points both above and below the target 0-60 time indicating that the Autonomie data do not merely apply equal or better vehicle acceleration when adding technology or resizing the powertrain. The Autonomie model does not act as a one-way ratchet in terms of vehicle performance improvement but instead aims for a target to minimize the performance difference during powertrain resizing and can either undershoot or overshoot the target by small margins. This fact is seen in the Autonomie data for any of the vehicle technology classes, some 0-60 mph performance times are better than the target and some are worse than the target. As a vehicle's weight is reduced, its performance will increase if vehicle power and gearing remain the same, which is the assumption the Autonomie model runs until the model reaches a 10-percent reduction in vehicle mass, at which point it runs a resizing loop to adjust power output until vehicle performance is within the specified target and tolerance range.[122]
There will naturally be some variation in vehicle 0-60 mph performance time as technology is added between resizing events. NHTSA monitors vehicle performance fluctuation for each rule making analysis and believes that performance neutrality is being achieved and is in line with industry behavior. NHTSA's approach to performance neutrality considers
( printed page 62035)
technology pathways that manufacturers could take to maintain similar vehicle attributes while assessing the cost and benefits of fuel economy focused technology.[123]
Doing so simplifies the analysis when considering various scenarios to set stringencies by reducing the variability of vehicle attributes and their perceived value to consumers. NHTSA has made no changes to its performance neutrality approach for this final rule.
NHTSA's analysis ensures that vehicle models maintain consistent performance levels to allow NHTSA to estimate the costs and benefits of different levels of fuel economy standards more accurately. For its analysis, NHTSA wants to capture only the costs and benefits that result from NHTSA changing its CAFE standards. For example, a manufacturer may add a turbocharger to its engine without downsizing the engine and then direct all the additional engine work to additional vehicle HP instead of vehicle fuel economy improvements. If NHTSA modeled increases or decreases in performance because of fuel economy-improving technology, then that increase in performance has a monetized benefit attached to it that is not specifically due to the agency's fuel economy standards. By ensuring that the agency's vehicle modeling remains performance neutral, NHTSA can better ensure that the agency is reasonably capturing the costs and benefits due only to potential changes in the fuel economy standards.
Autonomie then adopts one single fuel-saving technology to the initial vehicle model, keeping everything else the same except for that one technology and the attributes associated with it. Once one technology is assigned to the vehicle model and the new vehicle model meets its performance metrics, the vehicle model is used as an input to the full-vehicle simulation. This means that Autonomie simulates driving the optimized vehicle models for each technology class on the test cycles NHTSA described above. As an example, the Autonomie modeling could start with 10 initial vehicle models (one for each technology class in the analysis). Those 10 initial vehicle models use a 5-speed automatic transmission (AT5). Argonne then builds 10 new vehicle models; the only difference between the 10 new vehicle models and the first set of vehicle models is that the new vehicle models have a 6-speed automatic transmission (AT6). Replacing the AT5 with an AT6 would lead either to an increase or decrease in the total weight of the vehicle because each technology class includes different assumptions about transmission weight. Argonne then ensures that the new vehicle models with the 6-speed automatic transmission meet their performance metrics. Argonne has 20 different vehicle models that can be simulated on the two-cycle tests. This process is repeated for each technology option and for each technology class. This results in 10 separate datasets, each with over 100,000 results, which include information about a vehicle model made of specific fuel economy-improving technology and the fuel economy value that the vehicle model achieved by driving its simulated test cycles.
NHTSA condenses the million-or-so datapoints from Autonomie into three datasets used in the CAFE Model. These three datasets include (1) the fuel economy value that each modeled vehicle achieved while driving the test cycles, for every technology combination in every technology class (converted into “fuel consumption,” which is the inverse of fuel economy; fuel economy is mpg and fuel consumption is gallons per mile); (2) the fuel economy value for PHEVs driving those test cycles, when those vehicles drive on gasoline only; and (3) optimized battery sizing and associated costs for each vehicle that adopts some sort of hybridized powertrain (discussed in more detail below). NHTSA then uses these datapoints to produce the technology effectiveness values in the CAFE Model.
Technology effectiveness values allow the CAFE Model to simulate how manufacturers can improve fuel economy relative to a consistent reference point by adding technology and combinations of technologies. The effectiveness values represent the simulated relative improvement of fuel economy that can be applied to a vehicle when new technology is added. These values are calculated based on comparing the achieved fuel economies simulated using the Autonomie full-vehicle models.
NHTSA adds the technology effectiveness values to the CAFE Model as inputs. When the CAFE Model runs a simulation, the effectiveness values for that vehicle's class determine how much the vehicle's fuel economy improves with the application of each technology. The CAFE Model's compliance simulation begins with actual fuel economy values derived from compliance data. As the CAFE Model adds technology, the technology effectiveness values are applied to estimate the new fuel economy value for the vehicle, and the CAFE Model runs millions of combinations of technologies on different vehicles to find the most cost-effective means of compliance for each manufacturer and fleet.
Return to the Ravine Runner F Series example, which has a starting fuel economy value of just over 26 mpg and a starting technology key “TURBOD; AT10L2; SS12V; ROLL0; AERO5; MR3.” The equivalent Autonomie vehicle model has a starting fuel economy value of just over 30.8 mpg and is represented by the technology descriptors Mid-size SUV, Perfo, Micro Hybrid, eng38, AUp10, MR3, AERO1, or ROLL0. In MY 2028, the CAFE Model determines that Generic Motors needs to redesign the Ravine Runner F Series to reach Generic Motors' new CAFE standard. The Ravine Runner F Series now has new fuel economy-improving technology, a parallel strong HEV with a turbocharged engine with the addition of cooled exhausted recirculation (TURBOE), an integrated 8-speed automatic transmission, 30-percent improvement in ROLL, 20-percent aerodynamic drag reduction, and 10-percent lighter glider (
i.e.,
mass reduction). Its new technology key is now P2TRBE, ROLL30, AERO20, MR3. Table II-4 shows how the incremental fuel economy improvement from the Autonomie simulations is applied to the Ravine Runner F Series' starting fuel economy value.
( printed page 62036)
Note that the fuel economy values NHTSA obtains from the Autonomie modeling are based on the city and highway test cycles (
i.e.,
the two-cycle test) described above. This is because NHTSA's analysis is based on the EPA procedures used for calculating fuel economy for CAFE compliance, which uses two-cycle testing.[124]
In 2008, EPA introduced three additional test cycles to bring fuel economy “label” values from two-cycle testing in line with the efficiency values consumers were experiencing in the real world, particularly for hybrids. This is known as 5-cycle testing. Generally, the revised 5-cycle testing values have proven to be a good approximation of what consumers will experience while driving and are significantly more representative than the previous two-cycle test values of real-world fuel economy. Though the compliance modeling uses two-cycle fuel economy values, the agency uses the “on-road” fuel economy values, which are the ratio of 5-cycle to 2-cycle testing values (
i.e.,
the CAFE compliance values to the “label” values) [125]
to calculate the value of fuel savings to the consumer in the effects analysis. This is because the 5-cycle test fuel economy values better represent fuel savings that consumers will experience from real-world driving. FRIA Chapter 4.3.1 and Section 5.3.2 of the CAFE Model Documentation contain more information about these calculations. NHTSA's discussion of the effects analysis is presented later in this section.
In sum, NHTSA uses Autonomie to generate modeling and simulation technology effectiveness estimates. These estimates ensure that the modeling captures differences in technology effectiveness due to (1) vehicle size and performance relative to other vehicles in the analysis fleet; (2) other technologies on the vehicle or being added to the vehicle at the same time; and (3) how the vehicle is driven. The modeling approach allows the isolation of technology effects in the analysis supporting an accurate assessment and comports with the NAS 2015 recommendation to use full-vehicle modeling supported by the application of lumped improvements at the sub-model level.[126]
In NHTSA's analysis, “technology effectiveness values” are the relative difference between the fuel economy value for one Autonomie vehicle model driving the two-cycle tests and a second Autonomie vehicle model that uses new technology driving the two-cycle tests. NHTSA adds the difference between two Autonomie-generated fuel economy values to a vehicle in the Market Data Input File's CAFE compliance fuel economy value. NHTSA then calculates the costs and benefits of different levels of fuel economy standards using the incremental improvement required to bring an analysis fleet vehicle model's fuel economy value to a level that contributes to a manufacturer's fleet meeting its CAFE standard.
In the next section, Technology Costs, NHTSA describes the process of generating costs for the Technologies Input File.
d. Technology Costs
NHTSA estimates present and future costs for fuel-saving technologies by taking into consideration the type of vehicle or type of engine when technology costs vary by application. These cost estimates are based on three main inputs. First, direct manufacturing costs (DMCs), or the component and labor costs of producing and assembling the physical parts and systems, are estimated assuming high-volume production. Second, NHTSA estimates indirect costs. DMCs generally do not include the indirect costs of tools, capital equipment, financing, engineering, sales, administrative support, or return on investment (ROI). NHTSA accounts for these indirect costs via a scalar markup of DMCs, which is termed the retail price equivalent (RPE). Finally, the costs for technologies may change over time as industry streamlines design and manufacturing processes. To model this, the agency estimates potential cost improvements with cost learning. The retail cost of equipment in any future year is estimated to be equal to the product of the DMC, RPE, and cost learning. Considering the retail cost of equipment, instead of merely DMCs, allows NHTSA to account for the real-world price effects of a technology as well as market realities. Each of these technology cost components is described briefly below and in the following individual technology sections as well as in detail in Chapters 2 and 3 of the Final TSD.
DMCs are the component and assembly costs of the physical parts and systems that make up a complete vehicle. NHTSA uses agency-sponsored tear-down studies of vehicles and parts to estimate the DMCs of individual technologies in addition to independent tear-down studies, other publications,
( printed page 62037)
and confidential business information (CBI). In the simplest cases, NHTSA sponsors studies to produce results that confirm or refute third-party industry estimates and to determine alignment with confidential information provided by manufacturers and suppliers. In cases where the tear-down study results differ significantly from credible independent sources, the agency scrutinizes the study assumptions and sometimes revises or updates the analysis accordingly.
Due to the variety of technologies and their applications and the cost and time required to conduct detailed tear-down analyses, NHTSA did not sponsor tear-down studies for every technology. In addition, the analysis includes some fuel-saving technologies that are pre-production or sold in very small pilot volumes, but for which appropriate data are available for the range of vehicles the agency models. For those technologies, NHTSA could not conduct a tear-down study to assess costs because the product is not yet in the marketplace for evaluation. In these cases, the agency relies upon third-party estimates and confidential information from suppliers and manufacturers; however, relying on CBI to estimate costs introduces several analytical challenges. First, the agency and the CBI source may use incongruent or incompatible baselines or reference points from which to measure costs. Second, sources may provide incomplete data or project DMCs far into the future based on overly optimistic production volumes—critical caveats that the agency must weigh carefully. Furthermore, a manufacturer's proprietary cost structure may be influenced by intellectual property rights or exclusive strategic partnerships. Because not all manufacturers can access these proprietary technologies at the same price point, replicating these costs within the CAFE Model could be difficult. Given these complexities, NHTSA spends significant resources scrutinizing all new data, particularly those concerning emerging technologies.
While costs for fuel-saving technologies reflect the best estimates available at the time of this analysis, technology cost estimates likely will change in the future as technologies are deployed, production is expanded, and nascent technologies mature. For emerging technologies, NHTSA uses the best information available at the time of the analysis and continues to update cost assumptions for any future analysis. Chapter 3 of the Final TSD discusses each category of technologies (
e.g.,
engines, transmissions, or hybridization) and the cost estimates the agency uses for this analysis.
As discussed above, direct costs represent the costs associated with acquiring raw materials, fabricating parts, and assembling vehicles with the various technologies that manufacturers are expected to use to improve the fuel economy of their fleets. They include materials, labor, and variable energy costs required to produce and assemble the vehicle. However, direct costs do not include overhead costs required to develop and produce the vehicle, costs incurred by manufacturers or dealers to sell vehicles, or the profit manufacturers and dealers make from their investments. These items together contribute to the price consumers ultimately pay for the vehicle. Table II-5 illustrates how these components can affect retail prices.
( printed page 62038)
To estimate total consumer costs (
i.e.,
both direct and indirect costs), NHTSA multiplies a technology's DMCs by an indirect cost factor (the RPE) to represent the average price for fuel-saving technologies at retail. The RPE markup factor is based on an examination of historical financial data contained in 10-K reports filed by manufacturers with the Securities and Exchange Commission. It represents the ratio between the retail price of motor vehicles and the direct costs of all activities in which manufacturers engage.
For more than three decades, the retail price of motor vehicles has been, on average, roughly 50 percent above the direct cost expenditures of manufacturers. That is, the retail price is approximately 1.5 times the direct cost expenditures.[127]
This ratio has been consistent, averaging roughly 1.5 with minor variations from year to year over this period. At no point has the RPE markup based on 10-K reports exceeded 1.6 or fallen below 1.4, based on data from 1972-1997 and 2007.[128]
During this timeframe, the average annual increase in real direct costs was 2.5 percent, and the average annual increase in real indirect costs was also 2.5 percent. The RPE averages 1.5 across the lifetime of technologies of all ages, with a lower average in earlier years of a technology's life, and, because of learning effects on direct costs, a higher average in later years. Many automotive industry stakeholders have either endorsed the 1.5 markup or have estimated alternative RPE values. As seen in Table II-6, all estimates range between 1.4 and 2.0, and most are in the 1.4 to 1.7 range.[129]
An
RPE of 1.5 does not mean that manufacturers automatically mark up each vehicle by exactly 50 percent. Rather, it means that, over time, the competitive marketplace has resulted in pricing structures that average out to this relationship across the entire industry. Prices for any individual model may be marked up at a higher or lower rate depending on market demand. On average, over time and across the vehicle fleet, consumers spend about $1.50 for each dollar of direct costs incurred by manufacturers. Based on NHTSA's own evaluation and the widespread use and acceptance of the RPE by automotive industry stakeholders, the agency has determined that the RPE provides a reasonable indirect cost markup for use in the analysis. A detailed discussion of indirect cost methods and the basis for the agency's use of the RPE to reflect these costs, rather than other indirect cost markup methods, is available in the FRIA for the 2020 final rule.[131]
IPI criticized the established application of RPE in NHTSA's analysis. IPI asserted that “NHTSA must update its indirect cost factor to reflect recent
( printed page 62039)
data and to remove any transfer effects.” [132]
NHTSA disagrees with IPI's assertion and continues to use the best available information for RPE (indirect cost factor). NHTSA justifies its choice of an indirect cost factor as a central estimate of a long run markup factor. IPI provided neither evidence that the long-stable indirect cost factor (RPE) has changed substantively since the most recent comprehensive analysis nor examples of estimates of indirect cost factors or RPEs that are more recent than those cited in the proposal.[133]
IPI based its assertion on a structural model of implied firm markups, which is a categorically different measure than indirect cost factors or RPE [134]
(IPI likely conflated the two concepts because the term “markup” is used to describe each of these distinct measures). IPI also argued in its comment that NHTSA cannot consider vehicle price changes resulting from regulatory action due to OMB guidance in Circular A-4, but it misunderstands that document, since here the purpose of NHTSA's analysis is to measure the potential impacts of a regulatory action.
IPI claimed that NHTSA is irrationally counting RPE as a cost when IPI believes that RPE represents a transfer. IPI asserted that original equipment manufacturers (OEMs) have pricing power and then incorrectly characterizes RPE as representing “monopoly profits.” IPI also argued that NHTSA cannot account for the impact of changing new vehicle prices on consumer welfare due to guidance in Circular A-4.
In response to IPI's comment, NHTSA notes that Chapter 2.4 in the Final TSD provides NHTSA's rationale for including indirect costs in technology costs. IPI's representation of indirect costs (and as a result technology costs associated with standard setting) conflates manufacturer profits with impacts on vehicle prices. RPE represents indirect costs such as the costs of tools, capital equipment, financing, engineering, sales, administrative support, or ROI associated with the application of new vehicle technology. The RPE assumes that, over time, the competitive marketplace results in pricing structures that average out to this relationship across the automotive industry.[135]
In addition, Circular A-4 provides instruction and guidance to agencies in developing assessments of the costs and benefits of regulatory actions and alternatives to those actions pursuant to Section 6(a)(3)(C) of Executive Order 12866. Here, NHTSA's standard-setting analysis is prescribed by law to consider the four statutory factors set forth in EPCA: technological feasibility, economic practicability, the effect of other motor vehicle standards of the Government on fuel economy, and the need of the United States to conserve energy.[136]
NHTSA's analysis of technology costs and RPE are consistent with this statutory directive and previous rulemakings. Measuring the technology costs paid by consumers through higher new vehicle prices provides a transparent representation of standards' effects on consumers.
Finally, manufacturers make improvements to production processes over time, which often result in lower costs. “Cost learning” reflects the effect of experience and volume on the cost of production, which results generally in better utilization of resources, leading to higher and more efficient production. As manufacturers gain experience through production, they refine production techniques, raw material and component sources, and assembly methods to maximize efficiency and reduce production costs.
NHTSA estimates cost learning by considering methods established by T.P. Wright and later expanded upon by J.R. Crawford. Wright, examining aircraft production, found that every doubling of cumulative production of airplanes resulted in decreasing labor hours at a fixed percentage. This fixed percentage is commonly referred to as the progress rate or progress ratio, where a lower rate implies faster learning as cumulative production increases. J.R. Crawford expanded upon Wright's learning curve theory to develop a single unit cost model, which estimates the cost of the nth unit produced where the following information is known: (1) cost to produce the first unit; (2) cumulative production of n units; and (3) the progress ratio.
Consistent with Wright's learning curve, NHTSA uses the basic approach by Wright for most technologies in the CAFE Model, with NHTSA estimating technology cost reductions by applying a fixed percentage to the projected cumulative production of a given fuel economy technology in a given model year.[137]
The agency estimates the cost to produce the first unit of any given technology by identifying the DMC for a technology in a specific model year. As discussed in detail below, and in Chapter 3 of the Final TSD, NHTSA's technology DMCs come from studies, teardown reports, other publicly available data, and feedback from manufacturers and suppliers. Because different studies or cost estimates are based on costs in specific model years, the agency identifies the “base” model years for each technology where the learning factor is equal to 1.00. Then, the agency applies a progress ratio to back-calculate the cost of the first unit produced. The majority of technologies in the CAFE Model use a progress ratio (
i.e.,
the slope of the learning curve, or the rate at which cost reductions occur with respect to cumulative production) of approximately 0.89, which is derived from average progress ratios researched in studies funded or identified by NHTSA.[138]
Many fuel economy technologies that have existed in vehicles for some time will have a gradual sloping learning curve implying that cost reductions from learning is moderate and eventually becomes less steep toward MY 2050. Conversely, newer technologies have a steeper learning curve initially, where cost
( printed page 62040)
reduction occurs at a high rate. Mature technologies generally have a flatter curve and may not incur much cost reduction, if at all, from learning. Final TSD Chapter 2.4.4 provides an illustration showing various slopes of learning curves.
The agency assigns groups of similar technologies or technologies of similar complexity to each learning curve. Though the grouped technologies differ in operating characteristics and design, NHTSA chooses to group them based on market availability, complexity of technology integration, and production volume of the technologies that can be implemented by manufacturers and suppliers. In general, the agency considers most basic engine and transmission technologies to be mature technologies that do not experience any additional improvements in design or manufacturing. Other basic engine technologies, like variable valve lift (VVL), stoichiometric gasoline direct injection (SGDI), and DEAC, decrease in costs through around MY 2036, because those were introduced into the market more recently. All advanced engine technologies follow the same general pattern of a gradual reduction in costs until MY 2036, when they plateau and remain flat. NHTSA expects the cost to decrease as production volumes increase, manufacturing processes are improved, and economies of scale are achieved. The agency has assigned advanced engine technologies based on a singular preceding technology to the same learning curve as that preceding technology. Similarly, the more advanced transmission technologies experience a gradual reduction in costs through MY 2031, when they plateau and remain flat. Lastly, the agency estimates that the learning curves for road load technologies, with the exception of the most advanced mass reduction level (which decreases at a fairly steep rate through MY 2040, as discussed further below and in Chapter 3.4 of the Final TSD), will decrease through MY 2036 and then remain flat.
For technologies that have been in production for many years, like some engine and transmission technologies, this approach produces reasonable estimates that NHTSA can compare against other studies and publicly available data. Generating the learning curve for battery packs for hybrid vehicles in future model years is significantly more complicated, and NHTSA discusses how the agency generated those learning curves in detail in Chapter 3.3 of the Final TSD. NHTSA's battery pack learning curves recognize that there are many factors that could potentially lower battery pack costs over time outside of cost reductions from improvements in manufacturing processes due to knowledge gained through experience in production.
Table II-7 shows how some of the technologies on the example MY 2024 Ravine Runner F Series decrease in cost over several years. Note that these costs are specifically applicable to the MedSUVPerf class, and other technology classes may have different costs for the same technologies. These costs are pulled directly from the Technologies Input File, meaning that they include the DMC, RPE, and learning.
e. Simulating Tax Credits
The Inflation Reduction Act (IRA) included several tax credits intended to encourage the adoption of clean vehicles.[139]
OB3 amended these credits through a combination of stricter eligibility requirements and earlier phase out of certain credits.[140]
Consistent with prior rulemakings, NHTSA assumes that non-plug-in hybrids do not qualify for the tax credits because their battery size is below the minimum thresholds set within the credit provisions. As noted throughout this preamble, NHTSA is statutorily prohibited from considering the fuel economy of dedicated automobiles and therefore has excluded dedicated vehicles from the analysis. The agency considers the fuel-based efficiency of dual-fueled vehicles, such as PHEVs, which are the only vehicles the agency models that are eligible for tax credits.
NHTSA models three provisions of the IRA—the Advanced manufacturing production credit (“AMPC” or “45X”), the Clean vehicle credit (“30D”), and the Credit for qualified commercial clean vehicles (“45W”). The AMPC, which provides a $35 per kWh tax credit for manufacturers of battery cells and an additional $10 per kWh for manufacturers of battery modules (all applicable to manufacture in the United States), is modeled through its phase out in 2032 in this final rule.[141]
The 30D and 45W credits (collectively, the Clean Vehicle Credits or “CVCs”) are modeled through their sunset, which for modeling purposes is assumed to be MY 2025.[142 143]
The 30D credit provided up to $7,500 toward the purchase of new clean vehicles with critical minerals either extracted or processed in the United States or a country with which the United States has a free trade agreement or recycled in North America and battery components manufactured or assembled in North America.[144]
In
( printed page 62041)
contrast to 30D, the 45W credit did not have the same critical minerals and production restraints, but instead the credit value is the lesser of the incremental cost to purchase a comparable ICE vehicle or 15 percent of the cost basis for PHEVs up to $7,500 for vehicles with a gross weight vehicle rating (GVWR) less than 14,000 pounds. The Department of the Treasury set safe harbors for claiming credits based on DOE's Incremental Purchase Cost Methodology and Results for Clean Vehicles report.[145]
The safe harbors were set at the full amount of $7,500 for most vehicles except for smaller PHEV sedans, which were capped just shy of the maximum value.[146]
Given the relatively small difference between the full credit value and the cap for smaller PHEV sedans, and the few vehicle lines categorized as smaller sedans, the agency assumed that all vehicles could qualify for the full credit as a modeling simplification. The 45W credit was also available only to commercial purchasers; however, the Department of the Treasury determined that leased vehicles could be eligible for the 45W credit where the financing company was the owner of the vehicle for Federal income tax purposes. NHTSA jointly models the CVC tax credits. Both credits are available at the time of sale and provided up to $7,500 towards the purchase of light-duty vehicles acquired on or before September 30, 2025. Because only one of the CVCs could be claimed for each vehicle purchase, NHTSA models them jointly.
The CAFE Model projects vehicles in model year cohorts rather than on a calendar year basis. Given that model years and calendar years can be misaligned (
e.g.,
a MY 2024 vehicle could be sold in CYs 2023, 2024, or even 2025), choosing which calendar year a model year falls into is important for assigning tax credits that are phased out during the analytical period. NHTSA analyzed the timing of new vehicle sales and new vehicle registrations and determined that, for this final rule, it is appropriate to assume that credits available in a given calendar year are available to all vehicles sold in the same model year.
In the NPRM, the agency elected not to model the AMPC past MY 2025 because of the more stringent requirements imposed by OB3 restricting usage of materials from prohibited foreign entities (PFE) (
i.e.,
constrained eligibility for the tax credit based on materials sources) and uncertainty about whether manufacturers could meet the non-PFE component threshold percentages. NHTSA conducted a sensitivity analysis for the NPRM where the AMPC extended through its statutory sunset in MY 2032.
Attorneys General from Multiple States (Attorneys General) argued that NHTSA failed to include the cost-reducing effects of the 45X credit to inflate artificially the price of hybrid vehicles, and that NHTSA incorrectly assumed that automakers would not meet the required domestic component thresholds and foreign entity constraints.[147]
The Attorneys General countered that significant recent onshoring means the industry can take advantage of the 45X credit. BlueGreen Alliance (BGA) commented that while Congress recently eliminated other EV incentives, it intentionally preserved the 45X credit.[148]
They argue that maintaining strong CAFE standards works hand-in-hand with the 45X credit and President Trump's executive actions to support onshore domestic battery manufacturing and secure America's critical mineral supply chain. The Alliance acknowledged the sunsetting of the 30D and 45W tax credits and noted that 45X eligibility was also tightened.149
The agency took these comments into consideration and updated the 45X phase out years for the final rule.
The agency assumes that manufacturers and consumers each capture half of the dollar value of the AMPC and CVCs. The agency assumes that manufacturers' shares of both credits will offset part of the cost to supply models eligible for the credits—PHEVs, specifically. The subsidies reduce the costs of eligible vehicles and increase their attractiveness to buyers. Because the AMPC credit scales with battery capacity, NHTSA determines battery energy capacity separately for each vehicle based on Argonne simulation outputs. Final TSD Chapter 2.3.2 contains a detailed discussion of these assumptions. NHTSA accounts for all the eligibility requirements of 30D and the AMPC, such as the location of final assembly and battery production, the origin of critical minerals, and the income restrictions of 30D through the credit schedules constructed in part based off of these factors and allows all PHEVs produced and sold during the timeframe that tax credits are offered to be eligible for those credits subject to the MSRP restrictions discussed below.[150]
To account for the agency's inability to model dynamically sourcing requirements and income limits for 30D, NHTSA uses projected values of the average value of 30D and the AMPC for the final rule. The projections increase throughout the analysis due to the expectation that gradual improvements in supply chains over time would allow more vehicles to qualify for the credits.
NHTSA uses a DOE report that provides combined values of the CVCs.[151]
These values consider the latest information of PHEV penetration rates, PHEV retail prices, the share of United States PHEV sales that meet the critical minerals and battery component requirements, the share of vehicles that exclude suppliers that are “Foreign Entities of Concern,” and lease rates for vehicles that qualify for the 45W CVC. The DOE projections are the most detailed and rigorous projections of credit availability that NHTSA is aware of at this time, and DOE has not released updated projections that reflect the enactment of OB3. Final TSD Chapter 2.5.3 includes more information on the average AMPC credit per kWh that NHTSA uses in this final rule.
The CAFE Model accounts for the statutory MSRP restrictions of 30D by assuming that the CVCs cannot be applied to cars with an MSRP above $55,000 or other vehicles with an MSRP above $80,000, which are ineligible for 30D. The 45W credit does not have the same MSRP restrictions; however, because NHTSA is unable to model the CVCs separately at this time, the agency has to choose whether to model the restriction for both CVCs or not to
( printed page 62042)
model the restriction at all. NHTSA chooses to include the restriction for both CVCs to be conservative.[152]
Chapter 2.5.2 of the Final TSD contains additional details on how NHTSA implements tax credits.
NHTSA uses real dollars for future costs and benefits, such as technology costs in future model years. Including the tax credits as nominal dollars instead of real dollars artificially raises the value of the credits in respect to other costs, so NHTSA converts the DOE projections to real dollars.
NHTSA does not model individual State tax credits or rebate programs. State clean vehicle tax credits and rebates vary from jurisdiction to jurisdiction and are subject to more uncertainty in funding availability and eligibility than their Federal counterparts.[153]
Tracking sales by jurisdiction and modeling each program's individual compliance program would require significant revisions to the CAFE Model while likely producing minimal changes in the net outputs of the analysis given constraints imposed by statute. NHTSA has not changed this approach for the final rule but will continue to monitor State programs for appropriateness for consideration in future rulemakings.
f. Technology Applicability Equations and Rules
As NHTSA describes above, the CAFE Model simulates cost-effective ways that vehicle manufacturers could comply with CAFE standards, subject to limits that ensure that the Model reasonably replicates manufacturers' decisions in the real world. This section describes the equations the CAFE Model uses to determine how to apply technology to vehicles, including whether technologies are cost effective, and why the agency believes the CAFE Model's calculation of potential compliance pathways reasonably represents manufacturers' decision-making. This section also gives a high-level overview of real-world limitations that vehicle manufacturers face when designing and manufacturing vehicles and how the agency includes those in the technology inputs and assumptions in the analysis.
For each manufacturer's fleet, the CAFE Model first determines whether any technology should be “inherited” from an engine, transmission, or platform that currently uses the technology and should be applied to a vehicle that is due for a refresh or redesign. NHTSA describes above how vehicle manufacturers use the same or similar engines, transmissions, and platforms across multiple vehicle models, and the agency tracks vehicle models that share technology by assigning Engine, Transmission, and Platform Codes to vehicles in the analysis fleet. As an example, variants of the Ford 10R80 10-speed transmission are currently used in the following Ford Motor Company vehicles: 2017-present Ford F-150, 2018-present Ford Mustang, 2018-present Ford Expedition/Lincoln Navigator, 2019-present Ford Ranger, and the 2020-present Ford Explorer/Lincoln Aviator. The 2WD variant of the 10R80, as applied to the CAFE Model, is shared by the 2WD Expedition models, 2WD F-150 models, and the Mustang, thus linking these models by the same Transmission Code. If one of these three vehicle model types receives a transmission upgrade, the other two would automatically receive the same upgrade at their next redesign or refresh.
After applying inherited technologies, the Model begins the process of evaluating what additional technologies could be applied to the manufacturer's vehicles. The CAFE Model applies the most cost-effective technology out of the universe of technology options that the Model could potentially apply. To determine whether a particular technology is cost effective, the Model calculates the “effective cost” of multiple technology options and chooses the option that results in the lowest “effective cost.” A technology that has an effective cost less than zero (Equation II-4 results in a negative number) is considered cost effective, as a negative effective cost implies that the technology “pays for itself.” The “effective cost” calculation is actually multiple calculations, but this section describes only the highest levels of that logic; interested readers can consult the CAFE Model Documentation for additional information on the calculation of effective cost. Equation II-4 shows the CAFE Model's effective cost calculation for this analysis.
Equation II-4: CAFE Model Effective Cost Calculation
Where:
TechCostTotal:
the total cost of a candidate technology evaluated on a group of selected vehicles;
TaxCreditsTotal:
the cumulative value, if any, of additional vehicle and battery tax credits (or Federal incentives) resulting from application of a candidate technology evaluated on a group of selected vehicles;
FuelSavingsTotal:
the value of the reduction in fuel consumption (or fuel savings) resulting from application of a candidate technology evaluated on a group of selected vehicles;
Δ
Fines:
the change in manufacturer's fines in the analysis year, if applicable;
Δ
ComplianceCredits:
the change in manufacturer's CAFE compliance value in the analysis year (denominated in thousands of gallons);
EffCost:
the calculated effective cost attributed to application of a candidate technology evaluated on a group of selected vehicles.
The components of this “cost per credit” effective cost calculation are described further here. The CAFE Model considers the total cost of a technology (TechCost) that could be applied to a group of connected vehicles, just as a vehicle manufacturer might consider what new technologies it has ready for the market and which vehicles should and could receive the upgrade. Next, like the technology costs, the CAFE Model calculates the total value of Federal incentives (TaxCredits) available for a technology that could be applied to a group of vehicles and subtracts that total incentive from the total technology costs. The total fuel cost savings (FuelSavings) are the savings in fuel expense resulting from adding additional technology or switching from one technology to another. For this, the CAFE Model must calculate the total fuel cost for the vehicle before application of a
( printed page 62043)
technology and subtract the total fuel cost for the vehicle after calculation of that technology. The total fuel cost for a given vehicle depends on both the price of gas (or gasoline equivalent fuel) and the number of miles that a vehicle is driven during the initial years of ownership, among other factors.[154]
As technology is applied to vehicles in groups, the fuel cost savings for the vehicle is then multiplied by the sales volume of a vehicle in a model year to equal total fuel cost savings, which is then subtracted in the numerator of the effective cost equation. Finally, in the numerator, the agency subtracts the change in a manufacturer's expected fines (ΔFines), which are set at $0 for this analysis as a result of Public Law 119-21, before and after application of a specific technology, if any.[155]
This approach can be thought of as subtraction of the fines
avoided
by upgrading to a certain technology. Then, the result from the sequence above is divided by the change in compliance credits (
ΔComplianceCredits), which means the difference in a manufacturer's calculated fuel economy value in a compliance category before and after the application of a technology to a group of vehicles. This approach can be thought of as dividing the result by the
gain
in fuel economy performance resulting from upgrading to a certain technology.
After inherited technologies and cost-effective (effective cost is less than zero) technologies are applied, the CAFE Model determines whether the manufacturer's fleet meets its CAFE standard. If the manufacturer is still not in compliance, the Model applies non-cost-effective technologies (which have an effective cost greater than zero, or which do not “pay for themselves”) until it runs out of technology options.
The Model runs the compliance simulation successively and accounts for technology added during each previous model year by carrying forward technologies between model years once they are applied. The CAFE Model does this by mirroring real-world decisions of manufacturers to carry forward most technologies between model years, concentrating the application of new technology to vehicle redesigns or mid-cycle “freshenings,” and design cycles vary widely among manufacturers and specific products. Comments from manufacturers and Model peer reviewers for past CAFE rules have strongly supported explicit year-by-year simulation. In addition, the multi-year planning capability increases the Model's ability to simulate manufacturers' real-world behavior, accounting for the fact that manufacturers will seek out compliance paths for several model years at a time, while accommodating the year-by-year requirement.
In addition to the Model's technology application decisions pursuant to the compliance simulation algorithm, several technology inputs and assumptions work together to determine which technologies the CAFE Model can apply. The technology pathways, discussed in detail above, are one significant way that the agency instructs the CAFE Model to apply technology. The pathways define mutually exclusive technologies (
i.e.,
those that cannot be applied at the same time) and define the direction in which vehicles can advance as the modeling system evaluates specific technologies for application. Then, the arrows between technologies instruct the Model on the order in which to evaluate technologies on a pathway, to ensure that a vehicle that uses a more fuel-efficient technology cannot downgrade to a less efficient option.
In addition to technology pathway logic, NHTSA uses several technology applicability rules to replicate better manufacturers' decision-making. The “skip” input—represented in the Market Data Input File as “SKIP” in the appropriate technology column corresponding to a specific vehicle model—is particularly important for accurately representing how a manufacturer applies technologies to their vehicles in the real world. This tells the Model not to apply a specific technology to a specific vehicle model. SKIP inputs are used to simulate manufacturer decisions, including: (1) parts and process sharing; (2) stranded capital; and (3) performance neutrality.
First, parts sharing includes the concepts of platform, engine, and transmission sharing, which are discussed in Section II.C.2.b. A “platform” refers to engineered underpinnings shared on several differentiated vehicle models and configurations. Manufacturers share and standardize components, systems, tooling, and assembly processes within their products (and occasionally with the products of another manufacturer) to manage complexity and costs for development, manufacturing, and assembly. Detailed discussion for this type of SKIP is provided in the “adoption features” section for different technologies, if applicable, in Chapter 3 of the Final TSD.
Similar to vehicle platforms, manufacturers create engines that share parts. For instance, manufacturers may use different piston strokes on a common engine block or bore out common engine block castings with different diameters to create engines with an array of displacements. Head assemblies for different displacement engines may share many components and manufacturing processes across the engine family. Manufacturers may finish crankshafts with the same tools to similar tolerances. Engines on the same architecture may share pistons and connecting rods, and the same engine architecture may include both 6- and 8-cylinder engines. One engine family may appear on many vehicles on a platform, and changes to that engine may or may not carry through to all the vehicles. Some engines are shared across a range of different vehicle platforms. Vehicle model/configurations in the analysis fleet that share engines belonging to the same platform are identified as such, and the agency also may apply a SKIP to a particular engine technology where it is known that a manufacturer shares an engine throughout several of their vehicle models and the engine technology is not appropriate for any of the platforms that share the same engine.
It is important to note that manufacturers can define a “common” engine platform in different ways. Some manufacturers consider engines as “common” if the engines share an architecture, components, or manufacturing processes. Other manufacturers take a narrower approach and consider engines “common” only if the parts in the engine assembly are the same. In some cases, manufacturers designate each engine in each application as a unique powertrain. For example, a manufacturer may have listed two engines separately for a pair that share designs for the engine block, the crankshaft, and the head because the accessory drive components, oil pans, and engine calibrations differ between the two. In practice, many engines share parts, tooling, and assembly resources, and manufacturers often coordinate design updates between two similar engines. NHTSA considers engines to be on a common platform (for purposes of coding, discussed in Section II.C.2 above, and for SKIP application) if the engines share a common cylinder count and configuration, displacement, valvetrain, and fuel type, or if the engines only differ slightly in
( printed page 62044)
compression ratio (CR), HP, and displacement.
Parts sharing also includes the concept of sharing manufacturing lines (the systems, tooling, and assembly processes discussed above), because manufacturers are unlikely to build a new manufacturing line to build a completely new engine. A new engine designed to be mass manufactured on an existing production line has limits in number of parts used, type of parts used, weight, and packaging size due to the weight limits of the pallets, material handling interaction points, and conveyance line design to produce one unit of a product. The restrictions are reflected in the usage of a SKIP of engine technology that the manufacturing line would not accommodate.
SKIPs also relate to instances of stranded capital when manufacturers amortize research, development, and tooling expenses over many years, especially for engines and transmissions. The traditional production life cycles for transmissions and engines have been a decade or longer. If a manufacturer launches or updates a product with fuel-saving technology, and then later replaces that technology with unrelated or different fuel-saving technology before the equipment and research and development investments have been fully paid off, there will be unrecouped, or stranded, capital costs. Quantifying stranded capital costs accounts for such lost investments. One design where manufacturers take an iterative redesign approach, as described in a recent SAE paper,[156]
is the MacPherson strut suspension. It is a popular low-cost suspension design, and manufacturers use it across their fleets. As the agency observed previously, manufacturers may be shifting their investment strategies in ways that may alter how stranded capital could be considered. For example, some suppliers sell similar transmissions to multiple manufacturers. Such arrangements allow manufacturers to share in capital expenditures or amortize expenses more quickly. Manufacturers share parts on vehicles around the globe, achieving greater scale and greatly affecting tooling strategies and costs.
As a proxy for stranded capital, the CAFE Model accounts for platform and engine sharing and includes redesign and refresh cycles for significant and less significant vehicle updates. This analysis continues to rely on the CAFE Model's explicit year-by-year accounting for estimated refresh and redesign cycles, and shared vehicle platforms and engines, to moderate the cadence of technology adoption and thereby limit the implied occurrence of stranded capital and the need to account for it explicitly. In addition, limiting the specific advanced technology pathways manufacturers may pursue for certain models through technology adoption prevents additional capital being dedicated towards technologies that may be quickly replaced and therefore minimizes the amount of stranded capital indirectly. Adoption features specific to each technology are discussed in each technology section.
D. Technology Pathways, Effectiveness, and Cost
The previous section has discussed, at a high level, how NHTSA generates the technology inputs and assumptions used in the CAFE Model. The process for generating these inputs and assumptions involves NHTSA using engineering judgment to evaluate and synthesize data from a variety of sources, including data submitted by vehicle manufacturers; consolidated publicly available data, such as press materials, marketing brochures, and other information; data from collaborative research, testing, and modeling with other Federal agencies and laboratories; data from research, testing, and modeling with independent organizations; data and assumptions from work done for prior rules; and feedback from stakeholders on prior rules and meetings conducted prior to the commencement of this rulemaking, to the extent it is still relevant and applicable.
This section discusses the specific technology pathways, effectiveness, and cost inputs and assumptions used in the compliance analysis. As an example, NHTSAs explained in the previous section that the starting point for estimating technology costs is an estimate of the DMC—the component and assembly costs of the physical parts and systems that make up a complete vehicle—for any particular technology.
After spending over a decade refining the technology pathways, effectiveness, and cost inputs and assumptions used in successive CAFE Model analyses, NHTSA has developed guiding principles to ensure that the CAFE Model's compliance analysis reflects impacts reasonably expected in the real world. These guiding principles are as follows:
Technologies have complementary or non-complementary interactions with the full-vehicle technology system.
The fuel economy improvement from any individual technology must be considered in conjunction with the other fuel economy-improving technologies applied to the vehicle, because technologies added to a vehicle do not result in a simple additive fuel economy improvement from each individual technology. In particular, NHTSA expects this result from engine and other powertrain technologies that improve fuel economy by allowing the ICE to spend more time operating at efficient engine speed and load conditions or from combinations of engine technologies that work to reduce the effective displacement of the engine.
The effectiveness of a technology depends on the type of vehicle to which the technology is being applied.
When discussing “vehicle type” in the analysis, NHTSA is referring to the ten vehicle technology classes (
e.g.,
small car, small car performance, medium car, medium car performance, small SUV, small SUV performance, medium SUV, medium SUV performance, pickup truck, or pickup truck high towing (HT)). A small car and a medium performance SUV that use the exact same technology have very different starting fuel economy values; when the exact same technology is added to both of those vehicles, the technology provides different effectiveness improvements for the vehicles.
The cost and effectiveness values for each technology are reasonably representative of what can be achieved across the entire industry.
Each technology model employed in the analysis is designed to be representative of a wide range of specific technology applications used in industry. Some manufacturers' systems may perform better or worse than the modeled systems and some may cost more or less than the modeled systems; however, employing this approach ensures that, on balance, the analysis captures a reasonable level of costs and benefits that would result from any manufacturer applying the technology.
A consistent reference point for cost and effectiveness values must be identified before assuming that a cost or effectiveness value could be employed for any individual technology.
For example, this analysis uses a set of engine map models developed by starting with a small number of engine configurations, and then, in a systematic and controlled process, adding specific well-defined technologies to create a new map for each unique technology combination. Again, providing a
( printed page 62045)
consistent reference point to measure incremental technology effectiveness values ensures that NHTSA is capturing accurate effectiveness values for each technology combination.
The following sections discuss the engine, transmission, hybridization, mass reduction, aerodynamic, tire rolling resistance, and other vehicle technologies considered in this analysis. The following sections discuss:
How NHTSA defines technology in the CAFE Model; [157]
How NHTSA assigns technology to vehicles in the analysis fleet used as a starting point for this analysis;
Any adoption features applied to the technology, so the analysis better represents manufacturers' real-world decisions;
Technology effectiveness values; and
Technology cost.
Note that the following technology effectiveness sections provide
examples
of the
range
of effectiveness values that a technology could achieve when applied to the entire vehicle system, in conjunction with the other fuel economy-improving technologies already in use on the vehicle. To see the incremental effectiveness values for any particular vehicle moving from one technology key to a more advanced technology key, see the CAFE Model Fuel Economy Adjustment Files that are installed as part of the CAFE Model Executable File, and
not
in the input/output folders. Similarly, the technology costs provided in each section are
examples
of absolute costs seen in specific model years, for specific vehicle classes. The Technologies Input File contains all absolute technology costs used in the analysis across all model years.
1. Engine Paths
ICE vehicles convert chemical energy in fuel to useful mechanical power. The chemical energy in the fuel is released and converted to mechanical power by being oxidized, or burned, inside the engine. The air/fuel mixture entering the engine and the burned fuel/exhaust by-products leaving the engine are the working fluids in the engine. The engine power output is a direct result of the work interaction between these fluids and the mechanical components of the engine.[158]
The generated mechanical power is used to perform useful work, such as vehicle propulsion.[159]
NHTSA classifies the extensive variety of light-duty vehicle ICE technologies into discrete Engine Paths. These paths are used to model the most representative characteristics, costs, and performance of the fuel economy-improving engine technologies most likely available during the rulemaking timeframe. The paths are intended to be representative of the range of potential performance levels for each engine technology. In general, the paths are tied to ease of implementation of additional technology and how closely the technologies are related. The technology paths are presented in Chapter 3.1.1 of the Final TSD.
The Engine Paths have been selected and refined over a period of more than 10 years, based on engines in the market, stakeholder comments, and engineering judgment, subject to the following factors: the included technologies are those most likely available during the rulemaking timeframe and within the range of potential performance levels for each technology, and excluded technologies are those unlikely to be feasible in the rulemaking timeframe, unlikely to be compatible with U.S. fuels, or for which there was not appropriate data available to allow the simulation of effectiveness across all vehicle technology classes in this analysis.
The Engine Paths begin with one of the three base engine configurations: DOHC engines have two camshafts per cylinder head (one operating the intake valves and one operating the exhaust valves), single overhead camshaft (SOHC) engines have a single camshaft, and overhead valve engines, which have a single camshaft located inside of the engine block (beneath the valves rather than overhead) connected to a rocker arm through a pushrod that actuates the valves. DOHC and SOHC engine configurations are common in the light-duty fleet.
The next step along an Engine Path is the Basic Engine Path technologies. These include VVL, SGDI, and a basic level of DEAC. VVL dynamically adjusts how far the valve opens and reduces fuel consumption by reducing pumping losses and optimizing airflow over a broader range of engine operating conditions. Instead of injecting fuel at lower pressures and before the intake valve, SGDI injects fuel directly into the cylinder at high pressures allowing for more precise fuel delivery while providing a cooling effect and allowing for an increase in the CR, more optimal spark timing for improved efficiency, or both. DEAC disables the intake and exhaust valves and turns off fuel injection and spark ignition (SI) on select cylinders, which effectively allows the engine to operate temporarily as if it were smaller while also reducing pumping losses to improve efficiency. For the proposal and now for this final rule, NHTSA's analysis has integrated variable valve timing (VVT) technology in all non-diesel engines, so there is not a separate box for it on the Basic Engine Path. VVL, SGDI, and DEAC can be applied to an engine individually or in combination with each other.
Moving beyond the Basic Engine Path technologies are the “advanced” engine technologies, which are technologies that require significant changes to the structure of the engine or an entirely new engine architecture. The advanced engine technologies represent the application of alternate combustion cycles, various applications of forced induction technologies, or advances in-cylinder deactivation.
Advanced cylinder deactivation (ADEAC) systems, also known as rolling or dynamic cylinder deactivation systems, allow the engine to vary the percentage of cylinders deactivated and the sequence in which cylinders are deactivated. Depending on the engine's speed and associated torque requirements, an engine might have most cylinders deactivated (
e.g.,
low torque conditions, as with slower speed driving) or it might have all cylinders activated (
e.g.,
high-torque conditions, as with merging onto a highway).[160]
An engine operating at low-speed/low-torque conditions can save fuel by operating at a fraction of its total displacement. NHTSA models two ADEAC technologies: advanced cylinder deactivation on a single overhead camshaft engine (ADEACS) and advanced cylinder deactivation on an ADEACD.
Forced induction gasoline engines include both supercharged and turbocharged downsized engines, which can pressurize or force more air into an engine's intake manifold when higher power output is needed. The raised pressure results in an increased amount
( printed page 62046)
of airflow into the cylinder to support combustion, increasing the specific power of the engine. The first-level turbocharged downsized technology (TURBO0) engine represents a basic level of forced air induction technology being applied to a DOHC engine. A cooled exhaust gas recirculation (CEGR) system takes engine exhaust gases, passes them through a heat exchanger to reduce their temperature, then mixes them with incoming air in the intake manifold to reduce peak combustion temperature, thereby improving fuel efficiency and emissions. NHTSA models the base TURBO0 turbocharged engine with the addition of cooled exhausted recirculation (TURBOE), basic cylinder deactivation (TURBOD), variable valve lift (TURBO1), and advanced cylinder deactivation (TURBOAD). Advancing further down the Turbo Engine Path leads to an engine with a higher brake mean effective pressure (BMEP), which is a function of displacement and power. In other words, the higher the BMEP, the higher the power density of the engine. NHTSA models an advanced turbocharging technology (TURBO2) that runs increasingly higher turbocharger boost levels, burning more fuel and making more power for a given displacement. This analysis pairs turbocharging with engine downsizing, meaning that the turbocharged downsized engines improve vehicle fuel economy by using less fuel to power the smaller engine while maintaining vehicle performance.
The technology pathways represent an increase in the level or combinations of technologies being applied, with lower levels at the top and higher levels at the bottom of the path. Chapter 3.1.1 of the Final TSD shows the technology pathways for visualization purposes; however, the CAFE Model could apply any cost-effective combinations of technologies from those given pathways. Levels of improvement are dependent upon the vehicle class and the technology combinations. Again, in general, the paths are tied to ease of implementation of additional technology and how closely the technologies are related. An example of how this applies to the TURBO family of technologies is described below. The pathways are not aligned from “least effective” to “most effective” because assuming so would ignore several important considerations, including how technologies interact on a vehicle, how technologies interact on vehicles of different sizes that have different power requirements, and how hardware changes may be required for a particular technology. For example, the scenario below describes how, once a manufacturer downsizes an engine accompanying the application of a turbocharger, it would most likely not re-upsize the engine to add a less advanced turbocharger. The interaction of these technology combinations is discussed in more detail in Final TSD Chapter 2.
While TURBO0 is modeled with cooled EGR (TURBOE) and with DEAC (TURBOD), these technologies do not apply to TURBO1 or TURBO2; this decision is intentional. NHTSA defines TURBO1 in the analysis by adding VVL to the TURBO0 engine, and TURBO2 is the highest turbo downsized engine with a high BMEP. The benefits of cooled EGR and DEAC on TURBO1 and TURBO2 technologies would occur at high engine speeds and loads, which do not occur on the two-cycle tests. Because NHTSA measured technology effectiveness in this analysis based on the delta in improvements in vehicles' two-cycle test fuel consumption values, adding cooled EGR and DEAC to TURBO1 and TURBO2 would provide little effectiveness improvement for the corresponding increase in cost, a technology decision that the agency does not believe manufacturers would adopt in the real world. NHTSA's modeling effectively captures these complex interactions among technologies—an example of why effectiveness values from different technologies cannot simply be added together.[161]
This potential for added costs with limited efficiency benefit is also an example of why the CAFE Model technology tree is not ordered from least to most effective technology and why particular technologies are included on the technology tree while others are not. Final TSD Chapter 2 provides more discussion on interactions among individual technologies in the full-vehicle simulations.
Consistent with the approach of preventing moving backward in the technology tree, the Model does not allow a vehicle assigned a TURBO2 technology to adopt a TURBOE technology. A vehicle in the analysis fleet that is assigned the TURBO2 technology indicates a manufacturer has made the decision to either skip over or move on from lower levels of force induction technology. Moving backwards on the technology tree from TURBO2 to any of the lower turbo technologies would require the engine to be upsized to meet the same performance metrics as the analysis fleet vehicle. As discussed further in Section II.C.2.c, NHTSA ensures the vehicles in this analysis meet similar performance levels after the application of fuel economy-improving technology as they did before the application of the technology, because the agency's objective is to measure the costs and benefits of manufacturers responding to CAFE standards in this analysis and not the costs or benefits related to changing performance metrics in the fleet. Moving from a higher to a lower turbo technology works counter to saving fuel as the engine would grow in displacement, requiring more fuel, adding frictional losses, and increasing weight and cost. Accordingly, the agency believes that the Turbo engine pathway appropriately captures the ways manufacturers might apply increasing levels of turbocharging technology to their vehicles.
In this analysis, HCR engines represent a class of engines that achieve a higher level of fuel efficiency by implementing a high geometric CR with varying degrees of late intake valve closing (LIVC) (
i.e.,
closing the intake valve later than usual) using VVT, and without the use of an electric drive motor.[162]
These engines operate on a modified Atkinson cycle, allowing for improved fuel efficiency under certain engine load conditions while still offering enough power not to require an electric motor; however, there are limitations on how HCR engines can apply LIVC and the types of vehicles that can use this technology. The way that each individual manufacturer implements a modified Atkinson cycle is unique, as each manufacturer must balance not only fuel efficiency considerations, but also emissions, on-board diagnostics, and safety considerations, which include the vehicle being able to operate responsively to the driver's demand.
NHTSA defines HCR engines as being naturally aspirated, gasoline, SI, using a geometric CR of 12.5:1 or greater [163]
and able to apply various levels of LIVC dynamically based on load demand. An HCR engine uses less fuel for each
( printed page 62047)
engine cycle, which increases fuel economy but decreases power density (or torque). Generally, during high loads—when more power is needed—the engine will use variable valve actuation to reduce the level of LIVC by closing the intake valve earlier in the compression stroke (leaving more air/fuel mixture in the combustion chamber), increasing the effective CR, reducing over-expansion, and sacrificing efficiency for increased power density.[164]
However, there is a limit to how much the air-fuel mixture can be compressed before ignition in the HCR engine due to the potential for engine knock.[165]
Engine knock can be mitigated in HCR engines with higher octane fuel; however, the fuel specified for use in most vehicles is not higher octane fuel. Conversely, at low loads, the engine will typically increase the level of LIVC by closing the intake valve later in the compression stroke, reducing the effective CR, increasing the over-expansion, and sacrificing power density for improved efficiency. By closing the intake valve later in the compression stroke (
i.e.,
applying more LIVC), the engine's displacement is effectively reduced, which results in less air and fuel for combustion and a lower power output.[166]
Varying LIVC can be used to mitigate, but not eliminate, the low power density issues that can constrain the application of an Atkinson-only engine.
The phrase “low power density issues” translates to a low torque density,[167]
meaning that the engine cannot create the torque required at necessary engine speeds to meet load demands. To the extent that a vehicle requires more power in a given condition than an engine with low power density can provide, that engine would experience issues like engine knock for the reasons discussed above; more importantly, an engine designer would not allow a particular engine design to be used in conditions where the engine has the potential to operate in unsafe conditions. Instead, a manufacturer could significantly increase an engine's displacement (
i.e.,
size) to overcome those low power density issues,[168]
or could add an electric motor and battery pack to provide the engine with more power; however, a far more effective pathway would be to apply a different type of engine technology, like a downsized, turbocharged engine.[169]
Because of these limitations with HCR engines, NHTSA restricts the Model from applying this technology to vehicles that would be negatively impacted by the technology, like pickup trucks.[170]
Vehicle manufacturers' intended performance attributes for a vehicle—like payload and towing capability, features for off-road use, and other attributes that affect aerodynamic drag and rolling resistance—dictate whether an HCR engine can be a suitable technology choice for that vehicle.[171]
As vehicles require higher payloads and towing capacities,[172]
experience higher road load forces from larger all-terrain tires or less aerodynamic designs, or experience driveline losses for AWD and 4WD configurations, more engine torque is required at all engine speeds. When more engine torque is required, the application of HCR technology becomes less effective and more limited.[173]
For these reasons, and to maintain a performance-neutral analysis, NHTSA limits non-hybrid and non-plug-in-hybrid HCR engine application to certain categories of vehicles.[174]
NHTSA includes three HCR Engine Path technology options in this analysis: (1) a first-level Atkinson-enabled engine (HCR) with VVT and SGDI; (2) an Atkinson-enabled engine with CEGR (HCRE); and (3) an Atkinson-enabled engine with DEAC (HCRD). This updated family of HCR engine map models also reflects the statement in NHTSA's May 2, 2022 final rule that a single engine that employs an HCR, CEGR,
and
DEAC “is unlikely to be utilized in the rulemaking timeframe based on comments received from the industry leaders in HCR technology application.” [175]
These three HCR Engine Path technology options (HCR, HCRE, HCRD) should not be confused with the hybrid and plug-in hybrid electric pathway options that also utilize HCR engines in combination with a P2 hybrid powertrain (
e.g.,
P2HCR, P2HCRE, PHEV20H, and PHEV50H); those hybridization path options are discussed in Section II.D.3 below. In contrast, Atkinson engines in NHTSA's power-split hybrid powertrains (SHEVPS, PHEV20PS, and PHEV50PS) run the Atkinson Cycle full time but are connected to an electric motor. The full-time Atkinson engines are also discussed in Section II.D.3.
The Miller cycle is another alternative combustion cycle that effectively uses an extended expansion stroke, similar to the Atkinson cycle but with the application of forced induction to
( printed page 62048)
improve fuel efficiency. Miller cycle-enabled engines have a similar trade-off in power density as Atkinson engines; the lower power density requires a larger volume engine in comparison to an Otto cycle-based turbocharged system for similar applications.[176]
To address the impacts of the extended expansion stroke on power density during high-load operating conditions, the Miller cycle operates in combination with a forced induction system. In NHTSA's analysis, the first-level Miller cycle-enabled engine includes the application of variable turbo geometry technology (VTG), or what is also known as a variable-geometry turbocharger. VTG technology allows for the adjustment of key geometric characteristics of the turbocharging system, thus allowing adjustment of boost profiles and response based on the engine's operating needs. The adjustment of boost profile during operation increases the engine's power density over a broader range of operating conditions and increases the functionality of a Miller cycle-based engine. The use of a variable geometry turbocharger also supports the use of CEGR. NHTSA's second level of VTG engine technology (VTGE) is an advanced Miller cycle-enabled system that includes the application of at least a 40V-based electronic boost system. An electronic boost system has an electric motor added to assist the turbocharger; the motor assist mitigates turbocharger lag and low boost pressure by providing the extra boost needed to overcome the torque deficit at low engine speeds.
Variable compression ratio (VCR) engines work by changing the length of the piston stroke of the engine to optimize the CR and improve thermal efficiency over the full range of engine operating conditions. Engines that use VCR technology are currently in production as small-displacement, turbocharged, in-line four-cylinder, high BMEP applications.
Diesel engines have several characteristics that result in better fuel efficiency over traditional gasoline engines, including reduced pumping losses due to lack of (or greatly reduced) throttling, high-pressure direct injection of fuel, a combustion cycle that operates at a higher CR, and a very lean air/fuel mixture relative to an equivalent-performance gasoline engine. However, diesel technologies require additional systems to control nitrogen oxide (NOX) emissions, such as a NOX
adsorption catalyst system or a urea/ammonia selective catalytic reduction system. NHTSA included two levels of diesel engine technology in the analysis: the first-level diesel engine technology (Advanced Diesel Engine (ADSL)) is a turbocharged diesel engine, and the more advanced diesel engine (DSLI) adds DEAC to the ADSL engine technology. The diesel engine maps are new for this analysis and are based on a modern 3.0L turbo-diesel engine.
Finally, compressed natural gas (CNG) systems are ICE vehicles that run on natural gas as a fuel source. The fuel storage and supply systems for these engines differ tremendously from gasoline, diesel, and flexible-fuel vehicles.[177]
The CNG engine option has been included in past analyses; however, the light-duty analysis fleet does not include any dedicated CNG vehicles. As with the last analyses, CNG engines are included as an analysis fleet-only technology and are not applied to any vehicle that did not already include a CNG engine.
There are other vehicle technologies that work in various ways to improve fuel efficiency, such as turbo compounding, negative valve overlaps in-cylinder fuel reforming (NVO), passive prechamber combustion (PPC), and high energy ignition, which are not included in NHTSA's analysis. The International Council on Clear Transportation (ICCT) also provided examples of technology we do not use in the analysis such as NVO, PPC, and high energy ignition.[178]
Though suitable explanations for their exclusion could be that these technologies are in various stages of development and some, like PPC, are in very limited production, the primary reason NHTSA opted not to include them in the analysis is that the agency does not have information suggesting that these technologies will gain significant adoption during the rulemaking timeframe. This topic was discussed in detail in the 2022 final rule,[179]
and the agency has not found evidence of significant development for mass market production across multiple vehicle lines since then that would indicate manufacturers are now pursuing these costly technologies within the same standard-setting years. NHTSA will monitor these technologies as time progresses as part of NHTSA's continuous efforts to improve its modeling for any future analysis.[180]
The first step in assigning engine technologies to vehicles in the analysis fleet is to use data for each manufacturer to determine which vehicle platforms share engines. Within each manufacturer's fleet, NHTSA develops and assigns unique engine codes based on configuration, technologies applied, displacement, compression ratio, and power output. NHTSA also assigns engine technology classes, which are codes that identify engine architecture (
i.e.,
how many cylinders the engine has, whether it is a DOHC or SOHC, and so on) to account accurately for engine costs in the analysis.
When assigning engine technologies to vehicles in the analysis fleets, it is important to consider the actual technologies on a manufacturer's engine and compare them to the engine technologies in the analysis. NHTSA has over 250 unique engine codes in the light-duty analysis fleet, meaning that the technologies present on those engines in the real world must be identified and matched to the 29 engine map models (and therefore engine technology on the technology tree) [181]
that best represents those real-world engines. When considering how best to fit each of those 250 engines to the 29 engine technologies and engine map models, NHTSA uses specific technical elements contained in manufacturer publications, press releases, vehicle benchmarking studies, technical publications, manufacturer's specification sheets, occasionally CBI, and engineering judgment. The information NHTSA reviews includes specific technologies such as cylinder deactivation and direct injection, along with engine architecture (DOHC or SOHC), engine displacement, compression ratio, and horsepower, which help NHTSA to appropriately assign a modeled engine to an engine in the analysis fleet. For example, an engine having a 13.0:1 CR is a good indication that the engine would be considered an HCR engine. Some engines that achieve a slightly lower CR (
e.g.,
12.5) may also be considered an HCR engine depending on other technology on the engine, such as the inclusion of SGDI, increased engine displacement compared to other
( printed page 62049)
competitors, reduction of engine parasitic losses through variable or electric oil and water pumps, or the combination of these technologies. Importantly, engine technologies are never assigned based on one factor alone but rather data and engineering judgment are used to assign complex real-world engines to their corresponding engine technologies in the analysis. NHTSA believes that the initial characterization of the fleet's engine technologies reasonably captures the current state of the market while maintaining a reasonable amount of analytical complexity. Also, in addition to the 29 engine map models used in the Engine Pathways, there are 16 additional potential powertrain technology assignments available in the Hybridization Pathways.
Engine technology adoption in the Model is defined through a combination of technology path logic, refresh and redesign cycles, phase-in capacity limits, and SKIP logic. Path logic defines technology adoption by preventing an engine design from moving from one advanced engine tree to another. Once in an advanced engine tree, it must stay there. For example, any light-duty basic engine can adopt one of the TURBO engine technologies, but vehicles that have turbocharged engines in the analysis fleet stay on the Turbo Engine Path to prevent unrealistic engine technology change in the short timeframe considered in the rulemaking analysis. This is included to represent real-world considerations of stranded capital, which is when manufacturers amortize research, development, and tooling expenses over many years. Besides technology path logic, which applies to all manufacturers and technologies, NHTSA places additional constraints on the adoption of VCR and HCR technologies.
VCR technology requires a complete redesign of the engine and, in the analysis fleet, Nissan is the only manufacturer (including the Infiniti brand) to incorporate this technology. VCR engines are complex, costly by design, and address many of the same efficiency losses as mainstream technologies like turbocharged downsized engines. This makes it unlikely that a manufacturer that has already started down an incongruent technology path would adopt VCR technology. Because of these issues, VCR engine technology adoption is limited to OEMs that have already employed the technology and their partners. NHTSA does not believe any other manufacturers will invest in developing and marketing this technology in their fleet in the rulemaking timeframe.
As recognized in past analyses,[182]
HCR engines excel in lower power applications for lower load conditions, such as driving around a city or steady State highway driving without large payloads. Thus, their adoption is more limited than some other technologies. Accordingly, HCR engines are subject to three limitations.
First, vehicles with 405 or more HP, and (to simulate parts sharing) vehicles that share engines with vehicles with 405 or more HP, are not allowed to adopt HCR engines due to their prescribed power needs being more demanding and likely not supported by the lower power density found in HCR-based engines.[183]
Because LIVC essentially reduces the engine's displacement, to make more power and keep the same levels of LIVC, manufacturers would need to increase the displacement of the engine to make the necessary power. NHTSA does not believe manufacturers will increase the displacement of their engines to accommodate HCR technology adoption, because as displacement increases, so do friction, pumping losses, and fuel consumption. This bears out in industry trends: total engine size (or displacement) is at an all-time low, and trends show that industry focus on turbocharged downsized engine packages are leading to their much higher market penetration.[184]
Separately, as seen in the analysis fleet, manufacturers generally use HCR engines in applications where the vehicle's power requirements fall significantly below the agency's HCR HP threshold. In fact, the average HP for the sales-weighted average of vehicles in the analysis fleet that use HCR Engine Path technologies is 194 HP, demonstrating that HCR engine use has indeed been limited to lower HP applications, and well below the 405 HP threshold. In fringe cases where a vehicle classified as having higher load requirements does have an HCR engine, it is coupled to a hybrid system.[185]
Second, to maintain a performance-neutral analysis,[186]
pickup trucks and (to simulate parts sharing) [187]
vehicles that share engines with pickup trucks are excluded from receiving HCR engines that are not accompanied by a hybrid powertrain. In other words, pickup trucks and vehicles that share engines with pickup trucks can receive HCR-based engine technologies only in the Hybridization Pathways of technologies. Pickup trucks and vehicles that share engines with pickup trucks are excluded from receiving HCR engines not accompanied by a hybrid powertrain because these often-heavier vehicles have higher low-speed torque needs, higher base road loads, increased payload and towing requirements,[188]
and have powertrains sized and tuned to perform this additional work beyond what passenger cars are required to conduct. Vehicle manufacturers' intended performance attributes for a vehicle—like payload and towing capability, intention for off-road use, and other attributes that affect aerodynamic drag and rolling resistance—dictate whether an HCR engine can provide a reasonable fuel economy improvement for that vehicle.[189]
For example, road loads are
( printed page 62050)
composed of aerodynamic loads, which include vehicle frontal area and its drag coefficient, along with tire rolling resistance, all of which contribute to higher engine loads as vehicle speed increases.[190]
NHTSA assumes that a manufacturer intending to apply HCR technology to their pickup truck or vehicle that shares an engine with a pickup truck would do so in combination with an electric system to assist with the vehicle's load needs.
Finally, HCR engine application is restricted for some heavily performance-focused manufacturers that have demonstrated a significant commitment to power-dense technologies such as turbocharged downsizing,[191]
such that their fleets use nearly 100 percent turbocharged downsized engines. This means that no vehicle manufactured by these manufacturers can receive an HCR engine. Again, this adoption feature is implemented to avoid an unquantified amount of stranded capital that would be realized if these manufacturers switched from one technology to another.
Note that these adoption features apply only to vehicles that receive HCR engines that are not accompanied by a hybrid powertrain. A P2 hybrid system that uses an HCR engine overcomes the low-speed torque needs using the electric motor and thus has no restrictions or SKIPs applied.
ICCT commented on the application of HCR technologies, stating that, “NHTSA inappropriately prevents the application of HCR engine on engines with 405 horsepower, pickup trucks and vehicles that share engines with pickup trucks, or performance-focused manufacturers.” [192]
ICCT has provided similar comments on previous CAFE rulemakings, but it has not provided data to support its claims beyond pointing to its prior comments, to which NHTSA has previously responded. To avoid repetition, previous discussions located in prior related documents are incorporated here by reference.[193]
The agency notes that HCR engines have yet to be applied to the use cases identified by ICCT, and we will continue to assess technology improvements and refine our modeling efforts based on the best available data.
NHTSA realizes that engine technology, vehicle type, and their applications are always evolving.[194]
The Hyundai Santa Cruz, a unibody pickup truck with a 4-cylinder HCR engine, is one example of a pickup truck with a non-hybrid HCR engine. However, the Santa Cruz is not comparable in capability to other pickup models like the Tacoma, Colorado, and Canyon, and it therefore cannot be assumed that those pickup models should be able to adopt non-hybrid HCR technology as well. Small unibody pickup trucks like the Santa Cruz and the Ford Maverick do not have the same capabilities and functionality as a mid-size body-on-frame pickup like the Toyota Tacoma.[195]
NHTSA believes that its current restrictions for HCR are reasonable and appropriate, and the agency has not been presented with any new information that would suggest otherwise. NHTSA's stance on this issue is also borne out in real-world trends. Manufacturers who currently offer HCR engines in their fleets and therefore had the potential to introduce HCR technologies on recently redesigned vehicles that previously used high-displacement NA engines (such as Toyota Tacoma or Chevrolet Colorado) or TURBO technologies (such as the Mazda CX-90 replacing CX-9) have instead opted to introduce or continue to pursue turbocharged or hybrid engines. NHTSA does not believe HCR in its current state can provide enough fuel efficiency benefit to support removing the current HCR restrictions; however, this by no means precludes manufacturers from developing and deploying HCR technology for future iterations of their pickup trucks.
NHTSA also emphasizes that, in the real world, manufacturers are not required to follow the technology pathways to compliance that the agency models in the standard-setting analysis but can instead take their own pathway based on their respective business models, technology availability, market share, and other considerations. The CAFE Model simulates an example of a low-cost compliance pathway, and no manufacturer is required to comply with the pathway as it has been modeled. Instead, manufacturers are free to choose their own path to compliance. NHTSA has added features and restrictions into the CAFE Model to make the compliance simulation more representative of how manufacturers make decisions about technology adoption in the real world. This is to ensure that the CAFE Model does not simulate unrealistic compliance pathways. For example, if the CAFE Model simulated manufacturers abandoning one technology in favor for another, particularly with respect to HCR technology for pickup trucks and high HP vehicles, the results and corresponding costs and benefits would be unrealistic and could lead to NHTSA setting standards that are more stringent than maximum feasible. For this and other reasons, the agency endeavors to model the most realistic and low-cost pathway to compliance. NHTSA's standard-setting analysis is also restricted in ways that manufacturers are not, which increases the likelihood that manufacturers will not follow the technology pathways projected in the standard-setting analysis.[196]
Lucid Group, Inc. (Lucid) commented on how NHTSA maintains performance neutrality in its modeling, stating that, “[t]he technical analysis links fuel economy improvements to reductions in peak horsepower without incorporating vehicle mass and power to weight. Real-world efficiency strategies optimize engine output relative to mass rather than relying on absolute horsepower reductions alone.” [197]
The commenter misunderstands the agency's approach. NHTSA uses peak HP for the sizing of powertrains to maintain performance neutrality but also takes into account vehicle mass to ensure that the modeling is capturing all of the complex interactions among numerous vehicle
( printed page 62051)
attributes, including mass, acceleration, and technology combinations, among many others. This is discussed in detail in Final TSD Chapter 3 and the Autonomie documentation.
How effective an engine technology is at improving a vehicle's fuel economy depends on several factors, such as the vehicle's technology class and any additional technology added or removed from the vehicle in conjunction with the new engine technology, as discussed in Section II.C above. The Autonomie model's full-vehicle simulation results provide most of the effectiveness values that are used as inputs to the CAFE Model. Chapter 2.4 of the Final TSD and the CAFE Analysis Autonomie Documentation provide a full discussion of the Autonomie modeling. The Autonomie modeling uses engine map models as the primary inputs for simulating the effects of different engine technologies.
Engine maps provide a three-dimensional representation of engine performance characteristics at each engine speed and load point across the operating range of the engine. Engine maps have the appearance of topographical maps, typically with engine speed on the horizontal axis and engine torque, power, or BMEP on the vertical axis. A third engine characteristic, such as brake-specific fuel consumption (BSFC), is displayed using contours overlaid across the speed and load map. The contours provide the values for the third characteristic in the regions of operation covered on the map. Other characteristics typically overlaid on an engine map include engine emissions, engine efficiency, and engine power. The engine maps developed to model the behavior of the engines in this analysis are referred to as engine map models.
The engine map models used in this analysis are representative of technologies currently in production or expected to be available in the rulemaking timeframe. The engine map models are developed to be representative of the performance achievable across the industry for a given technology, and they are not intended to represent the performance of a single manufacturer's specific engine. NHTSA targets a broadly representative performance level because the same combination of technologies produced by different manufacturers will differ in performance, due to manufacturer-specific designs for engine hardware, control software, and emissions calibration. Accordingly, the agency expects that the engine maps developed for this analysis will differ from engine maps for manufacturers' specific engines. However, it is intended and expected that the incremental changes in performance modeled for this analysis, due to changes in technologies or technology combinations, will be similar to the incremental changes in performance observed in manufacturers' engines for the same changes in technologies or technology combinations.
IAV developed most of the engine map models used in this analysis. IAV is one of the world's leading automotive industry engineering service partners with an over 35-year history of performing research and development for powertrain components, electronics, and vehicle design.[198]
SwRI developed the light-duty diesel engine maps for this analysis. SwRI has been providing automotive science, technology, and engineering services for over 70 years.[199]
Both IAV and SwRI developed these engine maps using GT-POWER. GT-POWER is a commercially available industry-standard engine performance simulation tool. GT-POWER can be used to predict detailed engine performance characteristics, such as power, torque, airflow, volumetric efficiency, fuel consumption, turbocharger performance and matching, and pumping losses.[200]
Just like Argonne optimizes a single vehicle model in Autonomie following the addition of a singular technology to the vehicle model, these engine map models were built in GT-POWER by incrementally adding engine technology to an initial engine—built using engine test data, component test data, and manufacturers' and suppliers' technical publications—and then optimizing the engine to consider real-world constraints like heat, friction, and knock. One of the basic assumptions the agency makes when developing these engine maps is using 87 octane Tier 3 gasoline because it is the most common octane rating on which engines are designed to operate, and it is the test fuel manufacturers will have to use for EPA fuel economy testing.[201 202 203]
A small number of initial engine configurations with well-defined BSFC maps are used, and then, in a systematic and controlled process, specific well-defined technologies are added to optimize a BSFC map for each unique technology combination. This could theoretically be done through engine or vehicle testing, but such an approach would require conducting tests on a single engine, and each configuration would require physical parts and associated engine calibrations to assess the impact of each technology configuration. This is impractical for the rulemaking analysis because of the extensive design, prototype part fabrication, development, and laboratory resources that are required to evaluate each unique configuration. Both NHTSA and the automotive industry use modeling as an approach to assess an array of technologies with more limited physical testing. Modeling offers the opportunity to isolate the effects of individual technologies by using a single or small number of initial engine configurations and incrementally adding technologies to those initial configurations. This provides a consistent reference point for the BSFC maps for each technology and for combinations of technologies that enable us to identify and quantify carefully the differences in effectiveness among technologies.
Before its use in the Autonomie analysis, both IAV and SwRI validated the generated engine maps against a global database of benchmarked data, engine test data, single-cylinder test data, prior modeling studies, technical studies, and information presented at conferences.[204]
IAV and SwRI also validated the effectiveness values from the simulation results against detailed engine maps produced from the
( printed page 62052)
Argonne engine benchmarking programs, as well as published information from industry and academia.[205]
This ensures reasonable representation of simulated engine technologies. Additional details and assumptions that are used in the engine map modeling are described in detail in Chapter 3.1 of the Final TSD and the CAFE Analysis Autonomie Model Documentation chapter titled “Autonomie—Engine Model.”
Note that absolute BSFC levels are never applied from the engine maps to any vehicle model or configuration for the rulemaking analysis; only the absolute fuel economy values from the full-vehicle Autonomie simulations are used to determine incremental effectiveness for switching from one technology to another technology. The incremental effectiveness is then applied to the absolute fuel economy or fuel consumption value of vehicles in the analysis fleet, which are based on CAFE compliance data. For subsequent technology changes, NHTSA applies incremental effectiveness changes to the absolute fuel economy level of the previous technology configuration. Therefore, for a technically sound analysis, it is most important that the differences in BSFC among the engine maps be accurate and not the absolute values of the individual engine maps.
While the fuel economy improvements for most engine technologies in the analysis are derived from the database of Autonomie full-vehicle simulation results, the analysis incorporates a handful of what the agency refers to as “analogous effectiveness values.” These are used when an engine map model is not available for a particular technology combination. To generate an analogous effectiveness value, data from analogous technology combinations for available engine map models are used by conducting a pairwise comparison to generate a data set of emulated performance values for adding technology to an initial application. Analogous effectiveness values are used only for four SOHC technologies. NHTSA has determined that the effectiveness results using these analogous effectiveness values provided reasonable results. This process is discussed further in Chapter 3.1.4.2 of the Final TSD.
The engine technology effectiveness values for all vehicle technology classes can be found in Chapter 3.1.4 of the Final TSD. These values show the calculated improvement for upgrading the listed engine technology for a given combination of other technologies. The range of effectiveness values listed for each specific technology (
e.g.,
TURBO1) represents the addition of the TURBO1 technology to every technology combination that could select the addition of TURBO1. These values are derived from the Argonne Autonomie Results Dataset and the righthand side Y-axis shows the number of Autonomie simulations that achieve each percentage effectiveness improvement point. The dashed line and gray shading indicate the median and 1.5X interquartile range (IQR), which is a helpful metric to identify outliers. After comparing these histograms to the box and whisker plots presented in prior CAFE program rule documents, the number of effectiveness outliers is extremely small.
ICCT commented on the application of the engine sizing algorithm and when it is applied in relation to vehicle road load improvement technologies stating that, “NHTSA continues to only downsize engines for large changes in tractive load,” which they assume artificially increases the overall performance of the fleet.[206]
The commenter misunderstands the agency's analytical approach. Final TSD Chapter 2.3.4 discusses NHTSA's approach of sizing powertrains, which iteratively goes through both low and high-speed acceleration performance loops and adjusts powertrain size as needed based on the performance neutrality requirements.[207]
ICCT also implies that the analysis should require engine resizing for every technology change on a vehicle platform. NHTSA does not resize the engine for every technology change on a vehicle platform because doing so would artificially inflate effectiveness relative to cost. Manufacturers have repeatedly and consistently conveyed that the costs for redesign and the increased manufacturing complexity resulting from continually resizing engine displacement for small technology changes preclude them from doing so. It would not be reasonable or cost effective to expect resizing powertrains for every unique combination of technologies, and even less reasonable and less cost effective for every unique combination of technologies across every vehicle model due to the extreme manufacturing complexity that would be required.[208]
NAS stated in its 2011 report, “[f]or small (under 5 percent [of curb weight]) changes in mass, resizing the engine may not be justified, but as the reduction in mass increases (greater than 10 percent [of curb weight]), it becomes more important for certain vehicles to resize the engine and seek secondary mass reduction opportunities.” [209]
NHTSA's analysis evaluates engine resizing with mass changes of 10 percent or greater.[210]
ICCT also commented regarding the validity of the continued use of NHTSA's engine map models. ICCT stated that, “[a]lthough NHTSA scales its MY 2010 hybrid Atkinson engine map to match the thermal efficiency of the MY 2017 Toyota Prius, this appears to have been the only update made to the several engine maps that underpin all base and advanced engine technologies. The remaining engine maps are still primarily based on outdated engines (
e.g.,
from MY 2011, 2013 and 2014 vehicles). Even with the updated hybrid engine, the newest Toyota Prius demonstrates an additional 10 percent improvement over the outgoing variant, due in part to improvements in engine efficiency.” [211]
ICCT also took issue with NHTSA not using two of EPA's engine map models and commented on the lack of effectiveness benefit they perceived for adding cylinder deactivation technology to turbocharged and HCR engines.
In response to this comment, NHTSA emphasizes that many of the engine maps were developed specifically to support analysis for the current rulemaking timeframe. The engine map models encompass engine technologies present in the analysis fleet and technologies that could be applied in the rulemaking timeframe. In many cases, those engine technologies are
( printed page 62053)
mainstream in the baseline fleet and will continue to be mainstream during the rulemaking timeframe. For example, the engines on some MY 2024 vehicles in the analysis fleet have technologies that were introduced ten or more years ago. Ensuring we use engine maps that are representative of those technologies is important for the analysis. The most basic engine technology levels also provide a useful consistent starting point for the incremental improvements for other engine technologies. The timeframe for the testing or modeling used to generate a given engine map is unimportant because the mere passage of time does not affect the validity of engine map data. A given engine or model will produce the same BSFC map regardless of when testing or modeling is conducted. Eliminating engine maps based on temporal considerations alone would arbitrarily result in discarding useful and valid technical information.
ICCT also commented that the hybrid engine map models are outdated and that the hybrid effectiveness values exceed reasonable thermal efficiency.[212 213]
This issue is further discussed in Section III.D.3 of this preamble. NHTSA previously responded to ICCT's criticisms for not employing EPA's engine map models for the 2020 final rule setting MY 2021-2026 standards, demonstrating that the modeled engines provided similar incremental effectiveness values as the EPA engine map models.[214]
In any event, the relevant question is not whether NHTSA's engine map models are similar to those of the EPA (or any other analysis), but whether the models reasonably approximate engine performance to enable an assessment of technological effectiveness, and NHTSA's engine maps do just that. ICCT have not submitted information demonstrating otherwise. Notwithstanding their apparent preference for EPA's engine map models, ICCT did not provide information demonstrating that models used in the analysis are not reasonably similar to those of the EPA.[215]
Regarding engine effectiveness modeling, ICCT commented that “[t]he modeled benefit of adding cylinder deactivation (DEAC) to turbocharged and HCR engines appears to be only about 25 percent of the benefit of adding DEAC to the base engine. While DEAC added to turbo or HCR engines will have lower pumping loss reductions than when added to base naturally aspirated engines, DEAC can still be expected to provide significant pumping loss reductions while enabling the engine to operate in a more thermally efficient region of the engine map.” [216]
As described in numerous previous rulemakings and repeated in the NPRM, fuel-efficiency technologies (such as adding DEAC to a turbocharged engine) have complex interactions, and the effectiveness values of various technologies cannot be simply added together.[217]
Turbocharging and DEAC both work to reduce engine pumping losses, and when working together, they often provide a fuel-efficiency improvement greater then when they are working independently. But much of the improvement attributable to each technology occurs in the same regions of engine operation where one or the other technology has a dominant effect that overshadows the benefits of the other. In other words, the benefits of the technologies are overlapping in the similar regions where the engine operates. These complex interactions among technologies are captured in the engine modeling used in the analysis for this rule, as described in greater detail in TSD Chapter 3.
ICCT commented that NHTSA's technology costs and effectiveness values should be updated to reflect the most recent data available, but it did not provide or reference a comprehensive alternative dataset.[218]
NHTSA's technology costs are based on the most recent, comprehensive cost data available that represent the discrete costs for each technology used in the analysis. NHTSA continually seeks out updated costs that are representative of the specific technology being modeled and makes use of learning curves to help capture how technology costs change over time. NHTSA has not received any updated comprehensive cost data for technology since publishing the NPRM and, therefore, continues to use the cost sources cited in this analysis that were used for the NPRM. The engine costs in NHTSA's analysis are the product of engine DMCs, RPE, and the learning effect, updated to a consistent dollar year. Engine DMCs are obtained from multiple sources but primarily from the 2015 NAS report.[219]
For VTG and VTGE technologies (
e.g.,
Miller Cycle), NHTSA uses cost data from a FEV technology cost assessment performed for ICCT,[220]
which is aggregated using individual component and system costs from the 2015 NAS report. Costs from the 2015 NAS report that have referenced a Northeast States Center for a Clean Air Future 2004 report [221]
are considered, but NHTSA believes the reference material from the FEV report provides more updated cost estimates for the VTG technology.
All engine technology costs start with a base engine cost, and then additional technology costs are based on cylinder and bank count and configuration; the DMC for each engine technology is a function of unit cost multiplied by either the number of cylinders or number of banks, based on how the technology is applied to the system. The total costs for all engine technologies in all model years across all vehicle classes can be found in the Technologies Input File.
2. Transmission Paths
Transmissions transmit torque generated by the engine from the engine to the wheels. Transmissions primarily use two mechanisms to improve fuel efficiency: (1) a wider gear range, which allows the engine to operate longer at higher efficiency speed-load points and (2) improvements in friction or shifting efficiency (
e.g.,
improved gears, bearings, seals, pumps, and other components), which reduce parasitic losses.
NHTSA models only automatic transmissions (AT) in the light-duty analysis. The three subcategories of ATs that are modeled in this analysis include traditional ATs, dual-clutch transmissions (DCT), and continuously variable transmissions (CVT and
( printed page 62054)
eCVT).[222]
The agency also includes high efficiency gearbox (HEG) technology improvements as options to the transmission technologies (designated as L2 or L3 in the analysis to indicate level of technology improvement).[223]
There has been a significant reduction in manual transmissions (MT) over the years, and they make up less than one percent of the vehicles produced in MY 2024.[224]
Due to the declining trend of MTs and their current low production volumes, NHTSA has removed MTs from this analysis and assigned vehicles using MTs as DCTs in the analysis fleet.
To assign transmission technologies to vehicles in the analysis fleets, NHTSA identifies which Autonomie transmission model is most like a vehicle's real-world transmission, considering the transmission's configuration, costs, and effectiveness. As with engines, data from manufacturers' CAFE reports and publicly available information are used to assign transmissions to vehicles and determine which platforms share transmissions. Transmission codes that include information about the manufacturer, drive configuration, transmission type, and number of gears are used to link shared transmissions in a manufacturer's fleet. Just as manufacturers share transmissions in multiple vehicles, the CAFE Model treats transmissions as “shared” if they share a transmission code and transmission technologies will be adopted together.
While identifying an AT's gear count is fairly easy, identifying HEG levels for ATs and CVTs is more difficult. NHTSA reviews the age of the transmission design, relative performance versus previous designs, and technologies incorporated to assign a HEG level. There are no HEG Level 3 ATs in the analysis fleet. NHTSA finds all 7-speed, all 9-speed, all 10-speed, and some 8-speed ATs to be advanced transmissions operating at HEG Level 2 equivalence. The agency assigns eight-speed ATs and CVTs newly introduced for the light-duty market in MY 2016 and later as HEG Level 2. All other ATs are assigned to their respective transmission's initial technology level (
e.g.,
AT6, AT8, and CVT). For DCTs, the number of gears in the assignments usually match the number of gears listed by the data sources, with some exceptions (dual-clutch transmissions with seven and nine gears are assigned to DCT6 and DCT8, respectively). NHTSA assigns any vehicle in the light-duty analysis fleet with a power-split hybrid (SHEVPS) powertrain an electronic continuously variable transmission (eCVT). Finally, the limited number of MTs in the light-duty fleet are assigned as DCTs, as MTs are not modeled in Autonomie for this analysis.
Most transmission adoption features are instituted through technology path logic (
i.e.,
decisions about how less advanced transmissions of the same type can advance to more advanced transmissions of the same type). Technology pathways are designed to prevent “branch hopping”—changes in transmission type that would correspond to significant changes in transmission architecture—for vehicles that are relatively advanced on a given pathway. For example, any automatic transmission with more than five gears cannot move to a DCT. NHTSA also prevents “branch hopping” as a proxy for stranded capital, which is discussed in more detail in Section II.C and Chapter 2.6 of the Final TSD.
The automatic transmission path precludes adoption of other transmission types once a platform progresses past an AT8. This restriction is used to avoid the significant level of stranded capital loss that could result from adopting a completely different transmission type shortly after adopting an advanced transmission, which would occur if a different transmission type has been adopted after AT8 in the rulemaking timeframe. Vehicles that did not start out with AT7L2 transmissions cannot adopt that technology in the Model. It is likely that other vehicles will not adopt the AT7L2 technology, as vehicles that have moved to more advanced ATs have overwhelmingly moved to 8-speed and 10-speed transmissions.[225]
Vehicles that do not originate with a CVT or vehicles with multispeed transmissions beyond AT8 in the analysis fleet cannot adopt CVTs. Vehicles with multispeed transmissions greater than AT8 demonstrate increased ability to operate the engine at a highly efficient speed and load. Once on the CVT path, the platform is allowed to apply only improved CVT technologies. Due to the limitations of current CVTs, discussed in Final TSD Chapter 3.2, this analysis restricts the application of CVT technology on light-duty vehicles with greater than 300 lb.-ft of engine torque. This is because of the higher torque (load) demands of those vehicles and CVT torque limitations based on durability constraints. NHTSA believes the 300 lb.-ft restriction represents an increase over current levels of torque capacity that is likely to be achieved during the rulemaking timeframe. This restriction aligns with CVT application in the analysis fleet, in that CVTs are seen only on vehicles with under 280 lb.-ft of torque.[226]
In addition, this restriction is used to avoid stranded capital. Finally, the analysis allows vehicles in the analysis fleet that have DCTs to apply an improved DCT and allows vehicles with an AT5 to consider DCTs. Drivability and durability issues with some DCTs have resulted in a low relative adoption rate over the last decade. This is also broadly consistent with manufacturers' technology choices.[227]
Autonomie models transmissions as a sequence of mechanical torque gains. The torque and speed are multiplied and divided, respectively, by the current ratio for the selected operating condition. Furthermore, torque losses corresponding to the torque/speed operating point are subtracted from the torque input. Torque losses are defined based on a three-dimensional efficiency lookup table that has the following inputs: input shaft rotational speed, input shaft torque, and operating condition. NHTSA populates transmission template models in Autonomie with characteristics data to model specific transmissions.[228]
Characteristics data are typically tabulated data for transmission gear ratios, maps for transmission efficiency, and maps for torque converter performance, as applicable. Different transmission types require different quantities of data. The characteristics data for these models come from peer-reviewed sources, transmission and vehicle testing programs, results from simulating current and future transmission configurations, and confidential data obtained from OEMs and suppliers.[229]
HEG improvements
( printed page 62055)
are modeled via improvements to the efficiency map of the transmission. As an example, the AT8 model data comes from a transmission characterization study.[230]
The AT8L2 has the same gear ratios as the AT8; however, gear efficiency map values are increased to represent application of the HEG level 2 technologies. The AT8L3 models the application of HEG level 3 technologies using the same principle, further improving the gear efficiency map over the AT8L2 improvements. There are 13 transmissions in the analysis, and each transmission is modeled in Autonomie with defined gear ratios, gear efficiencies, gear spans, and unique shift logic for the technology configuration to which the transmission is applied. These transmission maps are developed to represent the gear counts and span, shift and torque converter lockup logic, and efficiencies that can be seen in the fleet, along with upcoming technology improvements, all while balancing key attributes, such as drivability, fuel economy, and performance neutrality. This modeling is discussed in detail in Chapter 3.2 of the Final TSD and the CAFE Analysis Autonomie Documentation chapter titled “Autonomie—Transmission Model.”
The effectiveness values for the transmission technologies, for all technology classes, are shown in Chapter 3.2.4 of the Final TSD. Note that the effectiveness for the AT5 and eCVT technologies is not shown. The eCVT transmissions do not have standalone effectiveness values because those technologies are implemented only as part of hybrid-electric powertrains. The AT5 has no effectiveness values because it is a reference-point technology against which all other transmission technologies are compared.
NHTSA's transmission DMCs come from the 2015 NAS report and studies cited therein. The costs are taken almost directly from the 2015 NAS report adjusted to the current dollar year or for the appropriate number of gears. Chapter 3.2 of the Final TSD discusses the specific 2015 NAS report costs used to generate these transmission cost estimates, and all transmission costs across all model years can be found in the CAFE Model's Technologies Input File. NHTSA has used the 2015 NAS report transmission costs for the last several light-duty CAFE Model analyses (since re-evaluating all transmission costs for the 2020 final rule) and has not received comments or feedback on these costs.
3. Hybridization Paths
The hybridization paths each include a set of technologies that share common hybrid powertrain components, like batteries and electric motors, for certain vehicle functions that were powered solely by ICEs traditionally. While all vehicles (including conventional ICE vehicles) use batteries and electric motors in some form, some component designs and powertrain architectures contribute to greater levels of hybridization than others, allowing the vehicle to use less gasoline or other fuel.
As explained elsewhere, NHTSA endeavors to model how manufacturers could apply technology to respond to CAFE standards. Hybrid technologies can improve fuel economy, and NHTSA believes that the inputs and assumptions selected to represent hybrid technologies are reasonable to use in NHTSA's CAFE Model. NHTSA provides details of the inputs and assumptions in the Final TSD accompanying this final rule and provides more information regarding the agency's rationale and approach throughout Section II and III of this preamble.
Unlike with other technologies in the analysis, Congress placed specific limitations on how NHTSA considers the fuel economy of alternative fueled vehicles, which includes not only BEVs and FCEVs but also dual-fueled vehicles like PHEVs.[231]
For PHEVs and other hybrid technologies, which are discussed in this section, NHTSA restricts its analysis by using fuel economy values that assume “charge sustaining” (gasoline-only) operation only.[232]
The fuel economies of BEVs and FCEV technologies are excluded entirely from NHTSA's standard-setting analysis.[233]
Final TSD Chapter 2.2 contains discussion of NHTSA's consideration of PHEVs, BEVs, and FCEVs in the Final SEIS analysis.
Among the simpler configurations with the fewest hybrid components is micro HEV technology (SS12V), which uses a 12-volt system that simply restarts the engine from a stop. Mild HEVs use a 48-volt belt integrated starter generator (BISG) system that restarts the engine from a stop and provides some regenerative braking functionality.[234]
Mild HEVs are often also capable of minimal electric assist to the engine during take-off.
Strong hybrid-electric vehicles (SHEVs) have higher system voltages compared to mild hybrids with BISG systems and are capable of engine stop/start, regenerative braking, electric motor assist of the engine at higher speeds and power demands with the ability to provide limited all-electric propulsion. Common SHEV powertrain architectures, classified by the interconnectivity of common hybrid vehicle components, include both a series-parallel architecture by power-split device (SHEVPS) as well as a parallel architecture (SHEVP2). SHEVP2s—though enhanced by the electric components, including just one electric motor—remains fundamentally similar to a conventional powertrain.[235]
In contrast, SHEVPS powertrains are considerably different than a conventional powertrain, as they use two electric motor/generators, which allows the use of a lower power-density engine. This results in a higher potential for fuel economy improvement compared to a SHEVP2, though the SHEVPS engine power density is lower.[236]
Put another way, “[a] disadvantage of the power-split architecture is that when towing or driving under other real-world
( printed page 62056)
conditions, performance is not optimum.” [237]
In contrast, “[o]ne of the main reasons for using parallel hybrid architecture is to enable towing and meet maximum vehicle speed targets.” [238]
This is an important distinction to understand why NHTSA allows certain types of vehicles to adopt SHEVP2 powertrains and not SHEVPS powertrains.
PHEVs utilize a combination gasoline-electric powertrain, like that of a SHEV, but have the ability to plug into the electric grid to recharge the battery, like that of a BEV; this contributes to all-electric mode capability in both blended and non-blended PHEVs.[239]
The analysis includes PHEVs with an AER of 20 and 50 miles to encompass the range of PHEV AER in the baseline fleet. Final TSD Chapter 3.3 contains more information on every hybrid technology considered in the analysis, including common acronyms and a brief description of each hybrid technology. For brevity, NHTSA refers to technologies by their acronyms in this section.
As with previous CAFE analyses, there are a number of engine options available for SHEVs and PHEVs. These engines better represent the variety of different hybrid architectures and engine options available in the real world for SHEVs and PHEVs while still maintaining a reasonable level of analytical complexity.
ICCT commented that NHTSA did not include additional mild hybrid technology such as more capable, higher output 48-volt mild hybrid systems beyond P0 mild hybrids, such as P2, P3, or P4 configurations [240]
which offer additional benefits of electric power take-offs (
i.e.,
launch assist or “a short power boost to the drivetrain”) [241]
or “slow-speed electric driving” [242]
on the vehicle's drive axle(s).
In response, NHTSA acknowledges that these mild hybrid configurations, such as P2 (mild) and P4, could offer improvements compared to P0 mild hybrids. Non-P0 powertrains, however, require significant changes and would require a higher capacity battery—both leading to increased powertrain cost; this is similar to what the agency observed in past rulemakings with the (P1) crank integrated starter generator system, with the non-P0 mild hybrid not being a cost-effective way for manufacturers to meet standards in the rulemaking timeframe. For this reason, NHTSA did not include additional mild hybrid technology for this final rule but may consider mild hybrid advancements in future analysis if they become more prevalent in the U.S. market.
MECA also commented on strong hybrid market penetration, noting that, “the NPRM anticipates only single digit increases in full hybrid technology penetration” [243]
and that hybrid powertrains exist in the light-duty and medium-duty vehicle space without relying on full electrification (
i.e.,
EVs).[244]
Zero Emission Transportation Association (ZETA) similarly commented, “NHTSA's perception of consumers' acceptance of strong hybrids is likewise out of date and inconsistent with recent sales trends and evaluations in the trade press.” [245]
ICCT added, “Removing HEV application restrictions and improving fuel consumption improvement values would more accurately lead to more vehicles adopting this highly cost-effective technology.” [246]
Regarding MECA's comment about the projection of hybrid penetration, NHTSA notes that in preamble Section IV, in both the NPRM and this final rule, NHTSA projects increases in the penetration of hybrids, which is in line with MECA's assessment that hybrids will be a contributing technology for adoption across the fleet. Regarding purported phase-in caps for SHEV technologies, no such restriction on adoption applies—the Model would allow 100 percent if the technology were cost-effective. Though strong hybridization is allowed on all vehicle types, NHTSA allows different types of strong hybrid powertrains to be applied to different types of vehicles for the reasons discussed below and believes that allowing SHEVPS and SHEVP2 powertrains to be applied subject to the base vehicle's performance and utility requirements is a reasonable approach to maintaining a performance-neutral analysis. NHTSA has explored a sensitivity case that restricts SHEV adoption and its impacts on this analysis; for more information on this and other sensitivity cases, see FRIA Chapter 9.
NHTSA also received comments requesting that NHTSA include extended-range electric technologies (EREVs) in its analysis, with both MECA and ICCT indicating that industry is retooling and has plans to launch EREV pickup trucks.[247]
Though NHTSA is aware of recent manufacturer announcements of plans to introduce EREVs,[248]
NHTSA does not currently have a method through which to estimate the fuel economy improvements for adopting the technology because true EREVs do not exist in the baseline fleet.[249]
In this analysis, as well as in previous CAFE rulemaking analyses, NHTSA has modeled a variant of EREV to represent PHEV50PS using a downsized ICE with larger battery pack and electric motors.[250]
PHEV powertrain architectures, like SHEVs, include both series-parallel power-split and parallel hybrid architectures, but do not currently include series hybrid architectures (commonly known as extended-range electric vehicles or EREVs). NHTSA will continue to monitor these technology variants for future analyses as viable pathways for mass market adoption.
NACAA requested that NHTSA conduct a comprehensive technology assessment that includes “advanced engine stop-start systems.” [251]
NHTSA notes that the analysis already includes micro hybrid (SS12V) and mild hybrid (BISG) technologies, and NACAA did not identify or expand on any other specific advanced stop-start system technology that it believes should be included in the analysis.
ICCT commented that if SHEVPS restrictions were removed for smaller pickup trucks and SUVs, this would
( printed page 62057)
better reflect what is in the baseline fleet and improve the SHEVPS application within the fleet.[252]
Though anomalous examples exist in the fleet,[253]
NHTSA has not removed the SHEVPS restrictions for smaller pickup trucks and SUVs because, in the real world, performance vehicles with certain powertrain configurations cannot adopt the technologies listed above and maintain vehicle performance without a cost-effective pathway to redesigning the entire powertrain, as described below.
As described in Final TSD Chapter 3.3, NHTSA assigns hybrid technologies to vehicles in the analysis fleet [254]
using manufacturer-submitted CAFE compliance information, publicly available technical specifications, marketing brochures, articles from reputable media outlets, and data subscriptions.[255]
Final TSD Chapter 3.3.2 shows the penetration rates of hybrid technologies in the standard-setting analysis fleets. Over half the analysis fleet has some level of hybridization, with the vast majority—over 50 percent of the fleet—being micro hybrids. Like the other technology pathways, as the CAFE Model adopts hybrid technologies for vehicles, more advanced levels of hybrid technologies will supersede all prior levels, while certain technologies within each level are mutually exclusive. The only adoption feature applicable to micro (SS12V) and mild (BISG) hybrid technology is path logic; vehicles may adopt micro and mild hybrid technology only if the vehicle did not already have a more advanced level of hybridization.
The adoption features that NHTSA applies to strong hybrid technologies include path logic, powertrain substitution, and vehicle class restrictions. Per the technology pathways, SHEVPS, P2x, P2TRBx, and the P2HCRx technologies are considered mutually exclusive. When the Model applies one of these technologies, the others are immediately disabled from future application. However, all vehicles on the strong hybrid pathways can still advance to one or more of the plug-in technologies, when applicable in the modeling scenario (
i.e.,
allowed in the Model).
When the Model applies any strong hybrid technology to a vehicle, the transmission technology on the vehicle is superseded; regardless of the transmission originally present, P2 hybrids adopt an advanced 8-speed automatic transmission (AT8L2), and power split hybrids adopt a continuously variable transmission via power-split device (eCVT). When the Model applies the P2 technology, the Model can consider various engine options to pair with the P2 architecture according to existing engine path constraints—taking into account relative cost effectiveness. For SHEVPS technology, the existing engine is replaced with a full-time Atkinson cycle engine.[256]
For P2s, NHTSA picks the 8-speed automatic transmission to supersede the vehicle's incoming transmission technology. This is because most P2s in the market use an 8-speed automatic transmission,[257]
therefore it is representative of the fleet now. NHTSA also believes that 8-speed transmissions are representative of the transmissions that will continue to be used in these hybrid vehicles, as NHTSA anticipates manufacturers will continue to use these “off-the-shelf” transmissions based on availability and ease of incorporation in the powertrain. The eCVT (power-split device) is the transmission for SHEVPSs and is therefore the technology NHTSA has picked to supersede the vehicle's prior transmission when adopting the SHEVPS powertrain.
SKIP logic is also used to constrain adoption of SHEVPS and PHEVx0PS technologies. These technologies are “skipped” for vehicles with engines [258]
that meet one of the following conditions: the engine belongs to an excluded manufacturer; [259]
the engine belongs to a pickup truck (
i.e.,
the engine is on a vehicle assigned the “pickup” body style); the engine's peak HP is more than 405 HP; or the engine is on a non-pickup vehicle but is shared with a pickup. The reasons for these conditions are similar to those for the SKIP logic that NHTSA applies to HCR engine technologies, discussed in more detail in Section II.D.1.
It may be helpful to understand why NHTSA does not apply SKIP logic to P2s but does apply SKIP logic to SHEVPSs. Note the difference between SHEVP2 and SHEVPS architectures: P2 architectures are better for “larger vehicle applications because they can be integrated with existing conventional powertrain systems that already meet the additional attribute requirements” of large-vehicle segments.[260]
No SKIP logic applies to P2s because NHTSA believes that this type of hybrid powertrain is sufficient to meet all the performance requirements for all types of vehicles. Manufacturers have proven this with vehicles like the Ford F-150 Hybrid and Toyota Tundra Hybrid.[261]
If NHTSA were to size (in the Autonomie simulations) the SHEVPS motors and engines to achieve “not optimum” performance, the electric motors would be unrealistically large (on both a size and cost basis), and the accompanying engine also would have to be a very large displacement engine, which is not characteristic of how vehicle manufacturers apply SHEVPS to ICE vehicles in the real world. Instead, for vehicles that have particular performance requirements—which the analysis defines as vehicles with engines that belong to an excluded manufacturer, engines belonging to a pickup truck or shared with a pickup truck, or engines with a peak HP of more than 405 HP—the model allows for the adoption of SHEVP2 architectures that should be able to handle the vehicle's performance requirements.
As mentioned above, while strong hybridization is allowed on all vehicle types, NHTSA allows different types of strong hybrid powertrains to be applied to different types of vehicles for the reasons discussed above. NHTSA believes that allowing SHEVPS and SHEVP2 powertrains to be applied subject to the base vehicle's performance requirements is a reasonable approach to maintaining a performance-neutral analysis.
The engine and transmission technologies on a vehicle are superseded when PHEV technologies
( printed page 62058)
are applied. For example, the Model applies an AT8L2 transmission with all PHEV20T/50T plug-in technologies, and the Model applies an eCVT transmission for all PHEV20PS/50PS and PHEV20H/50H plug-in technologies in the fleet; Final TSD Chapter 3.3 provides more details on different system combinations of hybridization. A vehicle adopting PHEV20PS/50PS receives a hybrid full-time Atkinson cycle engine, and a vehicle adopting PHEV20H/PHEV50H receives an HCR engine. For PHEV20T/50T, the vehicle receives a TURBO1 engine.
Autonomie determines the effectiveness of each hybridized powertrain type by modeling the basic components, or building blocks, for each powertrain and then combining the components modularly to determine the overall efficiency of the entire powertrain. The components, or building blocks, which contribute to the effectiveness of a hybridized powertrain in the analysis include the vehicle's battery, electric motors, power electronics, and accessory loads. Autonomie identifies components for each hybridized powertrain type and then interlinks those components to create a powertrain architecture. Autonomie then models each hybridized powertrain architecture and provides an effectiveness value for each architecture. For example, Autonomie determines a PHEV's efficiency in part by considering the efficiencies of the battery (including charging efficiency), the electric traction drive system (ETDS) (the electric machine and power electronics), and mechanical power transmission devices.[262]
Autonomie further combines the modeled hybrid components of the hybrid powertrain to include the ICE and related power for transmission components.[263]
Argonne uses data from their Advanced Mobility Technology Laboratory (AMTL) to develop Autonomie's hybrid powertrain models. The modeled powertrains are not intended to represent any specific manufacturer's architecture but act as surrogates predicting representative levels of effectiveness for each hybrid technology. NHTSA discusses the procedures for modeling each of these subsystems in detail in the Final TSD and in the CAFE Analysis Autonomie Documentation and provides a summary below.
NHTSA received a comment from Anderson Economic Group (AEG) stating that NHTSA omits the real-world costs of heat loss during fueling for BEVs and only considers these losses for ICE vehicle refueling.[264]
Contrary to the commenter's assertion, Autonomie modeling captures charging efficiency and considers the associated losses of the modern-day charging technology. For more information on these assumptions, see CAFE Analysis Autonomie Documentation.[265]
Further discussion on this comment with regard to the unconstrained analysis can be found in SEIS Appendix D.
NHTSA received comments about the hybrid effectiveness values used in the analysis. ZETA commented that DOE/EPA's data on hybrid effectiveness “is consistent with NHTSA's effectiveness estimates.” [266]
ICCT commented extensively on hybrid effectiveness values. ICCT noted that though NHTSA's SHEVPS effectiveness is acceptable, ICCT recommends including “at least one future (power-split) hybrid system improvement beyond that which is already modeled.” [267]
ICCT commented further that NHTSA's SHEVP2 effectiveness is too low and noted that NHTSA's modeling constrains SHEVP2 motor power to below 45 kW [268]
for future model years, citing ICCT's 2025 HEV study, which it says shows specifications for primary drive motors and that the SHEVP2 motor rated between 34kW and 42 kW in 2024 and between 135 kW and 175 kW in 2030 and beyond.[269]
In response to the comments on a purported need to align NHTSA's effectiveness values with industry and the perspective on future hybrid component specifications, NHTSA notes that NHTSA generally models effectiveness values only with components that exist in the current fleet—not concept powertrain components that might exist in the market years from now that have drastically different power ratings compared to the present day. There are ways to optimize electric motors, engines, and battery packs and integrate them in the powertrain, but in the analysis this is limited to discrete packages that NHTSA has modeled with Autonomie, as discussed further in Section II.C.2.c. For example, ICCT projected hypothetical electric motor and hybrid battery sizes in MY 2030 do not appear to even be based on any OEM announcements, component teardowns, or concept vehicles within the rulemaking timeframe. Without more concrete data about these future developments, NHTSA cannot accurately simulate the effectiveness and costs associated with their adoption. In contrast, NHTSA modeled ten SHEVP2 variants from basic to advanced engines that cover the span of hybrid technologies present in the current fleet.[270]
Though NHTSA has not made any changes to the analysis in response to ICCT's comment, NHTSA will continue to monitor for these improvements and will continue to update its analyses.
The fundamental components of a hybrid powertrain's propulsion system—the electric motor and inverter—ultimately determine the vehicle's performance and efficiency. For this analysis, Autonomie employs a set of electric motor efficiency maps created by Oak Ridge National Laboratory (ORNL), one for a traction motor and an inverter, the other for a motor/generator and inverter.[271]
The electric motor efficiency maps, created from production vehicles like the 2007 Toyota Camry hybrid and the 2011 Hyundai Sonata hybrid, represent electric motor efficiency as a function of torque and motor rotations per minute (RPM). These efficiency maps provide nominal and maximum speeds, as well as a maximum torque curve. Argonne uses the maps to determine the efficiency characteristics of the motors, which include some of the losses due to power transfer through the electric machine.[272]
Specifically, Argonne scales the efficiency maps, specific to powertrain type, to have total system peak efficiencies ranging from 96 to 98
( printed page 62059)
percent [273]
—such that their peak efficiency value corresponds to the latest state-of-the-art technologies, as opposed to retaining dated system efficiencies (90 to 93 percent).[274]
Beyond the powertrain components, Autonomie also considers electric accessory devices that consume energy in 2-cycle testing and how they affect overall vehicle effectiveness, such as radiator fans, engine control units, transmission control units, cooling systems, and safety systems. In real-world driving and operation, the electrical accessory load on the powertrain varies depending on how the driver uses certain features and the condition in which the vehicle is operating, such as night driving or hot weather driving. However, for regulatory test cycles related to fuel economy, the electrical load is repeatable because the fuel economy regulations control these factors. Accessory loads during test cycles vary by powertrain type and vehicle technology class, since distinctly different powertrain components and vehicle masses consume different amounts of energy.
The analysis fleets consist of different vehicle types with varying accessory electrical power demand. For instance, vehicles with different motor and battery sizes require different sizes of electric cooling pumps and fans to manage component temperatures optimally. Autonomie has built-in models that can simulate these varying subsystem electrical loads. However, for this analysis, NHTSA uses a fixed (by vehicle technology class and powertrain type), constant power draw to represent the effect of these accessory loads on the powertrain on the 2-cycle test. NHTSA expects that fixed accessory load values will, on average, have similar impacts on effectiveness as found on actual manufacturers' systems. This process is in line with the past analyses.[275 276]
NHTSA aggregates electrical accessory load modeling assumptions for the different powertrain types (hybridized and conventional) and technology classes from data from the 2016 Draft Technical Assessment Report (TAR), and the 2016 EPA Proposed Determination,[277]
data from manufacturers,[278]
research and development data from DOE's Vehicle Technologies Office,[279 280 281]
and DOT-sponsored vehicle benchmarking studies completed by Argonne's AMTL.
Certain technologies' effectiveness for reducing fuel consumption requires optimization through the appropriate sizing of the powertrain. Autonomie uses sizing control algorithms based on data collected from vehicle benchmarking,[282]
and the modeled hybrid components are sized based on performance neutrality considerations. This analysis iteratively minimizes the size of the powertrain components to maximize efficiency while enabling the vehicle to meet multiple performance criteria. The Autonomie simulations use a series of resizing algorithms that contain “loops,” such as the acceleration performance loop (0-60 mph), which automatically adjusts the size of certain powertrain components until a criterion, like the 0-60 mph acceleration time, is met. As the algorithms examine different performance or operational criteria that must be met, no single criterion can degrade; once a resizing algorithm completes, all criteria will be met, and some may be exceeded as a necessary consequence of meeting others.
Autonomie applies different powertrain sizing algorithms depending on the type of vehicle considered because different types of vehicles not only contain specific, optimized components, but they must also operate in varying driving modes. While the conventional powertrain sizing algorithm must consider only the power of the engine, the more complex algorithm for hybridized powertrains must simultaneously consider multiple factors, which could include the engine power, electric machine power, battery power, and battery capacity. Also, while the resizing algorithm for all vehicles must satisfy the same performance criteria, the algorithm for some electric powertrains must also allow those hybridized vehicles to operate in certain driving cycles, like the US06 cycle (a high acceleration aggressive driving schedule), without assistance of the combustion engine and ensure the electric motor/generator and battery can handle the vehicle's regenerative braking power, all-electric mode operation, and intended range of travel.
To establish the effectiveness of the technology packages, Autonomie simulates the vehicles' performance on compliance test cycles.[283]
For vehicles with conventional powertrains and micro hybrid powertrains, Autonomie simulates the vehicles using the 2-cycle test procedures and guidelines.[284]
For mild HEVs and strong HEVs, Autonomie simulates the same 2-cycle test, with the addition of repeating the drive cycles until the final state-of-charge (SOC) is approximately the same as the initial SOC, a process described in SAE J1711; SAE J1711 also provides test cycle guidance for testing specific to PHEVs.[285]
PHEVs have a range of modeled effectiveness during “standard-setting” CAFE Model runs, in which the PHEV operates under a “charge sustaining” (gasoline-only) mode—similar to how SHEVs function.
The Alliance for Vehicle Efficiency (AVE) submitted a comment emphasizing the need for harmonized test procedures across Federal regulatory programs when evaluating hybrid and electrified powertrains. AVE further stated that differences in test procedures result in inconsistent performance valuation of hybrid vehicle technologies.[286]
In response to AVE's comment, NHTSA emphasizes that its analysis is based on the 2-cycle testing prescribed by EPA's regulation for calculating CAFE compliance, in accordance with EPCA.[287]
We discuss the use of 2-cycle
( printed page 62060)
testing for compliance in Section VI of this preamble.
Chapters 2.4 and 3.3 of the Final TSD and the CAFE Analysis Autonomie Documentation chapter titled “Test Procedure and Energy Consumption Calculations” discuss the components and test cycles used to model each hybrid powertrain type; please refer to those chapters for more technical details on each of the modeled technologies discussed in this section.
The range of effectiveness for the hybrid technologies used in this analysis is a result of the interactions between the components listed above and how the modeled vehicle operates on its respective test cycle. This range of values results in some modeled effectiveness values being close to real-world measured values and some modeled values departing from measured values, depending on the level of similarity between the modeled hardware configuration and the real-world hardware and software configurations. The range of effectiveness values for the hybrid technologies applied in the fleet is shown in Final TSD Figure 3-23 and Figure 3-24.
Some advanced engine technologies indicate low effectiveness values when paired with hybrid architectures. The low effectiveness results from the application of advanced engines to existing P2 architectures. This effect is expected and illustrates the importance of using the full-vehicle modeling to capture interactions between technologies and to capture instances of both complementary technologies and non-complementary technologies. In developing its hybrid powertrains, NHTSA considers the engine maps, engine technologies, electric motor power, and battery pack size. The hybrid powertrains are calibrated to operate in their respective hybrid architecture most effectively and to allow the electric machine to provide propulsion or assistance in regions of the engine map that are less efficient. As the Model sizes the powertrain for any given application, it considers all these parameters as well as performance neutrality metrics to provide the most efficient solution. In this instance, the P2 powertrain improves fuel economy, in part, by allowing the engine to spend more time operating at efficient engine speed and load conditions. This reduces the advantage of adding advanced engine technologies, which also improve fuel economy by broadening the range of speed and load conditions for the engine to operate at high efficiency. This redundancy in fuel-saving mechanisms results in a lower effectiveness when the technologies are added together.
The technology effectiveness values are developed specifically to support analyses for a rulemaking timeframe. For example, the hybrid Atkinson engine peak thermal efficiency was updated based on 2017 Toyota Prius engine data.[288]
As mentioned above, Argonne scales the efficiency maps, specific to powertrain type, to have total system peak efficiencies ranging from 96 to 98 percent [289]
—such that their peak efficiency value corresponds to the latest state-of-the-art technologies, as opposed to retaining dated system efficiencies (90 to 93 percent).[290]
The 2016 maps scaled to peak efficiency are equivalent to (if not exceed) efficiencies seen in vehicles in the current fleet and in the future. Though the base references for these technologies are from a few years ago, NHTSA has worked with Argonne to update individual inputs to reflect the latest improvements. Accordingly, NHTSA has made no changes to the electric machine efficiency maps for this final rule analysis.
When the CAFE Model turns a vehicle powered by an ICE into a hybridized vehicle, it must remove the parts and costs associated with the ICE (and, potentially, the transmission depending on the hybridization level and powertrain type) and add the costs of a battery pack and other non-battery hybridization components, such as the electric motor and power inverter. To estimate battery pack costs for this analysis, NHTSA needs an estimate of how much battery packs cost (
i.e.,
a “base year” cost) and estimates of how that cost could reduce over time (
i.e.,
the “learning effect”). The general concept of learning effects is discussed in detail in Section II.C and in Chapter 2 of the Final TSD, while the specific learning effect NHTSA applied to battery pack costs in this analysis is discussed below. NHTSA estimates base year battery pack costs for most hybrid technologies using BatPaC, which is an Argonne model designed to calculate the cost of hybrid battery packs.
Traditionally, a user would use BatPaC to cost a battery pack for a single vehicle, and the user would vary factors such as battery cell chemistry, battery power and energy, battery pack interconnectivity configurations, battery pack production volumes, charging constraints, or combinations of these factors, to name a few, to see how those factors would increase or decrease the cost of the battery pack. However, several hundreds of thousands of simulated vehicles in the analysis have hybridized powertrains, meaning that NHTSA would have to run individual BatPaC simulations for each full-vehicle simulation that requires a battery pack. This would have been computationally intensive and impractical. Instead, Argonne staff builds “lookup tables” with BatPaC that provide battery pack manufacturing costs, battery pack weights, and battery pack cell capacities for vehicles with varying power requirements modeled in these large-scale simulation runs.
Just like with other vehicle technologies, the specifications of different vehicle manufacturers' battery packs are extremely diverse. NHTSA, therefore, endeavored to develop battery pack costs that reasonably encompass the cost of battery packs for vehicles in each technology class.
In conjunction with the agency's partners at Argonne working on the CAFE analysis Autonomie modeling, NHTSA references assessment and outlook reports,[291]
vehicle teardown reports,[292]
and stakeholder discussions [293]
to determine common
( printed page 62061)
battery pack chemistries for each modeled hybrid technology. The CAFE Analysis Autonomie Documentation chapter titled “Battery Performance and Cost Model—BatPaC Examples From Existing Vehicles in the Market” includes more detail about the reports referenced for this analysis.[294]
For mild hybrids, NHTSA uses the lithium iron phosphate (LFP)-G [295]
chemistry because power and energy requirements for mild hybrids are very low, the charge and discharge cycles (or need for increased battery cycle life) are high, and the battery raw materials are much less expensive than a nickel manganese cobalt (NMC)-based cell chemistry. NHTSA uses NMC622-G [296]
for all other hybrid vehicle technology base (MY 2022) battery pack cost calculations. NHTSA believes that, based on available data,[297]
NMC622 is more representative for the MY 2022 base year battery costs than LFP, and any additional cost reductions from manufacturers switching to LFP chemistry-based battery packs in years beyond 2022 are accounted for in the battery cost learning effects. The learning effects estimate potential cost savings for future battery advancements (a learning rate applied to the battery pack DMC); this final rule includes a dynamic NMC/LFP cathode mix over each future model year (for PHEVs). The battery chemistry that NHTSA uses is intended to represent reasonably what is used in the MY 2022 U.S. fleet, which is the DMC base year for the BatPaC calculations.[298]
The Attorneys General [299]
stated that NHTSA's analysis assumed that all strong hybrids rely on NMC battery chemistries and countered that cheaper LFP batteries have quickly become the dominant global battery chemistry since 2022, meaning NHTSA's chemistry assumption overstates actual market costs.
NHTSA does not apply LFP batteries to SHEVs in its analysis because no strong hybrid in the American automotive market uses the LFP battery chemistry for its battery packs. As for battery chemistry assumptions in the analysis, NHTSA accounts for the increasing prevalence of LFP displacing NMC cathodes in the U.S. market, applies a “composite correlation equation” for PHEVs,[300]
and models a dynamic, shifting mix of NMC and LFP chemistries through MY 2035.
The Attorneys General [301]
also commented that NHTSA used 2022 as the base year to estimate the manufacturing cost of hybrid battery packs. The Attorneys General point out that material costs and the relative intensity of certain mineral uses dropped significantly between 2022 and 2024, meaning the 2022 baseline overestimates DMCs.
While the
base
DMC is anchored to MY 2022, NHTSA does not assume that battery costs will remain constant at 2022 levels. To reflect how battery costs will decrease over the analytical timeframe, NHTSA applies specific “learning rates” to the BatPaC-generated DMCs, developed by Argonne's BatPaC team.[302]
Final TSD Chapter 3.3 explicitly notes that “NHTSA accounts for the potential cost savings for future battery cell chemistries using a learning rate applied to the battery pack DMC.” The anticipated drops in material costs and advancements in manufacturing are built into the future projections via these learning curves, and the analysis does not require a shift in base year. NHTSA did not update the battery cost base year for the final rule analysis.
NHTSA also looks at vehicle sales volumes for MY 2022 to determine a reasonable base production volume assumption.[303]
In practice, a single battery plant can produce packs using different cell chemistries with different power and energy specifications, as well as battery pack constructions with varying battery pack designs—different cell interconnectivities (to alter overall pack power end energy) and thermal management strategies—for the same base chemistry. However, in BatPaC, a battery plant is assumed to manufacture and assemble a specific battery pack design, and all cost estimates are based on one single battery plant manufacturing only that specific battery pack. For example, if a manufacturer has more than one PHEV in its vehicle lineup and each uses a specific battery pack design, a BatPaC user would include manufacturing volume assumptions for each design separately to represent each plant producing each specific battery pack. NHTSA has examined battery pack designs for vehicles sold in MY 2022 to determine a reasonable manufacturing plant production volume assumption. NHTSA considers each assembly line designed for a specific battery pack and for a specific PHEV as an individual battery plant. Since battery technologies and production are still evolving, it is likely to be some time before battery cells can be treated as commodities where the specific numbers of cells are used for varying battery pack applications and all other metrics remain the same.
Similar to previous rulemakings, NHTSA uses sales as a starting point to analyze potential base modeled battery manufacturing plant production volume assumptions. Since actual production data for specific battery manufacturing plants are extremely hard to obtain and the battery cell manufacturer is not always the battery pack manufacturer,[304]
NHTSA calculates an average production volume per manufacturer metric to approximate hybrid vehicle production volumes for this analysis. This metric is calculated by taking an average of all of one hybrid vehicle type (for example, all PHEVs) battery energies reported in a vehicle manufacturer's pre-MY 2022 reports [305]
and dividing by the averaged sales-weighted energy per-vehicle; the resulting volume is then rounded to the nearest 5,000. Manufacturers are not required to report gross battery pack sizes for the pre-model year or mid-model year compliance reports, so NHTSA estimates pack size for each vehicle based on proprietary data and publicly available data, like a
( printed page 62062)
manufacturer's published or announced specifications. This process is repeated for all hybrid vehicle technologies. NHTSA believes this provides a reasonable base year plant production volume—especially in the absence of actual production data—since the compliance report data from manufacturers already includes accurate related data, such as vehicle model and estimated sales information metrics.[306]
The final battery manufacturing plant production volume assumptions for different hybrid technologies are as follows: mild hybrid and strong hybrids are manufactured assuming 200,000 packs and PHEVs are manufactured assuming 20,000 packs.
As mentioned above, the BatPaC Lookup Tables provide $/kWh battery pack costs based on vehicle power and energy requirements. As the total cost of a battery pack increases the higher the power/energy requirements, the cost per kWh decreases. This represents the cost of hardware that is needed in all battery packs but is deferred across more kW/kWh in larger packs, which reduces the per kW/kWh cost. Table 3-78 in Final TSD Chapter 3.3.5 shows an example of the BatPaC Lookup Tables for SHEVPS technology classes.
Note that the values in the table discussed above should not be considered the total battery $/kWh costs that are used for vehicles in the analysis in future model years. As detailed below, battery costs are also projected to decrease over time as manufacturers improve production processes, shift battery chemistries, and make other technological advancements. In addition, select modeled tax credits further reduce the estimated costs; additional discussion of those tax credits is located throughout this preamble, Final TSD Chapter 2.3, FRIA Chapters 8 and 9, and preamble Section II.C.2.e.
The CAFE Analysis Autonomie Documentation details other specific assumptions that Argonne used to simulate battery packs and their associated base year costs for the full-vehicle simulation modeling, including updates to the battery management unit costs and the range of power and energy requirements used to bound the lookup tables.[307]
CAFE Analysis Autonomie Documentation and Chapter 3.3 of the Final TSD provide further information about how NHTSA used BatPaC to estimate base year battery costs. The full range of BatPaC-generated battery DMCs is in the file ANL—Summary of Main Component Performance Assumptions_NPRM_2206.[308]
Note again that these charts represent the DMC using a dollar per kW/kWh metric; absolute battery costs used in the analysis by technology key can be found in the CAFE Model Battery Costs File.
The DOE and Argonne developed battery cost correlation equations from BatPaC for use in the 2024 CAFE final rule analysis—cost equations that continue to be used in this analysis.[309]
These cost equations—developed for use through MY 2035—are tailored for different vehicle segments,[310]
different levels of hybridization,[311]
and anticipated plant production volumes.[312]
These equations represent cost improvements achieved from advanced manufacturing, pack design, and cell design with current and anticipated future battery chemistries,[313]
design parameters, forecasted market prices, and vehicle technology penetration. Argonne's Cost Analysis and Projections for U.S.-Manufactured Automotive Lithium-ion Batteries report contains a detailed discussion of the inputs and assumptions used to generate these cost equations.[314]
The Attorneys General [315]
argue that NHTSA's evaluation of economic feasibility relies on cost models that fail to account for dramatically falling battery costs, thereby artificially inflating the cost of strong hybrid vehicles. They assert that NHTSA's inaccurate assumptions affect the CAFE Model results by inflating projected regulatory costs and distorting the projected makeup of the fleet. In addition to comments on battery base year and chemistry assumptions that were discussed above, the Attorneys General argued that NHTSA's attempt to account for battery technology advancements by applying a 1.5-percent learning rate is inadequate to keep pace with current battery technology advancements. They cite evidence suggesting that EV battery manufacturing has recently demonstrated a 7.5-percent learning rate, which is five times higher than the rate NHTSA applied.
In response to these comments, NHTSA emphasizes that the 1.5-percent learning rate applies to later years—well beyond those years subject to this regulation—when battery technology matures, not in the near term. The Final TSD clarifies that NHTSA specifically uses the 1.5-percent learning rate for battery packs from MY 2036 and beyond, which is appropriate because the agency expects battery technology to be largely mature by that time. The near-term battery learning rates differ across each vehicle class, specific hybrid powertrain technology, and across each year (through MY 2035), with year-over-year improvements spanning from above four percent year-over-year to below one percent year-over-year.[316]
Though batteries and relative battery components are the biggest cost drivers of hybridization, non-battery hybridization components, such as electric motors, power electronics, and wiring harnesses, also add to the total cost required to electrify a vehicle. Different levels of hybrid vehicles have variants of non-battery hybridization components and configurations to accommodate different vehicle classes and applications with respective designs. For instance, some SHEVs may be engineered with only one electric motor, while other SHEVs may be engineered with two or even three electric motors within their powertrains to provide AWD functionality. In addition, some hybrid vehicle types still include conventional powertrain components, like an ICE and transmission.
For all hybrid vehicle powertrain types, NHTSA groups non-battery hybridization components into four major categories: electric motors, power electronics (generally including the DC-DC converter, inverter, and power distribution module), charging components (charger, charging cable, and high-voltage cables), and thermal management systems. NHTSA further groups the components into those composing the ETDS, and all other components. Though each manufacturer's ETDS and power electronics vary between the same hybrid vehicle types and between different hybrid vehicle types, NHTSA
( printed page 62063)
considers the ETDS for this analysis to be composed of the electric motor and inverter, power electronics, and thermal system.
When researching costs for different non-battery hybridization components, NHTSA finds that different reports vary in components considered and cost breakdown. This is not surprising, as vehicle manufacturers use different non-battery hybridization components in different vehicle systems, or even in the same vehicle type, depending on the application. For each of the component categories discussed above, NHTSA examines cost teardown studies and uses the best available cost estimate for each component from these different reports. These reports capture components in most manufacturers' systems but not all, and NHTSA believes that this is a reasonable approach for this analysis, given the non-standardization of hybrid powertrain designs and subsequent component specifications. Other sources NHTSA uses for non-battery hybridization component costs include an EPA-sponsored FEV teardown of a 2013 Chevrolet Malibu ECO with eAssist for some BISG component costs,[317]
which were validated against a 2019 Dodge Ram eTorque system's publicly available retail price,[318]
and the 2015 NAS report.[319]
Broadly, the total BISG system cost, including the battery, fairly matches these other cost estimates. Component cost information is discussed further in Final TSD Chapter 3.3.5.
NHTSA received a number of comments about hybrid powertrain costs. Stellantis argued that NHTSA's cost assumptions were too low, while other commenters argue that NHTSA's cost estimates are too high. Stellantis [320]
argued that NHTSA's powertrain cost assumptions for SHEV technology are significantly underestimated regarding what is economically and commercially feasible, especially for large vehicles. Stellantis urges NHTSA to adjust SHEV cost estimates upward specifically for large vehicles and not assume a similar cost across small cars, crossovers, SUVs, and full-size pickup trucks—noting that correcting these cost assumptions will alter the technology penetration rates assumed in the modeling.
In contrast to the comment from Stellantis, NHTSA received several comments stating that the agency overestimates hybrid costs compared to current markets.[321 322]
These commenters argue that NHTSA's cost estimates for strong hybrid electric vehicles (SHEVs) are excessively high and outdated and contradict current market prices.[323 324]
ICCT asserted that the agency overestimates cost by comparing price premiums for hybrids and their non-hybrid counterparts.[325]
ZETA commented similarly, referencing a paper asserting the differences in price premiums between the current market prices and NHTSA's analysis, and incorrectly concluding that NHTSA inflated hybrid powertrain cost estimates.[326]
As with previous rulemakings, NHTSA continues to reject the use of vehicle MSRPs to estimate component costs, as this oversimplifies the technology cost walk that the Model performs between powertrains in a given model year.[327]
Final TSD Chapter 2.4 describes NHTSA's technology cost estimation methodology and clarifies that the agency estimates technology costs from the ground-up and scales for factors such as electric motor power and does reference vehicle prices to estimate technology costs. The Vehicle Report Output File and read related CAFE Model Documentation describe the actual technology costs used in the model. NHTSA is not making any changes to hybrid vehicle costs from the NPRM analysis for this final rule.
For the non-battery electrification component learning curves, NHTSA uses cost information from Argonne's 2016 Assessment of Vehicle Sizing, Energy Consumption, and Cost Through Large-Scale Simulation of Advanced Vehicle Technologies report.[328]
The report provides estimated cost projections from the 2010 lab year to the 2045 lab year for individual vehicle components.[329]
NHTSA considers the component costs used in HEVs and determines the learning curve by evaluating the year over year cost change for those components. Argonne published a 2020 and a 2022 version of the same report; however, those versions did not include a discussion of the high- and low-cost estimates for the same components.[330]
The learning estimates generated using the 2016 report align in the middle of the high- and low-cost estimates from the Argonne reports, and therefore NHTSA continues to apply the learning curve estimates based on the 2016 report. There are many sources that NHTSA could have picked to develop learning curves for non-battery electrification component costs; however, given the uncertainty surrounding extrapolating costs out to MY 2050, NHTSA believes these learning curves provide a reasonable estimate.
ICCT commented that NHTSA's electric motor and inverter costs are too high for SHEVs that utilize greater than 57 kW[331]
and attached a related 2025 HEV study they published.[332]
NHTSA interprets ICCT's comment as taking issue with learning rates associated with electric motors in the future and disagrees with ICCT's claim that the cost of electric motors greater than 57 kW is too high. NHTSA determined that the non-battery component learning rates used in this analysis reflect the trajectory of economies of scale and production capabilities predicted by industry. NHTSA has not updated the non-battery component learning rates for the final rule.
In summary, NHTSA calculates the total hybrid powertrain costs by
( printed page 62064)
summing individual component costs, which ensures that all technologies in a hybrid powertrain appropriately contribute to the total system cost. NHTSA combines the costs associated with the ICE (if applicable) and transmission, non-battery hybridization components like the electric machine, and battery pack to create a full-system cost. Chapter 3.3.5.4 of the Final TSD presents the total costs for each hybrid powertrain option, broken out by the components NHTSA discussed throughout this section. In addition, the section discusses where to find each of the component costs in the CAFE Model's various input files.
4. Road Load Reduction Paths
No car or truck uses energy (whether gas or otherwise) 100 percent efficiently when it is driven down the road. If the energy in a gallon of gas is thought of as a pie, the amount of energy ultimately available from that gallon to propel a car or truck down the road would only be a small slice. Instead, most of the energy is lost due to thermal and frictional losses in the engine and drivetrain and drag from ancillary systems (
e.g.,
the air conditioner, alternator generator, or various pumps). The rest is lost to what engineers call road loads. For the most part, road loads include wind resistance (or aerodynamics), drag in the braking system, and rolling resistance from the tires. At low speeds, aerodynamic losses are very small, but as speeds increase these losses rapidly become dramatically higher than any other road load. Drag from the brakes in most cars is practically negligible. Tire rolling resistance losses can be significant: at low speeds rolling resistance losses can be more than aerodynamic losses. Whatever energy is left after these road loads is spent on accelerating the vehicle anytime its speed increases. This is where reducing the mass of a vehicle is important to efficiency because the amount of energy to accelerate the vehicle is always directly proportional to a vehicle's mass. All else being equal, reduce a car's mass and better fuel economy is guaranteed. However, at freeway speeds, aerodynamics plays a more dominant role in determining fuel economy than any other road load or vehicle mass.
NHTSA includes three road load reducing technology paths in this analysis: the Mass Reduction (MR) Path, Aerodynamic Improvements (AERO) Path, and Low Rolling Resistance Tires (ROLL) Path. For all three paths, NHTSA assigns vehicles in the analysis fleet technologies and identifies adoption features based on the vehicle's body style. The light-duty fleet body styles NHTSA includes in the analysis are convertible, coupe, sedan, hatchback, wagon, SUV, pickup, minivan, and van. Figure II-3 shows the light-duty fleet body styles used in the analysis.
As expected, the road load forces described above operate differently based on a vehicle's body style, and the technology adoption features and effectiveness values reflect this. The following sections discuss the three Road Load Reduction Paths.
5. Mass Reduction
Mass reduction is a relatively cost-effective means of improving fuel economy, and vehicle manufacturers are expected to apply various mass reduction technologies to meet fuel economy standards. Vehicle manufacturers can reduce vehicle mass through several different techniques, such as modifying and optimizing vehicle component and system designs, part consolidation, and adopting materials that are conducive to mass reduction (
e.g.,
advanced high strength steel), aluminum, magnesium, and
( printed page 62065)
plastics, including carbon fiber reinforced plastics).
For this analysis, NHTSA considers five levels of mass reduction technology (MR1-MR5) that include increasing amounts of advanced materials and mass reduction techniques applied to the vehicle's glider.[333]
The subsystems that may make up a vehicle glider include the vehicle body, chassis, interior, steering, electrical accessory, brake, and wheels systems. NHTSA accounts for mass changes associated with powertrain changes separately.[334]
The agency's estimates of how manufacturers could reach each level of mass reduction technology, and a discussion of advanced materials and mass reduction techniques can be found in Chapter 3.4 of the Final TSD.
Reaching the highest level of mass reduction considered in this analysis, MR5, requires a blend of aluminum and carbon fiber components. Achieving MR5 with aluminum exclusively is unlikely to be achievable by manufacturers during the rulemaking timeframe. Though aluminum technology can be an effective mass reduction pathway, it has its limitations. First, aluminum does not have a fatigue endurance limit. That is, with aluminum components there is always some combination of stress and cycles when failure occurs. Automotive design engineering teams will dimension highly stressed cross sections to provide an acceptable number of cycles to failure. But this often comes at mass savings levels that fall short of what would be expected purely based on density specific strength and stiffness properties for aluminum.
Looking at real data, the mostly aluminum (cab and bed are made from aluminum) 2021 Ford F150 achieves less than a 14-percent mass reduction compared to its 2014 all-steel predecessor.[335]
This is an especially pertinent comparison because both vehicles have the same footprint within a 2-percent margin and presumably were engineered to similar duty cycles given that they both came from the same manufacturer. Per the agency's regression analysis, the Ford F-150 achieves MR3. As mentioned in the Final TSD Chapter 3.4, achieving MR4 using aluminum only would require that the body in white structure be made almost entirely from aluminum. It may be possible to achieve MR5 without the use of carbon fiber, but the resultant vehicle would not achieve performance parity with customer expectations in terms of crash safety, noise and vibration levels, and interior content. The discontinued Lotus Elise is an example of an aluminum and fiberglass car that achieved MR5 but represents an extremely niche vehicle application that is unlikely to translate to mainstream, high-volume models. Therefore, it is entirely reasonable to assume that carbon fiber “hang on” panels and closures would be necessary to achieve MR5 at performance parity.
In past rules, commenters have noted that the NAS study relies on very little application of carbon fiber technology to achieve their highest level of mass reduction technology. NHTSA notes that the NAS study espouses a maximum level of mass reduction of approximately 14.5 percent using composites (
e.g.,
fiberglass) and carbon fiber technology only in closures structures (
e.g.,
doors, hoods, and decklids) and hang-on panels (
e.g.,
fenders). This is the “alternative scenario 2” in the NAS study and is a similar light-weighting technology application strategy to what the analysis roughly associates with MR5, but MR5 requires a 20-percent mass reduction. In this scenario, NHTSA is allotting more mass reduction potential for the same carbon fiber technology application than the NAS study does.
CALSTART, Inc. (CALSTART) commented on mass reduction, stating, “. . . mass reduction is often treated as a secondary pathway rather than a primary technology lever. This underestimates the true `maximum feasible' frontier.” Offering support for the approach NHTSA takes with mass reduction, the American Chemistry Council (ACC) commented, “ACC supports NHTSA standards that recognize mass reduction as an effective strategy to achieve both improved safety and fuel economy outcomes.” [336]
CALSTART appears to misunderstand how the CAFE model analyzes and applies mass reduction, since mass reduction is a primary, not secondary, technology pathway, as explained in the CAFE Model Documentation and Final TSD Chapter 3.4. For this final rule, NHTSA did not make any changes to the mass reduction pathway in response to comments.[337]
ICCT commented on specific mass reduction technology levels, stating that, “Nearly half of the baseline fleet is assumed to be at mass reduction level MR2 or MR3” and that, “NHTSA effectively limits further minor reduction in mass.” [338]
Fleet assignments for mass reduction, along with the regression analysis used to establish MR0 for each vehicle technology class, is discussed in Final TSD Chapter 3.4. Vehicles assigned MR2 or MR3 in the analysis fleet are lighter than the modeled vehicle for a given vehicle technology class and have already incurred the costs of MR2 or MR3 as a result of this mass reduction. Because these vehicles are already lighter than their respective vehicle technology class MR0 and early stages of mass reduction have already been achieved, continuing to remove mass from these vehicles will cost more. If NHTSA were to re-baseline MR0 continually, it would no longer account for the level of mass reduction already applied to vehicles in the analysis fleet, overestimating the available levels of mass reduction and underestimating the associated costs. The regression analysis used in this rulemaking appropriately captures the levels of mass reduction in the analysis fleet and further potential mass reduction throughout the rulemaking timeframe. NHTSA will revisit the regression analysis for future rulemaking and make appropriate updates.
NHTSA assigns mass reduction levels to vehicles in the analysis fleet by using regression analyses that consider a vehicle's body design [339]
and body style,
( printed page 62066)
in addition to several vehicle design parameters, like footprint, horsepower, bed length (for pickup trucks), and battery pack size (if applicable), among other factors. NHTSA has been improving on the light-duty regression analysis since the 2016 Draft TAR and continues to find that it reasonably estimates mass reduction technology levels of vehicles in the analysis fleet. Chapter 3.4 of the Final TSD contains a full description of the regression analyses used for the analysis fleet and examples of results of the regression analysis for select vehicles.
There are several ways NHTSA ensures that the CAFE Model considers mass reduction technologies in the way that manufacturers might apply them in the real world. Given the degree of commonality among the vehicle models built on a single platform, manufacturers do not have complete freedom to apply unique technologies to each vehicle that shares the same platform. Though some technologies (
e.g.,
low rolling resistance tires) are very nearly “bolt-on” technologies, others involve substantial changes to the structure and design of the vehicle and therefore often necessarily affect all vehicle models that share that platform. In most cases, mass reduction technologies are applied to platform level components and therefore the same design and components are used on all vehicle models that share the platform. Each vehicle in the analysis fleet is associated with a specific platform family. A platform “leader” in the analysis fleet is a vehicle variant of a given platform that has the highest level of mass reduction technology in the analysis fleet. As the Model applies technologies, it “levels up” all variants on a platform to the highest level of mass reduction technology on the platform. For example, if a platform leader is already at MR3 in MY 2024, and a “follower” starts at MR0 in MY 2024, the follower will get MR3 at its next redesign (unless the leader is redesigned again before that time and further increases the mass reduction level associated with that platform, then the follower would receive the new mass reduction level).
In addition to leader-follower logic for vehicles that share the same platform, NHTSA also restricts MR5 technology to platforms that represent 50,000 vehicles or fewer. The CAFE Model does not apply MR5 technology to platforms representing high-volume sales, like a Chevrolet Traverse, for example, where hundreds of thousands of units are sold per year. NHTSA also restricts MR5 technology from being applied to low volume non-passenger vehicles with a focus on durability and utility, such as the Ineos Grenadier and Ram 1500 Classic.[340]
NHTSA uses the combination of the leader-follower logic, the 50,000-unit threshold, and the high-utility vehicle restriction to make the simulation of mass reduction technologies more realistic. This is because NHTSA assumes that MR5 would require carbon fiber technology.[341]
There is high global demand from a variety of industries for a limited supply of carbon fibers; specifically, aerospace, military/defense, and industrial applications demand most of the carbon fiber currently produced. Currently, only about 10 percent of the global dry carbon fiber supply is allocated to the automotive industry, limiting the global supply base to supporting approximately 70,000 vehicles.[342]
In addition, the production process for carbon fiber components is significantly different than for traditional vehicle materials. NHTSA uses this adoption feature as a proxy for stranded capital (
i.e.,
when manufacturers amortize research, development, and tooling expenses over many years) from leaving the traditional processes and to represent the significant paradigm change to tooling and equipment that would be required to support molding carbon fiber panels. There are no other adoption features for mass reduction in the analysis.
In the Autonomie simulations, mass reduction technology is simulated as a percentage of mass removed from the specific subsystems that make up the glider. The mass of subsystems that make up the vehicle's glider is different for every technology class, based on glider weight data from the A2Mac1 database [343]
and two NHTSA-sponsored studies that examined light-weighting a passenger car and light truck. NHTSA accounts for mass reduction from powertrain improvements separately from glider mass reduction. Autonomie considers several components for powertrain mass reduction, including engine downsizing and fuel tank, exhaust systems, and cooling system light-weighting.[344]
With regard to the light-duty vehicle fleet, the 2015 NAS report suggested an engine downsizing opportunity exists when the glider mass is light-weighted by at least 10 percent. The 2015 NAS report also suggested that 10-percent light-weighting of the glider mass alone would boost fuel economy by 3 percent and any engine downsizing following the 10-percent glider mass reduction would provide an additional 3-percent increase in fuel economy.[345]
The NHTSA light-weighting studies applied engine downsizing (for some vehicle types but not all) when the glider weight was reduced by 10 percent. Accordingly, the analysis limits engine resizing to several specific incremental technology steps; important for this discussion, engines in the analysis are resized only when mass reduction of 10 percent or greater is applied to the glider mass or when one powertrain architecture replaces another architecture. A summary of how the different mass reduction technology levels improve fuel consumption is shown in Final TSD Chapter 3.4.4.
Regarding mass reduction costs, ICCT commented, “[a]lthough NHTSA improved its methodology for calculating mass reduction costs (the `bracketed' approach), its costs for M0-M4 levels of mass reduction remain based on outdated studies.” [346]
ICCT did not provide more recent comprehensive mass reduction cost estimates. NHTSA prices mass reduction technologies using a series of studies completed by EDAG in 2012 and 2018.[347 348]
These prices are then multiplied by an RPE factor to account for indirect costs
( printed page 62067)
associated with applying and developing the mass reduction technologies, such as R&D, personnel, and facilities. To account for ongoing improvements in manufacturing, learning, and efficiencies, the prices are reduced in a linear fashion year after year. Accordingly, NHTSA concludes that the current mass reduction costs and learning curves are still representative of mass reduction levels during the rulemaking timeframe and has not made changes to mass reduction costs for this final rule.
NHTSA's mass reduction costs are based on two NHTSA light-weighting studies—the teardown of a MY 2011 Honda Accord and a MY 2014 Chevrolet Silverado pickup truck [349]
—and the 2021 NAS report.[350]
The costs for MR1-MR4 rely on the light-weighting studies, while the cost of MR5 references the carbon fiber costs provided in the 2021 NAS report. Unlike the other technologies in this analysis that have a fixed technology cost (for example, it costs about $3,000 to add an AT10L3 transmission to a light-duty SUV or pickup truck in MY 2027), the cost of mass reduction is calculated on a dollar per pound saved basis based on a vehicle's starting weight. Put another way, for a given vehicle platform, an initial mass is assigned using the aforementioned regression model. The amount of mass to reach each of the five levels of mass reduction is calculated by the CAFE Model based on this number and then multiplied by the dollar per pound saved figure for each of the five mass reduction levels. The dollar per pound saved figure increases at a nearly linear rate going from MR0 to MR4. However, this figure increases steeply going from MR4 to MR5 because the technology cost to realize the associated mass savings level is an order of magnitude larger. This dramatic increase is reflected by all three studies NHTSA relied on for mass reduction costing, and NHTSA believes that it reasonably represents what manufacturers would expect to pay for using increasing amounts of carbon fiber on their vehicles.
Like past analyses, NHTSA considers several options for mass reduction technology costs. The agency has determined that the NHTSA-sponsored studies accounted for significant factors the agency believes are important to include in this analysis, including materials considerations (material type and gauge, while considering real-world constraints such as manufacturing and assembly methods and complexity), safety (including the Insurance Institute for Highway Safety's (IIHS) small overlap tests), and functional performance (including towing and payload capacity and noise, vibration, and harshness), and gradeability in the pickup truck study.[351]
First, NHTSA limits application of MR5 in the analysis to represent the limited volume of available dry carbon fiber and the resultant high costs of the raw materials. This constraint is described above and in more detail in Final TSD Chapter 3. The CAFE Model assumes that there is not enough carbon fiber readily available to support vehicle platforms with more than 50,000 vehicles sold per year. NHTSA believes this volume constraint does more to limit the application of MR5 technology in the analysis than does its high price. Even if a lower price is used, the dominant constraint would still be volume. Second, NHTSA does not believe that a lower price would prove to be a competitive pathway to compliance with exotic materials technology compared to other less expensive technologies with higher effectiveness. The MR5 effectiveness as applied to vehicles in this analysis considers the total effect of reducing that level of mass from the vehicle, from the vehicle's starting mass reduction level. As an example, while the cost of going from MR0 or MR1 to MR5 may be slightly overstated (but still limited in total application by the volume cap), the cost of going from MR4 to MR5 is not. NHTSA continues to consider the balance of carbon fiber and other advanced materials for mass reduction to meet MR5 levels and may update that value in future rules.
6. Aerodynamic Improvements
The energy required for a vehicle to overcome wind resistance, or more formally what is known as aerodynamic drag, ranges from minimal drag at low speeds to extremely significant drag at highway speeds.[352]
Reducing a vehicle's aerodynamic drag is, therefore, an effective way to reduce the vehicle's fuel consumption. Aerodynamic drag is characterized as proportional to the frontal area (A) of the vehicle and a factor called the coefficient of drag (Cd). The coefficient of drag (Cd) is a dimensionless value that represents a moving object's resistance against air, which depends on the shape of the object and flow conditions. The frontal area (A) is the cross-sectional area of the vehicle as viewed from the front. Aerodynamic drag of a vehicle is often expressed as the product of the two values, Cd
A, which is also known as the drag area of a vehicle. The force imposed by aerodynamic drag increases with the square of vehicle velocity, accounting for the largest contribution to road loads at higher speeds.[353]
Manufacturers can reduce aerodynamic drag either by reducing the drag coefficient or reducing vehicle frontal area, which can be achieved by passive or active aerodynamic technologies. Passive aerodynamics refers to aerodynamic attributes that are inherent to the shape and size of the vehicle. Passive attributes can include the shape of the hood, the angle of the windscreen, or even overall vehicle ride height. Active aerodynamics refers to technologies that variably deploy in response to driving conditions. Examples of active aerodynamic technologies are grille shutters, active air dams, and active ride height adjustment. Manufacturers may employ both passive and active aerodynamic technologies to improve aerodynamic drag values.
There are four levels of aerodynamic improvement (over AERO0, the first level) available in the analysis (AERO5, AERO10, AERO15, AERO20). Refer to Figure II-3 for a visual of each body style considered in the analysis. Each AERO level is associated with 5-, 10-, 15-, or 20-percent aerodynamic drag improvement values over a reference value computed for each vehicle body style. These levels, or bins, respectively correspond to the level of aerodynamic drag reduction over the reference value (
e.g.,
“AERO5” corresponds to the 5-percent aerodynamic drag improvement value over the reference value). While
( printed page 62068)
each level of aerodynamic drag improvement is technology neutral—that is, manufacturers can ultimately choose how to reach each level by using whatever technologies work for the vehicle—NHTSA estimates a pathway to each technology level based on data from a National Research Council of Canada-sponsored wind tunnel testing program. The program included an extensive review of production vehicles utilizing aerodynamic drag improvement technologies and of industry comments.[354]
NHTSA's example pathways for achieving each level of aerodynamic drag improvement are discussed in Chapter 3.5 of the Final TSD.
NHTSA assigns aerodynamic drag reduction technology levels in the analysis fleets based on vehicle body styles.[355]
NHTSA computes an average coefficient of drag based on vehicle body styles, using coefficient of drag data from the MY 2015 analysis fleet. Different body styles offer different utility and have varying levels of form drag. This analysis considers both frontal area and body style as unchangeable utility factors affecting aerodynamic forces; therefore, the analysis assumes all reductions in aerodynamic drag forces come from improvements in the drag coefficient. Then NHTSA uses drag coefficients for each vehicle in the analysis fleet to establish an initial aerodynamic technology level for each vehicle. NHTSA compares the vehicle's drag coefficient to the calculated drag coefficient by body style mentioned above to assign initial levels of aerodynamic drag reduction technology to vehicles in the analysis fleets. NHTSA can find most vehicles' drag coefficients in manufacturers' publicly available specification sheets; however, in cases where this information cannot be found, NHTSA uses engineering judgment to assign the initial technology level.
NHTSA looks at vehicle body style and vehicle HP to determine which types of vehicles can adopt different aerodynamic technology levels. For this analysis, AERO15 and AERO20 cannot be applied to minivans, and AERO20 cannot be applied to convertibles, pickup trucks, and wagons. In addition, NHTSA does not allow application of AERO15 and AERO20 technology to vehicles with more than 780 HP. This threshold is informed by information about performance of ICE vehicles. NHTSA recognizes that manufacturers tune aerodynamic features on these vehicles to provide desirable downforce at high speeds and to provide sufficient cooling for the powertrain, rather than reducing drag, resulting in middling drag coefficients despite advanced aerodynamic features. Therefore, manufacturers may have limited ability to improve aerodynamic drag coefficients for high performance ICE vehicles without reducing HP. This threshold for performance vehicles only limits the application of aerodynamic technologies on 2,518 units of sales volume in the analysis fleet.[356]
The aerodynamic technology effectiveness values that show the potential fuel consumption improvement from AERO0 technology are found and discussed in Chapter 3.5.4 of the Final TSD. For example, the AERO20 values represent the range of potential fuel economy improvement that could be achieved through the replacement of AERO0 technology with AERO20 technology for every technology key that is not restricted from using AERO20. NHTSA uses the change in fuel consumption values between entire technology keys and not the individual technology effectiveness values. Using the change between whole technology keys captures the complementary or non-complementary interactions among technologies.
NHTSA has carried forward the established AERO technology costs previously used in the 2020 final rule for the MY 2024-2026 standards analysis,[357]
and the 2024 rulemaking and has updated those costs to the dollar-year used in this analysis. For light-duty AERO improvements, the cost to achieve AERO5 is relatively low, as manufacturers can make most of the improvements through body styling changes. The cost to achieve AERO10 is higher than AERO5, due to the addition of several passive aerodynamic technologies, and consecutively the cost to achieve AERO15 and AERO20 is much higher than AERO10 due to use of both passive and active aerodynamic technologies. The cost estimates are based on CBI submitted by the automotive industry in advance of the 2018 CAFE NPRM and on the agency's assessment of manufacturing costs for specific aerodynamic technologies. The 2018 FRIA contains discussion of the cost estimates.[358]
NHTSA has not received additional information from stakeholders regarding the AERO costs since conducting the analysis for the 2018 final rule and has continued to use those cost estimates for subsequent analysis, including for this analysis. Final TSD Chapter 3.5 contains additional discussion of aerodynamic improvement technology costs, and costs for all technology classes across all model years are in the Technologies Input File.
7. Low Rolling Resistance Tires
Tire rolling resistance burns additional fuel when driving. As a car or truck tire rolls, at the point the tread touches the pavement, the tire flattens out to create what tire engineers call the contact patch. The rubber in the contact patch deforms to mold to the tiny peaks and valleys of the pavement. The interlock between the rubber and these tiny peaks and valleys creates grip. Every time the contact patch leaves the road surface as the tire rotates, it must recover to its original shape, and then as the tire goes all the way around, it must create a new contact patch that molds to a new piece of road surface. However, this molding and repeated re-molding action takes energy. Just like stretching a rubber band requires work, so does deforming the rubber and the tire to form the contact patch. When thinking about the efficiency of driving a car down the road, this means that not all the energy produced by a vehicle's engine can go into propelling the vehicle forward. Instead, some small, but appreciable, amount goes into deforming the tire and creating the contact patch repeatedly. This also explains why tires with low pressure have higher rolling resistance than properly inflated tires. When the tire pressure is low, the tire deforms more to create the contact patch, which is the same as stretching the rubber farther in the analogy above. Larger deformations consume even more energy, which results in worse fuel economy. Low rolling resistance tires have characteristics that reduce frictional losses associated with the energy dissipated mainly in the deformation of the tires under load, thereby improving fuel economy.
NHTSA uses three levels of low rolling resistance tire technology for the
( printed page 62069)
light-duty analysis. Each level of low rolling resistance tire technology reduces rolling resistance by 10 percent from an industry-average rolling resistance coefficient (RRC) value of 0.009.[359]
RRC data from a NHTSA-sponsored study shows that similar vehicles across the light-duty vehicle categories have been able to achieve similar RRC improvements. Chapter 3.6 of the Final TSD presents more information on this comparison. Final TSD Chapter 3.6.1 shows the light-duty low rolling resistance technology options and their associated RRC.
NHTSA has been using ROLL10 and ROLL20 in the last several CAFE Model analyses. NHTSA has only recently included ROLL30 due to lack of widespread commercial adoption of ROLL30 tires in the fleet within past rulemaking timeframes, despite commenters' argument on availability of the technology on current vehicle models and the possibility that there would be additional tire improvements over the next decade.[360]
NHTSA has received comments in previous CAFE rules that also reflect the application of ROLL30 by OEMs, though they discourage considering the technology due to high cost and possible wet traction reduction. With increasing use of ROLL30 application by OEMs,[361]
and material selection making it possible to design low rolling resistance independent of tire wet grip (discussed in detail in Chapter 3.6 of the Final TSD), NHTSA considers ROLL30 as a viable future technology during this rulemaking period. NHTSA believes that the tire industry is in the process of moving automotive manufacturers towards higher levels of low rolling resistance technology in the vehicle fleet. NHTSA believes that, at this time, the emerging tire technologies that would achieve 30-percent improvement in rolling resistance, like changing tire profile, stiffening tire walls, employing novel synthetic rubber compounds, or adopting improved tires along with active chassis control, among other technologies, may be available for commercial adoption in the fleet during this rulemaking timeframe.
Assigning low rolling resistance tire technology to the analysis fleet is difficult because RRC data are not part of tire manufacturers' publicly released specifications, and because vehicle manufacturers often offer multiple wheel and tire packages for the same nameplate. Consistent with previous rules, NHTSA uses a combination of CBI, data from a NHTSA-sponsored ROLL study, and assumptions about parts-sharing to assign tire technology in the analysis fleet. A slight majority of vehicles (54.9 percent) in the analysis fleet do not use any ROLL improvement technology (ROLL0), while 13.0 percent of vehicles use ROLL10, and 28.4 percent of vehicles use ROLL20. Only 3.7 percent of vehicles in the analysis fleet use ROLL30.
Lucid commented that the Draft TSD assumes all vehicles sharing a nameplate use identical rolling resistance technology in the fuel economy model. Lucid stated its view that this assumption is inaccurate, noting this approach “skews modeled fleet performance toward higher resistance values and undermines accuracy in estimating standards compliance.” [362]
NHTSA has determined that the approach used in the analysis is appropriate given the available data discussed above in this section and in Final TSD Chapter 3.6.2, and that the analysis reasonably captures the state of and application of low rolling resistance technology and its impact on fuel economy. Attempting to gather or generate specific rolling resistance values for each tire make and model for each vehicle in the analysis fleet would be unreasonably time consuming and expensive without contributing significantly to the robustness of the analysis. Lucid also commented, “NHTSA's analysis exaggerates cost burdens and fails to distinguish between low cost RRC improvements and wheel and tire size changes.” [363]
Consistent with previous rules, ROLL10 costs are in line with the supporting studies and reports discussed in Final TSD Chapter 3.6. Second, NHTSA concludes that using percent reductions in tire rolling resistance and the costs associated with the different levels of ROLL technology best represents the available technology and how the fleet could incorporate that technology. For this final rule, NHTSA has not made changes to the approach or costs for tire rolling resistance technologies.
The CAFE Model can apply ROLL technology at either a vehicle refresh or redesign. NHTSA recognizes that some vehicle manufacturers prefer to use higher RRC tires on some performance cars and SUVs. Since many performance cars have higher torque, to avoid tire slip, OEMs prefer to use higher RRC tires for these vehicles. Like the aerodynamic technology improvements discussed above, NHTSA applies ROLL technology adoption features based on vehicle HP and body style. As explained in Final TSD Chapter 3.6.3, all light-duty vehicles under 350 HP can adopt ROLL technology, and as vehicle HP increases, fewer vehicles can adopt the highest levels of ROLL technology. Final TSD Chapter 3.6 shows how effective the different levels of ROLL technology are at improving vehicle fuel consumption.
DMCs and learning rates for ROLL10 and ROLL20 are the same as prior analyses [364]
but are updated to the
( printed page 62070)
dollar-year used in this analysis. In the absence of ROLL30 DMCs from tire manufacturers, vehicle manufacturers, or studies, NHTSA extrapolated the DMCs from ROLL10 and ROLL20 to develop the DMC for ROLL30. NHTSA believes that the added cost of each tire technology accurately represents the price difference that would be experienced by the different fleets. ROLL technology costs are discussed in detail in Chapter 3.6 of the Final TSD, and ROLL technology costs for all vehicle technology classes can be found in the Technologies Input File.
8. Simulating Air-Conditioning Efficiency and Off-Cycle Technologies
Under EPA's current procedures for determining fleet average fuel economy for CAFE compliance, manufacturers may generate FCIVs, which improve their fuel economy values. Manufacturers may generate FCIVs for the addition of OC and AC efficiency technologies, which can provide fuel economy benefits in real-world vehicle operation that are not fully captured using the 2-cycle test procedures (
e.g.,
FTP and HFET) used to measure fuel economy.[365]
Starting in MY 2027, only automobiles powered by ICEs are eligible to generate FCIVs, and the OC FCIV program is currently being phased out between MYs 2031-2033, with manufacturers no longer being able to generate OC FCIVs for MY 2033 and beyond. OC technologies can include, but are not limited to, thermal control technologies, high-efficiency alternators, and high-efficiency exterior lighting. As an example, manufacturers can generate FCIVs for the addition of thermal control technologies like active seat ventilation and solar reflective surface coating, which help to regulate the temperature within the vehicle's cabin—making it more comfortable for the occupants and reducing the use of low-efficiency heating, ventilation, and air-conditioning (HVAC) systems. AC efficiency technologies are technologies that reduce the operation of or the loads on the compressor, which pressurizes AC refrigerant. The less the compressor operates or the more efficiently it operates, the less load the compressor places on the engine or battery storage system, resulting in better fuel efficiency. AC efficiency technologies can include, but are not limited to, blower motor controls, internal heat exchangers, and improved condensers/evaporators.
Since EPA first proposed allowing manufacturers to earn FCIVs for AC efficiency and OC technologies, NHTSA has not modeled AC efficiency and OC technologies in the CAFE Model like other vehicle technologies, for several reasons. Each time NHTSA adds a technology option to the CAFE Model's technology pathways, the agency increases the number of Autonomie simulations by approximately a hundred thousand. This means that adding just five AC efficiency and five OC technology options would double the agency's Autonomie simulations to around 2 million total simulations. Instead, for applicable model years, the CAFE Model applies predetermined AC efficiency and OC benefits to each manufacturer's fleet after the CAFE Model applies traditional technology pathway options. The CAFE Model attempts to apply pathway technologies and AC efficiency and OC technologies in a way that both minimizes cost and allows the manufacturer to meet a given CAFE standard without over-or under-complying. The predetermined benefits that the CAFE Model applies for AC efficiency and OC technologies are based on manufacturers' MY 2024 mid-model year CBI compliance reports.
NHTSA uses manufacturers' MY 2024 AC efficiency and OC FCIVs as a starting point for each regulatory class, then holds those values constant from MYs 2024-2031 for the No-Action Alternative and through MY 2027 for action alternatives. Unlike previous versions of this analysis, NHTSA does not extrapolate the MY 2024 values to future model years. Instead, the CAFE Model assumes that FCIVs for MY 2027 will be the same as they were for MY 2024. Manufacturers have been able to settle in on a level of AC efficiency and OC technologies that maximize their ROI; therefore, NHTSA does not anticipate a significant increase in manufacturers' AC efficiency and OC FCIVs between MYs 2024-2027 for any regulatory category. Additional details about how NHTSA determines AC efficiency and OC technology application rates are discussed Chapter 3.7 of the Final TSD.
Because the CAFE Model applies AC efficiency and OC technology benefits independent of the technology pathways, NHTSA must account for the costs of those technologies independently, as well. NHTSA generates costs for these technologies on a dollars per gram of CO2
per mile ($ per g/mi) basis, as AC efficiency and OC technology benefits are applied in the CAFE Model on a gram per-mile basis (as in the regulations). NHTSA updates the AC efficiency and OC technology costs by implementing an updated calculation methodology and converting the DMCs to 2024 dollars. The AC efficiency costs are based on data from EPA's 2010 FRIA and the 2010 and 2012 Joint NHTSA/EPA TSDs.[366 367 368]
NHTSA has used data from EPA's 2016 Proposed Determination TSD [369]
to develop the updated OC costs that were used for the 2022 final rule and now this final rule.
In the NPRM and for this final analysis, NHTSA removed FCIVs from its standard-setting analysis starting with MY 2028, which is the first year in which a removal of FCIVs could go into effect.[370]
NHTSA initially made this change in the NPRM to align with its conclusion that technology-specific incentives should not be considered when running the compliance simulation that informs its consideration of maximum feasible standards. For MY 2028 and beyond, NHTSA's analysis is based on simulating compliance based on 2-cycle testing. To simulate compliance
( printed page 62071)
pathways using the CAFE Model without AC efficiency and OC technologies, NHTSA sets the maximum allowable FCIV to 0 g CO2
(CO2
)/mi in the Scenarios Input File. Section VI contains a more detailed discussion of how AC efficiency and OC benefits affect compliance with NHTSA's fuel economy standards.[371]
In addition, NHTSA believes that the FCIVs generated under the OC and AC efficiency programs are no longer representative of actual fuel savings. The values for adding such technologies were estimated from emission-reduction assessments performed on MY 2008 automobiles. As fuel economy has improved in the model years since these assessments were performed, the FCIVs for adding OC technologies have increasingly represented a larger percentage improvement in fuel economy values. As a result, the values for FCIVs have become less representative of actual fuel savings and have created market distortions by incentivizing the addition of technology that does not provide commensurate fuel savings. NHTSA sought comment on this determination. Additional details and assumptions used for AC efficiency and OC costs are discussed in Chapter 3.7.2 of the Final TSD.
Comments from auto manufacturers and supplier groups supported the exclusion of AC efficiency and OC values from the standard-setting analysis. The Alliance [372]
agreed that technology-specific incentives should not be used to justify higher standards. Historically, including these values has increased stringency of the standards, effectively requiring their application. Ford Motor Company (Ford), Hyundai, Nissan, Porsche Cars North America (Porsche), and Stellantis [373]
support removing AC efficiency and FCIVs from the analysis used to set standards starting in MY 2028. MEMA, The Vehicle Suppliers Association and Specialty Equipment Market Association (SEMA) [374]
support the decision to base standards exclusively on gas and diesel vehicle fuel economy, excluding adjustments for OC technologies during the standard-setting phase.
NHTSA did not receive any comments requesting a different modeling approach for AC and OC FCIVs, nor any comments arguing that NHTSA should continue to include the simulation of these technologies and their FCIVs in the analysis. Therefore, NHTSA has made no changes to the analysis from the NPRM regarding AC efficiency and OC technology FCIVs. As described above, FCIVs are removed from the regulatory alternatives starting in MY 2028 and remain in the No-Action Alternative per the limits and phase-out schedule in EPA's regulations.
E. Consumer Responses to Manufacturer Compliance Strategies
The preceding subsections of Section II discussed how manufacturers might respond to the final standards. While the technology analysis outlined different compliance strategies available to manufacturers, the costs and benefits that would accrue because of the final standards are dependent on how consumers respond to manufacturers' compliance decisions. The following subsections describe how the agency models potential consumer response to changes in vehicle prices and attributes caused by manufacturer compliance decisions, as simulated by the CAFE Model.
1. Macroeconomic and Consumer Behavior Assumptions
Most of the economic effects simulated within the analysis are influenced by macroeconomic conditions outside the agency's influence. For example, fuel prices are determined mainly by global petroleum supply and demand, yet they affect how much fuel efficiency-improving technology U.S. manufacturers would apply to their vehicles, how much more consumers would be willing to pay to purchase vehicles offering higher fuel economy, how much buyers would drive those vehicles, and the value of each gallon of fuel saved from improved fuel efficiency. Forecasting the consequences of CAFE standards requires robust projections of demographic and macroeconomic variables that span the full timeframe of the analysis, including real GDP, consumer confidence, U.S. population, and real disposable personal income.
The analysis presented with the final rule utilizes fuel price projections developed by EIA, an agency within DOE that collects, analyzes, and disseminates independent and impartial energy information to promote sound policy-making and public understanding of energy. EIA uses its National Energy Modeling System (NEMS) to produce its AEO, which presents projections of future fuel prices (among many other economic and energy-related variables). The agency's analysis for the final rule uses AEO's 2026 Alternative Transportation and Electricity case projections of U.S. population, GDP, disposable personal income, GDP deflator, and fuel prices.[375]
NHTSA uses AEO's 2026 Alternative Transportation and Electricity case because this case is intended to reflect recently finalized changes to policy and therefore provides a more informed analysis of conditions that will affect fuel prices than the Reference Baseline case, especially in the near-term. The analysis also relies on the S&P Global forecasts of the University of Michigan's Consumer Sentiment Index from its fall 2025 U.S. Macroeconomic Forecast, which EIA also uses to develop the projections it reports in its AEO.[376]
These macroeconomic assumptions are important inputs to the analysis, but they are also uncertain, particularly over the long lifetimes of the vehicles affected by this final rule. To reflect the effects of this uncertainty, the agency also uses the 2026 AEO's Low Oil and Gas Supply and High Oil and Gas Supply side cases, and the 2025 AEO's Low Oil Price and High Oil Price side cases to analyze the sensitivity of its analysis to alternative fuel price projections.[377]
The purpose of the sensitivity analysis, which is discussed in greater detail in Chapter 9 of the FRIA, is to measure the degree to which different assumptions about fuel prices can change simulated outcomes. NHTSA similarly uses low and high economic growth cases from the 2026 AEO forecast as bounding cases for the macroeconomic variables in its analysis.
NHTSA sought and received comments on these data sources. Prime Mover Institute (PMI) criticized past price forecasts from the AEO, which overestimated the long-term level of prices, but supported NHTSA's choice in the proposal to rely on the Alternative Transportation case from the 2025 AEO because of the mix of policies
( printed page 62072)
included in this case as compared to the Reference case.[378]
In contrast, an individual commenter criticized the use of the Alternative Transportation case forecast, claiming that this artificially deflated the level of fuel prices and thus the benefits from higher CAFE standards.[379]
In response to these comments, NHTSA acknowledges that it is important to rely on a forecast that uses up-to-date assumptions about the most likely effects of policy on energy markets and the economy. The forecast NHTSA used in the proposal for gasoline prices was higher than the Reference case forecast, and this remains the case in the final rule. For 2031-2050, crude oil prices are also higher in the Alternative Transportation case that NHTSA is using than in the other AEO cases.
The analysis presented for this final rulemaking uses a 2024 base year, consistent with the use of vehicle data for MY 2024, and data for that year represents actual observations rather than estimates to the extent possible. Chapter 4.1 of the Final TSD discusses macroeconomic forecasts and assumptions NHTSA uses in this analysis.
Another key assumption used throughout the agency's analysis is how much consumers are willing to pay for improved fuel economy, including how much they are willing to pay when these fuel savings are accompanied by sacrifices in other vehicle features. The payback period assumption also has important implications for other regulatory analysis results, including the effect of standards on sales and the use of new vehicles, as well as the number and use of older, used vehicles. The NPRM proposed to change the payback period assumption from 30 months of fuel savings used in prior analyses to 36 months. The agency has updated its review of the academic literature on willingness to pay as part of its analysis of this final rule, which is discussed in Final TSD Chapter 4.21 and FRIA Chapter 2.1.2. As noted in previous rulemakings, the range of estimates presented in the literature is wide. Some of the studies conclude that consumers value much of the potential savings in fuel costs from driving higher mpg vehicles, while others conclude that consumers significantly undervalue expected fuel savings. The more recent studies suggest that consumers value somewhere between 24 months and the full lifetime value of undiscounted fuel savings, which is also supported by several of the older studies.[380]
Manufacturers have repeatedly informed the agency that they believe consumers only value between two to three years of fuel savings when choosing among competing models to purchase,[381]
and the plurality of consumers when surveyed about their payback preferences have stated they are willing to pay for technology that repays the upfront cost within 24 months.[382]
The agency also performed a retrospective analysis using the CAFE Model with reference fleets created to support prior rules. For the NPRM, the agency modeled how the 2020 reference fleet (used for the 2022 final rule), similarly projected forward, compared with the 2022 reference fleet (used in the 2024 final rule) and how the 2022 reference fleet (used for the 2024 final rule) projected forward with different payback assumptions compared with the 2024 reference fleet. These simulations provided model predictions about the technology penetration rates under different assumptions about the length of the payback period and under different projections of future fuel prices and technology costs. By comparing these to actual penetration rates, NHTSA could assess the Model's ability to predict technology adoption under each payback assumption. NHTSA found that the payback assumption that predicted technology adoption most accurately is 36 months, followed by 30 months. Both longer and shorter payback periods create a larger divergence; that is, when NHTSA tested longer and shorter payback periods, the model's predictions become less accurate, compared to the actual use of technology observed in MY 2024.
After weighing the results from the academic literature, previous statements from manufacturers, and the agency's retrospective analysis, NHTSA used a 36-month payback assumption for the analysis supporting the proposal. In coming to this determination, NHTSA was persuaded by its retrospective analysis, which found that a 36-month payback period assumption yielded greater consistency between the modeled 2024 fleet and observed 2024 technology application and achieved compliance. This estimate is also consistent with the literature and what manufacturers have consistently relayed to the agency. While this estimate represents a longer payback period assumption than was applied in the analysis of the previous three CAFE rules, the agency stated in the proposal its belief that the preponderance of the evidence suggests that 36 months is appropriate.
NHTSA sought comments on whether this is an appropriate representation of consumer willingness to pay higher upfront vehicle prices for future fuel savings. Several commenters criticized the assumption of a 36-month payback period. Consumer Reports argued that this was too short and at odds with survey evidence, while ZETA and other commenters argued 36 months was at odds with NHTSA's survey of the literature regarding consumer willingness to pay for fuel economy, and criticized NHTSA's survey as too selective.[383]
Another commenter suggested that NHTSA should use a longer payback period, noting that the average vehicle age is now 12.8 years.[384]
Several commenters disputed NHTSA's assumption that automakers will add technologies with a 36-month payback voluntarily in the absence of standards, stating this has no historical basis and artificially inflates the costs and pollution associated with the proposed rule.[385]
UCS argued that, because there were not significant changes in achieved fuel economy during the period in which standards were not increasing, modeling voluntary adoption of fuel-saving technologies that pay back within 36 months was inappropriate.[386]
UCS argued that no voluntary over-compliance should be assumed, which is equivalent to a 0 month payback period. They further argued that this assumption is inconsistent with NHTSA's inclusion of the implicit opportunity cost (IOC), because in principle consumers may value performance improvements more.[387]
Another commenter suggested that if
( printed page 62073)
industry truly believed consumers valued fuel economy improvements with a 36-month payback, they would invest in efficiency without Federal mandates.[388]
PMI supported NHTSA's choice to model a 36 month payback period in conjunction with its inclusion of the IOC, arguing that this was a reasonable proxy for buyers' preference for other vehicle characteristics, as opposed to being the result of myopia.[389]
The range of comments NHTSA received is consistent with the range of findings in the literature surrounding how much consumers value fuel savings. As noted in Final TSD Chapter 4.2.1.1, NHTSA's updated survey of the literature found a wide range of estimates that vary based on factors such as how the value was elicited (stated preference surveys vs. revealed preference surveys and market sales data). Including additional sources in NHTSA's review of the literature did not change NHTSA's findings about the approximate range of estimates. Indeed, one large survey found that, across different methodologies and datasets, the range of average estimates lined up closely with NHTSA's findings.[390]
Ultimately, NHTSA must choose a set of assumptions to make about consumer behavior in its modeling. For this reason, to determine an appropriate payback period assumption, NHTSA relied on retrospective analysis comparing results obtained from its model using a range of different payback periods. This allows NHTSA to use a payback period that produces realistic results in its simulations. NHTSA found that using a payback period of 36 months provided the most accurate representation of consumer behavior across the range of technologies modeled. Using significantly shorter or longer payback period assumptions appears to produce less representative results when predicting technology adoption.
NHTSA's retrospective analysis separately examined the technology adoption by manufacturers for vehicle fleets that over-complied with the MY 2024 standards and found that its assumption of 36 months outperformed shorter payback periods.[391]
This contradicts the contention by commenters that manufacturers will not apply fuel-saving technologies in the absence of higher standards. Therefore, eliminating cost-effective technology adoption in NHTSA's analysis would bias downward the achieved fuel economy levels in the absence of standards, and would bias upwards the technology costs of the standards. NHTSA also disagrees with UCS's argument that inclusion of the IOC precludes voluntary over-compliance. The technologies adopted under voluntary over-compliance are those whose fuel savings most significantly exceed upfront costs. Crucially, the fuel savings of vehicles with these technologies by definition are large enough that the portion of their fuel savings that consumers are assumed to value exceeds the sum of both the upfront additional costs of the technology and NHTSA's estimate of the IOC.
The contention that consumer valuation of fuel savings supports a longer payback period might not consider potential associated trade-offs in vehicle attributes. For example, survey evidence may indeed support the idea that consumers are willing to pay more for a vehicle with greater fuel economy if the question used in the survey does not include the caveat that the vehicle will come equipped with a less advanced set of features, less interior space, less power, or worse performance than expected. Similarly, consumers may indeed show a willingness to pay more for an individual vehicle model when fuel prices are higher (and projected fuel savings are greater) versus when fuel prices are lower. However, this does not address directly how a consumer would react to a combination of changes that includes new fuel-saving technology, changes to other vehicle features, and a higher sticker price.
Accordingly, NHTSA has concluded that increasing the payback period from 30 months in previous rulemakings to 36 months for this rulemaking is appropriate. Recognizing the consequences of the payback assumption in the agency's regulatory analysis, NHTSA also includes sensitivity cases to examine the impacts of longer and shorter payback periods in Chapter 9 of the FRIA. These concepts are explored more thoroughly in Chapter 4.2.1.1 of the Final TSD and Chapter 2.1 of the FRIA.
2. Fleet Composition
The composition of the on-road fleet—and how it changes in response to standards—determines many of the costs and benefits of the final rule. For example, how much fuel is consumed depends on the number and efficiency of new vehicles sold and how rapidly older, less efficient, less safe vehicles are retired. Reducing the stringency of the CAFE standards would lower the price of new vehicles compared to the No-Action Alternative and would lead to a relative increase in sales of newer, safer vehicles, which in turn would decrease the price of used vehicles leading to the quicker retirement of the oldest, least safe, and less fuel-efficient vehicles on the road.
The analysis accompanying the proposal and now this final rule simulates changes in the vehicle fleet's size, composition, and usage as manufacturers and consumers respond to regulatory alternatives, fuel prices, and macroeconomic conditions. The analysis of fleet composition examines two primary drivers: how sales of new vehicles and their integration into the existing fleet change in response to each regulatory alternative, and how economic and regulatory factors influence the retirement of used vehicles from the fleet (scrappage). NHTSA models sales and scrappage independently.
CAFE standards have been rising every year for nearly two decades. This constant increase in standards has been accompanied by a rise in both the cost of new vehicles and the age of the on-road fleet. The average selling price for new cars and light trucks rose nearly 50 percent between 2012 and 2024 and now approaches $50,000,[392]
while average U.S. household income increased only about half as much over that same period.[393]
Meanwhile, the total number of cars and light trucks in use rose by about 30 million, with the entire increase representing used vehicles, while their average age rose
( printed page 62074)
from 10.6 to 12.6 years.[394]
Below are brief descriptions of how the agency models sales and scrappage; for full explanations, readers should refer to Chapter 4.2.1 of the Final TSD.
a. Sales
By reducing the regulatory costs of complying with fuel economy standards, the final rule would lead to an increase in new vehicle sales relative to the No-Action Alternative. For purposes of regulatory evaluation, the relevant metric is the
difference
in the number of new vehicles sold between the baseline and each alternative rather than the absolute number of sales under any alternative. The agency's analysis of the response of new vehicle sales to different stringencies of fuel economy standards includes three components: a forecast of sales based exclusively on macroeconomic factors, which is used to determine the sales quantity for the No-Action Alternative; the assumed price elasticity of new vehicle demand, which interacts with estimated price increases under each alternative to create differences in sales relative to the No-Action Alternative; and a fleet share model that projects differences in the passenger and non-passenger automobile fleet shares under each alternative.
The first component of the sales response model is the nominal total new vehicle sales forecast, which is based on a small set of macroeconomic inputs that together determine the size of the new vehicle market in each future year under the baseline alternative. This statistical model is intended to provide only an initial forecast of light-duty vehicle sales; it does not incorporate the effect of prices on sales and is not intended to be used for analysis of the response to price changes in the new vehicle market. NHTSA's projection varies in the early model years before leveling off at around 15 million vehicles per year in the 2030s. This result is consistent with the continued response to sales volatility in the years following the coronavirus (COVID-19) public health emergency and the supply chain challenges immediately thereafter, as well as consumer sentiment in the near-term. NHTSA acknowledges that excluding the regulatory costs to comply with the baseline standards has the potential to underestimate the effect of prevailing conditions on vehicle sales; however, given that the macroeconomic assumptions used in the analysis take into account the effects of various regulatory policies and the fact that the relevant metric is the differences created by alternative CAFE stringencies, the agency has determined this approach is appropriate.
The agency's baseline sales forecast assumes that total new vehicle sales are driven primarily by conditions in the U.S. economy that are outside the influence of the automobile industry. Over time, new vehicle sales have been cyclical—rising when prevailing economic conditions are positive (periods of growth) and falling during periods of economic contraction. While changes to vehicles' designs and prices that occur as consequences of manufacturers' compliance with earlier standards (and with regulations on vehicles' features other than fuel economy) exert some influence on the volume of new vehicle sales, they are far less influential than macroeconomic conditions. The effects of compliance are not large enough to reverse broader cyclical trends in sales; instead, they produce marginal differences in sales among regulatory alternatives that the agency's sales module is designed to simulate. Increases in new vehicle prices caused by higher regulatory costs reduce sales below the cyclical trend, and slow fleet turnover, while decreases in prices have the opposite effect.
NHTSA is prohibited by statute from considering the fuel economy of dedicated automobiles (
e.g.,
battery electric or hydrogen vehicles) and therefore has removed dedicated automobiles from the sales forecast it uses to analyze the final rule. NHTSA uses market penetration rates from the AEO 2026 Alternative Transportation and Electricity case to estimate the market share of the gasoline-powered fleet. The agency then applies this market share to the total light-duty forecast produced by the nominal forecast.[395]
An independent projection like the AEO 2026 Alternative Transportation and Electricity case is a reliable estimate of the future market share for gasoline-powered vehicles.
The second component of the sales response model captures how price changes affect the number of vehicles sold. NHTSA estimates the change in sales from its initial forecast during future years under each regulatory alternative by applying an assumed price elasticity of new vehicle demand to the percent difference in average price between the regulatory alternatives and the No-Action Alternative. This price change does not represent an increase or decrease from the previous model year, but rather the percent difference in the average price of new vehicles between the baseline and each regulatory alternative for that model year. The average new vehicle price in the baseline is defined as the observed price in 2024 (the last historical data year before the simulation is run) plus the average regulatory cost associated with the No-Action Alternative for each future model year.[396]
The agency also subtracts any tax credits for which a PHEV may qualify from those regulatory costs to simulate sales.[397]
Within the CAFE Model's logic, there is an assumption that new vehicle models within the same regulatory class (
e.g.,
passenger automobiles) are close substitutes for one another, including vehicles with differing powertrains.[398]
NHTSA recognizes that different vehicle attributes may alter the perceived value of vehicles. NHTSA implements several modeling constraints to prevent the CAFE Model from considering technologies for fuel economy that could adversely affect the utility of vehicles, such as maintaining performance neutrality, including phase-in caps, and defining technology pathways by using engineering judgement. The agency acknowledges that, even with these constraints, it is possible that CAFE standards may influence attributes other than price or fuel economy that are unaccounted for in the agency's sales analysis.
NHTSA has previously invested considerable resources in developing a discrete choice model of the new automobile market that would (1) enable the agency to incorporate the effect of additional vehicle attributes on buyers' choices among competing models; (2)
( printed page 62075)
reflect consumers' differing preferences for specific vehicle attributes; and (3) provide the capability to simulate responses, such as strategic pricing strategies by manufacturers intended to alter the mix of models they sell and enable them to comply with new CAFE standards. However, those efforts have not yet produced a satisfactory and operational model.[399]
Instead, NHTSA accounts for the possibility of decreased utility of vehicles because of CAFE standards outside of the sales module.
Because the price elasticity that is applied in the CAFE Model assumes no perceived change in the quality of the product, and the vehicles produced under different regulatory scenarios have inherently different operating costs, the price metric must account for this difference. The price change to which the elasticity is applied in the analysis represents the residual price difference
between the baseline and each regulatory alternative
after deducting the value of fuel savings over the first three years of each model year's lifetime.
The price elasticity is also specified as an input, and for the proposal, the agency assumed a value of −0.4, meaning that a 5-percent increase in the average price of a new vehicle produces a 2-percent decrease in total sales. NHTSA has used this same elasticity in prior rulemakings. NHTSA stated in the proposal that estimates of this parameter reported in published literature vary widely,[400]
and NHTSA believes that its choice is a reasonable one within this range, but NHTSA also presented sensitivity cases that explore higher and lower elasticities in the PRIA.
The agency sought comment on this sales elasticity assumption—including whether NHTSA should consider applying separate short-run and long-run elasticity assumptions in the analysis. NADA supported NHTSA's use of −0.4 as its price elasticity since it is in the range supported by recent literature.[401]
Natural Resources Defense Council
et al.
(NRDC
et al.
) suggested that NHTSA revise its approach by using a lower elasticity value.[402]
This suggestion was based on a selection of estimates made since the year 2010, and NRDC
et al.
argued that the lower value better captures the long run dynamics of the new vehicle market in conjunction with scrappage. In support of its position, NRDC
et al.
included a literature review of papers from 1952 to 2020. The mean of all the studies was −0.6 and -1.15 for the long-run and short-term estimates, respectively. Narrowing the scope to only studies since 2000, NRDC
et al.
found that the median of all estimates for the elasticity falls around −0.35 to −0.4. NRDC
et al.
claimed that even further censoring its dataset to just estimates produced since 2010 lowers the average more and pointed to two recent papers and an amicus brief filed in litigation over the 2020 final rule. Finally, NRDC
et al.
argued that NHTSA's choice of elasticity was inconsistent with the large welfare losses it ascribes to sacrifices in other features for vehicles. IPI also argued that NHTSA should adjust sales using a lower magnitude elasticity due to interactions with the used vehicle market and potential substitution by car owners to outside options like public transit and ride shares.[403]
NHTSA's review of the literature NRDC
et al.
submitted found that one of these papers (Leard (2021) [404]
) estimated a long-term elasticity of −0.35, in line with results from the larger set of estimates, and very close to NHTSA's estimate. The amicus brief suggests a range between −0.03 and −0.61, which puts NHTSA's preferred estimate firmly in the middle. NHTSA also notes that Jacobsen
et al.
(2021) conducted a thorough review of the literature around this parameter, and chose a parameter estimate of −0.4 as the lowest magnitude value to use in simulations.[405]
NHTSA also chose −0.4, which, as demonstrated by Jacobsen (2021) and literature cited in comments is at the relative low-end of estimates, to represent a long-run “policy elasticity” meant to capture the long-run dynamics outlined by IPI. IPI argued that NHTSA should consider outside options like public transit and carpooling. NHTSA believes that these options also carry additional costs and the availability of these options varies across the country. Modeling the impact of these options directly, beyond the long-run impact of fuel prices on light-duty vehicle sales, is beyond the scope of the CAFE analysis and it is unclear whether broadening the analysis' scope would provide materials improvement.
In response to NRDC
et al.'
s comment that NHTSA's choice of elasticity was inconsistent with the large welfare losses it ascribes to sacrifices in other features for vehicles, NHTSA's choice of a three-year payback period operates under the assumption that after accounting for the value of sacrificed attributes, a new vehicle's fuel-saving technology must payback within its first three years of operation in order to be cost effective. This assumption is incorporated in the sales model, meaning that the agency's sales model is consistent with its accounting for the value of other vehicle features.
After consideration of comments and the relevant literature, NHTSA is continuing to use −0.4 as its sales elasticity parameter in this final rule. NHTSA presents sensitivity cases that explore the impact of higher and lower elasticities on the analysis in FRIA Chapter 9. Chapter 4.2.1.2 of the Final TSD further presents evidence that NHTSA believes supports its decision.
The third and final component of the sales model is the dynamic fleet share module (DFS). The analysis uses the DFS developed during the previous rulemaking. The baseline fleet share projection is derived from the agency's own compliance data for the 2024 fleet and from the 2026 AEO projections for subsequent model years. These shares are applied to the total industry sales derived in the first stage of the total sales model to estimate sales volumes of car and light truck body styles. NHTSA determines individual model sales using the following sequence: (1) individual
( printed page 62076)
manufacturer shares of each regulatory class (either passenger cars or light trucks) are multiplied by total industry sales of vehicles in that regulatory class and then (2) each vehicle within a manufacturer's volume of that regulatory class is assigned the same percentage share of that manufacturer's sales as in MY 2024. This assumes that consumer preferences for particular styles of vehicles are determined in the aggregate (
i.e.,
at the industry level), but that manufacturers' sales shares of those body styles are consistent with their MY 2024 sales. Within a given regulatory class, NHTSA assumes a manufacturer's sales shares of individual models are also constant over time.
This approach also assumes implicitly that manufacturers are pricing individual vehicle models within market segments in a way that maximizes their profit. Without more information about each manufacturer's true cost of production, including its fixed and variable components and its target profit margins for its individual vehicle models, there is no basis to assume that strategic shifts within a manufacturer's portfolio will occur in response to standards.
Similar to the second component of the sales module, the DFS applies an elasticity to the change in price between each regulatory alternative and the No-Action Alternative to determine the change in fleet share from its baseline value. NHTSA uses the net regulatory cost differential (costs minus fuel savings) in a logistic model to capture the changes in fleet share between passenger cars and light trucks, with a relative price coefficient of −0.000042. NHTSA selected this methodology and price coefficient based on a review of academic literature.[406]
When the total regulatory costs for passenger automobiles of meeting standards minus the value of the resulting fuel savings exceed that of non-passenger automobiles, the market share of non-passenger automobiles will rise relative to passenger automobiles. For example, a $100 net regulatory cost increase in passenger automobiles relative to light trucks would produce around a 0.1 percent shift in market share towards light trucks, assuming in the example that the latter initially represents 60 percent of the fleet.
As discussed in preamble Section VI, the agency is modifying its regulatory definitions for vehicle classification starting with MY 2030. The agency takes account of this reclassification after it simulates the aggregate sales and DFS responses to changes in vehicle prices. NHTSA assigns vehicles both an “initial” classification based on how they are classified under the current regulations and a “revised” classification for how they would be classified under the final regulations. The aggregate sales response is calculated at the fleetwide level, so regulatory classification affects changes in sales only insofar as a reclassified vehicle model incurs a different regulatory cost to comply with the requirements of its new regulatory class. For the DFS model, the regulatory costs are borne by a vehicle's “initial” classification, so an SUV that is reclassified from the light truck fleet to the passenger car fleet has its regulatory costs for the DFS analysis attributed to the light truck fleet throughout the analysis. This method assumes that each individual model's sales shares within the “initial” regulatory class remain constant. This may cause the counterintuitive effect of an increase in a vehicle's price, leading to an increase in that vehicle's sales. NHTSA considered applying its existing model to sales shares determined by the “revised” classification but decided against this due to the cross-elasticities used in the analysis being estimated based on the current classification system.
NHTSA sought comment on this approach and whether it is appropriate to apply the DFS's price coefficient to the “revised” regulatory classes, and if there is an alternative elasticity or methodology the agency could employ in its analysis. NHTSA did not receive any comments on this issue. On a related matter, AEG agreed with NHTSA that a discrete choice model would best capture the tradeoffs present in the new vehicle market and suggested using a sequential decision problem model setup.[407]
AEG argued that this framework would allow NHTSA to analyze substitution at a more granular and realistic level, within specific segments of the new vehicle market, rather than between regulatory classes. Likewise, IPI commented that sales should be projected by make of vehicle or even by model, allowing for compliance cost differences between manufacturers and vehicle models to influence market shares.[408]
In response to AEG's comments, NHTSA notes that it is continuing to explore options for improving the modeling of consumer choice for future rules. Regarding IPI's comment, to model sales accurately at the make or even model level would require modeling pricing strategies for manufacturers, which would involve capturing firm-level priorities and costs outside of the fuel economy technology adoption decision and goes well beyond the scope of this analysis. As a result, NHTSA has not changed its approach for this final rule.
b. Scrappage
For potential car buyers, new and used vehicles act as alternatives, or substitutes, for each other within broad limits. A consumer surveying the market for a new vehicle may find the combination of price and features undesirable and elect to continue to use an existing vehicle or purchase a used vehicle that better meets the consumer's price and feature preferences. When the price of a good increases, so does the demand for its substitutes, causing the equilibrium price and quantity of substitutes supplied to rise. Because the final rule would lower the price of new vehicles, demand for used vehicles would decrease, causing the equilibrium market price for used vehicles to decrease and simultaneously increasing the rate at which used vehicles are retired. Because used vehicles are in existence, their supply only can be increased by keeping more of those that would otherwise be retired in use longer, which corresponds to a reduction in their scrappage or retirement rates. As older vehicles are used longer, the average age of the fleet rises and the safety risk to all road users likewise increases, because older vehicles are less safe than newer ones.
When new vehicles become more expensive, demand for used vehicles increases. Because used vehicles are more valuable in such circumstances, they are scrapped at a lower rate, and just as rising new vehicle prices push some prospective buyers into the used vehicle market, rising prices for used vehicles force some prospective buyers to acquire even older vehicles or models with fewer desired attributes. The effect of fuel economy standards on scrappage is partially dependent on how consumers value future fuel savings; NHTSA assumes that, after accounting for sacrifices in other vehicle attributes, consumers value only the first 36 months of fuel savings when making a purchasing decision.
Many competing factors influence the decision to scrap a vehicle, including the cost to maintain and operate it, the household's demand for VMT, the cost
( printed page 62077)
of alternative means of transportation, and the value that can be attained through reselling or scrapping the vehicle for parts. In theory, a car owner will decide to scrap a vehicle when the value of the vehicle minus the cost to insure, register, maintain, and repair the vehicle is less than its value as scrap material; in other words, when the owner realizes more value from scrapping the vehicle than from continuing to drive it or from selling it. Typically, the owner that scraps the vehicle is not the original owner.
While scrappage decisions are made at the household level, NHTSA is unaware of sufficiently detailed household data to capture scrappage at that level. Instead, NHTSA uses aggregate data measures that capture broader market trends. In addition, the aggregate results are consistent with the rest of the CAFE Model, as the Model does not attempt to project manufacturers' pricing strategies; the Model assumes instead that all regulatory costs to make a particular vehicle compliant are passed on to the purchaser who buys the vehicle.
The dominant source of scrappage is “engineering scrappage,” which is largely determined by the age of a vehicle and the durability of the specific model year or vintage it represents. NHTSA uses proprietary vehicle registration data from S&P Global to estimate vehicle age and durability. Other factors affecting decisions to retire used vehicles or retain them in service include fuel economy and new vehicle prices; for historical data on new vehicle transaction prices, NHTSA uses NADA data.[409]
The data consists of the average transaction price of all light-duty vehicles; because the transaction prices are not broken down by body style, the scrappage module may miss unique trends within a particular vehicle body style. The transaction prices reflect the amount consumers paid for new vehicles and exclude any trade-in value credited towards the purchase. This may be relevant particularly for pickup trucks, which have experienced considerable changes in average price as luxury and high-end options entered the market over the past decade.
Vehicle survival rates, which are determined over time by scrappage, follow a roughly logistic function with age—that is, when a vintage is young, few vehicles in the cohort are scrapped; as they age, more and more of the cohort are retired each year, and the annual rate at which vehicles are scrapped reaches a peak. Scrappage then declines as vehicles enter their later years, as fewer and fewer vehicles in the cohort remain on the road. The analysis uses a logistic function to capture this trend of vehicle scrappage with age. The data shows that the durability of successive model years generally increases over time; put another way, historically, newer vehicles last longer than older vintages. However, this trend is not constant across all vehicle ages—the instantaneous scrappage rate of vehicles is lower generally for more recent vintages up to a certain age, but must increase thereafter so that the final share of vehicles remaining converges to a similar share remaining for historically observed vintages.[410]
NHTSA's scrappage model uses fixed effects to capture potential changes in durability across model years and ensures that vehicles approaching the ends of their lives are scrapped in the analysis.
The final source of vehicle scrappage is from cyclical effects, which the CAFE Model captures using forecasts of GDP and fuel prices. The macroeconomic conditions variables discussed above are included in the logistic model to capture cyclical effects. Finally, the change in new vehicle prices projected in the Model (technology costs minus 36 months of fuel savings and any tax credits passed through to the consumer) is included, and changes in this variable are the source of differing scrappage rates among regulatory alternatives.
NHTSA sought comment on the suitability of its scrappage modeling approach in the proposal. NADA and other commenters supported NHTSA's scrappage modeling and agreed with its finding that policies like CAFE standards cause some vehicle owners to forgo retiring used vehicles when new vehicle prices increase. NADA pointed to the rise of the average age of vehicles in the on-road fleet in recent years and the greater safety risks that older vehicles present.[411]
On the other hand, Consumer Reports supported NHTSA's modeling of scrappage effects but argued that the length of its payback period unduly influenced its results. NRDC
et al.
disagreed with NHTSA's assumption that manufacturers will pass technology costs onto consumers and suggested that this would cause NHTSA to overestimate the effect of high standards on scrappage rates.[412]
NRDC
et al.
also argued that, in the absence of higher standards, manufacturers may choose to apply technology to improve other vehicle features and will not lower prices in response.
Regarding Consumer Reports' comment about the interaction between scrappage effects and payback period, NHTSA continues to believe that 36 months is the most appropriate payback period for its new vehicle sales analysis as discussed in Section II.E.1. Because the payback period included in the scrappage model is meant to capture the effects of changes in new vehicle sales on scrappage, NHTSA believes that the payback period for the scrappage model should be the same as that used for the sales module.
In response to NRDC
et al.'
s comment, NHTSA does not model new vehicle pricing strategies because it is beyond the scope of NHTSA's analysis. NHTSA is unaware of any empirical basis to model new vehicle pricing strategies more comprehensively and notes that the data necessary to do so is almost certain to include proprietary business information. If a manufacturer's profit maximizing strategy involves cross-subsidizing vehicles with new technologies by raising the price of other vehicles, the analysis may indeed overestimate the predicted price of some individual new vehicle models while underestimating the price of others. However, NHTSA's analysis operates at higher, more aggregated levels, and its assumptions at this level are reasonable. If manufacturers do not pass on additional costs of technology to consumers at the fleet level, over the long term, they will go out of business. In the case of improvements to other vehicle features, NHTSA anticipates that manufacturers would add these features by choice because they are valued by consumers and would increase demand for new vehicles. As outlined in Final TSD Chapter 4.2, these types of changes in the new vehicle market would tend to increase scrappage rates. Therefore, NHTSA believes that its use of pass-through assumptions at the aggregate level used in the scrappage model is reasonable.
Finally, some commenters took issue with NHTSA's decision to continue using the same dataset for estimating its scrappage model in this rulemaking, and to continue using a reduced-form
( printed page 62078)
model.[413]
They argued that a reduced-form model, which estimates the statistical relationship between scrappage rates and other economic variables, rather than a structural model which formally relates the variables through a theoretical economic model, was inappropriate for predicting scrappage rates out into the future. NHTSA considered updating its dataset, which includes observations for all vehicles present in the on-road fleet for CYs 1975-2017.[414]
However, new and used vehicle markets faced significant disruptions due to supply chain interruptions from 2020-2022, making these datapoints somewhat atypical outliers. Scrappage rates require two years of data because they represent a year-to-year change in the size of the on-road fleet, meaning that only one additional year of observations after 2020 would be available prior to the start of the rulemaking period. Because the dataset NHTSA uses covers an extensive time series, adding even several new model years of data would only contribute a small share of additional information to the dataset used to develop the estimates. The commenters also do not point to any reasons or evidence for the assertion that not using more recent data biases the results. Therefore, NHTSA continues to use the same dataset to estimate its scrappage model results for the final rule. However, the agency did update its estimates by adjusting variables denominated in dollars to constant 2024$ values and adjusting the calculation of the explanatory variable representing price net of payback period fuel savings. In prior rulemakings, this variable used a value of fuel savings equal to the value accumulated over the first 2.5 years of use. NHTSA updated its payback period for the proposal to the first 3 years, which is equivalent to the first 48,000 miles of use. Because this variable is meant to capture the effects of the new vehicle market on the used market, and thus scrappage, the CAFE Model projects it forward using the same quantity of miles. Accordingly, the coefficient used in the scrappage model must be estimated using this same calculation in order for the model to be consistent. This means that, in both the proposal and this final rule, coefficients differ from those used in the 2024 final rule, which was noted by commenters.[415]
The adjustments are discussed in Chapter 4.2 of both the Draft and Final TSD.
In addition to the variables included in the scrappage module, NHTSA considers several other potential variables that likely either directly or indirectly influence scrappage in the real world, including maintenance and repair costs, the value of scrapped metal, vehicle characteristics, the quantity of new vehicles purchased, higher interest rates, and unemployment. These variables are excluded from the scrappage module either because of difficulties in obtaining data to measure them accurately or other modeling constraints. Their exclusion from the module is not intended to diminish their importance but rather highlights the practical constraints of modeling intricate decisions like scrappage.
NHTSA sought comments on whether it should include any of these variables and, if so, requested specific methodologies that would produce robust and unbiased estimates that could be used in a regulatory analysis setting. Some commenters argued that NHTSA should use a single model to determine both new vehicle sales and scrappage rates jointly.[416]
While NHTSA uses separate modules to predict sales and scrappage, the two are connected through the inclusion of new vehicle prices, net of payback period fuel savings, in each. Modeling sales and scrappage jointly would require developing a dynamic model for scrappage that takes account of consumer expectations for the cost of continuing to own and operate used vehicles as well as expectations about the future cost of owning and operating new vehicles in future years. This would add significant modeling complexity and require additional data not currently used in the CAFE Model, including maintenance costs by age, body style, and powertrain for the entire on-road fleet, which is not possible within the rulemaking timeframe. This would also require more granular data for existing used vehicles, some of which is not available and thus would require significant assumptions that could introduce error to the model. NHTSA includes a set of sensitivity cases that vary parameters in the sales and scrappage models in Chapter 9 of the FRIA which addresses many of the alternative theories posited by commenters. The agency will consider development of a dynamic scrappage model for future rulemaking, but the existing approach provides a reasonable means by which the agency can evaluate the relationship between changes in new vehicle prices and scrappage rates.
Resetting the CAFE standards is expected to accelerate the retirement of older vehicles. Because the final standards reduces the regulatory burden on manufacturers and by extension the price of new vehicles, the demand and price for used vehicles should decrease, and incentivize households to replace the older vehicles that are costly to maintain with newer, cheaper options—including newer used vehicles.
3. Changes in Vehicle Miles Traveled
As described in the fleet turnover section, fuel economy standards influence the quantity of new vehicles sold and how quickly older vehicles are retired. Model years of different vintages possess distinguishable characteristics, with newer vehicles typically being more fuel efficient and safer than their older contingents. While the decision itself to buy a new vehicle or retire an older vehicle may confer certain costs and benefits to their owners, most of the effects are realized only through the use of those vehicles. The lower standards of the final rule will accelerate fleet turnover compared to the baseline, which results in more miles being driven in newer, safer vehicles compared to older, less safe vehicles. The agency anticipates that fewer miles will be driven in the oldest and least safe vehicles on the road, and the number of fatal accidents and serious injuries from highway crashes will decrease as result of the final rule.
Deciphering which vehicles are being driven is just as important as how many miles are being driven. Any shift in miles driven by older vehicles to newer vehicles creates a corresponding shift in societal benefits. To capture how CAFE standards influence the distribution of miles across the fleet, NHTSA estimates VMT based on the average use of vehicles at different ages, the total number of vehicles in use, and the composition of the fleet by ages. These three components—average vehicle usage, new vehicle sales, and older vehicle scrappage—jointly determine total VMT projections for each alternative.
VMT is determined by how much households want to drive and how much they can afford to do so. NHTSA believes that a significant portion of light-duty VMT is unaffected by fuel economy standards. Households have some basic level of travel demand that needs to be met such as driving to work or school, and those households will drive those miles regardless of the
( printed page 62079)
imposition that fuel economy standards may impose. NHTSA's perspective is that the total demand for VMT should not vary excessively across alternatives. To prevent large differences from arising among the regulatory alternatives, the agency constrains the aggregate amount of VMT—besides VMT attributable to the “rebound effect”—across alternatives to be equal with the No-Action Alternative.
In prior rules, the agency used the Federal Highway Administration (FHWA) VMT Forecasting Model to project total VMT in future calendar years and then adjusted alternatives based on fleet composition. NHTSA employed this methodology because it used a reliable, external projection of annual VMT as a starting point. However, because the FHWA model includes miles that will be driven in dedicated automobiles, NHTSA amended its approach for the proposed rule, which the agency has elected to retain for the final rule.
The No-Action Alternative's projection of VMT uses the simulated projections of the gas-powered fleet produced by the sales and scrappage models and applies it to estimates of VMT per vehicle. Vehicles of different ages and body styles have different costs to own and operate, and usage changes across vehicle ages independent of CAFE standards. To account properly for the average value of consumer and societal costs and benefits associated with vehicle usage under various alternatives, it is necessary to partition miles by age and body type. Using S&P Global odometer data, NHTSA creates “mileage accumulation schedules” as an initial estimate of how much a vehicle is expected to drive at each age throughout its life. The mileage accumulation schedules also account for differences in driving habits based on body style. Multiplying the numbers of each vehicle projected to be in the fleet by the per-vehicle VMT estimates from the mileage accumulation schedules creates a forecast of VMT in each calendar year.
The methodology to allocate miles within the regulatory alternatives is similar. NHTSA uses the forecasts of the fleet produced by the sales and scrappage models and multiplies those by mileage accumulation schedules to create a total estimate of VMT. NHTSA then scales the alternative's VMT to match the No-Action Alternative's aggregate VMT, preserving the percentage of VMT driven by each model.
NHTSA sought comments on whether it should remove the VMT constraint and allow alternatives to have differing levels of VMT. NHTSA stated in the NPRM that, while most household VMT is likely inelastic, it may be reasonable to assume that fleets with differing sizes, age distributions, and inherent cost of operation may have marginally different annual VMT (even without considering VMT associated with rebound miles). In previous rules, NHTSA elected to continue to constrain VMT across alternatives in part because of the difficulty of determining whether VMT would shift to other modes of transportation and, if so, how to account for the impacts of any such mode shift. NHTSA sought comments on whether it is appropriate to consider mode shifts if the agency removes the VMT constraints and requested data or suggested modeling approaches that could assist the agency.
IPI commented that changes in the fleet composition and size should be accompanied by changes in non-rebound VMT.[417]
UCS by contrast agreed with NHTSA's assessment that household VMT is largely inelastic, and that changes in travel demand are captured by the modeling of rebound VMT.[418]
NHTSA agrees with UCS and is continuing to model a non-rebound VMT constraint in this final rule. While some households may choose not to own a vehicle, or might dramatically change their daily travel habits when they buy or sell one of their vehicles, it is more likely that most of the changes in fleet size caused by increased CAFE standards will result in compensating changes in the usage of other vehicles, primarily older vehicles being driven more. Even if CAFE standards do cause some changes in VMT, attempting to model the exact nature of this substitution requires a complex model of household travel demand, and alternative modes of travel would require capturing regional and local variation in household driving patterns, and the availability of alternatives like public transportation and carpooling. Modeling this type of decision-making adds little additional precision to NHTSA's incremental results and could instead introduce additional sources of error. Doing so would thus significantly expand the model beyond its current scope, for little additional gain in estimating the variables of interest for NHTSA's CAFE analysis.
The Attorneys General criticized NHTSA's approach to modeling non-rebound VMT in the standard-setting analysis.[419]
These commenters argued that, by not including BEVs and other dedicated AFVs, NHTSA failed to consider the costs and benefits related to changes in VMT driven by these vehicles. These commenters also pointed to inconsistencies between NHTSA's standard-setting projection for non-rebound VMT and other projections, including its EIS projection and projections produced by EIA in its 2025 AEO. Commenters pointed to periods where NHTSA's gas-powered fleet's projected non-rebound VMT exceeded the EIS projection, and the faster rate of decline in the gas-powered fleet's share of non-rebound VMT compared to the AEO. These commenters argued that these factors showed that NHTSA's projection model was not suitable for determining non-rebound VMT, and that it had material effects on the costs and benefits estimated in NHTSA's analysis.
NHTSA did not include these vehicles in its projection because doing so would violate the statutory restrictions that preclude consideration of such vehicles when setting standards. While NHTSA's projection of VMT differs from other projections given these statutory constraints, this does not make it unsuitable for the task for which it is used, namely producing a baseline forecast that is consistent with the projected fluctuations in the size and composition of the gas-powered on-road fleet NHTSA models in its standard-setting analysis. Per-vehicle VMT is determined using NHTSA's VMT accumulation schedule, which is documented in Final TSD Chapter 4.3, and represents a reasonable expectation for vehicle usage over the long term. The size and composition of the on-road fleet are consistent with the development of the fleet as predicted by NHTSA's sales and scrappage models. Finally, the purpose of this projection is to provide a baseline expected level of VMT that can be fixed across alternatives and used as a basis for determining rebound VMT. NHTSA's methodology ensures that the per-vehicle usage that rebound elasticities are applied to remains at a reasonable level across alternatives. Using an outside forecast not generated consistently with the projected fleet risks introducing a source of error into the analysis.
NHTSA analyzed sensitivity cases that used alternative sources for its non-rebound VMT constraint, including projections of gas powered VMT from
( printed page 62080)
the 2026 AEO and the EIS. Results are discussed in PRIA Chapter 9.
A portion of household travel that
is
elastic is known as “rebound” mileage. The fuel economy rebound effect—a specific example of the well-documented energy efficiency rebound effect for energy-consuming capital goods—refers to motorists who choose to increase vehicle use (as measured by VMT) when fuel economy is improved and, as a result, the cost per mile (CPM) of driving declines. If fuel economy increases, the cost to drive additional miles decreases, causing vehicles with better fuel efficiency to be driven more. For the final rule, reducing the level of fuel economy required by government regulation would have the opposite effect, reducing the number of miles driven.
NHTSA has employed several different estimates of the rebound effect through the years. Until recently, the agency had historically used an estimate between 15 and 20 percent. The agency lowered its estimate in the 2022 final rule to 10 percent, a value that was also used in the 2024 final rule. For this rulemaking, NHTSA re-reviewed the literature related to the fuel economy rebound effect, which is extensive and covers multiple decades and geographic regions.[420]
The totality of evidence, without excluding certain studies based on arbitrary selection criteria, suggests that the plausible range for the rebound effect is quite wide, extending from 10 percent to perhaps as high as 40 percent. This range implies that, for example, a 10-percent reduction in vehicles' fuel CPM would lead to an increase of between 1 to 4 percent in the number of miles they are driven annually. The central tendency of this range appears to be at or slightly above its mid-point, which is 25 percent. Considering only those studies that NHTSA believes utilize robust and reliable data, employ identification strategies that are likely to prove effective at isolating the rebound effect, and apply rigorous estimation methods, suggests a range of approximately 10-35 percent, with most of the estimates falling in the 15-30 percent range.
When NHTSA reviewed the literature for both the 2022 and 2024 rules, the agency arrived at a similar conclusion but chose to use an estimate at the lowest end supportable by published research. NHTSA argued that both economic theory and empirical evidence suggested that the rebound effect was declining over time in response to factors such as increasing income (which increases the value of travelers' time), progressively smaller reductions in fuel costs from continuing increases in fuel economy, and slower growth in car ownership and the number of license holders. The agency also noted that some lower estimates of the rebound effect were associated with recently published studies that rely on U.S. data, measure vehicle use using actual odometer readings, control for the potential endogeneity of fuel economy, and—critically—estimate the response of vehicle use to variation in fuel economy itself rather than to fuel cost per distance driven or fuel prices. The agency gave greater weight to these studies, which suggested a rebound effect in the 5 to 15 percent range.
Consistent with NHTSA's surveys of the latest available data for each successive CAFE analysis, as discussed above, the agency reconsidered for this analysis its prior assumptions about the rebound effect discussed in the 2022 and 2024 final rules—in particular its assumption that the rebound effect is declining over time—and concluded that a rebound estimate of 15 percent is more appropriate. In particular, a meta-analysis of 74 recently published studies of the rebound effect noted that “the magnitude of the rebound effect in road transport can be considered to be, on average, in the area of 20 [percent],” and that the most likely long-run estimate was about 32 percent [421]
—both significantly higher than the agency's prior 10 percent value, and also well above the 15 percent value employed in this analysis. The agency also believes that selecting a rebound estimate that is well-supported by the scientific consensus is more appropriate than speculating about potential future trends. NHTSA examines the sensitivity of estimated impacts to values of the rebound effect ranging from 10 to 20 percent to account for the uncertainty surrounding its exact value. For a more complete discussion of the rebound literature, refer to Final TSD Chapter 4.3.4.
Several commenters objected to NHTSA's decision to use a 15 percent rebound effect in its analysis supporting the NPRM, rather than the 10 percent value it has used in some previous rulemaking analyses. ICCT described the lower 10 percent value as “in alignment with prior analyses and updated research, especially in the context of a new fleet that is more efficient than ever and thus costs less to drive than ever [. . .] Restoring a 10 percent rebound is consistent with both historical precedent and recent literature.” ICCT and NRDC
et al.
both argued that NHTSA's review of the literature was focused on studies using changes in fuel price or fuel CPM rather than changes in fuel efficiency, and that the former generated a stronger response from consumers than the latter.[422]
NRDC
et al.
objected to NHTSA's consideration of all published estimates of the rebound effect, arguing that it should more heavily weight estimates identified by the authors of published studies as their preferred estimates, while discounting those the authors may view as less reliable.[423]
NRDC
et al.
noted that while authors such as Gillingham (2015) and Hymel and Small (2015) report wide ranges of estimates for the rebound effect, these authors prefer estimates toward the lower end of the ranges they report. NRDC
et al.
also cited some research arguing that the rebound effect is likely to decline over time in response to rising incomes, which raise the value of travel time while reducing the importance of fuel costs in drivers' decisions about how much to travel, thus reducing the magnitude of the fuel economy rebound effect.
Similarly, the City of Cleveland (Cleveland) noted “Historically, NHTSA and U.S. EPA have used a 10 percent rebound effect—meaning that VMT will increase 10 percent for every doubling of fuel economy—which reflects the best available research. In this NPRM, NHTSA rejects that 10 percent standard and instead adopts a 15 percent rebound effect. This is an inappropriately high estimate that breaks with recent research and historical norms.”[424]
Attorneys General asserted that “. . . the best evidence on rebound driving available—from the United States, using odometer data from emissions or safety inspections, and from recent years—leads to a central case estimate for the rebound effect of 10 percent, or perhaps even lower,” [425]
In contrast, PMI argued that increasing the rebound effect to 15
( printed page 62081)
percent is appropriate, observing that “at least some rebound effect is very likely, meaning the decrease in gasoline consumption will be muted . . . NHTSA's review of the literature suggests “a range of approximately 10-45 percent” for the rebound effect, “with most of the estimates falling in the 15-30 percent range. NHTSA previously assumed that the rebound effect was 10 percent, but NHTSA now assumes that it is 15 percent. Though still conservative, this change is appropriate.” [426]
While NHTSA acknowledges certain commenters' concern about the rebound effect estimate [427]
the agency concludes that the 15 percent value used in this analysis better represents the totality of evidence about the rebound effect's likely magnitude. As indicated above, the agency purposely chose the previous 10 percent value to be at the lower end of the range of values that could be supported by published research. After considering the issue in this rulemaking, however, NHTSA has concluded that it is more appropriate to select a value more accurately representing the full range of available evidence. The 15 percent value better serves this purpose than does 10 percent because the former lies closer to the central tendency of estimates reviewed in Final TSD Chapter 4.3.4. Specifically, the probability distributions of estimates of the rebound effect based on the response of vehicle use to variation in fuel cost per-mile driven and using different data and estimation approaches (shown in Final TSD Figure 4.20) suggest a most likely value close to 15 percent, while the distribution of estimates based on fuel efficiency (see Final TSD Figure 4.19) suggests a most likely value only slightly lower. Using a 15 percent rebound effect in the central analysis better represents the overall sense of the extensive research on its magnitude conducted over the past three decades, and conducting sensitivity analyses using values of 10 percent and 20 percent adequately encompasses the range of plausible values.
In order to calculate total VMT after allowing for the rebound effect, the CAFE Model applies the price elasticity of VMT (taken from the FHWA forecasting model) to the change in fuel CPM resulting from higher fuel economy and uses the result to adjust the initial estimate of each model's annual use accordingly. The CAFE Model applies this adjustment after the reallocation step described previously because that adjustment is intended to ensure that total VMT is identical among alternatives
before
considering the contribution of increased driving due to the rebound effect. Its contribution differs among regulatory alternatives because alternatives requiring higher fuel economy lead to larger reductions in the per-mile fuel cost of driving and thus to larger increases in vehicle use.
To summarize, because the finalized standards would lower the cost of newer vehicles, more of the base household travel demand will be satisfied by safer, newer vehicles, and simultaneously, newer vehicles will have lower fuel economy, leading to fewer miles being driven and resulting in a further reduction in fatalities and fuel expenditures.
Chapter 4.3 of the Final TSD provides more information on how NHTSA accounts for and models VMT.
4. Changes to Fuel Consumption
NHTSA uses fuel economy, age, and VMT estimates to determine changes in fuel consumption. NHTSA divides the expected vehicle use by the anticipated mpg to calculate the gallons consumed by each simulated vehicle, and when aggregated, the total fuel consumed in each alternative.
F. Simulating Emissions Impacts of Regulatory Alternatives
Changes in fuel consumption because of changes in CAFE standards (and resulting technology application) will result in changes in emissions of various pollutants.[428]
Vehicle-related emissions are computed by multiplying vehicle activity (
e.g.,
miles traveled, hours operated, or gallons of fuel burned), population (or number of vehicles), and emission factors. An emission factor is a representative rate that attempts to relate the quantity of a pollutant released to the atmosphere per unit of activity. As in past rules, the CAFE Model generates vehicle activity levels (both miles traveled and fuel consumption), while emission factors have been adapted from models developed and maintained by other Federal agencies.
This section provides a brief overview of how the agency estimates the resulting changes in emissions and associated effects from emissions of those pollutants.[429]
In this section, emissions that are generated between the initial point of oil extraction and delivering fuel to vehicles' fuel tanks or energy storage systems are referred to as “upstream” emissions, while “downstream” emissions refer to those emitted by vehicles' exhaust systems, and also include other emissions generated during vehicle refueling, use, and inactivity (called “soaking”), including hydrofluorocarbons leaked from vehicles' AC systems.[430]
Emissions also include particulate matter released into the atmosphere by BTW, as well as evaporation of volatile organic compounds from fuel pumps and vehicles' fuel storage systems during refueling and when parked.
For the final rule, the agency updated upstream petroleum emission factors using R&D GREET 2025, a lifecycle emissions model developed by Argonne.[431]
Several commenters supported the inclusion of upstream impacts in this final rule analysis.[432]
As in past analyses, the agency derived emission factors for the following four upstream emission processes for gasoline and diesel: (1) petroleum extraction; (2) petroleum transportation and storage; (3) petroleum refining; and (4) fuel transportation, storage, and distribution. A detailed description of how the agency used R&D GREET 2025 to generate upstream emission factors appears in Chapter 5 of the Final TSD. In this final rule, NHTSA uses a simplified parameterized economic model for estimating the response of domestic fuel production to changes in
( printed page 62082)
U.S. fuel consumption because such responses also affect upstream emissions estimates. Using this model, NHTSA estimates that 20 percent of the reduction in fuel consumption will be translated into reductions in domestic fuel production. Though NHTSA has not made any methodological changes to calculating upstream emissions in this final rule, projections of non-criteria and criteria pollutant upstream emissions inventories in FRIA Chapter 8.5 are now reported separately for global and domestic emissions, in line with Circular A-4 (2003).[433]
The agency estimated downstream emission factors for gasoline and diesel fuels for the majority of pollutants using EPA's MOVES5 model, a regulatory highway emissions inventory model developed by that agency's National Vehicle and Fuel Emissions Laboratory.[434 435]
In the proposal, NHTSA sought comments on the assumptions and methods used to project future emission inventories, which included estimated effects from Federal emissions standards for light-duty vehicles, including EPA's CO2
standards for MYs 2024-2026 and MYs 2027-2031. These effects were estimated prior to EPA publishing its proposal to rescind its action titled “Endangerment and Cause or Contribute Finding for Greenhouse Gases Under Section 202(a) of the Clean Air Act” (Endangerment Finding) and all resulting GHG emissions standards for light-, medium-, and heavy-duty vehicles and engines.[436]
There were no substantive comments on the policy assumptions included in MOVES5 used to estimate emission inventories in the proposal; however, to be consistent with EPA's final rule rescinding the Endangerment Finding, we have removed policy assumptions that are no longer relevant to estimating future non-criteria pollutant emission inventories for this final rule.[437]
In the proposal, NHTSA explored updating its methodology for applying downstream emission factors to vehicle classes within the CAFE Model and sought comment. MOVES regulatory classes may no longer map directly to the CAFE Model regulatory classes beginning in MY 2030, at which time NHTSA will subject vehicles to the amended vehicle classification definitions. However, because the CAFE Model applies downstream emission factors based on specific vehicle attributes, rather than regulatory classification, NHTSA's update to vehicle classification definitions does not affect how downstream emission inventories are estimated. Final TSD Chapter 5.3 contains additional details about how the agency generated the downstream emission factors used in this analysis, and Section VI presents additional information about NHTSA's finalized vehicle reclassification beginning in MY 2030.
As with downstream emission factors, the agency generated BTW emission factors using the latest version of EPA's MOVES5 model.[438]
NHTSA believes that compared to previous versions of MOVES, MOVES5's updated assumptions about brake pad composition and vehicle weights to estimate brake wear emissions that vary by model year, regulatory class, and fuel type present reasonable estimates for use in the agency's regulatory analysis. For further reading on BTW assumptions and how the agency employed those assumptions in the CAFE Model, please refer to Final TSD Chapter 5.3.3.4. NHTSA sought comments on this methodology and received no substantive comments or feedback. NHTSA continues to use the NPRM estimates of BTW emission factors for the analysis supporting this final rule. In terms of combined upstream, downstream, and BTW emissions, commenters noted that the action supported by this analysis would result in increased non-criteria, criteria, and air toxic emissions.[439]
The CAFE Model computes select health impacts resulting from localized population exposure to PM2.5
and its precursor pollutants that are measured by the number of instances predicted to result from exposure to each ton of relevant pollutant.[440]
As in past CAFE analyses, NHTSA relied on publicly available scientific literature to estimate PM2.5
-related effects for each upstream and downstream emissions source [441]
and employed certain assumptions to determine the most reasonable approach to incorporate estimates from literature into the Model.[442]
NHTSA includes additional discussion of the agency's approach to estimating these effects in Chapter 5.4 of the Final TSD. NHTSA received comments from individuals specifically calling for the agency to estimate direct health damages from air toxics.[443]
( printed page 62083)
In the absence of any published sources giving per-ton health incidence estimates for these pollutants, NHTSA is continuing to focus the CAFE analysis accounting of health damages from emissions on those stemming from NOX, SO2, and PM2.5
. Commenters noted that there are updated damage estimates for criteria pollutants available for some, but not all, sectors.[444]
They encouraged NHTSA to update estimates for the sectors that are available and only retain the current estimates for sectors that have not been updated.[445]
NHTSA has reviewed updated damage estimates for the available sectors and has determined that using these estimates would result in a lack of consistency and the inability to compare health damages across sectors. The available updated damage estimates use different specific health endpoints and including them would require a full restructuring of the health damages analysis that would leave many gaps remaining until the publication of updated damage estimates for all the sectors used in the CAFE analysis. Thus, NHTSA is maintaining the health damages estimates used in the NPRM for this final rule analysis.
G. Simulating Economic Impacts of Regulatory Alternatives
The following sections describe NHTSA's approach for measuring the economic costs and benefits that could result from amending previously established CAFE standards. OMB Circular A-4 states that benefits and costs reported in regulatory analyses must be defined and measured consistently with economic theory and also should reflect how alternative regulations are anticipated to change the behavior of producers and consumers from a baseline scenario without the regulation.[446]
Fuel economy standards affect vehicle manufacturers, buyers of new vehicles, owners of used vehicles, and suppliers of fuel, all of whom respond in complex ways to the standards that DOT establishes for future model years. NHTSA's accounting framework for the economic costs and benefits of CAFE standards was developed for a scenario in which standards are being set for cars and light trucks produced during future model years, for which no standards currently exist. Under this framework, NHTSA assumes hypothetical baseline standards for those future years to be identical to those in the last model year for which the agency previously established standards. Costs of alternative standards considered for future model years are measured relative to those for meeting the baseline standards, while benefits for each alternative are savings or other gains to buyers and users of new cars and light trucks or the general public, again measured in reference to the baseline alternative.
Most of the agency's rulemakings have established standards for future model years that are above their hypothetical baseline level, so the costs of meeting these standards have consisted primarily of manufacturers' outlays to increase the fuel economy of their car and light truck models to meet those higher standards, while benefits have consisted primarily of fuel savings for buyers and subsequent owners of models offering higher fuel economy. In rulemakings, such as this one, where the agency
reduces
previously established standards for future model years due to updated economic, market, and technological realities, manufacturers costs will be reduced compared to those for meeting the previous standards, while new cars and light trucks will consume more fuel than if those previous standards remained in place.
Thus, the estimated costs of meeting the revised standards are reported as negative values, which represents a regulatory cost savings. In addition, vehicle buyers' increased costs for fuel represent a reduction in benefits, and are therefore also reported as negative values. The analysis supporting this final rule assumes that reduced costs to manufacturers for meeting reduced CAFE standards will be reflected in lower prices for new cars and light trucks.
NHTSA's approach to estimating the economic impacts of regulatory alternatives considered in this rulemaking, including the assumptions it relies upon and the methodologies it employs, is discussed in detail in Chapter 6 of the Final TSD and throughout the FRIA (particularly Chapter 5). The safety implications of the final rule, including monetary measures of those impacts, are covered in Section II.H below.
Regulatory analysis needs to express costs and benefits that occur at different future times in comparable terms, which is done by discounting each future year's impacts to their present values. Following OMB Circular A-4 (2003), NHTSA presents the current values of all economic impacts quantified in its regulatory analysis discounting using the recommended rates of three and seven percent. One commenter argues that a seven percent capital-based rate should be accompanied by a different pass-through rate of compliance costs to consumers, and that the default discount rate should be a consumption-based one, with rates closer to two percent.[447]
The discount rates used in rulemaking are prescribed by the White House OMB. The current operative guidance from OMB, Circular A-4, refers agencies to OMB's earlier guidance on discounting contained in its Circular A-94, noting that “[a]s a default position, OMB Circular A-94 states that a real discount rate of 7 percent should be used as a base-case for regulatory analysis.” [448]
OMB continues to use the seven percent rate to estimate the average pre-tax rate of return to private capital investment throughout the U.S. economy. Because it is intended to approximate the opportunity cost of capital, it is the appropriate discount rate for evaluating the economic consequences of regulations that affect private-sector capital investments. OMB's guidance on discounting also recognizes that some Federal regulations are more likely to affect private consumption decisions made by households and individuals, such as when they affect prices or other attributes of consumer goods. In these cases, Circular A-4 advises that a lower discount rate is likely to be more appropriate, and that a reasonable choice for such a lower rate is the real consumer (or social) rate of time preference. This is the rate at which individual consumers discount future consumption to determine its present value to them, and a three percent rate is appropriate in this context.
The categories of economic costs and benefits resulting from NHTSA's finalized amendment to its previously established CAFE standards are described in Chapter 5 of the FRIA (see in particular Table 5-1). Monetary values of those estimates are presented in Chapter 8 (for the central analysis) and Chapter 9 (showing the results of various sensitivity analyses around key parameters and assumptions) of the accompanying FRIA.
Table II-8 below lists the economic benefits and costs analyzed in conjunction with this final rule and identifies where to find explanations of how they were estimated. The organization of the table shows how individual elements of the analysis are grouped together to produce NHTSA's estimates of each alternative's private
( printed page 62084)
and external costs and benefits.[449]
Private benefits and costs are those borne by vehicle manufacturers and by users of new cars and light trucks, including their initial purchasers and subsequent owners. External costs and benefits result indirectly from producing and consuming fuel and are borne by the public rather than just those who purchase and use vehicles. Social costs and benefits are the sum of their private and external components.
( printed page 62085)
( printed page 62086)
The remainder of this section briefly describes the key economic impacts of the finalized amendment and explains how they are categorized within the FRIA (with the exception of safety costs, which as noted earlier are covered in Section II.H).
1. Private Costs and Benefits
Manufacturer efforts to meet CAFE standards consist primarily of adding new technology to their car and light truck models, and together with any necessary design or engineering modifications, this increases their production costs. NHTSA assumes manufacturers pass these costs on to buyers of models that offer higher fuel economy by raising their selling prices.[455]
While the agency incorporates the effects of available tax credits in its analysis, these credits simply transfer revenue from taxpayers to vehicle buyers and have no net effect on the benefits or costs of the final rule. Estimates of technology costs reported throughout this final rule should be interpreted as excluding the value of tax credits unless otherwise noted.
Resetting CAFE standards will reduce the cost of technology that manufacturers need to add to their car and light truck models in order to comply with CAFE standards, and NHTSA assumes that this reduction in regulatory costs will be passed through to vehicle buyers in the form of lower prices. Relaxing standards will reduce the regulatory burden on manufacturers and enable them to produce models that offer combinations of fuel economy, other features, and prices that align more closely with consumer demand, resulting in higher vehicle sales. The CAFE reset will improve consumer welfare for consumers who are able to purchase vehicles at lower prices, and their collective welfare gain is measured by the increase in consumer surplus from higher sales of new cars and light trucks. Consumer surplus represents the value a good or service provides to consumers (the maximum they would have been willing to pay for it) over and above its market price, and OMB guidance states that it should be accounted for in regulatory analysis.[456]
Resetting previous standards will keep would-be purchasers from being priced out of the new vehicle market as manufacturers raise prices to recover their costs for applying more technology to meet higher standards, so buyers' consumer surplus will increase as sales rise rather than decline as it would have with the higher fuel economy standards in the No-Action Alternative. Section II.C.2.f of this preamble and Chapter 2.4 of the Final TSD provide more details.
Generally, NHTSA's CAFE rulemaking analyses include estimates of benefits to consumers from improving fuel economy, measured by the resulting reduction in vehicles' fuel costs. However, while improved fuel economy reduces vehicles' fuel cost throughout their lifetimes, new car buyers and subsequent owners do not appear to value those savings fully. If they did, manufacturers would presumably offer the levels of fuel economy that buyers demand, and market-determined fuel economy levels would balance the costs of improving it against the private benefits from saving fuel. To the extent regulating fuel economy does not improve the welfare of vehicle owners, regulation can only be justified if it produces additional benefits that are not experienced by buyers themselves. As discussed in II.E, NHTSA assumes that manufacturers will only adopt technologies with fuel economy improvements that repay the higher prices of models offering those improvements within 36 months.
In past rulemakings, the agency has described its assumption that buyers will forgo purchasing vehicles with higher fuel economy, even when they appear to offer future savings exceeding their price premiums, as an example of what is often termed an “energy paradox” or “energy-efficiency gap.” Though there has been extensive debate about whether and why such a gap might arise, NHTSA has recently justified stricter standards partly by assuming that potential car and light truck buyers act shortsightedly when they refuse to purchase models whose lower fuel costs would more than repay their higher purchase prices. This rationale is fundamentally different from the agency's traditional justification that fuel economy standards are necessary to remedy some “externality”—whereby buyers' choices cause economic harm to others—that arises from producing and consuming fuel.
Without clear evidence of such “myopia,” continuing to raise CAFE standards distorts the market by constraining manufacturers to provide levels of fuel economy above those consumers demand, causing manufacturers to raise prices to recover their higher costs for producing those vehicles or to sacrifice improvements in their models' other features. Instead, the agency believes a more plausible explanation for buyers' reluctance to purchase higher mpg models is that their unsatisfactory combinations of
( printed page 62087)
price and other features offset the attraction of lower fuel costs, and recent research supports this interpretation.[457]
Chapter 6.1.3 of the Final TSD provides further detailed review of this research. NHTSA has acknowledged this potential “opportunity cost” of raising fuel economy standards in its recent rules but has attempted to estimate its magnitude only as one of a large number of sensitivity analyses. The agency has justified this decision by claiming there is uncertainty in the literature over the degree to which requiring higher fuel economy will lead manufacturers to delay or forgo improvements to their models' features and how consumers would react. NHTSA has also cited data from EPA's Fuel Economy Trends Report showing that HP and acceleration have not decreased even when fuel economy standards were rising. However, these arguments did not consider the possibility that manufacturers could have offered
further improvements
in their models' other features or lower prices without continuing pressure to increase fuel economy.
NHTSA includes an estimate of the extent to which relaxing standards will reduce the opportunity cost of meeting previously established standards in its primary analysis of this final rule. The agency assumes that this cost must be sufficient to account for buyers' apparent unwillingness to purchase models whose higher fuel economy would repay their higher purchase prices. NHTSA estimates the opportunity cost as the value of fuel savings consumers are unwilling to pay for voluntarily that accrues between years 4 and 10 of a vehicle's life.[458]
In practice, manufacturers will respond to lower standards by adjusting the technologies they add to vehicles as well as by altering the tuning of these technologies and mix of vehicles in their production fleets, with the goal of increasing profits. For individual vehicle models this could result in a pure cost reduction, an improvement in other vehicle features, or a combination of the two.[459]
At the vehicle level, NHTSA's estimates of changes in costs and other vehicle attributes could be over- or under-estimates. However, at the aggregate level it is reasonable to assume, as NHTSA does, that there is likely to be a combination of lower technology costs and a reduction in the IOC cost relative to the No-Action Alternative. NHTSA included in the Draft TSD a detailed description of the agency's method for developing this measure, including its assumptions about manufacturers' anticipated response. The agency sought comments on its approach as well as suggestions for improving it.
Various organizations commented that the inclusion of IOC in the central analysis is arbitrary, lacks empirical evidence, and is inconsistent with established economic theory.[460]
They contend that NHTSA has not provided sufficient justification for elevating these costs from a sensitivity analysis to the central analysis.
The agency included the IOC in its central analysis, after presenting it as a sensitivity analysis in multiple prior rulemakings, because of its strong theoretical basis and the preponderance of empirical findings supporting its existence and importance. As documented in Final TSD Chapter 6, research shows that consumers place significant value on vehicle attributes like acceleration and that manufacturers have tended to make improvements to these features rather than fuel economy when standards are not rising. Moreover, findings from recent research including Leard
et al.
(2023) suggest that when CAFE standards increase manufacturers have less ability to design to the preferences of their customers for attributes other than fuel economy. This constitutes a significant cost to consumers because manufacturers invest less in features that consumers value.
NHTSA does not explicitly model vehicle design decisions over the full range of vehicle features and so must rely on other means to estimate the value of the IOC. This is similar to other aspects of NHTSA's analysis, like the additional mobility benefit provided by rebound driving, that use simplifying assumptions.[461]
This approach relies on the economic assumption that competitive, profit maximizing firms will be incentivized to provide vehicles with a mix of attributes that consumers desire in order to increase market share and profits. Manufacturers choosing to prioritize improving performance and other features rather than focusing on improving fuel economy during periods in which standards are constant reveals that consumers value these attributes more than the alternative improvements that could be made to fuel economy, even if consumers also recognize the value of fuel economy. The fact that these improvements to other features slows during periods of increasing standards, while improvements to fuel economy increase demonstrates that CAFE standards are restricting improvements to other features that would have been made otherwise. NHTSA does not model the range of design decisions that manufacturers alter to accommodate applying fuel-saving technology but instead assumes that their cost must be significant enough to account for the gap described above. Thus, NHTSA's approximation is rooted in the economic principle of revealed preference and is consistent with its approach to estimating other costs and benefits accounted for in its analysis.
NHTSA chose to approximate the value of the IOC by using the gap between what consumers have demonstrated they are willing to pay for changes in fuel economy, absent the sacrifice in other vehicle attributes, and the fuel savings that accrue within the first three years, or payback period. UCS claimed that this represented an inconsistency, since NHTSA's choice of payback period was not equal to its assumption about consumer willingness to pay for fuel savings.[462]
However, as discussed in Final TSD Chapter 4.2.1.1, these represent distinct concepts. The
( printed page 62088)
former can be thought of as the degree to which consumers will be willing to pay more for a new vehicle with high fuel efficiency if they expect gasoline prices to be relatively higher over the period in which they own the vehicle verses when they expect gasoline prices to be relatively lower. In this case, the quality of the vehicle's other features is unchanged, but the value of any fuel savings generated by the more fuel-efficient vehicle varies with the level of gas prices. The latter represents the degree to which consumers value a vehicle with greater fuel economy after considering any design changes manufacturers make to accommodate improvements to the vehicle's efficiency. Based on the evidence NHTSA examined in Final TSD Chapters 4 and 6, NHTSA believes that these two concepts differ.
IPI argued that observed consumer undervaluation was more likely the result of behavioral anomalies and other market failures.[463]
However, as discussed in FRIA Chapter 2, NHTSA found the evidence for this conclusion to be less compelling as evidence supporting the IOC.
In addition, some commenters argued that the magnitude of NHTSA's estimate of the IOC was unrealistic and had too large of an influence on the estimated net benefits for each alternative, given that it is being added as a measured cost in the central analysis for the first time in this rulemaking.[464]
One commenter suggested that NHTSA had used the wrong number of years (10) of discounted fuel savings in calculating the IOC because it did not correspond to the average length of ownership by the initial purchaser.[465]
As explained in Chapter 6 of the Final TSD, the 10-year timeframe accounts for about 75 percent of discounted lifetime fuel consumption. While this period extends beyond a typical initial purchaser's ownership, original owners are still compensated for future fuel savings because a portion of that value is capitalized into the vehicle's resale price. However, as detailed in Final TSD Chapter 6.1.3.4, buyers remain reluctant to factor these recaptured savings into their initial purchasing decisions. The agency's view is that this behavior demonstrates a clear trade-off: the value buyers place on other vehicle features—which manufacturers must often forgo to meet stringent CAFE standards—must significantly exceed the financial benefit of both their direct fuel savings and the capitalized resale value. Further, these other attributes could add value at resell too, which may offset any losses at the time of resale from reduced fuel economy; however, at this time, the agency is not directly measuring the change in value of used vehicles based on differing attributes.
Although NHTSA's estimate of the IOC is meaningful, it is just one of several costs and benefits estimated in the analysis, and the overall estimated net benefits of the final standards would remain positive even if it were to be excluded entirely. Moreover, NHTSA views this as evidence that estimates of costs in prior rulemakings were biased downward by the failure to include the IOC. PMI agreed with this characterization, arguing that costs were underestimated in past rulemakings and pointed to estimates from the economics literature to support its position.[466]
Commenters suggested that NHTSA's modeling of the IOC would be improved by modeling the sacrifice in other vehicle features rather than approximating the value of these features.[467]
UCS proposed one potential method for modeling this tradeoff by examining the full range of available technologies for each vehicle in each alternative, and comparing the value of using these technologies to improve performance rather than fuel economy. After accounting for the added cost of applying these technologies, the value of this additional performance can then be compared across alternatives. To address these comments, NHTSA has added a sensitivity case using a similar methodology to that suggested by UCS to estimate the value of the IOC. These results can be found in FRIA Chapter 9.
Commenters also argued that NHTSA misinterprets manufacturers' reluctance to apply fuel-saving technology as being due to a tradeoff of other vehicle features, claiming instead that it is evidence of supply side market failures, such as market power.[468]
In response to this comment, NHTSA considered the financial incentives facing these manufacturers, the findings of economic research on this topic, and the spending by manufacturers on market research. Grieco
et al.
(2024) find that evidence of concentrated market power-based markups have fallen over the past four decades, and that consumers' share of total surplus has increased.[469]
The authors suggest that the consumers captured benefits through improvements to features other than fuel economy and from manufacturers passing through reductions in production costs.[470]
Some commenters argued that NHTSA's performance neutrality modeling constraint is incompatible with modeling the existence of an IOC.[471]
This position misconstrues the nature of the IOC as applied in NHTSA's analysis. Although performance does not decline in the CAFE Model, it also does not improve. Past observed manufacturer decisions and evidence from the economics literature demonstrate that, in the absence of higher standards, manufacturers will make greater effort to improve performance and other features than they would make under higher standards. Thus, the relevant metric is not the difference in performance between the initial fleet and the modeled fleet under higher standards, but instead the modeled fleet under higher standards and under lower standards. NHTSA's performance neutrality assumption simplifies its modeling but prevents it from modeling these tradeoffs. However, NHTSA accounts for their impact on consumer welfare through the IOC.
Some commenters criticized NHTSA's treatment of the IOC as a single value, rather than accounting for any production costs that would have been diverted from fuel-saving technologies to other vehicle features under reduced fuel economy standards.[472]
Because NHTSA does not explicitly model changes in performance and other attributes, NHTSA can only model the IOC's net impact on consumer welfare. In its analysis, NHTSA assumes that the additional consumer benefits that these attributes provide would be larger than consumer willingness to pay for fuel economy improvements using the same
( printed page 62089)
technology or carrying the same cost. This example is illustrated in TSD Chapter 6.1.3.2, which explains the mechanisms through which CAFE standards generate this negative impact for consumers. For this reason, lower standards, which effectively allow manufacturers to substitute from fuel economy improvements to performance and other attribute improvements, are still likely to be net beneficial to the consumer even if there is no net reduction in technology costs (and thus no reduction in vehicle prices) associated with it. There likely are also cases in which manufacturers will choose not to apply additional fuel-saving technologies and will either adopt some additional performance enhancing technology, or not adopt additional technology but instead redeploy existing technology towards greater performance rather than fuel economy. In these cases, costs would decline below levels seen under high standards, performance would improve, and fuel economy would either remain unchanged or decline somewhat. Based on the measures of consumer willingness to pay for these other attributes, consumers will experience a net improvement, as modeled by the IOC. For the final rule, NHTSA has included a sensitivity analysis based on a methodology suggested by UCS, which decomposes technology costs between performance and fuel economy using the existing technology set in the CAFE Model. These results are presented in FRIA Chapter 9.
Finally, some commenters suggested that because some fuel-saving technologies like improved aerodynamics can improve both fuel economy and performance, or because performance features have improved alongside improvements in fuel economy over time, NHTSA's model of the production frontier as a tradeoff between fuel economy and performance is flawed.[473]
There are some technologies that may improve both performance and technology, and as NHTSA points out in its discussion of the production frontier, the figure in Final TSD Chapter 4.2.1.1. represents only a single slice of a multidimensional function relating fuel economy to other attributes. However, based on its review of the economics literature, tradeoffs between fuel economy and performance features more generally operate in the direction NHTSA indicates.[474]
PMI supported NHTSA's decision to include the IOC rather than assuming that market failures accounted for buyers' apparent undervaluation of fuel savings.[475]
They argued that in past rulemakings failing to consider tradeoffs between fuel economy and performance, and the high value consumers place on performance, has caused the agency to significantly underestimate the costs of CAFE standards. PMI argued that the effects of high standards can be seen in the share of more powerful V-6 and V-8 engines, which has dropped since 2005, and been replaced by V-4 engines.
After consideration of the comments and relevant literature, NHTSA has continued to include an estimate of the IOC in the analysis supporting this final rule.
Resetting previously established CAFE standards will permit lower fuel economy for some new cars and light trucks, thus increasing their fuel consumption and raising owners' fuel costs. The difference between fuel consumption in the No-Action Alternative and in each regulatory alternative represents that alternative's effect on total fuel use, and the cost of this additional consumption is estimated using forecasts of retail fuel prices. The agency's assumptions about future fuel prices are discussed in detail in Chapter 4.1.2 of the Final TSD. NHTSA received no substantive comments regarding the methodology used in the calculation of fuel costs for consumers. Commenters did compare the projected change in fuel costs to consumers to the upfront savings in vehicle prices, noting that for some model years the lifetime average change in fuel costs is greater than the average decrease in projected vehicle price.[476]
However, when taking into account the other categories that accrue privately to consumers, both private net benefits and overall net benefits are positive under the action. See Final TSD Chapter 6.1 for an explanation of the methodology for calculating fuel expenditure and FRIA Chapter 8 for the projected change in fuel expenditure as well as all other categories of private consumer costs and benefits.
Lowering existing standards will lead to relatively shorter driving ranges of models that achieve lower fuel economy in the action alternatives, requiring their users to refuel more frequently than under the No-Action Alternative. Drivers (and passengers) of future new cars and light trucks will economize on refueling stops as fuel economy increases over time under each regulatory alternative. However, their savings will be more modest than under the No-Action Alternative, so it appears as an incremental increase in the frequency of refueling stops in the analysis. NHTSA estimates the cost of more frequent fill-ups by calculating the amount of time it takes to locate a retail outlet, refuel one's vehicle, and pay, accounting for the typical number of passengers traveling with the driver, and multiplying by DOT's recommended value of travel time. NHTSA has updated these values for the final rule consistent with DOT's most recent benefit-cost analysis (BCA) guidance.[477]
For a full description of the agency's methodology, refer to Chapter 6.1.5 of the Final TSD. The agency sought comment on whether, and the extent to which, a reasonable manufacturer may simply install a larger fuel tank—potentially eliminating any refueling time savings. There was no substantive feedback on this potential impact on refueling time savings nor on the methodology for calculating it. One commenter did point to the updated guidance from DOT regarding the value of travel time savings used as an input.[478]
The commenter discussed the various categories of the value of time travel savings as well as the share of travel that is local versus inter-city. The December 2025 DOT BCA Guidance update does have categories for personal versus business travel time as well as local (urban) versus intercity (rural) travel, given that there is information on the mix of local versus long-distance
( printed page 62090)
intercity travel.[479]
The final rule has been updated to use parameters from the latest guidance.
Under the regulatory alternatives, new car and light truck models that achieve lower fuel economy would be driven slightly less than in the No-Action Alternative, as their higher fuel cost reduces the fuel economy rebound effect described in preamble Section II.E.3. Again, the final rule would continue to raise fuel economy standards but at a slower rate than under the No-Action Alternative. For example, while vehicle use would continue to increase under each regulatory alternative, it would increase more slowly than under the No-Action Alternative. Additional driving enables buyers of new cars and light trucks to travel more frequently or to reach more desirable destinations, but because vehicle use increases more slowly, these benefits are more modest under this reset of the CAFE standards.[480]
NHTSA received no substantive comments on the methodology of calculating the benefits from reallocated mileage.
In addition to the private costs and benefits described above, Table II-8 includes maintenance and repair cost savings as a line item without an associated dollar value; the agency projects the reset of CAFE standards to reduce technology requirements for meeting the new standards and thus to lower buyers' costs to repair and maintain new vehicles. However, the agency does not currently possess sufficiently robust data to quantify maintenance and repair costs in the analysis. NHTSA requested comments on whether the agency should include estimates of repair and maintenance costs—and that interested commenters provide data to support an informed analysis.
There was general support for the inclusion of repair and maintenance costs, as these may be major considerations for consumers in their purchase of a new vehicle.[481]
One commenter discussed maintenance and repair costs for low rolling resistance tires, stating that “lower rolling resistance tires would increase maintenance costs assuming they were replaced at the end of their lifespans.” [482]
The life of low rolling resistance tires can indeed be time limited even if the treads are not worn out; however, the same is also true for conventional tires. Historically, low rolling resistance came from using harder tread compounds and harder tires tend to wear longer than softer tires. With modern materials and compounding it is now possible to maintain this connection as well as to increase traction. For this final rule NHTSA did not make any changes to its consideration of maintenance and repair costs for low rolling resistance tires.
Several commenters noted that there may be a difference in cost for ICE vehicles versus BEVs, and ICCT cited a 2021 Argonne National Laboratory report that develops estimates of maintenance costs that vary for ICE vehicles, HEVs, PHEVs, and BEVs.[483]
Due to statutory constraints on considering the fuel economy of BEVs and the full fuel economy of PHEVs in determining maximum feasible CAFE standards, any change in maintenance and repair costs due to electrification would have a limited impact on NHTSA's analysis comparing alternatives. As the results would not affect the agency's decision given the statutory constraint on consideration of BEV fuel economy in determining maximum feasible CAFE standards, it is reasonable not to model these benefits or costs in this final rule.
Commenters also raised methodological concerns related to PRIA Appendix II. NHTSA included an alternative analysis of the benefits and costs of the proposed rule in Appendix II of the NPRM applying a revealed preference approach and sought comment on the analysis. A commenter stated that the methods were unjustified, the assumptions were faulty, and the data was outdated as well as improperly applied.[484]
NHTSA has not relied upon Appendix II as justification for this rulemaking. Based on the feedback of the methodology and use of outdated data in Appendix II, NHTSA is not including Appendix II in its analysis of this final action.
2. External Costs and Benefits
Higher fuel economy standards increase vehicle use via the rebound effect and contribute to increased traffic congestion and highway noise. These impacts affect other road users (and nearby residents) rather than the drivers generating additional mileage. Conversely, resetting previous CAFE standards will reduce fuel economy levels compared to the No-Action Alternative, and the resulting reduction in fuel efficiency will lead to fewer rebound miles being driven which will lower the external costs that congestion and noise impose on others. NHTSA estimates these impacts by updating per-mile congestion and noise costs from increased automobile and light truck use originally reported in FHWA's 1997 Highway Cost Allocation Study to account for changes in congestion levels, travelers' value of time, and inflation, an approach it also used for the 2020, 2022, and 2024 final rules. NHTSA received no comments related to its methodology for estimating noise and congestion costs.
Changes in new car and light truck buyers' costs for fuel represents changes in tax revenue received by Federal, State, and some local government agencies. Any variation in the fuel tax burden on drivers is offset by changes in tax revenues, so this transfer does not affect net benefits from changing CAFE standards. However, NHTSA estimates those offsetting changes in drivers' fuel tax payments and tax revenue received by government agencies to highlight this transfer and show its potential impact on government finances. The estimation of this transfer is supported by the DOTs of ID, MT, ND, SD and WY (ID, MT, ND, SD, and WY DOTs). Their comment points to the impact that changing fuel tax revenues have on the Highway Trust Fund and transportation investment.[485]
As indicated above, any increase in tax revenue received by governments that levy taxes on fuel is exactly offset by higher fuel tax payments by consumers, so from an economy-wide standpoint increases in gasoline tax revenues are simply a transfer of economic resources and have no effect on net benefits.
Fuel production, distribution, and use generate emissions of certain “criteria” or regulated pollutants, and the population's exposure to these pollutants causes adverse effects on public health. Raising or lowering CAFE
( printed page 62091)
standards affects these emissions by changing the volume of fuel produced and consumed, and NHTSA estimates these changes in emissions and their economic consequences for public health. The CAFE Model estimates monetized health effects associated with population exposure to fine particulate matter, which is emitted directly by refineries and vehicles and also formed in the atmosphere via physical and chemical reactions involving other regulated pollutants emitted by refining and using fuel.[486]
Chapter 5 of the Final TSD accompanying this final rule includes a detailed description of the Model's procedures for calculating emissions of these pollutants and assessing their consequences for public health.
Many commenters noted the increase in criteria pollutant emissions and the resulting monetized health costs from rule.[487]
NHTSA received comments on the NPRM regarding healthcare costs that are expected to be incurred, given the criteria pollutant health damages projected in the rule analysis.[488]
Some commenters specifically cited concerns over healthcare costs in their regions and provided these estimates, stating that NHTSA's health effects analysis was missing these healthcare-specific costs.[489]
NHTSA is maintaining the health damages estimates from the NPRM, partly because of the unavailability of updated estimates that correspond to the pollutant source categories needed for the CAFE analysis, and partly because the inclusion of healthcare payments in addition to the health damages already included in the analysis would constitute a double-counting of costs. The cost values per ton used in NHTSA's analysis already include healthcare costs.[490]
Southern Environmental Law Center (SELC) and Attorneys General noted that NHTSA only monetizes the health impacts of NOX, SOX, and PM2.5
and does not monetize the impacts of other pollutants, arguing that the impacts of these other pollutants are substantial and would change the final net benefit calculation.[491]
NHTSA only calculates the impacts from these three pollutants, because they are known to be emitted regularly from mobile sources, have the most adverse effects on human health, and have been the subject of extensive research to estimate the benefits of reducing these pollutants. Commenters did not provide peer-reviewed research for the monetization of CO, volatile organic compounds (VOCs), or air toxics. NHTSA received comments on the NPRM pointing to academic sources of monetized values of the health effects of CH4
through its contribution to ozone.[492]
NHTSA has included a sensitivity case in PRIA Chapter 9 using these estimates, adding them to the health damages portion of the cost-benefit analysis.
NHTSA did not include monetized estimates of changes in so-called GHG emissions in the central analysis supporting the proposal.[493]
NHTSA stated in the proposal that this was because there are significant uncertainties related to the monetization of GHGs that include, but are not limited to: the magnitude of the change in climate due to a change in GHG emissions; the relationship between changes in the climate and the economy and, therefore, the resulting economic impacts; future economic and population growth, which are important for estimating vulnerability, willingness to pay to avoid impacts, and the ability to adapt to future changes; future technological advancements that would reduce vulnerability and impacts; the share of impacts from GHG emissions that affect citizens and residents of the United States; and the appropriate discount rates to use when discounting in an intergenerational context. Monetizing these impacts could potentially result in flawed decision-making due to overreliance on highly uncertain values. NHTSA presented a sensitivity analysis using domestic-only (rather than global) estimates in the Draft RIA and concluded that these estimates, if considered in the central analysis, would not have changed its proposed amended standards.
Many commenters encouraged NHTSA to monetize GHG emissions in its central analysis rather than a sensitivity analysis,[494]
and to use a global value of the impact of GHG emissions (in particular, those published by the EPA in 2023).[495]
A subset of these commenters referenced
Center for Biological Diversity
v.
NHTSA,[496]
saying that an estimate of this impact must be included in the analysis.[497]
Others supported NHTSA's decisions to exclude these costs from the central analysis, enumerating the uncertainties involved in estimation of these costs and encouraging the calculation of net benefits to rely on non-subjective or speculative parameters.[498]
( printed page 62092)
NHTSA disagrees that
CBD
v.
NHTSA
requires the agency to include monetized estimates of the changes in GHG emissions in its central analysis. In the rule at issue in that case, the agency deliberately set standards at the point that maximized societal net benefits.[499]
The court acknowledged that the agency possessed the legal discretion to determine standards by maximizing societal net benefits—though not required to [500]
—but noted that if the agency were to use such a process, then the agency needed to account reasonably for the social cost of carbon given the agency stated it believed the value was above zero. The holding that the agency acted arbitrarily by not monetizing carbon emissions was conditioned on the agency's decision to determine the stringency of its standards by maximizing monetized net benefits, and the court rejected the agency's decision to exclude a factor the agency acknowledged would affect societal net benefits.
Since that rule and decision, NHTSA has departed from the stance that its estimate of societal net benefits should be deterministic; instead, NHTSA uses the analysis and ensuing estimates of net benefits as one of many inputs for the setting of maximum feasible standards in the context of the statutory balancing of factors specified in 49 U.S.C. 32902(f). As discussed in more detail in Section V, NHTSA is not setting standards based on maximizing net benefits and instead is focusing on resetting the CAFE standards to align more faithfully with the factors Congress directed the agency to balance. In addition, as noted in the proposal, there are significant uncertainties related to the monetization of GHG emissions. As such, for this final rule, NHTSA continues to follow Federal guidance and excludes monetized estimates of changes in GHG emissions in its central analysis.[501]
As with the NPRM, the agency includes with the final rule a sensitivity analysis that is discussed in more detail in FRIA Chapter 9. This sensitivity analysis ensures that excluding this value from the central analysis does not bias the cost-benefit analysis that informs the determination of maximum feasible standards. The sensitivity analysis demonstrates that including a monetized estimate for changes in GHG emissions in the central analysis would not have altered NHTSA's maximum feasible determination. This sensitivity analysis uses the same domestic value of the impacts of GHG emissions as used in the 2020 final rule, adjusted for inflation. This value also conforms with E.O. 14154 and Circular A-4 (2003), which direct agencies to consider domestic-only impacts. NHTSA's selection of final standards, considering the various sensitivity analyses presented in FRIA Chapter 9, is discussed in more detail in Section V.
Resetting CAFE standards may increase domestic consumption of gasoline compared to the regulatory baseline, producing a corresponding increase in the Nation's demand for crude petroleum. The U.S. accounts for a significant share of global oil consumption, so the resulting increase in global petroleum demand will exert some upward pressure on worldwide prices, but the financial consequences of higher prices are transfers. Unlike in decades past, when the U.S. was heavily dependent upon foreign petroleum and therefore was broadly exposed to price shocks attributable to supply disruption, the U.S. is now an established net exporter of petroleum. Accordingly, while domestic petroleum production does not insulate the U.S. from international disruptions in petroleum generation, any transfer from global consumers to petroleum producers becomes a financial benefit to the U.S. economy.
Higher U.S. petroleum consumption increases all domestic consumers' exposure to the risks of potential rapid increases in oil prices and interruptions in petroleum imports, though rising domestic production cushions the latter's effect. Individual petroleum users are unlikely to consider the effect of their own consumption on such economy-wide risks, so they may unwittingly impose costs on others that increase with domestic petroleum use. NHTSA includes this effect as a cost of the finalized standards, and Chapter 6.2.4.4 of the Final TSD explains how the agency estimates its magnitude.
Several commenters supported NHTSA's methodology for considering energy security risks, noting (as mentioned above) that the U.S. is now a net exporter of petroleum and arguing that the need to conserve energy against supply shocks has shifted over time as the U.S. has become more insulated due to its growing dominance in this market.[502]
Others commented in a general way on the need to insulate consumers from supply shocks and to reduce the impact of foreign power, arguing that changing CAFE standards expose consumers to these costs.[503]
As discussed above and in Final TSD Chapter 6.2.4.4, increased domestic petroleum consumption may impose an externality through its impact on the domestic economy as a result of petroleum supply shocks. Such a cost is measured and included in the final calculation of net benefits.
Raising or lowering petroleum imports has also been claimed to influence U.S. military spending, but most careful studies conclude that changes in petroleum use on the scale likely to result from changing CAFE standards are unlikely to affect military activity.[504]
Thus, as Chapter 6.2.4.3 of the Final TSD explains in detail, NHTSA does not consider the potential impact of changing CAFE standards on military spending. No substantive comments were received regarding the exclusion of military spending impacts.
NHTSA is also monitoring the availability of critical minerals used in electrified powertrains and whether any shortage of such materials could emerge as an additional energy security concern. Although nearly all electricity in the United States is generated through the conversion of domestic energy sources and thus its supply does not raise security concerns, EVs (as well as hybrids and plug-in hybrids) also require batteries to store and deliver that electricity. Currently, the most common EV battery chemistries include relatively scarce materials (compared to other automotive parts) which are sourced, in large part, from foreign adversaries or potentially insecure or unstable overseas sites. While all mined materials (including those in vehicles powered by ICEs) can pose environmental challenges during extraction and conversion to usable material, this is particularly true with minerals used in battery production. Known supplies of some of these critical minerals are also highly concentrated in a few countries and therefore face similar market power concerns to petroleum products.
NHTSA is restricted from considering the fuel economy of alternative fuel
( printed page 62093)
sources in determining CAFE standards, so the agency only considers the gasoline powered fleet in simulating compliance with fuel economy regulatory alternatives and determining their effects. Although the cost of critical minerals may affect the cost to supply both plug-in and non-plug-in hybrids that require larger batteries, this cost would apply primarily to manufacturers whose voluntary compliance strategy emphasizes hybridization. NHTSA does not include costs or benefits related to these emerging energy security considerations in its analysis for its final rule because, pursuant to its statutory authority to set CAFE standards, NHTSA cannot consider alternative fueled vehicles when setting standards. A few commenters encouraged NHTSA to consider security risks of critical mineral supply chains given supposed growth in electric and hybrid vehicles.[505]
As discussed above, NHTSA only considers the gas-powered fleet in determining CAFE standards, and as critical mineral costs would mostly impact voluntary compliance strategies by manufacturers, these costs would be unlikely to vary by alternative. Therefore, NHTSA does not include costs or benefits associated with critical mineral security in its analysis.
The analysis considers the direct labor effects that the finalized standards would have across the automotive sector. The effects include: (1) dealership labor related to new light-duty sales; (2) assembly labor for new vehicles, engines, and transmissions; and (3) labor for developing and producing technologies that improve fuel economy but exclude any broader implications of fuel economy standards for economy-wide employment. NHTSA has used this approach in several recent rulemakings but has not highlighted its results because of its limited scope and the uncertainty introduced by rapidly changing labor inputs for vehicle assembly and technology development. NHTSA sought comment on alternative approaches to the labor analysis that the agency could consider, including approaches that could supplement the agency's current approach or succeed it in future rulemakings. Multiple commenters focused on labor utilization from the manufacturing of fuel-economy-improving components.[506]
They argued that the proposed standards will result in substantial losses of jobs associated with making components and materials for fuel-efficiency-based technologies and will likely incentivize OEMs to move production of advanced technologies to parts of the world where regulatory standards are more stringent. Other commenters pointed out the importance of keeping U.S. jobs in automotive technology manufacturing for specific regions and cities where these economic effects are strongest (
e.g.,
Indiana's “Battery Belt,” the City of Cleveland).[507]
NHTSA is keeping the methodology used in the NPRM for the final rule analysis as well because none of the alternative approaches suggested by commenters fits the scope of the CAFE analysis. NHTSA especially cannot consider impacts on battery-producing areas given that the statute prohibits the agency from considering the fuel economy of dedicated automobiles.[508]
Regarding fuel-economy-improving component manufacturing, lower CAFE standards do not prevent manufacturers from producing more efficient vehicles domestically nor from selling those vehicles in the U.S. Manufacturers that have already invested capital to build so-called clean vehicles in the United States are not disincentivized from these investments as they can continue to sell these vehicles in the U.S. to consumers who demand them and to export these vehicles to meet demand in other countries. Chapter 6.2.5 of the Final TSD describes the current process NHTSA uses to estimate labor impacts in additional detail.
H. Simulating Safety Effects of Regulatory Alternatives
Fuel economy standards have the potential to lead manufacturers to alter the vehicles they produce in ways that may have unintended consequences for motor vehicle safety. The analysis accompanying the final rule includes a comprehensive measure of safety impacts from three sources:
Changes in Vehicle Mass.
NHTSA calculates the safety impact of changes in vehicle mass made to reduce fuel consumption to comply with the standards. Statistical analysis of historical crash data indicates that reducing mass in heavier vehicles generally improves safety for occupants in lighter vehicles and other road users such as pedestrians and cyclists, while reducing mass in lighter vehicles generally reduces safety.
Impacts of Vehicle Prices on Fleet Turnover.
Vehicles have become safer over time through a combination of new safety regulations and voluntary safety improvements. NHTSA expects this trend to continue as emerging technologies, such as advanced driver assistance systems, are incorporated into new vehicles. Safety improvements will continue regardless of changes in the standards; however, vehicle technologies added to comply with increased fuel economy standards increase vehicle prices, slowing the acquisition of newer, safer vehicles and retirement of older, less safe vehicles.
The standards also influence the composition of the new light-duty sales mix. As the safety of light trucks, SUVs, and passenger cars is affected by technologies that manufacturers employ to meet the standards differently—particularly mass reduction—fleets with different compositions of body styles have varying safety risks. Therefore, changing the share of each type of light-duty vehicle in the projected future fleet impacts safety outcomes.
Changes in Safety Associated With “Rebound Effect” Driving.
The “rebound effect” predicts consumers will drive more when the cost of driving declines. More stringent standards reduce vehicle operating costs, and in response, some consumers may choose to drive more. Additional driving increases exposure to risks associated with motor vehicle travel, and this added exposure translates into higher fatalities and injuries. Slowing vehicle turnover results in an older fleet on average. As a result, this slowing turnover exacerbates the safety costs of additional driving resulting from the “rebound effect.”
Resetting the CAFE standards will improve safety overall. Setting less stringent standards will accelerate fleet turnover, limit the amount of rebound driving, and reduce the need to adopt mass reduction technologies across the fleet.
The contributions of the three factors described above generate the differences in safety outcomes among regulatory alternatives. NHTSA's analysis makes extensive efforts to allocate the differences in safety outcomes between the three factors. Fatalities expected during future years under each alternative are projected by deriving a fleetwide fatality rate (fatalities per VMT) that incorporates the effects of differences in each of the three factors from the reference baseline and then multiplying it by that alternative's expected VMT. Fatalities are converted into a societal cost by multiplying
( printed page 62094)
estimated fatalities by the DOT-recommended value of a statistical life (VSL), supplemented by additional economic costs not considered in VSL measurements. Traffic injuries and property damage are also modeled directly using the same process and valued using costs specific to each injury severity level.
All three factors influence predicted fatalities, but only two of them—changes in vehicle mass and in the composition of the light-duty fleet in response to changes in vehicle prices—directly impose increased risks on drivers and passengers not compensated for by accompanying benefits. In contrast, increased driving associated with the rebound effect is a consumer choice that reveals the benefits of additional travel. Consumers who choose to drive more have decided that the utility of additional driving exceeds the additional costs for doing so, including the crash risk that they perceive additional driving involves. As discussed in Chapter 7 of the Final TSD, the benefits of rebound driving are accounted for by offsetting a portion of the added safety costs.
NHTSA's analysis considers the safety impact to both vehicle occupants and non-occupants, such as pedestrians and cyclists. The agency categorizes safety outcomes through three measures of light-duty vehicle safety: fatalities occurring in crashes, serious injuries, and the amount of property damage incurred in crashes with no injuries. Counts of fatalities among occupants of automobiles and non-occupants are obtained from NHTSA's Fatal Accident Reporting System for 1975-2022. Estimates of the number of serious injuries to drivers and passengers of light-duty vehicles are tabulated from NHTSA's General Estimates System (GES) for 1990-2015, and from its Crash Report Sampling System (CRSS) for 2017-2022. Both GES and CRSS include annual samples of motor vehicle crashes occurring throughout the United States. Weights for different types of crashes were used to expand the samples of each type to estimates of the total number of crashes occurring during each year. Finally, estimates of the number of automobiles involved in property damage-only crashes each year were also developed using CRSS.
NHTSA does not anticipate, and does not model, any changes in safety from the finalized changes in vehicle classification. A vehicle's safety performance is unrelated to its CAFE vehicle classification; instead, the safety risk is dependent on its physical attributes, the safety technologies incorporated, and how the vehicle is used.
1. Mass Reduction Impacts
Vehicle mass reduction can be one of the more cost-effective means of improving efficiency, particularly for makes and models built with less high-strength steel or aluminum closures or low-mass components. Manufacturers have stated that they will continue to reduce mass of some of their models to meet more stringent standards (such as those currently in place), and therefore, this expectation is incorporated into the modeling analysis supporting the final rule. Safety trade-offs associated with mass reduction have occurred in the past, particularly before standards were attribute-based, because manufacturers chose, in response to standards, to build smaller and lighter vehicles; these smaller, lighter vehicles did not fare as well in crashes as larger, heavier vehicles, on average. Although NHTSA now uses attribute-based standards, in part to reduce or eliminate the incentive to downsize vehicles to comply with the standards, NHTSA is mindful of the possibility of related safety trade-offs. For this reason, NHTSA accounts for how the application of mass reduction to meet standards affects the safety of a specific vehicle given changes in CW.
For the final rule, the agency employed the modeling technique developed in the 2016 Puckett and Kindelberger report to analyze the updated crash and exposure data by examining the cross sections of the societal fatality rate per billion VMT by mass and footprint, while controlling for driver age, sex, and other factors, in separate logistic regressions for five vehicle groups and nine crash types. NHTSA utilized the findings from the study about the relationships between weight and safety, expressed as a percentage increase in fatalities per 100-pound weight reduction (which is how mass reduction is applied in the technology analysis; see Section II.D.5), to examine the changes in mass in response to standards across the regulatory scenarios. The effects of mass reduction on safety were estimated relative to the regulatory baseline in the analysis, across all vehicles for MY 2024 and beyond. The analysis of mass reduction includes two opposing impacts.
Research shows that mass reduction affects “lighter” and “heavier” vehicles differently across crash types. The 2016 Puckett and Kindelberger report found mass reduction concentrated among the heaviest vehicles is likely to have a beneficial effect on overall societal fatalities, while mass reduction concentrated among the lightest vehicles is likely to have a detrimental effect on occupant fatalities but a slight benefit to pedestrians and cyclists. This represents a relationship between the dispersion of mass across vehicles in the fleet and societal fatalities: decreasing dispersion is associated with a decrease in fatalities. For collisions with large mass disparities, mass reduction in heavier vehicles would be more beneficial to the occupants of lighter vehicles than it would be harmful to the occupants of heavier vehicles. Mass reduction in lighter vehicles is more harmful to the occupants of lighter vehicles than it is beneficial to the occupants of heavier vehicles.
To capture the differing effect on lighter and heavier vehicles accurately, NHTSA splits vehicles into lighter and heavier vehicle classifications. However, this poses a challenge to identifying statistically meaningful results. There is limited relevant crash data to use for the analysis. Each partition of the data reduces the number of observations per-vehicle classification and crash type and thus reduces the statistical robustness of the results. The methodology employed by NHTSA was designed to balance these competing forces as a trade-off to capture the impact of mass-reduction across vehicle CWs and crash types while preserving the potential to identify robust estimates.
Commenters noted that the estimates of fatality rate impacts of changes in vehicle mass by safety class are not statistically significant at the 95-percent confidence level, and that mass changes should not be modeled as having any impact on safety.[509]
The mass-size-safety estimates are used as intermediate inputs in the CAFE Model. The body of engineering and research evidence suggests that there is indeed a mass-disparity safety effect. Using the best available data, NHTSA conducted a study to measure and bound this effect.
It is essential for NHTSA, as a safety agency, to consider potential safety impacts of its regulations using the best available estimates. As the agency believes that the point estimates still represent the best available data, NHTSA continues to include a measurement of mass-safety impacts in its analysis. In addition, because the resulting estimated net safety impact of mass changes in the Preferred Alternative is close to zero, assuming no
( printed page 62095)
safety impact from mass reduction would have little effect in the CAFE analysis.
Although the agency does not attempt to model safety impacts on a vehicle model-level basis, resetting the standards as finalized will lessen the need to adopt mass reduction technologies broadly across the fleet and will allow manufacturers to incorporate mass reduction more thoughtfully within its fleet. In addition, the agency's finalized vehicle reclassification could incentivize manufacturers to adopt mass reduction technologies to larger vehicles, which would provide other road users tangible safety benefits.
NHTSA received comments on the treatment of the vehicle mix in the analysis, including trade-offs and incentives with respect to dimensions and mass across vehicle models. One commenter stated that “larger, taller fronts increase risks for pedestrians and occupants of smaller vehicles” and that “a credible safety analysis should address how different standards affect vehicle mix and safety outcomes for all users.” [510]
Cleveland stated that the NPRM “fails to deliver on its stated goals” to improve safety outcomes, such as by incentivizing manufacturers to concentrate mass reduction among larger vehicles.[511]
CPAC Foundation Center for Regulatory Freedom (CPAC-CRF) stated that the NPRM “does not adequately examine the tradeoffs that arise when compliance is driven by vehicle downsizing and weight reduction” and that “safety outcomes cannot be assumed; they must be demonstrated through careful analysis that accounts for engineering constraints and real-world driving conditions.” [512]
Effects of different standards on the vehicle mix and associated societal safety outcomes are central components of the analysis. NHTSA applies extensive engineering and economics-based modeling to compare impacts of potential standards and compliance paths (
e.g.,
mass reduction technologies) associated with those standards. The choice of Preferred Alternative involves optimizing with respect to many trade-offs among factors influencing benefits and costs rather than optimizing mass reduction in isolation. The analysis identifies an approximately neutral net effect of vehicle mass on safety across the alternatives considered.
Commenters stated that applying mass reduction can be associated with societal safety improvements, whether for individual vehicles or applying mass reduction across the full fleet.[513]
NHTSA has acknowledged the potential for combinations of mass reduction to yield net societal safety benefits across its mass-size-safety analyses. For example, if mass reduction approached a proportional case, in which more absolute mass were reduced from larger vehicles, the estimated net safety impact could be a reduction in societal fatalities. Because the estimated coefficients for the lightest passenger cars and the heaviest LTVs are of opposite sign, the CAFE Model allows for mass reduction across safety classes to yield a net safety benefit if the concentration of mass reduction is sufficiently weighted towards heavier LTVs. This estimated relationship is consistent with a hypothesis that reducing dispersion in vehicle mass can reduce societal fatality risk.
ACC offered extensive feedback regarding vehicle design and its effect on safety outcomes. ACC commented that NHTSA should “more fully acknowledge the limitations of the [George Washington University (GWU)] study in Section 7.3” of the Final TSD and “provide additional analysis and statistical review of the improvements in vehicle design and associated safety benefits that have emerged since the study was completed.” [514]
ACC also stated that the GWU study “demonstrates that well-designed lightweighted vehicles may help improve occupant outcomes.” [515]
In a related comment CPAC-CRF acknowledged trade-offs between vehicle mass and crashworthiness, noting, “although advances in materials and design have improved safety performance over time, there are physical limits to how much mass can be reduced without affecting occupant protection.” [516]
CPAC-CRF continued, “the proposal assumes continued progress in reconciling these competing goals without sufficiently addressing the diminishing returns and structural tradeoffs involved.”
NHTSA agrees with ACC's assessment that “vehicle design and material science has evolved over the last 20 years since the [GWU] study was completed.” NHTSA maintains that the findings from the GWU study are valid in concert with the evolution of vehicle design and material science over the past 20 years, and that the crash data informing safety estimates associated with mass changes incorporate processes of improvement in design and materials that are consistent with the present.
NHTSA agrees with CPAC-CRF regarding decreasing returns to scale for the potential to mitigate safety risk from mass reduction through vehicle design and advanced materials. However, NHTSA disagrees with CPAC-CRF's assessment that NHTSA's analysis assumes continued progress in mitigating safety risk from mass reduction beyond what is observed in the data. The mass-size-safety estimates maintain a net safety decrement for reducing mass in the lightest vehicles (chiefly representing own-vehicle incremental risk) and a net safety improvement for reducing mass in the heaviest vehicles (chiefly representing risk reductions to other vehicles and persons) that is based on variability in vehicle mass for the crash records in the analysis.
ACC suggested that “NHTSA should deepen its analysis of existing older studies to better reflect the data about the role of vehicle design in safety outcomes associated with vehicle mass reduction,” [517]
and recommended further recent studies focusing on safety improvements and the potential to incorporate those improvements while decreasing vehicle mass for NHTSA to include in its literature review regarding vehicle mass and safety.[518]
ACC also discouraged NHTSA “from associating vehicle mass disparity and societal fatality risk . . . without further discussion and analysis on the impact of these factors.” [519]
ICCT agreed with ACC in a comment, recommending that NHTSA “report its findings from leading research, research from the literature, and automaker developments on how lightweighting designs that the auto industry is pursuing are positively impacting vehicle crash and crash avoidance properties.” [520]
Studies cited by ACC from Section 7.3 of the Draft and Final TSD include the National Academies of Sciences, Engineering, and Medicine's (NASEM) 2021 report, the analysis discussed in Nolan's presentation at the 2013
( printed page 62096)
NHTSA Mass-Size-Safety Workshop,[521]
NRC (2015), and Park
et al.
(2012). Recent studies suggested by the National Research Council (NRC) include Hollowell
et al.
(2023) and Gunti
et al.
(2017).[522]
NHTSA agrees with key points by Nolan (2013), including concerning the generally improving and narrowing safety trends across safety classes, the role of design improvements (notably, crash compatibility, side impact safety technology, and electronic stability control) in driving those trends, the potential for crash avoidance technologies to extend those trends, and the caveat that smaller and lighter vehicles may still face safety disadvantages regardless of vehicle design improvements. NHTSA likewise agrees with NASEM's position that new vehicle designs are part of an array of influences leading to potential changes in safety outcomes over time. Technological developments in vehicle safety are represented in the CAFE Model within the baseline, and changes in vehicle mass are accounted for relative to that baseline.
NHTSA agrees with key points by NRC (2015), including that mass disparity is a factor in fatality risk, albeit one subject to change as technologies and fleet composition overall evolve, and that the role of vehicle mass in societal safety should be evaluated in an effort to mitigate statistical biases that may be present in predominant modeling efforts. It is feasible to apply advanced materials science to mitigate at least some safety risk associated with mass reduction, per Park
et al.
(2012), through the use of plastics and polymers, especially for incremental technologies that would otherwise add net weight, such as advanced driver assistance systems.
NHTSA acknowledges the findings in Hollowell
et al.
(2023) and Gunti
et al.
(2017),[523]
which confirm that advanced designs can incorporate new technologies while optimizing vehicle mass. NHTSA notes, however, that the role of automated driving systems is outside the scope of the mass-size-safety analysis. Furthermore, though it is feasible to reduce vehicle mass while adding safety technology, such capability would be distributed across the fleet and hence part of the baseline, while the mass-size-safety component of the analysis would center on differential changes in mass across models under different fuel economy standards.
Both NHTSA's safety baseline and the mass-size-safety model already reflect the ability to mitigate some detrimental effects of mass reduction on safety outcomes, in that extant mass reduction incorporates the technologies discussed in the literature. Optimized designs may help improve occupant safety, and improvements in vehicle design and changes in mass disparity could lead to distinct observed societal safety outcomes. However, NHTSA maintains that the estimated relationships are the best available estimate for this analysis.
Despite the technological advancements noted by commenters, mass still plays a critical role in determining safety outcomes when crashes do occur and therefore needs to be accounted for in the analysis. As noted earlier, NHTSA believes that the mass-size safety approach developed in the 2016 Puckett and Kindelberger report represents the most accurate methodology to examine to approximate, all else being equal, the changes to safety when isolating changes in mass.
A more detailed description of the mass-safety analysis can be found in Chapter 7.3 of the Final TSD.
2. Sales/Scrappage Impacts
As described in Section II.E.2, resetting CAFE standards would have important safety consequences because of the resulting increase in fleet turnover. Less stringent standards allow manufacturers to sell more vehicles demanded by consumers at cheaper prices, which increases the rate at which newer vehicles, and their associated safety improvements, enter the on-road population. The sales response also influences the mix of vehicles on the road based on the relative net price increases caused by CAFE standards. Setting less stringent standards removes distortionary effects that push consumers into vehicles with less preferred body styles that may have different intrinsic safety risks. Similarly, as the price of new vehicles decreases, fleet turnover increases compared to the baseline, meaning newer, safer vehicles would replace older, less safe vehicles on the road. These effects would reduce the safety risk not only for the occupants of newer vehicles but also for other road users who benefit from newer vehicles equipped with advanced driving assistance systems.
Any effect of sales and scrappage on fleet composition will affect the distribution of both ages and model years present in the on-road light-duty fleet. Because each of these vintages carries with it inherent rates of fatal crashes, and newer vintages are generally safer than older ones, changing that distribution will change the safety performance of the fleet, affecting the total number of on-road fatalities under each regulatory alternative. Similarly, the DFS model captures the changes in the light-duty fleet's composition of cars and light trucks. As cars and trucks have different fatality rates, differences in fleet composition across the alternatives will affect fatalities.
NHTSA received various comments on the modeling of safety effects related to sales and scrappage in the CAFE Model. IPI speculated that NHTSA fails to “account for countervailing safety effects if lower prices increase VMT by young, male, riskier drivers.” [524]
IPI also argued that increasing the prices of new vehicles makes used vehicles less affordable for consumers and therefore improves safety. IPI speculated that lower used vehicle prices result in marginal consumers becoming drivers and that these drivers are disproportionately some of the riskiest drivers. However, IPI provided no evidence that such selective entry into driving or disparate changes in driving behavior occur in response to changes in used vehicle prices. In its argument, IPI disregarded the effect of higher used vehicle prices on the prevalence of older less safe vehicles in the fleet. Lower used vehicle prices also mean that more consumers can afford newer and safer used vehicles regardless of demographics. As explained elsewhere in the rule, NHTSA believes that the demand for driving is relatively inelastic, meaning that the final rule and the effects analyzed are focused, for the most part, on determining which vehicle will be driven rather than if the mile will be driven at all. Furthermore, IPI's claim contradicts another argument
( printed page 62097)
they make: that more stringent standards would have a minimal impact on new vehicle demand and thus minimal impact on the used vehicle fleet.[525]
At the highest level, NHTSA calculates the impact of the sales and scrappage effects by multiplying the VMT of a vehicle by the fatality risk of that vehicle. For the analysis, NHTSA uses the distribution of miles calculated in Chapter 4.3 of the Final TSD. The fatality risk measures the likelihood that a vehicle will be involved in a fatal accident per-mile driven. NHTSA calculates the fatality risk of a vehicle based on the vehicle's model year, age, and style, while controlling factors that are independent of the intrinsic nature of the vehicle, such as behavioral characteristics. Using this same approach, NHTSA designed separate models for fatalities, non-fatal injuries, and property damaged vehicles.
NHTSA received comments on the model used to estimate fatality risks for future fleets. ICCT commented on the use of a single fleetwide fatality rate in the safety analysis. ICCT argued that it would be more appropriate to model fatality rates based on vehicle class due to differences in vehicle safety characteristics.[526]
IPI stated that “NHTSA's model does not cleanly identify the impacts of vehicle age, model year, and time, leading to biased results.” [527]
NHTSA finds it unnecessary to disaggregate fatality rates by fleet because the CAFE compliance model does not substantially change the relative composition of vehicle body types in the on-road fleet between regulatory alternatives. As such a single fleetwide value for fatality rates is sufficient for NHTSA's analysis. While IPI listed a set of potential econometric concerns with the age-period-cohort fatality rate forecast, IPI did not explain how these potential econometric issues could materially affect the analysis. Without further details regarding the alleged error, the agency cannot evaluate the merit of the comment. For example, IPI failed to identify the direction or magnitude of the claimed bias. The agency also believes that the cohort methodology is designed to address IPI's concern that safety technologies are not applied uniformly in a singular model year. The fatality rate model is consistent with previous rulemaking and is still the best methodology to use in the analysis of CAFE standards.
The vehicle fatality risk described above captures the historical evolution of automotive safety. Given that modern technologies are proliferating faster than ever and offer greater safety benefits than traditional safety improvements through crash avoidance, NHTSA augmented the fatality risk projections with knowledge about forthcoming safety improvements. NHTSA applied estimates of the market uptake and improving effectiveness of crash avoidance technologies to estimate their effect on the fleetwide fatality rate, including incorporating both the direct effect of those technologies on the crash involvement rates of new vehicles equipped with them, as well as the “spillover” effect of those technologies on improving the safety of occupants of vehicles that are not equipped with these technologies.
NHTSA's approach to measuring these impacts derives effectiveness rates for these ADAS technologies from safety technology literature. NHTSA applies these effectiveness rates to specific crash target populations for which the crash avoidance technology is designed to mitigate, which are then adjusted to reflect the current pace of adoption of the technology, including any public commitment by manufacturers to install these technologies or recent regulatory actions. The product of these factors produces a fatality rate reduction percentage that is applied to the fatality rate trend model discussed above, which projects both vehicle and non-vehicle safety trends. The combined model produces a projection of impacts of changes in vehicle safety technology as well as behavioral and infrastructural trends. A much more detailed discussion of the methods and inputs used to make these projections of safety impacts from advanced technologies is provided in Chapter 7 of the Final TSD.
While ADAS features directly affect safety of the fleet over time, IPI asserted that “NHTSA fails to account for the negative externalities to safety associated with horsepower and other attributes.” [528]
IPI also asserted that NHTSA does not measure an unaccounted for “Peltzman Effect” between vehicle size and driving behavior attributable to a “positional goods treadmill.” IPI speculated that changes in fuel economy standards induce indirect second order effects on consumers' preferences for vehicle characteristics and driving behavior.
IPI's concerns regarding potential horsepower-related and other attribute-related safety impacts are not applicable to the CAFE analysis due to the performance-neutrality modeling assumption. Adjustments in vehicle HP are not modeled as a compliance strategy. IPI states elsewhere in its comment that they believe fuel economy can be improved without adversely affecting performance and even argue that improvements in fuel economy might improve vehicle performance.[529]
IPI's argument is largely based on industry press releases rather than applicable engineering studies. There is insufficient evidence to assert there is an omitted “other attribute” safety impact via fleet turnover, nor is there a pathway for such “other attributes” to affect fleet safety through the CAFE Model.
IPI's claim of an unaccounted for Peltzman Effect argues that the agency should assume that drivers are more careless when they drive larger vehicles because they feel safer.[530]
IPI presented no material evidence supporting their conjecture that changes in CAFE standards result in second order changes in consumers' overall preferences for automobiles, automobile attributes, or driving behavior. The sales module captures the effect of reducing prices of larger vehicles through reductions in regulatory costs, in its forecast of future fleets under different regulatory approaches.
3. Rebound Effect Impacts
The additional VMT demanded due to the rebound effect is accompanied by more exposure to risk. However, rebound miles are not imposed on consumers by regulation. Rather, they are a freely chosen activity resulting from reduced vehicle operational costs. As such, NHTSA has long believed that a large portion of the safety risks associated with additional driving are offset by the benefits drivers gain from added driving. The level of risk internalized by drivers is uncertain. This analysis assumes that drivers internalize 90 percent of this risk, which mostly offsets the societal impact of added fatalities from this voluntary consumer choice. However, by resetting the standards, NHTSA would expect fewer rebound miles and therefore fewer
( printed page 62098)
crashes, injuries, and fatalities. Additional discussion of internalized risk is contained in Chapter 7.5 of the Final TSD. NHTSA sought comment on this assumption. In particular, the agency asked commenters for any evidence that could be used to bolster a higher or lower estimate of how much consumers internalize the risk of driving an additional mile.
No commenters provided evidence to support either a higher or lower estimate for internalized risk of driving. Two commenters, NRDC
et al.
and Consumer Reports, opposed NHTSA's inclusion of the safety impacts of rebound driving in the analysis. NRDC
et al.
claimed that “it is unreasonable for NHTSA to consider individuals' driving choices, which the Agency cannot control or regulate, as a safety impact of the 2024 rule.” Consumer Reports commented that because behavioral responses to changes in fuel economy standards are “voluntary,” these responses are “not imposed by regulation” and that NHTSA should not measure the safety effects of rebound driving. Consumer Reports then claimed that “NHTSA and DOT do not apply rebound driving safety impacts to other policies that influence consumer finances; applying it selectively here to justify lower fuel economy standards.” [531]
Rebound driving results when improved fuel economy lowers the marginal cost of driving additional miles. The rebound effect is a long-standing finding from economic research on the effects of improving energy efficiency on consumer behavior. In the context of CAFE, rebound driving would not occur in the absence of regulatory action, and while the additional driving is a “voluntary” choice by drivers, it occurs in direct response to regulatory action. It is thus appropriate for NHTSA to measure the safety impacts of rebound driving resulting from changes in CAFE standards. Even if drivers internalize some of these safety costs, these costs are still affected by the change in standards and borne by members of society.
NRDC
et al.
stated that fatality rates, rather than total fatalities, are the proper metric for considering the safety effects of changes in fuel economy standards. In the SAFE II final rule, NHTSA responded to a similar comment by Environmental Defense Fund (EDF), noting that NHTSA must weigh the value of benefits from its regulatory actions against their costs. NHTSA stated, “the fundamental metric for valuing loss of life is VSL. To apply this metric, [NHTSA] must first produce estimates of any change in the numbers of fatalities that result from regulatory action. Fatalities prevented, as well as other safety impacts such as non-fatal injuries prevented and property damage crashes avoided, are appropriate measures of the consequences of rules that affect vehicle safety.” [532]
4. Value of Safety Impacts
Fatalities, non-fatal injuries, and property damage crashes are valued as a societal cost within the CAFE Model's cost and benefit accounting. Estimated fatality costs are based on the comprehensive value of a fatality, which includes lost quality of life and is quantified in the VSL, as well as economic costs related to medical and emergency care, insurance administrative costs, legal costs, and other economic impacts not captured in the VSL. These values were first derived from data in Blincoe
et al.
(2015), updated in Blincoe
et al.
(2023), adjusted to 2024 dollars, and updated to reflect DOT guidance on the VSL.[533]
Non-fatal injury costs, which differ by severity, were weighted according to the relative incidence of injuries across the Abbreviated Injury Scale. To determine this incidence, NHTSA applied a KABCO/Maximum AIS (MAIS) translator to CRSS KABCO based injury counts from 2017-2019. This produced the MAIS-based injury profile. This profile was used to weight non-fatal injury unit costs derived from Blincoe
et al.
(2023), adjusted to 2024 price and income levels and updated consistently with DOT guidance on the VSL. Property-damaged vehicle costs were also taken from Blincoe
et al.
(2023) and adjusted to 2024 dollars.
For the analysis, NHTSA assigns a societal value of $14.1 million for each fatality, $338,000 for each non-fatal injury, and $9,700 for each property damaged vehicle. As discussed in the previous section, NHTSA discounts 90 percent of the safety costs associated with the rebound effect. The remaining 10 percent of those safety costs are not considered to be internalized by drivers and appear as a cost of the standards that influence net benefits. Similarly, the effects on safety attributable to changes in mass and fleet turnover are not offset by additional benefits because manufacturers are responsible for deciding how to design and price vehicles. However, 90 percent of these costs are also treated as private costs because they are borne by owners of vehicles rather than society more broadly. The safety costs not internalized by drivers are equal to 10 percent of the sum of the mass-safety effects, fleet turnover effects, and rebound-related fatality and non-fatal injuries, plus the cost of any property damage.
III. Regulatory Alternatives Considered in This Final Rule
A. General Basis for Alternatives Considered
NHTSA considers regulatory alternatives in rulemaking analyses as a way of evaluating the comparative effects of different potential ways of accomplishing its desired goal, which in this case is to fulfill the statutory mandate to set maximum feasible CAFE standards. E.O. 12866 and E.O. 13563, as well as OMB Circular A-4, encourage agencies to evaluate regulatory alternatives in their rulemaking analyses.
In the proposed rule, NHTSA developed separate alternatives for two distinct periods of time (MYs 2022-2026 and MYs 2027-2031) and two distinct fleets (passenger cars (PC) and light trucks (LT)). Alternatives analysis begins with a “No-Action” Alternative, typically described as the “baseline.” [534]
The baseline is the state that would occur in the absence of any regulatory action by the agency. Accordingly, NHTSA developed 16 total alternatives in the proposed rule: a No-Action and three action alternatives for PCs for MYs 2022-2026; a No-Action and three action alternatives for LTs for MYs 2022-2026; a No-Action and three action alternatives for PCs for MYs 2027-2031; and a No-Action and three action alternatives for LTs for MYs 2027-2031.
In the NPRM, NHTSA proposed changes to its classification system starting in MY 2028. To accommodate this change, NHTSA proposed using a different set of target function coefficients that better captured the relationship between vehicle footprint and fuel consumption in each class
( printed page 62099)
under the modified classification system. NHTSA also proposed a methodology for transitioning standards in the regulatory alternatives from MYs 2026-2028 to account for this change in the classification system. NHTSA described the methodology for developing these alternatives in the proposal and sought comment on the levels of stringency for each time period.
Although there have been updates since the NPRM, the overall curve methodology for the final rule has remained consistent with the NPRM approach. The changes that have taken place were based on updates to the reclassification start year and comments received on the NPRM analysis. The changes include the following: first, changing the year that reclassification takes effect (from MY 2028 in the NPRM to MY 2030 for the final rule); second, updating the target function transition analysis used to account for reclassification; and third, providing consistent year-to-year stringency increases for the rulemaking period using MY 2027-2031 stringency increases to project back to the MY 2022 selected standard, instead of having separate rates for MYs 2022-2026 and MYs 2028-2031 connected by a bridge year (MY 2027), as in the NPRM. The differences in required fuel economy between the proposal and this final rule for Alternative 3 are summarized in Figure III-1 and Figure III-2 for both PCs and LTs, for example vehicles with footprint sizes of 50 and 70 square feet. Together, the changes from the proposal to this final rule have a material impact on required fuel economy for some vehicles, like full-sized pickup trucks. These changes were made in response to comments as described in this section and are meant to smooth the overall rate of increase over time for both classes of vehicles during the transition between vehicle classification systems.
( printed page 62100)
AmFree and
the Illinois, Missouri, and National Corn Growers Associations (AmFree and Corn Growers Associations) and PMI commented that NHTSA should set the stringency increase to zero percent.[537]
AmFree and Corn Growers Associations commented that while NHTSA's proposed stringency increases of 0.5 and 0.25 percent are an improvement upon the previous standards, they are based on flawed theories regarding consumer behavior. They also commented that the logic of the agency's safety analysis supports a zero percent increase in stringency, which will maximize economic practicability in addition to maximizing safety. PMI commented that NHTSA failing to consider the most natural result of its energy security, affordability, and technological feasibility findings—zero percent increase in stringency—is arbitrary. They commented that NHTSA's analyses concluded that fuel-efficient technologies are expensive, vehicle affordability is low, and American energy security is high, which demand standards that flatline or decrease.
MEMA commented, “from a supplier perspective, the differences among the proposed alternatives are not merely differences in aggregate fuel economy outcomes, but differences in technology deployment signals, investment recoverability, and supply chain continuity.” [538]
MEMA stated that “the usability of credits under each alternative, including whether credits remain available, transferable, or durable over the investment cycle for technologies that suppliers are expected to develop and scale” [539]
is also an important factor. MEMA also commented that “alternatives that reduce uncertainty around deployment volumes, preserve credit usability, and maintain a stable and predictable compliance trajectory” [540]
are more feasible for suppliers than “alternatives that achieve similar nominal stringency through sharper curve inflections, credit removals, or late-cycle compliance compression.” [541]
While MEMA expressed support for year-over-year increases in the stringency of the standards for MYs 2022-2031, it did not support the No-Action Alternative, Alternative 1, or Alternative 2 as proposed in the NPRM. MEMA did not support Alternative 1 because its “reduced stringency would slow demand for fuel-savings technologies that are already in the advanced stages of development.” [542]
MEMA expressed concern with the stringency levels of the No-Action Alternative, specifically highlighting its concerns with the level of infrastructure deployment required to support the transition to AFVs. MEMA commented that Alternative 2 would “weaken the market signal needed to sustain supplier investment in efficiency technologies.” [543]
MEMA expressed support for Alternative 3, stating that Alternative 3 would “better preserve continuity with prior planning assumptions[,] . . . provide a clearer demand signal for suppliers across powertrain systems[, and] . . . align more closely with current investment cycles.” [544]
MEMA also encouraged
( printed page 62101)
NHTSA to consider developing a modified version of Alternative 3 that “maintains the overall stringency trajectory while incorporating targeted flexibility mechanisms.” [545]
MEMA stated its belief that such an alternative could “achieve a better balance between economic practicality and continued progress.” [546]
NRDC and the UCS commented that the alternatives that NHTSA considered in its proposal are all very similar and do not constitute a reasonable range of alternatives.[547]
Similarly, NRDC commented that NHTSA did not provide reasonable explanation for its change from the No-Action Alternative and failed to explain its reasoning for rejecting the most stringent alternative it did consider.[548]
CPAC-CRF commented “NEPA also requires agencies to rigorously explore and objectively evaluate reasonable alternatives. The Draft SEIS does not adequately examine alternative regulatory approaches that could achieve efficiency gains with fewer environmental and security tradeoffs, such as more gradual standard increases, technology-neutral pathways, or policies that better align with infrastructure readiness. The absence of a meaningful alternatives analysis limits the usefulness of the environmental review.” [549]
NRDC also provided a similar comment that NHTSA, as part of the NEPA process, must provide a reasonable range of alternatives.[550]
Two individuals provided comments that generally opposed the proposed actions.[551]
Regarding AmFree and the Corn Growers Associations and PMI's suggestions about a zero percent stringency increase, NHTSA is significantly resetting standards starting with MY 2022 because that is the earliest year that the agency has not administratively closed out, and which allows for proposer assessment of ICE only vehicles. To do this, NHTSA examined the degree to which manufacturers' gas-powered vehicles were able to comply with standards. For setting standards in MYs 2023-2031, NHTSA considered a wide range of rates of increase so that its analysis could consider the exact costs to which these commenters referred. NHTSA included alternatives that provide significant cost savings relative to prior standards. NHTSA also quantified the beneficial effects of lowering the price of new vehicles for the overall safety of the on-road fleet. Ultimately, after balancing four key factors: technological feasibility, economic practicability, the need of the United States to conserve energy, and the effect of other Federal regulations on fuel economy, NHTSA determined that the Preferred Alternative is the maximum feasible level that vehicle manufacturers can achieve in each model year.[552]
This is discussed more detail in Section V.
NHTSA appreciates MEMA's assessment of the alternatives presented in the proposal. As discussed in additional detail in Section V, NHTSA agrees with MEMA's assessment about the Alternative 3 standards.
In response to comments about the range of alternatives considered, for this final rule, NHTSA added two action alternatives to its analysis for each period of standard-setting years for both the passenger and non-passenger fleets. These new alternatives—referred to as Alternatives 4 and 5—fall between Alternative 3 and the No-Action Alternative. These Alternatives have stringency levels that are high enough above Alternative 3 to produce different effects and societal costs and benefits. With these additional alternatives, and the No-Action Alternative, NHTSA's analysis for this final rule provides detailed coverage of a wide range of potential stringency options.
In sum, as with the NPRM, NHTSA analyzes separate alternatives for two distinct time periods (MYs 2022-2026 and MYs 2027-2031) and two distinct fleets (passenger and non-passenger automobiles) in this final rule. The final rule also continues using the No-Action Alternative as the baseline. In response to comments received and in further consideration of the issues, NHTSA revised certain aspects of the alternatives considered in this final rule. As explained above, the final rule analyzes two additional alternatives for each period of standard-setting years for both the passenger and non-passenger fleets. NHTSA is also finalizing changes to the mathematical functions, or curves, that define the standards, based on comments and based on changing the effective year for the vehicle reclassification change from MY 2028 to MY 2030. The details of comments and responses regarding vehicle reclassification and the final decision are discussed in Section VI. The details of all the alternatives, in addition to comments and responses, are discussed below. NHTSA's decision to finalize Alternative 3 as the Preferred Alternative is discussed in more detail in Section V.
The finalized standards may, in places, be referred to as the “Preferred Alternative(s),” but NHTSA intends “final standards,” “finalized standards,” and “Preferred Alternative(s)” to be used interchangeably for purposes of this document. The Preferred Alternative(s) represent the maximum feasible fuel economy standards for each model year under consideration when viewed in context of the finalized structural changes (
i.e.,
reclassification, elimination of FCIVs, and elimination of credit trading) and in light of statutory constraints (
i.e.,
not considering dedicated vehicles, non-petroleum performance of dual-fueled vehicles, or the availability of regulatory credits).
Each action alternative sets fuel economy stringency levels for each model year that can be defined in terms of percentage changes in stringency from one model year to the next—with the exception of the transition between MY 2029 and MY 2030 standards, discussed in more detail below—which may be different for PCs and LTs.[553]
Although the stringency levels can be defined in terms of percentage changes in stringency from one model year to the next for ease of understanding, pursuant to the statute, they are actually defined as coefficients that define the following mathematical functions that relate fuel economy to footprint levels.
For PCs, NHTSA is defining final fuel economy targets as shown in Equation III-1.
( printed page 62102)
Where:
TARGETFE
is the fuel economy target (in mpg) applicable to a specific vehicle model type with a unique footprint combination, and
a is a maximum fuel economy target (in mpg),
b is a minimum fuel economy target (in mpg),
c is the slope (in gallons per mile per square foot, or gpm per square foot), of a line relating fuel consumption (the inverse of fuel economy) to footprint, and
d is an intercept (in gpm) of the same line.
Here, MIN and MAX are functions that take the minimum and maximum values, respectively, of the set of included values. For example, MIN[40, 35] = 35 and MAX(40, 25) = 40, such that MIN[MAX(40, 25), 35] = 35.
The resulting functional form is depicted in graphs displaying the PC target function in each model year for each regulatory alternative in Sections III.B.1 and III.B.3 below.
For LTs, NHTSA is defining fuel economy targets as shown in Equation III-2.
TARGETFE
is the fuel economy target (in mpg) applicable to a specific vehicle model type with a unique footprint combination, and
a, b, c, and d are as for PCs, but taking values specific to LTs.
For this final rule, NHTSA applies individual rates of change to the PC and the LT fleet standards in different model years in some of the action alternatives. NHTSA has discretion to set CAFE standards that increase at different rates for PCs and LTs because NHTSA, by law, must set maximum feasible CAFE standards separately for PCs and LTs.
1. MYs 2022-2026
NHTSA's analysis resets the passenger and non-passenger automobile fuel economy target functions in MY 2022 and increases them through MY 2026 at levels consistent with the available data for that timeframe and the context for those years, as discussed in more detail in Section V. Unlike past rules that set CAFE standards, in which the last model year for which standards are currently set serves as the base year for describing the regulatory alternatives considered in terms of annual percentage increases in standards, NHTSA analyzed reset standards using MY 2022 as the base year, consistent with the Secretary's memorandum titled “Fixing the CAFE Program” (Jan. 28, 2025).[554]
NHTSA considered several potential approaches for analyzing regulatory alternatives for that model year within a reasonable range of feasible average fuel economy standards.
For the proposal, the agency relied in large part on the observed capabilities of the gasoline- and diesel-powered vehicle fleets over the model years covered by the standards. Although NHTSA always examines manufacturer capabilities (also referred to as “achieved” fuel economy values for each manufacturer's fleet in each model year) relative to the standards under consideration as part of its evaluation of maximum feasible standards, this analysis is unique in that the data-based projections that NHTSA would generally rely on to estimate manufacturer behavior are not necessary because NHTSA can rely on observed data for MYs 2022-2026. That said, as discussed in Section V, NHTSA believes the appropriate qualitative context exists for giving meaning to the section 32902(f) factors related to manufacturer compliance for model years that have already passed or are currently underway.
NHTSA defined a potential standards range using the mean fit curve and the mean fit curve minus one standard deviation,[555]
and then selected three levels of standards that the agency believed represented reasonable low-, medium-, and high-level resetting functions for the MY 2022 PC and LT fleets, respectively. NHTSA then applied a 0.5 percent year-to-year rate of growth for the stringency of the standards for MYs 2023-2026. These three functions represented different ways that NHTSA could consider the available data for MY 2022, accounting for the removal of subsection 32902(h) technologies and compliance credits, and consistent with the agency's balancing of the four factors as described in more detail in Section V.
The lowest level function for MY 2022 that NHTSA considered represented standards that weighed economic practicability most heavily. The lowest level function did this by recognizing that the prior standards for MY 2022 were infeasible for the gasoline- and diesel-powered vehicle fleets (from the perspective of manufacturers reasonably being able to apply technology during the rulemaking timeframe). This function also recognized that prior standards were infeasible based on the fleet-average performance having been below the fleet-average standards for several years. A less stringent standard, in compliance with the statute, represents an opportunity for vehicle manufacturers to meet a standard that influences their obligations to improve fleet fuel economy without distorting typical design cycles or technology application
( printed page 62103)
in a manner inconsistent with NHTSA's statutory authority.[556]
Under these standards, about 80 percent of PCs and LTs would have met or exceeded their target function values for MY 2022.
At the time of the proposal, Alternative 3 was the high-level function considered for MY 2022. That alternative represented a balancing that weighed economic practicability but recognized that some manufacturers had been able to apply technology that improved the fuel economy levels of their gasoline- and diesel-powered fleets at a cadence that, if applicable to the rest of the fleet had the model year not already passed, would have pushed the fleet to higher average fuel economy levels. NHTSA tentatively concluded in the proposal that the fact that a number of manufacturers' gasoline- and diesel-based fleets could not comply with that standard is evidence that the baseline standard is beyond maximum feasible for the gasoline- and diesel-powered passenger and non-passenger automobile fleets for MY 2022. Under these standards, about 30 percent of PCs and 50 percent of LTs, by sales volume, failed to meet their target function values for MY 2022.
In the proposal, NHTSA presented Alternative 2, which utilized mid-level target functions for MY 2022, as its Preferred Alternative because the agency tentatively concluded it represented the maximum feasible average fuel economy. The agency explained that this alternative provided an appropriate, reformed starting point for future stringency increases by properly balancing the statutory maximum feasibility factors and excluding prohibited elements—namely, the consideration of EVs and compliance credits—to reflect the actual, measured performance of the gasoline- and diesel-based fleet. Under this proposed alternative, approximately 75 percent of PCs and 70 percent of LTs by sales volume would have successfully met or exceeded the requirements.
NHTSA also examined for the proposal real-world data to evaluate the capacity of gasoline- and diesel-powered fleets to achieve consistent efficiency improvements, excluding prohibited elements like alternative-fueled vehicles from the analysis. The agency observed that, while technologies to improve internal combustion engine efficiency exist, much of that technology has already been applied extensively over the past 15 years in response to increasing the stringency of standards. Data from the EPA's Automotive Trends Reports and input from Auto Innovators, demonstrated that average fuel consumption for non-electric vehicles generally improved by roughly one to two percent annually between MYs 2010 and 2022, but these improvements slowed to an average of just 0.7 percent for MYs 2020-2023, and remained relatively flat into MY 2024. The agency highlighted in the NPRM that the market had already seen a sharp decrease in basic naturally aspirated engines—dropping from 37.9 percent of the fleet in MY 2022 to just 22.0 percent by MY 2024—while advanced, costly technologies like turbochargers and mild and strong hybrids correspondingly increased.
Based on this data NHTSA tentatively concluded that expecting manufacturers to apply advanced technologies continually across all vehicle types to meet aggressive standards using only gasoline- and diesel-based powertrain improvements would not be maximum feasible and would be unreasonable. Ultimately, in the proposal the agency determined that adopting the proposed rates of annual increase would better reflect these physical capabilities and allow fuel-saving technology to propagate across the fleet in a cost-effective manner.
As discussed above, NHTSA reevaluated its alternatives for this final rule and added two new alternatives, Alternatives 4 and 5, in response to additional analysis and comments. In MYs 2022-2026, Alternatives 1 and 2 increase at a rate close to 0.5 percent per year from each alternative's MY 2022 starting point. Alternative 3 increases at a rate of 0.9 percent per year for PCs and 0.51 percent for LTs. Alternative 4 increases at a rate of 1.32 percent per year for PCs and 1.5 percent for LTs. The highest action alternative, Alternative 5, increases at a rate of 2.81 percent per year for PCs and 3.03 percent for LTs.
NHTSA's determination to apply vehicle reclassification, starting in MY 2030 rather than MY 2028, required corresponding changes to the NPRM's alternatives. The final rule's revised Alternatives 1, 2, and 3 are generally consistent with the stringency of those proposed in the NPRM but also are compatible with maintaining the existing vehicle classification criteria for MYs 2028 and 2029 in the final rule. NHTSA applied a uniform rate of increase in the stringency of standards for MYs 2022-2029 to mirror changes in the overall stringency of the fleets used in the proposal over this time period. Because this time period includes MYs 2027-2029, the growth rates that are used in this final rule differ from those used for MYs 2022-2026 in the NPRM.[557]
Alternatives 4 and 5 were added to the analysis for this final rule. NHTSA analyzed CAFE Model simulations over a range of stringencies falling between Alternative 3 and the No-Action Alternative to determine ranges over which technology adoption substantially changed in each fleet in the later years in its analysis. NHTSA determined the stringencies for these simulations by evaluating different uniform growth rates from MYs 2022-2029. Alternatives 4 and 5 represent two levels of stringency that produced distinct solutions across a variety of manufacturers in each class, and thus significant variation in achieved compliance, and the costs and benefits to society. As a result, NHTSA chose to use these rates of increase for MYs 2022-2026 as additional alternatives which it evaluated in this final rule.
Accordingly, NHTSA has considered a range of stringency options that allowed the agency to analyze and select an alternative within that range. The range of alternatives represents different ways that the agency could balance the section 32902(f) factors for MYs 2022-2026. In addition, this final range of alternatives is responsive to comments about the range and space between alternatives.
2. MYs 2027-2031
Consistent with NHTSA's approach for MYs 2022-2026, the agency endeavored to reset future model years' standards at levels that reflect the technological and economic capabilities of the gasoline- and diesel-powered vehicle fleets, but also in a manner that reflects how finalized compliance provisions (discussed in more detail in Section VI) would impact manufacturers' ability to comply. NHTSA performed an analysis, similar to its analysis of feasible per-year rates of stringency increase for gasoline- or diesel-powered vehicle improvements for MYs 2022-2026 discussed above to establish a range of regulatory alternatives that encompassed the ways the agency believes manufacturers could improve their fleet fuel economies year-over-year.
For the proposal, the agency began by using MY 2024 market data as a starting point for characterizing the technology and compliance levels of the vehicle
( printed page 62104)
fleet, and then relied on the CAFE Model to simulate the fleet's expected evolution under the current regulatory fleet classifications in future years in the No-Action Alternative and using the proposed alternative classification regulations starting in MY 2028 in the action alternatives. In the proposal, NHTSA designed the standards through MY 2028 by projecting an average required fuel economy level using a particular growth rate (or as in the case of Alternative 2, pair of growth rates). For MYs 2028-2031, NHTSA then assumed that the stringency of standards would grow at a constant rate.
In the proposal NHTSA developed alternatives to produce class average target function values that reflected different rates of growth from MYs 2022-2028, with MY 2027 acting as a “bridge” year between MY 2026 and MY 2028, when NHTSA proposed to modify vehicle classification. NHTSA accounted for changes in the cutpoints, slope, and intercept in MY 2028, after the proposed updated classifications by rescaling coefficients such that their average level was equal to the level it would have been for MY 2028 without a change in classification. Because of changes in the slope of the standards after reclassification, this approach produced significant increases in required fuel economy levels for some vehicles even when they remained in the same class.
NHTSA described in the proposal that the projected levels of fuel economy under each of the three regulatory alternatives for MYs 2027-2031 continually push manufacturers to improve real-world fuel economy, and even the least stringent option would exceed fuel efficiency merely driven by market demand.[558]
NHTSA treated market demand for fuel-economy improvements as a floor for determining action alternatives by rescaling its estimates such that they produced standards achievable for manufacturers when only market demanded technology was applied. Any standard less stringent than this floor would not be projected to change manufacturers' technology adoption decisions from those they would make in the absence of standards. In accordance with the purpose of the statutory scheme to increase fleet fuel economy of gasoline- and diesel-powered vehicles, NHTSA chose alternatives for the proposal above this floor.
NHTSA also recognized in the proposal that the process for creating regulatory alternatives for this set of standards was different in some ways from how the agency had created regulatory alternatives in past rules; however, the process used was necessary to bring the CAFE program into compliance with the law and to implement a significant reclassification of the PC and LT fleets to reflect better the intent of the CAFE program established by Congress. Previously, NHTSA evaluated regulatory alternatives based on varying levels of stringency increases from the last year of the previously established standards. Since NHTSA considered the fuel efficiency of EVs in establishing those previous standards, in contravention of the law, a stringency increase from the last year of those standards is on its face higher than the maximum feasible standards NHTSA could establish if only considering gasoline- and diesel-fueled vehicles. NHTSA also discussed that the agency was setting standards lower in MY 2022 than MY 2021, in part, because actual compliance data clearly demonstrated that manufacturers were unable to achieve the MY 2022 standards with their gasoline- and diesel-powered vehicle fleets.
In the proposal, for MYs 2027-2031, NHTSA designed standards using the proposed MY 2026 standards as a starting point for each alternative. In the proposal, NHTSA increased the stringency of Alternative 1, its lowest stringency alternative, at a rate of 0.1 percent for PCs and 0.8 percent for LTs in MY 2027. In MY 2028, when the classification system changed, NHTSA adjusted its coefficients and set standards such that the average required fuel economy in the PC fleet increased by 0.3 percent for PCs and 0.6 percent for LTs from MY 2027 averages. For MYs 2029-2031, the Alternative 1 standards increased at a rate of 0.25 percent per year. In Alternative 2, the proposed standards, NHTSA increased stringency at a rate of 0.35 percent for PCs and 0.7 percent for LTs in MY 2027. For MYs 2027-2028, the standards were set such that the average fleetwide required value for each class increased at a rate of 0.25 percent. For MYs 2029-2031, the Alternative 2 standards increased in stringency at a rate of 0.25 percent per year. Finally in Alternative 3, the most stringent alternative in the proposal, the standards increased at a rate of 1.4 percent for PCs and 0.4 percent for LTs in MY 2027. In MY 2028, the standards were set such that the average required fuel economy increased by 1.5 percent for PCs and 0.2 percent for LTs. For MYs 2029-2031, standards increased at a rate of 1 percent per year for both classes. NHTSA sought comment on the range of alternatives presented, in addition to any other alternatives that the agency should consider.
In addition to the general comments on the alternatives, discussed above, NHTSA also received comments regarding how the form of the standards accounted for the vehicle reclassification proposal. The Alliance noted that, for vehicles remaining in the LT fleet, stringency increased substantially in the proposal from MYs 2028-2029.[559]
The Alliance urged NHTSA to reconsider its methodology for the transition between these years. Ford commented that it supported Alternative 2 for MYs 2022-2031 as proposed in the NPRM. However, Ford expressed concern regarding the sharp increase between the MY 2027 and MY 2028 average fuel economy standards for LTs; specifically for vehicles with larger footprints. Ford urged NHTSA to re-examine its methodology for MYs 2027 and 2028 and adjust the stringency between those two model years to be consistent with other year-over-year changes in the NPRM. Stellantis expressed support for the overall direction of the proposed Preferred Alternative but recommended a delay in implementation of reclassification to MY 2030.
In response to the Alliance and Ford's concerns about the increase in stringency for LTs between MY 2027 and MY 2028, and Stellantis's concerns about the year of reclassification, NHTSA reconsidered its approach to transitioning standards to account for vehicle reclassification. First, NHTSA has determined that the update to classification will be applied beginning with MY 2030 rather than MY 2028. The agency recognizes that reclassification represents a dramatic change to the CAFE program, and, given product design and market planning lead times, a MY 2028 transition as MY 2027 approaches does not allow manufacturers a significant opportunity to reconsider their compliance strategies. This decision provides an additional two years for manufacturers to plan and make any necessary changes to their production plans. Second, NHTSA changed the rate of stringency increase for the MYs 2022-2029 to a single consistent value in each alternative. This makes the path to the MY 2030 standards and reclassification
( printed page 62105)
smoother overall. Third, NHTSA changed its methodology for shifting from footprint curves designed for the years before reclassification to curves designed for the updated vehicle classification.
For this final rule, NHTSA developed standards for each alternative reflecting different rates of growth from MYs 2022-2029, and MYs 2029-2031, with MY 2030 adjusted so that one of its constraints (low-footprint constraint for PCs and high-footprint constraint for LTs) was unchanged after adjusting the standards to account for different footprint cutpoints, and estimates of the footprint curve slope and intercept obtained using the updated classification. NHTSA's updated approach minimizes changes to the standards introduced as a result of reclassification at regions of the footprint curve where classification had less effect on the fleet. Changes to the functions governing the standards are appropriate because the achievable level of fuel efficiency at a given footprint level has changed as a result of changes to the composition of vehicles in a regulatory class at that footprint level. NHTSA's methodology in the proposal limited the effect of reclassification at the production-weighted average footprint in each fleet (around 48 and 61 sq. ft. for PCs and LTs respectively). Vehicles that changed regulatory classes are heavily concentrated at footprint levels of approximately 50 sq. ft. This means that the fleet of PCs up to 46 sq. ft. and the fleet of LTs larger than 74 sq. ft. are relatively unchanged, making these cutpoints more suitable locations for the finalized curves to be unaffected by reclassification. This change ensures that vehicles that are not reclassified will be required to meet standards that rise at a steady rate over time without the unintended and unreasonably sharp stringency increase identified by Ford.
NHTSA's updated approach is shown for Alternative 3 for both regulatory classes in Figure III-10 and Figure III-11. The dashed line represents a one percent increase in stringency from MY 2029 to MY 2030, while maintaining the same curve shape and cutpoints as the MY 2029 standards. The solid gray line adjusts these standards to maintain the same sales-weighted average standard value for each class but using the updated curve shape parameters and cutpoints, which is the methodology used in the NPRM. The solid black line shows NHTSA's approach for this final rule, which uses the updated curve shape parameters and cutpoints, and maintains upper or lower constraint value that would have existed without reclassification.
( printed page 62106)
NHTSA performed additional analysis to define the target functions for the years where the fleet transitions regulatory classification definitions. Because NHTSA is using a different set of initial footprint curve parameters (
i.e.,
slope, intercept, and cutpoints) for each fleet starting in MY 2030, the change in stringency from MYs 2029-2030 cannot be defined using multiplication by a common factor. Instead, NHTSA first applied a year-over-year stringency adjustment to each finalized alternative for each regulatory class “m” in MY 2029 to generate initial target function parameters for MY 2030. NHTSA then determined the required level of fuel economy for these initial target functions at the upper and lower constraints (coefficients “a” and “b” respectively).
Equation III-3: Scaling Equations for Initial MY 2030 Target Function Parameters
Here “Δ2030
” equals the percentage year-to-year change in stringency from MYs 2029-2030 in a given alternative. Here “am2030,0
” and “bm2028,0
” denote the initial upper and lower constraint values for class
m
in MY 2030. For PCs, NHTSA rescaled its coefficient estimates for the updated PC fleet to be consistent with its initial value for coefficient a, and the cutpoint footprint levels it determined were appropriate for the updated PC fleet. Similarly for LTs, NHTSA then rescaled its coefficient estimates for the updated LT fleet to be consistent with this initial value for coefficient b, and the cutpoint footprint levels it determined were appropriate for the updated LT fleet. These calculations are shown in Equation III-4 and Equation III-5.
Equation III-4: Determination of Final MY 2030 Coefficient Values for Passenger Cars
Equation III-5: Determination of Final MY 2030 Coefficient Values for Light Truck
Here “
am2030,A
”denotes the value of the upper constraint obtained using the updated coefficient estimates and footprint cutpoints for class
m
without any rescaling. “
bm2030,A
”likewise denotes the value of the lower constraint obtained using the updated coefficient estimates and footprint cutpoints for class
m
without any rescaling. “
cm2030,A
” and “
dm2030,A
”denote the updated estimates of slope and intercept for the mathematical functions.
Accordingly, for the final rule, the standards are defined as follows:
For Alternative 1, NHTSA assessed the standards for 2027-2029 by increasing stringency at a rate of 0.44 percent per year for PCs, and 0.54 percent per year for LTs. These rates of
( printed page 62107)
increase were also used to consider the 2030 standards using the methodology described in Equation III-3 and Equation III-4. The regulatory class average standard value for PCs decreases by 1.1 percent from MY 2029 to MY 2030, while the average decreases by 15.1 percent for LTs. The standards for both classes increase in MY 2031 by 0.25 percent.
In Alternative 2 NHTSA assessed the standards for MYs 2027-2029 by increasing stringency at a rate of 0.47 percent per year for PCs, and 0.46 percent per year for LTs. While the rate of increase for LTs is slightly lower than in Alternative 1, since Alternative 2 starts from a higher initial level in MY 2022, the standards for LTs in MY 2027 are higher in Alternative 2. These rates of increase were also used to consider the 2030 standards using the methodology described in Equation III-3 and Equation III-4. The regulatory class average standard value for PCs decreases by 1.3 percent from MY 2029 to MY 2030, while the average decreases by 15.1 percent for LTs. The standards for both classes increase by 0.25 percent in MY 2031.
For Alternative 3, NHTSA assessed the standards for MYs 2027-2029 by increasing stringency at a rate of 0.9 percent per year for PCs, and 0.51 percent per year for LTs. These rates of increase were also used to consider the MY 2030 standards using the methodology described in Equation III-3 and Equation III-4. The regulatory class average standard value for PCs decreases by 0.5 percent from MYs 2029 to 2030, while the average decreases by 14.4 percent for LTs. The standards for both classes increase by one percent in 2031.
For Alternative 4, NHTSA assessed the standards for MYs 2027-2029 by increasing stringency at a rate of 1.32 percent per year for PCs, and 1.5 percent per year for LTs. These rates of increase were also used to consider the MY 2030 standards using the methodology described in Equation III-3 and Equation III-4. The regulatory class average standard value for PCs decreases by 0.7 percent from MY 2029 to MY 2030, while the average decreases by 14.9 percent for LTs. The standards for both classes increase in MY 2031 by 0.5 percent.
For Alternative 5, NHTSA assessed the standards for MYs 2027-2029 by increasing stringency at a rate of 2.81 percent per year for PCs, and 3.03 percent per year for LTs. These rates of increase were also used to consider the MY 2030 standards using the methodology described in Equation III-3 and Equation III-4. The regulatory class average standard value for PCs decreases by 0.8 percent from MY 2029 to MY 2030, while the average decreases by 14.7 percent for LTs. The standards for PCs and LTs increase in MY 2031 by 0.5 percent.
3. Minimum Domestic Passenger Car Standard Analysis Update
EPCA, requires that any manufacturer's domestically manufactured PC fleet must meet the greater of either 27.5 mpg on average or 92 percent of the average fuel economy projected by the Secretary for the combined domestic and non-domestic passenger automobile fleets manufactured for sale in the United States by all manufacturers in the model year. Along with calculating each regulatory alternative, NHTSA must calculate a minimum standard for domestically manufactured passenger automobiles in accordance with 49 U.S.C. 32902(b)(4)(B). Since the 2020 final rule, NHTSA has calculated the “minimum domestic passenger car standard” (MDPCS) using an offset to account for the fact that the agency's model cannot predict any shift in vehicle designs (as opposed to technology application) that manufacturers might make in response to CAFE standards. Additional information about the origin of the MDPCS and the related offset calculation can be found in Section V.
In its 2020 final rule, NHTSA developed the MDPCS offset, a scalar that accounts for differences between the PC standards the agency forecasts in its rulemaking analyses and the actual PC standards EPA calculates for CAFE final compliance in accordance with 49 U.S.C. 32904(a). NHTSA used forecasted data from its 2009, 2010, and 2012 final rule analyses and actual CAFE final compliance data for MYs 2011-2018 to develop the initial MDPCS offset of −1.9 percent. NHTSA developed the original offset value for use in its 2020 final rule; however, the agency continued to use that same offset value in its 2022 and 2024 final rules without updating the underlying analysis. In addition to promulgating two final rules since it developed the initial MDPCS offset, NHTSA has also collected five additional model years of final compliance data—with two of those model years having been verified by EPA in accordance with 49 U.S.C. 32904(a).
For the NPRM, NHTSA updated the analysis it uses to calculate the MDPCS by supplementing the original analysis with additional data, such as estimated PC standards from subsequent rulemaking analyses and calculated PC standards from more recent CAFE compliance data. NHTSA began with the Market Data Input File containing the MY 2017 baseline fleet, which the agency used in the 2020 final rule analysis, covering MYs 2021-2026. The agency then identified and removed all the model types of dedicated AFVs from the Market Data Input File, consistent with the section 49 U.S.C. 32902(h) prohibition on considering the fuel economy of dedicated and dual-fueled vehicles when setting maximum feasible standards. Next, NHTSA ran the 2020 final rule version of the CAFE Model with the modified Market Data Input File to produce an analysis devoid of dedicated AFVs. The agency then extracted the PC standard from the resulting Compliance Output Report for MYs 2017-2050.
Next, NHTSA added the following CAFE compliance data for additional model years to the analysis: MYs 2012-2021, which have been verified by EPA in accordance with 49 U.S.C. 32904(a), and MYs 2022-2023, which have yet to be verified. As a proxy for individual model types of dedicated AFVs, NHTSA identified and removed the manufacturers that produce only dedicated AFVs from the compliance data and calculated the PC standard for MYs 2012-2023.[560]
Next, NHTSA modified the methodology it uses to calculate the offset. In the original offset analysis, NHTSA included comparisons between actual PC standards calculated from final model year compliance data to PC standards projected in proposed rules, in addition to those projected in final rules. For CAFE compliance, manufacturers are required to meet only those standards estimated and published in final rules, not those estimated and published in proposed rules. Consequently, NHTSA included comparisons to PC standards forecasted only in final rules in the updated analysis.
NHTSA compared the MDPCSs estimated from CAFE Model outputs from MYs 2017-2050 to the MDPCSs calculated from actual compliance data from MYs 2012-2023 and calculated the relative change (in percent) between them for each model year. NHTSA then calculated the offset by taking the average of the relative changes in
( printed page 62108)
MDPCS for MYs 2017-2023, which are those model years where the CAFE Model outputs (excluding all individual model types of dedicated AFVs) overlapped with CAFE compliance data that excluded manufacturers that produced only dedicated AFVs. The updated MDPCS offset analysis shows that the PC standards projected with the MY 2017 baseline fleet and the 2020 final rule version of the CAFE Model were more stringent than the actual PC standards calculated for CAFE final compliance by an average of −0.7 percent, less than half of the offset calculated previously.
In the NPRM, NHTSA proposed to use the new −0.7 percent offset to adjust the MYs 2027-2031 MDPCSs. NHTSA stated that the basis for the offset, which is tied to the agency's inability to project the precise mix of vehicles sold in the future, is inapplicable to the MYs 2022-2026 MDPCSs because they are based on average fuel economy standards that incorporate the most up-to-date data available to the agency for vehicle sales volume and footprint sizes in MY 2022. The agency proposed to use the new −0.7 percent offset to adjust the MDPCSs for MYs 2027-2031 to ensure that they are reflective of industry capabilities.
Several manufacturers, advocacy groups, and a government entity commented on NHTSA's use of an MDPCS offset. The Alliance, Hyundai, and Kia Corporation (Kia) supported NHTSA's continued use of an MDPCS offset. The Alliance and Stellantis supported NHTSA factoring the impact of changes to vehicle classification into the MDPCS offset calculation methodology.[561]
Specifically, Stellantis recommended that the MDPCS offset methodology should reflect the uncertainties associated with the contents of the rule, including the significant change in the PC fleet composition due to the vehicle classification changes.
Regarding the level of the offset, the Alliance, Ford, Kia, Nissan, and Stellantis commented in support of NHTSA's continued use of the existing −1.9 percent MDPCS offset. The Alliance recommended NHTSA retain its current −1.9 percent offset and defer amending the offset as a bulwark against unforeseen changes in the makeup of the fleet resulting from changes to vehicle classification.[562]
Ford requested that NHTSA retain its current −1.9 percent offset to provide flexibility against unforeseen changes in the makeup of the fleet resulting from changes to vehicle classification.[563]
Kia supported NHTSA's retention of its current −1.9 percent offset as protection against unintended consequences that may result from changes to vehicle classification.[564]
Kia argued that implementing the −0.7 percent offset in conjunction with changes to vehicle classification could penalize domestic passenger automobiles and ultimately discourage domestic manufacturing, increase costs, and reduce consumer choice. Nissan recommended that NHTSA retain its current −1.9 percent offset to account for differences between forecasted and real-world PC footprints.[565]
Stellantis stated that NHTSA should retain its current −1.9 percent offset to account for the uncertainty regarding changes to vehicle classification.[566]
Stellantis also stated that NHTSA should delay amending the offset until the impact of changing vehicle classification is better understood and no earlier than MY 2030.
Conversely, UCS and Attorneys General [567]
opposed NHTSA's use of an MDPCS offset. UCS stated that NHTSA's use of an MDPCS offset is arbitrary and inconsistent with its legal authority, and suggested that NHTSA to use a set of projections to establish the CAFE standards, but then state that those same set of projections are not sufficient when setting the MDPCS in the same rulemaking. UCS concluded that NHTSA should finalize a MDPCS without an offset that is inconsistent with its legal authority. The States and Cities similarly stated that the statute does not make any provision for an MDPCS offset to account for shifts in vehicle mix. They stated that NHTSA's use of an offset is arbitrary and contrary to statute.
UCS commented that the MDPCS offset is based on an ad hoc calculation methodology that lacks any underlying scientific or technical basis and confuses correlation with causation.[568]
UCS stated that NHTSA's central analysis takes into consideration many of the factors that NHTSA identifies as responsible for a potential shift in fleet mix,[569]
and further commented that, if NHTSA does not think its model is good enough at projecting the fleet, it must say so as part of that central analysis and should seek to remedy such concerns by correcting that underlying model. In addition, UCS commented that NHTSA used incorrect assumptions for its fleet projections when it calculated the MDPCS offset.[570]
UCS stated that NHTSA incorrectly assumed that its fleet projections can only be wrong in one direction, which is responsive to manufacturer compliance strategy. UCS further commented that part of NHTSA's reason for the offset stems from concerns about fuel prices that could alter the market; however, NHTSA's primary analysis includes a steady increase in fuel prices. In addition, UCS stated that the EIA has predicted that proposed policy changes would lead to higher gasoline prices, if finalized. UCS further stated that higher oil prices could shift consumer demand away from crossovers and towards PCs.
NHTSA disagrees with the Alliance, Ford, Kia, and Stellantis that it should continue to use the −1.9 percent offset until the impact of changes to vehicle classification and other uncertainties are better understood. The MDPCS offset is not a forward-looking value; it is based on comparing the projected average fuel economy standard as absolute MPG in prior rulemakings to the final compliance data of model years that have been completed. The analysis that NHTSA used to calculate the new −0.7 percent offset is based on the most recent and complete data available to the agency. Furthermore, the −0.7 percent offset compared to the −1.9 percent offset is a reduction of 1.2 percent, demonstrating NHTSA's efforts to minimize uncertainty in its projection of future CAFE standards. NHTSA disagrees with commenters requesting that NHTSA maintain the −1.9 percent offset because of uncertainty in vehicle reclassification. As previously mentioned in Sections II.A, II.B and III, the impact of the changes to vehicle classification in this final rulemaking has been accounted for in the final average fuel economy standards for the combined domestic and non-domestic passenger automobile fleet in both the curve fitting analysis and the Alternatives themselves.
NHTSA also disagrees with the Alliance and Stellantis that the agency should modify its MDPCS offset calculation methodology to incorporate impacts from the vehicle classification
( printed page 62109)
changes that have been finalized in this rulemaking. Significant modifications to improve and clarify vehicle reclassification, like replacing gross combined weight rating (GCWR) with Trailer Weight Rating (TWR) and delaying the implementation date from MY 2028 to MY 2030, have mitigated most of the uncertainties raised by the Alliance and other manufacturers. As stated earlier, the projected MDPCSs in the analysis have accounted for much of the concerns raised by manufacturers, such as vehicles moving from the non-passenger automobile to the passenger automobile regulatory class. The MDPCSs are based on average fuel economy standards that have been developed from footprint curves and estimated during compliance simulations in the CAFE Model. The vehicle classification changes will cause some vehicle models from the non-passenger automobile compliance fleet to move to the passenger automobile compliance fleet for MY 2030 and beyond. These changes were captured in the Market Data Input File and synthesized in the CAFE Model during its compliance simulation. In addition, for this final rule, NHTSA is finalizing adjustments to the footprint curves that define CAFE standards for MYs 2027-2031. In addition to other modifications, these adjustments incorporate the aforementioned changes to vehicle classification. While the effects of the changes to vehicle classification will not be factored into the MDPCS offset calculation methodology, they are adequately represented in the projected average fuel economy standards and consequently the MDPCSs themselves. As such, there is no need to further modify the MDPCS offset calculation methodology to account for changes to vehicle classification.
NHTSA does not agree with UCS and the States and Cities' assertion that NHTSA's use of an offset is arbitrary and inconsistent with its legal authority. This is discussed in more detail in Section V.
NHTSA also disagrees with UCS' assertion that the agency assumes its fleet projections can only be wrong in one direction. The agency does not presume or predict how the final compliance standards will compare to the predicted standards. As discussed above, the methodology that NHTSA uses to calculate the final MDPCS offset is a simple percentage change equation that can produce a positive or negative offset. In establishing the MDPCS, the agency is simply acknowledging the difference between the historic projected and achieved fuel economy, which is a function of vehicle footprints and sales volumes. Based on both MDPCS offset analyses, the offset shows that NHTSA has over predicted the static MPG of the MDPCS. However, NHTSA has improved the analysis that projects the MDPCS, which is reflected in this final rule.
NHTSA also disagrees with UCS' assertion that the MDPCS offset is based on an ad hoc calculation methodology that lacks any underlying scientific or technical basis. As previously discussed, NHTSA developed the offset to account retroactively for the differences between projected and achieved domestic and non-domestic passenger automobile fuel economy, which is a static MPG value. NHTSA uses a simple percentage change equation to determine the value of the offset to show this offset based on actual final CAFE compliance data. NHTSA also does not agree with UCS' assertion that, in establishing the offset, the agency is confusing causation with correlation. NHTSA has identified some potential causes of the historic differences but has not proclaimed an exact cause. The CAFE standards are coefficients that define a curve based on vehicle footprint, which accounts for variability in the vehicle offerings within a manufacturer's fleet; however, the MDPCS by statute is a static MPG, which does not account for the same variability. In addition, NHTSA does not agree with UCS's comment that NHTSA must modify the CAFE model in response to the historic differences between the projected and actual fuel economy standards. During compliance modeling, the CAFE model maintains a vehicle's initial footprint and does not adjust it when the platform component is upgraded. However, NHTSA does update the inputs and the CAFE model to continuously improve its projections. The decrease in the offset from −1.9 percent to −0.7 percent is indicative of this. As such, it is reasonable for projected standards to differ from those standards established during final compliance.
NHTSA also received comments on its use of the fleet average fuel economy standard rather than the fleet average fuel economy performance to develop the MDPCS and its application of the 49 U.S.C. 32902(h) restrictions to its MDPCS and MDPCS offset calculation methodologies, which the agency addresses in Section V.
B. Regulatory Alternatives Considered
For this final rule, NHTSA developed separate alternatives for two distinct periods of time (MYs 2022-2026 and MYs 2027-2031) and two distinct fleets (PCs and LTs). NHTSA developed a No-Action and five action alternatives for PCs for MYs 2022-2026; a No-Action and five action alternatives for LTs for MYs 2022-2026; a No-Action and five action alternatives for PCs for MYs 2027-2031; and a No-Action and five action alternatives for LTs for MYs 2027-2031. In total NHTSA developed twenty-four separate alternatives. The final standards may, in places, be referred to as the “Preferred Alternative(s),” but NHTSA intends “final standards” and “Preferred Alternative(s)” to be used interchangeably for purposes of this document.
Table III-1 below shows the specific change year over year for each of the 24 alternatives NHTSA analyzed for this final rule. Each row in the table contains four alternatives, one for each time period and regulatory class. For example, Alternative 3 consists of PC stringencies for MYs 2022-2026, PCs stringencies for MYs 2027-2031, LT stringencies for MYs 2022-2026, and LT stringencies for MYs 2027-2031. Throughout the analysis NHTSA refers to this group of alternatives collectively as “Alternative 3” for simplicity.
The regulatory alternatives considered by the agency in this final rule are presented in Table III-1 as percentage changes in stringency over the preceding model year. In the sections that follow, NHTSA presents the coefficients that define the standards in each model year for each alternative that corresponds to these percentage rates.
( printed page 62110)
The following subchapters define the regulatory alternatives (including the No-Action Alternative) by time period and provide details on how NHTSA developed them.
1. No-Action Alternatives for PCs and LTs
a. No-Action Alternative for the MYs 2022-2026 Amendment
The analysis of the No-Action Alternative assumes that the following CAFE standards remain in place: the CAFE standards for MYs 2022-2023 that were finalized in the 2020 final rule,[571]
and the CAFE standards for MYs 2024-2026 that were finalized in the 2022 final rule.[572]
The analysis also applies the statutory limitations in 49 U.S.C. 32902(h) in all model years in the analysis; specifically, the fuel economy of dedicated automobiles is not considered, dual-fueled automobiles are considered only when operated on gasoline or diesel fuel, and the trading, transferring, or availability of credits is not considered.
The No-Action Alternative standards for the existing MYs 2022-2026 PC and LT fleets are defined by the following coefficients:
( printed page 62111)
These equations are represented graphically below, where the x-axis represents vehicle footprint and the y-axis represents fuel economy.
( printed page 62112)
For the No-Action Alternative for MYs 2022-2026, the MDPCS is applied as it was established in the 2020 and 2022 final rules, including the offset originally calculated in those rules to account for recent projection errors as part of estimating the total PC fleet fuel economy standard.
b. No-Action Alternative for the MYs 2027-2031 Amendment
The analysis of the No-Action Alternative assumes the following CAFE standards remain in place: the CAFE standards for MYs 2024-2026 that were finalized in the 2022 final rule [573]
and the CAFE standards for MYs 2027-2031 that were finalized in the 2024 final rule.[574]
The analysis also applies the statutory limitations in 49 U.S.C. 32902(h) in all model years in the analysis; specifically, the fuel economy of dedicated automobiles is not considered, dual-fueled automobiles are considered only as operated on gasoline or diesel fuel, and the trading, transferring, or availability of credits is not considered.
The No-Action Alternative standards for the existing MYs 2027-2031 PC and LT fleets are defined by the following coefficients, which (for the purposes of this analysis) are assumed to persist without change in subsequent model years:
( printed page 62113)
( printed page 62114)
For the No-Action Alternative for MYs 2027-2031, the MDPCS is applied as it was established in the 2024 final rule.
2. Action Alternatives for Passenger Cars and Light Trucks
In addition to the No-Action Alternative, NHTSA has considered five action alternatives for PCs and LTs. These action alternatives are specified below and demonstrate different possible approaches to balancing the statutory factors applicable for setting fuel economy standards for PCs and LTs, as discussed in more detail in Section V.
a. Action Alternatives for MYs 2022-2026 Amendment
(1) Alternative 1
Alternative 1 begins with a MY 2022 set of target function parameters with which 80 percent of the PC fleet complied in MY 2022, and with which 80 percent of LTs complied in MY 2022. From there, Alternative 1 would increase CAFE stringency by 0.44 percent per year for MYs 2022-2026 for PCs and by 0.54 percent per year for MYs 2022-2026 for LTs.
( printed page 62115)
These equations are represented graphically below:
( printed page 62116)
( printed page 62117)
Under this alternative, the MDPCS is as follows:
(2) Alternative 2
Alternative 2 begins with a MY 2022 set of target function parameters with which 75 percent of the PC fleet complied in MY 2022, and with which 70 percent of LTs complied in MY 2022. From there, Alternative 2 would increase CAFE stringency by 0.47 percent per year for MYs 2022-2026 for PCs and by 0.46 percent per year for MYs 2022-2026 for LTs.
( printed page 62118)
These equations are represented graphically below:
( printed page 62119)
Under this alternative, the MDPCS is as follows:
(3) Alternative 3—Preferred Alternative
The Preferred Alternative begins with a MY 2022 set of target function parameters with which 70 percent of the PC fleet complied in MY 2022, and with which 50 percent of LTs complied in MY 2022. From there, Alternative 3 would increase CAFE stringency by 0.90 percent per year for MYs 2022-2026 for PCs and by 0.51 percent per year for MYs 2022-2026 for LTs.
( printed page 62120)
These equations are represented graphically below:
( printed page 62121)
Under this alternative, the MDPCS is as follows:
(4) Alternative 4
Alternative 4 begins with a MY 2022 set of target function parameters with which 55 percent of the PC fleet complied in MY 2022, and with which 40 percent of LTs complied in MY 2022. From there, Alternative 4 would increase CAFE stringency by 1.32 percent per year for MYs 2022-2026 for PCs and by 1.50 percent per year for MYs 2022-2026 for LTs.
( printed page 62122)
These equations are represented graphically below:
( printed page 62123)
Under this alternative, the MDPCS is as follows:
(5) Alternative 5
Alternative 5 begins with a MY 2022 set of target function parameters with which 55 percent of the PC fleet complied in MY 2022, and with which 40 percent of LTs complied in MY 2022. From there, Alternative 5 would increase CAFE stringency by 2.81 percent per year for MYs 2022-2026 for PCs and by 3.03 percent per year for MYs 2022-2026 for LTs.
( printed page 62124)
These equations are represented graphically below:
( printed page 62125)
Under this alternative, the MDPCS is as follows:
b. Action Alternatives for MYs 2027-2031 Amendment
(1) Alternative 1
Alternative 1 would increase CAFE stringency for PCs by 0.44 percent per year from MYs 2026-2029, change by −1.1 percent from MYs 2029-2030, and by 0.25 percent for MYs 2030-2031. Alternative 1 would increase CAFE stringency for LTs by 0.54 percent per year from MYs 2026-2029, change by −15.10 percent from MYs 2029-2030, and by 0.25 percent for MYs 2030-2031.
( printed page 62126)
These equations are represented graphically below. Note that the shapes of the curves for MYs 2027-2029 are also different from the shapes of the curves for MYs 2030-2031 due to the finalized reclassification in MY 2030.
( printed page 62127)
For this rulemaking, NHTSA has updated the analysis it uses to estimate the offset and calculated an offset of 0.7 percent, which will be applicable to the MDPCS for each action alternative in MYs 2027-2031. Under this alternative, the MDPCS is as follows:
(2) Alternative 2
Alternative 2 would increase CAFE stringency for PCs by 0.47 percent per year from MYs 2026-2029, change by −1.1 percent from MYs 2029-2030, and by 0.25 percent for MYs 2030-2031. Alternative 2 would increase CAFE stringency for LTs by 0.46 percent per year from MYs 2026-2029, change by −15.1 percent from MYs 2029-2030, and by 0.25 percent for MYs 2030-2031.
( printed page 62128)
These equations are represented graphically below. Note that the shapes of the curves for MYs 2027-2029 are also different from the shapes of the curves for MYs 2030-2031 due to the finalized reclassification in MY 2030.
( printed page 62129)
For this rulemaking, NHTSA has updated the analysis it uses to estimate the offset applied to the MDPCS, which is now calculated at 0.7 percent and is applied to each action alternative in MYs 2027-2031. Under this alternative, the MDPCS is as follows:
(3) Alternative 3—Preferred Alternative
The Preferred Alternative would increase CAFE stringency for PCs by 0.90 percent per year from MYs 2026-2029, change by −0.3 percent from MYs 2029-2030, and by 1.0 percent for MYs 2030-2031. The Preferred Alternative would increase CAFE stringency for LTs by 0.51 percent per year from MYs 2026-2029, change by −14.4 percent from MYs 2029-2030, and by 1.0 percent for MYs 2030-2031.
( printed page 62130)
These equations are represented graphically below. Note that the shapes of the curves for MYs 2027-2029 are also different from the shapes of the curves for MYs 2030-2031 due to the finalized reclassification in MY 2030.
( printed page 62131)
Under this alternative, the MDPCS is as follows:
(4) Alternative 4
Alternative 4 would increase CAFE stringency for PCs by 1.32 percent per year from MYs 2026-2029, change by −0.7 percent from MYs 2029-2030, and by 0.5 percent for MYs 2030-2031. Alternative 4 would increase CAFE stringency for LTs by 1.5 percent per year from MYs 2026-2029, change by −14.9 percent from MYs 2029-2030, and by 0.5 percent for MYs 2030-2031.
( printed page 62132)
These equations are represented graphically below. Note that the shapes of the curves for MYs 2027-2029 are also different from the shapes of the curves for MYs 2030-2031 due to the finalized reclassification in MY 2030.
( printed page 62133)
( printed page 62134)
For this rulemaking, NHTSA has updated the analysis it uses to estimate the offset and calculated an offset of 0.7 percent, which will be applicable to the MDPCS for each action alternative in MYs 2027-2031. Under this alternative, the MDPCS is as follows:
(5) Alternative 5
Alternative 5 would increase CAFE stringency for PCs by 2.81 percent per year from MYs 2026-2029, change by −0.8 percent from MYs 2029-2030, and by 0.5 percent for MYs 2030-2031. Alternative 5 would increase CAFE stringency for LTs by 3.03 percent per year from MYs 2026-2029, change by −14.7 percent from MYs 2029-2030, and by 0.5 percent for MYs 2030-2031.
( printed page 62135)
These equations are represented graphically below. Note that the shapes of the curves for MYs 2027-2029 are also different from the shapes of the curves for MYs 2030-2031 due to the finalized reclassification in MY 2030.
( printed page 62136)
For this rulemaking, NHTSA has updated the analysis it uses to estimate the offset and calculated an offset of 0.7 percent, which will be applicable to the MDPCS for each action alternative in MYs 2027-2031. Under this alternative, the MDPCS is as follows:
IV. Effects of the Regulatory Alternatives
A. Effects of the Regulatory Alternatives for MYs 2022-2026
NHTSA does not estimate any impacts from changes to the MY 2022-2026 standards other than the difference between the estimated achieved compliance value and the finalized standard for each manufacturer's fleet. At the time of the final rule, manufacturers have already produced fleets for MYs 2022-2026, either partially or completely. As a result, NHTSA's finalized standards are expected to have no impact on manufacturers' production decisions. Similarly, new vehicles produced for MYs 2022-2025 have already been purchased, as have, at the time of this final rule, most new vehicles produced for MY 2026.
Table IV-1
through Table IV-9 present compliance gaps for domestic passenger cars, imported passenger cars, and non-passenger automobile fleets for MYs 2022-2024, comparing the fuel economy levels that have been achieved to those that would have been achieved under the standards contemplated by NHTSA.
( printed page 62137)
( printed page 62138)
( printed page 62139)
( printed page 62140)
( printed page 62141)
( printed page 62142)
Unlike MYs 2022-2024, NHTSA is not yet in possession of complete pre- or mid-model year manufacturer data for MYs 2025-2026 from which to generate estimates of fuel economy standards and values. As a reminder, a manufacturer's fleet fuel economy standard is generated based on a calculation of sales-weighted volumes of vehicles by footprint and fuel economy in a particular regulatory fleet. The fuel economy in mpg values are not the standards; instead, the coefficients that go into the mathematical functions that create the footprint-to-fuel-economy relationship curves define the standards. Accordingly, without data for MYs 2025-2026 in hand, NHTSA performed side cases using the CAFE Model to generate estimated fleet average CAFE standards for MYs 2025-2026.
Table IV-10 through Table IV-13 show the estimated required CAFE level for MYs 2025-2026. Table IV-10 shows these values for passenger cars, light trucks, and the fleet as a whole for the Preferred Alternative. Table IV-11 through Table IV-13 show these values by regulatory class (domestic passenger cars, imported passenger cars, and non-passenger automobiles) for each manufacturer in each alternative. It is important to note that these values are projections of the average mpg that the fleets will need to achieve. The actual level of performance that each manufacturer would need to meet varies and is calculated for each manufacturer's compliance fleet based on the footprint of each vehicle in the fleet and the corresponding footprint curve.
( printed page 62143)
( printed page 62144)
B. Effects of the Regulatory Alternatives for MYs 2027-2031
1. Effects on Vehicle Manufacturers
Each regulatory alternative considered in this final rule, aside from the No-Action Alternative, would change the stringency of both passenger car and light truck CAFE standards during MYs 2027-2031. To estimate the potential effects of each of these alternatives, including effects beyond these years, NHTSA has, as with all recent CAFE rulemakings, assumed that standards would continue unchanged after the last model year to be covered by CAFE targets (in this case, after MY 2031).
The estimated required average fuel economy values for the passenger car, light truck, and total fleets for each action alternative NHTSA considered alongside values for the No-Action Alternative are presented in Table IV-14 below. NHTSA recognizes that the size and composition of the fleet (
i.e.,
in terms of distribution across the range of vehicle footprints) can change over time, affecting the average fuel-economy requirements under both the passenger car and light truck standards, and for the overall fleet. To the extent the fleet differs from NHTSA's projections, average requirements also would differ from NHTSA's projections.
( printed page 62145)
Manufacturers' achieved average fuel economy, as projected by the CAFE Model, does not always exactly match each CAFE standard in each model year, and some manufacturers have tended to exceed at least one requirement.[589]
NHTSA uses the CAFE Model to approximate compliance solutions of manufacturers, while observing statutory constraints on the factors NHTSA may consider in setting standards (and thus its analysis of alternative standards).[590]
As discussed in the accompanying FRIA and Final TSD, NHTSA simulates manufacturers' responses to each alternative given a wide range of input estimates (
e.g.,
technology cost and efficacy and fuel prices), each of which is subject to uncertainty. NHTSA's analysis simply illustrates one potential way manufacturers could respond to each regulatory alternative; actual manufacturer responses may differ from NHTSA's simulations, and therefore the achieved compliance levels will likely differ from the estimated achieved fuel economy for each regulatory alternative shown in these tables.
( printed page 62146)
The SHEV share of the fleet initially (
i.e.,
in MY 2024) is around 10.4 percent. By the end of the regulatory period (MYs 2027-2031), SHEV penetration rates reach 48-50 percent for the action alternatives and 81 percent for the No-Action Alternative (including both the passenger car and light truck fleets). For both light truck and passenger car fleets, each regulatory alternative produces a similar portion of SHEVs in each model year across MYs 2027-2031.
The PHEV share of the fleet in MY 2024 is 3.4 percent for light trucks and 1.7 percent for passenger cars. Although their market shares do not increase to the levels seen for SHEVs, in the light truck fleet, PHEVs are estimated to make up 4.3 percent of the fleet for all the regulatory alternatives by MY 2031, and 9.6 percent for the No-Action Alternative. In the passenger car fleet, PHEV penetration stays under two percent through MY 2029 and under three percent through MY 2031 for all regulatory alternatives, and reaches 1.8 percent by MY 2031 for the No-Action Alternative.[591]
Variation in penetration rates across regulatory alternatives generally results from differences in the number of vehicles or models to which a manufacturer would need to add technology to comply with each alternative. For example, a certain technology pathway could be the most cost-effective pathway if a manufacturer is just shy of its fuel-economy target, but the pathway likely becomes ineffective if there is a larger gap, which may necessitate pursuing broader changes in powertrain technology across the manufacturer's fleet. For more details on the technology application by regulatory fleet, see FRIA Chapter 8.2.2.1.
( printed page 62147)
( printed page 62148)
The FRIA also presents NHTSA's estimates of manufacturers' potential application of fuel-saving technologies, including advanced transmissions, aerodynamic improvements, and reduced vehicle mass, in response to each regulatory alternative. The accompanying FRIA Appendix provides more detailed and comprehensive results, and the underlying CAFE Model Output File provides all the information used to construct these estimates, including the specific combination of technologies estimated to be applied to every vehicle model/configuration in each of MYs 2024-2050.
NHTSA's analysis estimates the regulatory costs to manufacturers for compliance with the CAFE standards. As summarized in Table IV-22, NHTSA estimates the present discounted value of manufacturers'
cumulative
regulatory costs across MYs 2027-2031 would total $116 billion under the No-Action Alternative and between approximately $53 billion to $90 billion under regulatory alternatives 1 through 5 considered in this final rule. These regulatory costs account for fuel-saving technologies added in the simulation (and AC improvements and other OC technologies through MY 2027). Table IV-22 below shows estimated costs by manufacturer. Values for the regulatory alternatives are presented as incremental relative to the No-Action Alternative. The variation in aggregate costs among manufacturers is a function of both differences in the quantities of vehicles produced for sale in the United States and differences in technology application and compliance pathways. Technology costs for each model year are defined on an incremental basis, with costs equal to the relevant technology applied minus the costs of the initial technology state in a reference fleet (
i.e.,
MY 2024).[592]
The accompanying FRIA Appendix presents results separately for each manufacturer's compliance fleets (
i.e.,
( printed page 62149)
domestic passenger car, imported passenger car, and light truck) under each regulatory alternative and model year, and the underlying CAFE Model Output File also show results for each manufacturer's combined passenger car fleet (
i.e.,
domestic and imported cars).
NHTSA assumes that technology costs are reflected in vehicle prices. NHTSA's estimates of the average costs to new vehicle purchasers from MYs 2027-2031 are summarized in Table IV-23 and Table IV-24.
( printed page 62150)
Table IV-25 shows how these costs could vary among manufacturers. See Chapter 8.2.2 of the FRIA for more details of the effects on vehicle manufacturers, including regulatory costs.
Fuel savings and regulatory costs act as countervailing forces on new vehicle sales. All else being equal, as fuel savings increase, the CAFE Model projects higher new vehicle sales, but as regulatory costs increase, the CAFE Model projects lower new vehicle sales. Both fuel savings and regulatory costs increase with stringency. The magnitude of these fuel savings and vehicle price increases depends on manufacturer compliance decisions, especially technology application. Final TSD Chapter 4.2.1.2 discusses NHTSA's approach to estimating new vehicle sales. Starting in MY 2027, the CAFE Model begins applying technology differently in response to the standards
( printed page 62151)
that would be set under the various regulatory alternatives. All regulatory alternatives result in more vehicle sales compared to the No-Action Alternative, which has higher projected regulatory costs starting in MY 2027. Regulatory alternatives 1 through 4 result in very similar vehicle sales for all model years; in comparison to the No-Action Alternative, they all have 0.3 percent more sales in MY 2027 and approximately 0.6 percent more by MY 2031. Regulatory alternative 5, in comparison to the No-Action Alternative, has 0.2 percent more sales in MY 2027 and approximately 0.3 percent more by MY 2031. Figure IV-1 shows the estimated annual light-duty industry sales by regulatory alternative.
Differences in sales and the cost of technology applied to vehicles in turn tend to affect projected automobile industry labor utilizations. All regulatory alternatives result in lower levels of labor utilization, measured in person years, compared to the No-Action Alternative. Because the action alternatives 1 through 4 produce similar levels of technology costs and sales volumes, the related changes in labor predicted by the CAFE Model across these alternatives are also negligible; in comparison to the No-Action Alternative, Alternatives 1 through 4 all have approximately 0.2 percent lower labor in MY 2027 and approximately 1.2 percent lower by MY 2031. Regulatory Alternative 5, in comparison to the No-Action Alternative, has 0.3 percent less labor utilization in MY 2027 and 0.6 percent less by MY 2031. Figure IV-2 shows the estimated number of person years under each alternative.
( printed page 62152)
The accompanying Final TSD Chapter 6.2.5 discusses NHTSA's approach to estimating automobile industry employment, and the accompanying FRIA Chapter 8 (and its Appendix I) and CAFE Model Output File provide more detailed results of NHTSA's light-duty analysis.
2. Effects on Society
NHTSA accounts for the effects of the standards on society using a benefit-cost framework. The categories considered include private costs borne by manufacturers and passed on to consumers; external costs, which include government costs and costs pertaining to emissions, congestion, noise, and energy security; and costs associated with safety impacts. In this accounting framework, the CAFE Model records costs and benefits related to vehicles in the fleet throughout the lifetime of a particular model year and allows for the accounting of costs and benefits by calendar years. Examining program effects through this lens illustrates the temporal differences in major cost and benefit components and allows NHTSA to examine costs and benefits tied only to those vehicles directly impacted by this final rule.
NHTSA splits effects on society into private costs, external costs, private benefits, and external benefits. Table IV-26 and Table IV-28 present NHTSA's estimates of the present discounted values of the costs and benefits of changing CAFE standards in each alternative considered in this final rule, as well as the party (private interests or society as a whole) to which they accrue. Manufacturers are regulated directly under the program and incur additional production costs when they apply technology to their vehicle offerings to improve fuel economy. NHTSA assumes that those costs are passed through to new car and truck buyers in the form of higher prices (and conversely, that decreases in technology costs pass through as lower prices for consumers).
While incremental maintenance and repair costs and benefits would change for buyers of new cars and trucks affected by modified CAFE standards, NHTSA does not include these impacts in the analysis because they are difficult to estimate, and NHTSA does not currently have sufficient data to estimate them accurately. NHTSA may include estimates of the impact that CAFE standards have on lifetime maintenance and repair costs in future analyses if sufficient data become available.
The analysis estimates also take into account the rebound effect, in which vehicles are driven more as increased fuel economy reduces the cost of driving. NHTSA also assumes that drivers of new vehicles internalize 90 percent of the risk associated with increased exposure to crashes when they engage in additional travel.
The value of fuel savings,[593]
which accrue to new car and truck buyers, is the largest component of the estimated private benefits associated with each of the regulatory alternatives. For this final rule, the estimates reflect forgone fuel savings for consumers. NHTSA considered options for the final rule to present the value of fuel savings as those savings accrue to multiple buyers over the life of the vehicle; currently,
( printed page 62153)
the value of fuel savings is presented as one value attached to the entire life of the vehicle. In contrast, in the real world, a vehicle may have multiple owners that experience different benefits between the up-front savings from reduced technology application under lower fuel economy standards and the forgone fuel savings for the first owner for the time that they own the vehicle. NHTSA sought comment on such alternative presentations of fuel savings that the agency could include for informational purposes in the final rule, in addition to its traditional presentation of fuel savings as shown below. IPI commented that NHTSA should maintain its societal perspective and value the full fuel savings in its analysis.[594]
IPI argued that any change to NHTSA's presentation that accounted for the distribution of fuel savings between first and subsequent owners should also account for any additional residual value of vehicles captured by initial owners at resale. NHTSA maintains that the societal value of fuel savings should be considered in order to capture the full effect over the vehicle's lifetime and is not changing its presentation of fuel savings. NHTSA is still weighing alternative approaches and how best to separate costs and benefits between different owners and will consider changes for future CAFE rulemakings.
The regulatory alternatives also increase the cost of driving relative to the No-Action Alternative (
i.e.,
lower fuel economy increases the per-mile cost of travel) and results in more frequent refueling and a rebound-related reduction in the mobility benefits of travel.
By reducing standards, NHTSA enables manufacturers to provide a mix of vehicles and invest in other attributes such as safety. When standards increase in stringency, NHTSA accounts for forgone improvements in attributes other than fuel economy due to CAFE standards through the IOC in its analysis; however, the agency does not account for changes in the fleet mix offered by manufacturers in an effort to comply with standards, which could include eliminating some models entirely. Because the finalized standards would prevent these distortionary effects, they would increase the range of choices available to Americans and provide additional benefits to new car and truck buyers.
In addition to private benefits and costs—those borne by manufacturers, buyers, and owners of cars and light trucks—there are other benefits and costs from resetting CAFE standards that are borne more broadly throughout the economy or society, which NHTSA refers to as external benefits and costs.[595]
In the case of the finalized standards, the increase in per-mile fuel costs would lead to a reduction in congestion, fatalities, and road noise costs, due to reduced rebound travel.596
The external benefits of health outcomes related to exposure of criteria pollutants and of improved energy security also would decrease slightly relative to the No-Action Alternative under each of the regulatory alternatives considered in this final rule.
Table IV-26 through Table IV-29 below present NHTSA's estimates of the benefits and costs of each regulatory alternative at different discount rates and from both model year and calendar year perspectives. Estimated net benefits are positive for all regulatory alternatives at both the three and seven percent discount rates and for each perspective, with higher costs and benefits estimated in the calendar year analysis.
( printed page 62154)
( printed page 62155)
( printed page 62156)
( printed page 62157)
3. Physical and Environmental Effects
NHTSA estimates various physical and environmental effects associated with the standards. These include quantities of fuel consumed, non-criteria and criteria pollutant emissions, and health and safety impacts. Table IV-30 shows the average annual impacts, including the on-road fleet sizes, vehicle miles traveled (VMT), fuel consumption, and CO2
emissions, across alternatives and grouped by decade. The overall size of the on-road ICE fleet decreases in later decades regardless of alternative due to declining ICE sales, with the lowest on-road fleet size projected under the No-Action Alternative.[597]
All five regulatory alternatives result in larger fleets by CY 2050 compared to the No-Action Alternative. Increased sales during the standard-setting years increases the existing vehicle stock, thereby expanding the size of the overall fleet.
In the No-Action Alternative, the decreasing size of the overall ICE fleet results in ICE VMT decreases in later decades, with the lowest average VMT per year occurring between CY 2041 and CY 2050. Similarly, on an annual basis, fuel consumption (measured in gallons of gasoline gallon equivalents (GGEs)) and non-criteria emissions decline in the later decades due to reduced VMT and new, more efficient vehicles replacing older, less efficient vehicles in the fleet. Relative to the No-Action Alternative, all regulatory alternatives considered result in lower VMT but increase fuel consumption and non-criteria emissions due to a larger ICE fleet, with the largest increases observed in Alternative 1.
( printed page 62158)
NHTSA's analysis estimates total annual consumption of fuel by the ICE on-road fleet on a calendar basis for 2024 through 2050, as shown in Figure IV-3 for the No-Action Alternative, Alternative 1, Alternative 2, Alternative 3, Alternative 4, and Alternative 5. Gasoline consumption decreases over time, with smaller decreases seen under the regulatory alternatives compared to the No-Action Alternative. Note that in many of the figures presented, the lines representing different regulatory alternatives lay nearly on top of each other, indicating that estimated impacts are very similar.
( printed page 62159)
NHTSA estimates the non-criteria emissions attributable to the light-duty on-road fleet, from both vehicles and upstream energy sector processes (
e.g.,
petroleum refining, or fuel transportation and distribution) as shown in Figure IV-4, Figure IV-5, and Figure IV-6.[600]
All three non-criteria emissions follow similar trends of decline in the years between CYs 2024-2050, with smaller declines for the regulatory alternatives compared to the No-Action Alternative.[601]
( printed page 62160)
Using the CAFE model, NHTSA estimates criteria pollutant emissions attributable to the light-duty on-road fleet from both vehicles and upstream energy sector processes (
e.g.,
petroleum refining, or fuel transportation and distribution) as shown in Figure IV-8, Figure IV-9, and Figure IV-10. Changes in criteria pollutant emissions in turn
( printed page 62161)
lead to changes in health outcomes described in later sections. The CAFE Model computes select health impacts resulting from population exposure to PM2.5
associated with emissions from directly emitted PM and two precursors to PM2.5
(NOX
and SOX). Under the No-Action Alternative and each regulatory alternative, NHTSA projects a decrease in emissions of all criteria pollutants attributable to the light-duty on-road ICE fleet between CY 2024 and CY 2050 due to the decrease in VMT and retirement of older less efficient vehicles. These criteria pollutant emissions increase relative to the baseline as the stringencies of the alternatives decrease.
( printed page 62162)
( printed page 62163)
Health impacts quantified by the CAFE Model include various instances of hospital visits due to respiratory problems, minor restricted activity days, non-fatal heart attacks, acute bronchitis, premature mortality,[602]
and other effects of criteria pollutant emissions on health. Table IV-31 shows changes in select health outcomes relative to the No-Action Alternative, across all action alternatives. The magnitude of the differences relates directly to the changes in the volumes of criteria pollutants emitted. See Chapter 5.4 of the Final TSD for information regarding how the CAFE Model calculates these health impacts.[603]
NHTSA also quantifies safety impacts in its analysis. These include the estimated numbers of fatalities, non-fatal injuries, and property damage crashes occurring over the lifetimes of the light-duty vehicles considered in the analysis. The following table shows the changes in these projected outcomes under the action alternatives relative to the reference baseline.
( printed page 62164)
Decreasing fuel economy stringency impacts safety outcomes from rebound-related reductions in VMT (motorists choosing to drive less as driving becomes more expensive), and the increase in scrappage causing newer vehicles with more safety features to enter the fleet sooner. The impacts of mass changes are non-linear and depend on the specific fleet receiving those changes, with larger mass disparities between passenger cars and light trucks causing an increase in adverse safety outcomes. Though the point estimates applied suggest a decrease under the regulatory alternatives, NHTSA notes that none of these safety outcomes due to mass changes can be distinguished statistically from zero. Chapter 7.1.5 of the FRIA accompanying this document contains an in-depth discussion of the effects of the various alternatives on these safety measures, and Chapter 7 of the Final TSD contains information regarding the construction of the safety estimates.
4. Sensitivity Analysis
The FRIA that supports this rulemaking relies on many different inputs, parameters, and other analytical assumptions that reflect the agency's best judgments regarding a variety of factors relevant to the anticipated outcomes of the finalized CAFE standards reset, which are all applied within an analytical framework using the CAFE Model. NHTSA recognizes that the values of many analytical inputs are uncertain, and some to a significant degree, which in turn results in uncertainty for some estimates of the benefits, costs, and other outcomes. Some of the uncertain input parameters have a considerable influence on specific types of estimated impacts, while others may affect the results of the analysis more broadly. To understand the effect that particular assumptions have on the estimated outcomes, NHTSA conducted a sensitivity analysis by running the CAFE Model using alternative assumptions (referred to as “sensitivity cases”). The results allow
( printed page 62165)
NHTSA to explore a range of potential analytical inputs and to understand the sensitivity of estimated impacts to changes in these specified model inputs. The sensitivity cases developed for this analysis span assumptions related to technology applicability and cost, economic conditions, consumer response, externality values, and safety assumptions, among others.[604]
A sensitivity analysis can identify two critical pieces of information:
how big an influence
does each parameter exert on the analysis, and
how sensitive the model results are
to that assumption. NHTSA acknowledges, however, that influence is different from likelihood. NHTSA does not mean to suggest that any one of the sensitivity cases presented here is inherently more likely than the collection of assumptions that represent the analysis NHTSA conducted to support this rulemaking (referred to as the “central analysis”). The sensitivity analysis simply provides an indication of which assumptions have the greatest impact and the extent to which future deviations from the central analysis assumptions could affect the actual future costs and future benefits of the rule.
( printed page 62166)
( printed page 62167)
Chapter 9 of the accompanying
FRIA summarizes results for each of the sensitivity cases, and detailed model inputs and outputs are available on NHTSA's website.[607]
The figures in Section IV.B.1 illustrate the relative changes produced by the sensitivity effects of selected inputs on the costs and benefits estimated for this final rule. Each collection of figures groups sensitivity cases by the category of input assumption (
e.g.,
macroeconomic assumptions, technology, and safety assumptions). The figures provide a sense of which inputs are ones for which a different assumption would have a much different effect on analytical findings, and which ones would not. For example, assuming a different oil price trajectory would have
( printed page 62168)
a relatively large effect, as would changing the assumptions about the effects of changes in vehicle mass on safety outcomes. Chapter 9 of the FRIA provides an extended discussion of these findings and presents net benefits estimated under each of the cases included in the sensitivity analysis. The results presented in the earlier subsections of Section IV and discussed in Section V are drawn from the central analysis and reflect NHTSA's best judgments regarding many different factors; the sensitivity analysis discussed here is simply to illustrate how differences in assumptions can lead to differences in analytical outcomes, some of which can be large and some of which may be smaller.
Overall, NHTSA finds that, for light-duty vehicles, the Preferred Alternative in this final rule, Alternative 3, produces positive estimated net benefits under all sensitivity cases, at both three and seven percent discount rates. In cases that assume the central analysis treatment of MYs 2022-2026, societal net benefits are highest in the “Mass-size-safety (high)” case ($70 billion) and lowest in the “Mass-size-safety (low)” case ($13.6 billion), when applying a three percent social discount rate.
( printed page 62169)
( printed page 62170)
( printed page 62171)
V. Basis for NHTSA's Conclusion That the Final Standards Are Maximum Feasible
This section details the statutory factors, data, and analysis that NHTSA considered when determining maximum feasible standards for MYs 2022-2026 and MYs 2027-2031.
A. The Energy Policy and Conservation Act of 1975 (EPCA), as Amended by the Energy Independence and Security Act of 2007 (EISA)
Under EPCA, NHTSA is required to set separate average fuel economy standards for new passenger cars and light trucks produced or imported for sale in the United States at “maximum feasible” levels.[608 609]
That mandate is subject to important limiting considerations, which center on the statutory concept of “maximum feasibility.” In determining maximum feasibility, NHTSA must consider the factors set forth in section 32902(f). Specifically, the fuel economy standards established by NHTSA must be based on consideration of technological feasibility, economic practicability, the effects of other Government standards applicable to motor vehicles, and the need of the United States to conserve energy.[610]
Fuel economy standards are designed based on light-duty vehicles powered by “fuel,” which is defined in EPCA to include gasoline, diesel fuel, or other liquid or gaseous fuels with similar combustion properties as NHTSA identifies.[611]
While EPCA includes specific provisions designed to incentivize automakers to invest in the development of new technologies, including battery-electric and other alternative-fuel powertrains, EPCA prohibits NHTSA from considering the fuel economy of alternative-fueled vehicles in setting or amending its standards.[612]
As for dual-fueled vehicles, such as plug-in hybrid electric vehicles (but not non-plug-in hybrid vehicles),[613]
the statute requires NHTSA to consider their fuel economy only while operated exclusively on gasoline or diesel fuel.[614]
EPCA also prohibits NHTSA from considering the availability of compliance credits in setting or amending its standards.[615]
In addition to these considerations, section 32902 includes several provisions specifying how NHTSA must prescribe CAFE standards, including the form that the CAFE standards must take and the manner and timing of setting such standards and any subsequent amendments.[616]
The following
( printed page 62172)
subsections discuss in greater detail these requirements, including the requirement to set maximum feasible fuel economy standards.
1. Administrative Provisions Governing CAFE Standard Setting
a. Lead Time, Amendatory Authority, and the Number of Model Years for Which Standards May Be Set at One Time
EPCA requires that NHTSA prescribe new CAFE standards at least 18 months before the beginning of each model year.[617]
In addition, EPCA authorizes NHTSA to prescribe regulations amending the standard established previously for a model year to a level that the Secretary determines is the maximum feasible average fuel economy level for that model year.[618]
NHTSA previously had interpreted EPCA to allow amendments reducing the stringency of an industry-wide fuel economy standard for a particular model year up until the beginning of the model year in question.[619]
The beginning of the model year is considered generally to be October 1 of the calendar year preceding the named model year (
e.g.,
a MY 2027 vehicle might be offered for sale on or after October 1, 2026).[620]
However, the statute does not contain any language limiting the model years for which standards may be amended. The only statutory provision addressing a time limit for an amendment to an existing standard says that NHTSA must provide at least 18 months of lead time if the standards are amended to become more stringent.[621]
EPCA contains no lead time requirement if the amendment makes an average fuel economy standard less stringent. As such, NHTSA interprets EPCA as authorizing amendment of standards after a model year has commenced or concluded, so long as the amendment makes the standard less stringent.
NHTSA recognized in the proposal that this is a change in its previous interpretation of the statute with respect to generally applicable standards.[622]
NHTSA's prior interpretation was made in response to a manufacturer request for broad downward adjustment to standards in response to manufacturer non-compliance. In this case, NHTSA is amending existing standards promulgated contrary to specific statutory provisions to ensure that vehicle manufacturers are not in the position of committing violations because they could not meet a standard that is impermissibly high and far above the maximum feasible level for vehicles with internal combustion engines (
i.e.,
the vehicles for which the agency has the authority to set standards).[623]
This conclusion is consistent with NHTSA's rationale for amending standards for low-volume manufacturers in some cases well after the conclusion of a model year, to avoid penalizing manufacturers for NHTSA's own conduct (there, a delay in addressing the manufacturers' petitions).[624]
NHTSA's conclusion is further supported by legislative action amending the CAFE civil penalty provision, which applies to years for which the Secretary of Transportation (NHTSA, by delegation) has not notified a manufacturer of the penalty due for an average fuel economy less than the applicable standard.[625]
The elimination of civil penalties for these model years obviates NHTSA's prior concern that amending standards after the end of a model year “would undermine the limits Congress placed on NHTSA's authority to mitigate penalties.” [626]
That statutory change likewise applies to MY 2022 and later. Accordingly, NHTSA stated in the proposal that the agency was proposing to amend standards beginning in MY 2022, also consistent with the Secretary's direction in the January 28, 2025 memorandum titled “Fixing the CAFE Program” as this was the earliest model year for which NHTSA has not concluded compliance proceedings.
NHTSA received several comments regarding the agency's authority to amend standards beginning with MY 2022. PMI and the Alliance supported NHTSA's authority to revise standards for prior model years, arguing that the agency retains the power to correct unlawful or infeasible standards, particularly those for MYs 2022-2026, which they state were
void ab initio
due to the illegal inclusion of electric vehicles in the baseline.[627]
AEI similarly contended that NHTSA is prohibited by law from considering dedicated automobiles and must therefore amend MYs 2022-2026 standards that included EV penetration.[628]
PMI also emphasized that the statute draws a sharp distinction between setting new standards and amending existing ones: while Congress explicitly imposed an 18-month lead-time requirement for new standards or amendments that
increase
stringency, subsection (c) of section 32902, which governs amendments generally, contains no such temporal limitation.[629]
PMI contended that this distinction demonstrates that Congress intended to protect automakers from sudden regulatory tightening but left the agency free to loosen standards if they were too stringent.[630]
PMI further stated that traditional administrative law restrictions on retroactive rulemaking do not apply to this proposal.[631]
Although there is a general presumption against retroactivity, PMI asserted that this principle exists to protect regulated parties from the unfair imposition of new duties or liabilities for past conduct.[632]
Because NHTSA's proposal
relieves
a regulatory burden rather than imposing burdens on formerly lawful conduct, the fairness concerns animating the presumption against
( printed page 62173)
retroactivity are not implicated.[633]
With regard to automakers' banked credits, PMI cited the D.C. Circuit for the proposition that “regulatory credit `anticipation alone does not create a vested right.' ” [634]
In addition, PMI addressed historical D.C. Circuit precedent,[635]
stating that decisions upholding the agency's past refusal to amend standards retroactively are no longer controlling following the Supreme Court's
Loper Bright
decision.[636]
PMI noted that the D.C. Circuit had previously relied on
Chevron
deference to uphold NHTSA's policy preference at the time; without
Chevron,
the “single best reading” of the statute compels the agency to correct unlawful standards retrospectively.[637]
On the other hand, several commenters, including NRDC
et al.,
UCS, ZETA, IPI, SELC, Lucid, the Attorneys General, and individual commenters, argued that NHTSA lacks the authority to amend standards for model years that have already concluded or commenced.[638]
First, commenters including ZETA, NRDC
et al.,
and the Attorneys General rejected NHTSA's reliance on statutory silence in subsection (c), asserting that silence cannot override the firmly embedded presumption against retroactivity.[639]
Citing the Supreme Court's decision in
Bowen,
ZETA, NRDC
et al.,
and the Attorneys General stated that a statutory grant of rulemaking authority cannot encompass the power to promulgate retroactive rules unless Congress conveys that power in “express terms.” [640]
Regarding the amendment provisions in subsections 32902(c) and (g), the Attorneys General argued that any amended standard must be “maximum feasible,” a forward-looking term inherently meaning “capable of being done.” [641]
Because automakers cannot change past production, they argued that setting a feasible standard for concluded model years is logically impossible.[642]
NRDC
et al.
further stated that subsection (g)(1) demands that amended standards comply with subsection (a), which explicitly requires standards to be set “before the beginning of each model year.” [643]
A pair of individual commenters stated that while 49 U.S.C. 32902(g) “exempts amendments that reduce stringency from the 18-month lead time requirement—it does not authorize the agency to rewrite standards years after a model year has concluded.” [644]
This commenter further observed that “[e]xemption from a timing requirement answers `how much notice must the agency provide?' It does not answer whether an agency may retroactively nullify standards that have already been applied, against which compliance has been assessed, and under which penalties have accrued,” warning that if NHTSA's interpretation were correct, “the agency could wait until 2030 and retroactively relieve manufacturers of all CAFE obligations stretching back a decade—a reading that would render the statutory scheme meaningless.” [645]
Other individual commenters stated that all standards, including downward amendments, are subject to EPCA's 18-month lead-time requirement.[646]
Commenters opposed to the amendments for MYs 2022-2026 further supported their position by citing the EPCA Conference Report, which states that “[a]n amendment which has the effect of making an average fuel economy standard less stringent can be promulgated at any time prior to the beginning of the model year in question.” [647]
A pair of individual commenters also commented on the meaning of the statutory term “amendment,” which they stated implies a modification to something currently operative.[648]
Regarding the practical impacts, commenters detailed how amendments to prior model years' standards will disrupt the CAFE program's statutory scheme and ignore manufacturers' reliance interests. NRDC
et al.
noted that because amendments to prior model years cannot change how vehicles were already built and sold, the rule will simply result in mass over-compliance, awarding automakers large credit banks for past years that they will use to avoid making future fuel economy improvements.[649]
Moreover, the Attorneys General and ZETA criticized the agency for failing to consider the reliance interests of automakers who made significant investments to comply with existing rules and generated credits that would be abruptly devalued or eliminated.[650]
UCS, NRDC
et al.,
and IPI observed that NHTSA has consistently rejected amendments to prior model years since 1984 to ensure regulatory certainty.[651]
Similarly, an individual commenter stated that “[e]ven if the agency believes penalties are limited, retroactively changing regulatory benchmarks raises significant concerns regarding reliance interests, administrative finality, and whether the agency's action is reasonable and non-arbitrary.” [652]
This commenter argued that “[r]egulated entities and markets rely on finalized rules. Rewriting past standards after the fact undermines predictability and confidence in the government,” and concluded that if NHTSA believes prior rules were unlawful, “it must still explain how retroactive revision complies with the APA and why less disruptive alternatives were not pursued.” [653]
Another individual commenter stated that relaxing standards for past model years “would only serve to give a windfall of credits to some auto manufacturers while doing nothing to help consumers or incentivize innovation.” [654]
This commenter also argued that it is inappropriate to use historical individual vehicle compliance to determine standards for prior model years, as manufacturers previously
( printed page 62174)
made choices based on the fleet average valuation mechanisms then in place.[655]
In addition, SELC, UCS, and NRDC
et al.
argued that the narrow statutory carve-out for low-volume manufacturers cannot be used to justify a blanket amendment of standards for prior model years for the entire industry.[656]
ZETA and NRDC
et al.
also objected to the concept that NHTSA could amend standards because compliance proceedings remained open, stating those proceedings are open only because NHTSA violated its own statutory duty to assess compliance annually.[657]
Finally, though American Honda Motor Co., Inc. (Honda) supported a regulatory reconsideration, it expressed concern at the “notable retroactive application,” stating that reaching back to MY 2022 and 2023 would unfairly penalize manufacturers who made good-faith investments.[658]
Honda suggested that focusing on MY 2024 and subsequent years would “[t]arget the core issue by addressing the consideration of electric vehicles at the point where they began to distort `maximum feasible' calculations of the fleets.” [659]
NHTSA has carefully considered comments regarding the agency's authority to amend standards for model years that have already commenced or concluded. While the agency acknowledges the importance of regulatory finality, NHTSA disagrees with the commenters' assertion that it lacks the statutory or administrative authority to reset standards for MYs 2022-2026. NHTSA cannot assess manufacturer compliance against standards that considered factors in contravention of the express text of subsection 32902(h), including for compliance determinations for past model years. This is consistent with the agency's statutory authority, prior positions, and applicable case law, as discussed in more detail below.
First, NHTSA disagrees with the assertion that the 18-month lead-time requirement in 49 U.S.C. 32902(a) or the amendment provisions in section 32902(g) categorically bar the agency from revising standards after a model year has commenced. Although the agency has historically adopted a policy of limiting downward stringency amendments to those finalized before October 1, the authority to amend standards to the “maximum feasible” level under subsection 32902(c) confirms that Congress did not impose any explicit temporal restriction on amendments that reduce the stringency of the standards. In addition, as discussed below, NHTSA is not lowering standards to accommodate manufacturer compliance shortfalls. Rather, the agency's present action remedies standards for all outstanding model years that were statutorily defective from their inception due to the consideration of prohibited factors. NHTSA must adopt amended standards that reflect a correct application of the subsection 32902(h) factors and cannot enforce standards based on an incorrect application of those factors. Because NHTSA's assessment of manufacturer compliance against these amended standards will only operate prospectively in upcoming compliance determinations, these amendments are not retroactive.
This action is also distinguishable from the rulemaking invalidated in
Bowen,
where providers structured their operations using prospective cost limits to avoid having non-reimbursable costs from the Government.[660]
In contrast, this action imposes no costs on manufacturers as a result of the agency's appropriate application of standards that consider subsection 32902(h), including for compliance determinations for past model years. Because reducing the stringency of the standards based on a permissible consideration of statutory factors relieves compliance burdens rather than creating new liabilities, manufacturers face no retroactive monetary penalties—a result independently guaranteed by Congress setting the CAFE civil penalty rate to zero. For similar reasons, NHTSA agrees with PMI that the revisions for MYs 2022-2026 are not retroactive as articulated in
Landgraf
v.
USI Film Products.[661]
Specifically, NHTSA's action to reset standards for those years does not impair rights a regulated party possessed when it acted, increase liability for past conduct, or impose new duties upon completed transactions. Because compliance proceedings have not yet commenced, the revised standards do not attach new legal consequences to events already finished; instead, they reflect the principle that applying updated standards to pending matters is permissible when it does not alter primary conduct or legal obligations.[662]
NHTSA has considered the reliance interests asserted by Honda, ZETA, and the Attorneys General. The agency recognizes that manufacturers make long-term capital investments based on established standards. However, the agency must correct standards that exceed what is maximum feasible for the industry as a whole due to the inappropriate inclusion of electric vehicles in the standard-setting process. NHTSA also agrees that regulatory credits do not constitute a vested right. Regardless of commenters' views regarding the timing of downward adjustments, NHTSA retains the authority to amend standards,[663]
meaning that regulatory credits remain speculative expectations rather than vested rights until NHTSA has verified manufacturer-submitted data, any necessary investigative work or corrective math is completed, and the agency has finalized compliance for the relevant model year. This has been the case since the creation of the credit program, and manufacturers expect adjustments until the agency finalizes compliance determinations for a given model year. Conversely, to the point raised by NRDC
et al.
and others regarding over-compliance and potential credit generation with the reset standards, credits generated under a corrected standard are a reflection of a manufacturer's performance against a legally valid benchmark. Furthermore, NHTSA believes that maintaining a standard that is legally and technically flawed poses a greater threat to regulatory stability than credits generated as an incidental consequence of a one-time correction.
NHTSA disagrees with commenters who argue that the agency is bound by its past positions or subsequent judicial affirmations of its past positions, such as
General Motors Corp.
v.
NHTSA.[664]
As discussed above, NHTSA will assess compliance using these amended standards only in future proceedings, instead of assessing manufacturer compliance against an unlawfully established standard. In contrast, previously, NHTSA declined to lower standards that were lawfully established under EPCA simply because those standards ultimately proved to exceed manufacturer capabilities at the time of compliance. While the agency
( printed page 62175)
previously cited appropriate policy reasons for denying the manufacturer's petitions—such as relying on Congress's statutory credit mechanism to absorb temporary shortfalls under lawfully promulgated standards—those policy considerations are inapplicable where, as here, NHTSA's threshold obligation is to ensure that the standards are established in accordance with EPCA. The present action addresses standards that relied upon factors and assumptions that the agency was statutorily proscribed from considering when setting those standards at their inception. Consequently, while previous denials of manufacturer petitions to lower standards after the commencement of a model year preserved legally valid standards against post-hoc compliance challenges, NHTSA's action today remedies standards that were defective from the outset.
As noted by PMI, the Supreme Court's decision in
Loper Bright Enterprises
v.
Raimondo
requires courts to determine, and agencies to follow, the single best reading of enabling legislation.[665]
Although the Supreme Court in
Loper Bright
stated that it does not call into question prior cases that relied on such deference,[666]
agencies retain authority to reconsider their prior statutory interpretations. As discussed, NHTSA has reconsidered the agency's prior interpretation and now concludes that the best reading of the statute authorizes amendments that make downward adjustments to standards after the applicable model year has commenced.
NHTSA believes that the best reading of EPCA is that the agency maintains the authority to correct standards that were promulgated using prohibited factors, such as the consideration of electric vehicles in the analytical baseline. Leaving such legally defective standards in place would place manufacturers in a legally contradictory compliance posture, forcing them to navigate corporate policies committing to legal compliance against fuel economy standards that the agency was statutorily proscribed from setting. NHTSA also disagrees that this action renders the statutory scheme meaningless. This amendment is based on a correction of a specific legal error, made in consideration of legally appropriate information and statutory factors, and informed by significant public comment, not an assertion of a generalized power to rewrite standards at will.
NHTSA acknowledges comments from ZETA and NRDC
et al.
regarding the timing of compliance assessments. NHTSA assesses compliance with CAFE standards as expeditiously as possible, in recognition of both manufacturer interest in understanding their own compliance positions and planning to use available compliance flexibilities like credits, in addition to the public's interest in publicly available information about fleet fuel economy.[667]
However, closing compliance proceedings based upon known legally infirm standards would be inappropriate. The agency retains the authority in appropriate circumstances to reconsider the underlying standards upon which final compliance assessments are based and will issue final compliance determinations against standards that reflect a correct construction of the statute.
NHTSA concludes that the best reading of EPCA provides authorization for NHTSA to reset to less stringent levels fuel economy standards applicable to passenger vehicles for prior model years. Subsections 32902(a) and (b) require the Secretary, starting with MY 2011, to establish fuel economy standards for light-duty vehicles at least 18 months in advance of the beginning of each model year. Subsection 32902(c) provides that the Secretary may amend previously established standards to levels the Secretary decides are the maximum feasible for that model year. Subsection 32902(c) contains no temporal limitation on an amendment. In subsection 32902(g), Congress specified a lead time requirement only for NHTSA actions to establish more stringent standards. It is well understood that the authority to amend standards conveys the authority to change standards that the agency has already established. Subsection 32902(c), by authorizing an amendment to an existing fuel economy standard, provides explicitly that the Secretary can revisit a prior determination of maximum feasibility. Congress clearly anticipated that the agency may need to revisit standards that new information indicates are no longer maximum feasible—either too high or too low—and imposed additional restrictions when making standards more stringent. Given the economic harm to the industry and consumers likely to result from overly stringent standards, Congress expressly
declined
to impose time restrictions to enable more nimble agency action when needing to reduce stringency.
The same reasoning applies to amending standards for past model years. Given the trend line connecting past and future standards, when previous standards exceed maximum feasibility because the agency considered factors explicitly disallowed from consideration, a course correction to restore the program to appropriate levels is necessary—even if this results in generation of credits to account for additional manufacturer investment in fuel-saving technologies than might have occurred had an appropriate balancing been undertaken originally. NHTSA concludes that the grant of authority in EPCA to amend standards encompasses specifically the authority to establish less stringent standards affecting past MYs. As discussed in more detail in Section V.D, however, should a court determine that NHTSA lacks authority to adjust standards for MYs 2022-2026, the agency intends for the amended standards to apply to subsequent model years, as the rationale for these revisions applies with equal force to those standards.
NHTSA also received comments related to the level of standards for MYs 2022-2026, and the agency discusses those comments below.
NHTSA received one comment from North American Subaru, Inc. (Subaru) related to the lead time required for future model year standards, specifically asserting that the “reclassification of off-highway capable light-duty trucks is akin to a fleet stringency increase requiring at least 18-months lead time under the statute.” [668]
Subaru expressed concern that this requirement would likely not be achieved for MY 2028 implementation given the planned publication timing of this final rule.[669]
NHTSA recognizes the challenges imposed by near-term reclassification, and in consideration of public comments received from Subaru and others, and its own analysis, NHTSA is finalizing the updated vehicle classification definitions to begin in MY 2030, as discussed in more detail in Section VI.
EISA also requires NHTSA to “issue regulations . . . prescribing average fuel economy standards for at least 1, but not more than 5, model years.” [670]
In the 2020 final rule, NHTSA explained that it interpreted EISA's legislative history to suggest that Congress included the
( printed page 62176)
five-year maximum limitation so NHTSA would issue standards for a period of time where it would have reasonably realistic estimates of market conditions, technologies, and economic practicability (
i.e.,
not setting standards too far into the future because of potential feasibility challenges or the uncertainty surrounding future market conditions).[671]
NHTSA explained, however, that the concerns Congress sought to address by imposing those limitations are not present for nearer model years where NHTSA already has existing standards and noted that revisiting existing standards is contemplated by both 49 U.S.C. 32902(c) and 32902(g). NHTSA stated that the agency therefore believed that it is reasonable to interpret subsection 32902(b)(3)(B) as applying only to the establishment of new standards rather than to the combined action of establishing new standards and amending existing standards.
In addition, NHTSA stated that the statute allows NHTSA to revisit existing standards and separately allows NHTSA to prescribe new standards “for at least 1, but not more than 5, model years” when it “issue[s] regulations.” NHTSA also explained that the statute does not preclude multiple concurrent or quickly sequential rulemakings “issuing regulations” for different periods of time. NHTSA provided as an example that it could issue two separate rulemakings, one amending a single model year's standard and one setting new standards for the five immediately ensuing model years, but this would be an unnecessary waste of resources that could be saved by consolidating agency (and commenter) work into a single rulemaking. For these reasons, NHTSA concluded that its interpretation was reasonable and appropriate.
NHTSA stated in the NPRM that—consistent with the 2020 interpretation—the agency continued to believe that the five-year maximum applies only to rulemakings establishing new standards, and not to, as in this case, the amendment of existing standards. Unlike a situation when NHTSA must be cautious about setting new standards for distant future years, the agency proposed amending standards to rectify placing manufacturers in a situation where they violate standards set at beyond maximum feasible levels due to the consideration of factors in the analysis in a manner inconsistent with subsection 32902(h). Moreover, as in the example NHTSA provided in the 2020 final rule, NHTSA believed that the public interest in efficiency was best served by presenting amendments for all model years under consideration in one notice. NHTSA emphasized in the proposal that two separate analyses were conducted for the MYs 2022-2026 and 2027-2031 standards. It made sense, however, to seek public input on the standards in a single proceeding. In addition, the proposal was the first time that NHTSA's consideration of maximum feasible standards for all model years had appropriately excluded the subsection 32902(h) factors, meaning that it was the first time the public was able to provide comments on a fuel economy standards trajectory for the automotive fleet that appropriately includes only gasoline- and diesel-powered vehicles. Accordingly, NHTSA concluded in the NPRM that it was appropriate to present all years covered by the proposed amendments in one notice.
NHTSA received a considerable number of comments regarding its authority to issue a single rulemaking action covering a ten-year period from MYs 2022 through MY 2031. The Alliance supported the agency's approach, stating its concurrence with NHTSA that the five-year limitation on standard setting does not apply when the agency is amending existing standards.[672]
Conversely, other commenters including SELC, NACAA, NRDC
et al.,
IPI, ZETA, the Attorneys General, Maine Department of Environmental Protection (ME DEP), ALA, and individual commenters, argued that the proposal unlawfully exceeded the agency's statutory authority by regulating ten model years in a single action, in purported conflict with the statutory limitation in subsection 32902(b)(3)(B) that restricts standard setting to “prescribing . . . standards for . . . not more than 5 model years” at a time.[673]
Commenters opposed to the ten-year period focused on the statutory text and the meaning of the word “prescribe.” The Attorneys General argued that the agency is impermissibly reading an exemption into the statute, noting that the statutory text creating the five-year limitation refers generally to “prescribing” standards, without distinguishing between new or amended standards.[674]
The Attorneys General also stated that “prescribe” is the exact verb Congress used to describe the actions NHTSA takes when it sets new standards under subsection 32902(a), as well as when it amends existing standards under subsections (c) and (g).[675]
ZETA and IPI echoed this analysis, asserting that subsection 32902(b)(3)(B) applies whenever NHTSA “issue[s] regulations under this title prescribing average fuel economy standards,” which “naturally” includes any proposed amendments, and that the statute draws no distinction between establishing new standards and modifying existing ones.[676]
Furthermore, the Attorneys General drew a structural comparison to subsection 32902(b)(3)(A)—the requirement for separate passenger and non-passenger standards expressed as mathematical functions—noting that it unambiguously governs both original standards and amendments, and asserting there is no reason why the scope of subsection (b)(3)(B) should be interpreted any differently.[677]
A pair of individual commenters argued that the five-year limit governs the permissible scope of any single rulemaking action, and that to hold otherwise would allow any administration to circumvent the limit simply by labeling its action an “amendment.” [678]
NRDC
et al.
similarly stated that NHTSA's claim that the five-year limit does not cabin its authority to amend past standards is unsupportable because NHTSA “has not, and cannot,” articulate any limiting principle.[679] NRDC et al.
also contended that under subsection (g)(1), any amended standard must independently meet the requirements of subsection (a), which implies that the temporal limitations apply equally to amendments.[680]
Several commenters also challenged the agency's policy and administrative rationales for issuing a ten-year rule. Although NHTSA posited that the statutory five-year cap was primarily intended to prevent the agency from forecasting market and technological conditions too far into the future,
( printed page 62177)
commenters argued that Congress had other clear purposes, such as ensuring periodic reassessments as markets evolve, preventing a single administration from locking in a decade of fuel economy policy, and providing manufacturers with a predictable timeline to prepare compliance strategies.[681]
Furthermore, ZETA, IPI, and Attorneys General disagreed with NHTSA's contention that a consolidated ten-year rulemaking promotes administrative efficiency and preserves resources.[682]
These commenters also maintained that administrative convenience cannot override supposedly unambiguous statutory text, and the Attorneys General suggested that separate rulemakings for multiple five-year periods might be more efficient by allowing the public to better understand and comment on the distinct analyses required for retrospective versus prospective standards.[683]
Commenters also included, with their objections to the ten-year period, arguments against rulemaking covering past model years. NRDC
et al.
and IPI contended that the ten-year scope is a product of the agency's attempt to amend past standards.[684]
IPI noted that otherwise, the rule would cover only the five model years from 2027 through 2031.[685]
NACAA contended that weakening requirements to cover a ten-year period undermines the congressional design of EPCA.[686]
NHTSA disagrees with the commenters who claim that the agency's approach conflicts with the statutory text and purpose. More specifically, NHTSA's interpretation that EPCA allows the agency to amend more than five model years of standards in this rulemaking does not implicate the statute's use of the term “prescribe.” Rather, the five-year limitation applies when NHTSA “issue[s]” new standards, as the agency explained in the 2020 final rule.[687]
But that limitation is not applicable when, under 49 U.S.C. 32902(c), the Secretary “prescribe[s] regulations amending the standard under subsection (b).” The placement of the amendatory authority in a separate subsection of section 32902, one devoid of any temporal limitation, demonstrates that Congress vested the Secretary with the power to amend more than five years of fuel economy standards in a single rulemaking. That multiple subsections use the word “prescribe” does not alter this conclusion.
For the same reasons, NHTSA disagrees with the Attorneys General that, because 49 U.S.C. 32902(b)(3)(A)'s requirements for how fuel economy standards are established—“based on 1 or more vehicle attributes related to fuel economy” and “in the form of a mathematical function”—may apply both to original standards and any amendments, means that 49 U.S.C. 32902(b)(3)(B)'s temporal limitation also applies to any amendments. The amendatory authority conferred by 49 U.S.C. 32902(c) does not include any temporal limitation. As such, the plain and best reading of that subsection, and of the section 32902 as a whole, is that the agency may amend more than five years of standards in a single rulemaking.
The agency also disagrees with these comments regarding the underlying congressional intent and the administrative realities of standard setting. NHTSA examined the Congressional record around the five-year limitation prior to the 2018 NPRM, as explained in the proposal and again above, and concluded that the five-year limit “was intended to prevent NHTSA from setting standards too far into the future, recognizing that predicting the future is difficult.” [688]
This was also reflected in the Congressional record, where it was recognized that the five-year limitation “allows for reasonable and realistic estimates of market conditions, the availability of new and developing technologies, and other considerations of technological and economical practicability.” [689]
Because this combined rulemaking relies on retrospective data for the earlier years and standard prospective forecasting for the later years, it does not implicate this concern. Furthermore, as NHTSA stated in the NPRM, while the agency could satisfy the commenters' narrow reading by initiating multiple concurrent or quickly sequential rulemakings, doing so would unnecessarily waste agency resources. A single rulemaking, supported by separate analyses for the 2022-2026 and 2027-2031 standards, is the most efficient approach administratively and provides the public with a comprehensive view of the CAFE program's trajectory.
As described above, Congress recognized the importance to the economy and automotive industry of correctly balancing statutory factors to establish maximum feasible standards and was particularly cognizant of the risks presented by overly stringent standards. Congress gave NHTSA more flexibility in amending standards in light of new information—especially when necessary to reduce stringency—than in establishing new standards. Applying the five-year restriction to amendments of standards would restrict the agency's ability to correct inappropriate standards—too high or too low.
b. Separate Standards for Passenger Automobiles and Non-Passenger Automobiles
EPCA requires NHTSA to set separate standards for passenger automobiles and non-passenger automobiles for each model year.[690]
Based on the plain language of the statute, NHTSA consistently has interpreted this requirement as preventing NHTSA from setting a single combined CAFE standard for passenger and non-passenger automobiles. EPCA requires separate CAFE standards for passenger and non-passenger automobiles to reflect the different fuel economy capabilities of those distinct types of vehicles; over the history of the CAFE program, this requirement has remained unchanged.
Since 2012, NHTSA has at times proposed or finalized standards for passenger and non-passenger automobiles that increase at different respective rates year over year.[691]
Even if NHTSA set passenger and non-passenger automobile standards previously with the same rates of increase (
i.e.,
percentage increase from the prior years' standard, which could, for example, increase at a rate of 2 percent for both passenger and non-passenger automobiles), the standards themselves were different because of the starting point for each fleet. This
( printed page 62178)
underscores that NHTSA, in fulfilling its obligation to set maximum feasible standards separately for each fleet, is vested with the discretion to do so based on an assessment of each fleet's respective circumstances and a consideration of how the four statutory factors (technological feasibility, economic practicability, the effect of other motor vehicle standards of the Government on fuel economy, and the need of the United States to conserve energy) apply to each fleet.
c. Minimum Standards for Domestic Passenger Automobiles
The 2007 EISA CAFE amendments required NHTSA to begin setting a separate standard for domestically manufactured passenger automobiles.[692]
Unlike the generally applicable standards for passenger and non-passenger automobiles described above, the compliance obligation of the MDPCS is identical for all manufacturers. The statute states that any manufacturer's domestically manufactured passenger car fleet must meet the greater of either 27.5 mpg on average or “92 percent of the average fuel economy projected by the Secretary for the combined domestic and non-domestic passenger automobile fleets manufactured for sale in the United States by all manufacturers in the model year, which projection shall be published in the
Federal Register
when the standard for that model year is promulgated in accordance with [49 U.S.C. 32902(b)].” [693]
Consistent with the statutory language stating that the 92-percent standards must be determined at the time an overall passenger car standard is promulgated and published in the
Federal Register
, NHTSA has also determined that it must recalculate the MDPCS when amending a passenger car standard.[694]
Since the first CAFE rules establishing the MDPCS (the 2008 proposal for MYs 2011-2015 standards and the subsequent 2009 final rule for MY 2011 standards), NHTSA has interpreted “92 percent of the average fuel economy projected by the Secretary” to mean 92 percent of the average fuel economy standard projected by the Secretary.[695]
Accordingly, consistent with NHTSA's longstanding interpretation, the calculated MDPCSs presented in the proposal were based on the projected passenger automobile standards.
The Attorneys General argued that the statute requires the MDPCS to be calculated based on the projected “achieved” average fuel economy of the combined domestic and non-domestic fleets.[696]
The Attorneys General emphasized that EPCA treats “average fuel economy” and “average fuel economy standard” as distinct defined terms, and past agency practice cannot override this clear congressional directive.[697]
The Attorneys General acknowledged that while the “projected standard” methodology was previously a reasonable proxy for projected achieved fuel economy under the agency's prior interpretation of 32902(h), NHTSA's abandonment of that interpretation caused the projected
standard
mpg-value and projected
achieved
mpg-value to diverge significantly, making the prior methodology invalid.[698]
They further argued that the statute's reference to the word “standard” in the second clause of subsection 32902(b)(4)(B) governs only the timing of the minimum standard's publication, not the underlying calculation.[699]
NHTSA disagrees that the statute requires the use of the projected achieved average fuel economy level to calculate the MDPCS. Although “average fuel economy” and “average fuel economy standard” are separately defined terms in 49 U.S.C. 32901, the best reading of “average fuel economy” in 49 U.S.C. 32902(b)(4)(B) is a reference to the method of calculation of “average fuel economy” specified in 49 U.S.C. 32904(a)(1)(B), where the total number of vehicles manufactured by a manufacturer in a model year is divided by the sum of fractions created by dividing each manufacturer's model's production volume by its fuel economy value. Notably, other provisions of EPCA use “average fuel economy” and “average fuel economy standard” to mean the same thing despite their separate definitions in section 32901. For example, 49 U.S.C. 32902(b)(2)(B) equates “average fuel economy” with “average fuel economy standard.” [700]
And 49 U.S.C. 32902(f) states that “When deciding maximum feasible
average fuel economy
under this section, the Secretary of Transportation shall consider technological feasibility, economic practicability, the effect of other motor vehicle standards of the Government on fuel economy, and the need of the United States to conserve energy” (emphasis added). Yet these four factors are the criteria to be used in deciding maximum feasible average fuel economy standards. Furthermore, UCS's proposed approach, to calculate the MDPCS pursuant to 49 U.S.C. 32904(a)(2)(B), would require NHTSA to include the fuel economy of dedicated alternative fueled vehicles. To do so would render meaningless 49 U.S.C. 32902(h)'s prohibition on considering dedicated alternative fueled vehicle fuel economy values in establishing fuel economy standards.
NHTSA also received a comment from UCS stating that the agency cannot “project” a value for the MDPCS for MYs 2022 and 2023 because it is a known quantity.[701]
UCS stated that the agency has certification data for MYs 2022 and 2023, and that MYs 2022-2026 data in its entirety may be available by the time the rule is finalized.[702]
UCS argued that the agency must amend the MDPCS with data it has on hand, “which would require setting the standard at 92 percent of the actual certification level achieved.” [703]
UCS also stated that “given that the agency cannot “project” standards for model years that have already passed, this conflicting requirement is additional evidence that Congress did not seek to grant NHTSA the authority to amend MDPCS retroactively.” [704]
An individual commenter also stated that the prior MDPCS for MY 2027 of 54.2 mpg is the absolute floor for any
( printed page 62179)
standards that DOT adopts going forward.[705]
NHTSA disagrees with the characterization that it cannot establish the MDPCS for MYs 2022 and 2023 simply because those years have already occurred, or that it must use certification data to do so. As established in the June 2025 interpretive rule,[706]
the previous standards for these years were based on a legal interpretation that improperly included prohibited factors under 49 U.S.C. 32902(h). Correcting this error requires the agency to reconstruct a projection of the maximum feasible fuel economy standard for passenger automobiles for the years impacted by this error that have not been closed administratively, specifically excluding the influence of dedicated electric vehicles and other flexibilities.
In response to UCS's comment that the agency may have a complete set of certification data to use for MYs 2022-2026 by the time this rule is finalized, that has not come to pass. While the agency does have some additional pre- and mid-model year fuel economy data, the quality and completeness of this manufacturer-submitted information could not be sufficiently verified such that the agency would rely on that data to set the MDPCS. Such preliminary data typically exhibits meaningful discrepancies when compared to final certification data, which serves as the only verified and conclusive record of actual fleet performance. Consequently, the agency believes that relying on these unverified datasets would introduce unnecessary uncertainty into the standard-setting process and would be inconsistent with the agency's practice of basing its projections on the most robust information available. In addition, for the reasons discussed below, NHTSA cannot legally maintain the prior MDPCS for MY 2027 because that value included electric vehicle fuel economy.
Consistent with NHTSA's longstanding interpretation, the finalized MDPCSs for each model year are based on the projected passenger automobile standards.
NHTSA has also calculated the finalized MDPCSs based on the gasoline- and diesel-powered vehicle fleet. NHTSA believes that doing so is required by EPCA for the reasons discussed in Section V.A.2.e, Factors that NHTSA is Prohibited from Considering, and in the June 2025 interpretive rule,[707]
as discussed in more detail below. In short, EPCA requires that fuel economy standards be established based on vehicles that run on “fuel,” as defined by the statute to include gasoline and diesel fuel.[708]
It is inconsistent with the statute's text to base the MDPCS on vehicles, specifically EVs, that are powered by an “alternative fuel” [709]
and differ fundamentally from the gasoline- and diesel-powered vehicles presupposed by EPCA.
The Attorneys General and UCS commented on this interpretation, objecting to NHTSA's assertion that it is inconsistent with EPCA to include electric vehicles in the domestic minimum calculation.[710]
These commenters argued that EPCA does not presuppose a solely gas- and diesel-powered fleet, but rather explicitly incentivizes alternative-fueled vehicles.[711]
Lastly, they maintained that the statutory calculation fundamentally incorporates EVs and their fuel economy values and noted that subsection (b)(4) is not one of the provisions covered by 49 U.S.C. 32902(h).[712]
NHTSA disagrees with the Attorneys General and UCS's interpretation that the absence of a cross-reference in subsection 32902(h) creates an affirmative mandate to include EVs in the domestic minimum calculation. While EPCA, as amended by AMFA, does provide incentives for alternative-fueled vehicles, these provisions were intended to provide compliance flexibilities, not to redefine the baseline for standard setting. To calculate the domestic minimum using a fleet projection that includes EV fuel economy values while the primary standard excludes them would create an internal inconsistency within the statutory framework. Such an incongruity could result in a domestic minimum “backstop” that is far more stringent than the primary standard, effectively forcing manufacturers to exceed what the agency has already determined based on permissible considerations to be a maximum feasible level.
Furthermore, NHTSA disagrees that the domestic minimum calculation can be divorced from the primary “maximum feasible” passenger car standard it is designed to support. The second clause of subsection 32902(b)(4)(B) requires the agency to publish the domestic minimum standard “when the standard for that model year is promulgated.” Because the “standard” in this clause refers to the generally applicable standards prescribed under subsection 32902(a) or (b)—provisions that are subject to subsection 32902(h)'s exclusion of alternative fueled vehicle fuel economy for standard-setting purposes—it follows that the domestic minimum must share the same analytical foundation. Accordingly, NHTSA has made no updates to the fleet used to calculate the domestic minimum standard for this final rule.
As in the 2020, 2022, and 2024 final rules, NHTSA continues to recognize industry concerns that actual passenger car fleet standards have differed significantly from prior projections, perhaps more so the further that NHTSA projects into the future. In the 2020 final rule, the compliance data showed that the standards projected in the 2012 final rule were consistently more stringent than the actual standards calculated at the end of the model year, by an average of −1.9 percent.[713]
NHTSA stated that this difference indicated that in rulemakings conducted in 2009 through 2012, NHTSA's and EPA's projections of passenger car vehicle footprints and production volumes underestimated the production of larger passenger cars over the MYs 2011-2018 period.[714]
Unlike the passenger car standards and light truck standards, which are vehicle-attribute-based and automatically adjust with changes in consumer demand, the MDPCS is not attribute-based, and therefore it does not adjust with changes in consumer demand and production. Instead, it is a fixed standard established at the time of the rulemaking. As a result, by assuming a smaller than actual average footprint fleet than was ultimately produced, the MYs 2011-2018 MDPCS ended up being more stringent and placed a greater burden on manufacturers of domestic passenger cars than was expected at the time of the rulemakings that established those standards.
In the 2020 final rule, NHTSA concurred with industry concerns over the impact of changes in consumer demand (especially when contrasted against what was assumed in the 2012 rulemaking about future consumer demand for greater fuel economy) on manufacturers' ability to comply with the MDPCS, particularly for those manufacturers that produce larger
( printed page 62180)
passenger cars domestically.[715]
Some of the largest civil penalties for non-compliance in the history of the CAFE program have been paid based on non-compliance with the MDPCS.[716]
NHTSA also expressed concern in the 2020 final rule that consumer demand may shift even more in the direction of larger passenger cars if fuel prices remain low.[717]
NHTSA explained that sustained low oil prices can be expected to have real effects on consumer demand for additional fuel economy, and if that occurs, it is foreseeable that consumers may be even more interested in 2WD crossovers and passenger-car-fleet SUVs (and less interested in smaller passenger cars) than they previously had been.[718]
Therefore, to help avoid outcomes from application of the MDPCS in the MYs 2021-2026 timeframe like those observed over the preceding model years, NHTSA determined that it was reasonable and appropriate to consider the recent projection errors as part of estimating the total passenger car fleet fuel economy for MYs 2021-2026.[719]
Thus, in the 2020 final rule, NHTSA projected the passenger car fleet fuel economy standard for each model year and applied an offset based on the historical −1.9-percent difference identified for MYs 2011-2018.[720]
NHTSA continued to apply the −1.9-percent offset in calculating the MDPCS for the 2022 and 2024 final rules after additional quantitative and qualitative analysis showing the offset, and specifically the −1.9-percent value, was still appropriate and reasonable.[721]
NHTSA noted in the 2022 final rule its concern with the stringency in overall standards for MYs 2024-2026 and the statutorily required increase in CAFE civil penalty rate due to inflation adjustments as reasons why the agency should continue to employ the −1.9-percent offset, specifically if automakers struggling to meet the MDPCS would choose to import their passenger cars rather than produce them domestically.[722]
In the 2024 final rule, NHTSA retained the offset, stating all of the reasons presented previously for the offset continued to apply.[723]
For this rulemaking, NHTSA reviewed the analysis used to calculate the MDPCS offset and updated the analysis to add new data sources and refine the methodology used to calculate the offset value. As described in further detail in Section III of the proposal, NHTSA averaged the relative percentage differences between CAFE Model outputs and actual compliance data for MYs 2017-2023, excluding manufacturers that only produce dedicated alternative fueled vehicles. NHTSA determined that based on this updated assessment the difference between model outputs and actual fleet data was −0.7 percent, less than half of the previously calculated value. The MYs 2027-2031 MDPCSs presented in the proposal accordingly included a recalculated −0.7-percent offset. NHTSA stated that the agency believed that the basis for the offset, the inability to project precisely the mix of vehicles sold in the future, is inapplicable to the finalized MYs 2022-2026 standards because those standards incorporated the most up-to-date data available to the agency for vehicle sales volume and footprint sizes in MY 2022. NHTSA's proposed MDPCS for MYs 2027-2031 included the offset to ensure that the standard reflects industry capabilities while still considering the original intent behind the MDPCS.
PMI commented in support of NHTSA's proposal to recalculate the MDPCS excluding electric vehicles, noting in addition that “[b]y removing the distortion of electric vehicles from the historical data, NHTSA calculates that the necessary offset has dropped from 1.9 percent to 0.7 percent.” [724]
Conversely, the Alliance urged NHTSA to reconsider its proposal to lower the offset from −1.9 percent to −0.7 percent and to restrict its application to MY 2027 and beyond.[725]
The Alliance argued that the offset should also be applied to MYs 2025 and 2026, noting that the agency's reliance on MY 2022 data do not eliminate the inherent uncertainty regarding sales volumes and footprint sizes, given that NHTSA does not have preliminary or final data for those years.[726]
Furthermore, the Alliance recommended retaining the current −1.9-percent offset and deferring any reassessment because the agency's proposed reclassification of large volumes of SUVs and minivans into the passenger car fleet will significantly impact the MDPCS and introduce broad market uncertainties that are not fully accounted for in the current methodology.[727]
In contrast, the Attorneys General commented that neither subsection (b)(4) nor section 32904 authorizes the MDPCS offset.[728]
Instead, they argued that the 8-percent difference inherently built into the 92-percent requirement is the only allowance Congress provided for consumer-driven market shifts.[729]
The agency acknowledges the Alliance's recommendation to maintain the −1.9-percent offset and to expand its application to MYs 2025 and 2026. However, NHTSA continues to believe that a −0.7-percent offset for MYs 2027 and later is the most appropriate and technically driven approach and is maintaining the −0.7-offset as proposed for this final rule. The offset is designed to mitigate the inherent uncertainty that arises when the CAFE Model projects future standards by carrying forward fixed sales volumes and footprint distributions from a baseline fleet. In contrast, for MYs 2022-2026, NHTSA was able to calibrate its analysis using a refined and technically defensible MY 2024 dataset uniquely suited for complex regulatory modeling through rigorous data-cleaning, cross-referencing, and verification exercises to enhance the fidelity of manufacturer-reported information significantly. The proximity of MY 2026 to MY 2024 ensures that any intervening shifts in sales volume or footprint size would be minimal. Consequently, the agency believes that the risk of a significant discrepancy is insufficient to warrant the application of an offset for those years.
Regarding the Attorneys General comment, NHTSA believes that the −0.7-percent offset is a necessary and reasonable adjustment and has continued to employ this significantly reduced offset in the final rule. The offset, which NHTSA calculated with the intent to capture consumer-driven market shifts, serves a different purpose than the 8-percent difference inherently built into the 92-percent requirement, which Congress prescribed with the intent for it to serve as a backstop for domestically manufactured vehicle fuel economy values.
NHTSA presents the final MDPCSs for MYs 2022-2031 in Section III.
( printed page 62181)
d. Attribute-Based Standards Defined by a Mathematical Function
EPCA, as amended by EISA, requires NHTSA to set CAFE standards “based on 1 or more vehicle attributes related to fuel economy and express[ed] . . . in the form of a mathematical function.” [730]
Under attribute-based standards, every vehicle model has a fuel economy target, the levels of which depend on the level of that vehicle's determining attribute. The manufacturer's fleet average CAFE performance is calculated by the harmonic production-weighted average of those targets. This means that no vehicle is required to meet its target; instead, manufacturers are free to balance improvements however they deem best within their fleets.
Although CAFE standards for passenger cars and light trucks must be specified as a mathematical function dependent on one or more attributes related to fuel economy, NHTSA has the authority to select
which
attributes and mathematical functions. Prior to the requirement that CAFE standards be attribute-based and defined by a mathematical function, CAFE standards were instead specified as single mpg values (
e.g.,
27.5 mpg for passenger cars and 20.7 mpg for light trucks). Because these single-mpg standards were wholly independent of fleet composition, these requirements posed a significantly greater technical challenge for manufacturers producing more larger vehicles for the U.S. market than for manufacturers focused on smaller vehicles, because smaller vehicles achieve greater fuel economy levels generally. Therefore, because the standards are fleet-average standards, these single-mpg standards presented an inherent incentive to shift production toward smaller vehicles rather than increasing the application of fuel-saving technologies across entire fleets, meaning that fuel economy benefits would be available primarily to purchasers of smaller vehicles, rather than available broadly to consumers with a more diverse range of vehicle preferences.
In setting attribute-based standards, NHTSA has sought to reflect the trade-off (
i.e.,
the relationship) between the attribute and fuel economy. If the mathematical function establishing the standards captures these trade-offs, every manufacturer is more likely to continue adding fuel-efficient technology across the distribution of the attribute within their fleet, instead of changing the attribute—and other correlated attributes, including fuel economy—as part of their compliance strategy. NHTSA discusses the mathematical function establishing the standards in more detail in Final TSD Chapter 1.
Historically, NHTSA has based standards on the attribute of vehicle footprint, and the agency is continuing to do so in this final rule. As in previous rulemakings, NHTSA is defining the standards in the form of a constrained linear function that sets higher (more stringent) targets for smaller footprint vehicles and lower (less stringent) targets for larger footprint vehicles. NHTSA discusses the footprint curves in more detail in Section II and Final TSD Chapter 1.
e. 35 Miles per Gallon in 2020
Subsection 32902(b)(2)(A) requires the Secretary to “prescribe a separate average fuel economy standard for passenger automobiles and a separate average fuel economy standard for non-passenger automobiles for each model year beginning with MY 2011 to achieve a combined fuel economy average for MY 2020 of at least 35 miles per gallon for the total fleet of passenger and non-passenger automobiles manufactured for sale in the United States for that model year.” [731]
In addition to this requirement, for MYs 2011-2020, standards must “increase ratably.” [732]
For MYs 2021-2030, however, “the average fuel economy required to be attained by each fleet of passenger and non-passenger automobiles manufactured for sale in the United States shall be the maximum feasible average fuel economy standard for each fleet for that model year.” [733]
NHTSA last discussed the 35 mpg in 2020 requirement in the 2020 final rule, where NHTSA stated that “[n]either of these requirements [referring to the 35 mpg in 2020 and increase ratably requirements] apply after MY 2020, so given that this rulemaking concerns the standards for MY 2021 and after, the NPRM stated that they are not relevant to this rulemaking.” [734]
In response to a comment from CARB saying that the 2018 proposal violated the Congressional direction to ratably increase fuel economy, NHTSA concluded that “the statutory language is clear that Congress only directed ratable increases in stringency through MY 2020. After MY 2020, the statutory language is clear that standards simply need be `maximum feasible, as determined by the Secretary.' Some commenters may have disagreed that the proposal represented maximum feasible levels, but there is no statutory basis for arguing that the `ratable increase' requirement extends beyond MY 2020.” [735]
NHTSA did not discuss the 35 mpg in 2020 requirement in the proposal for this rulemaking because the proposal did not suggest amending MY 2020 standards, and as such, that statutory provision continued to be inapplicable to this rulemaking. However, several stakeholders submitted comments on that provision. The Alliance argued that NHTSA is not limited by the historical requirement to achieve 35 mpg by 2020 in setting standards for MYs 2020 and beyond.[736]
The Alliance emphasized that this specific statutory mandate applies strictly to MYs 2011-2020, and because NHTSA is not proposing to revise the previously issued standards for any of those historical model years, the 2020 requirement does not constrain the agency's current action.[737]
Conversely, several commenters, including the ME DEP, NACAA, Lucid, ZETA, and other individual and public interest commenters, objected to the proposed stringency levels, arguing that among other things, they violate the express statutory mandate to require the fleet to reach 35 mpg in MY 2020.[738]
Commenters, like NACAA, emphasized that the proposed rule projects a combined fleet average of 34.5 mpg by MY 2031, which is more than a decade after the statutory deadline and 0.5-mpg below the 35-mpg level Congress required for 2020.[739]
Other commenters, like ZETA, asserted that NHTSA's failure to acknowledge this statutory requirement in the proposal is arbitrary and capricious.[740]
ME DEP and other commenters argued that decreasing standards below this mandated threshold contravenes the stated goals of EISA and moves the United States toward greater gasoline dependency, which purportedly will result in higher consumer costs, increased GHG production, and poorer energy
( printed page 62182)
performance.[741]
Commenters also argued that falling below the 2020 mandate cannot be squared with the agency's ongoing obligation to establish “maximum feasible” standards.[742]
Lucid contended that EISA required the standards to achieve at least 35 mpg by 2020 and then increase to the maximum feasible standard in subsequent years.[743]
Commenters disagreed with NHTSA that the 34.5-mpg target for 2031 was “maximum feasible,” particularly given that the target is lower than the industry's real-world performance in 2024.[744]
The agency recognizes the Alliance's concurrence with NHTSA's interpretation articulated in the 2020 final rule that the specific 35-mpg mandate set forth in 49 U.S.C. 32902(b)(2)(A) was a time-limited directive applicable to the period beginning with MY 2011 and ending with MY 2020. For subsequent years, including the 2022 through 2031 period addressed in this rulemaking, Congress provided a different instruction in subsection 32902(b)(2)(B), requiring that standards be set at the maximum feasible average fuel economy level for each model year. The agency does not interpret the mandate specific to MY 2020 as establishing a permanent statutory floor that precludes the agency from ever setting a standard below that level, if in applying the four statutory factors—for example, accounting for changed circumstances such as vehicle prices under economic practicability or the United States' status as a net petroleum exporter under the need of the United States to conserve energy—and the restrictions of subsection 32902(h) the agency concludes that a different result is more appropriate. In addition, as NHTSA recognized in its notice proposing to grant several low volume manufacturers' petitions for exemption from the industry-wide CAFE standards,[745]
by virtue of creating a corporate average program, that is, one where manufacturers need not comply with individual vehicle models but with their fleet as a whole, Congress accounted for the concept that a manufacturer's fuel economy performance could fluctuate yearly based not only on changes in the fuel economy of each of its models, but also based on changes in the production volumes of those models. There may be situations in which a manufacturer makes no changes to the fuel economy of any of its models from one year to the next, but its fleet average decreases because of changes in the production volumes of the individual vehicle models it produces. This may occur even when a manufacturer makes improvements in the fuel economy of one or more individual vehicle models from one year to the next. Congress also articulated when it did want the agency to increase the standards ratably over a period of time,[746]
but did not do so for the period of model years covered by this rulemaking,[747]
again deferring to the agency to set standards at maximum feasible levels.[748]
Accordingly, NHTSA preliminarily determined in the proposal that the 34.5-mpg projection for 2031 reflected a standard that is maximum feasible for a vehicle fleet powered exclusively by petroleum-fueled, internal combustion engine vehicles without the benefit of credit trading or alternative-fuel accounting.
One individual commenter stated that CAFE standards should stop increasing after MY 2030, as the statutory mandate to promulgate the “maximum feasible” CAFE standard remains, but it becomes far more open-ended after the requirement to “increase” standards ends.[749]
The commenter stated that “given that the U.S. does not have energy conservation needs that would require such a tightening of fuel standards, there is no reason to keep raising the CAFE standard. There have been many past years when NHTSA has not raised standards; it is not statutorily required, and given both the regulatory ambition of recent decades and the fact that any Congressional mandate toward greater stringency is set to expire, NHTSA should give both consumers and industry much- needed relief by halting any increases after Model Year 2030 at the latest.” [750]
NHTSA appreciates this commenter's statutory interpretation and believes that the agency's current approach of resetting standards beginning in MY 2022 in a manner that comports with the statute will provide necessary relief to the industry and consumers. Although the commenter notes that the specific mandate to increase standards for previous model years has passed, the agency remains under a statutory obligation to set average fuel economy standards at the maximum feasible level for each model year. Doing so requires an updated evaluation of factors in every rulemaking, and while this rulemaking increases stringency every year, the statute does not mandate increases in stringency for every rulemaking. NHTSA discusses this evaluation in more detail in Section V.C, below.
2. Maximum Feasible Standards
As discussed, EPCA directs NHTSA to consider four factors in determining what levels of CAFE standards would be maximum feasible.[751]
In the sections below, NHTSA addresses those four factors, in addition to other statutory requirements the agency must consider.
a. Technological Feasibility
Under EPCA, “[t]echnological feasibility” refers to whether a particular method of improving fuel economy is available for deployment in commercial application in the model year for which a standard is being established. NHTSA is not required to account for every technology that might conceivably be applied to improve fuel economy and has considered it unnecessary to do so given that many technologies address fuel economy in similar ways. It is also important to note that technological feasibility and economic practicability (addressed separately below) are often conflated. The question of whether a fuel-economy-improving technology does or will exist (technological feasibility) is a different question from what economic consequences could ensue if NHTSA requires that technology to become widespread in the fleet in the absence of sufficient consumer demand for such technologies (economic practicability). Accordingly, it is conceivable that a standard may be technologically feasible but still beyond the level that NHTSA determines to be maximum feasible due to consideration of economic practicability and the other factors.
NHTSA has long rejected interpretations of the technological feasibility factor that would require NHTSA to set “technology-forcing” standards. NHTSA has recognized that “[i]t is important to remember that technological feasibility must also be balanced with the other of the four statutory factors. Thus, while `technological feasibility' can drive standards higher by assuming the use of technologies that are not yet commercial, `maximum feasible' is still
( printed page 62183)
also defined in terms of economic practicability, for example, which might caution the agency against basing standards (even fairly distant future standards)
entirely
on such technologies” (emphasis original).[752]
NHTSA has also concluded that “as the `maximum feasible' balancing may vary depending on the circumstances at hand for the model years in which the standards are set, the extent to which technological feasibility is simply met or plays a more dynamic role may also shift.” [753]
NHTSA continues to believe that the crucial question on technological feasibility is not whether technologies exist, but rather how much existing technology should be required to be added to new cars and trucks to conserve fuel, and how to balance any additional fuel conserved against the additional cost the mileage requirements will impose on new vehicles. NHTSA has applied this interpretation of technological feasibility over the course of multiple rulemakings.[754]
The agency received a variety of comments regarding its interpretation and application of the technological feasibility factor. The American Fuel & Petrochemical Manufacturers (AFPM) expressed support for the agency's interpretation of technological feasibility, agreeing that the statutory factor refers to the level of fuel economy actually achievable by applying available or reasonably anticipated technologies, rather than what is merely theoretically possible.[755]
AFPM agreed with the agency's position that NHTSA is not required to consider every possible technology when determining feasibility.[756]
Instead, AFPM asserted that the agency must take a holistic, practical approach that balances fuel-saving options against economic practicability, other motor vehicle standards, and the Nation's need to conserve energy, rather than simply mandating that all vehicles use a specific technology.[757]
Other commenters, including ZETA, NRDC
et al.,
Attorneys General, NACAA, and IPI, objected to the agency's interpretation and application of this factor. First, several commenters argued that the agency impermissibly conflated technological feasibility with economic practicability by improperly introducing cost considerations into what should be an independent engineering assessment. The Attorneys General argued that the ordinary meaning of “technological feasibility” calls for a straightforward evaluation of whether a given vehicle technology will improve fuel economy, and that the cost of installing such technology must be considered separately under economic practicability.[758]
Similarly, NRDC
et al.
stated that the agency is internally inconsistent and incorrect in asserting that the “crucial question” is how much existing technology should be required.[759]
Rather, NRDC
et al.
argued that the agency should focus its review on whether the fuel-saving technology is available for commercial deployment and that because the agency's own analysis demonstrates that more stringent standards are feasible using existing technologies, this factor should weigh in favor of stronger standards.[760]
ZETA echoed that the agency improperly conflated this factor with economic practicability.[761]
Second, commenters asserted that the agency's interpretation abandons the purported “technology-forcing” purpose of EPCA. ZETA and the Attorneys General argued that Congress designed fuel economy standards to compel technological development because market forces alone are insufficient to achieve necessary national energy conservation.[762]
They contended that the proposed standards would not materially increase for ten years, relying only on existing technologies and lacking technology-forcing effect.[763]
IPI similarly urged the agency to interpret the statute as requiring the “use of all feasible methods” to encourage the industry to develop new technologies beyond what the market would produce organically.[764]
Third, commenters criticized the agency for purportedly limiting the scope of its technology assessment. NACAA urged the agency to conduct a comprehensive assessment of all proven fuel-saving technologies—including advanced internal combustion engines, mass reduction, aerodynamic improvements, and hybridization/electrification—arguing that they must be included regardless of whether consumers actively demand them.[765]
NACAA stated that excluding proven technologies artificially limits apparent feasibility and results in standards below the “maximum feasible” level.[766]
Furthermore, ZETA and the Attorneys General objected to the agency's assertion that it need not account for every technology simply because many address fuel economy in “similar ways.” [767]
They argued this justification is arbitrary because it fails to define “similar ways” and ignores significant cost differences among technologies.[768]
The Attorneys General also noted that the agency's exclusive focus on technologies “already being commercially applied” constitutes an unexplained departure from past rulemakings, which evaluated all types of technologies capable of improving real-world fuel economy.[769]
NHTSA notes that several commenters appear to have misunderstood the agency's discussion regarding the crucial question to be addressed when evaluating the technological feasibility factor. The agency disagrees with the characterization that this discussion represented a new or restrictive statutory interpretation of the technological feasibility factor itself. Instead, this discussion was intended as supplemental framing to address the practical reality that standard setting involves complex policy considerations. This framing recognizes that while a specific technology might be available in an engineering sense, the agency must still determine the appropriate degree to which that technology is sufficiently mature and developed to be deployed across the fleet to achieve a fuel economy standard during the rulemaking period.
This contextualization does not change the underlying application of the technological feasibility factor, which continues to involve an assessment of whether a given technology is available for commercial deployment or reasonably expected to be available during the rulemaking period. The agency continues to perform robust engineering analysis to identify proven fuel-saving technologies, including all technologies that NACAA listed in their
( printed page 62184)
comment,[770]
with the exception of electrification or other alternative fuel technologies that NHTSA is prohibited by statute from considering. However, the mere existence of feasible advanced technologies does not and cannot mandate that NHTSA set standards maximizing their application in the fleet, because the agency's obligation is to balance
competing
statutory factors to set maximum feasible standards in light of existing and expected circumstances. For example, even if a given technological pathway may be feasible, the statutory mandate that NHTSA consider economic practicability in setting standards requires that the agency evaluate cost ramifications and manufacturer refresh and redesign cycles to determine whether standards that tend toward implementation of that pathway would be appropriate in a rulemaking. By clarifying that technological feasibility does not require the agency to set technology-forcing standards, NHTSA is simply acknowledging the multi-factored balancing mandated by Congress. This is quite different than some regulatory schemes, generally in the environmental space, that require agencies to maximize stringency to the point technologically feasible.[771]
Unlike such regulatory schemes, EPCA requires NHTSA to take a balanced approach, with feasible technological possibilities representing just one factor to be weighed against others, including economic and energy-related factors that may counsel toward greater or lesser stringency depending upon the circumstances.
Regarding comments on the agency's alleged duty to set technology-forcing standards, NHTSA notes that those comments were previously addressed in the 2012 and 2020 final rules,[772]
and have since been incorporated in NHTSA's interpretation of the technological feasibility factor in every subsequent rulemaking. NHTSA's interpretation of the statute has not changed.
NHTSA also disagrees with commenters that the agency limited the scope of technologies considered in this rulemaking, and that the agency's technology assessment represents an unexplained departure from prior assessments. NHTSA has long maintained—specifically in response to identical comments—that the agency need not account for every conceivable fuel economy technology in its analysis.[773]
In the 2020, 2022, and 2024 final rules, NHTSA used the example of high-speed flywheels as potential energy storage devices for hybrid vehicles: “while such flywheels have been demonstrated in the laboratory and even tested in concept vehicles, commercially available hybrid vehicles currently known to NHTSA use chemical batteries as energy storage devices, and the agency has considered a range of hybrid vehicle technologies that do so.” [774]
NHTSA provided additional examples in the 2020 final rule in response to comment, including an example where one entirely speculative set of engine technologies was not modeled because proven combinations of technologies existed that provided similar fuel economy improvements.[775]
NHTSA did not receive comments on the same interpretation in the 2022 or 2024 final rules.
The 2024 final rule and the 2025 proposal also discussed different technologies that improve fuel economy in similar ways in the context of technology effectiveness modeling. NHTSA provided the example that both turbocharging and cylinder deactivation technology improve fuel economy by reducing engine displacement and therefore using less fuel.[776]
In contrast to the high-speed flywheel example, which represented a technology that the agency determined was better represented by a range of other types of hybrid technologies not merely in a laboratory or concept stage, NHTSA has continued to model several levels of turbocharging and cylinder deactivation technologies because both are prevalent in the fleet currently and are expected to continue to be in use or available for application on additional vehicles in the rulemaking timeframe.
NHTSA also exercises deliberate caution when expanding the suite of technologies included in its modeling, as each addition to the CAFE Model's technology pathways creates a substantial increase in computational complexity. As the agency has previously detailed, incorporating one singular additional technology option necessitates approximately 100,000 additional physics-based full-vehicle simulations through the Autonomie tool. As an example, adding ten technologies would effectively double the analytical workload to roughly two million simulations. Despite this necessary selectivity, the agency's existing technology tree remains remarkably comprehensive, featuring nearly thirty variants of advanced internal combustion and hybrid powertrain configurations, as well as multiple tiers of advanced transmissions and road load reduction levels. By iterating these options across ten distinct technology classes, the agency's assessment evaluates an expansive matrix of current and projected vehicle technology combinations. Although NHTSA remains open to incorporating
( printed page 62185)
additional technologies based on public comment, the agency and commenters have yet to identify a “silver bullet” gasoline or diesel technology—including those in the research phase—that demonstrates a cost or effectiveness advantage over the robust set of technologies already utilized in the agency's analysis.
NHTSA addresses additional comments on how the agency balanced technological feasibility in determining the final standards below.
b. Economic Practicability
NHTSA has long interpreted “[e]conomic practicability” to focus on whether a standard is one “within the financial capability of the industry, but not so stringent as to” lead to “adverse economic consequences, such as a significant loss of jobs or the unreasonable elimination of consumer choice.” [777]
In evaluating economic practicability, the agency considers the uncertainty surrounding future market conditions and consumer demand for fuel economy alongside consumer demand for other vehicle attributes. NHTSA has explained in the past that this factor can be especially important during rulemakings in which the auto industry is facing significantly adverse economic conditions, with a corresponding risk of significant job losses. Consumer acceptability is also a major component of economic practicability,[778]
which can involve consideration of anticipated consumer responses not just to increased vehicle cost, but also to the way manufacturers may change vehicle models and vehicle sales mix in response to CAFE standards. In attempting to determine the economic practicability of attribute-based standards, NHTSA considers a wide variety of elements, including the annual rate at which manufacturers can increase the percentage of their fleet that employs a particular type of fuel-saving technology, as well as manufacturer fleet mixes. NHTSA also considers the effects on consumer affordability resulting from costs to comply with the standards and consumers' valuation of fuel economy, among other things.
NHTSA's consideration of economic practicability involves several elements. These include expected availability of capital to make investments in new technologies and production facilities; manufacturers' expected ability to sell vehicles with certain technologies; likely consumer choices; and other elements. NHTSA's analysis also incorporates assumptions to capture aspects of consumer preferences, vehicle attributes, safety, and other elements relevant to an impacts estimate. The agency accounts for safety as closely related to, and in some circumstances a subcomponent of, economic practicability. Because manufacturers have finite resources to invest in research and development, investment into the development and implementation of fuel-saving technology necessarily comes at the expense of investing in other areas, such as safety technology. Moreover, when making decisions on how to equip vehicles, manufacturers must balance cost considerations to avoid pricing more consumers out of the market. As manufacturers add technology to increase fuel efficiency, they may decide against installing additional safety equipment to reduce cost increases. As the prices of new vehicles increase beyond the reach of more consumers, these consumers continue to drive or purchase older, less safe used vehicles. In assessing economic practicability, NHTSA thus also considers the harm to the U.S. economy caused by highway fatalities and injuries.
The agency received a variety of comments regarding its interpretation and application of “economic practicability.” Commenters supporting the agency's approach, including the AmFree and Corn Growers Associations and one individual commenter, agreed that the economic practicability analysis must account properly for vehicle affordability and consumer choice.[779]
AmFree and Corn Growers Associations contended that a standard is not practicable if it causes adverse economic consequences like the unreasonable elimination of buyer choice.[780]
From the supplier perspective, MEMA urged the agency to take a measured approach that provides regulatory stability, requesting that NHTSA account for the economic practicability of stranded investments and warning that uncertainty could limit U.S.-based research and development.[781]
Conversely, commenters including NRDC
et al.,
IPI, ZETA, and the Attorneys General, opposed the agency's interpretation, arguing that it unlawfully subordinates the statute's goal of energy conservation to consumer preference and upfront costs.[782]
NRDC
et al.
argued that the agency inexplicably departed from its historical framing—which evaluated whether standards were within the industry's financial capability without causing substantial hardship—in favor of an approach that attempts to correct “market distortions,” to provide automakers with improper relief for past investments, and to preserve the ability for manufacturers to focus on non-fuel efficiency related issues, such as safety, affordability, and consumer choice.[783]
These commenters cited the D.C. Circuit's decision in
Center for Auto Safety
v.
NHTSA,
arguing that it is impermissible for the agency to rely on consumer demand to such an extent that it ignores the overarching goal of fuel conservation.[784]
IPI and the Attorneys General also stated that NHTSA arbitrarily prioritized reducing upfront vehicle costs over substantial long-term fuel savings.[785]
NRDC
et al.,
ZETA, and the Attorneys General also opposed the classification of safety under economic practicability, arguing it lacks a statutory basis and departs from prior agency practice.[786]
NRDC
et al.
argued that safety considerations, while a legitimate priority, are not appropriately part of the agency's economic practicability calculus. The Attorneys General noted that Congress already specified the precise and limited role safety should play in standard setting under subsection (f), which requires the agency to consider only whether separately adopted safety regulations limit the fuel economy improvements automakers could apply.[787]
Both commenters contended that by elevating safety in this manner, the agency unlawfully substituted a non-statutory goal in place of the statute's express
( printed page 62186)
objective to maximize fuel economy.[788]
NRDC
et al.
also argued that NHTSA incorrectly relied on the court's statement in
Competitive Enterprise Institute
v.
NHTSA
to justify its consideration of safety as a subcomponent of economic practicability, when the court merely recognized that NHTSA had historically considered safety in some form when setting CAFE standards.[789]
ZETA commented that NHTSA had not provided support for the assertion that there is a tradeoff between investing in safety and fuel economy, and further that it is not necessarily true that is the case.[790]
NHTSA has considered the comments regarding its interpretation and application of the economic practicability factor and continues to believe that its approach is consistent with its long-standing statutory authority and the specific statutory goals. NHTSA disagrees with the characterization that the agency has elevated improperly vehicle affordability and consumer choice over the objective of energy conservation. The agency's approach to setting these standards remains not only well within the bounds of the D.C. Circuit's decision in
Center for Auto Safety
v.
NHTSA,[791]
but these elements also represent key components of the factor. Although the agency may not rely on consumer demand to the extent that it ignores fuel conservation, Congress tasked NHTSA with consideration of
all
enumerated factors in setting maximum feasible standards. A standard that results in severe economic disruption or makes vehicles unaffordable for a significant segment of the population cannot be considered economically practicable, even if technological pathways exist that make it possible to produce a fleet that complies with the standard. NHTSA must ensure that its standards do not result in serious market distortion, including situations where consumers are unable to find vehicles that meet their functional needs or where the cost of compliance results in price increases that would force consumers out of the market or force manufacturers to restrict essential investments in critical areas, including safety.
NHTSA disputes the assertion that the agency has departed from its historical framing of economic practicability and notes that the financial capability of the industry has always been a core component of this analysis.[792]
Evaluating whether a standard causes substantial hardship involves an assessment of the market environment in which manufacturers operate, in addition to accounting for stranded investments and the need for regulatory stability, as noted by MEMA. NHTSA's analysis accounts for the concepts of vehicle technology investments quantitatively by assuming specific refresh and redesign years for specific vehicle models and shared technologies across vehicle models, as discussed in more detail above, and the agency also discusses in this section other factors related to stranded investments.
By ensuring that standards are set at levels that allow for the orderly application of technology and of U.S.-based research and development, the agency avoids creating the very hardships that the economic practicability factor was intended to prevent. NHTSA does not view its consideration of upfront vehicle costs as an arbitrary prioritization over long-term fuel savings, but rather as a necessary recognition of the budget constraints faced by many American households. If the upfront cost of fuel-efficient technology, combined with associated increased costs of insurance, taxes, and fees prevents a consumer from purchasing a new, more efficient vehicle, the projected long-term fuel savings and safety benefits of that vehicle—which accrue across multiple owners over a modeled 30-year period—will never be realized in the real-world fleet. The agency remains committed to energy conservation and believes that its current interpretation of economic practicability provides the most robust framework for achieving meaningful, long-term improvements in the fuel economy of the Nation's passenger car and light truck fleet in a way that comports with statutory legal restrictions while maintaining a healthy and competitive automotive market.
The agency also disagrees with the assertion that considering safety in this context lacks a statutory basis or unlawfully substitutes a non-statutory goal for the objective of energy conservation. While subsection 32902(f) explicitly directs the agency to consider the effects of other Federal motor vehicle standards, such as safety regulations, on fuel economy, this does not preclude the agency from considering the inherent relationship between fuel economy and vehicle safety under the broader umbrella of economic practicability. NHTSA maintains that the standard is not economically practicable if it forces a technological trade-off that compromises public safety or restricts manufacturer's ability to continue innovating in safety-critical areas.[793]
Safety is not a competing interest to be balanced against fuel economy, but rather an integral component of the manufacturing and design process that dictates what is practically achievable for manufacturers.
Finally, in response to comments suggesting that the agency incorrectly relied on
Competitive Enterprise Institute
v.
NHTSA
to assess safety elements under the economic practicability factor, NHTSA clarifies that it did not rely explicitly on that case as the sole legal justification for its interpretation. Although the court in that case did recognize that NHTSA has historically considered safety when setting standards, the agency's authority to do so is derived directly from the statutory directive to consider the economic practicability of any proposed fuel economy level. “Economic practicability” encompasses the safety implications of fuel economy standards because a standard that leads to increased fatalities or injuries would impose significant societal and economic costs that the agency should and does consider in its decision-making.
NHTSA discusses additional comments related to how the agency balanced economic practicability in setting the final standards below.
( printed page 62187)
c. The Effect of Other Motor Vehicle Standards of the Government on Fuel Economy
The effect of other motor vehicle standards of the Government on fuel economy involves analysis of the effects of compliance with emission, safety, noise, or damageability standards on fuel economy capability and thus on average fuel economy. From the CAFE program's earliest years until recently,[794]
the effects of compliance with such standards on fuel economy capability over the history of the CAFE program have been negative ones. For example, safety standards that have the effect of increasing vehicle weight typically lower fuel economy capability, thus decreasing the level of average fuel economy that NHTSA can determine to be feasible. For recent CAFE analyses, including the analysis accompanying these final standards, NHTSA has captured the added weight due to safety standards in baseline vehicle mass estimates. There are no safety standards with compliance dates within the time period of this action expected to impose further effects on light-duty vehicle mass. NHTSA had also previously considered EPA's motor vehicle emissions standards set pursuant to the CAA when both agencies had set separate yet related standards in joint rules. However, this final rule does not incorporate any non-criteria emissions standards due to EPA's rescission of its Endangerment Finding and all resulting GHG emissions standards for light-, medium-, and heavy-duty vehicles and engines.[795]
In the proposal and June 2025 interpretive rule NHTSA also elaborated the agency's approach to standards set by the California Air Resources Board (CARB).[796]
Regardless of whether NHTSA explicitly considered those standards previously as “other motor vehicle standards of the Government” or otherwise, NHTSA now explicitly rejects such consideration. For the reasons explained in the proposal and reiterated in this section, CARB's standards are not “other motor vehicle standards of the Government on fuel economy.”
NHTSA stated in the proposal that the agency believed that the best interpretation of the text of EPCA rebuts the conclusion that CARB's standards appropriately are considered under this subsection 32902(f) factor. As a threshold textual matter, statutory references to “the Government” are most naturally understood to denote the United States Federal Government, rather than other governments, including State governments. EPCA uses the singular “the Government,” which refers to the Federal Government, consistent with the 1994 recodification discussed below. This reference likely reflects that only the Federal Government has authority to set standards “on fuel economy,” as EPCA itself provides. Therefore, even if California were held to have authority to set vehicle emission standards pursuant to a waiver under the CAA, for purposes of the maximum feasibility determination, such standards should not be considered because they are not standards of “the Government,” as that term is used in EPCA. Congress easily could have referred to standards set by “a government” if it sought to authorize NHTSA to consider State standards in the maximum feasible determination. Congress did not do so.
NHTSA also described in the proposal how EPCA's history buttresses the plain meaning of the text. As initially passed in 1975, EPCA mandated average fuel economy standards for passenger cars beginning with MY 1978. The law required the Secretary of Transportation to establish, through regulation, maximum feasible fuel economy standards for MYs 1981-1984 with the intent to provide steady increases to achieve the standard established for 1985 and thereafter authorized the Secretary to adjust that standard. For the statutorily established standards for MYs 1978-1980, EPCA provided each manufacturer with the right to petition for changes in the fuel economy standards applicable to that manufacturer, based on the application of other Federal standards.[797]
A petitioning manufacturer had the burden of demonstrating that a “Federal fuel economy standards reduction” was likely to exist for that manufacturer in one or more of those model years and that it had made reasonable technology choices. “Federal standards,” for that limited purpose, included not only safety standards, noise emission standards, property loss reduction standards, and emission standards issued under various Federal statutes, but also “emissions standards applicable by reason of section 209(b) of [the CAA].” Critically, all definitions, processes, and required findings regarding a Federal fuel economy standards reduction were located within a single self-contained subsection of 15 U.S.C. 2002, which applied only to MYs 1978-1980.[798]
In 1994, Congress recodified several laws related to transportation. As part of this recodification, the CAFE provisions were moved to title 49 of the United States Code. In doing so, unnecessary provisions were deleted. Specifically, the recodification eliminated subsection (d). The House report describing the recodification declared that the subdivision was already “executed,” and described its purpose as “[p]rovid[ing] for modification of average fuel economy standards for MYs 1978, 1979, and 1980.” [799]
It is generally presumed, when Congress includes text in one section and not in another, that Congress knew what it was doing and made the decision deliberately. As part of the same recodification, the relevant language now found at 49 U.S.C. 32902(f) changed from “effect of other
Federal
motor vehicle standards on fuel economy” to “effect of other motor vehicle standards of
the Government
on fuel economy” (emphasis added).[800]
The Senate report accompanying the legislation clarified that “`United States Government' is substituted for `United States' (when used in referring to the Government), `Federal Government', and other terms identifying the Government the first time the reference appears in a section. Thereafter, in the same section, `Government' is used unless the context requires the complete term to be used to avoid confusion with other governments.” [801]
Accordingly, consistent with the statutory intent and text, NHTSA stated in the proposal that the agency limited its consideration to the effect of other Federal motor vehicle standards on fuel economy.
In addition, as NHTSA explained in the proposal, under EPCA's blanket preemption provision, States may not adopt or enforce regulatory requirements related to fuel economy standards.[802]
This preemption mandate holds true regardless of whether EPA has granted waivers for emissions requirements under the CAA. In addition, the President has signed into law three resolutions adopted by Congress under the Congressional Review Act (CRA) to disapprove waivers EPA granted under CAA section
( printed page 62188)
209,[803]
including for, as is relevant to the model years and vehicle classes under consideration in this final rule, EPA's notice of decision granting CARB's request for a waiver of Clean Air Act (CAA) preemption for the Advanced Clean Cars II regulations for light-duty vehicles.[804]
In addition, to the extent that CARB purports to enforce its CO2
emission standards or ZEV mandate to any model years, including for MYs 2025 and beyond, those standards are preempted and unenforceable under EPCA, regardless of their waiver status under the CAA.[805]
Given the above, CARB standards cannot be justified as policies properly incorporated in the analytical baseline for EPCA purposes.
The agency received several comments on the interpretation that State standards are not “other motor vehicle standards of the Government” for purposes of EPCA and that certain standards related to CO2
emissions and zero emission vehicles are preempted. The API commented that “NHTSA is correct in not considering vehicle emissions standards previously set by the California Air Resources Board (CARB), or any other State,” as “[n]ot only did Congress revoke the waivers that allowed CARB to enforce its State regulatory programs, the term “the Government” clearly is a reference to the Federal Government and cannot reasonably be construed as including State or local governments.” [806]
API also stated that they supported NHTSA's proposal to not incorporate EPA's non-criteria emissions standards.[807]
Other commenters, including NRDC
et al.
and the Attorneys General, opposed the agency's interpretation that the term is limited exclusively to standards issued by the Federal Government.[808]
NRDC
et al.
contended that NHTSA's reinterpretation contradicts the statute's plain text and legislative history, arguing that because the 1994 recodification was explicitly intended to restate the law without substantive change, the phrase “other motor vehicle standards of the Government” must retain the scope of the original 1975 EPCA text.[809]
This original text, specifically within the Section 502(d) modification provisions for MYs 1978-1980, unequivocally defined “Federal standards” to include EPA-approved California emissions standards, a legal incorporation NRDC
et al.
asserted remains binding despite the later removal of those specific model-year provisions.[810]
Consequently, they argued that NHTSA's current exclusion of California standards impermissibly reads a restrictive limitation into the statute that is unsupported by the historical record and violates established canons of construction against adding words to a statute that do not appear on its face.[811]
The Attorneys General also rejected NHTSA's argument that the singular article in “the Government” restricts the meaning solely to the Federal Government, arguing that such a reading makes no sense given the provision's clear object to account for the effects of all criteria pollutant emissions standards that reduce fuel economy, which they stated California has specific authority to set.[812]
Commenters also criticized the agency for an unjustified and inadequately explained departure from decades of past practice. Both NRDC
et al.
and the Attorneys General pointed out that NHTSA has consistently considered California's standards under this factor across multiple previous administrations.[813]
NRDC
et al.
argued that the agency failed to offer any practical or logical reason why Congress would have prohibited the consideration of CARB standards, given that they are mandatory legal obligations applying to automakers during the rulemaking timeframe.[814]
Furthermore, NRDC
et al.
asserted that NHTSA entirely ignored Federal case law, specifically citing the
Green Mountain
and
Central Valley
decisions, which explicitly considered and rejected the agency's newly proposed interpretation.[815]
Commenters also stated that though California's ZEV standards are subject to litigation and EPA had (at the time of the comment period) proposed to rescind GHG standards, these standards remain in effect and NHTSA must consider them, in addition to considering that California and the “Section 177” States [816]
may increase the stringency of their standards or penalties for non-compliance in response to NHTSA's weakening of the CAFE standards.[817]
NHTSA has carefully considered the comments regarding its interpretation of the phrase “other motor vehicle standards of the Government” under 49 U.S.C. 32902(f). NHTSA continues to believe that the most natural reading of the current statutory text, which refers to standards of “the Government,” refers to the United States Government. The 1994 recodification was intended to be non-substantive, and the accompanying Senate report specifically states that the term “Government” means the Federal or United States Government in subsequent sections. Furthermore, even if the historical statutory language were read to encompass certain State-level requirements, such consideration would be moot in the present context because there are currently no operative California standards that would impose additional, non-redundant obligations on manufacturers beyond the Federal requirements accounted for in this analysis. As discussed above, to the extent CARB purports to enforce its CO2
emission standards or ZEV mandate to any model years, including for MYs 2025 and beyond, those standards are preempted and unenforceable under EPCA, regardless of their waiver status under the CAA.[818]
The agency also disagrees with the assertion that this interpretation constitutes an inadequately explained departure from past practice. While NHTSA has considered California standards in various capacities in previous rulemakings, the agency has not considered California standards in every past rulemaking.[819]
NHTSA is not prohibited from refining its legal interpretations to align more faithfully with the language of the statute. NHTSA also recognizes the commenters' references to district court decisions in
( printed page 62189)
Green Mountain
and
Central Valley;
NHTSA addressed those decisions in the SAFE I proposal, concluding that the agency did not agree with the district courts' preemption analysis, which suggested an apparent misunderstanding of the underlying concerns and the requirement to consider other standards.[820]
Additional discussion of the agency's assessment of those decisions is located in the SAFE I proposal.[821]
The agency maintains that those decisions do not foreclose NHTSA from re-evaluating its own statutory interpretation, particularly as the legal landscape surrounding Federal preemption and State regulatory authority continues to evolve. Lastly, regarding the comment that NHTSA must factor in the possibility that California or Section 177 States may increase the stringency of their standards or penalties in response to this rulemaking, NHTSA disagrees. Not only are State-level fuel economy standards and associated penalties unlawful and unenforceable, but the agency has no duty to model hypothetical future regulatory reactions, regardless of their purported legality or enforceability.
d. The Need of the United States To Conserve Energy
NHTSA has historically interpreted “the need of the United States to conserve energy” to mean “the consumer cost, national balance of payments, environmental, and foreign policy implications of our need for large quantities of petroleum, especially imported petroleum.” [822]
(1) Consumer Costs and Fuel Prices
Regarding NHTSA's consideration of the need for energy conservation, fuel purchases for vehicles are costly to vehicle owners and operators. Projections of future fuel prices help NHTSA to determine the value of fuel savings both to new vehicle buyers and to society and the amount of fuel economy that the new vehicle market is likely to demand in the absence of new standards. Future fuel prices also inform NHTSA about “the consumer cost . . . of our need for large quantities of petroleum.” [823]
In this final rule, NHTSA's analysis relies on fuel price projections from EIA's AEO for 2026, Alternative Electricity and Alternative Transportation Combination case.[824]
Federal agencies generally use EIA's price projections in their assessment of future energy-related policies.
(2) National Balance of Payments
The need of the United States to conserve energy has historically included consideration of the “national balance of payments” because of concerns that importing large amounts of oil created a significant wealth transfer to oil-exporting countries and left the U.S. economically vulnerable.[825]
In the 20th and early 21st centuries, the U.S. trade deficit was driven mainly by petroleum.[826]
As recently as 2009, almost half of the deficit was composed of petroleum imports.[827]
However, this concern has largely abated in the timespan of more recent CAFE rulemakings, in part because other factors besides petroleum consumption have since played a bigger role in the U.S. trade deficit, and because of the substantial rebalancing of international petroleum markets largely driven by shale oil productivity in the United States. In light of significant increases in U.S. oil production and corresponding decreases in oil imports, this concern is likely to remain less pronounced for the foreseeable future.[828]
Increasingly, changes in the price of fuel have come to represent transfers between domestic consumers of fuel and domestic producers of petroleum rather than gains or losses to foreign entities.
Though total energy independence is not possible for any country that participates in the global energy market, the fact that the U.S. is now a net oil exporter reduces risks from global price fluctuations. Even if the U.S. consumed only domestically produced petroleum and continued to export, the U.S. economy would still be subject to oil price fluctuations due to external events and situations. But changes in the oil market mean that the risk of damage to the U.S. economy and of potential strain on U.S. drivers is lower than it was in previous decades. To be sure, risk still exists, and both production and consumption of oil are relevant to how significant that risk might be. But the risk is much lower than it would have been in the absence of the rapid growth in U.S. oil production, and this diminished risk means that the need of the U.S. to conserve energy is significantly less than it was at earlier points in the history of the program.
PMI commented that the need of the United States to conserve energy should be given limited weight because the Nation's status as a net exporter of petroleum significantly reduces the energy security risks the statute was originally designed to address.[829]
PMI stated that conservation under EPCA should be viewed as insurance against global supply shocks rather than a mandate for scarcity, as domestic abundance provides the economic insulation once sought through more aggressive consumption reductions.[830]
One individual commenter also agreed that the energy conservation factor should be weighed differently now that the United States produces more energy than it consumes.[831]
The commenter noted that while energy security remains important, the geopolitical and security implications of U.S. energy usage underwent a revolution in 2019 when the shale boom transitioned the country from a net importer to a net exporter.[832]
The commenter argued that this fundamentally altered the landscape that existed when Congress originally passed EPCA in 1975 and EISA in 2007, during a 60-year period when the Nation consumed more energy than it produced.[833]
Conversely, commenters including NRDC
et al.,
ZETA, and the Attorneys General, opposed the agency's reliance on the Nation's net exporter status to weigh less heavily the national balance of payments and foreign policy
( printed page 62190)
considerations.[834]
First, these commenters asserted that the United States remains highly susceptible to global oil market volatility, arguing that increased domestic oil production does not insulate consumers from global price shocks.[835]
Commenters noted that the United States still relies heavily on foreign oil, importing millions of barrels of crude oil per day, with ZETA specifying approximately 8 million barrels per day,[836]
and NRDC
et al.
citing 6.48 million barrels per day in 2023.[837]
The Attorneys General emphasized that imports remain particularly critical for areas not well connected to domestic production, such as the West Coast and Hawai'i, the latter of which lacks domestic petroleum sources and relies on imports for roughly 80 percent of its energy consumption.[838]
Second, commenters pointed to recent geopolitical events as evidence of the Nation's ongoing vulnerability to supply shocks. NRDC
et al.
and the Attorneys General cited the surge in crude oil prices following Russia's 2022 invasion of Ukraine, as well as recent U.S. operations in Venezuela aimed at securing oil to reduce domestic prices.[839]
The Attorneys General further argued that NHTSA's premise of diminished energy risk is contradicted by the President's recent declaration of a “national energy emergency,” which explicitly cited inadequate domestic energy production and transportation capacity as an ongoing threat.[840]
Furthermore, the Attorneys General criticized NHTSA's rationale that fuel purchases represent a transfer between domestic consumers and producers; they argued it is implausible to treat increased profits for oil companies as an even trade for the negative economic consequences of adding cost pressures and price-shock exposure to everyday American households.[841]
NHTSA has considered the comments regarding the need of the United States to conserve energy and the agency's assessment of how the Nation's transition to a net petroleum exporter affects the weighing of this factor. As an initial matter, the agency recognizes that the statutory landscape governing the CAFE program was shaped during periods of relative energy scarcity and significant reliance on foreign petroleum. NHTSA agrees with PMI and other commenters that the United States shale revolution and the Nation's subsequent shift in 2019 to a net exporter status represent a fundamental change in the national energy profile that the agency must account for when determining the maximum feasible average fuel economy levels.
Historically, the national balance of payments was a primary driver of the need to conserve energy, as the massive outflow of capital to oil-exporting nations created systemic economic vulnerabilities. With the U.S. now producing record levels of crude oil and experiencing a substantial rebalancing of international markets, the macroeconomic risk associated with a wealth transfer to foreign entities has diminished. This shift supports NHTSA's view that the agency may weigh the “need of the United States to conserve energy” differently than the agency had weighted it in 1975 or 2007.
NHTSA recognizes the persistence of global market volatility and its impact on American consumers. The agency acknowledges, as it did in the proposal, that net exporter status does not equate to total energy insulation or price immunity. Geopolitical conflicts, including those in or near oil producing regions,[842]
could result in short-term volatility in global oil markets because they introduce sudden uncertainty regarding supply continuity and maritime transit security. These events lead to price spikes driven by both physical disruptions and speculative trading, which could strain the domestic economy. That said, global energy markets are increasingly resilient in light of geopolitical conflicts compared to historic events.[843]
In contrast, the CAFE program is a long-term structural intervention designed to address the underlying demand for petroleum by establishing fuel efficiency of the national fleet. CAFE standards can lower the baseline energy intensity of the U.S. economy, providing a hedge against price trends over decades, but are neither intended nor suited to manage transient fluctuations of a global commodity market.
Regarding the criticism of the agency's characterization of fuel price changes as transfers between domestic producers and consumers, NHTSA clarifies that this perspective is not a dismissal of consumer hardship, but rather a recognition that, as discussed in more detail in TSD Chapter 6, from a national accounting perspective, when a domestic consumer pays more for fuel produced within the U.S., that money remains within the domestic economy rather than being transferred to a foreign producer. NHTSA emphasizes that the standards established in this final rule consider consumer impacts of fuel costs by giving weight to economic practicability in considering upfront vehicle costs.
Ultimately, NHTSA must strike a balance between the reality of increased domestic abundance and the lingering risks of global market integration. As discussed below regarding the level of final standards, NHTSA has weighed the conservation of energy not as a response to an era of scarcity, but as a strategic tool to enhance economic resilience and reduce the exposure to a volatile global commodity, in light of the Nation's status as a net exporter.
(3) Environmental Effects
NHTSA has considered environmental effects in setting CAFE standards, in some cases in the context of the need of the United States to conserve energy, in the context of the agency's regulatory impact analysis and associated obligations under Circular A-4, and in the context of NEPA.[844]
In addition to discussing how these effects are weighted in NHTSA's balancing of maximum feasible standards for this final rule, discussed below, NHTSA also summarizes information related to the environmental effects of this final rule in Chapter 8.2.5 of the FRIA, and in the section below titled “National Environmental Policy Act.” For more detail on the NEPA analysis conducted in conjunction with this final rule, please refer to the accompanying Final SEIS.
In the proposal, NHTSA sought comment on whether Congress had given it authority under EPCA to consider environmental effects when setting fuel economy standards. NHTSA stated that EPCA's charge is for the agency to set maximum feasible fuel economy standards to reduce national
( printed page 62191)
vulnerability to supply shocks while balancing statutory factors—none of which includes environmental effects. Among those statutory considerations is the effect of other Federal Government standards on fuel economy. NHTSA stated that the agency had traditionally considered the fact that the vehicles NHTSA regulates are also subject to compliance obligations under EPA's criteria emission standards (
e.g.,
mass attributable to adding a catalytic converter) in setting fuel-economy standards. This is appropriate since EPA is the Federal environmental regulator. NHTSA noted that the agency is not an environmental regulator, and Congress directed NHTSA to consider the impact of regulations established by Federal environmental regulators (
i.e.,
in practice, primarily EPA) on fuel economy when establishing standards. NHTSA also stated that the question of the appropriateness of NHTSA's historic consideration of environmental effects when setting fuel economy standards has become more relevant considering the United States' recent emergence as a net petroleum exporter. NHTSA solicited comments on whether consideration of potential effects of upstream activity such as domestic extraction and refining of petroleum conflicts with or is otherwise not contemplated by Congress's delegation of fuel-economy regulatory authority to NHTSA, including because those upstream activities are subject to regulation by the EPA under the CAA. Considering EPCA's initial passage as an energy conservation statute and the United States being a net energy exporter, the agency sought comment on whether environmental effects should remain relevant under “the need of the United States to conserve energy,” or any other factor.
Despite this request for comment, NHTSA presented the results of selected environmental metrics in its discussion of maximum feasibility, specifically with regard to the need of the United States to conserve energy, and presented the full suite of modeled environmental metrics in the agency's PRIA accompanying the proposal. The agency also discussed the results of its Draft SEIS, which considered more environmental effects in accordance with the agency's NEPA obligations.
The agency received a variety of comments focusing on whether the agency possesses the authority to and should consider environmental effects. Commenters, such as PMI, argued that the “need to conserve energy” does not encompass environmental or global climate change considerations and that the agency should discontinue consideration of environmental effects.[845]
PMI argued that EPCA is fundamentally an energy security law, not an environmental statute, and pointed to the Supreme Court's decision in
Massachusetts
v.
EPA
to emphasize that environmental protection falls under the EPA's distinct mandate.[846]
PMI stated that the proper statutory mechanism for NHTSA to account for environmental regulation is through the “other motor vehicle standards of the Government” factor, which requires the agency to evaluate the physical fuel economy impacts of installing EPA-mandated emission control components.[847]
PMI also stated that even if NHTSA
could
consider environmental effects in setting CAFE standards, EPCA restricts that consideration to domestic effects.[848]
API commented that, though it “may be relevant to consider the environmental effects from the transportation sector, and related upstream activities on a lifecycle basis in considering the four statutory factors, NHTSA should not duplicate the policymaking and analysis of other agencies that regulate the environmental effects of activities linked to vehicles.” [849]
API stated that “[i]t is paramount that CAFE standards be cost-effective and technology-neutral, providing consumer choice in transportation. NHTSA's own policy making, in so far as it considers environmental effects and achieves environmental outcomes, should have the buy-in of vehicle, fuel, and equipment manufacturers, to reflect that the policy is achievable to implement and acceptable to consumers.” [850]
AFPM commented that the law prohibits NHTSA from considering environmental impacts, including upstream or downstream emissions, because the statute explicitly limits the agency to considering only technological feasibility, economic practicability, the effect of other motor vehicle standards, and the need of the Nation to conserve energy.[851]
Although AFPM acknowledged NEPA requires NHTSA to assess the environmental impacts of its proposed actions, it asserted that environmental modeling is not relevant to EPCA's central objective of conserving energy reserves and reducing reliance on energy imports.[852]
Citing the substantial deference Federal agencies receive to determine the scope of the environmental effects they consider, AFPM concluded that NHTSA's decision not to consider these environmental impacts in its standard-setting process is legally appropriate.[853]
An individual commenter stated that the “need of the Nation to conserve energy” factor as Congress wrote it “is both flexible and capacious enough to cover today's new energy reality, where the major geopolitical threat to U.S. energy security comes from China, rather than OPEC or the Arab League. However, this term is not capacious enough, and was never intended to be, to cover environmental effects unrelated to the energy security of the United States. To the extent that such environmental effects include vehicle electrification mandates that further strain the U.S. grid, and increase reliance on green energy and EV infrastructure from China, such environmental effects are not only unrelated to the statutory goals, but actively opposed to them. For these reasons, NHTSA's approach in this proposal represents important progress in advancing the energy conservation needs of the United States, as Congress intended.” [854]
Conversely, commenters, including NRDC
et al.
and the Attorneys General, opposed the potential interpretation, arguing that excluding environmental effects violates congressional intent, statutory text, and decades of agency practice.[855]
These commenters argued that the ordinary meaning of “conservation” inherently includes the long-term benefits of pollution reduction, and they pointed to legislative history from AMFA and EISA as evidence that Congress consistently recognized air quality improvements and greenhouse gas reductions as important justifications for strengthening the CAFE program.[856]
The Minnesota Pollution Control Agency and the Minnesota Department of Transportation strongly urged NHTSA to consider environmental impacts, arguing that Congress inherently directed agencies to consider such effects when it called for the more efficient use of energy, and noting the statutory requirement to consult with EPA. OCT similarly asserted a legal and
( printed page 62192)
moral obligation to transition away from fossil fuels to prevent climate harm,[857]
while an individual commenter characterized the agency's reliance on a narrow statutory interpretation that ignores other environmental laws as misguided.[858]
Both NRDC
et al.
and the Attorneys General criticized the agency for the potential departure from its historical precedent, stating that NHTSA has consistently evaluated environmental implications, including climate change, under the “need of the United States to conserve energy” factor since the late 1970s.[859]
They also noted that three separate court of appeals decisions over the last 40 years have explicitly affirmed this interpretation.[860]
Consequently, commenters asserted that abandoning this longstanding practice, especially given that the statute does not expressly prohibit the consideration of environmental and health impacts, would constitute a failure to consider an important aspect of the problem, thereby rendering the rule arbitrary and capricious.[861]
Finally, commenters rejected several of the agency's potential administrative and policy rationales for excluding environmental effects. The Attorneys General countered the argument that environmental impacts should be handled solely via the “other motor vehicle standards” factor by noting that NHTSA's duty to account for EPA emission standards is legally distinct from its broader duty to consider the social importance of reducing fuel consumption.[862]
They added that relying on EPA regulations is particularly inadequate given EPA's (then) proposal to rescind its greenhouse gas standards.[863]
In addition, the Attorneys General and NRDC
et al.
argued that the status of the United States status as a net energy exporter does not override the statutory mandate to conserve energy,[864]
or diminish the pressing need to address climate considerations.[865]
The Attorneys General also asserted that it is arbitrary for the agency to ignore upstream environmental effects, such as emissions from petroleum extraction and refining, while simultaneously evaluating upstream foreign policy and supply chain implications under the same statutory factor.[866]
NHTSA has carefully reviewed the comments regarding the scope of the “need of the United States to conserve energy” factor and the extent to which it may encompass environmental and climate change considerations. The agency continues to believe that its mandate under EPCA is focused on energy security and the reduction of petroleum consumption. Although some commenters point to a broad definition of the word “conservation” to include environmental conservation, NHTSA notes that in EPCA, Congress only uses “conservation” in the context of “energy conservation,” and specifically directs NHTSA to consider the need of the United States to “conserve energy.” [867]
NHTSA's consideration of environmental mandates and factors is properly situated under the “other motor vehicle standards of the Government” factor, where the agency evaluates how compliance with EPA emissions standards impacts manufacturers' ability to improve fuel economy. The Supreme Court has similarly acknowledged EPCA's focus on energy conservation in motor vehicle regulation, while distinguishing EPA's focus in the same space to protect public health and welfare.[868]
In addition, NHTSA considers environmental factors when assessing the effects of its actions under NEPA.
NHTSA does not agree that its interpretation constitutes an arbitrary departure from precedent. While the agency has discussed environmental impacts in the preambles of prior rulemakings, the agency's departure from that practice is not an arbitrary one, as NHTSA is not legally required to treat environmental impacts as a driver of the fuel economy levels under the “need to conserve energy” factor. NHTSA has concluded that the approach presented in the proposal and this final rule is appropriate because Congress directed the agency to set standards that are maximum feasible and has specified the four factors to be used in doing so. In focusing the application of this factor on energy conservation (as contrasted with the environmental consequences of energy conservation), NHTSA is ensuring that its decisions are based on the core energy-related objectives of the statute as Congress has directed. The agency has considered the relevant aspects of “the need to conserve energy” by focusing on the Nation's current energy posture, including the significant shift in the status of the United States to a net energy exporter, which fundamentally alters the domestic need to conserve energy compared to the era in which EPCA was originally enacted. Moreover, the referenced statements from EISA's legislative history do not evidence that CAFE standards were intended to address environmental factors, but rather that greenhouse gas emissions reductions were an ancillary byproduct of higher standards.
Regarding the assertion that NHTSA's consideration of environmental impacts under the “other motor vehicle standards” factor is inadequate, NHTSA believes this approach is consistent with the differing roles Congress created for NHTSA and EPA under their respective statutory schemes. The agency's obligation to consider the need to conserve energy is appropriately balanced alongside the other statutory factors, including economic practicability and technological feasibility. NHTSA disagrees that it is arbitrary to consider upstream energy security or supply chain implications while excluding upstream environmental effects; the former are directly tied to the availability and security of the Nation's energy supply, which is the central concern of EPCA, whereas the latter fall under the specialized expertise and regulatory jurisdiction of other Federal and State environmental agencies. Consequently, NHTSA believes its interpretation of the “need to conserve energy” is a reasonable and lawful exercise of its administrative discretion that remains consistent with the overarching goal of promoting energy independence, and that consideration of environmental factors is appropriate under the “other motor vehicle standards” factor, and also appropriate when fulfilling agency obligations under NEPA and when conducting analysis pursuant to E.O. 12866.
( printed page 62193)
(4) Foreign Policy Implications
U.S. consumption and imports of petroleum products can impose costs on the domestic economy that are not reflected in the market price for crude petroleum or in the prices paid by consumers for petroleum products such as gasoline. These costs include the risk of disruptions to the U.S. economy caused by sudden increases in the global price of oil and its resulting impact on fuel prices faced by U.S. consumers.[869]
Higher U.S. consumption of crude oil or refined petroleum products could increase the magnitude of external economic costs, thus increasing the true economic cost of supplying transportation fuels above the resource costs of producing them. Conversely, reducing U.S. consumption of crude oil or refined petroleum products (by reducing motor fuel use) can reduce these external costs.
While these costs are considerations, the United States has shifted to become a net petroleum exporter,[870]
as discussed above. The U.S. currently produces a surplus of petroleum relative to its needs and is projected to remain a net exporter for decades, though it continues to swap its light-grade oil for the heavier imports required by domestic refineries. In 1977, the U.S. consumed 18.43 million barrels of oil per day, producing 10.39 million, and importing 8.81 million. By 2007, when EISA was adopted, U.S. consumption had risen to 20.68 million barrels of oil per day, with production dropping to 7.85 million, and imports increasing significantly to 13.47 million. By 2022, the landscape had shifted dramatically, with U.S. production of total petroleum liquids skyrocketing to 20.08 million barrels per day, effectively matching domestic consumption of 20.01 million barrels of oil per day.[871]
While these figures indicate the U.S. has reached a net exporter status by volume, the Nation remains integrated into the global market. Specifically, the U.S. still imported 8.32 MMb/d in 2022.[872]
This continued importation is not driven by a lack of domestic volume, but rather that U.S. refineries are largely optimized to process heavy crude oil from abroad, while domestic shale production yields light crude, much of which is exported to international markets.[873]
Further, as petroleum imports have declined substantially, the source of such imports has shifted away from more volatile sources in the Middle East and towards North America. In 1977, 8.64 million barrels of oil per day were imported from OPEC and Persian Gulf countries, while only 540 thousand barrels were imported from Canada.[874]
In 2007, 8.14 million barrels per day were imported from OPEC and Persian Gulf countries, but Canadian imports increased to 2.23 million.[875]
By 2022, OPEC and Persian Gulf imports dropped to only 2.23 million barrels per day, while Canadian imports jumped to 4.37 million.[876]
This significant change in circumstances has added new stable supply to the global oil market since the adoption of EPCA and EISA, even as U.S. imports shifted away from volatile and adversarial sources and toward North American sources. NHTSA's assessment of the weight of this factor in balancing the “need of the Nation to conserve energy” has shifted accordingly, as discussed in more detail below.
AFPM acknowledged that the United States cannot completely insulate itself from global oil price dynamics, noting that geopolitical disruptions such as Middle East conflicts, Russian supply shocks, or sanctions still ripple through the globally integrated oil market.[877]
However, AFPM argued that, as fuel economy stringency increases, the marginal petroleum savings from each additional increase decline because manufacturers have already applied the most cost-effective technologies.[878]
Because foreign policy benefits rely on actual petroleum reductions, AFPM concluded that these diminishing returns moderate the need for increasingly stringent standards.[879]
Other commenters objected to NHTSA's conclusion that foreign policy considerations have diminished, arguing that the proposed rule will increase oil dependency and associated military costs. NRDC
et al.
and the Attorneys General emphasized that reducing fuel use is a critical mechanism for mitigating the foreign policy costs associated with oil consumption.[880]
The Attorneys General noted that relying on oil exacerbates vulnerabilities to supply disruptions, limits U.S. alliances, empowers hostile oil-exporting countries, and necessitates the costly maintenance of a U.S. military presence in regions like the Middle East.[881]
By conserving energy, they argued, strong standards increase resilience and reduce revenue to regimes opposed to U.S. interests.[882]
These commenters further stated that the premise of diminished risk is factually contradicted by America's continued exposure to international market volatility and its reliance on heavy crude imports, with the U.S. still importing 6.48 million barrels per day in 2023 and in light of the agency's own assumption that 90 percent of any change in domestic gasoline consumption merely shifts crude exports rather than altering domestic production.[883]
To illustrate these ongoing national security vulnerabilities, commenters highlighted the market shocks following Russia's 2022 invasion of Ukraine and the President's recent Executive Order aimed at safeguarding Venezuelan oil revenue to lower domestic prices.[884]
Because the U.S. cannot dictate prices in a global market, NRDC
et al.
cited the agency's prior 2022 statement that reducing consumption is the only effective protection for consumers from
( printed page 62194)
foreign policy price shocks.[885]
The Attorneys General noted that NHTSA's proposal will instead raise fuel consumption by nearly 100 billion gallons through 2050, exacerbating demand that is inextricably linked to the estimated $81 billion spent annually on maintaining a U.S. military presence to secure imported oil.[886]
Commenters thus contended that the agency acted arbitrarily and capriciously by departing from longstanding reasoning and not giving weight to these military and foreign policy factors, especially while the administration simultaneously spends resources on military action to secure oil infrastructure in places like Venezuela.[887]
NHTSA has considered the comments regarding the role of foreign policy and national security relating to the “need of the United States to conserve energy.” The agency continues to believe that the fundamental shifts in the domestic energy landscape since the enactment of EPCA necessitate a re-evaluation of how these considerations influence the stringency of fuel economy standards. As noted by AFPM, the United States has achieved a level of energy independence that was largely unforeseen when the CAFE program was first established, and the Nation's status as a net energy exporter significantly mitigates the traditional energy security risks associated with oil consumption. While the agency acknowledges that global oil prices remain integrated and subject to international volatility, the marginal security benefits of additional fuel-economy increases have diminished as manufacturers have deployed the most effective fuel-economy-improving technologies widely across the fleet.
The agency disagrees with the characterization by NRDC
et al.
and the Attorneys General that the proposed standards will actively increase oil dependency or jeopardize national security. While commenters highlighted recent geopolitical shocks and U.S. military actions in regions such as Venezuela and the Middle East, these events involve a complex array of national security and diplomatic objectives that are not driven primarily by domestic fuel consumption levels. A U.S. military presence in critical maritime transit corridors protects global commerce and regional stability broadly Commenters provided no evidence that incremental fuel savings associated with more stringent standards would lead to a measurable reduction in these overarching defense obligations, and the agency remains unconvinced of such a direct relationship. Specifically, regarding requests for additional quantification of the connection between CAFE standards and military spending, NHTSA explains that the prevailing literature concludes that policies to moderately reduce oil imports over time, which did not entirely eliminate import dependency, would have little benefit in terms of reducing U.S. military spending in any particular region. For this reason, most recent economics articles that quantify energy security-related benefits associated with policies like CAFE standards do not include changes in military spending.
Furthermore, the agency's obligation is to set the maximum feasible average fuel economy level based on a realistic assessment of the Nation's current energy needs. Given the record-breaking domestic production levels, the significant strategic reserves currently held by the United States, and the shift away from imported petroleum from volatile regions, the agency believes that the standards established in this final rule strike the appropriate balance between promoting energy conservation and recognizing the diminished role of petroleum-based foreign policy vulnerabilities.
In addition, in response to comments regarding the continued exposure of the United States to international volatility and reliance on specific crude grades, NHTSA observes that these market dynamics are better addressed through broader energy and economic policies rather than fuel economy standards. The agency's analysis, including incorporation of the most up-to-date fuel price projections, indicates that the domestic market is currently far more resilient than in previous decades, and the costs of forcing further, more expensive fuel economy improvements would disproportionately impact American consumers without providing a corresponding increase in national security. NHTSA remains committed to setting standards that conserve energy but maintains that this goal must be pursued in a manner that is economically practicable, reflective of the geopolitical realities of 2026, and in conformance with law.
NHTSA discusses additional comments on how the agency balanced the need of the United States to conserve energy in arriving at the final standards below.
e. Factors That NHTSA Is Prohibited From Considering
EPCA also provides that in determining the level at which NHTSA should set CAFE standards for a particular model year, the agency may not consider the fuel economy of dedicated automobiles, must consider dual-fueled automobiles to be operated only on gasoline or diesel fuel, and may not consider, when prescribing a fuel economy standard, the trading, transferring, or availability of credits under section 32903.[888]
Because restrictions are set forth in 49 U.S.C. 32902(h), these are referred to as the “subsection 32902(h)” limitations.
On June 11, 2025, NHTSA published in the
Federal Register
an interpretive rule titled “Resetting the Corporate Average Fuel Economy Program” (the “interpretive rule”), which set forth NHTSA's interpretation of how it could consider the subsection 32902(h) limitations when setting maximum feasible CAFE standards.[889]
That rule described the history surrounding EPCA's passage in 1975: EPCA was passed in the context of the Arab oil embargoes of the 1970s when American consumers and the U.S. economy were impacted by gasoline shortages and high fuel prices. The House report accompanying EPCA noted that, as a result, the legislation sought to address the national security dangers of America's dependence on foreign oil.[890]
Consistent with that context, the House report stated that the purpose of the CAFE program was to induce automakers into offering America's consumers more fuel-efficient vehicle options to advance the national goal of conserving energy, while simultaneously “recogniz[ing] that the automobile industry has a central role in our national economy and that any regulatory program must be carefully drafted so as to require of the industry
( printed page 62195)
what is attainable without either imposing impossible burdens on it or unduly limiting consumer choice as to capacity and performance of motor vehicles.” [891]
As originally enacted, EPCA did not specify matters that the Secretary may not consider when setting maximum feasible standards. The subsection 32902(h) limitations first appeared in the AMFA in 1988.[892]
AMFA aimed to displace energy derived from imported oil to help achieve energy security and improve air quality by encouraging the development and widespread use of methanol, ethanol, and natural gas as transportation fuels by consumers and the production of motor vehicles powered by these fuels. The statute specified that, in carrying out responsibilities to set maximum feasible fuel economy standards, “the Secretary shall not consider the fuel economy of alcohol powered automobiles or natural gas powered automobiles, and the Secretary shall consider dual energy automobiles and natural gas dual energy automobiles to be operated exclusively on gasoline or diesel fuel.” [893]
One member of Congress described AMFA's approach as “evenhanded” in that the bill did not favor one alternative fuel over another; rather, “[i]t allow[ed] the market to pick the non-petroleum alternative fuel of the future.” [894]
The conferees specifically noted their intent to ensure that the Secretary of Transportation did not erase the AMFA incentives by setting the CAFE standards for passenger or non-passenger automobiles “at a level that assumes a certain penetration of alternative fueled vehicles.” [895]
Specifically, “[i]t is intended that [NHTSA's maximum feasibility] examination will be conducted without regard to the penetration of alternative fuel vehicles in any manufacturer's fleet, in order to ensure that manufacturers taking advantage of the incentives offered by this bill do not then find DOT including those incentive increases in the manufacturer's `maximum fuel economy capability.' ” [896]
The Energy Policy Act of 1992 expanded the subsection 32902(h) limitations to include all dedicated alternative-fueled vehicles.[897]
The Energy Policy Act's accompanying House report acknowledged that the widespread use of alternative fuels faced several challenges, but expanded the AMFA requirements to keep the program “fuel neutral.” [898]
The Energy Policy Act's legislative history explained that this expansion occurred because “all the data, experience, and knowledge gathered concerning alternative fuels over the past two decades points to the fact that no one fuel is `the winner.'” [899]
There have been no subsequent substantive changes to the language in subsection 32902(h),[900]
including with the enactment of EISA in 2007.
In addition to examining the legislative history surrounding the subsection 32902(h) factors, the interpretive rule, among other things, set forth the bases for NHTSA's conclusion that the statute bars the agency from considering the fuel economy of dedicated automobiles in setting maximum feasible fuel economy standards. Specifically, NHTSA concluded that a lawful exercise of its standard-setting authority requires that the agency adhere to the prohibitions in subsection (h) at every stage of the standard-setting process. Consequently, when evaluating what level of fuel economy is “maximum feasible,” NHTSA must establish standards based solely on the capabilities of the gasoline-powered vehicle fleet. This interpretation differed from earlier approaches that considered the projected market penetration of alternative-fueled vehicles in establishing a baseline for considering and evaluating increasing stringency. NHTSA stated in the interpretive rule that if the agency were to set a standard that could be met by a manufacturer only through the production of electric vehicles or the purchase of credits, it would be effectively “considering” those very vehicles in contravention of subsection 32902(h). By ensuring that the “maximum feasible” level of standards is determined strictly by the performance and costs of gasoline and diesel vehicles, the agency avoids creating standards that serve as a mandate for electrification, rather than a production incentive as Congress intended.
The agency received a wide array of comments regarding its interpretive rule, and its underlying interpretation of the statutory restrictions in subsection 32902(h). Commenters were divided over whether the agency possesses the statutory authority to exclude alternative fueled vehicles entirely from the standard-setting process, with commenters providing feedback on both the procedural validity of the interpretive rule and substantive statutory interpretation.
Commenters including the Alliance, Hyundai, Kia, and Stellantis supported excluding EVs from the baseline analysis and standard-setting process.[901]
They concurred that subsection 32902(h) explicitly prohibits the agency from considering dedicated AFVs when establishing maximum feasible fuel economy standards.[902]
Stellantis emphasized that the legislative history of the Alternative Motor Fuels Act demonstrates Congress's intent to prevent the agency from using alternative fuel incentives to inflate an automaker's capability, noting that the prior inclusion of these vehicles exaggerated the fleet's capabilities and led to overly aggressive standards.[903]
Kia added that excluding EVs provides stability to the CAFE program, as the large unknowns regarding EV sales volumes and PEF variability introduce a high degree of compliance uncertainty.[904]
API, AFPM, and a joint coalition of fuel marketers (NACS, NATSO, SIGMA, and EMA (hereinafter referred to as NACS
et al.
)) echoed support for the exclusion.[905]
The joint coalition argued that the statute establishes a clear legislative boundary requiring fuel economy standards to be based exclusively on liquid or gaseous fuel consumption, which inherently
( printed page 62196)
excludes electricity.[906]
AmFree and Corn Growers Associations further argued from an economic standpoint, contending that a standard becomes economically impracticable if it raises the cost of essential vehicles to subsidize luxury EVs, and that the statute does not permit the agency to consider EVs simply because they are produced in response to other regulations.[907]
A coalition of States, including the Commonwealth of Kentucky, the State of West Virginia, and 22 other States (Joint States), alongside the U.S. Chamber of Commerce, PMI, and the Institute for Energy Research (IER), agreed that standards must be entirely feasible and practicable for gas-powered vehicles without regard to non-gas-powered alternatives or compliance credits.[908]
PMI emphasized that the statutory command that the Secretary “may not consider” EVs admits of no discretion, meaning the agency cannot read unwritten exceptions into the law to permit considering EVs at any point in the process.[909]
Furthermore, PMI urged the agency to extend this regulatory exclusion to high-range PHEVs, arguing that treating them as gasoline-powered vehicles in regulatory modeling arbitrarily bypasses statutory constraints because their internal-combustion engines function primarily as a redundancy rather than a prime mover.[910]
API, IER, the U.S. Chamber of Commerce, PMI, and individual commenters also argued that the prior inclusion of EVs functioned as an unlawful backdoor attempt to force the electrification of the vehicle fleet and a “de facto technology mandate.” [911]
They and other commenters asserted that the previous methodology substituted the agency's policy preferences for Congress's clear instructions, violating the major questions doctrine by exerting highly consequential economic and political power without the required clear congressional authorization.[912]
Several commenters concluded that removing consideration of prohibited technologies and credits from every aspect of the standards development process correctly restores the CAFE program to its statutory foundation.[913]
Conversely, several commenters, including NRDC
et al.,
Attorneys General, South Coast AQMD, ZETA, a coalition of local governments and the Sabin Center for Climate Change Law at Columbia, C40 Cities, Climate Mayors, ICLEI—Local Govts for Sustainability USA (Sabin
et al.
), and NACAA, objected to the agency's reliance on the interpretive rule, on both procedural and substantive grounds.[914]
NRDC
et al.
and the Attorneys General argued that the agency incorrectly characterized the action as an interpretive rule to evade various APA requirements when it in fact constituted a substantive, legislative rule that drastically altered decades of agency policy and bound regulated entities.[915]
These commenters also emphasized that the interpretive rule is currently the subject of consolidated legal challenges, making it an improper and arbitrary foundation for the current rulemaking.[916]
Substantively, these commenters argued that the agency's interpretation of subsection 32902(h) is flawed, is contrary to the plain text of the statute, and arbitrarily distorts the agency's modeling. NRDC
et al.,
the coalition of local governments and Sabin
et al.,
ZETA, and the Attorneys General noted that the text of subsection 32902(h) limits its prohibition to when the agency is “carrying out subsections (c), (f), and (g),” which govern setting standards and subsequent amendments and the weighing of feasibility factors, but not the baseline calculation.[917]
ZETA argued that Congress's deliberate omission of subsections 32902(a), (b), (d), and (e) from subsection 32902(h) demonstrates that the statute does not prohibit the agency from considering existing EVs when establishing the baseline of what the real-world fleet has already achieved.[918]
By applying the restriction to “any point in the process,” the Attorneys General asserted that the agency is unlawfully erasing over 4 million actual EVs from its model and pretending those vehicles do not exist.[919]
Citing administrative law principles, they noted that reliance on facts that an agency knows are false at the time it relies on them is the “essence of arbitrary and capricious decision-making.” [920]
Also with regard to the analytical modeling supporting standards, ZETA and an individual commenter echoed that the agency is unlawfully creating a counterfactual scenario, while other commenters pointed out the internal inconsistency of the agency eliminating EVs from real-world baseline calculations while simultaneously acknowledging them when forecasting future fleet compositions.[921]
AEG argued that because BEVs take up an increasing share of the fleet, completely excluding their emissions and fuel use makes the CAFE estimates increasingly unreliable.[922]
A pair of individual commenters also stated that excluding EVs from the analysis contravenes D.C. Circuit precedent and longstanding administrative guidance (OMB Circular A-4), which requires that a regulatory baseline be the “best assessment of the way the world would look absent the proposed action.” [923]
Lucid commented that the agency's assumption that there are no EVs permeates the entire rulemaking and forces NHTSA to calculate that complying with present CAFE standards is not “economically
( printed page 62197)
practicable.” Furthermore, Lucid pointed out that by assuming manufacturers have not used credit trading to comply with prior standards, the agency overstates the costs manufacturers will incur to adopt new ICE technologies. MECA agreed that the statute does not allow the agency to factor alternative fueled vehicles into the design of standards but warned that completely omitting full-vehicle electrification from the baseline causes market distortion.[924]
MECA argued this artificially reduces stringency so much that automakers might remove fuel-efficiency technologies from their internal combustion engine vehicles.[925]
NRDC
et al.
and the Attorneys General commented that excluding millions of highly efficient vehicles from the baseline artificially lowers the starting point of the agency's analysis, resulting in proposed maximum feasible standards that fall far below the fuel-economy levels the fleet is already achieving in the real world.[926]
Furthermore, NRDC
et al.
pointed out that the interpretation would lead the agency to set a minimum standard for domestic passenger cars under subsection 32902(b)(2) that is mathematically higher than the “maximum” standard applicable to the entire fleet.[927]
The Attorneys General expanded on this argument, asserting that the domestic minimum is already projecting five mpg higher than the maximum feasible standard, an anomaly they argued is contrary to common sense and irreconcilable with congressional intent.[928]
These commenters concluded that the interpretive rule unlawfully and textually expands the statutory restrictions on dedicated EVs, dual-fueled vehicles, and credit trading in a manner that produces absurd results and undermines the long-term integrity of the CAFE program.[929]
Several commenters also asserted that this new interpretation departs from years of established agency practice without adequate explanation and leads to nonsensical results that frustrate the purpose of EPCA.[930]
Lastly, the Attorneys General and ZETA commented that NHTSA improperly relied on the elimination of the credit trading program to justify reducing the stringency of the fuel economy standards starting in MY 2028.[931]
They asserted that this approach directly violates the statutory prohibition against considering the trading, transferring, or availability of credits when prescribing a fuel economy standard.[932]
NHTSA has carefully considered the comments regarding the interpretive rule and the subsequent incorporation of its legal conclusions into the current rulemaking. The agency continues to believe that the interpretive rule provides a correct and necessary clarification of the mandatory restrictions set forth in subsection 32902(h). As noted by Joint States and the U.S. Chamber of Commerce, the statutory text explicitly prohibits the agency from considering the fuel economy of dedicated automobiles, the alternative-fuel capabilities of dual-fueled automobiles, or the availability of compliance credits when determining the maximum feasible average fuel economy level. The agency agrees that the phrase “may not consider” functions as a strict legislative boundary, divesting the agency of discretion to include dedicated AFVs at any stage of the maximum feasibility determination. By centering the analysis exclusively on technologies the law allows to be considered—that is, vehicles powered exclusively by gasoline or diesel fuels—the agency avoids creating the “de facto technology mandate” described by commenters and ensures that standards remain economically practicable without the distortive effects of cross-subsidization. This approach addresses concerns regarding the major questions doctrine—
i.e.,
that the CAFE program was being misused to force the conversion of the vehicle fleet to electrification without the necessary congressional mandate—by restoring the program to its original statutory foundation, providing the industry with the stability and legal certainty required for long-term compliance planning.
Moreover, NHTSA agrees that EPCA, as amended, does not provide a directive to use the CAFE program as a mechanism for mandating a wholesale transition from internal combustion engines to electric vehicles. Instead, the statutory text directs the agency to establish standards that are maximum feasible based on the technological and economic realities of the vehicles being regulated. By adhering to these defined criteria, the agency ensures that its standards remain consistent with its legal obligation to establish maximum feasible fuel economy standards without extending its regulatory reach into areas not specifically authorized by the text.
NHTSA disagrees with the contention raised by NRDC
et al.,
Sabin
et al.,
and the Attorneys General that these restrictions are limited only to a single step in the process or restricted to the carrying out of subsections (c), (f), and (g) by setting maximum feasible standards for vehicles only above a baseline that includes factors explicitly identified in subsection 32902(h). In establishing or amending maximum feasible fuel economy standards and determining the baseline by which those standards are established, NHTSA is, by definition, carrying out subsections (c), (f), and (g). A standard that is determined based on a baseline or analysis that includes prohibited factors
considers
those factors, in contravention of the statutory requirements regarding what NHTSA may not consider. To comply with the congressional mandate that standards be technologically feasible and economically practicable for the internal combustion engine fleet, the agency must exclude alternative fueled vehicles at every stage of its standard-setting calculus.
NHTSA believes that the statutory command in subsection 32902(h) is clear: the agency is restricted from considering these vehicles when “carrying out” its duty to set maximum feasible fuel economy standards. Inclusion of even a small number of electric vehicles in the baseline analysis fleet upon which stringency increases are applied has a serious impact upon fuel economy standards—an effect that has become apparent in recent years with increased fleet electrification. Specifically, the MY 2024 gasoline- and diesel-fueled analysis fleet achieves a combined 35.4 mpg, while the MY 2024 fleet including PHEV full fuel economy and EVs achieves 36.2 mpg, with the effect increasing significantly in the passenger car fleet, which achieves 43.2 mpg based solely on gasoline- and diesel-fueled vehicles, and 45 mpg considering all vehicles. These values would only continue to diverge if EV fuel economy became a greater portion of total fuel economy. If the agency were to include electric vehicles in its baseline, the resulting standard would inevitably be higher than what is
( printed page 62198)
technologically feasible or economically practicable for the petroleum-powered fleet alone.
The nearly one-mile-per-gallon increase in standard stringency, representing an almost 2.5-percent increase in stringency between the MY 2024 gasoline- and diesel-powered fleet and the total fleet, and the nearly two-mile-per-gallon increase in stringency for the passenger car fleet, representing a 4.2-percent increase in stringency for the passenger car fleet, denotes what would otherwise be a substantial technological gap that places an immediate compliance burden squarely on the remaining internal combustion engine-powered fleet. This would thereby circumvent the very protections Congress prescribed to prevent the standard-setting process from being used to mandate a shift away from internal combustion engines. This approach does not create a counterfactual baseline but rather ensures that the regulatory burden is calibrated solely to the vehicles the agency is authorized to regulate under subsection 32902(h). The agency's interpretation of subsection 32902(h) likewise does not produce non-sensical results regarding the MDPCS because NHTSA correctly interprets the MDPCS to be set based on a projection of the standard, as discussed above.
Regarding comments that NHTSA's analysis approach breaks with years of established agency precedent, NHTSA disagrees. Dedicated vehicles were only included in appreciable numbers in recent rulemakings, and in fact NHTSA's assessment of maximum feasible fuel economy standards has considered the capabilities of the gasoline- and diesel-powered vehicle fleet for decades prior to assessments that included dedicated vehicles. In addition, NHTSA disagrees that the new interpretation frustrates the purpose of EPCA. As discussed in more detail below, excluding dedicated vehicles from the analysis does not limit NHTSA's ability to set maximum feasible standards; rather, it prevents artificially inflating the baseline and best aligns with EPCA's language and intent. Under a combined baseline, a manufacturer that produces gasoline and diesel vehicles would be inherently disadvantaged against one producing those vehicles and electric vehicles, and would be forced to react to more stringent standards simply because dedicated vehicles were considered in the baseline. To address compliance benefits for dedicated alternative fueled vehicles without distorting standard-setting, Congress enabled the Department of Energy to adjust the petroleum equivalency factor to ensure dedicated vehicles do not exert a disproportionate impact.
In response to the procedural concerns raised by NRDC
et al.,
South Coast AQMD, and Attorneys General, NHTSA maintains that the interpretive rule was properly classified as such. The rule did not create new legal obligations or alter existing regulatory text; rather, it set forth the agency's best understanding of its existing statutory constraints under EPCA. Because the rule explains what the statute has required of the agency since its enactment, it does not constitute a legislative rule requiring notice-and-comment procedures under the APA. Furthermore, while the agency acknowledges that the interpretive rule is currently the subject of litigation, NHTSA is not required to stay its regulatory activities or revert to a prior, incorrect interpretation of the law pending a judicial resolution. The agency's current reliance on this framework is intended to provide the regulatory stability requested by many stakeholders and to ensure that the resulting standards are legally robust and grounded in the plain text of the statute. Finally, the agency rejects the contention that incorporating the legal reasoning of the interpretive rule by reference into the standards proposal was procedurally defective, as this proposal's explicit identification of that rule as a prerequisite for the analytical updates provided all interested parties with a meaningful opportunity to evaluate the agency's logic and submit comments on its application within the scope of this rulemaking. NHTSA notes that several commenters did provide such comments on the subject from a number of different perspectives, which the agency considered in finalizing this rule. Should the interpretive rule be invalidated on procedural grounds, NHTSA would reach the same conclusions with respect to how to interpret the statute, as the agency articulated in the proposal and now this final rule.
Finally, NHTSA disagrees with the Attorneys General and ZETA's assertion that the agency improperly considered the removal of credit trading in MY 2028 when determining the proposed standards. NHTSA's tentative determination in the proposal was limited to the subsection 32902(f) factors; any discussion of the removal of credit trading in MY 2028 was part of a broader structural discussion of the program and had no bearing on any particular fuel economy level that NHTSA proposed or tentatively selected as the maximum feasible standard. The same holds true for the final standards set in this final rule, and the basis for those standards are discussed in more detail below.
Accordingly, NHTSA's conclusion from the interpretive rule and proposal remains that the statutory prohibition was clear at the time of enactment and has remained clear: it is impermissible for NHTSA to consider the fuel economy of dedicated automobiles in setting maximum feasible fuel economy standards. NHTSA's previous consideration of such vehicles has had a significant impact on the ability of gasoline- and diesel-fueled vehicles to achieve standards. NHTSA affirms that it did not consider any of these statutorily prohibited factors in determining the maximum feasible standards finalized in the present rulemaking.
f. Additional Considerations Relevant to NHTSA's Statutory Determination of Maximum Feasibility
There are additional considerations relevant to NHTSA's determination of maximum feasible standards that the agency evaluates in its analysis of the four enumerated subsection 32902(f) factors.
NHTSA historically has considered the potential for adverse safety consequences in setting CAFE standards,[933]
including as a subset of economic practicability and the effect of other motor vehicle standards of the Government on fuel economy, utilizing NHTSA's experience as a safety regulator. NHTSA assesses the potential safety impacts of alternative standards and considers them in balancing the statutory considerations and determining the maximum feasible level of the standards. Courts have upheld NHTSA's implementation of EPCA in this manner.[934]
NHTSA received a comment from the Attorneys General stating that a non-statutory factor like safety may not lawfully displace the subsection 32902(f) factors that Congress specified.[935]
In addition to objecting to NHTSA's projections of safety effects from different levels of standards, the Attorneys General stated that the presentation and description of safety effects signaled that this consideration played a driving role in the maximum
( printed page 62199)
feasibility determination.[936]
The Attorneys General stated that NHTSA cannot substitute this goal for EPCA's explicit statutory criteria.[937]
NHTSA disagrees with the characterization that safety considerations have displaced the four statutory factors and maintains that its maximum feasibility determination is the result of a rigorous balancing of the criteria specified in subsection 32902(f). The agency is committed to ensuring that fuel economy improvements do not come at the expense of public safety, and the extensive analysis provided throughout this preamble demonstrates that the agency has focused appropriately on the enumerated statutory factors of technological feasibility, economic practicability, the effect of other Government standards, and the need to conserve energy. As detailed in the following sections, safety considerations have not displaced the statutory factors but rather the agency has included them in a comprehensive assessment of the effects of the final standards.
NHTSA also considers consumer demand, which is “not specifically designated as a factor, but neither is it excluded from consideration; the factors of `technological feasibility' and `economic practicability' are each broad enough to encompass the concept.” [938]
As the D.C. Circuit has recognized, NHTSA “is directed to weigh the `difficulties of individual automobile manufacturers;' there is no reason to conclude that difficulties due to consumer demand for a certain mix of vehicles should be excluded.” [939]
In concert with E.O. 12866, NHTSA also considers net benefits as relevant to determining maximum feasible CAFE standards. EPCA does not mandate that NHTSA set standards at the point at which net benefits are maximized, and NHTSA does not believe it is compelled to do so.[940]
That said, this final rule is net beneficial, which fulfills NHTSA's responsibility under the DOT rule, Administrative Rulemaking, Guidance, and Enforcement Procedures, to make a reasoned determination that the benefits outweigh the costs,[941]
and as required by DOT Order 2100.7, Ensuring Reliance Upon Sound Economic Analysis in Department of Transportation Policies, Programs, and Activities.[942]
While E.O. 12866 states that agencies should, “in choosing among alternative regulatory approaches, . . . select those approaches that maximize net benefits,” [943]
even if NHTSA believed it could quantify enough relevant factors to determine the CAFE levels at which net benefits were maximized with reasonable accuracy, there may be other considerations that would lead the agency to conclude that maximum feasible CAFE standards are not the ones that maximize net benefits. For example, in 2012, NHTSA rejected the regulatory alternative that appeared to maximize net benefits (and all alternatives more stringent than that one) based on the conclusion that, even though estimated net benefits were maximized, the “resultant technology application and cost” were simply too high, and thus made those standards economically impracticable, and thus beyond maximum feasible.[944]
In addition, NHTSA has historically considered that some manufacturers may choose to pay a civil penalty rather than meet their applicable CAFE standard if the cost of paying the civil penalty is less than the cost of adding fuel economy technology. NHTSA did so through an option in the CAFE Model's Market Data Input file that would stop applying additional technology to this manufacturer's product line when cost-effective technology solutions were exhausted.[945]
NHTSA had historically justified programming the CAFE Model's technology selection algorithm accordingly because some manufacturers did choose to pay a civil penalty rather than apply technology, and NHTSA believed that its modeling was intended to reflect manufacturer decision-making in response to standards, even if that decision was to pay penalties.
In July 2025, Congress eliminated CAFE civil penalties by setting the statutory penalty rate to $0. In the proposal and in this subsequent final rule, notwithstanding the change in the CAFE penalty rate, NHTSA assumed, based upon its review and analysis of the relevant statutory provisions, that manufacturers will endeavor where practicable to attempt to comply with the finalized standards. “Practicable” in this context means subject to real-world constraints on technology application such as refresh and redesign cycles and technology applicability, concepts discussed in detail in Section II. This reading of EPCA's provisions best effectuates the statute's command that NHTSA establish maximum feasible standards that achieve industry-wide fuel economy improvements.[946]
To be clear, this does not mean NHTSA assumes all manufacturers will comply fully with standards for all fleets. For example, if a manufacturer could not redesign a portion of their fleet within the standard-setting years or if their baseline compliance position were simply lower than that of the rest of the industry, the CAFE Model would not assume that the manufacturer would nevertheless comply at any cost. This approach appropriately places the focus in standard setting on whether manufacturers could meet the standards through vehicle production decisions, consistent with the statutory direction to set maximum feasible standards without regard to the possible availability of compliance pathways that Congress has proscribed NHTSA from considering.[947]
( printed page 62200)
NHTSA's modeling assumption that manufacturers will make maximum practicable efforts to comply with CAFE standards despite the $0 penalty rate is supported by longstanding real-world experience. For example, the 1979 “Automotive Fuel Economy Program Third Annual Report to the Congress” issued by DOT stated in its recommendation that the statutory scheme be amended to allow a longer period for credit carry-forward and carry back that “[a] number of manufacturers have raised the point that failure to meet the fuel economy standards involves a violation of the law, regardless of whether the short fall involves a penalty or involves the use of credits being carried forward or backward. The manufacturers have expressed strong reluctance to engage in any corporate planning that would involve violations.” [948]
Many manufacturers also have formal corporate policies committing themselves to complying with applicable legal standards. For example, JLR states in its Code of Conduct that the products and services that they offer “shall comply with applicable laws, including emissions and safety standards.” [949]
In the proposal preceding the 2024 final rule, NHTSA sought comment on its manufacturer fine payment preference assumptions—which are differentiated by specific manufacturer and model year—and JLR commented that they do “not view fine payment as an appropriate compliance route or as a flexibility in the regulation.” [950]
NHTSA changed this assumption for JLR for the 2024 final rule. Similarly, GM's global environmental policy states that the company is “committed to complying with all applicable laws and regulations,” [951]
and Toyota's Code of Conduct states that Toyota will comply with “applicable laws and regulations” and “international environmental standards.” [952]
Honda's corporate responsibility statement likewise states that Honda shall comply with all applicable environmental laws and regulations in all jurisdictions in which they operate,[953]
and Stellantis' code of conduct and most recent Climate Policy Report state that the company is both committed to complying with applicable laws and to CAFE compliance specifically.[954]
NHTSA does not assume that all companies listed have treated civil penalty payment as a violation of CAFE standards, but rather that when an applicable standard is in effect, manufacturers have reasons to give that standard due consideration even with a $0 penalty rate. NHTSA thus believes that it is reasonable to assume in its analysis of maximum feasibility that manufacturers will endeavor to comply with the applicable standards.
NHTSA sought comment on this assumption. JLR commented that the company does not consider civil penalty payment to be an acceptable route to compliance, consistent with their corporate Code of Conduct and as acknowledged in the proposal.[955]
Similar to NHTSA's assessment presented in the proposal, ICCT reviewed the commitments of several automakers and found that “industry is consistently committed to fully complying with environmental laws and regulations in markets where they operate.” [956]
Porsche recommended that NHTSA consider amending future fuel economy standards should Congress revisit and amend the civil penalty rate, though Porsche also recognized that was out of scope for this particular rulemaking.[957]
On the other hand, MECA commented that the $0 civil penalty rate raises serious concern that manufacturers could choose non-compliance as a business strategy and recommended that NHTSA evaluate the impact of the $0 civil penalty rate on compliance with CAFE standards.[958]
NACAA similarly commented that “without meaningful financial consequences for non-compliance, manufacturers face no economic imperative to meet fuel economy targets, potentially rendering CAFE standards aspirational and failing to drive any real-world improvements in vehicle efficiency and associated air quality benefits.” [959]
NACAA stated that the proposal does not address the absence of a regulatory driver for meeting fuel economy standards, and proposed instead that NHTSA consider “alternative regulatory approaches that create meaningful regulatory drivers for fuel economy improvement even in the absence of civil penalties.” [960]
Finally, the NY DEC commented that by eliminating penalties, there is little reason for manufacturers to adhere to the standard, defeating the purpose of establishing standards in the first place.[961]
NHTSA has carefully considered the comments expressing concern over the potential for non-compliance as a business strategy in light of the $0 civil penalty rate. As a preliminary matter, the agency emphasizes that the current civil penalty rate is established by legislative action that is outside of NHTSA's discretion to alter. NHTSA's task is to ensure that the standards are modeled using appropriate assumptions about how the industry may choose to respond to the penalty rate. While commenters like MECA and NACAA expressed concern that the absence of a financial penalty removes the imperative to comply, the agency's modeling must be grounded in the existing law, and NHTSA believes its approach represents an appropriate one. The agency agrees with commenters such as JLR and ICCT who observed that for many manufacturers, compliance is not merely a matter of financial calculation but a corporate commitment. Internal codes of conduct that manufacturers have chosen to adopt provide reasons to attempt to meet CAFE standards, independent of whether a shortfall results in a monetary fine.
NHTSA would reach the same results regarding the stringency of the standards regardless of the applicable civil penalty level. NHTSA maintains an independent statutory obligation to establish standards at the maximum feasible level without regard to penalty
( printed page 62201)
rates—which are not a statutorily prescribed factor under EPCA—and must base its feasibility determination upon a careful balancing of statutory factors. By modeling compliance based on the assumption that manufacturers will strive to achieve the standards, NHTSA is carrying out EPCA's charge and providing the agency's best assessment of maximum feasible standards.
In response to recommendations that the agency pursue alternative regulatory drivers or redo its analysis of the penalty's impact, NHTSA notes that it must adhere to its delegated statutory authority. The agency is not empowered to create enforcement mechanisms that may impose consequences despite the $0 penalty rate. The agency has chosen modeling assumptions based on available indicia of manufacturers' likely choices regarding compliance. NHTSA will continue to monitor compliance trends and may revisit its modeling assumptions if facts and circumstances warrant doing so. Also, as suggested by Porsche, should Congress choose to revisit and amend the civil penalty structure in the future, NHTSA will assess future regulatory needs accordingly.
Regarding additional considerations relevant to NHTSA's maximum feasibility determination, the ME DEP commented that in addition to the subsection 32902(f) factors, NHTSA must “also consider the stated statutory goal of EISA, to increase energy independence and security, to increase the production of clean renewable fuels, to protect consumers, to increase the efficiency of products, buildings, and vehicles, to promote research on and deploy greenhouse gas capture and storage options, and to improve the energy performance of the Federal Government.” [962]
NHTSA acknowledges the broad, overarching goals of EISA as cited by the ME DEP but maintains that its specific authority to set CAFE standards is governed by section 32902. Adherence to the operative language of section 32902 reflects an interpretation of the statute that the specific and detailed requirements of the text must take precedence over the generalized goals or prefatory remarks found in a statute's preamble. NHTSA properly considers factors related to the statutory goals of EPCA, as amended by EISA, that have been listed in the statutory text, and through the agency's regulatory impact assessment, which properly considers environmental effects relevant to NHTSA's CAFE standard-setting action.
B. Other Statutory Requirements
1. Administrative Procedure Act
The APA governs agency rulemaking generally and provides the standard of judicial review for agency actions. To be upheld under the “arbitrary and capricious” standard of judicial review under the APA, an agency rule must be rational, based on consideration of the relevant factors, and within the scope of authority delegated to the agency by statute. The agency must examine the relevant data and articulate a satisfactory explanation for its rulemaking, including a “rational connection between the facts found and the choice made.” [963]
The APA also requires that agencies provide notice and comment to the public when proposing regulations,[964]
as NHTSA did with this final rule and its accompanying materials.[965]
NHTSA received some comments raising procedural concerns regarding the rulemaking process. NRDC
et al.
commented that the process violated the APA due to an inadequate sixty-day comment period that overlapped with Federal holidays, the decision to hold only a single public hearing, the imposition of an arbitrary fifteen-page limit on comment letters, and the omission of relevant OMB correspondence from the public docket.[966]
Furthermore, IPI and NRDC
et al.
requested that NHTSA disclose whether and how artificial intelligence (AI) tools were utilized in the drafting or analysis of the proposed rule, citing requirements under executive orders, OMB memoranda, and the APA to ensure transparency, prevent hidden biases, and maintain accountability in agency decision-making.[967]
As evidenced by the numerous extensive comments received addressing a wide array of issues, NHTSA believes 60 days to be adequate for commenters to have reviewed fully and commented meaningfully on the proposed rule and on the Draft SEIS.[968]
This length of time comported with prior NHTSA CAFE comment periods and comment periods for other significant rules,[969]
while balancing the public interest in timely completion of the final rule. NHTSA reserved two days for the agency's virtual public hearing to accommodate all potential requests to testify, but the agency received requests to testify that only covered part of one day. Given the number of requestors to testify, and that a virtual public hearing format allows the most flexibility for diverse public comments from commenters in multiple locations across the country, NHTSA did not need to extend the virtual public hearing into an additional day, nor did the agency schedule additional in-person public hearings. NHTSA also concluded that, given the ongoing opportunity for written comment, the requesters did not demonstrate a need for additional public hearings.
The APA provides an exception to providing notice and opportunity for comment, at 5 U.S.C. 553 when the agency for good cause finds (and incorporates the finding and a brief statement of reasons therefore for the rules issued) that notice and public procedure thereon are impracticable, unnecessary, or contrary to the public interest. In this final rule, NHTSA is finalizing a few additional technical amendments that were not included in the NPRM. NHTSA finds that the agency has good cause that notice and public procedure are unnecessary. The most notable of these technical amendments is an amendment to 49 CFR part 578 that revises the civil penalty amount for fuel economy shortfalls to $0, in accordance with OB3. Since the technical amendment merely aligns NHTSA's regulation on civil penalties with statute and NHTSA has no discretion, NHTSA finds that it is unnecessary to seek public comment.
In addition, NHTSA has made an update to language regarding manufacturers' submission of CBI material to align with current practice and to eliminate outdated language requiring that CBI requests be submitted on CD-ROM and mailed to NHTSA. The new language instructs manufacturers to submit CBI requests using NHTSA's new portal, in line with how manufacturers are instructed to submit other CBI material. NHTSA is also making technical amendments to
( printed page 62202)
include definitions where terms are referenced but not defined, using definitions that are already included in NHTSA's CAFE regulations. NHTSA finds that it has good cause that providing an opportunity for public comment is unnecessary and is finalizing these minor, clarifying technical amendments as described in Section VI.
Next, NHTSA has previously received comments on its requests that primary comments in response to proposed regulations be limited to 15 pages,[970]
and the agency emphasizes that commenters have always been free to submit attachments without any page limit, which these commenters did. NHTSA's proposal specifically stated, as the agency has in all prior rules, that the agency established the page limit to encourage commenters to write primary comments in a concise fashion.[971]
NHTSA also stated that commenters could attach additional documents to their comments, and there is no limit on the length of attachments.[972]
NHTSA considered both primary comments and their attachments in this rulemaking as demonstrated by the response to comments discussed throughout this final rule. No commenter was prevented from submitting comments based on NHTSA's page limit for primary comments.
Lastly, in response to comments from IPI and NRDC
et al.
regarding the transparency and legality of AI use and the APA, NHTSA clarifies that while AI tools were not utilized in the proposed rule, the agency did leverage AI capabilities to assist with drafting and document synthesis for this final rule. NHTSA emphasizes that these tools were used in a strictly assistive and administrative capacity—such as organizing comment summaries—and did not perform independent regulatory analysis or make policy determinations. All AI-assisted tasks operated under the supervision of Departmental reviewers. Because every substantive analytical conclusion and textual formulation was subject to human review, this approach maintains accountability, prevents algorithmic bias, and fully satisfies the requirements for reasoned decision-making.
NHTSA also received several comments referencing the agency's obligation under the APA in various respects related to substantive issues presented in the proposal and those comments are addressed throughout this preamble in the relevant subject matter discussion area.
2. National Environmental Policy Act
NEPA directs that environmental considerations be integrated into the Federal decision-making process, considering the purpose and need for agencies' actions. To explore the potential environmental consequences of this action, NHTSA prepared a Draft SEIS to accompany the proposal and has prepared a Final SEIS to accompany this final rule. Though NHTSA is finalizing MYs 2022-2031 CAFE standards, the main analyses of reasonably foreseeable impacts of the final rule and alternatives presented in the Final SEIS cover expected environmental impacts associated only with the finalized MYs 2027-2031 standards because no change in manufacturer behavior is possible for MYs 2022-2026 passenger car and light truck fleets.
EPCA and EISA require that the Secretary of Transportation determine the maximum feasible levels of CAFE standards in a manner that disregards the potential use of CAFE credits or application of alternative fuel technologies toward compliance in model years for which NHTSA is issuing new standards.[973]
NEPA, however, does not impose such constraints on analysis; instead, NEPA requires Federal agencies to consider reasonably foreseeable environmental impacts of their proposed actions.[974]
NHTSA's Final SEIS therefore presents results of an “unconstrained” analysis that considers manufacturers' potential use of CAFE credits and application of alternative fuel technologies (including PHEVs using their charge depleting fuel economy values, BEVs and FCEVs) to allow consideration of real-world environmental consequences of the final rule and alternatives.[975]
The rest of this preamble, and importantly NHTSA's balancing of relevant EPCA/EISA factors explained in Section V.C.1 and 2, employs the “standard setting” modeling to avoid consideration of the prohibited factors in subsection 32902(h) in determining maximum feasible standards. As a result, the impacts reported in Section V.C.3 may differ from those reported elsewhere in the preamble. NHTSA conducts modeling both ways (“standard setting” and “unconstrained”) to reflect the various statutory requirements of EPCA/EISA and NEPA, respectively.
NHTSA's Final SEIS describes the reasonably foreseeable impacts across a variety of environmental resources, including energy, air quality, emissions effects, and historic and cultural resources. The impacts of NHTSA's action and alternatives are discussed in proportion to their significance, as applicable.[976]
The findings of the analysis are summarized in Section V.C.3, and more detailed discussion—in particular for any qualitative resource assessment—can be found in the Final SEIS.
The Final SEIS is one input among many into NHTSA's decision-making process in setting CAFE standards. In preparing the Final SEIS, NHTSA has considered and taken into account the Supreme Court's opinion in
Seven County Infrastructure Coalition
v.
Eagle County, Colorado
and its progeny.[977]
Agencies are granted substantial deference to determine the scope of the environmental effects that they address and may decide whether to evaluate environmental effects from separate projects upstream or downstream from this action.[978]
Because the final rule amends standards for vehicle model years for which CAFE standards have previously been established, the Final SEIS discusses certain potential environmental effects from sectors that EPCA does not delegate authority to NHTSA to regulate. NHTSA's prior CAFE EISs contained analysis of the potential environmental impacts from these sectors.
Seven County
made clear, however, that NEPA does not require NHTSA to analyze potential environmental effects from these sectors. Analysis of such effects is not necessary for reasoned decision-making with respect to setting CAFE standards, because Congress has not directed
( printed page 62203)
NHTSA to consider those when setting CAFE standards.
AFPM commented that the agency lacks the authority to consider environmental impacts when establishing maximum feasible fuel economy standards under EPCA.[979]
AFPM emphasized that EPCA explicitly lists only four statutory factors for determining maximum feasible standards, and there is no mention of environmental impacts or upstream and downstream emissions.[980]
While AFPM acknowledged that NEPA requires the agency to assess the environmental impacts of its proposed actions, they asserted that environmental modeling is not relevant to EPCA's central objective of conserving energy reserves and reducing reliance on energy imports.[981]
Citing the substantial deference federal agencies receive to determine the scope of the environmental effects they consider, AFPM concluded that NHTSA's decision not to consider these environmental impacts in its standard-setting process is legally appropriate.[982]
Some commenters, however, disagreed with NHTSA's interpretation of
Seven County
and argued that the Final SEIS should contain analyses of potential environmental effects from sectors that EPCA does not delegate authority to NHTSA to regulate.[983]
NHTSA appreciates these comments, but reemphasizes that the Supreme Court's ruling in
Seven County
made it clear that Federal agencies are not required to analyze environmental impacts from other projects separate in time, or separate in place, or that fall outside of the agencies' regulatory authority, or that would have to be initiated by a third party. As such, NHTSA disagrees with these commenters and maintains its interpretation of
Seven County,
as discussed in more detail in Appendix C of the Final SEIS.
In addition, other commenters requested that NHTSA consider broader impacts in its Final SEIS, such as battery production supply chains, national security risks from overseas sourcing, lifecycle vehicle emissions, localized community health disparities, and the ecological stresses of fossil fuel extraction.[984]
As further explained in Appendix C of the Final SEIS, NHTSA reassessed its scope of analysis in light of these comments and determined that it has appropriately refined the scope of the proposed action in line with the Supreme Court's holding of
Seven County
and the DOT Order 5610.1D.
In addition, in light of the
Seven County
opinion, together with the 2023 legislative amendments to the NEPA statute and the 2025 rescission of Council on Environmental Quality (CEQ) NEPA regulations, NHTSA sought comment on whether the agency is required to prepare an EIS for any similar CAFE standard-setting action—that is to say, whether Congress has given NHTSA discretion, when setting CAFE standards, to take into account the potential environmental effects of its CAFE standards in terms of the environmental effects from the sector that those standards directly regulate (
i.e.,
the regulated vehicles themselves).
Several commenters, including NRDC
et al.,
as well as the Minnesota Pollution Control Agency and the Minnesota Department of Transportation (Minnesota state agencies), and ZETA, commented that NHTSA must prepare an EIS because CAFE standards are major Federal actions that significantly affect the human environment.[985]
Minnesota state agencies noted that neither judicial deference, nor the 2023 legislative amendments to NEPA, nor the 2025 rescission of CEQ's NEPA regulations absolve the agency of its environmental review responsibilities.[986]
They also highlighted that the Department of Transportation recently promulgated updated NEPA procedures specifically applicable to NHTSA to replace its rescinded 1975 procedures.[987]
NHTSA appreciates these comments and has prepared the Final SEIS for this proposed action.
C. Evaluating the Statutory Factors and Other Considerations To Arrive at the Final Standards
The following discussion contains NHTSA's explanation of how the agency has considered the analysis in this preamble and the accompanying Final TSD and FRIA and other relevant information in determining that the final standards are maximum feasible for MYs 2022-2026 and MYs 2027-2031 passenger cars and light trucks. As discussed in detail throughout the section below, NHTSA believes the small, steady, incremental increases in fuel economy standards over time, which preserve the ability for manufacturers to focus on safety, affordability, and consumer choice, are reasonable and appropriate, and best reflect and balance the various practical considerations and limitations mandated by Congress for the CAFE program.
1. Why is NHTSA's conclusion different from the 2020, 2022, and 2024 final rules?
NHTSA described in the proposal how the fuel economy standards the agency promulgated in recent years failed to satisfy EPCA's requirements in 49 U.S.C. 32902(h) because the prior standards considered the fuel economy of dedicated vehicles and dual-fueled vehicles in charge-depleting mode. Consequently, NHTSA concluded that the prior standards did not advance and, indeed, had come to undermine the goals established in EPCA for the CAFE program. In accordance with its authority to reconsider and modify past policy decisions,[988]
and in the exercise of the Secretary's express authority to “prescribe regulations amending” CAFE standards,[989]
NHTSA outlined in the proposal several reasons for resetting the CAFE program.
First, NHTSA summarized the agency's final rule published on June 11, 2025,[990]
as well as the position the agency previously took in its 2020, 2022, and 2024 final rules that it could account for the factors prohibited from consideration in subsection 32902(h) by using a narrow construction of that provision. This narrow interpretation permitted the Model to add dedicated alternative and dual-fueled vehicles to the fleet of vehicles in response to reasons other than NHTSA's CAFE standards,[991]
and outside of the years for which NHTSA was setting standards. Specifically, in the 2022 and 2024 final rule baselines, NHTSA
( printed page 62204)
accounted for zero emission vehicle (ZEV) mandates applicable in California and the other States that have adopted them,[992]
and some vehicle manufacturers' voluntary commitments to the State of California to continued annual nationwide reductions of vehicle greenhouse gas emissions through MY 2026, with greater rates of electrification than would have been expected under NHTSA's 2020 final rule. In addition, in the baselines for all three final rules, NHTSA accounted for manufacturer responses to previously promulgated fuel economy and greenhouse gas emissions standards, which included dedicated vehicles (like EVs) and dual-fueled vehicles (like PHEVs) operating in charge depleting mode. NHTSA prohibited the consideration of dedicated vehicles or dual-fueled vehicles operating in charge depleting mode only as a compliance option in response to the agency's fuel economy standards during “standard-setting” years (
i.e.,
the model years being evaluated as the subject of the active rulemaking) and similarly prohibited consideration of manufacturer use of compliance credits only during the standard-setting years. In other words, the model did not apply dedicated or dual-fueled technology to a manufacturer's fleet of vehicles when simulating a cost-effective pathway for the manufacturer to comply with a given level of CAFE standards in standard-setting years only, but application of the technology was otherwise permitted.
As NHTSA concluded in the June 2025 final rule, its prior consideration of the factors prohibited in subsection 32902(h) is inconsistent with a plain reading of subsection 32902(h). Consideration of those factors only in response to reasons other than NHTSA's standards and in non-standard-setting years did not somehow avoid the statutory inconsistency; EPCA prohibits NHTSA from considering those factors in any way in establishing the maximum feasible CAFE standards.
Next, NHTSA explained in the proposal that the large increases in the stringency of standards applicable to the succeeding model years through MY 2026 were not feasible or practicable, within the meaning of EPCA, for new gas-powered cars and trucks that manufacturers were likely to produce in those years. The inclusion of EVs inherently impacted the agency's determination of maximum feasible standards because EVs generally are imputed to have significantly higher fuel economy than ICE vehicles.[993]
NHTSA would not have proposed or adopted those stringent standards if the agency had not considered the fuel economy of EVs in its modeling analysis. NHTSA reasoned in the 2024 final rule that this consideration of EVs was appropriate because “accounting for technology improvements that manufacturers would make even in the absence of CAFE standards allows NHTSA to gain a more accurate understanding of the effects of the final rule.” [994]
However, the inclusion of dedicated vehicles in NHTSA's previous analysis impacted materially the standards that ultimately were promulgated.
The agency presented data showing the stringency of the existing CAFE standards for MYs 2022-2026 passenger cars and light trucks as estimated in the 2020 and 2022 final rules and compared those standards to the provisional (
i.e.,
not based on EPA final compliance data) fuel economy performance levels of gas-powered vehicles manufactured for sale in MYs 2022-2024.[995]
The gasoline- and diesel-powered vehicle fleet—the only fleet that NHTSA can consider in setting standards—was unable to comply with the previously estimated standards in all model years and all regulatory classes for which the agency had provisional gasoline- and diesel-powered vehicle fuel economy performance data. The agency observed that the non-compliance increased in each successive model year because the baseline fleet was inclusive of EVs that inflate overall fleet fuel economy performance. The agency noted that, though some may argue that such an analysis is not relevant when conducted across the entire U.S. fleet, because fuel economy standards apply to individual manufacturer fleets, the conclusion that the 2022 standards exceeded maximum feasibility is confirmed on a manufacturer-by-manufacturer fleet level analysis as well. On an individual manufacturer basis, only a single
( printed page 62205)
manufacturer's passenger car fleet could meet the MY 2022 standard with their gasoline- or diesel-fueled vehicles produced for that model year (Hyundai's domestic passenger car fleet), and only a single manufacturer's gasoline- or diesel-fueled light truck fleet could meet their standard (Subaru). NHTSA concluded that this information confirmed that the existing standards were set in a way that considered factors beyond the capability of gasoline- and diesel-powered vehicle fleets at the time the standards were promulgated.
NHTSA also recognized in the proposal that its tentative conclusion that MYs 2022-2023 standards are legally impermissible differs from NHTSA's and EPA's joint 2020 final rule.[996]
However, that final rule also suffered from some of the same deficiencies as the 2022 and 2024 final rules by including consideration of the subsection 32902(h) factors, though to a lesser extent than the 2022 and 2024 final rules because of the inclusion of CARB's ZEV standards in the baseline used for those later rules. Furthermore, the annual 1.5-percent rate of increase applied in the 2020 final rule, which reflected consideration of input provided by several major automakers and other interested parties, had not proven to reflect the real-world year-over-year fuel economy improvements feasible for gasoline- and diesel-powered vehicles.
NHTSA also presented data showing that the same faults apply to the existing standards for MYs 2027 and beyond. For passenger cars, based on NHTSA's updated estimates of manufacturer compliance with the No-Action Alternative, approximately 77 percent of the MY 2027 fleet would not be able to comply with the standard, and only three individual manufacturers' fleets would comply.[997]
NHTSA reasoned that this was likely based on the significant (8 percent, 8 percent, and 10 percent) stringency increases in MYs 2024-2026, which, as discussed in the proposal and in more detail in Section III, greatly exceeded the ability of manufacturers to improve the fuel economy of their ICE fleets.[998]
In fact, NHTSA estimated that the gasoline- and diesel-fueled passenger car fleet would not be able to comply with the standard in any year from MYs 2027-2031, with anywhere from 47 to 77 percent of the fleet out of compliance during those years. Similarly, NHTSA estimated that 91 percent of the gasoline- and diesel-fueled light truck fleet would not be able to comply with the MY 2027 standards, again most likely because of the overly stringent standards in MYs 2024-2026. By MY 2031, NHTSA projected the disparity between the standards and compliance would decrease, more so for non-passenger automobiles, likely because of the two years of flat standards. However, NHTSA projected the gasoline- and diesel-fueled passenger car fleet to miss the No-Action Alternative standards by more than three mpg in MY 2031.
NHTSA concluded that it was apparent that the existing standards depended upon the imputed fuel economy performance of EVs and PHEVs that NHTSA assumed would be manufactured in the relevant model years in contravention of both subsection 32902(h) and of the design and purposes of the CAFE program to avoid setting standards that cannot be met feasibly with gasoline- and diesel-fueled vehicles as part of a push toward alternative powertrains.
NHTSA observed that automakers are unable to meet the current standards without shifting significant capacity to EVs or purchasing credits from EV manufacturers, and that automakers could therefore not continue to produce at volume the full range of ICE-driven passenger cars and light trucks that American consumers continue to want and need. Many of the gasoline- and diesel-powered vehicle models would be unsustainable for manufacturers to produce under the existing standards, and it is unlikely that an EV alternative could provide the same performance, utility, or recreational value at a comparable price (or at all). Thus, NHTSA concluded in the proposal that the existing CAFE standards do not meet market demand, do not preserve consumer choice, and do not recognize the economic realities of the auto industry. The agency noted that automakers are free to invest in the production of EVs in response to market demand, but NHTSA's fuel economy standards should not compel them to do so; such industry-transforming regulatory compulsion is inconsistent with EPCA.
In addition, NHTSA detailed in the proposal how the analyses supporting the existing standards failed to consider countervailing costs to manufacturers, consumers, and society that may have led the agency to conclude that such stringent standards were in fact not feasible. NHTSA explained that the agency had substantially underestimated the technological costs the standards are expected to impose on manufacturers, including the direct expenditures made to redesign and reconfigure gasoline- and diesel-powered vehicles attributable to the acceleration in EV production caused by the regulatory force of the CAFE standards.[999]
Nor did the agency's economic analysis adequately consider the dramatically different supply chain and manufacturing implications of such an acceleration.[1000]
NHTSA stated that the agency underestimated the costs that the typical American would incur in owning and operating an EV (including, among others, charging costs, repair costs, battery-replacement costs, and insurance costs) as compared to the costs of owning and operating a gasoline- or diesel-powered vehicle. And NHTSA failed to quantify in its main analysis of maximum feasible standards costs to consumers from forgone features, including vehicle performance.
NHTSA also outlined that the additional costs to society more generally (not borne just by EV purchasers) include the costs associated with the massive and rapid national buildout of charging infrastructure and
( printed page 62206)
electricity generation and transmission capacity necessary to accommodate the anticipated ramp up in EV sales,[1001]
and the safety concerns accompanying lithium battery fires,[1002]
specifically including costs incurred by State and local governments and first responders to prepare for and respond to the unique circumstances surrounding battery-related fires and emergency situations that will follow from more EVs on the road.[1003]
Most importantly, NHTSA concluded that using the CAFE program to push automakers into producing EVs more rapidly than market demand would otherwise support undermines one of the national security goals behind EPCA because it moves the United States into a position of greater strategic dependence on foreign suppliers of critical automotive inputs, including the processed minerals needed for the manufacture of EV batteries. Such additional societal costs are avoided in the present final rulemaking, which is based on a faithful implementation of EPCA without improperly considering the factors prohibited by section 32902(h).
For those reasons, NHTSA concluded that the existing fuel economy standards for each of the model years covered in the proposal did not comply with the requirements of EPCA and the goals in EPCA for the CAFE program. NHTSA stated that, rather, the existing standards have undermined those goals, harming the freedom and economic interests of America's families, significantly degrading highway safety in all regions of the country, weakening the vitality of the U.S. auto industry, lessening the Nation's security by increasing America's strategic dependence on other countries for EV battery materials, and exacerbating the vulnerabilities of America's electricity grid. NHTSA determined that each of the factors discussed above in isolation would warrant the amendment of the prior standards. Accordingly, NHTSA proposed to set aside the previous light-duty fuel economy standards established for MYs 2022-2026 and MYs 2027-2031 and considered anew the “maximum feasible” replacement standards for the model years in question.
The agency received extensive and detailed comments regarding the legal, economic, and practical merits of the prior CAFE standards, and whether the agency's proposal to amend them was justified. Toyota Motor North America, Inc. (Toyota), NADA, SEMA, the National Association of Manufacturers (NAM), PMI, and AmFree and Corn Growers Associations, among others, commented that the prior CAFE standards contravened subsection 32902(h) by considering EVs in the regulatory baseline.[1004]
NADA asserted that by doing so, NHTSA's 2024 final rule violated EPCA and distorted the fuel economy standards, pushing them beyond what could be achieved with traditionally fueled vehicles.[1005]
Stellantis similarly commented that by including alternative-fueled vehicles in the baseline analysis, “the fuel economy capabilities of the fleet were exaggerated, and led to standards that were overly aggressive and inconsistent with Congressional intent.” [1006]
Likewise, AmFree and Corn Growers Associations noted that the presence of EVs raised the fleetwide average to a level that ICE vehicles could not achieve,[1007]
and IER stated this allowed standards to reach technologically infeasible levels for liquid-fueled vehicles, resulting in a de facto EV mandate because producing EVs became the only possible way for automakers to comply.[1008]
A joint comment from NACS
et al.
also agreed with NHTSA's conclusion that the agency exceeded its statutory authority in prescribing the current standards by considering EVs in a manner that was unlawful.[1009]
Furthermore, several commenters stated that the prior standards represented an unlawful substitution of policy judgment that violated the major questions doctrine. AmFree and Corn Growers Associations, along with API and American Consumer Institute (ACI), asserted that the prior standards violated the major questions doctrine by attempting to force a transition in the U.S. economy to electric vehicles without clear Congressional authorization.[1010]
Similarly, an individual commenter stated that NHTSA's previous fuel economy standards mirrored the EPA's Clean Power Plan, which was struck down by the Supreme Court in
West Virginia
v.
EPA.[1011]
The commenter asserted that using fuel economy standards to force a nationwide transition from gasoline-powered vehicles to electric vehicles represents an unconstitutional expansion of regulatory authority not delegated by Congress.[1012]
Joint States and ACI commented that the prior rules unlawfully pursued a climate-focused agenda that ignored EPCA's energy conservation purpose and the realities of consumer demand.[1013]
Beyond the statutory interpretation concerns raised above, in addition to commenters noting that the previous stringency levels pushed far beyond what internal combustion engine
( printed page 62207)
technologies could achieve, Toyota noted the prior rules compelled an unrealistic 47-percent EV market share by MY 2031.[1014]
NADA and Nissan highlighted that EV sales flatlined in late 2025 following the expiration of IRA tax credits, causing unsold EV inventories to surge to a 149-day supply, and forcing automakers to take billions in write-downs.[1015]
Stellantis similarly commented that “2024MY and 2025MY light-duty EV growth has remained flat, even showing some signs of decline despite even more EV models entering the market.” [1016]
Commenters such as NACS
et al.,
ACI, the ID, MT, ND, SD, and WY DOTs, and an individual commenter emphasized that EVs remain impractical for many Americans due to long charging times, cold weather range degradation, and inadequate rural infrastructure.[1017]
Other commenters also raised safety concerns regarding EV performance in cold weather, noting that significant range loss in winter creates hazards for drivers in mountainous or remote areas.[1018]
The Congressional Western Caucus and NADA added that forced electrification drove the average transaction price of new vehicles to nearly $50,000, pricing middle-class families out of the market.[1019]
Furthermore, PMI pointed to NHTSA's modeling indicating that without EVs, less than 14 percent of the conventional ICE fleet could meet the prior MY 2031 targets, proving they were not technologically feasible for gas-powered vehicles.[1020]
Commenters supporting the proposal also focused on how the prior standards negatively impacted investments in traditional energy sectors. NACS
et al.
commented that the prior standards threatened to chill multi-decade investments in liquid fuel infrastructure (such as tanks, terminals, and pipelines) by signaling the intended obsolescence of liquid fuels.[1021]
They stated that returning the CAFE standards to a focus on vehicles that consume fuel provides the regulatory clarity needed for private-sector capital to flow into refueling infrastructure that benefits every driver.[1022]
Several commenters also agreed with the agency's assessment of the societal and security costs imposed by the prior standards. NACS
et al.
commented that other Federal analyses emphasized diversified energy pathways during grid disruptions.[1023]
PMI commented that forced electrification exacerbates vulnerabilities in a struggling national electricity grid and increases the risk of foreign attacks on domestic power infrastructure.[1024]
ACI similarly noted that widespread EV adoption requires significant upgrades to power distribution systems, the costs of which are passed on to utility ratepayers in the form of higher base rates.[1025]
Conversely, commenters opposing the agency's proposal stated that the current rulemaking violates the APA and EPCA. South Coast AQMD and Save the Sound argued that the agency's characterization of the prior standards as unlawful relied on unsupported suppositions and an interpretive rule that bypassed notice-and-comment procedures, failing to provide the robust administrative record required to reverse prior factual findings.[1026]
The Attorneys General contended that the agency's rationale was pretextual, driven not by statutory factors but by recent Executive Orders.[1027]
Commenters also defended the feasibility of the prior standards and the growing demand for EVs. ZETA submitted data from three reports showing that EV battery costs have decreased by 90 percent since 2010, which they asserted brings the total cost of ownership (TCO) below that of comparable ICE vehicles.[1028]
Several commenters also disputed the agency's statements regarding waning demand for more fuel efficient vehicles, including EVs,[1029]
with the ME DEP noting that EV sales reached record highs in late 2025.[1030]
Furthermore, NRDC
et al.
and ICCT argued that the prior standards did not force electrification; NRDC
et al.
submitted analyses demonstrating that automakers could meet the prior targets by shifting production to the most efficient ICE and hybrid trims they already offer, and ICCT commented that BEVs are present regardless of the existence of CAFE standards, as automakers have made investments and consumers are demanding them.[1031]
Consumer Reports added that weakening the standards denies consumers thousands of dollars in guaranteed lifetime fuel savings in exchange for theoretical sticker-price cuts that historical data suggests will never materialize.[1032]
Finally, several commenters stated their belief that weakening fuel economy standards would undermine U.S. global competitiveness and remove incentives for domestic innovation, causing automakers to stall technological advancement or shift production to other markets, which would ultimately cede the next generation of automotive manufacturing and global market share to foreign competitors.[1033]
Several commenters stated that the agency arbitrarily ignored reliance interests and sunk costs engendered by the prior rules. MEMA, AVE, NRDC
et al.,
ZETA, and ICCT asserted that automakers and component suppliers made billions of dollars in long-lead, irreversible investments based on the regulatory certainty of the previous rules.[1034]
NRDC
et al.
presented data showing that $209 billion has been invested in EV supply chain facilities currently in operation or under construction.[1035]
ICCT provided a detailed accounting showing that major automakers have committed nearly $70 billion by 2030 to retool U.S. plants for
( printed page 62208)
advanced ICE, extended-range electric vehicles (EREVs), and hybrids to meet the prior standards.[1036]
ZETA and NRDC
et al.
also argued that the proposal to eliminate inter-manufacturer credit trading selectively harms EV-only manufacturers by devaluing hundreds of millions of dollars in compliance credits they relied upon as part of their business models.[1037]
Finally, Sabin
et al.,
the Colorado Energy Office and Colorado Department of Transportation (Colorado state agencies), and the Attorneys General outlined public and private investments in nationwide charging networks (such as National Electric Vehicle Infrastructure (NEVI) formula funding and municipal building codes) that rely on a growing EV fleet they claim will be severely undermined by less stringent standards.[1038]
Several commenters criticized the agency's findings regarding the societal and safety costs of the prior standards. In response to NHTSA's assertion that lithium-ion battery fires degrade highway safety, NRDC
et al.
and ZETA cited incident data from the U.S., Sweden, and Norway, showing that ICE vehicles catch fire at rates comparable to or even more than EVs.[1039]
A coalition of Representatives commented that overturning the prior standards will dramatically increase emissions of nitrogen oxide and particulate matter, resulting in 450 premature deaths and nearly 14,000 asthma exacerbations, worsening the affordability crisis for American households facing skyrocketing healthcare costs.[1040]
Regarding national security, ZETA and NRDC
et al.
challenged the agency's claim that EV production harms national security by increasing reliance on foreign critical minerals, arguing that continued dependence on global petroleum markets poses a far greater and historically established threat to U.S. security.[1041]
NHTSA has considered the comments regarding its authority to revise the CAFE standards and maintains that its primary obligation is to implement EPCA as enacted. Subsection 32902(h) contains an explicit, unambiguous prohibition: the agency may not consider the fuel economy of dedicated AFVs when determining maximum feasible average fuel economy levels. NHTSA's inclusion of electric vehicles in baseline calculations for the prior standards constituted a clear legal error that resulted in standards that were premised on impermissible considerations and beyond maximum feasible. NHTSA acknowledges the agency's prior position that exclusion of electric vehicles in the baseline would underestimate the standards that manufacturers could meet by making additional improvements to their gasoline- and diesel-powered vehicles.[1042]
In this final rule, NHTSA has reassessed the CAFE standards in accordance with the statutory text. An administrative agency possesses the authority to correct a prior erroneous interpretation of law and should not maintain a legally unsound framework. Moreover, excluding electric vehicles from the baseline does not constrain the agency's ability to issue meaningful standards reflecting maximum feasible fuel economy levels. Among other things, appropriately estimating the fuel economy value of electric vehicles using an analytically sound petroleum equivalency factor (PEF) has the potential to harmonize the standards with real-world market conditions. NHTSA's prior position failed adequately to account for the potential of the PEF to preserve meaningful fuel economy levels in such a way.
In this final rule, NHTSA reassessed the CAFE standards in accordance with the statutory text. An administrative agency possesses the authority to correct a prior erroneous interpretation of law and should not maintain a legally unsound framework.
Regarding the feasibility of the prior standards, though some commenters stated that manufacturers could achieve compliance through advanced internal combustion engine refinements and hybrid configurations alone, the agency's modeling presented in the proposal and this final rule demonstrates that—regardless of balancing factors—there would be significant under-compliance with the existing standards based on the capability of the gasoline- and diesel-powered vehicle fleet. The agency has also carefully evaluated the comments concerning reliance interests and capital investments made by automakers, component suppliers, and charging network developers under the previous rules. Nothing in this rule prohibits vehicle manufacturers that have invested in EV manufacturing from producing and selling those vehicles. With respect to non-regulated entities, such as charging equipment suppliers and State programs, NHTSA's statutory authority is strictly limited to prescribing vehicle fuel economy standards and does not extend to implications of those standards for broader infrastructure investments; the economic expectations of market actors in these sectors cannot expand the agency's defined legislative authority.
Instead, NHTSA must remain within the boundaries established by its enabling legislation. Although the proposal contained a discussion of the market, infrastructure, and economic challenges currently facing electric vehicles, similar to observations made by other stakeholders, these observations provided context on the state of the light-duty vehicle market, and do not inform the methodology used by NHTSA in this standard-setting action. In compliance with subsection 32902(h), NHTSA excluded alternative powertrains when determining maximum feasibility, ensuring that the final standards are derived solely from what is feasible and practicable for the gasoline- and diesel-powered fleet.
The analytical conclusions reached in this final rule diverge from those underpinning the 2020, 2022, and 2024 rulemakings, a result necessitated by a corrected legal framework, as discussed in this section, and an appropriate balancing of the factors for assessing maximum feasibility, as discussed in more detail below. Unlike the analyses supporting the prior standards, the baseline and simulated fleets evaluated in this analysis are restricted to avoid the unauthorized consideration of dedicated alternative fueled vehicles under subsection 32902(h). Regarding comments stating that NHTSA failed to provide a comprehensive record or factual findings related to its tentative conclusion that the prior standards were beyond maximum feasible, the agency's quantitative analysis and discussion of the No-Action Alternative in the proposal and this final rule demonstrates that the prior standards were beyond maximum feasible. NHTSA provides additional discussion regarding the results of the agency's analysis, including the results of the No-Action Alternative modeling, in the following subsection. Because the agency must evaluate maximum feasibility based on the statutory factors,
( printed page 62209)
subsection 32902(h) limitations, and updated economic assumptions reflective of the current broader context, these compounding legal and factual shifts require a standard-setting determination and analysis distinct from prior administrative actions.
In sum, the overriding purpose of this reconsideration is to bring the CAFE program into compliance with subsection 32902(h). Having reviewed the legal and analytical record from the prior rules, in addition to the agency's updated quantitative and legal analysis, NHTSA has determined that, pursuant to its delegated authority, resetting the standards promulgated in 2020, 2022, and 2024 is necessary to align those standards with the statutory text. This adjustment restores the program to its proper statutory text-based foundation, ensuring that fuel economy targets remain strictly within the parameters authorized by EPCA.
2. Considerations Justifying the Final Standards
NHTSA discussed in the proposal that EPCA authorized the Secretary of Transportation (and NHTSA by delegation) to prescribe maximum feasible fuel economy standards for the light-duty vehicle fleet, and to exercise discretion in weighing the factors for determining maximum feasibility in section 32902(f): technological feasibility, economic practicability, the need of the United States to conserve energy, and the effect of other motor vehicle standards of the Government on fuel economy. For the proposal, NHTSA examined three regulatory alternatives that, in addition to the No-Action Alternative, represented distinct ways the agency could balance the four factors, consistent with the subsection 32902(h) prohibition on considering certain factors when setting maximum feasible standards.
NHTSA also discussed in the proposal that the agency considered other aspects of the statute in formulating the proposal's three regulatory alternatives. One original aspect of the CAFE program that the agency had abandoned in the development of existing standards is the concept of “steady progress.” EPCA's original provision for the MYs 1981-1984 standards included a requirement that the agency's standards “will result in steady progress toward meeting” the statutorily established “standard . . . for model year 1985.” [1043]
EISA amended EPCA to include a similar provision for MYs 2011-2020 standards to “increase ratably” to the statutorily prescribed 2020 level.[1044]
While EPCA does not include the same requirement for standards applicable to MYs 2021-2030, NHTSA stated in the proposal that small, steady, incremental increases in fuel economy standards over time, while preserving the ability for manufacturers to focus on safety, affordability, and consumer choice, are reasonable and balance EPCA's priorities appropriately. Further, NHTSA stated that while the agency cannot consider the availability of credits or credit trading in establishing standards, eliminating the credit trading system beginning with MY 2028 would encourage manufacturers to provide for steady improvement in fuel economy across their gasoline and diesel-fueled fleets over time, as opposed to abandoning such improvements in favor of transition to EVs or relying upon credits acquired from third-party EV manufacturers to cover non-compliance with unattainable standards.
The three regulatory alternatives increased standards at modest rates beginning in MY 2022. In support of the agency's proposed Preferred Alternative, Alternative 2, NHTSA examined several quantitative outcomes from the CAFE Model analysis, including estimates of technology penetration rates, manufacturer compliance levels compared to the standards, technology cost decreases, sales, labor, and safety measures, and changes in both estimated fuel use and changes in the pollutants emitted from vehicles as a result of changes in fuel use. The agency also discussed qualitatively several factors, including consumer demand for different types of vehicles and vehicle technologies, the tradeoffs between higher upfront vehicle prices and encouraging incremental technology improvements to spread throughout the fleet more quickly, and, importantly, whether there was a continued need for the United States to push for higher fuel economy standards given the Nation's status for several years as a net energy exporter.
The agency received extensive comments regarding its overall determination of maximum feasible fuel economy levels and how it balanced the statutory factors. AFPM noted that Congress intended the agency to set attainable standards that balance national energy needs with technological and economic realities, without imposing impossible burdens or limiting consumer choice.[1045]
The Competitive Enterprise Institute (CEI) supported the agency's decision to weigh the Nation's need to conserve energy less heavily, pointing to diminishing returns from higher standards, rising domestic petroleum production, and an unaffordable new car market as valid justifications for setting standards at the proposed levels.[1046]
CEI noted that large percentages of the fleet could not meet the existing MY 2022 standards, necessitating a rollback driven by the statutory restriction on considering alternative fueled vehicles.[1047]
AmFree and Corn Growers Associations similarly commended the agency for prioritizing vehicle affordability and safety, arguing that the removal of the electric vehicle baseline correctly aligned the program with statutory constraints.[1048]
AmFree and the Corn Growers Associations also recommended that the agency go even further than the proposed alternatives and adopt a zero percent stringency increase to protect American families.[1049]
NACS
et al.
submitted comments regarding the analytical baseline used to calculate the costs and benefits of the rule.[1050]
They recommended that the agency present the MY 2021 standards as a primary or alternative No-Action baseline, rather than the existing MY 2022-2031 standards.[1051]
They argued that because the existing standards are legally flawed, using them as a baseline creates incongruities in the analysis, whereas reverting to the MY 2021 standards would better reflect actual implementation and align with longstanding agency practice and administrative guidance.[1052]
Conversely, the agency received several comments arguing that the proposal unlawfully deprioritized energy conservation. NRDC
et al.,
ZETA, and the Attorneys General stated that the fundamental, overarching purpose of the statute is energy conservation, and that the agency impermissibly elevated what they consider non-statutory factors such as safety, affordability, and consumer choice over this explicit goal.
[1053]
( printed page 62210)
Furthermore, the Attorneys General commented that the agency reversed its long-held position that conserving energy provides massive economic, environmental, and national security benefits, arguing that this reversal was executed without adequate acknowledgment or explanation.[1054]
NRDC
et al.
also commented that the agency's focus on correcting perceived market distortions misunderstands the fundamental purpose of the fuel economy program, which is designed to address market failures by pushing automakers to apply more fuel-saving technology than market forces alone would dictate.[1055]
The agency also received several comments that the proposed stringency levels fell far below the fleet's demonstrated capabilities, which violated the statutory requirement to set maximum feasible standards.[1056]
Similarly, several commenters pointed out that the proposed targets are weaker than what the gasoline and diesel fleets have already achieved.[1057]
Based on the existing vehicle classification regulations, the Attorneys General noted that the MY 2024 passenger car and light truck fleets achieved 41.2 mpg and 30.5 mpg respectively, yet the proposal would require only 37.4 mpg and 28.6 mpg for the reclassified fleet by MY 2031.[1058]
AVE commented that the statute requires maximum feasible improvements and does not permit the agency to default to incremental adjustments or prioritize compliance convenience over petroleum savings.[1059]
Furthermore, NRDC
et al.
and the Attorneys General emphasized that the agency's modeling projected significant over-compliance by the gasoline and diesel fleets, relative to the proposed standards.[1060]
The Attorneys General pointed to data in the proposal showing that the modeled fleet is projected to outperform the new standards by anywhere from 2.7 to 17.4 mpg.[1061]
NRDC
et al.
and UCS submitted comments that, based on the agency's assumptions, the proposed standards would have the exact same effect on fleet fuel economy as a one mile-per-gallon standard, effectively providing no regulatory incentive for improvement and rendering the standards a mere nullity.[1062]
Finally, NRDC
et al.
commented on what they perceived to be a lack of explanation regarding the agency's balancing of the statutory factors.[1063]
They noted that while NHTSA claimed to have balanced the criteria appropriately, it failed to provide a reasoned explanation for how competing policy priorities were resolved to arrive at the conclusion that the proposed levels represent the maximum feasible standards.[1064]
In addition, they commented that because the agency claimed its preliminary judgment was not based on its model, the agency unlawfully failed to disclose the actual information and evidence it relied upon to make its stringency determinations, violating its obligations under the APA.[1065]
The standard-setting process must remain within the boundaries established by subsection 32902(h). The empirical compliance data confirming industry-wide shortfalls under the prior standard-setting framework demonstrates that past standards exceeded the level achievable by the gasoline- and diesel-powered fleet. However, NHTSA is declining to adopt a zero percent stringency increase as suggested by some commenters. By selecting a framework of predictable increases achievable through gasoline and diesel technologies, the agency achieves the maximum feasible standard by giving appropriate weight to both the need of the United States to conserve energy and the range of factors that contribute to an economically practicable standard.
Regarding comments on the agency's choice of baseline, NHTSA's selection of the analytical baseline is governed by long-standing regulatory accounting practices and the directives of OMB Circular A-4. The No-Action baseline must accurately reflect the regulatory environment that would exist in the absence of proposed agency action. Because the standards for MYs 2022-2026 and MYs 2027-2031 were formally promulgated and remain legally binding upon the regulated industry until amended or vacated, they constitute the necessary baseline for measuring the potential economic impacts of the rulemaking. The legal conclusion that the prior framework improperly incorporated AFV technologies is correct and unavoidable. Utilizing the previously codified standards as the baseline ensures a transparent accounting of the potential cost reductions, technology penetration changes, and energy conservation adjustments. NHTSA performed additional sensitivity analyses for this final rule that removed the requirement that manufacturers attempt to comply with standards for MYs 2024-2026,[1066]
and the results of that analysis are discussed below and in FRIA Chapter 9. This sensitivity analysis also allowed the modeled compliance solution to differ from the No-Action Alternative during these years.
NHTSA disagrees with the premise that energy conservation must be pursued to the exclusion or minimization of the other statutory criteria—the statute quite literally instructs otherwise. While energy conservation is a foundational goal of the statute, subsection 32902(f) explicitly commands the agency to consider four distinct factors: technological feasibility, economic practicability, the need of the United States to conserve energy, and the effect of other motor vehicle standards of the Government. As discussed above, the text of the statute does not subordinate economic practicability to energy conservation. In an era of domestic petroleum abundance enabling the United States to become a net exporter of petroleum (quite different from the Nation's historical reliance upon petroleum imports from foreign adversaries during the passage of EPCA and even EISA), placing less weight upon the factor of energy conservation is reasonable, and, indeed, natural. That said, NHTSA has not disregarded the benefits of petroleum conservation, and is, in fact, placing heavier weight on this factor in selecting a more stringent final standard than proposed, as discussed further below.
NHTSA recognized in its proposal that the Preferred Alternative, Alternative 2, set standards for MY 2031 below what the fleet had achieved in
( printed page 62211)
MY 2024. NHTSA explained in the proposal that besides the obvious effects of considering the subsection 32902(h) technologies in prior standards, the seemingly high compliance levels in the light truck fleet in MY 2024 are related to the current inclusion of passenger-focused vehicles in that fleet. Moving high-volume crossover and SUV models out of the light truck fleet and into the passenger car fleet structurally lowers the mathematical average of both individual regulatory fleets, even though the physical efficiency of the individual vehicles and combined fleet average fuel economy remain unchanged. Consequently, the previous classification of an overly restricted passenger car fleet alongside an overly broad light truck fleet created a structural imbalance that artificially inflated baseline fuel economy levels in each fleet, obscuring the true operational capabilities of each independent vehicle category. NHTSA also stated that it was reasonable to reset standards at levels that did not artificially inflate vehicle fuel economy capabilities, noting that that the agency had previously overestimated manufacturer ability to apply technologies based on incongruent product design cycles and manufacturing capabilities, or underestimated manufacturer needs to deploy capital for necessary reasons unrelated to fuel economy (like safety technology).
Regarding the modeling projections showing fleet over-compliance between 2.7 and 17.4 mpg, NHTSA discussed in the proposal that this outcome was driven in part by the application of technologies by the CAFE Model to comply with the unachievable MYs 2024-2026 standards embedded in the No-Action baseline. While NHTSA maintains that the MYs 2024-2026 standards constitute the appropriate No-Action baseline for purposes of the central analysis, the agency conducted supplemental sensitivity analyses that project significantly less over-compliance when the Model excludes hypothetical technology applications that manufacturers never actually integrated into their fleets. NHTSA discusses these cases in more detail below and in FRIA Chapter 9. In addition, NHTSA also recognized in the proposal that the agency must set standards applicable to the entire automotive industry; NHTSA stated that it does not intend for its proposed reset standards to penalize manufacturers that increased their fleet fuel economy values using EV or PHEV technology, which left them with a lower fleet fuel economy value when only vehicles powered by gasoline and diesel fuels are considered. Rather, NHTSA tentatively concluded that resetting standards at a level where manufacturers can respond to market demand, consider affordability, and consider safety—all while being subject to continuously increasing standards—would better reflect consumer needs and preferences, and promote a healthier and better-balanced CAFE program.
Finally, in response to NRDC
et al.'
s comment that NHTSA failed to disclose its exact balancing of the subsection 32902(f) factors, NHTSA reminds commenters that standards are not generated by plugging inputs into a model and receiving an objectively correct result. Instead, NHTSA undertakes a balancing process that complies with EPCA, and the reasoned decision-making required by the APA. EPCA granted the Secretary broad administrative discretion to synthesize and balance the qualitative and quantitative factors set forth in subsection 32902(f). The agency's determination represents a holistic exercise of this discretion, balancing the quantitative engineering and economic outputs of the CAFE Model against qualitative, real-world market constraints. All data inputs, baseline fleet configurations, and model parameters used to inform the agency's technical analysis were disclosed in the proposal and the accompanying technical documents. The proposal's Preferred Alternative represented the point at which the agency determined preliminarily that continuous, steady efficiency progress could be sustained against economic practicability concerns facing consumers and manufacturers, and without encroaching upon the statutory prohibitions of subsection 32902(h). The determination of what constitutes maximum feasible fuel economy levels has consistently been recognized as a fluid and dynamic inquiry based on the four statutory factors, rather than a static calculation. The agency's standard-setting methodology maintains a careful equilibrium between rigid quantitative modeling data and qualitative consideration. This long-standing analytical flexibility ensures that NHTSA can reconcile shifting macroeconomic conditions and real-world market constraints while remaining anchored within the boundaries established by Congress.
For the final rule, in response to comments and the agency's own updated analysis, NHTSA considered both the three alternatives considered in the proposal and two additional alternatives for each set of MYs, 2022-2026 and 2027-2031. The following sections discuss the agency's consideration of each factor as applied to the range of alternatives considered in the proposal, comments on the agency's analysis, and the agency's updated assessment of each factor in response to comments and the updated range of regulatory alternatives.
a. Technological Feasibility
NHTSA tentatively concluded in the proposal that technological feasibility continued to be less constraining than in the past: manufacturers could comply with standards under each proposed alternative by applying existing technology to their vehicles. NHTSA noted that whether that technology could be applied to vehicles in the rulemaking timeframe and at what cost is a question of economic practicability and not technological feasibility; as NHTSA stated in 2020, all alternatives could be considered technologically feasible, but that does not mean that any of them could be maximum feasible.[1067]
Put another way, “[a]ny of the alternatives could thus be achieved on a technical basis alone if the level of resources that might be required to implement the technologies is not considered.” [1068]
However, the level of resources needed to apply those technologies and whether consumers will purchase vehicles equipped with those technologies are still prescient factors to consider, and the agency included those discussions with regard to the economic practicability of the standards.
The proposal evaluated baseline technology penetration and achieved fuel economy levels under the rubric of economic practicability because the agency had tentatively concluded that all technologies evaluated in the analysis are available for commercial application in the rulemaking timeframe. However, given the close intersection between projected required and projected achieved fuel economy levels and technology penetration rates, the following discussion further examines the technology penetration rates and fuel economy levels for the standards modeled in this final rule, while the discussion in Section V.C.2.b (Economic Practicability) discusses the cost of each associated level of technology application.
The proposal observed that different manufacturers had taken different pathways to fuel-economy-improving technology application, resulting in a
( printed page 62212)
fleet that was relatively bifurcated in terms of technology solutions. Some manufacturers had deployed capital into EVs at the expense of ICE improvements, while others invested in hybrid powertrains. The agency noted that when evaluating the actual capabilities of the ICE fleet—which is required by EPCA's command to base standards on vehicles powered by liquid or gaseous fuel, as defined by the statute—the data revealed significant under-compliance. The agency reasoned that this under-compliance demonstrated that the prior standards exceeded maximum feasibility, as manufacturers could only meet the targets by utilizing compliance flexibilities such as dedicated AFVs and credit transfers that NHTSA is prohibited from considering.
The proposal also discussed NHTSA's belief that prior standards forced the application of technologies that consumers may not demand. For instance, the agency noted that consumers frequently choose to deactivate stop-start (SS12V) systems when able to do so, entirely negating the technology's projected fuel economy benefits. The agency also explained that manufacturers have limited capital. Requiring manufacturers to apply expensive fuel-saving technologies that consumers do not seek requires manufacturers to sacrifice investments in vehicle safety technologies. NHTSA tentatively concluded that maximum feasible standards must allow manufacturers to deploy both proven efficiency and safety-enhancing technologies while keeping new vehicles affordable.
The agency's modeling in support of the proposal illustrated the economic impracticability of leaving the prior standards in place. The CAFE Model projected that attempting to meet the No-Action Alternative for MYs 2027-2031 without the use of EVs or PHEVs in charge-depleting mode would necessitate a massive increase in the production and sale of strong hybrid vehicles. Even with this forced hybridization, the model showed manufacturers failing to comply with the baseline standards, by more than one mile per gallon. The agency also cautioned that such aggressive hybrid penetration rates may be unrealistic. While the market share of strong hybrids has doubled since 2020 alongside rising gas prices, real-world data shows that strong hybrid penetration has historically grown by no more than approximately five percentage points year-over-year.[1069]
Because the baseline MY 2024-2026 standards increased at rates of 8 and 10 percent per year—far exceeding historical ICE technology improvement rates—the model was forced to assume unrealistic hybridization pathways. By resetting the standards, the agency projected that less effective technologies like SS12V would drop, and strong hybrids would remain a viable option for gas-price-conscious consumers, rather than required to meet overly stringent standards.
Finally, the proposal addressed how overly stringent CAFE standards can drive adverse changes in vehicle attributes and market offerings. The agency noted that EPCA established separate categories for passenger and non-passenger automobiles to preserve consumer access to vehicles with necessary cargo and off-highway capabilities. However, past CAFE standards created market distortions by establishing a mismatch in stringency that incentivized manufacturers to alter vehicle attributes to ensure passenger-carrying vehicles would be classified as less stringently regulated light trucks.
To correct this, the agency proposed to update the regulatory class definitions, starting in MY 2028, moving many models classified as light trucks into the passenger car fleet to which they properly belong by virtue of their being designed and used primarily to transport passengers. The agency tentatively concluded that this reclassification would ensure the light truck fleet consists strictly of vehicles with attributes contemplated by the statute for non-passenger capabilities. Although this shift lowers the average fuel economy values of both individual fleets (even while leaving the actual average fuel economy of the combined fleet unchanged), the agency tentatively concluded that coupling this reclassification with a reset of the footprint coefficient curves at sustainable levels would eliminate the incentive to manipulate vehicle attributes, thereby preventing the CAFE program from improperly disincentivizing the production of affordable passenger automobiles.
The agency received several comments on technology availability and how that availability impacts the projected manufacturer-achieved fuel economy levels. Honda noted that advanced internal combustion engine technologies are capable of supporting year-over-year stringency improvements that exceed the proposed 0.25-percent floor, which they stated would provide long-term investment certainty and maintain global competitiveness.[1070]
MEMA and MECA commented that reducing stringency to the levels in Alternatives 1 or 2 would create a technological deployment gap, weakening the market signals required to sustain the domestic manufacturing of fuel efficiency technologies.[1071]
To illustrate this impact, MECA pointed to the agency's PRIA, which showed that under the proposal's Preferred Alternative, only two out of eleven ICE and powertrain technologies would see modest single digit increases in market penetration, while five would experience decreases.[1072]
MEMA recommended the adoption of Alternative 3 or a modified Alternative 3+ to preserve continuity with prior planning assumptions.[1073]
Several commenters also pointed to specific over-compliance projections generated by the CAFE Model within the rulemaking timeframe.[1074]
SELC highlighted that the agency expects many manufacturers to exceed their targets by 15 percent or more across all evaluated alternatives.[1075]
MECA, among other commenters, noted that projections showed industry-wide over-compliance by 11.8 mpg in MY 2027 and 6.8 mpg in MY 2031.[1076]
Given these margins, MECA recommended that the agency's projected achieved fuel economy values should be adopted as the standards.[1077]
AVE provided a detailed inventory of technologies already deployed at production volumes that allow vehicles to exceed the proposed targets, including advanced combustion, direct injection, turbocharging, CVTs, improved thermal management, waste-
( printed page 62213)
energy recovery, engine friction reduction, start-stop systems, cylinder deactivation, and aerodynamic improvements.[1078]
NRDC
et al.
and Consumer Reports noted that consumer demand for highly efficient strong hybrid vehicles is expanding rapidly, adding that these configurations frequently offer superior performance, reliability, and safety compared to conventional internal combustion engine vehicles.[1079]
Regarding component-level technologies, the Attorneys General challenged the agency's assertion that consumers frequently deactivate start-stop systems, stating that the agency provided no empirical data to support this conclusion.[1080]
They further commented that the engineering capability to disable a feature manually expands, rather than restricts, consumer choice and vehicle utility.[1081]
The agency has carefully evaluated the detailed technical data submitted by AVE, MEMA, and MECA regarding currently deployable, multi-pathway efficiency technologies—including advanced combustion, direct injection, turbocharging, continuously variable transmissions, engine friction reduction, and aerodynamic improvements. As discussed above, NHTSA considers these technologies in its analysis, except for technologies that the agency cannot consider under subsection 32902(h).
In response to comments suggesting that the achieved fuel economy levels should be adopted as the standards, the agency emphasizes the fundamental distinction between regulatory modeling projections and statutory mandates. The CAFE Model's optimization simulations often indicate that certain manufacturers will, for assorted reasons including baseline technology levels or product mix, outpace other individual manufacturers in the adoption of fuel-saving technologies. However, though NHTSA has long rejected a “least-capable” manufacturer approach to setting standards, converting these achieved levels into a uniform, industry-wide standard would ignore the compliance constraints faced by less capable manufacturers, which may render such average achieved levels economically impractical for substantial portions of the industry. Regarding comments about technology forcing or mandating standards, NHTSA does not mandate any technology pathway to meet standards but instead models potential cost-effective technology pathways that manufacturers could use to do so. NHTSA also discusses comments regarding “technology forcing” standards in Section V.A, above.
In response to NRDC
et al.
and Consumer Reports' comments on consumer technology preferences, NHTSA intends for the final fuel economy standards to align with technology application at a pace that maintains a diverse product mix and that does not incentivize the application of any technology. If manufacturers find that their consumers benefit from having SS12V technology on their vehicles, they can continue to employ it. NHTSA does not disagree that consumer demand for strong hybrid vehicles is growing; rather NHTSA's discussion in the proposal addressed whether the demand could conceivably grow as much as the results from the CAFE Model showed. As discussed in the proposal and in more detail below, the aggressive strong hybrid penetration rates are a result of the Model's applying technology to meet extremely aggressive MYs 2024-2026 standards. Because many manufacturers have not met the projected strong hybrid electric vehicle penetration rates in the pre-standard-setting years (MYs 2025 and 2026), NHTSA performed two sensitivity analyses that may more accurately model how ICE fleets added technology in those early years.
However, in response to comments and the agency's reevaluation of its regulatory analysis considering updated assumptions and information, NHTSA examined additional regulatory alternatives for the final rule analysis that resulted in increased required and projected achieved fuel economy levels, and that resulted in additional technology application.
As in the analysis presented in the proposal, the final rule analysis developed using the CAFE Model estimates a significant amount of technology application in the vehicle fleet in all simulated scenarios by assuming the prior MYs 2024-2026 standards exist in the regulatory baseline. The CAFE Model does not remove technology from vehicles in the face of less stringent standards, meaning that any technology applied by the model to reach the existing stringent MYs 2024-2026 standards (modeled in accordance with Circular A-4's definition of a “No-Action baseline”) will continue to exist in the fleet in the model for MYs 2027-2031. While manufacturers invest significant capital in developing new vehicle technologies and may try to recoup their investments, it is entirely possible that manufacturers may choose to discontinue employing particular technologies earlier than anticipated or may price their vehicles in a way that would shift sales from a vehicle model using one technology to a vehicle model using another when faced with the proposed standards. NHTSA presents technology penetration rates for MYs 2027-2031 below but recognizes that manufacturers' responses to standards will be different in ways that the simulated analysis cannot capture.
The CAFE Model projections for MY 2031 demonstrate specific adjustments in fleetwide technology penetration rates across the regulatory alternatives relative to the No-Action baseline. The largest adjustments occur in SHEV penetration, which declines by 25 to 30 percent under Alternatives 1 through 4, compared to a 3.6-percent reduction under Alternative 5. PHEV penetration rates decrease consistently by approximately five percent across all action alternatives. For conventional powertrains, HCR engine technology increases by a few percentage points beginning in MY 2027, the first standard-setting year, in all options except the No-Action baseline and Alternative 5, while basic engine and advanced gasoline technologies decrease across all scenarios. Turbocharged engine deployment remains stable under Alternatives 1 through 4 but decreases at similar rates under the No-Action baseline and Alternative 5. In addition, the application of the highest-level road load reduction technologies decreases from the baseline to the lower alternatives but increases progressively as the regulatory alternatives become more stringent, with the exception of the highest levels of high rolling resistance tires, which are applied at consistent levels across the alternatives.
Table V-2 shows selected technology penetration rates for each alternative.
( printed page 62214)
( printed page 62215)
The proposal discussed reasons why the modeled hybrid penetration rates would likely not come to pass. For the final rule, NHTSA performed two additional sensitivity analyses, one assuming that standards in MYs 2024-2026 were set to 1 mpg and allowing the action alternative solutions to differ from the No-Action Alternative during those years, and one capping SHEV technology adoption rates at 25 percent by MY 2030 and PHEV technology adoption rates at two percent by MY 2030.
Table V-3 shows technology penetration rates with a 1 mpg standard for MYs 2024-2026, which effectively assumes that manufacturers did not attempt to comply with the prevailing CAFE standards in those years and instead only applied the technology the Model deemed cost effective—
i.e.,
adding technology that would pay for itself in projected fuel savings within the initial 36 months of use.
( printed page 62216)
( printed page 62217)
Even though the Model assumes that hybrid technology is cost effective to apply, manufacturers have not broadly applied SHEV or PHEV technology at rates reaching the levels estimated in the analysis, for various reasons including alternative compliance pathways. For instance, while SHEVs make up 50 percent of Toyota's MY 2024 fleet, GM's MY 2024 fleet consists of 0.05 percent SHEVs; the average SHEV penetration across an OEM's fleet is 4.6 percent.[1082]
As such, NHTSA also performed a sensitivity case examining what a cap on modeled hybrid and PHEV technology penetration rates would mean for the application of other ICE technologies. Table V-4 shows a technology penetration rate using a phase-in cap for SHEV and PHEV technology.[1083]
Further discussion on this sensitivity case can be found in FRIA Chapter 9.2.5.
( printed page 62218)
( printed page 62219)
As expected, capping the SHEV penetration rate results in SHEV penetration levels more in line with expected levels going into MY 2027. On the other hand, NHTSA recognizes that the SHEV phase-in cap sensitivity case, like many of the cases presented in this final rule, represents a counterfactual world where manufacturers had not taken all available compliance pathways to comply with prior standards, including those pathways that NHTSA cannot consider when setting standards. SHEV adoption looks similar for Alternatives 1-3 across both sensitivity cases but increases in the non-binding MY 2024-2026 standards case as Alternatives 4 and 5 become more stringent in the standard-setting years. NHTSA expects manufacturer pathways to compliance for their gasoline- and diesel-powered fleets to fall across this range of sensitivity cases; for the half or so of manufacturers that had a robust SHEV program already, they might fall towards the central case on the spectrum, whereas the half or so of manufacturers that had pursued alternative compliance pathways that NHTSA cannot consider when setting standards would fall towards the other.
As discussed in Section II regarding compliance simulation, the CAFE Model applies technology subject to several real-world constraints, like accounting for manufacturers' product design cycles and sharing vehicle technologies across platforms. Based on a combination of factors unique to each manufacturer, the compliance simulation ends with different manufacturers achieving different fuel economy levels relative to the standards. In addition, some manufacturers' distinct regulatory fleets (
i.e.,
passenger car and light truck) may perform differently relative to each standard. With some exceptions, manufacturers are projected to meet or exceed standard levels in Alternative 3, the Preferred Alternative in this final rule. In the domestic car fleet, manufacturers meet targets through Alternative 4 except Ford, remaining short of target levels in MYs 2028 and 2029 before vehicle reclassification changes go into effect for MY 2030.[1084]
The imported car fleet sees similar trends in compliance across manufacturers and model years. Ford enters this fleet with reclassification in MY 2030 and achieves compliance in all action alternatives other than Alternative 5. Volvo under-complies with its targets in MY 2027 for Alternatives 2 and 3 but over-complies once sufficient vehicles are eligible for refresh and redesign in subsequent model years. Across both passenger car regulatory classes, several manufacturers fall short of compliance under the higher stringency alternatives, Alternatives 4 and 5. Most manufacturers comply with standards in the light truck fleet across alternatives and model years. JLR does not meet compliance levels in Alternatives 4 and 5, while Mercedes-Benz, Nissan, and Stellantis miss targets in Alternative 5. Figure V-1 and Figure V-2 show manufacturers' estimated compliance positions relative to the standards. The figures report over-compliance or shortfall in mpg (cell shading indicates shortfalls):
( printed page 62220)
( printed page 62221)
Consistent with the analysis presented in the proposal, the tables show most manufacturers under-complying significantly in each fleet under the baseline standards. While some manufacturers' shortfalls may not seem significant, the cost to each manufacturer to reach those levels must be considered alongside performance, and that cost is discussed below in more detail regarding the economic practicability of the standards. There is also more compliance with the baseline standards in the light truck fleet, where reclassification does not occur and manufacturers can continue using vehicles built largely for passenger-carrying purposes, like CUVs, to comply with the standards.
Under the regulatory alternatives, different manufacturers would have difficulties complying depending upon fleet. There remains some over-compliance in the least stringent alternatives because the existing fleets used to establish the baseline were designed to meet extremely stringent MYs 2024-2026 standards, and there is significantly more under-compliance for individual manufacturers under the more stringent regulatory alternatives. By Alternative 5 in MY 2031, major manufacturers are unable to comply by several mpg in each regulatory fleet, particularly in the passenger car fleet, which will contain the large majority of sales volumes after reclassification in MY 2030. The over-compliance in Alternative 2 that some commenters identified in the proposal is still present for approximately half of manufacturers, whereas the other half are still projected to achieve fuel economy levels much more in line with the standard levels. In Alternative 3, that over-compliance again decreases as the standards become more stringent.
Under the two sensitivity cases discussed above (one assuming that manufacturers did not attempt to comply with the MYs 2024-2026 standards, and one that capped hybrid and plug-in hybrid technology adoption rates), compliance with standards by MY 2031 decreases significantly under the MYs 2024-2026 non-binding standards case, and to a lesser extent under the SHEV/PHEV cap case. NHTSA expects that manufacturers that used a hybrid pathway in the real world to comply with standards would see over-compliance levels more similar to these levels, whereas manufacturers that used a combination of ICE and EV technologies to comply with standards would not.
( printed page 62222)
( printed page 62223)
( printed page 62224)
( printed page 62225)
Considering the central case analysis and two sensitivity cases evaluated above, NHTSA views the general over-compliance in the early years in the lower stringency alternatives not as an anomaly, but as a correction to address distortions resulting from standards that had exceeded maximum feasibility in the past. In response to standards based upon consideration of prohibited factors, manufacturers invested significant capital into fuel-saving technology that has played a significant role in heightened new vehicle costs. Providing for less stringent standards in the early years of this rulemaking is not a reflection that the standards are too low, but an acknowledgement that previous standards were too high, and that manufacturers were forced by regulation to improve fuel economy performance at rates that exceeded those that would be maximum feasible had the agency adhered to statutory restrictions. By resetting the standards to comply with statutory restrictions and appropriately balance the statutory factors, NHTSA expects that manufacturers will reduce upfront vehicle costs, enhance consumer choice, and ensure a range of vehicles are easier to manufacture. Setting maximum feasible fuel economy standards that consider economic practicability for consumers helps protect entry-level, low-margin passenger cars from disproportionate regulatory burdens. This approach directly responds to concerns raised by manufacturers of small-footprint vehicles regarding recent stringency increases, while simultaneously addressing broader economic concerns over rising new-vehicle transaction prices. This approach prevents automakers from either passing steep, front-end technology costs directly onto budget-conscious consumers or pulling entry-level models from the market entirely. As NHTSA stated in the proposal, while consumer preferences change over time, the CAFE program should not set standards that drive changes in market offerings, particularly if it drives changes that decrease market offerings that are more affordable to consumers.
b. Economic Practicability
In the proposal, the agency explained that its consideration of economic practicability encompasses a broad array of elements, including available technology and application cadence, compliance shortfalls, increases in vehicle costs and resulting impacts on consumer demand, sales and employment impacts, and safety. The agency emphasized that while technological feasibility asks whether a fuel-economy-improving technology exists, economic practicability questions the economic consequences of implementing that technology in the fleet on a wide-spread basis, particularly when consumer demand for such technology is lacking.
A central focus of the economic practicability analysis presented in the proposal was vehicle affordability. The agency projected that the proposed alternatives would reduce technology costs by half compared to the baseline, saving consumers more than $900 in upfront vehicle costs by MY 2031. These upfront savings were projected to trigger cascading reductions in registration, insurance, and financing
( printed page 62226)
costs. While the proposal estimated that, over a vehicle's expected lifetime, additional fuel costs would exceed these upfront savings by approximately $500 for the Preferred Alternative, NHTSA reasoned that the upfront savings would make new vehicles affordable for more consumers in the nearer term, while preserving the ability of manufacturers to produce more fuel-efficient vehicles for the consumers who demand them.
The proposal further examined how affordability improvements translated to sales, employment, and safety impacts. NHTSA projected that lower vehicle prices would increase overall sales, thereby getting Americans into newer, safer vehicles more quickly. NHTSA also observed that modeled employment impacts were estimated to change by less than one percent compared to the baseline but also noted that the agency had not highlighted the results of its analysis in recent rulemakings because of its limited scope and the uncertainty introduced by rapidly changing labor inputs for vehicle assembly and technology development.
Finally, NHTSA provided a detailed safety assessment, emphasizing that, as new vehicles become unaffordable, consumers hold onto older, less safe vehicles—a phenomenon that has pushed the average age of the fleet toward 13 years. Looking at changes in vehicle mass, fleet turnover (sales and scrappage), and vehicle miles traveled, the agency projected that the proposed reset standards would yield significant safety benefits. Specifically, the proposal estimated that the decrease in vehicle miles traveled and the accelerated entry of newer, safer vehicles into the fleet would prevent approximately 1,300 to 1,500 fatalities and hundreds of thousands of non-fatal injuries in total through CY 2050, compared to the No-Action Alternative. In addition, the agency noted that the proposed MY 2028 vehicle reclassification would reduce market distortions that had previously incentivized manufacturers to shift production from passenger cars to less stringently regulated light trucks, potentially further lessening mass disparities and improving overall safety in the light-duty fleet.
The agency received extensive comments regarding its assessment of economic practicability, with comments divided on whether the proposed regulatory alternatives appropriately balanced upfront vehicle costs, long-term fuel savings, consumer choice, employment, and safety.
Commenters supporting the proposal, including NADA and AmFree and Corn Growers Associations strongly supported the agency's focus on reducing upfront vehicle costs.[1085]
NADA highlighted that reducing the average vehicle transaction price by approximately $1,000 will significantly expand the pool of households that can afford new vehicles.[1086]
NADA also commented against relying on a TCO metric, explaining that lenders base financing decisions on loan-to-value ratios and will not extend more credit to account for future fuel savings, making upfront costs the primary barrier to vehicle access.[1087]
CPAC-CRF added higher vehicle prices, including from increased compliance costs from CAFE standards, increase the burden on working families and middle-income households.[1088]
Conversely, several commenters, including NRDC
et al.,
Consumer Reports, ACEEE, Lucid, and several State environmental agencies, argued that the proposal harms overall affordability by trading upfront savings for increases in long-term fuel costs.[1089]
ACEEE and Consumer Reports emphasized that low-income and rural drivers, who spend a larger percentage of their income on fuel and drive longer distances, are disproportionately harmed by less stringent standards that increase exposure to volatile gasoline prices.[1090]
Lucid contended that TCO must be the benchmark for affordability, claiming that over a typical ten-year ownership period, additional fuel expenditures under the proposed standards will run into the thousands of dollars, far exceeding the agency's estimated $900 reduction in sticker price.[1091]
Furthermore, Consumer Reports and Lucid argued that the primary drivers of rising vehicle transaction prices are industry-wide shifts toward larger, more expensive SUVs and trucks, as well as rising expenses from advanced safety systems, software, and tariffs, rather than CAFE compliance costs.[1092]
NHTSA has carefully evaluated the comments regarding the economic metrics used to measure consumer affordability. The agency agrees that exclusive reliance on a TCO metric does not account for the consumer automotive credit market, which is reliant on both consumers' liquidity constraints and underwriting practices. This is also why, in part, NHTSA stated in the proposal that the agency was exploring more appropriate ways to present the value of fuel savings, which accrue to multiple buyers over the vehicle's life, and sought comment on such alternative presentations of fuel savings that the agency could include for informational purposes in the final rule. NHTSA agrees with NADA's point that upfront vehicle costs are a primary barrier to new vehicle purchases; consequently, an incremental regulatory cost increases the upfront capital barrier, which can reduce the number of credit-eligible buyers and affect market access for consumers. If NHTSA's standards were to increase upfront vehicle costs such that consumers could not afford to purchase them, it would be more difficult for vehicles with increased fuel economy levels to enter the fleet, and for the overall fleet's average fuel economy level to increase. In addition, nothing in this rule prohibits manufacturers from producing more fuel-efficient vehicles for consumers who value fuel economy.
Although industry-wide vehicle pricing is also influenced by consumer preferences for larger vehicles, advanced safety content, and macroeconomic factors, NHTSA's economic practicability and regulatory impact assessments, performed in accordance with OMB Circular A-4, generally limit the evaluation to the specific incremental cost burdens imposed by the agency's own standards. That said, NHTSA does consider the increase in fuel costs resulting from reduced fuel economy standards as a subset of the need of the United States to conserve energy statutory factor, and not under economic practicability. The agency carefully weighed the potential impacts of upfront cost increases against the magnitude of potential increases in fuel costs from changes in the standards and cannot conclude that standards that result in a high upfront cost weigh in favor of maintaining more stringent standards. By considering upfront transaction costs within its economic
( printed page 62227)
practicability analysis, the agency accounts for consumer affordability concerns that create barriers to new vehicle acquisition.
NHTSA also received several comments critical of the agency's assumption that manufacturers will pass 100 percent of compliance cost savings on to consumers in the form of lower purchase prices. NRDC
et al.
commented that empirical literature, including studies on asymmetric cost pass-through, suggests manufacturers frequently retain cost reductions as increased profits rather than lowering prices, particularly when absorbing other costs like tariffs.[1093]
Consumer Reports and an individual commenter presented data from a 2023 study covering MYs 2003-2021—a period of rising CAFE stringency—which found no statistically significant increase in inflation-adjusted vehicle prices, implying that automakers historically deployed fuel-saving technologies without passing net costs to consumers.[1094]
An individual commenter similarly expressed skepticism, noting that prices rarely decrease once elevated and that savings from less efficient vehicles are unlikely to materialize for the buyer.[1095]
NHTSA believes that it is reasonable to assume that changes in production costs are ultimately reflected in consumer transaction prices. As discussed in more detail in Section II in regard to the effect of new vehicle prices on vehicle scrappage, because specific vehicle pricing decisions are proprietary and inherently differ between manufacturers, modeling them is beyond the scope of this analysis. Transaction price trends between 2003 and 2021 were influenced by multiple confounding variables. Isolating the cost impact of CAFE compliance within historical retail prices is difficult due to shifts occurring simultaneously in automaker cross-subsidization of certain vehicle models, vehicle size mixes, standard equipment content, manufacturing efficiencies, dealer incentives or other pricing strategies, and global supply chain conditions. NHTSA's current approach allows the agency to isolate and evaluate the potential economic impacts of the standards on a fleetwide level, and though this may cause the agency to overestimate some individual vehicle prices and underestimate others, having confidence in the aggregate changes is most important for this analysis. NHTSA also believes the agency's approach is more appropriate than one that does not assume that manufacturers would pass on cost savings from lower CAFE standards to consumers in the form of lower vehicle purchase prices because of the basic economic principle that if manufacturers do not pass on cost savings in the aggregate, then they will be undercut by competitors. Accordingly, NHTSA's higher level, aggregated assumptions are reasonable.
The agency also received several comments on how fuel economy standards interact with consumer choice and vehicle attributes. CPAC-CRF commented that the previous rules distorted markets and reduced consumer choice by implicitly disfavoring the trucks and SUVs that American consumers legitimately need for family, work, and geographic reasons.[1096]
In contrast, the Attorneys General and NRDC
et al.
argued that the agency arbitrarily elevated consumer demand over the statute's primary goal of energy conservation, while simultaneously relying on unsupported assumptions about consumer preferences.[1097]
NRDC
et al.
disputed the agency's claim that consumers reject fuel-efficient vehicles because they lack desirable attributes, pointing to EPA data showing that vehicle HP and acceleration reached record highs alongside increasing fuel economy.[1098]
NRDC
et al.
also criticized the agency's reliance on particular studies to conclude that consumers fully value fuel savings, pointing to other behavioral economics research showing that consumers systematically undervalue future fuel savings due to uncertainty and information asymmetries.[1099]
In determining maximum feasible standards under EPCA, NHTSA is required to consider economic practicability, which inherently encompasses an evaluation of consumer choice. While the agency recognizes that historical data shows concurrent increases in both fuel economy and performance metrics like horsepower, standards must be set so that marginal compliance costs do not restrict the vehicle attributes required by consumers. In addition, at the analytical level, NHTSA evaluates maximum feasible standards based on maintaining performance attributes of the fleet, in order to isolate the effects of changes in vehicle fuel economy. Regarding consumer valuation of fuel savings, NHTSA has recognized in several prior rules that the range of estimates presented in literature is wide. NHTSA has relied on that wide range of studies, including several recent studies, in addition to information from manufacturers to conclude that its estimates of consumer valuation of fuel savings are reasonable.
Commenters also diverged on the macroeconomic impacts of the proposal. NADA projected that a $1,000 reduction in vehicle prices, using a price elasticity of demand of −0.4, would generate approximately 130,000 additional new light-vehicle sales.[1100]
Conversely, NRDC
et al.
commented that vehicle sales are driven primarily by macroeconomic conditions (such as the COVID-19 public health emergency and semiconductor shortages) rather than CAFE standards, and noted that the agency's own estimated increase of 16,000 to 49,000 units represents a negligible 0.1-percent to 0.3-percent increase in total sales, which could not justify the stringency decreases.[1101]
Regarding employment, Cleveland commented that the agency's own analysis estimated a loss of full-time equivalent employment positions across the three alternatives considered in the proposal, and noted that Ohio is home to nearly 19,000 auto manufacturing jobs.[1102]
The Attorneys General commented that the agency arbitrarily failed to evaluate these employment effects in its analysis, breaking with past practice by assuming lost auto worker jobs are subsumed by other unmonetized benefits, and also by ignoring the proposal's negative impacts on employment associated with the electric vehicle sector.[1103]
NHTSA's price elasticity modeling uses a variety of parameters to estimate a sales response to incremental price changes in response to changes in standards. As discussed in more detail below regarding the results of the agency's final rule analysis, the estimated additional vehicle sales volumes are enough to increase meaningfully the rate at which older, less efficient, and less safe vehicles are retired. Regarding the labor analysis, as
( printed page 62228)
noted in the proposal, NHTSA has used its approach to modeling labor effects in several recent rulemakings but had not highlighted its results because of its limited scope and the uncertainty introduced by rapidly changing labor inputs for vehicle assembly and technology development. NHTSA sought comment on alternative approaches to the labor analysis that the agency could consider, including approaches that could supplement the agency's current approach or succeed it in future rulemakings, but did not receive any suggestions suitable for inclusion in the agency's analysis. Accordingly, while the agency recognizes that mere translation of added required regulatory costs into additional labor utilization does not accurately reflect automotive labor, the labor utilization model does serve as an aggregate metric for directional tracking of total manufacturing hours directly tied to projected technology compliance costs. The agency also recognizes Cleveland's concerns about the labor utilization model's estimates but notes that these estimates represent an approximately one percent change from employment effects estimated under the existing standards, as shown in more detail below. Weighing these metrics against the other economic metrics associated with amending fuel economy standards, as the agency did in the proposal and now this final rule, contrary to the Attorneys General assertion, NHTSA concludes that the final standards represent maximum feasible standards, as discussed in more detail below. NHTSA also notes that real-world employment configurations remain dynamic and are heavily influenced by broader macroeconomic patterns, vehicle assembly locations, and international corporate choices outside the operational scope of this simulation. The agency will continue to develop an improved labor utilization model for future CAFE rulemakings.
Finally, AmFree and Corn Growers Associations commented in support of the agency's conclusion that lower vehicle prices will accelerate fleet turnover, getting consumers out of older vehicles and into newer models equipped with modern safety features like ESC and advanced driver assistance systems.[1104]
Conversely, NRDC
et al.
and the Attorneys General commented that the agency unlawfully categorized safety as a subset of economic practicability to elevate it above explicitly enumerated statutory factors.[1105]
NRDC
et al.
and Consumer Reports asserted that most of the agency's projected safety benefits do not stem from safety improvements in the vehicles, but from the assumption that people will drive fewer miles because it will be more expensive to drive under lower standards.[1106]
These commenters also contended that historical data shows automakers have consistently delivered fuel efficiency gains and life-saving safety improvements simultaneously without trading one for the other, making the agency's concerns about safety trade-offs purely speculative.[1107]
While modeled safety benefits stem in part from changes in total driving distance through the rebound effect, lower upfront vehicle prices accelerate fleet turnover, which delivers a distinct safety benefit by introducing modern crash-avoidance and occupant-protection features to the road more quickly. Further, though historical data demonstrates that the industry has improved both fuel economy and vehicle safety over time, the agency must evaluate the marginal impacts of the specific regulatory options under consideration. The projected safety effects reflect established economic principles regarding how vehicle price increases influence consumer purchasing decisions and overall fleet exposure.
For the final rule analysis, NHTSA considered metrics relevant to the economic practicability of the standards with the expanded suite of regulatory alternatives. Continuing from the discussion of technological feasibility, which examined the technologies applied in response to standards, and the fuel economy levels achieved by the fleet through use of those technologies, NHTSA discusses in this section the cost to apply those technologies. At the individual manufacturer level, the No-Action Alternative imposes large annual technology cost increases on manufacturers despite yielding significant under-compliance with their gasoline- and diesel fueled fleets. Per-vehicle technology costs vary widely by manufacturer and across alternatives, in part due to estimated technology application choices. Manufacturers remain free to apply any fuel economy technologies they choose, to meet the needs of their customers. Relative to the No-Action Alternative scenario, Alternatives 1 through 4 would result in an average industry-wide decrease in per-vehicle technology costs of between $1,318 and $1,135 (a decrease of approximately 50 to 60 percent), while Alternative 5 result in a decrease of $538 (a decrease of 24 percent). As discussed above, NHTSA expects that manufacturers would pass these cost reductions on to consumers. These cost reductions would have significant ripple effects in the new vehicle market, including increasing sales and fleet turnover, as discussed in more detail below.
( printed page 62229)
Under the No-Action Alternative, many manufacturers would see vehicle technology cost increases reaching or greatly exceeding $2,000, while in contrast seeing significant technology cost decreases relative to the No-Action Alternative under the regulatory alternatives. Technology cost decreases are presented for all regulatory alternatives in FRIA Chapter 8, and decreases for Alternative 3, the Preferred Alternative, are presented below for comparison. Across the industry, many manufacturers would see slight cost decreases in the early years, followed by increasing decreases by MY 2031.
As NHTSA discussed in the proposal, in the face of increasing fuel economy standards under the existing rules, vehicle manufacturers have taken different approaches to adding fuel-economy-improving technology to their vehicles. Some manufacturers that invested heavily in early deployment of EVs to meet the standards set in 2024 may find themselves with gasoline- and diesel-fueled fleets with lower fleet fuel economy values. Manufacturers that invested in non-plug-in hybrid powertrains and complied only marginally with 2024's standards presumably have ICE fleets with higher fleet fuel economy values and lower associated technology cost reductions. For example, the fact that General Motors is projected to realize a $2,561 relative per-vehicle cost reduction by 2031 under the reset standards while Toyota is projected to realize a more modest $526 reduction demonstrates the effect across model years of the prior differences in powertrain technologies used in their baseline fleets. Automakers that have historically invested heavily in conventional hybrid architectures already possess highly optimized, low-cost compliance foundations, meaning the incremental transition from the No-Action Alternative to Alternative 3 provides smaller, yet still positive, relative cost reductions. Conversely, manufacturers that relied more exclusively on capital-intensive EV strategies to raise their fleet fuel economy values under previous standards are estimated to see larger technology cost reductions.
EPCA's command—to set maximum feasible fleetwide average fuel economy values for vehicles that run on “fuel” as
( printed page 62230)
defined in the statute—becomes more difficult as manufacturers find themselves with different resulting potential technology costs. Analyzing whether technology can feasibly be applied to vehicles during the rulemaking timeframe, and at what cost, requires careful consideration of each individual manufacturer's technology levels and the potential economic consequences resulting from manufacturers' efforts to comply with different levels of standards.
NHTSA does not intend for its standards to penalize manufacturers that increased their fleet's fuel economy using EV technology. Rather, NHTSA recognizes that resetting standards at a level where all manufacturers can respond to market demand, consider affordability, and consider safety would better reflect consumer needs and preferences.
Alongside the significant up-front cost reduction for each of the regulatory alternatives compared to the No-Action Alternative, NHTSA expects that any standard lower than the No-Action Alternative would increase sales of the gasoline- and diesel-powered vehicles considered in the analysis. As stringency levels increase across scenarios (moving from Alternative 1 to Alternative 5) and technology costs increase, the overall magnitude of the increase in sales lessens. Sales are highest in Alternatives 1, 2, and 3, and lowest in Alternative 5. Though the sales variance across all action alternatives remains within 0.75 percent of the No-Action baseline through MY 2031, this fractional percentage represents a significant shift in absolute vehicle volumes. In a nationwide market with millions of annual transactions, a variance of nearly three-quarters of a percent translates into hundreds of thousands of additional new vehicles entering the fleet. This volume shift is meaningful as it materially accelerates the retirement of older, less efficient, and less safe models on the road.
NHTSA also estimates the employment effects of the different regulatory alternatives, as discussed above. The agency's model for estimating labor impacts in parts supply is based on the premise that any reduction in costs translates directly to an assumed reduction in labor hours, as measured in “person-years.” The agency's methodology does not account for a diversion of such labor into development or production of different technologies. Based on the agency's method for calculating labor effects, NHTSA's analysis shows a very small decrease in cumulative person years from less stringent standards relative to the baseline, in part because of the decreased need for development and application of additional fuel-economy-improving technology. Employment utilization decreases in each action alternative relative to the No-Action Alternative. Alternatives 1 and 2 show almost identical decreases in labor utilization, while for each model year, Alternative 5 sees the smallest decrease over the No-Action Alternative. Because the decrease is largest in the less stringent alternatives, this indicates that the technology effects outweigh the sales effects in the action alternatives. The impact of decreased demand for fuel economy-improving technologies is larger in magnitude than the increase in demand that results from increased vehicle sales. The trend of incremental labor utilization in the action alternatives generally follows that seen in the No-Action Alternative: the incremental difference grows until MY 2033 and then steadily declines through MY 2050.
( printed page 62231)
As NHTSA stated in the proposal, though the agency's quantitative estimates of changes in employment effects capture certain factors related to how the automotive industry may respond to lower fuel economy standards, a number of potential employment impacts from lower fuel economy standards are not captured in the analysis. As an example, the analysis does not capture the effects of manufacturers' shifting vehicle and powertrain production to the United States in response to factors other than the agency's CAFE standards.[1108]
The agency's safety assessment evaluates three primary elements: changes in vehicle mass, reduced crash exposure via the rebound effect, and fleet composition shifts driven by new vehicle sales and older vehicle scrappage. Across the regulatory alternatives, the overall safety impact is influenced by the rebound effect, as less stringent standards result in higher per-mile driving costs, thereby reducing total miles driven and lowering overall crash exposure. This reduction in fatalities and injuries is further enhanced by accelerated fleet turnover; lower upfront vehicle prices encourage consumers to replace older, less secure vehicles with newer models featuring advanced safety technologies. In contrast, changes in vehicle mass play a minor and statistically offsetting role in the broader safety analysis. Although broad upward shifts in weight lead to small fatality reductions in the heaviest non-passenger automobiles, these gains are counterbalanced by slight increases in fatalities among the lightest passenger cars, leaving mass changes near the median weight distribution with a negligible net impact. Ultimately, as improved vehicle technologies and reduced exposure enhance occupant protection, many crashes that would have otherwise resulted in injury or fatalities are downgraded to property-damage-only incidents, which subsequently increases the cumulative costs associated with minor property damage. Table V-9 shows these results in more detail.
( printed page 62232)
c. Effect of Other Motor Vehicle Standards of the Government on Fuel Economy
Regarding the effect of other motor vehicle standards of the Government on fuel economy, NHTSA has considered both the agency's own safety standards and EPA's criteria pollutant emissions standards in various aspects of the technical modeling. Neither presents a reason for the agency to pick one regulatory alternative over another. In addition, as discussed above, to the extent that non-Federal vehicle standards played a role in the agency's prior consideration of the effect of other motor vehicle standards of the Government on fuel economy, NHTSA has concluded that such consideration was improper. EPA has rescinded all greenhouse gas emission standards for all categories of new motor vehicles and engines, including light-duty vehicles, to effectuate its reading of CAA section 202(a).[1109]
Accordingly, for purposes of this standard-setting rulemaking, there is no analysis associated with the regulatory alternatives that would distinguish those alternatives from one another, or from the No-Action Alternative.
d. The Need of the United States To Conserve Energy
NHTSA described in the proposal that in the past decade, the consumer costs (via fuel prices), national balance of payments, and foreign policy implications of the need to consume large quantities of petroleum in the United States, especially imported petroleum, have shaped the consideration of this factor in ways that Congress could not have foreseen in the 1970s when EPCA was enacted. As NHTSA previously acknowledged in the 2020 final rule, there are two paths to petroleum independence: the first is simply to use less petroleum, and the second is for the United States to produce more of its own petroleum and to use less petroleum purchased from abroad. NHTSA outlined in the proposal how the United States became a net exporter of petroleum on an annual basis in 2020 (and on a monthly basis for the first time in September 2019) for the first time since at least 1949 and continued to export more petroleum than it imported in 2021, 2022, and 2023.[1110]
In fact, the United States currently produces the most oil (particularly shale oil) of any country.[1111]
The sources of imports to the U.S. have also changed significantly since EPCA's passage; whereas OPEC nations were the source of 70 percent of U.S. total petroleum imports in 1977, Canada now represents the largest source at 52 percent of gross total petroleum imports, and imports from OPEC nations represent only 16 percent.[1112]
This shift helps insulate the U.S. from supply shocks attributable to imports from the most volatile regions. A concurrent change in global oil market dynamics has helped steady the fuel prices that consumers experience in the wake of potential impacts to supply from foreign oil-producing countries:
( printed page 62233)
the oil market is simply less reactive to global events.[1113]
Isolated subnational events, like the 2021 Colonial Pipeline ransomware attack, still have the potential to cause short-term price spikes in specific areas of the country,[1114]
but that national-level gasoline prices have held steady and have even modestly decreased through major global events evidences at least some decoupling of fuel prices and the concerns that led to EPCA's passage in 1975. Although further events have introduced temporary volatility into global crude markets since the proposal's publication, the agency does not expect these short-term disruptions to alter long-term fuel price trajectories, which remain governed by broader global supply and demand trends.
While shifts have occurred in the global oil market, fuel use has not decreased appreciably despite a dramatic increase in fuel economy standards over the past 15 years. Since the agency began setting fuel economy standards in the early 2010s, motor gasoline consumption in the United States has hovered in the realm of the upper 8 million to low 9 million barrels per day (with a brief decrease in 2020 to just 8 million barrels per day).[1115]
There are a number of reasons why fuel consumption may hold steady as vehicle fuel economy increases (
e.g.,
vehicle miles traveled have increased substantially in response to the economy or the rebound effect), but the fact that even significantly increased vehicle fuel economy standards have not decreased fuel consumption at measurable levels in the real world should be considered by NHTSA in how heavily it weighs the need of the United States to conserve energy relative to other factors. This is particularly true given the diminishing effects attributable to fuel economy improvements: as fuel economy standards increase in stringency, the yield in reduced fuel consumption decreases. In mpg terms, a vehicle owner who drives a light vehicle 15,000 miles per year (a typical assumption for analytical purposes) and trades in a vehicle with fuel economy of 15 mpg for one with fuel economy of 20 mpg, will reduce their annual fuel consumption from 1,000 gallons to 750 gallons—saving 250 gallons annually. If, however, that owner trades in a vehicle that achieves 30 mpg for one that achieves 40 mpg, then the owner's annual gasoline consumption would drop from 500 gallons/year to 375 gallons/year—a fuel savings of only 125 gallons even though the mpg improvement is twice as large. Going from 40 to 50 mpg would save only 75 gallons/year. However, each incremental improvement in fuel economy becomes more expensive to achieve as the easiest to achieve low-cost technological improvement options are exhausted. Although fuel economy standards may support energy conservation, the agency must set maximum feasible standards based on the subsection 32902(f) factors.
Whether CAFE standards remain the most effective way to accomplish the goal of using less gasoline in the light-duty motor vehicle fleet to increase energy security is a decision for Congress, but for now, EPCA's directive to NHTSA is to set CAFE standards in each model year, and that is what the agency will continue to do. Within this framework, however, accounting for particular realities—specifically that oil consumption in the United States has remained steady or increased even in the face of significantly increased fuel economy standards while the country has simultaneously become a net petroleum exporter and the world's largest oil producer—led the agency to conclude that the weight of these three facets of the need of the United States to conserve energy did not lead the agency to consider higher CAFE standards than the proposal's Alternative 2 as maximum feasible.
In the proposal, NHTSA evaluated the environmental impacts associated with the action alternatives as part of its statutory assessment of the need for the United States to conserve energy. The agency explained that because the proposed standards would lower upfront vehicle costs relative to the baseline, they would incrementally stimulate vehicle sales, particularly among modestly less fuel-efficient models. Although this shift would result in a slight net increase in total fuel consumption and marginal increases in both upstream and downstream emissions, these factors would be partially counterbalanced by reduced driving demand stemming from higher per-mile driving costs. Ultimately, the agency's analysis in the Draft SEIS demonstrated that any overall emissions increases would remain marginal, and that both criteria and non-criteria emissions would continue to decline over time due to natural fleet turnover. Consequently, the agency tentatively concluded that these nominal environmental impacts affirmed that energy conservation goals did not weigh heavily enough against the countervailing factors of economic practicability and technological feasibility to merit more stringent standards.
In addition, the proposal reexamined the geopolitical and economic context governing the need of the United States to conserve energy, concluding that maximum feasible fuel economy standards should reflect America's modern energy landscape. Driven by the domestic shale-oil boom, the United States has achieved a level of energy independence and resource abundance that was entirely unforeseen when EPCA was enacted in 1975. Furthermore, the vulnerability of the United States to foreign oil shocks has been substantially mitigated as remaining petroleum imports have shifted away from volatile OPEC nations toward stable regional partners like Canada and Mexico. Given this diminished exposure to supply disruptions, NHTSA tentatively determined that fuel economy standards should function as an insurance policy against risk—increasing at steady, incremental, and manageable rates rather than imposing aggressive conservation mandates. Thus, the agency's proposal asserted that it is both reasonable and consistent with EPCA to require continuous fuel economy improvements over time, but at sustainable levels that protect manufacturers, consumers, and the broader economy.
The agency received extensive and highly detailed comments on its evaluation of the need of the United States to conserve energy. Major categories of comments included how the Nation's status as a net energy exporter should influence the stringency of the standards, whether NHTSA must consider environmental and climate impacts under this factor, and whether the agency adequately justified its departures from past analyses of energy and environmental effects.
Several commenters generally agreed with the agency's assessment that the Nation's need to conserve energy has fundamentally shifted due to recent increases in domestic energy production. IER and ACI noted that the CAFE program was created in response
( printed page 62234)
to the 1973 Arab oil embargo and strengthened under EISA when U.S. net oil imports surpassed 12 million barrels per day.[1116]
Noting that the United States became a net petroleum exporter in 2020, IER commented that the original purpose of the CAFE program has been superseded, asserting that “there is zero need for the U.S. to conserve oil” and that this statutory factor should consequently be given no weight.[1117]
PMI similarly commented that there is no need to conserve energy.[1118]
ACI also commented that the original purpose of the CAFE program—to reduce dependence on OPEC—has already been achieved.[1119]
AFPM commented that the U.S. oil industry now leads the world, producing roughly 13.6 million barrels of crude per day and accounting for 90 percent of global production increases between 2015 and 2024.[1120]
They stated that this domestic growth stabilizes global prices and directly benefits U.S. consumers.[1121]
PMI agreed with the agency that energy conservation under EPCA functions as a form of “national economic insurance against the volatility of foreign energy markets.” [1122]
PMI commented that because the U.S. exported 1.64 million barrels of oil per day more than it imported in 2023, global price volatility now primarily results in a redistribution of wealth within the domestic economy rather than a transfer to foreign adversaries, making the original national security justification for strict energy conservation mandates outdated.[1123]
Although AFPM acknowledged that the U.S. cannot insulate itself from global oil price dynamics because crude oil is traded on an integrated worldwide market, it stated that marginal petroleum savings decline as vehicle fuel economy rises.[1124]
Because the cheapest and most effective fuel-economy-improving technologies have already been applied, AFPM asserted that foreign-policy gains become progressively less significant as standards become more stringent, which moderates the need for even higher standards.[1125]
Similarly, PMI commented that because the relationship between fuel economy and fuel consumption is non-linear, the marginal utility of each additional mile per gallon plummets at higher stringency levels, making aggressive conservation mandates an economically inefficient method for hedging against supply shocks.[1126]
Conversely, several commenters, including environmental groups and States, commented in opposition to the agency's analysis of the need to conserve energy in light of updated global conditions. The Oregon Department of Environmental Quality (OR DEQ) commented that, because EPCA expressly mandates the implementation of a regulatory program to reduce national energy consumption, the agency's proposal may violate the statute by knowingly proposing alternatives that will increase national energy consumption.[1127]
NRDC
et al.
and the Attorneys General commented that the U.S. remains highly exposed to the global oil market.[1128]
The Attorneys General noted that the U.S. still imports roughly 3 million barrels of crude oil per day to supply refineries tailored for heavy crude oil.[1129]
As noted in Section V.A, above, they highlighted regional vulnerabilities, noting that Hawaii has no domestic petroleum sources, depends on petroleum for 80 percent of its energy, and remains highly exposed to geopolitical supply chain disruptions.[1130]
NRDC
et al.
and the Attorneys General also stated that NHTSA arbitrarily assumes in its modeling that there will not be shocks or volatility in oil prices.[1131]
Commenters also included data demonstrating that the U.S. remains exposed to the global oil market despite domestic production gains. Members of Congress (Matsui
et al.
) noted that 40 percent of the oil refined by U.S. fuel refineries is still imported, keeping the American transportation system dependent on foreign nations and vulnerable to price shocks after events like Russia's 2022 invasion of Ukraine.[1132]
NRDC
et al.
commented that the agency's own analysis assumes that 90 percent of any additional gasoline consumed due to the standards reset will come from imported crude oil, and thus, even with domestic production of crude oil, the United States can only supply a small portion of the fuel needed to sustain the transportation sector, and the country continues to rely heavily on foreign oil.[1133]
The Attorneys General commented that NHTSA is basing permanent regulatory decisions on a temporary peak in domestic oil production, citing an International Energy Agency forecast that warns of a protracted period of turbulent markets and a precipitous stalling of U.S. shale growth.[1134]
To underscore their point about risks of continued oil reliance, the Attorneys General also pointed to past NHTSA reliance on a Council on Foreign Relations report asserting that domestic consumption impacts national security by limiting U.S. alliances, empowering adversarial oil-exporting nations, and necessitating an ongoing military presence in the Middle East.[1135]
ME DEP also stated that the proposal heightens national exposure to global oil price volatility.[1136]
They pointed to the agency's PRIA, which estimates that the proposed standards reset will reduce energy security benefits by $4.21 billion to $7.84 billion compared to the No-Action Alternative.[1137]
They also highlighted regional impacts, asserting that the 2022 Russian invasion of Ukraine caused petroleum prices in the Northeast to rise sharply, imposing severe burdens on Maine households.[1138]
These commenters also stated that the agency's reliance on net-exporter status to weaken standards is arbitrary and capricious. NRDC
et al.
noted that the U.S. became a net exporter in 2020, yet in the May 2022 and June 2024 CAFE rulemakings, the agency concluded that because oil prices are inherently volatile, “the only means of reducing the exposure of U.S. consumers to global oil shocks is to reduce their
( printed page 62235)
consumption.” [1139]
The Attorneys General also stated that the agency failed to provide the required more detailed justification for abandoning its positions held as recently as the 2024 final rule that the U.S. still imported a substantial amount of oil from countries vulnerable to supply shocks even in light of the country's status as a net oil exporter, especially considering recent price shocks like those occurring following Russia's invasion of Ukraine.[1140]
Furthermore, NRDC
et al.
argued that if Congress believed the need to conserve energy had diminished due to domestic production, it would have amended EPCA; absent such amendment, they stated that the agency lacks statutory authority to deprioritize the statute's core conservation mandate.[1141]
The agency notes that one of the strengths of the CAFE framework established by EPCA, and as amended by EISA, is that it charges NHTSA to
balance
competing factors, including the need of the United States to conserve energy. This framework enables the agency to carry out its obligations in different energy and economic circumstances. As the need of the United States to conserve energy is heightened—such as when the United States was heavily reliant upon petroleum imported from countries vulnerable to supply shocks—that factor should be weighed more heavily. At times when the United States is less susceptible to petroleum supply shocks, that factor appropriately bears less weight—but remains a significant factor in determining maximum feasible fuel economy standards. In addition, NHTSA recognizes, as the agency did in the proposal, that the U.S. remains connected to global energy markets, and that domestic consumers still feel the impact of international price shocks. However, the country's macroeconomic position has changed fundamentally since the CAFE program was created in the 1970s and expanded in 2007, and NHTSA must continue to weigh the impacts of increasing standards in light of changed circumstances against the other impacts to consumers. In addition, a measured approach to increasing fuel economy standards, such as that represented by the alternatives considered in this final rule, provides an institutional framework better suited to long-term manufacturer compliance than standards that rise too quickly, that manufacturers cannot functionally comply with and then cannot result in real-world energy conservation benefits.
Regarding comments that this position breaks with the 2022 and 2024 rulemakings, NHTSA recognized in the proposal that total energy independence is not possible for any country that participates in the global energy market, and that even if the U.S. consumed only domestically produced petroleum and continued to export, the U.S. economy would still be subject to oil price fluctuations due to external events and situations.[1142]
However, the proposal and this final rule also recognize that risks from global oil price fluctuations are much lower than they would have been in the absence of the rapid growth in U.S. oil production, and this diminished risk means that the need of the U.S. to conserve energy is significantly less than it was at earlier points in the history of the program.[1143]
Federal agencies are permitted to update their analytical frameworks when conditions change. In addition, Congress did not mandate in EPCA that the need of the United States to conserve energy must be the most heavily weighted subsection 32902(f) factor. Instead, Congress granted NHTSA the discretion to balance four distinct statutory considerations without establishing a hierarchy among them. EPCA authorizes the agency to weigh the other three factors—such as economic practicability or technological feasibility—more heavily than the need of the United States to conserve energy when contemporary data, market conditions, or other circumstances indicate that such a balance is appropriate to establish a maximum feasible standard.
Regarding comments that NHTSA's modeling does not capture volatility in oil prices, EIA's Annual Energy Outlook, which NHTSA has relied on for fuel price projections for almost two decades, incorporates comprehensive assumptions to project structural, long-term oil price trajectories based on underlying global supply and demand trends. For the purposes of NHTSA's modeling, relying on these stable, multi-decade projections is more important than attempting to capture highly volatile and unpredictable short-term market disruptions. That said, as in all past CAFE rulemakings, NHTSA has performed sensitivity analyses using various AEO side cases with diverse long-term oil price projections.
Commenters also debated the impact of the proposed standards on U.S. military spending and foreign policy. AEI supported the agency's decision to disregard military costs, arguing that defense assets serve multiple, long-term functions and that allocating a fixed portion of defense costs specifically to the defense of sea lanes for oil is analytically arbitrary.[1144]
Other commenters disagreed with the agency's analysis of these costs. The Attorneys General and NRDC
et al.
commented the agency acted arbitrarily and capriciously by asserting that changes in petroleum use are unlikely to affect military activity.[1145]
The Attorneys General commented that NHTSA's failure to quantify the military costs of securing global petroleum was arbitrary and capricious, stating that the agency lacked support for its claim that foreign policy considerations have shifted and failed to explain how the proposal's projected increase in oil consumption would avoid escalating U.S. military expenditures, particularly in light of recent interventions.[1146]
NRDC
et al.
also cited a 2018 paper by Securing America's Future Energy estimating that the U.S. military spends at least $81 billion annually protecting global oil supplies, amounting to an implicit subsidy of roughly $0.28 per gallon of fuel consumed.[1147]
As mentioned above, the Attorneys General and NRDC
et al.
also pointed to recent actions, including the seizure of Venezuelan oil tankers and executive statements prioritizing the flow of Venezuelan oil to reduce American gas prices, as evidence that U.S. military and foreign policy resources remain heavily tied to securing global oil supplies.[1148]
As NHTSA has long maintained,[1149]
U.S. military spending cannot be reliably linked to marginal changes in fleetwide fuel economy. As discussed in more detail in TSD Chapter 6, while lower U.S. oil demand could theoretically enable the U.S. to reduce military spending on protecting foreign oil supplies, evidence shows these expenses do not change based on domestic consumption. For instance, neither the Nation's recent shift to becoming a net oil exporter nor the
( printed page 62236)
dramatic increase in fuel economy in recent years have led to a drop in military spending. This is because U.S. military presence in oil-producing regions is aimed at maintaining overall global stability and not merely securing U.S. imports. U.S. military operations would continue near oil-producing regions regardless of the exact number of gallons of oil consumed by the domestic light-duty vehicle fleet.
NRDC
et al.'
s comment does not distinguish between the average spending associated with oil consumption and the marginal effect of changes caused by CAFE standards. As noted by Parry and Darmstadter (2002), “[Military spending] does not really vary with (modest) changes in oil imports; military spending is more of a fixed cost than a variable cost. A policy to moderately reduce imports over time, and that did not entirely eliminate import dependency, would probably have little benefit in terms of cutting the costs of U.S. military involvement in the region.” [1150]
For this reason, most recent economic studies that quantify energy security-related benefits associated with policies like CAFE standards do not include changes in military spending.[1151]
Using an average cost as NRDC
et al.
suggests would be inappropriate when measuring the costs and benefits of marginal reductions in fuel consumption associated with changes in the standards.
The agency also received conflicting comments on how increased fuel consumption affects consumer costs and welfare. Although commenters like PMI agreed with the agency's characterization that increased fuel expenditures are domestic wealth transfers,[1152]
other commenters disagreed. NRDC
et al.,
ACEEE, and the Attorneys General commented that the proposal harms consumers by forcing them to pay an estimated $1,400 more in fuel costs over the lifetime of their vehicles.[1153]
The Attorneys General and ACEEE commented that increased fuel costs disproportionately burden low-income households, who spend three times as much of their income on gasoline compared to higher income households.[1154]
The Attorneys General cited NHTSA's statement from the proposal that the increased petroleum consumption from the proposal will increase global petroleum demand, which will exert upward pressure on worldwide gas prices, and concluded independently that this would raise gas prices for all drivers.[1155]
The National Parks Conservation Association (NPCA) commented that increased household fuel costs lead to decreased national park visitation, subsequently reducing critical entrance fee revenues for the National Park Service.[1156]
NHTSA acknowledges that lower fuel economy standards mean consumers could, on average, spend more on gasoline over the lifespan of their vehicles. However, the agency must also recognize that, while higher standards can create downstream fuel savings, they require manufacturers to install potentially expensive technologies that raise the upfront sticker price of a vehicle. For many buyers, particularly low-income households with limited access to credit, a high vehicle cost can price them out of the new vehicle market entirely. This forces them to remain in older, less efficient, and less safe vehicles. NHTSA's purpose in evaluating the range of alternatives considered is to find the alternative that keeps upfront vehicle purchase prices manageable while allowing for steady efficiency improvements that control long-term fuel costs. In addition, nothing in this rule prohibits manufacturers from producing and consumers who value fuel economy from purchasing more fuel-efficient vehicles. NHTSA also acknowledges the connection between petroleum demand and market pricing, as the agency recognized in the proposal, but notes that the Attorneys General failed to include the second part of NHTSA's conclusion that because the United States is a net exporter, the transfer from global consumers to petroleum producers becomes a financial benefit to the U.S. economy.[1157]
That said, as discussed in more detail below, none of the alternatives analyzed in this final rule would significantly increase fuel consumption compared with the levels of fuel estimated to be consumed under the No-Action Alternative.
Regarding quantified environmental and health impacts of the proposal, multiple commenters expressed strong opposition to the agency's treatment of the anticipated impacts on climate change and its estimates of GHG emissions and the assumptions surrounding the social cost of carbon. NRDC
et al.
stated that the tailpipe and upstream CO2
emissions projected in the modeling would result in worsening global surface temperatures, sea-level rise, precipitation anomalies, and ocean acidification.[1158]
ZETA, the Attorneys General, and NRDC
et al.
all commented that the agency improperly excluded the costs of increasing GHG emissions from its cost-benefit analyses, and asserted that incorporating the value of these climate benefits would prove increased fuel economy to be more cost-effective.[1159]
In particular, the Attorneys General claimed that this omission ignored $230 to $351 billion in climate damages.[1160]
Several commenters also commented that NHTSA's decision to exclude monetized estimates of changes in GHG emissions from the central analysis, stating that it was inconsistent with the 9th Circuit decision in
Center for Biological Diversity
v.
NHTSA.[1161]
NRDC
et al.
and the Attorneys General similarly criticized the domestic-only SCC sensitivity analysis, which they stated ignored global spillover effects on U.S. citizens and corporations and ignored OMB Circular A-4 guidance, among other things.[1162]
The National Tribal Air Association (NTAA) commented that the transportation sector's increased CO2
emissions would accelerate extreme weather events—including prolonged droughts, severe storms, wildfires, and ecological shifts—that uniquely threaten the economic stability, sustenance, and traditional lifeways of tribes and Alaskan Native Villages.[1163]
The Attorneys General also commented in opposition to the
( printed page 62237)
agency's characterization of the results of the criteria pollutant and health benefits analysis as “slight.” [1164]
The Attorneys General argued that all of the proposed action alternatives increase emissions relative to the No-Action baseline, and that the agency is improperly and unlawfully crediting its reset for environmental improvements that are occurring independent of, and in spite of, the proposed standards.[1165]
NRDC
et al.
also commented that NHTSA underestimated criteria pollution impacts by using outdated 2025 health incidence values to project harms through 2050, and by ignoring the ozone impacts of NOX
emissions, leading to an underestimation of public health harms by 6 to 26 times.[1166]
NTAA also commented on the specific health harms of increased emissions, noting that emissions of volatile organic compounds, nitrogen oxides, and fine particulate matter disproportionately harm tribal communities.[1167]
They submitted data showing that American Indian and Alaska Native adults suffer from asthma at a 13-percent rate, with their children reporting 42 percent more cases than the general population, arguing that the agency's proposal will prolong acute and chronic exposures to dangerous pollutants for these vulnerable populations.[1168]
NHTSA has determined that by encouraging faster fleet turnover, the finalized standards will help transition drivers into newer, cleaner, and more efficient vehicles faster than more stringent alternatives would allow, which provides long-term health and environmental benefits while also offering reduced upfront vehicle costs for consumers. In the central analysis supporting this final rule, NHTSA continues to exclude estimates of changes in CO2, CH4, and N2
O valuation, consistent with current Executive Order 14154 and Office of Management and Budget guidance. The agency maintains that significant, compounding uncertainties—including the precise macroeconomic response to climate shifts, long-term technological adaptation, demographic variables, and intergenerational discounting methodologies—render these valuation metrics highly speculative. Relying on such figures in the central analysis could inadvertently result in flawed decision-making due to an overreliance on deeply uncertain values. The domestic-only CO2, CH4, and N2
O valuation sensitivity cases focuses on domestic economic impacts because CAFE is a domestic regulatory program, and the costs and benefits are ordered similarly across the alternatives as in the central analysis. Relying on global valuation estimates would introduce an even higher level of uncertainty, for the reasons discussed in Section II above, and fails to maintain the required analytical boundary that excludes economic effects occurring outside of United States borders. However, even if NHTSA had considered alternative valuation estimates, the agency would have selected the same final standards. As discussed in more detail in Sections V.C.2.a, V.C.2.b, and V.C.2.e, Alternatives 4 and 5 exceed maximum feasible levels due to manufacturer noncompliance. Where compliance is unachievable, projected fuel savings and climate benefits cannot materialize. Consequently, valuing changes in CO2, CH4, and N2
O—whether domestic or global—would not change the agency's determination of the maximum feasible standards.
When NHTSA described certain criteria pollutant variations across alternatives as “slight,” the agency was referring to an objective comparison of the incremental differences between the emissions occurring under the No-Action Alternative and the regulatory alternatives considered. However, in the Final SEIS, NHTSA has defined and clarified the use of “slight” and other descriptors that describe the magnitude of impacts in the Final SEIS. The Final SEIS discloses cumulative emissions changes, projected changes in climate indicators, and sensitivity analyses to provide transparency regarding the scale of the modeled impacts. Regarding quantified health metrics, the agency disagrees that its health effects modeling is outdated; the agency has utilized the most up-to-date data available for each category of effects for both upstream and downstream sources across several successive rulemakings. This methodology and response to comments is discussed in more detail in Section II.
Table V-10 shows estimated fuel use for the regulatory alternatives compared to the No-Action Alternative. Importantly, NHTSA emphasizes that under the No-Action Alternative, the gasoline- and diesel-powered vehicle fleet regulated in this action is anticipated to consume 2,639 billion gallons of gasoline through CY 2050. The increases in gasoline and diesel fuel consumption under the regulatory alternatives range from an additional 128 billion gallons of gasoline under the least stringent alternative to 36 billion gallons of gasoline under the most stringent alternative, with Alternative 3 as the mid-range alternative resulting in an additional 122 billion gallons of gasoline through 2050. To put this in perspective, Americans used 136.5 billion gallons of finished motor gasoline, cumulative in 2025,[1169]
meaning that resetting the fuel economy program would only result in a total of less than one additional year's worth of gasoline consumption by the U.S. vehicle fleet over almost 25 years through 2050.
( printed page 62238)
As with the proposal, emissions of various pollutants would increase in the regulatory alternatives relative to the No-Action Alternative as a result of both increased upstream emissions from the various fuel production processes and increased downstream emissions from fuel combustion as vehicles are driven commensurate with the fuel consumption increases. However, in the context of total emissions compared to the baseline, the incremental increases would be nominal. In addition, non-criteria emissions (NCEs) in all five action alternatives decrease over time, as newer vehicles enter the fleet. Criteria pollutant emissions similarly increase relative to the No-Action Alternative, but all action alternatives result in decreasing criteria pollutant emissions over time. FRIA Chapter 8 provides additional detail on the changes in emissions and, for criteria emissions specifically, associated calculated health outcomes. NHTSA's NEPA analysis similarly shows only nominal differences between the baseline and alternatives considered in this proposal. The results of that analysis are summarized below and in the Final SEIS.
e. Synthesis of the Record Supporting Alternative 3 as Maximum Feasible
In establishing the final fuel economy standards, NHTSA is required under 49 U.S.C. 32902(f) to balance four statutory factors: technological feasibility, economic practicability, the need of the United States to conserve energy, and the effect of other motor vehicle standards of the Government on fuel economy. As NHTSA discusses throughout this final rule, EPCA does not permit the agency to look solely at energy conservation when setting maximum feasible fuel economy standards, instead explicitly requiring NHTSA to balance the four competing subsection 32902(f) factors. Accordingly, NHTSA tentatively concluded in the proposal that maximizing fuel savings at the expense of severe industry disruptions or unaffordable vehicle prices would place too little weight on the economic practicability factor and result in standards that exceed maximum feasibility. While NHTSA recognized that higher fuel consumption does lead to increased long-term fuel costs, overly aggressive standards impose immediate upfront cost increases on new vehicles that are already at record levels—slowing fleet turnover to newer, more efficient, cleaner, and safer vehicles. If vehicle prices rise too high, consumers are priced out of the new vehicle market entirely. A standard that is more stringent on paper does not save consumers money if they cannot afford to buy the vehicles. Looking only at total fuel volume also ignores how vehicle prices affect real-world safety outcomes. When new cars remain affordable, drivers replace older, less efficient, and less safe vehicles faster. Stricter standards that raise prices delay fleet turnover, keeping older cars on the road longer. Further, higher standards result in more rebound driving, where lower per-mile driving costs lead to more total miles driven, directly increasing crash exposure. Accordingly, NHTSA examined the marginal, long-term impact of increased fuel use from the regulatory alternatives against these general policy considerations.
To find the point that satisfied these competing factors, the agency developed and analyzed several action alternatives alongside a No-Action Alternative. While NHTSA examined the No-Action Alternative alongside three action alternatives for both MYs 2022-2026 and MYs 2027-2031 in the proposal, the agency responded to feedback from the public and considered two additional alternatives each for MYs 2022-2026
( printed page 62239)
and MYs 2027-2031 for this final rule. Throughout this preamble, TSD, FRIA, and Final SEIS, NHTSA describes its methodology for evaluating these regulatory alternatives and the potential effects that could result from the agency's selection of any of the alternatives as the final standards.
NHTSA agrees with several commenters that Alternatives 1 and 2, though reflecting distinct stringency increases over time, underrepresents vehicle manufacturer's technical capabilities and energy conservation. A wide array of technologies available for gasoline- and diesel-powered vehicles, such as advanced combustion, friction reduction, multi-valve architectures, and aerodynamic optimization, are already commercially available and deployed at high production volumes. Establishing a regulatory floor that changes by less than half a percent annually would fail to encourage the steady, incremental deployment of existing capabilities. Commenters like Honda further supported this conclusion, with Honda noting that advanced ICE refinements and multi-pathway efficiency technologies are robust enough to support annual improvements exceeding the proposed 0.25-percent-annual increase in stringency. Similarly, MEMA requested the agency to adopt Alternative 3 or a modified Alternative 3+ configuration. Both MEMA and MECA argued that dropping stringency to the levels defined in Alternatives 1 or 2 would create a technological deployment gap, weakening manufacturing market signals necessary to sustain domestic investments in efficiency engineering, and potentially risking billions of dollars of stranded capital in domestic research across vehicle components suppliers. While NHTSA recognizes concerns about sunk costs when considering changes in fuel economy standard, the agency agrees that the modified version of Alternative 3 appropriately accounts for technological capabilities of gasoline and diesel engines. In addition, while the Nation's status as a net energy exporter provides a structural macroeconomic buffer against oil price spikes, that fact does not absolve the agency of its statutory mandate to assign some weight to the need of the United States to conserve energy. Selecting these lower alternatives would result in a foregone reduction in petroleum consumption that is technically achievable through existing and available fuel economy-improving technologies.
On the other end of alternatives evaluated for this final rule, Alternatives 4 and 5 set initial MY 2022 target functions to an aggressive starting level and apply annual stringency increases that outpace the historic demonstrated efficiency improvements of the gasoline- and diesel-powered vehicle fleet, even in response to very stringent standards. In fact, by MY 2031, several manufacturers would be projected to under-comply with the Alternative 5 standards. The agency determined that the amount of manufacturer non-compliance using gasoline- and diesel-based vehicle technologies under Alternatives 4 and 5 demonstrates that these alternatives are beyond maximum feasible. To achieve these targets without the alternative fuel flexibilities, manufacturers would be pushed towards strong hybridization across all vehicle segments within a compressed time.
Although NHTSA's analysis projects all alternatives to reduce upfront vehicle costs compared to the No-Action standards, reducing upfront vehicle transaction prices is a factor the agency has determined should be accorded significant weight. Pricing buyers out of the new vehicle market would decelerate vehicle fleet turnover, keeping consumers in older, less safe, and less efficient vehicles longer. The agency carefully weighed the potential impacts of upfront cost increases against the magnitude of potential increases in fuel costs over several decades and cannot conclude that standards that result in a high upfront cost weigh in favor of maintaining more stringent standards.
In addition, NHTSA believes Alternatives 4 and 5 overweight energy conservation at the expense of economic practicability. As discussed in the proposal, NHTSA does not believe that the magnitude of fuel consumption and emission increases over the baseline would lead the agency to conclude that standards set at higher levels than Alternative 3 are maximum feasible. That the Alternative 3 standards are significantly different than the baseline standards and yet result in only marginal increases in fuel consumption and associated emissions metrics confirms NHTSA's conclusion that the environmental elements of the need of the United States to conserve energy do not weigh heavily enough against the countervailing factors of technological feasibility and economic practicability to merit the selection of more stringent standards.
Because the mathematical relationship between a vehicle's mpg rating and its actual fuel consumption is reciprocal, the marginal petroleum savings diminish significantly at these elevated stringency levels. NHTSA cannot weigh the need of the United States to conserve energy so high that it sets standards that would compel the vehicle fleet into rapid hybridization that results in continually flattening marginal improvements in fuel consumption, particularly because the Nation's net energy exporter status already mitigates some of the systemic economic and security risks historically associated with foreign energy dependency. Moreover, light-duty vehicle fuel consumption remains forecast to decline substantially over time, both as a result of NHTSA's standards and fleet turnover. The environmental effects related to fuel consumption, both because of NHTSA's standards and other light-duty transportation trends, will decrease proportionally based on effect and pollutant. NHTSA has concluded that the need of the United States to conserve energy weighs in favor of fuel economy standards acting as an insurance policy against risk, with standards that increase at steady, incremental, manageable rates for the light-duty gasoline- and diesel-powered fleets following their reset to align more closely with EPCA. In addition, the agency evaluated other environmental factors under NEPA and as part of its regulatory impact analysis to fulfill obligations under Executive Order 12866. Based on the results of those analyses, NHTSA confirms that the final standards selected in this rule remain the maximum feasible standards
Alternative 3 effectively balances the above concerns by requiring steady progress with deployable internal combustion and conventional hybrid technology. Considering the technologies available to meet the standards, and the achieved fuel economy levels that application of those technologies allows manufacturers to reach, NHTSA notes that a mid-range regulatory trajectory effectively minimizes the artificial over-compliance seen with less stringent options while avoiding the compliance deficits that emerge under the highest alternatives. The results indicate that an intermediate stringency level challenges the fleet to deploy available technologies at a sustainable pace, narrowing the gap between achieved and required fuel economy without exceeding the real-world engineering and product-cycle constraints of major manufacturers.
From an economic practicability standpoint, Alternative 3 addresses the vehicle cost concerns important to the agency, and as raised by commenters, while still requiring steady efficiency improvements. By avoiding the vehicle price increases associated with the
( printed page 62240)
highest alternatives, a middle-ground standard helps keep new cars affordable for vehicle buyers. This approach also keeps compliance costs within realistic limits for automakers' varied production cycles, making the standards economically practicable for the industry as a whole. In addition, while NHTSA's models show relatively minor differences in total vehicle sales and manufacturing employment across the options, basic economic theory supports the principle that lower upfront vehicle costs help stimulate the market. Selecting a conservative mid-point aligns with this economic reality, encouraging steady sales growth and protecting automotive jobs by avoiding the market strain associated with more aggressive targets.
Alternative 3 appropriately balances technological feasibility and economic practicability by providing long-term investment certainty for the domestic supply chain and avoiding the technology deployment gaps associated with lower alternatives identified by commenters. Simultaneously, by keeping stringency increments within a single-digit fractional range, it avoids the high upfront technology costs associated with the upper alternatives, ensuring that standards remain economically practicable for the industry as a whole. Alternative 3 also shows decreases in the fleet's overall fuel use over time, through a combination of improved vehicle fuel economy values and fleet turnover, to fulfill the agency's statutory mandate to conserve energy while properly aligning the stringency of the standard with the Nation's contemporary, structurally insulated energy profile.
Furthermore, Alternative 3 has the benefit of smoothing the effects of the finalized regulatory reclassification of passenger cars and light trucks. Because moving passenger-focused crossover and SUV models out of the light truck fleet structurally lowers the mathematical mpg average of both individual regulatory categories, the standard incorporates a calibrated transition adjustment in MY 2030 (−0.5 percent for passenger cars and −14.4 percent for light trucks) before resuming a steady 1.0-percent increase in MY 2031. This transition ensures the standards remain aligned with the physical capabilities of the adjusted fleets without triggering artificial compliance penalties.
Consistent with its position in the proposal, NHTSA affirms that it chooses to weigh “the need of the United States to conserve energy” less heavily as America continues to develop its proven oil reserves, because the Nation's exposure to oil shocks is diminished. This is especially true as the remaining petroleum imported into the U.S. has shifted dramatically away from volatile Organization of the Petroleum Exporting Countries (OPEC) nations and toward Mexico and Canada since the enactment of EPCA. The U.S. currently possesses an abundance of domestic energy resources, especially petroleum and natural gas. Following the shale-oil boom, America has become the world's largest petroleum producer by a significant margin and is now a net petroleum exporter. This status was unthinkable when Congress enacted EPCA, and even EISA. The United States does not have the same need to conserve liquid-fuel energy resources that it had in the wake of the Arab oil embargoes of the 1970s or in the wake of Operation Iraqi Freedom. Accordingly, NHTSA believes that it is both reasonable and congruent with EPCA's energy conservation goals to weigh the need of the United States to conserve energy such that vehicle fuel economy standards require continuous improvements over time, but at sustainable levels for manufacturers, consumers, and society at large.
Finally, as discussed above, NHTSA considers estimated net benefits relevant to determining maximum feasible CAFE standards, but the agency's selection of a Preferred Alternative is not dependent on the alternative that maximizes those benefits. The agency's analysis shows that all regulatory alternatives would result in positive net benefits on a model year accounting basis at both three percent and seven percent discount rates, with the Preferred Alternative, Alternative 3, resulting in $41.8 billion in estimated net benefits using a three percent discount rate and $36.3 billion in net benefits using a seven percent discount rate.[1170]
At the three percent discount rate, Alternative 3 maximizes net benefits among all the alternatives analyzed.
Balancing all factors and issues identified, specifically in this section and more broadly throughout this entire preamble, TSD, FRIA, and Final SEIS, NHTSA is finalizing Alternative 3 as the final fuel economy standards for MYs 2022-2026 and MYs 2027-2031. The agency's conclusion is that increasing the stringency of the standards at these adjusted annual rates—which remain fully achievable by conventional gasoline- and diesel-powered vehicles—coupled with the re-examination of the target function shapes and vehicle classification definitions, best comports with the substantive textual requirements of EPCA and is responsive to feedback and analysis submitted by commenters on the agency's proposal.
Moreover, the level, shape, and applicability of the standards to the gasoline- and diesel-powered passenger and non-passenger fleets, as reclassified under this final rule, are justified by the need to resolve the distortions that previous regulations caused in the marketplace. Imposing such market distortions is inconsistent with a proper application of EPCA and results in an unnecessary regulatory burden without effectively insulating the United States from global oil price shocks. Ultimately, NHTSA believes that the steady, incremental increases provided by Alternative 3, which are reasonable and appropriate, effectively balance EPCA's energy conservation goals while fully preserving the ability of manufacturers to focus on safety, affordability, and consumer choice and while resulting in positive benefits for consumers and society. Although the proposal initially applied these balancing principles to Alternative 2, NHTSA's subsequent evaluation of public comments, supplemental data, and sensitivity analyses demonstrates that Alternative 3 provides the most statutorily faithful execution of these objectives.
3. Final Supplemental Environmental Impact Statement Analysis Results
NHTSA described above that the agency's NEPA-related obligation is to “take a `hard look' at the environmental consequences” of a rulemaking, as appropriate.[1171]
Significantly, “[i]f the adverse environmental [impacts] of the proposed action are adequately identified and evaluated, the agency is not constrained by NEPA from deciding that other values outweigh the environmental costs.” [1172]
NHTSA considers the impacts reported in the Final SEIS, in addition to the other information presented in this preamble, the Final TSD, and the FRIA, as part of its decision-making process.
Per DOT Order 5610.1D, NHTSA considers a “No-Action” Alternative in its NEPA analyses and presents the environmental impacts of the final rule and alternatives, including the No-Action Alternative, in comparative
( printed page 62241)
form.[1173]
The range of CAFE standard action alternatives, including the No-Action Alternative, encompasses a spectrum of possible fuel economy standards that NHTSA could determine is the maximum feasible based on the different ways NHTSA could weigh the applicable statutory factors.
Some commenters argued that NHTSA did not evaluate a reasonable range of action alternatives because the alternatives outlined in the proposal yielded similar outcomes, which they asserted fall below the maximum feasible standard required by EPCA, do not account for gradual standard increases, technology-neutral pathways, or policies aligned with infrastructure readiness, and do not maximize fuel savings and emission reductions.[1174]
As further explained in Appendix C of the Final SEIS, NHTSA disagrees with these commenters. NEPA does not require NHTSA to include alternatives that result in specific outcomes nor incorporate factors or policies that are beyond its statutory authority under EPCA. Rather, NHTSA finds that its proposed action and the action alternatives considered in its environmental analysis are technically and economically feasible and meet the purpose and need of this final rule, as required by NEPA.[1175]
Additional discussion of the alternatives that NHTSA considered in the final rule is provided in Section III of the final rule preamble.
The agency's Final SEIS describes the reasonably foreseeable impacts for all alternatives across a variety of environmental resources, including energy, air quality, emissions effects, and historic and cultural resources. The impacts of the final rule are discussed in proportion to their significance, qualitatively and quantitatively, as applicable.[1176]
The findings of the analysis are summarized here, and more detailed discussion—in particular for any qualitative resource assessment—can be found in the Final SEIS.
Reasonably foreseeable energy impacts from the final rule include changes in vehicle fuel consumption. All five action alternatives would increase fuel consumption compared to the No-Action Alternative,[1177]
with fuel consumption increases that range from 114 billion GGEs under Alternative 5 to 210 billion GGE under Alternative 1. Alternative 3 (the Preferred Alternative) increases fuel consumption by 204 GGE.
The relationship between CAFE standards and criteria pollutant and air toxics emissions is less straightforward than the relationship between CAFE standards and energy use because the criteria pollutant and air toxics relationship reflects the complex interactions among many factors. In general, emissions of criteria air pollutants decrease with increasing stringency. However, the analysis shows that the action alternatives would result in various levels of emissions when measured against projected trends under the No-Action Alternative. These reductions and increases in emissions would vary by pollutant, calendar year, and action alternative. The differences in national emissions of criteria air pollutants among the action alternatives compared to the No-Action Alternative would range from less than 1 percent to about 11.7 percent. Adverse health outcomes from criteria pollutant emissions are expected to increase nationwide in 2035 and 2050 under all action alternatives relative to the No-Action Alternative. This is primarily due to increases in downstream emissions, particularly of VOC and CO. The increases in health effects would stay the same or get smaller from Alternatives 1 and 2 to Alternative 5 in 2035 and 2050, reflecting the generally greater stringency of Alternative 5. However, emissions decrease over time under each action alternative.
Toxic air pollutant emissions would remain the same or increase in 2035 and 2050 for all action alternatives relative to the No-Action Alternative. The largest relative increases in emissions generally would occur for formaldehyde for which emissions would increase by as much as 12.6 percent under Alternatives 1 and 2 in 2050 compared to the No-Action Alternative. Percentage increases in emissions of acetaldehyde, acrolein, 1,3-butadiene, benzene, and diesel particulate matter (DPM) would be less. The smaller increases are not expected to lead to measurable changes in concentrations of toxic air pollutants in the ambient air. For such minor changes, the impacts of those action alternatives would be essentially equivalent. Larger increases in emissions could lead to changes in ambient pollutant concentrations.
Overall changes in health effects due to air pollution are expected to be consistent with any resulting emissions trends. Higher emissions would be expected to lead to an overall increase in adverse health effects while lower emissions would be expected to lead to a decrease in adverse health effects. The changes in health effects due to changes in emissions also are dependent on geographic population distribution, meteorological and topographical conditions, and people's proximity to roadways and upstream facilities.
The final rule and alternatives would result in slight increases in CO2
concentrations, surface temperature, sea-level, and precipitation, and a slight decrease in ocean pH compared to the No-Action Alternative, based on projections using a reduced-complexity climate model. They also could, to a small degree, increase the impacts and risks of climate trends. A great deal of uncertainty exists regarding the magnitude of impact on these climate variables, as well as to the impacts and risks of climate trends. The impacts of the final rule and alternatives on global mean surface temperature, precipitation, sea-level, and ocean acidification would be very minor in relation to global emissions trajectories. This is because of the global and multi-sectoral nature of climate trends. Any impacts also would occur on a global scale and would not affect the United States disproportionately. To put these emissions changes in perspective, the emissions increase from all passenger cars and light trucks in 2035 compared with emissions under the No-Action Alternative are approximately equivalent to the annual emissions from 17,806,954 vehicles under Alternative 3, the Preferred Alternative. For reference, a total of 252,733,312 passenger cars and light trucks are projected to be on the road in 2035 under the No-Action Alternative.[1178]
In cases where quantitative impacts assessment was not possible, NHTSA presented the findings of a literature review of scientific studies for informational purposes.
Some commenters argued that the environmental analysis in the Draft SEIS is incomplete or incorrectly assessed in various ways.[1179]
For example, commenters argued that the Draft SEIS did not consider the potential effect of the retroactive generation of additional compliance credits resulting from this rule, or that it understated the impacts
( printed page 62242)
of changes in criteria and non-criteria air emissions.[1180]
Comments regarding the scope of environmental analysis are addressed in Section V.B.2 above, while those regarding the results of the environmental analysis are addressed in Appendix C of the Final SEIS.
The Final SEIS is one factor that informed NHTSA's decision-making process to set CAFE standards. NHTSA evaluated the range of reasonable alternatives in the Final SEIS, along with other factors during the rulemaking process and determined that Alternative 3 is the Preferred Alternative because it is maximum feasible. NHTSA took a hard look at the results of the Final SEIS in arriving at its conclusion that Alternative 3 is maximum feasible.
D. Severability
For the reasons discussed above, NHTSA concludes that its authority to finalize and implement CAFE standards for MYs 2022-2026 and 2027-2031 is well-supported in law and practice. NHTSA also concludes that its exercise of authority reflects sound policy.
In the proposal, NHTSA stated that if any portion of the rule is declared invalid, the agency intended the various aspects of the rule to be severable and, specifically, that each set of standards, for MYs 2022-2026 and MYs 2027-2031, be severable, as well as the various compliance proposals. NHTSA discussed that the standards for MYs 2027-2031 could be implemented independently if any of the other years' standards were struck down, and the agency believed that it would be in the best interest of the Nation for the standards to be applicable to support EPCA's overarching purpose of energy conservation. NHTSA stated that each standard was justified independently on both legal and policy grounds and could be implemented effectively by the agency.
The agency received a variety of comments regarding whether the different provisions and standards within the proposed rule are severable from one another in the event of a legal challenge. PMI recommended that NHTSA include express severability clauses in the regulatory text for distinct components of the rule to reduce legal risk and ensure the reforms are durable.[1181]
It detailed four specific areas that should function independently: first, the retroactive corrections for MYs 2022 through 2026 are logically and legally distinct from the prospective 2027 through 2031 standards, as the former corrects a specific legal error regarding the inclusion of electric vehicles, while the latter represents a forward-looking policy judgment about maximum feasibility; second, the proposed regulatory reclassification of light trucks based on functional utility serves the independent statutory purpose of preventing regulatory arbitrage and should remain in effect even if the numeric stringency targets are vacated; third, the elimination of the credit trading program is a discrete policy choice that is permitted, but not required, by the statute, and this decision to remove a distortive cross-subsidy stands on its own merits; and fourth, PMI urged NHTSA to explicitly state that its stringency levels are justified independently by economic practicability and energy conservation considerations, ensuring the standards would survive even if courts later reject the agency's statutory interpretation barring the consideration of electric vehicles under subsection 32902(h).[1182]
The Alliance also supported the agency's claim that the proposed standards for MYs 2022 through 2026 are severable from the standards for MYs 2027 through 2031, noting that the agency appropriately conducted two separate analyses for these periods.[1183]
However, the Alliance diverged from PMI regarding the vehicle reclassification proposal, arguing that these provisions should not be severable from the model years to which they apply.[1184]
They explained that reclassifying many SUVs and minivans as passenger cars subjects those vehicles to an unrevised passenger car fleet standard that was never designed for or evaluated with those heavier vehicles in mind.[1185]
Consequently, the Alliance argued that, if the revised standards for MYs 2028 and later are struck down, the vehicle reclassification provisions must also be struck down.[1186]
Several other commenters, including NRDC
et al.,
ZETA, and an individual commenter, opposed the assertion that the rule's provisions are severable.[1187]
These commenters argued that the proposed rule is intended to operate as a single, integrated whole and that its various components are interdependent and would not function sensibly in isolation. A primary objection from these commenters was that the standards for MYs 2027 through 2031 are inextricably linked to the standards for MYs 2022 through 2026.[1188]
NRDC
et al.
and the individual commenter noted that the later standards are explicitly based on the earlier ones, with each year providing a fixed percentage increase—specifically 0.5 percent followed by 0.25 percent per year—building off the maximum feasible “foundation” of the revised 2022 standards, with a “bridge” year in 2027.[1189]
NRDC
et al.
emphasized that if the MYs 2022-2026 standards are vacated, the existing, much more stringent standards for those years would automatically go back into effect.[1190]
NRDC
et al.
continued to state that because a 0.25-percent increase from those higher baseline levels would result in entirely different standards than what NHTSA proposed, the agency has not demonstrated it would have adopted the same 2027 through 2031 standards under those circumstances.[1191]
The individual commenter further noted that a new round of analysis and notice and comment would be required if earlier standards are invalidated.[1192]
Finally, NRDC
et al.
and ZETA opposed the contention that other policy choices in the rule, such as the elimination of credit trading and the reclassification of vehicle fleets, are discrete and severable provisions.[1193]
ZETA argued that the elimination of the credit trading program is directly predicated on NHTSA's new approach to the baseline.[1194]
NRDC
et al.
similarly contended that the agency has advanced a single, integrated proposal where these compliance and enforcement changes are combined with the elimination of purportedly unlawful considerations, rather than discrete policy choices that can be cleanly severed.[1195]
NHTSA has carefully considered the comments regarding the severability of
( printed page 62243)
the various provisions within this final rule. The agency agrees with PMI and the Alliance that each part of this regulatory action is legally and logically distinct, and as stated in the proposal and reaffirmed here, it is the agency's express intent that these provisions be treated as severable. Specifically, the corrections for MYs 2022-2026 are intended to rectify a specific legal error regarding the improper inclusion of prohibited factors under subsection 32902(h), while the standards for MYs 2027-2031 represent a separate, forward-looking exercise of the agency's discretion to determine maximum feasible levels based on the capability of vehicles powered by gasoline or diesel fuel, as defined by the statute. Moreover, the standards for MYs 2027-2031 were selected using a MY 2024 reference fleet and a forward-looking baseline, both unconnected mathematically to the MYs 2022-2026 standards. These two parts of the rule serve distinct functions and are based on independent analyses and legal justifications. NHTSA believes that the invalidation of one phase of the rule should not affect the continued validity of the other, as the agency would have adopted the MYs 2022-2026 revisions to align with the law regardless of its policy choices for future model years; conversely, NHTSA would have adopted the MYs 2027-2031 amendments regardless of the level of standards for MYs 2022-2026.
Regarding PMI's comment to state explicitly that the stringency levels are justified independently by economic practicability and energy conservation considerations regardless of whether a court finds NHTSA's application of the subsection 32902(h) factors appropriate, NHTSA cannot do so because such a determination would be based on factors that subsection 32902(h) explicitly bars the agency from considering when setting standards. The balance of external factors that the agency can consider, for example the nation's status as a net petroleum exporter, the significant increase in new vehicle transaction prices, and diminishing fuel savings from adding fuel-economy-improving technologies as the vehicle fleet gets more efficient, all point to a standards reset being appropriate.
Regarding the comments on various compliance proposals, NHTSA maintains that the new vehicle classification definitions can remain in the regulatory text as-is; however, NHTSA agrees with the Alliance that the agency must carefully consider the feasibility of standards based on the vehicles included in each regulatory class. The corrected definitions of passenger and non-passenger automobiles are valid exercises of the agency's authority to define vehicle categories independent of the specific numeric standards applied to them. NHTSA maintains that the updated vehicle classification definitions rest on independent legal justifications and can remain in the regulatory text even if a court finds that the numeric standards for those model years are not maximum feasible. Should standards for any particular model year be vacated, the agency would reassess and establish replacement standards using either the previous or updated classification framework based on a fresh evaluation of what constitutes reasonable lead time. With regard to compliance proposals, the decision to eliminate the credit trading program is a discrete one that is not dependent on the specific stringency levels or the baseline methodology adopted elsewhere in the rule. This is particularly important given the agency's application of subsection 32902(h), which precludes consideration of credit trading, transferring, or availability, to its standard-setting methodology.
NHTSA disagrees with the comments from NRDC
et al.,
ZETA, and others that the rule is an indivisible, integrated whole that cannot function in isolation. While the prospective standards for MYs 2027-2031 are designed to follow the revised MYs 2022-2026 standards, the agency's choice of annual stringency increases reflects a deliberate policy judgment about the appropriate rate of technological progress for the internal combustion engine fleet. If a court were to vacate the MYs 2022-2026 revisions, the agency's decision to pursue modest, incremental increases in subsequent years would remain a valid and reasonable application of the statutory factors of economic practicability and technological feasibility. Moreover, a return to the prior, more stringent baseline for MYs 2022-2026 would not automatically render the MYs 2027-2031 percentage increases non-sensical, as the MYs 2027-2031 standards were set using the prior rule's standards for MYs 2024-2026 as the baseline, and not the proposed correction to MY 2022-2026 standards.
The foundational legal interpretations, vehicle classification reforms, and specific stringency targets of this rule each rest on independent justifications. Therefore, each of these components is intended to survive independently of the others.
VI. Compliance and Enforcement
NHTSA is finalizing changes to its CAFE enforcement program for light-duty automobiles. These changes include: (1) modifying the criteria for classification as a non-passenger automobile beginning in MY 2030; (2) removing credit trading from the CAFE program beginning with credits earned in MY 2028; (3) removing references to EPA's regulations regarding manufacturers' ability to generate AC efficiency and OC FCIVs; (4) modifying manufacturer reporting requirements; and (5) making other technical amendments. To provide context for these changes, Section VI.A first provides an overview of NHTSA's CAFE enforcement program. Section VI.B then discusses and explains the finalized changes to the CAFE program.
A. Background and Overview of Compliance and Enforcement
NHTSA's CAFE enforcement program is largely established by EPCA, as amended by EISA, and is prescriptive regarding enforcement. EPCA and EISA also establish a number of flexibilities and incentives available to manufacturers to help them comply with the CAFE standards. The statute also authorizes NHTSA to establish, at its discretion, additional flexibilities by regulation. The light-duty CAFE program includes all vehicles with a GVWR of 8,500 pounds or less as well as vehicles between 8,501 and 10,000 pounds classified as medium-duty passenger vehicles (MDPVs).[1196 1197]
( printed page 62244)
Table VI-1 provides an overview of the CAFE program, including statutory and regulatory citations, and an overview of the changes proposed and finalized in this rulemaking.
( printed page 62245)
( printed page 62246)
( printed page 62247)
( printed page 62248)
In general, as required by EPCA, NHTSA sets fleet average fuel economy standards for light-duty vehicles on an mpg basis. As specified in EPCA, light-duty vehicles are separated into three separate compliance categories: passenger automobiles manufactured domestically (referred to as domestic passenger cars), passenger automobiles not manufactured domestically (referred to as imported passenger cars), and non-passenger automobiles (which are also referred to as light trucks).[1198]
Each standard applies to a manufacturer's compliance category as a whole and not to individual vehicles, and a manufacturer can balance the performance of their vehicles (via the application of fuel-saving technology) in complying with standards. NHTSA sets standards based on vehicle footprint (
i.e.,
the area calculated by multiplying the wheelbase times the track width), and each manufacturer must comply with the fleet average standard derived from their vehicles' target standards. These target standards are taken from a set of mathematical functions for each fleet. Although NHTSA sets the standards for light-duty vehicles, EPA, as authorized and directed by EPCA, establishes procedures for calculating a manufacturer's average fuel economy for CAFE compliance. Average fuel economy values are based on vehicle testing conducted using the FTP (or
( printed page 62249)
“city” test) and HFET (or “highway” test).[1199]
At the end of each model year, EPA determines the fleet average fuel economy performance for the individual fleets in accordance with procedures set forth in 40 CFR part 600. NHTSA then confirms whether a manufacturer's fleet average fuel economy performance for each of its compliance categories of light-duty vehicles meets the applicable target-based fleet standard. NHTSA makes its final determination of whether a manufacturer has met its CAFE compliance obligation based on official reported and verified CAFE data received from EPA. Pursuant to 49 U.S.C. 32904(e), EPA is responsible for calculating manufacturers' CAFE values so that NHTSA can determine compliance with its CAFE standards. A manufacturer's final model year report must be submitted to EPA no later than May 1st following the end of the model year.[1200]
EPA verifies the data submitted by manufacturers and issues final CAFE reports that are sent to manufacturers and to NHTSA electronically between April and October of the calendar year following the end of model year. NHTSA then assesses each manufacturer's compliance for each of their fleets and calculates each manufacturer's credit amounts (credits for vehicles exceeding the applicable CAFE standard) and shortfalls (amount by which a fleet fails to meet the applicable CAFE standards). A manufacturer meets NHTSA's fuel economy standard if its fleet average performance is greater than or equal to its required standard.
If one or more of a manufacturer's compliance categories fails to meet its fuel economy standard, NHTSA will provide written notification to the manufacturer that it has not met the standard. The written notification will also include the shortfall amount for each compliance category, which is calculated using the following equation: (Fuel Economy Achieved − Fuel Economy Standard) × 10 × Production Volume.[1201]
To determine the civil penalty amount, NHTSA multiplies the total shortfall (in credits) by the applicable civil penalty rate.[1202]
When the manufacturer receives the written notification, it is required to confirm the shortfall amount and submit a plan indicating how it will allocate existing credits or earn, transfer, or acquire credits to apply toward the shortfall, or inform NHTSA of its intention to pay a civil penalty to resolve the shortfall.[1203 1204]
The manufacturer must submit a plan or applicable civil penalty payment within 60 days of receiving the written notification from NHTSA. Credit allocation plans and carryback plans (
i.e.,
plans to use future earned or acquired credits to apply toward the shortfall) received from the manufacturer will be reviewed by NHTSA, and NHTSA will approve a credit allocation plan unless it finds the proposed credits are unavailable or that it is unlikely that the plan will result in the manufacturer earning sufficient credits to offset the shortfall. If a plan is rejected, NHTSA will notify the manufacturer and request a revised plan.
NHTSA received several comments on issues related to those discussed in this section, such as the transfer of credits and the statutory cap on the transfer of credits between compliance categories within a manufacturer's fleet; these discussions, while relevant to the CAFE program, are outside of NHTSA's authority. Honda commented that it supports manufacturers' ability to transfer credits between their own compliance fleets.[1205]
JLR, UCS, and Volkswagen commented on the 2-mpg transfer credit cap between compliance fleets.[1206]
Volkswagen commented that NHTSA should remove the transfer cap and allow manufacturers to use all their earned credits.[1207]
JLR commented that the transfer cap has become increasingly restrictive, considering the proposed changes to vehicle classification.[1208]
UCS commented that capping credit transfers means that marginal compliance costs have a component related to fleet mix, which can lead to credit imbalances among manufacturers.[1209]
In response to these comments, NHTSA notes that the cap on the transfer of credits between compliance categories within a manufacturer's fleet is set by statute at 49 U.S.C. 32903(g)(3). NHTSA cannot adjust the transfer cap in a manner that is inconsistent with the statute. For the final rule, NHTSA is not making any changes to the existing provisions regarding transferring credits between compliance categories. In accordance with the statute, credits transferred may only be used to improve a compliance category's fuel economy performance by up to 2 mpg.
AVE recommended that NHTSA use the 5-cycle test procedure, not the 2-cycle test procedure, to measure fuel economy.[1210]
AVE commented that, in addition to providing improved measurement that better reflects real-world performance, using the 5-cycle test procedure will align NHTSA's fuel economy values with EPA's emission values. AVE also requested that NHTSA align its test procedures with EPA's test procedures to provide consistent well-defined test cycle results, in particular for hybrid-electric powertrain technologies whose performance can vary based on test cycle assumptions.[1211]
NHTSA does not have the authority to modify the testing procedures used to calculate a manufacturer's average fuel economy values. EPCA, as amended by EISA, provides EPA with the authority to calculate the average fuel economy of a manufacturer's compliance fleet. NHTSA has no role in determining the testing and calculation procedures prescribed by EPA.[1212]
Porsche commented on the way NHTSA amends regulatory text.[1213]
Porsche recommended that NHTSA keep the original section number and `reserve' sections and subsections containing provisions that are removed. Porsche states that doing so will maintain consistency with other regulations that may reference them.
While NHTSA appreciates Porsche's comment, NHTSA does not agree that it should change the way it amends regulatory text. While NHTSA endeavors to check cross-references for all the provisions it amends, the agency acknowledges the possibility that a cross-reference may be missed. NHTSA does not believe however, that this possibility warrants `reserving' sections and subsections that contain provisions that are amended. Doing so could add unnecessary paragraphs to the text and would not ensure that all cross-references are updated appropriately.
( printed page 62250)
Instead, NHTSA would seek to address any outdated cross-references in the context of a technical amendment and encourages manufacturers to notify NHTSA if they find any in the text. Given these factors, NHTSA is finalizing amendments to the regulatory text using the same methods as the NPRM.
B. Finalized Changes to the CAFE Program
Consistent with the overall reset of the CAFE program discussed earlier in Section V, NHTSA is finalizing two changes intended to align NHTSA's regulations with EPCA in a manner that will better effectuate the statutory purpose of the CAFE program. First, NHTSA is amending the criteria for non-passenger automobile classification to align NHTSA's regulations with the best reading of the statue.[1214]
Second, NHTSA is terminating credit trading between manufacturers beginning with credits earned in MY 2028; credits earned prior to MY 2028 may be traded and used for up to five years, consistent with the statutory limit for carrying credits forward.[1215]
NHTSA is also finalizing technical amendments to its regulations to remove references to EPA's regulations for OC FCIVs, making modifications to reporting requirements, and making several technical amendments. The finalized changes are discussed in detail in the following sections.
1. Modification of Vehicle Classification in the CAFE Program
NHTSA is amending the criteria for non-passenger automobiles. This final rule is informed by an examination of how NHTSA's vehicle classification criteria in 49 CFR part 523,
Vehicle Classification,
align with and implement the vehicle definitions in 49 U.S.C. 32901.
This is not the first time NHTSA has examined vehicle classification; in its 2010 and 2012 final rules, NHTSA considered amending its vehicle classification regulations but decided to monitor and revisit them in future rulemakings.[1216 1217]
Notably, NHTSA stated that “no one can predict with certainty how the market will change between now and 2025” specifically regarding how vehicle manufacturers may “make more deliberate redesign efforts to move vehicles out of the car fleet and into the truck fleet in order to obtain the lower target.” [1218]
It is now 2026, and NHTSA has finalized an updated analysis using current fleet data.
The starting point of NHTSA's analysis was a recognition of the market shift from passenger automobiles to non-passenger automobiles (as currently classified) in the light-duty vehicle market. In 1975, non-passenger automobiles represented 19.3 percent of the light-duty automobile market [1219]
and now make up 64.7 percent.[1220]
Figure VI-1 below illustrates the year-over-year light-duty fleet shares of passenger automobiles and non-passenger automobiles over the last 50 model years (
i.e.,
from 1975 to 2024).
( printed page 62251)
Leading up to the 2010 and 2012 final rules, there was no clear year-over-year trend in the share of each fleet, but the fleet composition has since continued the long-term trend towards non-passenger automobiles. Based on its new analysis, NHTSA believes that the criteria it uses to delineate between the fleets need to be changed in concurrence with resetting of stringencies, to ensure that the classification of the fleets meets the intent of EPCA. These changes and the processes by which they were evaluated are described in detail in the subsequent paragraphs and sections.
To assess how the current criteria in section 523.5 of NHTSA's regulations align with the statutory definitions and intent, NHTSA conducted an analysis beginning with the compiled classification data from manufacturers' MY 2024 mid-model year fuel economy compliance reports.[1221]
To supplement this information, NHTSA conducted extensive research using publicly available manufacturer publications, such as owner's manuals, marketing brochures, and specification sheets,[1222]
to develop a comprehensive dataset of vehicle models and any non-passenger automobile criteria that each vehicle model meets. This additional research was necessary, as manufacturers' mid-model year reports generally provide only the minimum data required to demonstrate qualification as a non-passenger automobile. For example, for a three-row SUV that qualifies as a non-passenger automobile via 49 CFR 523.5(a)(5), the manufacturer may not provide data on off-highway angles and clearances specified in 49 CFR 523.5(b)(2). Incorporating additional market research data made it possible for NHTSA to check all possible regulatory pathways that could qualify a vehicle as a non-passenger automobile. A detailed discussion of how the MY 2024 analysis fleet dataset was developed and used can be found in Final TSD Chapter 2.7.[1223]
NHTSA has updated this data set since publishing the NPRM, based on comments and supporting material submitted by manufacturers, to fill in missing data and to correct errors in the dataset.
Based on the NPRM analysis, several commenters expressed support for the concept of reclassification but suggested that the method by which the changes were being introduced was intended only to reduce the stringency of both the passenger automobile and non-passenger automobile fleet.[1224]
The observation that the stringency of each fleet decreases at most footprints is correct when looking at each fleet individually; however, overall compliance is assessed as the weighted average of both the passenger
( printed page 62252)
automobile and non-passenger automobile fleets. While the compliance target of the passenger automobile footprint fuel economy curve decreases for most footprint sizes due to the reclassified fleet, it remains higher than the equivalent footprint fuel economy targets for a non-passenger automobile despite the fact that those targets will now apply to heavier vehicles, such as AWD crossovers previously subject to non-passenger automobile targets. Accordingly, while the overall stringency of each fleet decreases, the number of vehicles, and therefore the weighting, of the passenger automobile fleet is greater after the changes to classification criteria are applied. The resulting attribute-based fuel economy targets were not based on any reclassification effort to reduce or otherwise change the standards for each fleet, but are simply a product of the curve-setting analysis based on the composition of each fleet before and after reclassification. Further discussion of the fuel economy curve development can be found in preamble Section II.B.
Commenters also observed that these changes provide “no stringency benefit at fleet level” or changes to overall fleet efficiency.[1225]
This assessment is correct. As discussed throughout this preamble section, NHTSA's classification criteria, established in 1977 and based on a 1975 baseline fleet, have resulted in manufacturers' making design decisions, not in response to consumer demand, but to qualify vehicles as non-passenger automobiles. NHTSA's reclassification in this final rule, however, does not require manufacturers to remove or to redesign any feature or characteristics associated with the existing vehicle classification criteria, nor does it require a change to the existing utility or capability of the impacted vehicles. Instead, NHTSA is removing a regulatory incentive to add features that vehicle purchasers may not desire.
Based on this analysis, NHTSA is amending the criteria for non-passenger automobiles to align with the best reading of the statute. These changes are discussed in detail in the following sections.
a. Non-Passenger Automobile Definition
EPCA requires NHTSA to set separate maximum feasible standards for “passenger automobiles” and “non-passenger automobiles.” All vehicles in the light-duty fleet are classified into one of these two categories based on the presence or lack of certain vehicle characteristics and features. At 49 U.S.C. 32901(a)(17), EPCA defines a non-passenger automobile as “an automobile that is not a passenger automobile or a work truck.” By statute, the definition of non-passenger automobile is linked to the definition of passenger automobile found at 49 U.S.C. 32901(a)(18). A passenger automobile is a vehicle that NHTSA “decides by regulation is manufactured primarily for transporting not more than 10 individuals, but does not include an automobile capable of off-highway operation” that NHTSA decides by regulation “has a significant feature (except 4-wheel drive) designed for off-highway operation” and “is a 4-wheel drive automobile or is rated at more than 6,000 pounds gross vehicle weight.” In accordance with the statute, NHTSA has issued regulations at 49 CFR part 523 to establish criteria for determining whether a vehicle is a passenger automobile or non-passenger automobile. Under EPCA and NHTSA's regulations, there are three primary pathways for an automobile (
i.e.,
a vehicle under 10,000 pounds GVWR that is not a work truck) to be classified as a non-passenger automobile: (1) the automobile is designed to carry more than ten individuals; (2) the automobile is not manufactured primarily for transporting individuals; or (3) the automobile is capable of off-highway operation. NHTSA is finalizing changes to the criteria used to classify non-passenger automobiles via the second and third pathways.[1226]
These finalized changes are discussed in detail in the following sections.
ICCT's comments endorsed a single regulatory category and attribute-based fuel economy curve to encompass the entire light-duty automobile fleet.[1227]
This recommendation, however, is precluded by statute. EPCA directs NHTSA, by delegation, to evaluate and regulate passenger automobiles and non-passenger automobiles separately.
In the NPRM, NHTSA proposed that classification changes would take effect in MY 2028. Commenters who expressed support for the proposed changes did not provide specific rationale for why MY 2028 was a suitable year to introduce these changes, nor did they provide comment or supporting information endorsing or opposing the implementation of the vehicle classification changes in an alternative year.[1228]
NHTSA received several comments requesting that NHTSA delay implementation of the new vehicle classifications, most of which were from commenters who also expressed concerns about the proposed changes.[1229]
Several manufacturers and manufacturer-representing trade groups provided comments stating that MY 2028 did not provide sufficient lead time for manufacturers to respond to the classification changes with design changes to their vehicles or fleets.[1230]
A subset of these commenters argued that NHTSA's analysis was incomplete and recommended delaying reclassification indefinitely.[1231]
Comments also noted NHTSA's statutory 18-month lead time constraint,[1232]
suggesting that reclassified vehicles would be subject to more stringent standards without sufficient notice.[1233]
Some comments also raised concerns over the use of NHTSA's passenger automobile and non-passenger automobile definitions for regulatory purposes by other agencies, including EPA in its regulation of criteria emissions, evaporative emissions, and cold temperature carbon monoxide (CO) emissions and IRS in its implementation of the gas guzzler tax under 26 CFR 48.4064-1.[1234]
In response to these comments, NHTSA provides specific supporting information showing a complete and conclusive analysis for each change in preamble Sections VI.B.1.b and VI.B.1.c below.
In response to comments asserting that classification-specific design considerations are necessary for manufacturers to implement before the changes take effect, NHTSA refers commenters and other interested parties to preamble Section II.B for a complete
( printed page 62253)
description of how the attribute-based fuel economy curves were established and to preamble Section V for a discussion on maximum feasibility. NHTSA notes that the CAFE Model does not consider any of these design features or characteristics, and there is no inherent change in the actual utility or capability of the vehicles that move from non-passenger automobiles to passenger automobiles. The fuel economy curves before and after reclassification are both evaluated using the same methodology. NHTSA recognizes, however, that some manufacturers may have vehicles shift from the non-passenger automobile fleet to the passenger automobile fleet due to reclassification, and these manufacturers may need additional time to evaluate how this change may affect their compliance position.
To give manufacturers time to adjust their compliance positions, all changes to vehicle classification under 49 CFR 523.5 will take effect in MY 2030. NHTSA is aware of the use of its passenger automobile and non-passenger automobile (
i.e.,
passenger car and light truck, respectively) definitions by other agencies and pertaining to other regulations. Notably, EPA intends to use the non-passenger automobile criteria that NHTSA is proposing to amend at 49 CFR 523.5 to define “Light-duty truck” beginning in 2029.[1235]
EPA is proposing Tier 4 revisions for PM,[1236]
CO and HCHO,[1237]
and NMOG+NOX[1238]
standards, which by MY 2030 are the same regardless of light-duty vehicle (
i.e.,
passenger automobile) or light-duty truck (
i.e.,
non-passenger automobile) designation. Evaporative emission standards are proposed to remain at Tier 3 levels.[1239]
The relevant IRA excise tax is codified in regulation by the IRS [1240]
and states that “[a]n automobile does not include a non-passenger automobile as defined in regulations in effect on November 9, 1978 (49 CFR 523.5 (1978)), which were prescribed by the Secretary of Transportation for section 501 of the Motor Vehicle Information and Cost Savings Act (15 U.S.C. 2001).” While the interpretation, implementation, and consideration of this language is beyond the purview of NHTSA's authority or mandate, the specific regulation date means that any changes to the definition of a non-passenger automobile made after November 9, 1978 will have no impact or bearing on that vehicle's tax inclusion or exemption under 26 CFR 48.4064-1. To afford manufacturers additional time to adjust to the changes in vehicle classification criteria, NHTSA is delaying the implementation of all classification changes by two model years relative to the NPRM. All changes to vehicle classification under 49 CFR 523.5 will take effect in MY 2030.
b. Finalized Changes to Criteria for Off-Highway Capability
The third pathway at 49 CFR 523.5 for classification as a non-passenger automobile includes any automobile “capable of off-highway operation” that NHTSA decides by regulation: (1) “has a significant feature (except 4-wheel drive) designed for off-highway operation” and (2) “is a 4-wheel drive automobile or is rated at more than 6,000 pounds gross vehicle weight.” [1241]
Through rulemaking, NHTSA determined that “high ground clearance” would constitute a feature designed for off-highway operation and derived a specific list of dimensions that comprise high ground clearance.[1242]
Specifically, the regulation requires automobiles to meet minimum prescribed values for four out of the following five dimensions: running clearance, axle clearance, approach angle, breakover angle, and departure angle. When issuing these criteria, NHTSA explained that the agency arrived at these values “[a]fter comparing the ground clearance of automobiles used on highways only with automobiles used off as well as on the highway.” [1243]
In the 1977 final rule, NHTSA noted that Ford and International Harvester commented that the five ground clearance measurements proposed in the 1976 NPRM would distinguish automobiles capable of off-highway operation from other automobiles. The agency also stated that “[i]f a need arises in the future to establish additional criteria, the NHTSA will initiate rulemaking.” [1244]
After almost 50 years, NHTSA has re-evaluated whether the criteria appropriately differentiate between vehicles that are and are not capable of off-highway operation. After conducting an analysis using the MY 2024 fleet, NHTSA is finalizing two changes to the existing standard for determining high ground clearance, discussed in detail below. Together, these changes align NHTSA's criteria for off-highway capability with statutory intent.
In the NPRM, NHTSA proposed eliminating axle clearance as a characteristic used to define a vehicle with high ground clearance and requiring that vehicles classified as non-passenger automobiles via the off-highway pathway meet the prescribed thresholds for all four of the remaining characteristics that comprise the high ground clearance feature. NHTSA asserted that the objective of high ground clearance as an off-highway feature is to describe automobiles capable of off-highway operation. The axle configuration that is most impacted by the axle clearance characteristic is the solid axle, where the differential must be housed and vertically centered along a linear path between the center of the wheels on either side of the axle. In contrast, independent axles can vertically center the differential gears above the same linear path, effectively making running clearance the only constraining vertical measurement. Solid axles excel in off-highway operation at the expense of on-highway ride quality. In the NPRM, NHTSA found that creating an additional clearance characteristic that typically applies only to this solid axle type does not align with the statutory intent that the significant feature would indicate off-highway capability.
Along with the removal of the axle clearance, NHTSA is requiring that non-passenger automobiles using the off-highway pathway also meet all four of the remaining dimensions. In reaching this conclusion, NHTSA analyzed the MY 2024 fleet classification data and determined the manufacturing volumes of vehicles that qualified as non-passenger automobiles based on the vehicle's having a high ground clearance, as determined by meeting at least four of the five factors, as well as the angle and clearance values of each of those vehicles. Of particular importance was determining the subset of vehicles that met both the GVWR or 4WD off-highway criteria described in 49 CFR 523.5(b)(1) and exactly four of the five existing off-highway criteria described in 49 CFR 523.5(b)(2). NHTSA made the following observations within this subset of current off-highway classified automobiles: [1245]
Most of these classified automobiles (98.9 percent) do not meet the approach angle minimum threshold of 28 degrees;
( printed page 62254)
the remaining vehicles (1.1 percent) are comprised from a single nameplate.[1246]
Many of the classified automobiles (66.2 percent) have an approach angle of less than the required departure angle of 20 degrees.[1247]
After reviewing this data, NHTSA investigated why so few vehicles in this vehicle category meet the approach angle requirement and whether this vehicle feature is necessary for off-highway operation. The vehicle attributes outlined in 49 CFR 523.5(b)(2) include approach angle, breakover angle, departure angle, and running clearance, which work together to define what represents a vehicle designed with an off-highway capability intent without having to define the off-highway environment explicitly. The approach angle attribute is of particular importance because it is the first vehicle feature to engage with an off-highway obstacle or grade—determining whether the vehicle can navigate the obstacle. If the vehicle does not have the ability to approach the obstacle, then the other off-highway attributes become irrelevant. Because of the varying nature of off-highway environments and the equally varying ways to navigate them, the approach angle is set higher to maximize the capability of the other vehicle attributes. This higher approach angle feature can also be seen on vehicles in the 2024 fleet that are specifically designed with high levels of off-highway capability such as the Jeep Wrangler, Ford Bronco, and Land Rover Defender.[1248]
NHTSA determined in its analysis that manufacturers are reducing significantly the approach angle to as low as 14 degrees in pursuit of on-road aerodynamic improvements, ultimately degrading off-highway capability. The approach angle is an important off-highway vehicle attribute, which is why it was originally and continues to be set at 28 degrees. This approach angle observation suggests that regulatory definitions have caused shifts in vehicle design characteristics, where manufacturers apply the remaining high ground clearance characteristics (breakover angle, departure angle, and running clearance) to vehicles otherwise not intended for off-highway operation. The passenger automobile fleet's fuel economy stringencies originated and evolved at a time when high-frontal area automobiles that consumers have shown a preference for were not present in the light-duty fleet. The gradual introduction of and accompanying consumer preference for high frontal area passenger-carrying automobiles made it difficult for manufacturers to meet the passenger car CAFE standards,[1249]
which had originated and evolved prior to the widespread proliferation of this type of light-duty vehicle. Manufacturers, therefore, applied 4 out of the 5 high ground clearance characteristics, retaining aerodynamic (
i.e.,
low) approach angles that limit off-highway capability but place these vehicles in the non-passenger automobile fleet. NHTSA proposed to correct this divergence between fleet composition and off-highway operation by re-establishing the standard curves using an updated fleet allocation, asserting that this change (along with the rest of the applicable fuel economy standards) would eliminate the need for manufacturers to decide between unnecessary high ground clearance characteristics and achieving passenger automobile fuel economy standards.
Most commenters who expressed either support for or opposition to the proposed changes to the off-highway non-passenger criteria did not provide substantive comment specific to the removal of the axle clearance criterion. Honda, however, commented that removing axle clearance is “particularly problematic” because the axle is a rigid structure, versus “sacrificial plastic bumper trim” components that would impede approach or departure angle on certain vehicles.[1250]
Although it is true that the solid axle differential is a rigid component that cannot deflect laterally, axle height is influenced almost entirely by tire diameter and does not necessarily have a direct relationship to approach, breakover, or departure angles; however, running clearance impacts directly these angles for a given design and does not include unsprung mass such as suspension components or solid axles.[1251]
Despite extensive research, NHTSA was unable to identify a single vehicle meeting the off-highway criteria in the 1975 baseline fleet for which approach angle was the omitted off-highway characteristic,[1252]
while axle clearance was a common omission. A stock Ford Bronco [1253]
or Chevrolet Blazer [1254]
in 1975, for example, could have been manufactured with approach angle, departure angle, breakover angle, and running clearance well exceeding the off-highway characteristic thresholds, but with an axle clearance below the 18-centimeter threshold. As previously stated, a solid axle provides a tractive advantage on uneven terrain compared to an independent axle. For these reasons, NHTSA continues to agree with the historic assessment that, in conjunction with the statutorily required 4WD or GVWR of at least 6,000 pounds, a vehicle meeting the originally prescribed approach angle, departure angle, breakover angle, and running clearance with an axle clearance of less than 18 centimeters would be sufficiently indicative of off-highway capability.
Supporters of the proposal to require all four of the remaining off-highway criteria commented that doing so is consistent with statutory intent and a vehicle's fundamental design, and reflects actual vehicle use scenarios.[1255]
Other supporters described the five off-highway characteristics as a “regulatory checklist” that manufacturers have used to determine a vehicle's classification.[1256]
Opponents of the proposal to require all four of the remaining off-highway criteria had various categories of concern. The first is that NHTSA failed to consider off-highway environments that do not always require a significant approach angle, such as maintained trails, gravel roads, or a sandy environment like dunes or beaches. This comment came primarily from industry manufacturers and representative trade groups.[1257]
In
( printed page 62255)
making this case for the variety of off-highway use cases, North American Subaru, Inc. (Subaru) stated that “the most realistic determination of off-highway capability today is actual customer perception and usage, as evidenced by the various ways and conditions in which customers use their vehicle.” [1258]
Common commenter recommendations included requiring three out of the remaining four off-highway characteristics [1259]
or reducing the approach angle threshold to match departure angle.[1260]
Honda commented that the “4-of-4” off-highway requirement “penalizes fuel-efficient designs,” “mandates inefficiency,” and degrades pedestrian safety.[1261]
NHTSA also received comment that the agency should “conduct a new analysis of the modern off-highway functional characteristics rather than relying on an analysis that is now fifty years old.” [1262]
Some commenters were also concerned that, in combination with the changes to the standards in this rule, this change would further incentivize even more extreme design choices.[1263]
In response to comments from automakers and NGOs regarding the need to reconsider the existing off-highway characteristics, NHTSA examined how current off-highway vehicles are designed to meet off-highway conditions. NHTSA's analysis showed, for example, that of the 70 unique nameplates of vehicles in the MY 2024 analysis fleet that qualify under the off-highway pathway of the current regulations at 49 CFR 523.5 by meeting four out of the five criteria (as previously mentioned, nearly all of which do not meet the approach angle criterion), 50 of them meet the running clearance criterion by less than or equal to one centimeter or the departure angle criterion by less than or equal to one degree, or both.[1264]
NHTSA also acknowledges that off-highway environments are varied and diverse. The correct combination of driver skill, tire selection, and tire inflation level could enable most light-duty vehicles to operate in most mild off-highway environments, such as gravel roads or beaches. The statute, however, specifies a
significant
feature
designed for
off-highway operation.[1265]
Having only one or a few of the four criteria does not constitute a significant off-highway feature; rather, all four criteria are needed to indicate having a significant off-highway feature.
“Customer perception and usage” is a subjective assertion, and while customer utilization is an important market indicator, NHTSA must follow objective and uniform standards for enforcement and rulemaking. Changing the classification of a vehicle does not remove its existing utility or capability, nor does it alter the consumer market for those feature sets or restrict manufacturer advertising of off-road functionality.[1266]
As previously discussed, NHTSA is realigning the fuel economy curves to reflect more accurately the actual design, capability, and utility of the current light-duty vehicle fleet. With this rule, moving a reclassified vehicle back into the non-passenger automobile fleet by increasing its approach angle would yield a much less significant (if any) improvement to compliance position and would result in a fuel economy competitive disadvantage for customers who do not desire or require a high approach angle.
NHTSA acknowledges that the original fifty-year-old analysis is no longer a suitable representation of the modern fleet; however, the geometric principles determining how a vehicle's high ground clearance facilitates its ability to navigate off-highway environments have not changed. When the characteristics comprising the high ground clearance feature were originally prescribed, the agency found that, by applying the original thresholds to the 1975 fleet and requiring at least four of them, they could capture all of the “off-highway capable” vehicles without including any unintended vehicles. The original off-highway criteria set may have created separation between passenger and non-passenger automobiles at the time of issue, but may not continue to do so in a more modern fleet. Despite extensive research,[1267]
the agency has been unable to find an example of a vehicle from the 1975 fleet that met four out of five off-highway characteristics while omitting approach angle, running clearance, or breakover angle. Due to the designs and technologies of the vehicles in that era, departure angle was the most common omission, with several cases of axle clearance as well. In other words, requiring approach angle, running clearance, and breakover angle as well as requiring at least one of either departure angle or axle clearance would have been a slightly more complex formula producing an identical result. Although 49 CFR 523.5(a)(3)[1268]
was and continues to account for a significant share of the non-passenger automobile fleet, 49 CFR 523.5(a)(2)[1269]
and (4) [1270]
commanded a far larger share of the non-passenger automobile fleet in the 1975 fleet versus the current fleet; in the MY 2024 non-passenger automobile analysis fleet, these two regulatory pathways accounted for 779 vehicle sales out of over nine million total.[1271]
For perspective, 19.3 percent of the total MY 1975 light-duty fleet was classified as non-passenger—a fraction of which qualified exclusively on the off-highway capability pathway; in contrast, 32.2 percent of the total MY 2024 light-duty fleet qualifies as a non-passenger automobile exclusively via the off-highway capability pathway.
For these reasons, NHTSA is amending 49 CFR 523.5(b) as proposed in the NPRM, removing axle clearance specifications as an option in conjunction with three of the four other characteristics to qualify as a non-passenger automobile and instead requiring vehicles that qualify via this pathway to meet the historically prescribed values for the four remaining characteristics of approach angle, breakover angle, departure angle, and running clearance, beginning in MY 2030.
As part of its evaluation of the criteria for off-highway capability, NHTSA also investigated the statute's “4-wheel drive” off-highway feature, specifically with regard to the differences between 4WD (4x4) and AWD drivetrains. Currently, 4WD and AWD technologies
( printed page 62256)
both qualify as 4WD as required by statute for vehicles that do not have a GVWR of more than 6,000 lbs.[1272]
The agency found that there is significant overlap in present-day 4WD and AWD peripheral technologies, such as axle differential locks, interaxle locks, low-range gearing and torque availability, and intelligent traction control systems that make it difficult, if not impossible, to assess off-highway ability based on the exclusively differentiating features of 4WD and AWD systems. NHTSA sought comment on this assessment in the NPRM. Commenters agreed with the agency's assessment, and NHTSA is therefore not changing its position that any drivetrain capable of sending power to all four wheels, including both 4WD and AWD systems, is sufficient to be considered a 4-wheel drive automobile under the statute's vehicle definitions at 49 U.S.C. 32901.[1273]
c. Finalized Changes to Criteria for Functional Performance
A passenger automobile is defined, in part, as an automobile “manufactured primarily for transporting not more than 10 individuals.” [1274]
When the agency first issued vehicle classification regulations for the CAFE program in 1977, the agency considered the meaning of “primarily” in addition to the meaning of the phrase “manufactured primarily for transporting not more than 10 individuals” in the context of vehicle classification.[1275]
Ultimately, NHTSA determined that the phrase consisted of two criteria for passenger automobiles: (1) that passenger automobiles must be designed to carry 10 or fewer persons and (2) that passenger automobiles are “chiefly” for carrying persons. In the 1977 final rule, NHTSA noted that, if “primarily” were interpreted to mean “substantially,” almost every automobile would be a passenger automobile, because a substantial function of almost every automobile is to transport passengers. As a result, NHTSA instead interpreted the word “primarily” to mean “chiefly” or “predominantly” [1276]
and established criteria for the classification of an automobile as a non-passenger automobile based on the presence of certain chief characteristics. In the 1977 final rule, NHTSA stated its belief that “passenger automobile” include only those vehicles traditionally regarded as passenger cars (
i.e.,
vehicles whose major design features, including body style, reflect the purpose of carrying persons). NHTSA also provided examples of design features that, singly or in combination, would indicate that an automobile is not a passenger automobile: an open bed for carrying cargo; heavy-duty suspension; and greater cargo-carrying than passenger-carrying volume.[1277]
Under this interpretation, NHTSA created five different criteria of functional performance, any one of which would qualify the vehicle as a non-passenger automobile. The first, and most obvious type, is an automobile designed for transporting more than ten individuals.[1278]
The four other criteria were used to identify automobiles designed primarily or chiefly for carrying property or a derivative of an automobile designed primarily for the transportation of property and included automobiles that: (1) provide temporary living quarters; (2) transport property on an open bed; (3) provide greater cargo-carrying than passenger-carrying volume; or (4) permit expanded use of the automobile for cargo-carrying purposes through the removal of seats by means installed for that purpose by the manufacturer or with simple tools, so as to create a flat, floor level surface extending from the forwardmost point of installation of those seats to the rear of the automobile's interior.[1279]
The first three of these criteria have remained static over time and are codified at 49 CFR 523.5(a)(2) through (4). The fourth criteria, for automobiles derived from an automobile designed primarily for the transportation of property, has expanded over time. Currently, section 523.5(a)(5) classifies as non-passenger as any automobile with at least three rows of designated seating positions as standard equipment and has foldable or pivoting seats that can be removed, stowed, or folded to create a flat, leveled surface that extends from the forward most point of installation (of the third-row seat) to the rear of the automobile's interior.
After conducting an analysis of the fleet and vehicle characteristics, NHTSA no longer believes that the criteria in section 523.5(a)(5) are in accordance with the best reading of the statute. NHTSA's analysis has indicated that many vehicles that qualify as non-passenger automobiles solely on this criterion (
i.e.,
the automobile does not meet any of the other criteria to be a non-passenger automobile) would be classified more appropriately as passenger automobiles: the presence of a foldable, stowable, or removable third row seat is not a significant design characteristic indicating that a chief purpose for the vehicle is to transport property. However, NHTSA's analysis also indicates that there is a subset of vehicles currently classified as non-passenger automobiles based on this criterion for vehicles with three or more rows of seating that NHTSA believes should remain in the non-passenger automobile category because they have some chief design characteristics for transporting property not currently captured by section 523.5(a). To ensure that NHTSA's criteria for automobiles that chiefly or significantly are for transporting property effectuate the best reading of the statutory definitions, NHTSA is finalizing two changes to the criteria in section 523.5(a). First, NHTSA will remove the current criteria in section 523.5(a)(5) for vehicles with three or more rows. Second, the agency will add a new criterion premised on a performance-based light-duty work factor (LDWF) utility metric. These finalized changes are discussed in more detail below.
(1) Automobiles With Three or More Rows of Seating
As referenced above, automobiles with at least three rows of designated seating positions as standard equipment qualify as non-passenger automobiles under section 523.5(a)(5) if the removal or stowing of foldable seats creates a flat, leveled cargo surface extending from the forwardmost point of installation of those seats to the rear of the automobile's interior. The original version of this provision in the 1977 final rule was for automobiles that had removable seats, such that the automobile permits expanded use of the automobile for cargo-carrying purposes. In explaining the rationale for creating the criteria, the 1977 final rule preamble stated:
[I]t is not the convertibility factor alone which results in passenger vans being classified as non-passenger automobiles. It is that factor together with the derivative nature of those vans . . . . [S]ince a passenger van is designed with the same chassis, springs, and suspension system as a cargo van, it is treated in the same way as a cargo van.[1280]
When 49 CFR 523.5(a)(5) was applied to the original CAFE reference fleet, it achieved its intended objective of identifying those derivative vehicles, where purchasers could have instead
( printed page 62257)
opted for a “cargo” version of that vehicle. However, unlike the other regulations in section 523.5(a), the regulation at 523.5(a)(5) does not describe a chief non-passenger characteristic, but rather a passenger-based design feature that does not evidence a chief non-passenger characteristic when applied to the current automobile fleet. The automobile fleet of the late 1970s was fundamentally different from the automobile fleet being manufactured and sold currently; there are no “cargo van” derivatives “designed with the same chassis, springs, and suspension system” in the present-day light-duty fleet. The regulatory text at 523.5(a)(5) applied to the late-1970s fleets accommodated the derivative vehicles as they existed at the time.
Regarding the current fleet, meeting the criterion in section 523.5(a)(5) is not enough to indicate that the automobile is not “manufactured primarily” for carrying passengers. In fact, the presence of at least three rows of designated seating positions indicates the opposite because having three rows of designated seating positions is a significant feature indicating that a primary purpose of that automobile is for carrying numerous passengers. NHTSA received no substantive comments specifically regarding section 523.5(a)(5). Accordingly, NHTSA will remove 49 CFR 523.5(a)(5) as a non-passenger classification criterion beginning with MY 2030.
(2) Light-Duty Work Factor
With the removal of the expanded use criterion for vehicles with three or more rows of seating, NHTSA recognizes that some automobiles that have significant functional characteristics for the transportation of property would be classified as passenger automobiles unless NHTSA were to make further amendments to the criteria in section 523.5. To address this, NHTSA proposed a new criterion for classification as a non-passenger automobile. While the criterion NHTSA is removing for vehicles with three or more rows of seating is based primarily on a passenger-carrying design element (three rows of seats), in the NPRM, NHTSA proposed a new non-passenger automobile pathway that could be described independent of vehicle construction, platform, equipment, materials, or passenger-based metrics (such as rated cargo load [1281]
or seating arrangements). This new performance-based utility attribute, which NHTSA is referring to as the light-duty work factor (LDWF), would be determined based on a light-duty vehicle's ability to transport property via its payload and towing capacities. Performance-based standards preclude design or technology obsolescence by only prescribing a target without guidance or restriction on how it should be achieved.
NHTSA developed an analysis fleet specifically for the LDWF analysis, referred to as the LDWF analysis fleet. Beginning with the full MY 2024 non-passenger fleet, NHTSA created the LDWF analysis fleet by removing vehicles that qualified as non-passenger automobiles via any of the following pathways:
Transport more than 10 persons.
Provide temporary living quarters.
Transport property on an open bed.
Provide, as sold to the first retail purchaser, greater cargo-carrying than passenger-carrying volume.
Has either 4WD or a GVWR of more than 6000 lbs., and meets all four of the following criteria: [1282]
Approach angle of not less than 28 degrees
Breakover angle of not less than 14 degrees
Departure angle of not less than 20 degrees
Running clearance of not less than 20 centimeters
The agency opted to omit vehicles that qualified via these alternative non-passenger pathways because their designs contained other non-passenger characteristics or off-highway features that could skew the results of an analysis intended to evaluate whether a vehicle was designed chiefly for enhanced property-transporting utility. The remaining vehicles were subject to the LDWF analysis to evaluate an appropriate formula and threshold for the work factor.
In performing the fleet analysis to determine at what threshold of LDWF a vehicle would qualify as a non-passenger vehicle, NHTSA recognized that many vehicles could be specified with or without a trailering package (also commonly referred to as a “tow package” or “towing package”). These packages can range from minor changes, such as the inclusion of trailer wiring and a tow hitch, to more significant changes, such as higher capacity cooling packages, an enhanced suspension, a different final drive ratio, or reinforced driveline components. These changes do not significantly impact the powertrain or 2-cycle fuel economy of the base vehicle. In other words, trailering packages unlock utility that the powertrain and vehicle platform are already designed to provide. Therefore, in establishing the LDWF analysis fleet, NHTSA assumed that for a vehicle that would qualify as a non-passenger automobile via the LDWF criterion when specified with its trailering equipment, manufacturers would in the future not remove trailering capability as standard equipment on a vehicle that is otherwise designed to include it. These maximum available towing capacities for each vehicle in the LDWF analysis fleet were applied to the dataset used in the analysis.[1283]
NHTSA proposed to calculate LDWF as the weighted sum of a vehicle's payload and towing capacities [1284]
and prescribed a minimum threshold for this non-passenger criterion based on extensive analysis. In determining appropriate weighting for payload and towing capacity in the LDWF calculation, NHTSA considered the vehicle design considerations and property-transporting capabilities of payload capacity versus towing capacity. Designing for a higher payload capacity includes considerations for axle, frame, suspension, wheel, and tire capacities. These higher capacity components add weight to the vehicle and, when combined with the additional payload capacity, may require only modest enhancements to the powertrain and driveline to maintain performance and utility characteristics. In contrast, designing for a higher towing capacity includes considerations for pulling, including frame reinforcements to resist trailer forces acting opposite the direction of motion, increases to powertrain torque and power, and reinforcing driveline components to handle the additional torque. There is also a modest consideration for payload increases when considering increases to towing capacity due to a trailer's tongue weight.[1285]
NHTSA ultimately
( printed page 62258)
concluded that, in addition to the more expansive design considerations, towing capacity is a more effective means of providing cargo-transporting utility. Accordingly, NHTSA proposed a higher weighting for towing capacity when determining the LDWF.[1286]
Comments received by NHTSA in support of the LDWF supported the NPRM position that towing and payload are better indicators of a vehicle's ability to provide non-passenger utility than the functional ability regulation that it is replacing.[1287]
Some commenters that provided constructive criticisms or suggestions to improve the LDWF proposal supported NHTSA's attempt to refocus non-passenger criteria on various combinations of capability, utility, statutory alignment, and real-world usage.[1288]
Other commenters in broad support of reclassification did not provide substantive comment specific to the LDWF.
The agency received numerous comments containing criticisms of and suggestions to improve the LDWF proposal. Many commenters stated that the weighting scheme proposed in the NPRM for towing versus payload resulted in payload values so inconsequential that the agency may as well base the LDWF only on towing capacity.[1289]
Commenters criticized the LDWF threshold for being “arbitrarily defined,” suggesting that a vehicle capable of towing 5,000 pounds is “highly capable.” [1290]
Some commenters also stated their belief that NHTSA made improper use of GCWR in the context of towing capacity for the LDWF.[1291]
These comments largely recommended that the agency instead use the methodology specified in the consensus industry standard for determining GCWR and TWR, SAE J2807.[1292]
A subset of these commenters cautioned that while SAE J2807 is accepted by industry and synonymous with manufacturer tow ratings across a range of brands and models, it is not currently used across all brands and models, and that, if NHTSA were to adopt SAE J2807, sufficient time would be needed for some manufacturers to comply.[1293]
Commenters also expressed concern regarding NHTSA offsetting the LDWF threshold by 200 pounds to 5300 in the curve-setting analysis while leaving the regulatory threshold at 5500. Specifically, commenters stated that it implied an expectation or requirement for redesigns without sufficient notice.[1294]
Finally, commenters expressed concern about burdensome reporting requirements as a result of this new non-passenger automobile regulatory pathway.[1295]
This last topic regarding compliance reporting as it relates to the definition for curb weight is addressed in a later paragraph of this section.
NHTSA recognizes that GCWR can conflate the payload and towing capabilities of a vehicle, particularly on high-towing capable vehicles. Because NHTSA intends to consider the LDWF inputs separately (
i.e.,
in the case of payload and towing, how much payload a vehicle can carry when not towing, and how much a vehicle can tow when at a minimum operating payload), NHTSA has concluded that this method for determining towing capacity is not suitable. The agency agrees that SAE J2807 is a more objective, industry-accepted, test-based methodology for evaluating towing capacity. Therefore, NHTSA is using TWR defined in accordance with SAE J2807 in the finalized provisions for the new LDWF pathway. Many U.S. and Japanese auto manufacturers have well-documented use of SAE J2807 for their tow ratings dating back to at least 2015.[1296]
NHTSA recognizes that not all manufacturers currently utilize SAE J2807 when specifying their tow ratings. The docketed analysis spreadsheet [1297]
was updated to reflect manufacturer maximum tow ratings directly, with links to the source information for each vehicle provided. Reporting TWR in accordance with the definition in SAE J2807 is necessary only for light-duty vehicles qualifying as non-passenger automobiles via the LDWF regulatory pathway, and there is no requirement for manufacturers to adhere to SAE J2807 across their entire fleet. Given SAE J2807's widespread acceptance and industry familiarity, NHTSA believes the two-year delay in the implementation of the changes at 49 CFR 523.5, to MY 2030, provides sufficient notice.
NHTSA also acknowledges that payload and towing capacity were not weighted commensurately in the NPRM. For this final rule, the agency evaluated a range of weighting combinations, including the removal of payload capacity. In these evaluations, NHTSA recognized that because maximum payload values are relatively small compared to TWR values, the percent change of increasing either by equal amounts is significantly higher for payload. For example, if a vehicle had a 1,600-pound maximum payload capacity and a 5,000-pound TWR, increasing each by 100 pounds would constitute a 6.25 percent increase in payload capacity and only a two percent increase in towing capacity. Through analysis, NHTSA determined that removing the weighting on payload capacity and TWR when calculating the LDWF effectively places higher significance on TWR while still providing a significant contribution from payload. Because both LDWF input parameters are weighted equally, the formula can be simplified to the unweighted sum of the payload capacity and TWR. In Final TSD Chapter 2.7.2.3.4, NHTSA provides the complete analysis for setting the LDWF threshold, and the supporting data can be found in the rule docket.[1298]
Unlike the NPRM, NHTSA did not apply an offset between the curve-setting LDWF threshold and the regulatory LDWF threshold. As previously discussed, there is no requirement or necessity for redesigns as a result of the classification changes, nor do the changes alter the inherent utility of the vehicles impacted by the classification change. That said, NHTSA
( printed page 62259)
provides the two-year delay in the implementation of the changes at 49 CFR 523.5, to MY 2030, in this final rule.
In response to the claims of regulatory burden with the inclusion of the LDWF pathway, beginning with MY 2030, TWR is the only additional metric that manufacturers must provide, and the number of nameplates that need to provide non-passenger compliance metrics is significantly reduced.
Final TSD Chapter 2.7 provides the complete final rule analysis. Both the Final TSD Chapter 2.7 and preamble Regulatory Text provide the LDWF formula and threshold.[1299]
In connection with the finalized addition of the LDWF, NHTSA will update its definition of curb weight and add two additional definitions for “nominal tank capacity” and “optional equipment,” terms used in determining curb weight.[1300]
NHTSA is changing the definition of curb weight and defining the additional terms to provide clarity regarding how NHTSA would test a vehicle to determine whether it meets the LDWF or off-road criteria for non-passenger automobiles. The discussion about changes to the definition of curb weight is discussed in preamble Section VI.B.4.
2. Removal of Credit Trading in the CAFE Program
Under EPCA, as amended by EISA, manufacturers are afforded several compliance flexibilities that can be used to achieve compliance with CAFE standards. While some of these flexibilities are provided to manufacturers by statute, such as the ability to carry forward and backward credits earned from over-complying with a CAFE standard in a given model year,[1301]
others are provided by regulations issued at NHTSA's discretion. Credit trading among manufacturers is one flexibility that the statute authorizes but does not mandate. Credit trading refers to the ability of manufacturers or persons to sell credits to, or purchase credits from, another manufacturer.[1302]
EISA gave NHTSA discretion to establish by regulation a CAFE credit trading program to allow credits to be traded between vehicle manufacturers.[1303]
While establishing the credit trading program is discretionary, it is also limited by statute. Total oil savings must be preserved when credits are traded, and traded credits are not permitted to be used to meet the MDPCS.[1304]
Under this discretionary authority, NHTSA established a credit trading program in its 2009 final rule, permitting manufacturers to trade credits earned in MY 2011 and later.[1305]
Under NHTSA's regulations, traded credits are subject to an “adjustment factor” to ensure total oil savings.[1306]
NHTSA has observed, in recent years, that credit trading increasingly has been used by manufacturers of ICE vehicles to purchase credits from manufacturers of alternative fueled vehicles. As fuel economy standards increase, manufacturers generally look for the most cost-effective means of compliance. As standards have increased to levels unattainable for ICE vehicles, credit trading has become an increasingly more attractive means of satisfying CAFE requirements. This situation is due, in part, to EV manufacturers earning credits that are not representative of real-world fuel savings. The fuel economy values for EVs have been artificially high, resulting from the fuel content factor multiplier in the PEF [1307]
and EV manufacturers' generating FCIVs for AC efficiency and OC technologies that are not representative of real-world fuel savings.[1308]
As a result, EV manufacturers have been earning an abundance of credits. Under NHTSA's credit trading program, EV manufacturers can sell their credits to ICE vehicle manufacturers, effectively subsidizing the production of EVs. This was never NHTSA's intention in establishing a credit trading program because it creates market distortion that undermines EPCA's overarching purposes.
In the NPRM, NHTSA proposed to end credit trading by MY 2028, with MY 2027 being the last year in which manufacturers can use traded credits for CAFE compliance. As discussed below, NHTSA is finalizing a change to end trading of credits generated after MY 2027. This is a slight change from the proposal in that manufacturers may still trade credits earned through MY 2027 to be used up to five model years into the future (
e.g.,
credits earned in MY 2027 may be traded and used through MY 2032). Because NHTSA is finalizing amended standards that, as required by statute, do not consider alternative fueled vehicles or the use of compliance credits, NHTSA continues to believe that manufacturers of ICE vehicles will be able to meet CAFE standards without credit trading, thus minimizing any impacts on manufacturers' decisions about what vehicles and technologies to offer in the marketplace.[1309]
In the NPRM, NHTSA did not propose any changes to how manufacturers may transfer earned credits between their different compliance fleets, such as between their domestic passenger car and non-passenger car fleets, as this form of credit transfer is permitted explicitly by statute.
In the NPRM, NHTSA sought comment on this proposal, including on its assumptions about manufacturers' compliance pathways exclusive of credit trading as a compliance option. NHTSA also sought comment on the extent to which the presence of credits changed manufacturer compliance behavior and on the value of credits now that the civil penalty rate has been updated by law. NHTSA did not receive any comments related to the value of credits with the updated civil penalty rate.
NHTSA received some comments in support of removing the credit trading program. The SEMA, PMI, and AFPM supported the removal of the credit trading program as proposed in the NPRM, asserting that the program has created a market distortion.[1310]
SEMA stated that structural reforms to the CAFE program, such as changes to credit trading, will “better reflect real-world vehicle attributes and compliance pathways, which will improve transparency and predictability for manufacturers and downstream industries.” [1311]
PMI commented that ending the credit trading program “is necessary to stop the market distortion that results from existing and past [fuel
( printed page 62260)
economy] standards.” [1312]
AFPM said that “[t]hese transfers do not conserve petroleum; they merely enable paper compliance. By ending inter-company trading, the agency restores fuel economy as the primary pathway for meeting CAFE obligations.” [1313]
NHTSA also received several comments asking NHTSA to retain the credit trading program. The Alliance, Honda, Attorneys General, Ferrari S.p.A. and Ferrari North America, Inc. (Ferrari), Hyundai, JLR, Kia, MEMA, NRDC
et al.,
Nissan, Plug In America (PIA), Porsche, ME DEP, Volkswagen, and ZETA oppose the elimination of the credit trading program because the program allows flexibility as part of compliance plans or in unanticipated market conditions or supply chain disruptions.[1314]
Ferrari, MEMA, NRDC
et al.,
ME DEP, and ZETA oppose the elimination of the credit trading program because removing it would disadvantage manufacturers' investments in other compliance strategies.[1315]
NRDC
et al.,
China WTO/TBT, and ZETA said NHTSA is required to consider reliance interests engendered by the program prior to eliminating it.[1316]
ME DEP commented that eliminating the credit trading program would disadvantage certain manufacturers with respect to investments they have made in credit-based compliance pathways.[1317]
NRDC
et al.,
ZETA, an individual commenter, and PIA noted that removing these credits will discourage EV production and weaken the U.S. auto industry's ability to compete globally.[1318]
An individual commented, “This widens the technological gap between U.S. companies and global competitors. It threatens both export competitiveness and long-term market share in a rapidly electrifying global industry.” [1319]
China WTO/TBT commented that new manufacturers lack historical credit accumulation and thus cannot obtain compliance buffers through trading, which will increase their initial compliance costs and the difficulty entering the market.[1320]
ZETA, NRDC
et al.,
and Porsche commented that eliminating the credit trading program will harm consumer choice, by eliminating a pathway that Manufacturers use to offset less fuel-efficient vehicles.[1321]
An anonymous commenter stated that eliminating credit trading will raise costs of compliance.[1322]
Attorneys General, ZETA, an individual commenter, and the Alliance commented that NHTSA has not provided sufficient reasoning or evidence to support its decision to eliminate the program.[1323]
The Alliance elaborated that NHTSA is already addressing concerns about EVs creating market distortions through setting standards that do not consider EVs, and that making changes to credit trading is redundant.[1324]
ZETA also commented that NHTSA cited, in its reasoning for proposing to end credit trading, artificially high fuel economy values for EVs resulting from factors that it states that NHTSA is proposing to end.[1325]
Attorneys General stated that NHTSA failed to consider important aspects of the proposed change, failed to consider alternatives, and failed to consider serious reliance interests when it proposed eliminating the credit trading program, which purportedly are “hallmarks of an arbitrary and capricious agency action that renders such actions unlawful under the APA.” [1326]
Several commenters suggested that NHTSA should extend the effective date for eliminating credit trading and suggested alternate pathways that would not involve eliminating credit trading. The Alliance and Nissan recommend that, if NHTSA eliminates the credit trading program, the agency should defer its elimination until MY 2030 to provide additional lead time.[1327]
CALSTART recommended that, if NHTSA eliminates the credit trading program, the agency should defer its elimination until MY 2032.[1328]
Porsche and ZETA oppose NHTSA eliminating the credit trading program in MY 2028, the same model year that changes to vehicle classification are implemented.[1329]
Honda recommended that NHTSA continue the credit trading program with constraining mechanisms (
e.g.,
volumetric or percentage limits on traded credits) rather than eliminating it.[1330]
They argue that a constraining mechanism would ensure that the “windfall” for EV-only manufacturers is mitigated without restricting the flexibility on which traditional manufacturers rely.
NHTSA also received comments from the Alliance, Porsche, JLR, Nissan and ZETA requesting that, if the credit trading program were discontinued after MY 2027, credits earned through that model year be allowed to be carried forward up to five years.[1331]
The change these manufacturers requested would allow manufacturers to use credits that were earned in MY 2027 to be traded
( printed page 62261)
and used through MY 2032. The Alliance also suggested either delaying elimination of the credit trading program to MY 2030 to provide additional lead time or permitting the trading of credits for three years after the program has ended.[1332]
CALSTART argued that NHTSA should allow credit generation and banking through at least MY 2031.[1333]
CALSTART argued that, to preserve the credibility of the credit market, NHTSA should be explicit about the mechanisms it will use to enforce fuel economy standards and the consequences of not complying with those standards.[1334]
After reviewing the comments received regarding the proposed changes to the credit trading program, NHTSA agrees that all credits earned in the CAFE program up through MY 2027 should be permitted to be used for up to five model years after the year in which they were earned, which is consistent with the timeframe prescribed by 49 U.S.C. 32903(a) for manufacturers to carry forward their own credits. Therefore, NHTSA is revising the proposed changes to the credit trading program for the final rule. NHTSA is finalizing the removal of credit trading from the CAFE program for credits earned in MY 2028 and beyond.
NHTSA is finalizing the removal of the credit trading program to correct market distortion. In the past, BEVs equipped with AC efficiency or OC technologies have generated an excessive number of CAFE credits due to the fleet average fuel economy calculation methodology that includes DOE's PEF. For example, one manufacturer, that produces and sells a large volume of BEVs earned a total of approximately 116 million CAFE credits [1335]
in its domestic passenger and light truck fleets in MY 2021. This manufacturer averaged CAFE compliance of 620.4 mpg to 959.5 mpg from MY 2019 to MY 2021 in its regulatory fleets due to DOE's PEF and the EPA compliance calculation, and it sold these credits to offset other manufacturers' low CAFE performance. These credit transactions undermine the energy conservation purpose of EPCA.[1336]
The agency recognizes that manufacturers have made investments in fuel-saving technologies, which they have factored into their future design and compliance plans. NHTSA also recognizes that manufacturers may have reliance interests in the credit trading program to fulfill their current CAFE compliance obligations. Ending credit trading within the CAFE program for credits earned in MY 2028 and beyond provides manufacturers adequate transition time before trading ends. Furthermore, the fuel economy standards in this final rule are achievable with ICE technologies without consideration of the factors NHTSA is prohibited from considering pursuant to 49 U.S.C. 32902(h), namely alternative fueled vehicles and the availability of credits.
Further, NHTSA notes that, though credits earned prior to MY 2028 may continue to be traded and used for up to five model years after they were earned, NHTSA expects the value of those credits to be significantly diminished. Not only does NHTSA believe that manufacturers will seek to meet the amended standards through actual fuel economy improvement through best practicable effort, but even so, with the updated $0.00 penalty rate, there is little to no benefit to manufacturers who may purchase those credits. Together, these factors significantly reduce the value of the credits to the manufacturer that would seek to sell them.
3. Technical Amendments To Remove References to EPA's Regulations for AC Efficiency and Off-Cycle Fuel Consumption Improvement Values
AC efficiency technologies are technologies that reduce the operation of, or the loads on, the vehicle engine by reducing AC usage. For example, the less frequently the AC compressor operates or the more efficiently it operates, the less load the AC compressor places on the engine, resulting in better fuel efficiency. AC efficiency technologies can include, but are not limited to, blower motor controls, internal heat exchangers, and improved condensers/evaporators. OC technologies are technologies that also reduce the operation of ICE engines, but they cover other areas of vehicle operation. Examples of OC technologies include thermal control technologies, high-efficiency alternators, and high-efficiency exterior lighting.[1337]
In its 2012 final rule, NHTSA issued regulations to align with EPA's provisions that allowed manufacturers to generate FCIVs for the adoption of AC efficiency and OC technologies beginning in MY 2017. EPA established the AC efficiency and OC programs to account for technologies that are not captured fully in the 2-cycle test procedures (FTP and HFET) that EPA uses to measure fuel economy for NHTSA's CAFE program. Under EPA's provisions, FCIVs generated by manufacturers are factored into each manufacturer's calculation of its average fuel economy for purposes of NHTSA's CAFE compliance.
Under EPA's current regulations, manufacturers are eligible to earn AC efficiency and OC FCIVs for all types of automobiles equipped with those technologies in their fleet through MY 2026. Starting in MY 2027, only ICE-powered automobiles are eligible to generate FCIVs, and the OC FCIV program is currently being phased out between MYs 2031-2033, with manufacturers no longer being able to generate OC FCIVs for MY 2033 and beyond.
As explained in Section II, NHTSA is now removing FCIVs from its standard-setting CAFE analysis starting in MY 2028 (
i.e.,
NHTSA's model will no longer simulate manufacturers generating FCIVs that improve their fuel economy values for compliance). NHTSA is making this change in the analysis to ensure that it sets maximum feasible standards achievable without consideration of technology-specific standards.
Upon examination of NHTSA's existing regulations, NHTSA identified technical changes to remove references to EPA regulations pertaining to AC efficiency and OC FCIVs.
Accordingly, NHTSA proposed to remove the references to EPA's regulations regarding FCIVs from 49 CFR 531.6 and 49 CFR 533.6 because such references are unnecessary and created potential for confusion.
NHTSA received many comments on the AC and OC programs. The Alliance commented that they support the continuation of the AC efficiency and OC technology program under EPA's authority.[1338]
Honda, Ford, MECA, and MEMA support the program because the
( printed page 62262)
technologies represent a cost-effective means of achieving real-world fuel economy benefits.[1339]
Hyundai and Kia commented that they have made significant investments to develop and apply the technologies to their fleets and support the continued use of the technologies for compliance.[1340]
Nissan commented that AC efficiency and OC benefits have been a part of the CAFE program since 2017 and are integral to manufacturers' product planning and further explained that removing the option to use these flexibilities would cause significant disruptions for manufacturers and reduce their ability to develop efficient and advanced technologies beyond MY 2033.[1341]
Porsche and Stellantis commented that they support the continued availability of AC efficiency and OC technologies as a compliance pathway independent of the impacts from EPA's rulemaking.[1342]
MEMA commented that NHTSA's language regarding AC efficiency and OC benefits in the NPRM is ambiguous and MEMA requested that NHTSA explicitly state in the final rule that any proposed changes to the treatment of AC efficiency and OC benefits are limited to analytical modeling and do not alter their eligibility for use in compliance.[1343]
NHTSA received several comments supporting and opposing phasing out the AC efficiency and OC programs. ICCT and AFPM supported phasing out the AC and OC programs.[1344]
AFPM argued that these credits do not represent real-world petroleum conservation. ICCT argued that these technologies are already widespread and therefore do not need to be incentivized.
NHTSA responds to comments on the removal of FCIVs from the standard-setting CAFE analysis in Section II. In response to comments on removal of EPA's AC and OC programs, NHTSA does not have the authority to remove or alter EPA's AC and OC programs, and NHTSA did not propose any changes to EPA's AC and OC programs. EPCA, as amended by EISA, provides EPA with the authority to calculate the average fuel economy of a manufacturer's compliance fleet. NHTSA has no role in determining the testing and calculation procedures that are prescribed by EPA. NHTSA's goal in removing references to EPA's regulations from 49 CFR parts 531 and 533 is to avoid repeating measurement and calculation procedures determined by EPA. This change removes a potential for confusion and ensures alignment with EPA's regulations. NHTSA does not have the authority to establish its own set of calculation procedures that differ from EPA's procedures. As such, NHTSA is finalizing the removal of references to EPA's regulations for AC efficiency and OC FCIVs as proposed in the NPRM.
4. Modification of the Definition of Curb Weight and Manufacturer Reporting Requirements
NHTSA proposed changes to its reporting requirements for manufacturers in connection with the vehicle classification changes discussed above and is finalizing the proposal with certain revisions based on comments received and further consideration of the proposed reporting requirements.
In the NPRM, NHTSA proposed modifying its vehicle classification provisions under part 523. Specifically, NHTSA proposed modifications to several of the pathways manufacturers may use to classify a vehicle as a non-passenger automobile. NHTSA proposed removing the “expanded use” pathway under § 523.5(a)(5) and proposed removing the axle clearance specification from the “off-highway pathway” under § 523.5(b)(2), requiring that vehicles meet the remaining four criteria to qualify. NHTSA proposed implementing these changes beginning with MY 2028. To replace the “expanded use” pathway, NHTSA proposed adding a new, high-utility pathway into the non-passenger automobile fleet, beginning with MY 2028. This new pathway would be based on a performance-based utility attribute NHTSA refers to as the LDWF.
In the NPRM, NHTSA proposed calculating the LDWF value using several vehicle characteristics, including GCWR, which is the value manufacturers specify as the loaded weight of a combination vehicle, as well as GVWR and curb weight.
To support the new LDWF, NHTSA proposed updating its definition of curb weight and adding definitions for “nominal tank capacity” and “optional equipment,” which are two vehicle characteristics used in defining curb weight. NHTSA proposed modifying the curb weight definition to specify that curb weight is determined based on the actual weight of the vehicle at the time of first sale, including all optional equipment. These changes were proposed to provide clarity on how NHTSA would determine whether a particular vehicle meets the criteria for being classified as a non-passenger automobile under the “off-highway” and LDWF vehicle classification pathways.[1345]
The proposed change to the curb weight definition would ensure that every vehicle that a manufacturer reports as a non-passenger automobile would meet the requirements of the specific pathway in any configuration offered by the manufacturer.
In addition, NHTSA proposed revising its reporting requirements under part 537 to support the proposed vehicle classification modifications. The agency proposed removing reporting requirements specific to the “expanded use” pathway under § 523.5(a)(5) and the axle clearance requirements of the “off-highway” pathway under § 523.5(b)(2) for MY 2028 and beyond. NHTSA also proposed mandating GCWR as a required data field for all non-passenger automobiles for MY 2028 and beyond to support calculation of the LDWF but also to aid NHTSA in developing a better understanding of vehicle characteristics within the non-passenger automobile fleet.[1346]
NHTSA also included a requirement that manufacturers report curb weight for vehicles qualifying under the new LDWF pathway using NHTSA's proposed revised definition.
NHTSA did not receive any substantive comments in support of its proposed modifications to manufacturers' reporting requirements. Nissan, Porsche, Stellantis, Ford, Mercedes-Benz, Volkswagen, Kia, and The Alliance expressed opposition to NHTSA's change in the definition of curb weight due to the increased reporting burden the change would precipitate.[1347]
In general, these commenters noted the burden
( printed page 62263)
associated with tracking and reporting curb weight for many different vehicle configurations and requested that NHTSA not finalize any changes to its definition of curb weight. For example, Nissan commented that the use of curb weight in the LDWF calculation “creates an unreasonable and unnecessary analytical and administrative burden on [manufacturers].” [1348]
Nissan states that, for automakers, each buildable combination of a model type has an associated curb weight, which, Nissan states, means that for a given model, automakers would need to track and report on potentially hundreds of individual curb weights for every possible combination of subconfiguration, trim package, and option. Porsche's comment noted that within the Cayenne model there can be nearly 1 million buildable combinations and that weight differences of many of the combinations might be negligible. Porsche states that analyzing the weight differences would create complexity and add unnecessary costs. The other comments from industry expressed similar concerns and recommended that NHTSA continue referencing EPA's definition of curb weight in 40 CFR 86.1803-01.
NHTSA has considered these comments and is finalizing a change to address manufacturers' concerns about the regulatory burden associated with the reporting requirements. To address these concerns, NHTSA is changing the reporting requirements in 49 CFR part 537 to clarify that manufacturers do not need to submit data for every vehicle configuration. NHTSA does not intend for manufacturers to include unique curb weights for each combination of subconfiguration, trim package, and option package. As commenters have stated, there are small variabilities in curb weight within models and trims that may not be necessary to report. NHTSA clarifies in this final rule that the curb weight required to be reported under 49 CFR 537.7(c)(5)(i)(F)(1) is the curb weight of the vehicle with the lowest LDWF in that subconfiguration.
In general, NHTSA's reporting requirements are based on how manufacturers would report fuel economy data to EPA for CAFE compliance purposes. That is, the level of granularity that is required for EPA reporting dictates the granularity for which data would be reported to NHTSA. It is NHTSA's understanding that data are reported to EPA at the vehicle subconfiguration level (
i.e.,
meaning that each row of data reported to EPA is a vehicle subconfiguration, as defined at 40 CFR 600.002). NHTSA intends for its regulations to require that manufacturers submit data to NHTSA based on the reporting groupings reported to EPA (
i.e.,
each row of data reported to NHTSA should align with a cohort of vehicles reported to NHTSA in a single row of data). Based on this intention, NHTSA is finalizing changes to part 537 to specify reporting for each vehicle configuration. Therefore, for each cohort of vehicle there would be a single data element reported for each type of information requested. In response to commenters' concerns, NHTSA is finalizing a change to require, for purposes of calculating LDWF, that manufacturers only report the curb weight of the vehicle with the lowest LDWF within that vehicle subconfiguration. Although this will often be the heaviest curb weight within the vehicle subconfiguration, to account for the possibility that the TWR may vary within the vehicle subconfiguration, NHTSA is specifying the data element based on the vehicle with lowest LDWF. This reporting requirement will allow NHTSA to conduct a more efficient audit of vehicle classification by identifying vehicles that exceed the criteria by the smallest margins.
NHTSA is also adding a definition of standard equipment to § 523.2 to provide greater clarity because the term “standard equipment” is used in the definition of curb weight. NHTSA did not propose providing a definition as NHTSA believes the term is well-understood to mean, as defined in EPA's regulations at 40 CFR 86.1803-01, “those features or equipment which are marketed on a vehicle over which the purchaser can exercise no choice.” However, to avoid any possible ambiguity, NHTSA is adding this definition to part 523.
NHTSA also received comments from Mercedes-Benz and the Alliance on when the curb weight definitional changes should take effect.[1349]
Both entities commented that, if NHTSA does finalize the changes to its curb weight definition, the agency should delay when those changes take effect. The commenters recommend setting the effective date to MY 2028 to align with the effective date of the other changes to vehicle classification.
NHTSA has considered these comments and is finalizing changes such that reporting curb weight will go into effect for MY 2030 reporting, in line with the final rule's changes in vehicle classification that add the new “LDWF pathway.” The other situation in which the definition of curb weight in 523.2 is used is for purposes of determining whether a vehicle meets the criteria under the “off-highway pathway,” for which testing at curb weight is specified. In line with Mercedes-Benz and the Alliance's comment, NHTSA is finalizing the curb weight definitional change starting with MY 2028 in order to align NHTSA's regulations more faithfully with EPCA, which requires that every vehicle in the non-passenger automobile compliance category meet the prescribed classification criteria.
Ford expressed concern that “NHTSA will require manufacturers to provide vehicle weight information and off-highway criteria, regardless of which pathway is used.” [1350]
They commented that “data should only be required when it is necessary to demonstrate regulatory compliance.” Ford requested that NHTSA require manufacturers to report only data specific to the identified vehicle classification pathway.
NHTSA agrees with Ford's request for NHTSA to limit manufacturers' reporting requirements to only those data fields necessary for the vehicle classification pathway. It is not necessary to report all the possible data elements that could be used to classify a vehicle as a non-passenger automobile. Therefore, NHTSA is finalizing changes such that manufacturers are only required to report the data elements for the pathway used to qualify the vehicles as non-passenger automobile.
NHTSA is also replacing the GCWR reporting requirement with TWR for this final rule in line with the changes it is finalizing for the “LDWF pathway.” TWR is the value defined and used in SAE J2807, which is specified by the manufacturer as the maximum allowable weight of a loaded trailer for a specific vehicle model or configuration.[1351 1352]
NHTSA will require TWR because TWR information would be needed to determine whether an automobile qualifies as a non-passenger automobile under the LDWF criteria. Although NHTSA expects that TWRs will vary little, if any, within a
( printed page 62264)
single-vehicle subconfiguration, to account for the possibility of variance, NHTSA is specifying that the manufacturers provide the TWR of the vehicle with the lowest LDWF if there are multiple TWRs within the subconfiguration. The reporting requirement for TWR will go into effect for MY 2030, in line with the vehicle reclassification changes.
NHTSA will also remove 49 CFR 523.5(a)(5) and 49 CFR 523.5(b)(2)(v) beginning with MY 2030. Additional details regarding their removal can be found in Section VI.B.1.b and in Final TSD Chapter 2.7. Due to these changes, starting in MY 2030, manufacturers will no longer be required to provide information related to these two regulations, which are described in 49 CFR 537.7(c)(5), paragraphs (c)(5)(i)(E) and (c)(5)(ii)(D), respectively.
C. Technical Amendments
In the NPRM, NHTSA proposed to make certain technical amendments through this rulemaking, which include amendments removing residual mentions of fuel efficiency standards for trailers; technical amendments removing reference to civil penalties for non-compliance with fuel economy standards; removing provisions applicable only to model years before MY 2022; and technical amendments correcting regulatory citations and incorporating minor spelling, grammatical, and formatting edits to 49 CFR parts 523, 531, 533, 536, 537 and 578. NHTSA will upload to the docket a redline version of the regulatory text showing the changes from this final rule.
NHTSA did not receive substantive comments on any of the technical amendments proposed in the NPRM. NHTSA is finalizing the technical amendments proposed in the NPRM in this final rule. In this final rule, NHTSA is also finalizing six additional technical amendments that were not included in the NPRM. First, NHTSA is modifying the civil penalty rate for non-compliance with fuel economy standards in part 578 to align with the updated statute set in Public Law 119-21, which was signed into law on July 4, 2025.[1353]
Second, NHTSA is finalizing a technical amendment to include a definition of vehicle subconfiguration to § 537.8 that references EPA's definition used for CAFE compliance reporting. NHTSA is also finalizing two technical amendments to include the definition of footprint in parts 531 and 533 that reference back to NHTSA's definition of footprint in 523. Finally, NHTSA is finalizing technical amendments to add SAE J1100 NOV2009 to the list of incorporated materials in the new § 523.11 and to update the title of SAE J1100 NOV2009 as it is referenced in the definition of
passenger-carrying volume
in § 523.2.
1. Technical Amendments To Remove Residual Mention of Fuel Efficiency Standards for Trailers in NHTSA's Vehicle Classification Regulations
In November 2021, the United States Court of Appeals for the District of Columbia “vacate[d] all portions of the [2016 joint NHTSA and EPA] rule that apply to trailers.” [1354]
The underlying statute authorizes NHTSA to examine the fuel efficiency of and prescribe fuel economy standards for “work trucks and commercial medium-duty or heavy-duty on-highway vehicles.” 49 U.S.C. 32902(b)(1)(C); 49 U.S.C. 32902(k)(2). The court reasoned that trailers do not qualify as “vehicles” when that term is used in the fuel economy context because trailers are motorless and use no fuel.
Truck Trailer Mfrs. Ass'n, Inc.,
17 F.4th at 1200, 1204-08. Accordingly, the court held that NHTSA does not have the authority to regulate the fuel economy of trailers.
Id.
at 1208.[1355]
On March 15, 2024, NHTSA published the final rule titled “Improvements for Heavy-Duty Engine and Vehicle Fuel Efficiency Test Procedures, and Other Technical Amendments.” (89 FR 18808). In that final rule, NHTSA removed portions of its regulations that were vacated by that decision. Because that final rule removed all the fuel efficiency standards for trailers and most of the mentions of those standards from its regulations, a residual mention of those standards remained in NHTSA's vehicle classification regulations at 49 CFR 523.10(a)(3). In the NPRM, NHTSA proposed to amend 49 CFR 523.10(a)(3) by deleting the sentence that mentions fuel efficiency standards for trailers. This rulemaking finalizes the deletion as proposed.
2. Technical Amendment To Remove Heavy-Duty Trailers From the List of Heavy-Duty Vehicle Regulatory Categories
On June 24, 2024, NHTSA published the final rule titled “Corporate Average Fuel Economy Standards for Passenger Cars and Light Trucks for Model Years 2027 and Beyond and Fuel Efficiency Standards for Heavy-Duty Pickup Trucks and Vans for Model Years 2030 and Beyond.” (89 FR 52540, June 24, 2024). In Section VII.C.8.e of that final rule,[1356]
NHTSA finalized the removal of “Heavy-duty trailers” from the list of four heavy-duty vehicle regulatory categories in 49 CFR 523.6(a). However, NHTSA inadvertently excluded the necessary changes from the final rule's amendatory text. In the NPRM, to align with its original intent as expressed in its 2024 final rule, NHTSA proposed to amend 49 CFR 523.6(a) introductory text by stipulating that heavy-duty vehicles are divided into three regulatory categories and removing paragraph (a)(4)—which lists heavy-duty trailers as a heavy-duty vehicle regulatory category—from 49 CFR 523.6(a). This rulemaking finalizes the amendment to the regulatory text as proposed. Along with this edit, NHTSA is also finalizing minor grammatical edits, without regulatory effect, to § 523.7, § 523.8, and § 523.10, including amending § 523.10 to remove an obsolete note from paragraph (a)(3) regarding trailers.
3. Technical Amendments To Remove Civil Penalties for Non-Compliance With Fuel Economy Standards From the CAFE Program
NHTSA is removing the mention of civil penalty payments for manufacturers that do not meet their fuel economy standards in the CAFE program from 49 CFR part 536. These amendments are to remove the mention of civil penalties from § § 536.5(d)(2) and (6), § 536.9(e), § 536.10(b); and to remove § 536.7(b) through (d).
4. Additional Technical Amendments
NHTSA is incorporating minor technical amendments to 49 CFR parts 523, 531, 533, 536, and 537. These amendments are to correct regulatory citations and incorporate minor spelling, grammatical, and formatting edits. Specifically, NHTSA is incorporating the following technical amendments.
a. Technical Amendments to Part 523
Although not in the NPRM, NHTSA is updating § 523.1, without regulatory
( printed page 62265)
effect, to correct the outdated authority citation and to make a grammatical edit. NHTSA is adding and removing text, correcting spelling errors, and incorporating other grammatical edits to clarify several definitions, including
Basic vehicle frontal area, Breakover angle, Cargo-carrying volume, Electric vehicle, Emergency vehicle, Full-size pickup truck, Medium-duty passenger vehicle, Pickup truck, Temporary living quarters, Transmission configuration, Truck tractor,
and
Vocational vehicle (or heavy-duty vocational vehicle)
in § 523.2 and § 523.3; and correcting a regulatory citation in § 523.4. In addition, though it was not proposed in the NPRM, NHTSA is finalizing a very small change, without regulatory effect, to the definition of
Base tire (for passenger automobiles, non-passenger automobiles, and medium-duty passenger vehicles),
which references EPA's definition of standard equipment found in 40 CFR 86.1803-01. Because NHTSA is adding the identical definition of “standard equipment” used by EPA in 40 CFR 86.1803-01 to § 523.2 in connection with its changes to the definition of curb weight, the reference to the EPA regulation within the definition of
Base tire (for passenger automobiles, non-passenger automobiles, and medium-duty passenger vehicles)
is no longer needed. NHTSA is also finalizing a technical change to the definition of
passenger-carrying volume
to update the title of SAE Surface Vehicle Recommended Practice J1100, Motor Vehicle Dimensions. Though not proposed in the NPRM, this change is being finalized as a technical amendment that has no regulatory impact. NHTSA is also adding SAE J1100 NOV2009 to the list of materials incorporated by reference in § 523.11.
b. Technical Amendments to Part 531
NHTSA is adding a definition of the term
footprint
to § 531.4 that references back to NHTSA's definition of footprint in 523.2. NHTSA is removing requirements for past model years from § 531.5 and making minor grammatical and organizational edits to streamline the section and improve readability.
c. Technical Amendments to Part 533
NHTSA is adding a definition of the term
footprint
to § 533.4 that references back to NHTSA's definition of footprint in 523.2. NHTSA is also finalizing minor grammatical edits and clarifying edits, without regulatory effect, to the definitions in § 533.4 for
Captive import
and
Limited product line.
NHTSA is also correcting formatting errors in the text supporting equation 1 to § 533.5(a).
d. Technical Amendments to Part 536
NHTSA is finalizing minor clarifying edits, without regulatory effect to § 536.1 and § 536.3(b)(6); removing the definition of
Light truck
in § 536.3(b); adding and removing text to clarify the definition of
Trade
in § 536.3(b); adding and removing text to clarify the definition of
Transfer
in § 536.3(b); correcting a capitalization error in § 536.4(c); adding and removing text to clarify provisions in § 536.4(a) through (c) and Equation 1 to § 536.4(c); correcting a table heading in Table 1 to § 536.4(c); renaming the title of § 536.6; adding a new paragraph (a) to § 536.6; changing the existing paragraph (a) to paragraph (a)(1) in § 536.6 and making other edits to reorganize § 536.6 for clarity and readability. NHTSA is also finalizing an edit to amend the title of § 536.8 and make other minor grammatical edits to § 536.8 and § 536.9
e. Technical Amendments to Part 537
NHTSA is amending § 537.4(b)(2) to add the term
vehicle subconfiguration
to the list of terms that are defined in 40 CFR part 600. NHTSA is correcting a spelling error in § 537.4(b)(3) and a regulatory citation in § 537.7(c)(7)(i).
NHTSA is also finalizing another technical amendment to part 537 that was not proposed in the NPRM, which updates the language in 49 CFR 537.6 (d)(4) regarding how manufacturers submit confidential reports and requests for confidentiality to NHTSA. NHTSA recently developed an online portal for receiving requests for confidential treatment. This new portal allows manufacturers to upload files required for part 512 requests for confidential treatment in one centralized location. NHTSA is now finalizing changes to § 537.5 (d)(4) to replace the current language that directs manufacturers to submit confidential reports and requests for confidentiality to NHTSA on CD-ROM via mail. The technical amendment changes the language to direct manufacturers to use NHTSA's new CBI portal, which will align the regulatory text with current practice.
5. Technical Amendment To Modify the Civil Penalty for Non-Compliance With Fuel Economy Standards in Part 578
NHTSA is modifying the civil penalty rate, with no substantive effect, to reflect the rate set by Congress in Public Law 119-21, which was signed into law on July 4, 2025. This law amended EPCA's civil penalty rate for exceeding the applicable average fuel economy standard and set the civil penalty rate to $0.00 multiplied by each 0.1 of a mile a gallon by which the applicable average fuel economy standard exceeds the average fuel economy. The new $0.00 civil penalty rate is applicable to all model years for which NHTSA has yet to conclude compliance proceedings—which is MY 2022 and later. To align with 49 U.S.C. 32912(b) and 32912(c)(1)(B), NHTSA is amending 49 CFR 578.6(h)(2) to set the civil penalty rate to $0.00 for MY 2022 and later model years.
VII. Regulatory Notices and Analyses
A. Executive Order 12866, “Regulatory Planning and Review”; Executive Order 13563, “Improving Regulation and Regulatory Review”; Executive Order 14192, “Unleashing Prosperity Through Deregulation”; and Executive Order 14219, “Ensuring Lawful Governance and Implementing the President's `Department of Government Efficiency' Deregulatory Initiative”
E.O. 12866, “Regulatory Planning and Review” (58 FR 51735, Oct. 4, 1993), reaffirmed by E.O. 13563, “Improving Regulation and Regulatory Review” (76 FR 3821, Jan. 21, 2011), provides for determining whether a regulatory action is “significant” and therefore subject to the OMB review process and to the requirements of the Executive Order. This action is a “significant regulatory action” under Section 3(f)(1) of E.O. 12866 because it is likely to have an annual effect on the economy of $100 million or more. Accordingly, NHTSA submitted this rulemaking to OMB for review, and any changes made in response to interagency feedback submitted via the OMB review process have been documented in the docket for this rulemaking. The estimated benefits and costs of this final rule are described above, and in the FRIA, located in the docket and on NHTSA's website.
E.O. 14192, “Unleashing Prosperity Through Deregulation” (90 FR 9065, Feb. 6, 2025), requires an agency, unless prohibited by law, to identify at least ten existing regulatory requirements to be repealed when the agency publicly proposes for notice and comment or otherwise promulgates a new significant regulatory rule. Section 3(c) of E.O. 14192 also requires that the total incremental costs associated with an agency's new regulations must, to the extent permitted by law, be offset by the elimination of costs associated with other previous regulations of the agency. This final rule is an E.O. 14192 deregulatory action and thus is not expected to generate net new incremental costs. The estimated cost savings of this final rule are detailed in FRIA Tables 1-3 and 1-4.
( printed page 62266)
E.O. 14219, “Ensuring Lawful Governance and Implementing the President's `Department of Government Efficiency' Deregulatory Initiative” (90 FR 10583, Feb. 19, 2025) requires agency heads to review their regulations and identify any that, among other things, are based on anything other than the best reading of the underlying statutory authority or prohibition or that implicate matters of social, political, or economic significance that are not authorized by clear statutory authority. NHTSA has identified its CAFE standards issued in 2022 and 2024 as falling within an enumerated category of E.O. 14219. Specifically, as described in an interpretive rule published on June 11, 2025, NHTSA determined that the CAFE standards issued in 2022 and 2024 are not authorized by clear statutory authority. NHTSA is issuing this final rule to reset the CAFE standards and bring the CAFE program into compliance with relevant statutory requirements. NHTSA discusses compliance with relevant statutory requirements in Section V above.
B. Environmental Considerations
1. National Environmental Policy Act
To inform its development of the CAFE standards for MYs 2022-2031, and pursuant to NEPA, 42 U.S.C. 4321et seq.,
and DOT Order 5610.1D, 90 FR 29621 (July 3, 2025), NHTSA prepared a Final SEIS to evaluate the potential environmental impacts of the CAFE standards and a reasonable range of alternatives. In revising the CAFE standards established in NHTSA's June 2024 final rule, NHTSA is making substantial changes to those examined in the 2024 Final EIS and, as such, prepared this Final SEIS to inform its amendment of MYs 2027-2031 CAFE standards. A commenter asserted that NHTSA failed to evaluate the full scope of its action because it assessed only the environmental impacts associated with MYs 2027-2031 CAFE standards.[1357]
As explained in the NPRM and further addressed in Chapter 1 (Purpose and Need for the Action) of the Final SEIS, the MY 2026 passenger car and light truck fleets have already been produced and are released for sale at the time of issuance of this final rule to amend MY 2022-2031 CAFE standards. As such, the Final SEIS analyzes environmental impacts associated only with the MY 2027-2031 CAFE standards and range of alternatives.
The Final SEIS analyzes reasonably foreseeable impacts of the final rule on the potentially affected environment, which are discussed in proportion to their significance. It also discusses NHTSA's reasonable range of alternatives, including a No-Action Alternative and a Preferred Alternative, and other factors used in developing this final rule. The Final SEIS addresses mitigation measures considered as part of the environmental analysis.[1358]
NHTSA received many comments on the Draft SEIS. Comments regarding the scope and need for a NEPA analysis are addressed in Section V above, while those regarding the environmental analyses presented in the Draft SEIS are addressed in Appendix C of the Final SEIS.
As explained in NHTSA's June 2025 interpretive rule, NHTSA “must not consider the fuel economy of dedicated automobiles; must consider dual-fueled automobiles to be operated only on gasoline or diesel fuel; and must not consider, when prescribing a fuel economy standard, the trading, transferring, or availability of credits under [49 U.S.C. 32903].” [1359]
NEPA, however, does not impose such constraints on analysis; instead, NEPA requires that Federal agencies consider the “reasonably foreseeable environmental effects of the proposed agency action.” [1360]
NHTSA's Final SEIS therefore presents results of an “unconstrained” analysis that considers manufacturers' potential use of CAFE credits and application of alternative fuel technologies (including PHEVs using their charge depleting fuel economy values, BEVs, and FCEVs) in order to disclose and allow consideration of real-world environmental consequences of the final rule and alternatives.[1361]
NHTSA has considered the information contained in the Final SEIS as part of developing this final rule and in selecting the final standards.[1362]
This preamble and final rule constitute the agency's Record of Decision (ROD) for its promulgation of CAFE standards for MYs 2022-2031 passenger cars and light trucks. The agency has the authority to issue its Final SEIS and ROD simultaneously, pursuant to 49 U.S.C. 304a(b) and Section 14 of DOT Order 5610.1D. NHTSA has determined that simultaneous issuance is appropriate here because a separate 30-day waiting period is not required to address unresolved interagency disagreements or extraordinary public controversy that could otherwise affect the agency's final decision. Accordingly, neither the statutory criteria nor practicability considerations preclude issuing the combined documents. For additional information on NHTSA's NEPA analysis, please see the Final SEIS.
2. Clean Air Act as Applied to NHTSA's Final Rule
The CAA (42 U.S.C. 7401
et seq.) is the primary Federal legislation that addresses air quality. Under the authority of the CAA and subsequent amendments, EPA has established National Ambient Air Quality Standards (NAAQS) for six criteria pollutants, which are reviewed every five years.
The air quality of a geographic region is usually assessed by comparing the levels of criteria air pollutants found in the ambient air to the levels established by the NAAQS (also considering the other elements of a NAAQS: averaging time, form, and indicator). Concentrations of criteria pollutants within the air mass of a region are measured in parts of a pollutant per million parts (ppm) of air or in micrograms of a pollutant per cubic meter (μg/m3
) of air present in repeated air samples taken at designated monitoring locations using specified types of monitors. These ambient concentrations of each criteria pollutant are compared to the levels, averaging time, and form specified by the NAAQS to assess whether the region's air quality is in attainment with the NAAQS.
When the measured concentrations of a criteria pollutant within a geographic region are below those permitted by the NAAQS, EPA designates the region as an attainment area for that pollutant, while regions where concentrations of criteria pollutants exceed Federal standards are called non-attainment areas. Former non-attainment areas that are now in compliance with the NAAQS are designated as maintenance areas. Each State with a non-attainment area is required to develop and implement a State Implementation Plan (SIP) documenting how the region will reach attainment levels within the time periods specified in the CAA. For maintenance areas, the SIP must document how the State intends to maintain compliance with the NAAQS. EPA develops a Federal Implementation
( printed page 62267)
Plan (FIP) if a State fails to submit an approvable plan for attaining and maintaining the NAAQS. When EPA revises a NAAQS, each State must revise its SIP to address how it plans to attain the new standard.
No Federal agency may “engage in, support in any way or provide financial assistance for, license or permit, or approve” any activity that does not “conform” to a SIP or FIP after EPA has approved or promulgated it.[1363]
Further, no Federal agency may “approve, accept or fund” any transportation plan, program, or project developed pursuant to title 23 or chapter 53 of title 49, U.S.C., unless the plan, program, or project has been found to “conform” to any applicable implementation plan in effect.[1364]
The purpose of these conformity requirements is to ensure that federally sponsored or conducted activities do not interfere with meeting the emissions targets in SIPs or FIPs, do not cause or contribute to new violations of the NAAQS, and do not impede the ability of a State to attain or maintain the NAAQS or delay any interim milestones. EPA has issued two sets of regulations to implement the conformity requirements:
(1) The Transportation Conformity Rule [1365]
applies to transportation plans, programs, and projects that are developed, funded, or approved under 23 U.S.C. (Highways) or 49 U.S.C. chapter 53 (Public Transportation).
(2) The General Conformity Rule [1366]
applies to all other Federal actions not covered under the Transportation Conformity Rule. The General Conformity Rule establishes emissions thresholds, or
de minimis
levels, for use in evaluating the conformity of an action that results in emissions increases.[1367]
If the net increases of direct and indirect emissions exceed any of these thresholds, and the action is not otherwise exempt, then a conformity determination is required. The conformity determination can entail air quality modeling studies, consultation with EPA and State air quality agencies, and commitments to revise the SIP or to implement measures to mitigate air quality impacts.
During the public comment period, NHTSA received comments regarding the general impacts of the rulemaking on CAA goals, State SIP planning, and cooperative federalism. Commenters, including the NACAA, Minnesota state agencies, Connecticut Department of Energy and Environmental Protection (CT DEEP), Attorneys General, and Sabin
et al.,
argued that reducing stringency of CAFE standards will increase criteria pollutants (such as NOX, VOCs, and PM2.5
) and upstream emissions, jeopardizing States' and cities' abilities to attain or maintain the NAAQS.[1368]
These commenters argued that because mobile sources dominate the emission inventory in many non-attainment areas, the proposal creates an unfunded mandate forcing States to rely on costly, less effective controls on stationary sources. They stated this disrupts the CAA's “cooperative federalism” framework, where States rely on a strong federal floor for mobile source emission controls. NHTSA notes that the number of vehicle refueling events and the impacts of the emissions of certain criteria pollutants and their precursors will vary from area to area, depending on factors such as the composition of the local vehicle fleet and the amount of gasoline produced in the area. States consider emissions or air quality impacts in the context of SIP development for relevant NAAQS.
In addition, multiple State Attorneys General commented that NHTSA failed to examine the environmental justice implications of criteria pollution tied to upstream emissions from petroleum extraction and refining.[1369]
Other commenters raised specific programmatic concerns. ZETA asserted that NHTSA must consider existing EPA greenhouse gas standards in its baseline, rather than disregarding them due to a proposed rescission.[1370]
BGA argued that relaxing standards harms the domestic supply chain and auto sector employment.[1371]
NACAA urged a coordinated multi-pollutant approach with the EPA to maximize co-benefits, while other commenters argued conversely that utilizing criteria pollutant co-benefits to justify regulations drives up excess net costs.[1372]
Furthermore, NACAA warned that removing civil penalties creates compliance uncertainty that undermines the emissions assumptions used in State SIPs and suggested NHTSA explore an incentive-based alternative approach.[1373]
As disclosed and evaluated in Chapter 4 (Air Quality) and Appendix F of the Final SEIS, NHTSA modeled the projected impacts of the alternatives on criteria pollutants and mobile source air toxics. Regarding comments asserting the agency failed to examine upstream emissions and related environmental justice implications, NHTSA notes that, as determined by the Supreme Court in
Seven County Infrastructure Coalition
v.
Eagle County, Colorado,
605 U.S. ___ (2025), an agency is not required under NEPA to analyze upstream or other cumulative environmental impacts that fall outside its statutory authority. Because NHTSA's mandate under EPCA does not provide the authority to regulate upstream petroleum extraction or refining, analyzing these upstream impacts is not required. Furthermore, the Executive Orders that previously directed environmental justice analyses have been rescinded. Further discussion of the
Seven County
decision and the scope of the agency's impacts analysis can be found in the Final SEIS.
In response to the broader programmatic, baseline, and multi-pollutant comments, NHTSA emphasizes that this rulemaking is governed by EPCA, not the CAA. As previously discussed in Section V of this preamble, EPCA requires NHTSA to set maximum feasible average fuel economy standards by balancing four specific statutory factors: technological feasibility, economic practicability, the effect of other motor vehicle standards of the Government, and the need of the United States to conserve energy. While NHTSA consults with the EPA and properly considers existing, legally effective Federal emissions standards as “other motor vehicle standards of the Government,” EPCA does not authorize NHTSA to base its fuel economy standards on the objectives of ensuring local NAAQS attainment, minimizing State stationary-source control costs, or directly regulating environmental pollution. Finally, regarding the comments on civil penalties and incentives, NHTSA is bound by EPCA's specific statutory framework governing the assessment and collection of CAFE civil penalties, which does not grant the agency the authority to replace the penalty structure with the alternative compliance incentive programs. The finalized CAFE standards and associated program activities are not
( printed page 62268)
developed, funded, or approved under 23 U.S.C. or 49 U.S.C. chapter 53. Accordingly, this final rule and associated program activities would not be subject to transportation conformity requirements.
During the public comment period, several commenters, including State environmental agencies (ME DEP, OR DEQ), NACAA, and the South Coast AQMD, expressed concern that the proposed rule alters the future emissions trajectories relied upon in SIPs.[1374]
Commenters noted that State transportation conformity determinations rely on the EPA's MOVES model, which incorporates existing CAFE assumptions.[1375]
They argued that changes to the vehicle standards could invalidate existing Motor Vehicle Emissions Budgets (MVEBs), create gaps between projected and allowable emissions, and potentially halt major transportation projects.
While NHTSA acknowledges that State environmental and planning agencies utilize the EPA's MOVES model to establish MVEBs for their SIPs, and that States may need to update their planning models to reflect the revised Federal vehicle standards, this downstream modeling and SIP maintenance responsibility does not subject NHTSA's Federal rulemaking to transportation conformity. Because the agency's action does not fall under the statutory transportation planning provisions of title 23 or chapter 53 of title 49, U.S.C., transportation conformity requirements do not apply to this action.
Under the General Conformity Rule, a conformity determination is required where a Federal action would result in total direct and indirect emissions of a criteria pollutant or precursor in a non-attainment or maintenance areas equaling or exceeding the rates specified in 40 CFR 93.153(b)(1) and (2). As explained below, NHTSA's final rule would not result in direct or indirect emissions as defined in 40 CFR 93.152.
The General Conformity Rule defines direct emissions as “those emissions of a criteria pollutant or its precursors that are caused or initiated by the Federal action and originate in a non-attainment or maintenance area and occur at the same time and place as the action and are reasonably foreseeable.” [1376]
NHTSA's final rule establishes fuel economy standards for passenger cars and light trucks. It therefore would not cause or initiate direct emissions consistent with the meaning of the General Conformity Rule.[1377]
Indirect emissions under the General Conformity Rule are “those emissions of a criteria pollutant or its precursors: (1) [t]hat are caused or initiated by the Federal action and originate in the same non-attainment or maintenance area but occur at a different time or place as the action; (2) [t]hat are reasonably foreseeable; (3) [t]hat the agency can practically control; and (4) [f]or which the agency has continuing program responsibility.” [1378]
Each element of the definition must be met to qualify as indirect emissions. NHTSA has determined, for purposes of general conformity, that emissions (if any) that may result from its fuel economy standards would not be caused by the agency's action, but rather would occur because of subsequent activities the agency cannot practically control. “[E]ven if a Federal licensing, rulemaking or other approving action is a required initial step for a subsequent activity that causes emissions, such initial steps do not mean that a Federal agency can practically control any resulting emissions.” [1379]
NHTSA received comments from organizations including the NRDC
et al.[1380]
and South Coast AQMD [1381]
asserting that a general conformity determination is required. Commenters argued that the agency's own Draft SEIS identifies “reasonably foreseeable” increases in emissions (such as NOX
and VOCs) that exceed the
de minimis
thresholds established in 40 CFR 93.153, such as the 10 tons-per-year threshold in the South Coast Air Basin. South Coast AQMD argued that because these emissions are a substantive result of the rulemaking, the categorical exemption for rulemaking does not apply. These commenters challenged NHTSA's position that it cannot control these emissions, arguing that because NHTSA sets the fleetwide fuel economy standards, the agency has continuing program responsibility and practical control over the emissions outcomes. Furthermore, NRDC argued that the Supreme Court's ruling in
Department of Transportation
v.
Public Citizen
does not exempt NHTSA from a conformity determination, asserting that unlike the regulations of the Federal Motor Carrier Safety Administration in that case, NHTSA's standards are intended by Congress to act as an emissions-reduction tool.
NHTSA disagrees with the commenters' assertions that the projected emissions increases trigger a conformity determination. While the SEIS models potential criteria pollutant impacts for the purposes of NEPA, those projections do not equate to indirect emissions under the General Conformity Rule. EPCA requires NHTSA to set fleetwide average fuel economy standards for the CAFE program using performance-based standards. NHTSA is not authorized to dictate how manufacturers are to comply with the standards, nor may NHTSA require manufacturers to use specific technologies to achieve improved fuel economy in their fleets. Furthermore, NHTSA cannot control consumer purchasing or driving behavior, both of which can have a considerable effect on vehicle emissions of criteria pollutants. It is the combination of factors outside NHTSA's authority, such as manufacturers' decisions to apply fuel economy technologies and consumers' purchasing and driving behaviors, which determine the aggregate levels of criteria pollutant and precursor emissions.
For purposes of analyzing the environmental impacts of the alternatives considered under NEPA, NHTSA has necessarily made assumptions regarding all of these factors. NHTSA's Final SEIS projects that increases in air toxics and criteria pollutants would occur in some non-attainment areas under certain alternatives. However, the CAFE standards do not mandate specific manufacturer decisions, consumer purchasing, or driver behavior, and NHTSA cannot practically control any of them.[1382]
In addition, NHTSA does not have the statutory authority or practical ability to control the actual vehicle miles traveled (VMT) by drivers. As the extent of emissions is directly dependent on the operation of motor vehicles, changes in any emissions that would result from NHTSA's finalized
( printed page 62269)
CAFE standards are not changes NHTSA can practically control or for which NHTSA has continuing program responsibility.
Regarding legal precedent cited by commenters, as noted in the Supreme Court's reversal in
Dept. of Transportation
v.
Public Citizen,
541 U.S. 752 (2004), a “but for” causal relationship is insufficient to establish practical control where an agency lacks the statutory authority to prevent a certain resource use or emissions increase. Contrary to the commenters' claims, NHTSA is not an environmental regulator, and the agency's direction under EPCA is to set maximum feasible vehicle fuel economy standards by balancing four statutory factors, none of which have an environmental protection basis.
NHTSA, by this rule, does not cause indirect emissions under the General Conformity Rule, and a general conformity determination is not required.
3. Endangered Species Act (ESA)
Under Section 7(a)(2) of the Endangered Species Act (ESA), Federal agencies must ensure that actions they authorize, fund, or carry out are “not likely to jeopardize the continued existence” of any federally listed threatened or endangered species (collectively, “listed species”) or result in the destruction or adverse modification of the designated critical habitat of these species.[1383]
If a Federal agency determines that an agency action may affect a listed species or designated critical habitat, it must initiate consultation with the appropriate service—the U.S. Fish and Wildlife Service (FWS) of the Department of the Interior (DOI) or the National Oceanic and Atmospheric Administration's National Marine Fisheries Service of the Department of Commerce (together, “the Services”), or both, depending on the species involved—in order to ensure that the action is not likely to jeopardize the species or destroy or adversely modify designated critical habitat.[1384]
Under this standard, the Federal agency taking action evaluates the possible effects of its action and determines whether to initiate consultation.[1385]
The Services have previously provided legal and technical guidance about whether CO2
emissions associated with a specific proposed Federal action trigger ESA Section 7(a)(2) consultation. NHTSA analyzed the Services' history of actions, analysis, and guidance in Appendix G of the MY 2012-2016 CAFE standards EIS and incorporates that analysis by reference here.[1386]
In that appendix, NHTSA looked at the history of the Polar Bear Special Rule and several guidance memoranda provided by FWS and the U.S. Geological Survey. Ultimately, DOI concluded that a causal link could not be made between CO2
emissions associated with a proposed Federal action and specific effects on listed species; therefore, no Section 7(a)(2) consultation would be required.
Subsequent to the publication of that appendix, a court vacated the Polar Bear Special Rule on NEPA grounds, though it upheld the ESA analysis as having a rational basis.[1387]
FWS then issued a revised Final Special Rule for the Polar Bear.[1388]
In that final rule, FWS provided for ESA Section 7, that the determination of whether consultation is triggered is narrow and focused on the discrete effect of the proposed agency action. FWS wrote that, “the consultation requirement is triggered only if there is a causal connection between the proposed action and a discernible effect to the species or critical habitat that is reasonably certain to occur. One must be able to `connect the dots' between an effect of proposed action and an impact to the species and there must be a reasonable certainty that the effect will occur.” [1389]
The statement in the revised Final Special Rule is consistent with the prior guidance published by FWS and remains valid.[1390]
If the consequence is not reasonably certain to occur, it is not an “effect of a proposed action” and does not trigger the consultation requirement.
In the NPRM for this action, NHTSA stated that, pursuant to Section 7(a)(2) of the ESA, NHTSA considered the effects of the proposed CAFE standards and reviewed applicable ESA regulations, case law, and guidance to determine what, if any, impact there might be to listed species or designated critical habitat. NHTSA stated that, based on this assessment, the agency determined that the action of setting CAFE standards does not require consultation under Section 7(a)(2) of the ESA.
During the public comment period, NHTSA received comments from the NRDC and other organizations asserting that the agency violated the ESA by failing to consult under Section 7.[1391]
The commenters argued that the rule's projected increases in CO2
emissions (approximately one billion metric tons by 2050) and NOX
emissions (between 55,000 and 170,000 tons) satisfy the “may affect” threshold. Specifically, commenters claimed that the increased CO2
emissions will accelerate Arctic Sea ice loss, harming the threatened polar bear, while increased NOX
emissions will lead to nitrogen deposition that harms the threatened bay checkerspot butterfly by creating soil conditions for invasive grasses. Finally, the commenters alleged that NHTSA failed to conduct a proper effects determination, claiming there was no evidence of such an assessment in the record.
NHTSA disagrees with the commenters' assertions that this rulemaking triggers Section 7 consultation. As established by FWS guidance, a consultation requirement is triggered only if there is a causal connection between the proposed action and a discernible effect on a species or critical habitat that is reasonably certain to occur. While commenters cite broad studies linking global greenhouse gases to sea ice loss and regional nitrogen deposition to habitat degradation, they fail to establish a discrete, reasonably certain causal link between the specific incremental emissions attributable to this CAFE rulemaking and a discernible impact on the polar bear, the bay checkerspot butterfly, or any other listed species. It does not appear possible to establish a causal connection between the marginal vehicle emissions shifts resulting from this specific action and those localized environmental harms. Furthermore, NHTSA's review of the applicable ESA regulations, historical guidance, and case law discussed above constitutes the agency's formal effects determination, which satisfies the
( printed page 62270)
agency's obligations under 50 CFR 402.14(a).
Based on this assessment, NHTSA determined that the action of setting CAFE standards does not require consultation under Section 7(a)(2) of the ESA. NHTSA's determination remains unchanged from the proposal and concludes the agency's review of this action under Section 7 of the ESA.
4. Other Regulatory Analyses Discussed in the Final SEIS
NHTSA conducted qualitative reviews of the impacts of action alternatives on potentially affected resources, including those related to the statutory requirements and orders listed below, in the Draft SEIS, and determined that setting CAFE standards for passenger cars and light trucks is not the type of activity to have impacts on such resource categories. NHTSA's determination remains unchanged from the proposal:
National Historic Preservation Act (NHPA);
Fish and Wildlife Conservation Act (FWCA);
Coastal Zone Management Act (CZMA);
Floodplain Management (E.O. 11988 and DOT Order 5650.2);
Preservation of the Nation's Wetlands (E.O. 11990 and DOT Order 5660.1a);
Migratory Bird Treaty Act (MBTA), Bald and Golden Eagle Protection Act (BGEPA),E.O. 13186; and
Department of Transportation Act (Section 4(f)).
A commenter noted that NHTSA should consult with other agencies or outside experts about causal connections between this final rule and the resource categories covered under ESA and other statutes and orders listed above, such as endangered species, ecological damage, wildlife, and wetlands.[1392]
In light of this comment, NHTSA re-evaluated its obligations under the ESA and other statutes, regulations, case law, and guidance. Ultimately, NHTSA arrived at the same determination as in the NPRM, namely that, though there may be a general association between the actions undertaken in this final rule and environmental impacts, as described in this preamble and the Final SEIS, the setting of CAFE standards for passenger cars and light trucks is not the type of activity that has impacts on the resource categories identified by the commenter. Furthermore, NHTSA lacks sufficient authority under EPCA to regulate for these purposes. As such, NHTSA finds it unnecessary to conduct any additional analyses beyond those conducted for the NPRM and the Draft SEIS.
5. Executive Order 13045: “Protection of Children From Environmental Health Risks and Safety Risks”
This final rule is subject to E.O. 13045 (62 FR 19885, Apr. 23, 1997). Pursuant to E.O. 13045, NHTSA must prepare an evaluation of the environmental health or safety effects of the planned action on children, and an explanation of why the planned action is preferable to other potentially effective and reasonably feasible alternatives considered by NHTSA. Further, this analysis may be included as part of any other required analysis.
While children are more vulnerable to adverse health effects related to mobile source emissions, environmental and health effects associated with criteria pollutant and toxic air pollutant emissions estimated from the final standards vary over time and across alternatives, and negative effects, when estimated, are extremely small. In addition, as discussed above, effects will vary based on how manufacturers respond to standards and how consumers choose to drive. This preamble and the Final SEIS discuss air quality, climate, and their related environmental and health effects. In addition, Section V of this preamble explains why NHTSA believes the finalized CAFE standards are preferable to other alternatives considered. Together, this preamble and Final SEIS satisfy NHTSA's responsibilities under E.O. 13045.
E.O. 14154, “Unleashing American Energy” (90 FR 8353, Jan. 29, 2025), announced the administration's policy regarding energy resources, specifically to promote the production, distribution, and use of reliable domestic energy supplies, including oil, natural gas, and biofuels; to ensure that all regulatory requirements related to energy are “grounded in clearly applicable law”; and “to eliminate the `electric vehicle (EV) mandate' and promote true consumer choice” [1393]
by “removing regulatory barriers to motor vehicle access; by ensuring a level regulatory playing field for consumer choice in vehicles; by terminating, where appropriate, State emissions waivers that function to limit sales of gasoline-powered automobiles; and by considering the elimination of unfair subsidies and other ill-conceived government-imposed market distortions that favor EVs over other technologies and effectively mandate their purchase by individuals, private businesses, and government entities alike by rendering other types of vehicles unaffordable.” [1394] E.O. 14154 also directs agencies to adhere only to relevant legislated requirements for environmental considerations and to eliminate any considerations beyond these requirements. Further, E.O. 14154 specifically directed the CEQ to propose rescinding its NEPA regulations found at 40 CFR 1500. CEQ rescinded its NEPA regulations in an interim final rule published on February 25, 2025, which was adopted as final on January 8, 2026.[1395]
This final rule follows the direction of E.O. 14154 to ensure that all analysis related to energy is grounded in clearly applicable law and that only the relevant legislated requirements for environmental considerations and any considerations beyond these requirements are eliminated from the assessment of maximum feasible standards and the Final SEIS.
7. Executive Order 14173: “Ending Illegal Discrimination and Restoring Merit-Based Opportunity”
E.O. 14173, “Ending Illegal Discrimination and Restoring Merit-Based Opportunity” (90 FR 8633, Jan. 31, 2025), removed “diversity, equity, and inclusion” (DEI) and “diversity, equity, inclusion, and accessibility” (DEIA) principles from mandates, policies, programs, activities, guidance, regulations, and requirements. This Executive Order revoked E.O. 12898, “Federal Actions to Address Environmental Justice in Minority Populations and Low-Income Populations” (59 FR 7629, Feb. 11, 1994), which directed Federal agencies to identify and address, as appropriate, “disproportionately high and adverse human health or environmental effects of its programs, policies, and activities on minority populations and low-income populations.” [1396]
The final rule is in compliance with E.O. 14173, and the Final SEIS analyzes the impacts on the quality of life of all Americans potentially affected by the final rule.
( printed page 62271)
C. Regulatory Flexibility Act
Pursuant to the Regulatory Flexibility Act (5 U.S.C. 601et seq.,
as amended), whenever an agency is required to publish an NPRM or final rule, it must prepare and make available for public comment a regulatory flexibility analysis that describes the effect of the rule on small entities (
e.g.,
small businesses, small organizations, and small governmental jurisdictions). No regulatory flexibility analysis is required if the head of an agency certifies the rule will not have a significant economic impact on a substantial number of small entities and publishes with the rule a statement of the factual basis for certifying that a rule will not have a significant economic impact on a substantial number of small entities.
NHTSA has considered the impacts of this final rule under the Regulatory Flexibility Act, and the NHTSA Administrator certifies this final rule will not have a significant economic impact on a substantial number of small entities. NHTSA's statement providing the factual basis for this certification pursuant to 5 U.S.C. 605(b) follows.
Small businesses are defined based on the North American Industry Classification System (NAICS) code.[1397]
One of the criteria for determining size is the number of employees in the firm. For establishments primarily engaged in manufacturing or assembling automobiles, the firm must have less than 1,500 employees to be classified as a small business. This rulemaking would affect motor vehicle manufacturers. As shown in Table VII-1, NHTSA has identified nine small manufacturers that produce passenger cars, light trucks, and SUVs. NHTSA acknowledges that some very new manufacturers may potentially not be listed. However, those new manufacturers tend to have transportation products that are not part of the light-duty vehicle fleet and have yet to start production of relevant vehicles.[1398]
NHTSA believes that the final rule would not have a significant economic impact on small vehicle manufacturers. The final rule is intended to reset the CAFE standards consistent with NHTSA's statutory authority. In addition, under 49 CFR part 525, passenger car manufacturers building less than 10,000 vehicles per year can petition NHTSA to have alternative standards apply to them. The listed manufacturers producing gasoline- and diesel-powered vehicles do not currently meet the standard and must already petition NHTSA for relief. This final rule to amend standards is not expected to have a meaningful impact on these manufacturers—they are still expected to be required to go through the same process and petition for relief, as the amended standards are expected to exceed the maximum feasibility of these small manufacturers. Accordingly, a regulatory flexibility analysis was not prepared.
E.O. 13132, “Federalism” (64 FR 43255, Aug. 10, 1999), requires Federal agencies to develop an accountable process to ensure “meaningful and timely input by State and local officials in the development of regulatory policies that have federalism implications.” E.O. 13132 defines the term “[p]olicies that have federalism implications” to include regulations that have “substantial direct effects on the States, on the relationship between the national government and the States, or on the distribution of power and responsibilities among the various levels of government.” Under this order, agencies may not issue a regulation that has federalism implications, which imposes substantial direct compliance costs, unless the Federal Government provides the funds necessary to pay the direct compliance costs incurred by the State and local governments, or the agencies consult with State and local officials early in the process of developing the final rule.
NHTSA has determined that this final rule does not implicate E.O. 13132 because it neither imposes substantial direct compliance costs on State, local, or tribal governments, nor does it
( printed page 62272)
preempt State law. NHTSA is not taking any action regarding preemption in this final rule and has determined that even though EPCA gives the agency express preemption authority, preemption is best executed through other actions. This rule's purpose is to finalize amended CAFE standards. Nothing in EPCA/EISA provides that NHTSA must make a determination or pronouncement on preemption in actions setting or amending CAFE standards. Thus, this final rule does not implicate the consultation procedures that E.O. 13132 imposes on agency regulations that would either preempt State law or impose substantial direct compliance costs on State, local, or tribal governments, as the only entities subject to this final rule are vehicle manufacturers.
With respect to the review of the promulgation of a new regulation, Section 3(b) of E.O. 12988, “Civil Justice Reform” (61 FR 4729, Feb. 7, 1996), requires that executive agencies make every reasonable effort to ensure that the regulation: (1) clearly specifies the preemptive effect; (2) clearly specifies the effect on existing Federal law or regulation; (3) provides a clear legal standard for affected conduct, while promoting simplification and burden reduction; (4) clearly specifies the retroactive effect, if any; (5) specifies whether administrative proceedings are to be required before parties file suit in court; (6) adequately defines key terms; and (7) addresses other important issues affecting clarity and general draftsmanship under any guidelines issued by the Attorney General. This document is consistent with these requirements.
NHTSA has examined this final rule to reset the CAFE standards applicable to MYs 2022-2026 and MYs 2027-2031 and determined that it meets the requirements of the Executive Order. In particular, the issue of preemption is discussed above and the agency's assessment of the rule's effect on prior model years is discussed in Section V. NHTSA notes further that there is no requirement that individuals submit a petition for reconsideration or pursue other administrative proceedings before they file suit in court. In addition, the rule provides a clear legal standard for compliance, establishing CAFE standards for passenger cars and light trucks for MYs 2022-2026 and MYs 2027-2031.
F. Executive Order 13175 (“Consultation and Coordination With Indian Tribal Governments”)
This final rule does not have tribal implications, as specified in E.O. 13175, “Consultation and Coordination with Indian Tribal Governments” (65 FR 67249, Nov. 9, 2000). This final rule would be implemented at the Federal level and would directly impact only vehicle manufacturers. Thus, E.O. 13175, which requires consultation with tribal officials when agencies are developing policies that have “substantial direct effects” on tribes and tribal interests, does not apply to this final rule.
G. Unfunded Mandates Reform Act
Section 202 of the Unfunded Mandates Reform Act of 1995 (UMRA) requires Federal agencies to prepare a written assessment of the costs, benefits, and other effects of a proposed or final rule that includes a Federal mandate likely to result in the expenditure by State, local, or tribal governments, in the aggregate, or by the private sector, of more than $100 million in any 1 year (adjusted for inflation with base year of 1995). Adjusting this amount by the implicit GDP price deflator for 2024 results with $187 million (125.23/66.939=1.87).[1401]
Before promulgating a rule for which a written statement is needed, Section 205 of UMRA generally requires NHTSA to identify and consider a reasonable number of regulatory alternatives and adopt the least costly, most cost effective, or least burdensome alternative that achieves the objective of the rule. The provisions of Section 205 do not apply when they are inconsistent with applicable law. Moreover, Section 205 allows NHTSA to adopt an alternative other than the least costly, most cost effective, or least burdensome alternative if NHTSA publishes with the rule an explanation of why that alternative was not adopted.
This final rule will not result in the expenditure by State, local, or tribal governments, in the aggregate, of more than $187 million annually, but it will result in cost savings exceeding that amount for vehicle manufacturers and their suppliers. In developing this final rule, NHTSA considered a range of alternative fuel economy standards. As explained in detail in Section V of the preamble above, NHTSA concludes its selected alternatives are the maximum feasible alternatives that achieve the objectives of this final rule, as required by EPCA/EISA.
H. Regulation Identifier Number
DOT assigns a regulation identifier number (RIN) to each regulatory action listed in the Unified Agenda of Federal Regulations. The Regulatory Information Service Center publishes the Unified Agenda in the spring and fall of each year. The RIN contained in the heading at the beginning of this document may be used to find this action in the Unified Agenda.
I. National Technology Transfer and Advancement Act
Section 12(d) of the National Technology Transfer and Advancement Act (NTTAA) requires NHTSA to evaluate and use existing voluntary consensus standards in its regulatory activities unless doing so would be inconsistent with applicable law (
i.e.,
the statutory provisions regarding NHTSA's vehicle safety authority) or otherwise impractical.[1402]
Voluntary consensus standards are technical standards developed or adopted by voluntary consensus standards bodies. Technical standards are defined by the NTTAA as “performance-based or design-specific technical specification and related management systems practices.” They pertain to “products and processes, such as the size, strength, or technical performance of a product, process, or material.” [1403]
Examples of organizations generally regarded as voluntary consensus standards bodies include the American Society for Testing and Materials, International, the SAE, and the American National Standards Institute (ANSI). If NHTSA does not use available and potentially applicable voluntary consensus standards, it is required by the act to provide Congress, through OMB, an explanation of reasons for not using such standards.
NHTSA is incorporating by reference two SAE standards into this rule. NHTSA considered several options for evaluating a vehicle's tow rating for purposes of classification as a non-passenger automobile and has opted to use trailer weight rating (TWR) defined in accordance with SAE J2807 in the finalized provisions for the new LDWF pathway. SAE J2807 is an objective, industry-accepted, test-based methodology for evaluating towing capacity. In addition, many U.S. and Japanese auto manufacturers have well-
( printed page 62273)
documented use of SAE J2807 for their tow ratings dating back to at least 2015. This is discussed in more detail in Section VI, above. In addition, NHTSA has long referenced SAE J1100 for purposes of the definition of
passenger-carrying volume.
NHTSA is finalizing a technical change to the definition of
passenger-carrying volume
to update the title of SAE Surface Vehicle Recommended Practice J1100, Motor Vehicle Dimensions. Though not proposed in the NPRM, this change is being finalized as a technical amendment that has no regulatory impact. NHTSA is also adding SAE J1100 NOV2009 to the list of materials incorporated by reference in § 523.11. This is also discussed in more detail in Section VI, above.
J. Incorporation by Reference
Under regulations issued by the Office of the Federal Register (1 CFR 51.5), an agency, as part of a proposed rule that includes material incorporated by reference, must summarize material that is proposed to be incorporated by reference and discuss the ways the material is reasonably available to interested parties or how the agency worked to make materials available to interested parties. At the final rule stage, regulations require that the agency seek formal approval, summarize the material that it incorporates by reference in the preamble of the final rule, discuss the ways that the materials are reasonably available to interested parties, and provide other specific information to the Office of the Federal Register.
NHTSA is incorporating by reference two SAE standards into this rule. NHTSA incorporates by reference SAE J2807 Performance Requirements for Determining Tow-Vehicle Gross Combination Weight Rating and Trailer Weight Rating, specifically the TWR definition used in that standard. SAE J2807 establishes minimum performance criteria at GCWR and calculation methodology to determine tow-vehicle TWR for passenger cars, multipurpose passenger vehicles, and trucks. NHTSA's regulations will use TWR for manufacturers to determine whether a vehicle qualifies as a non-passenger automobile for purposes of the CAFE program. NHTSA also incorporates by reference SAE J1100 Motor Vehicle Dimensions (NOV2009). SAE J1100 defines a set of measurements and standard procedures for motor vehicle dimensions. NHTSA specifies that this standard should be used for measurements related to the definition of
passenger-carrying volume
as specified in 49 CFR part 523.
All standards incorporated by reference in this rule are available for review at NHTSA's headquarters in Washington, DC, and for purchase from SAE. In addition, SAE's Reading Room provides public access to foreign-government authored content and the sections of SAE standards that have been incorporated by reference into the CFR, at
www.sae.org/standards/sae-reading-room.
K. Department of Energy Review
In accordance with 49 U.S.C. 32902(j)(2), NHTSA submitted this final rule to DOE for review. The agency did not make any comments that NHTSA did not address.[1404]
L. Paperwork Reduction Act
Under the procedures established by the Paperwork Reduction Act of 1995 (PRA) (44 U.S.C. 3501et seq.), Federal agencies must obtain approval from OMB for each collection of information they conduct, sponsor, or require through regulations. A person is not required to respond to a collection of information by a Federal agency unless the collection displays a valid OMB control number. This final rule implements changes that relate to information collections that are subject to the PRA. Accordingly, NHTSA is forwarding an Information Collection Request (ICR) for a modification to NHTSA's existing information collection for CAFE Reporting to OMB for approval.
This final rule modifies NHTSA's previously approved ICR for its CAFE program (OMB control number 2127-0019). NHTSA sought comment on its intention to seek approval from OMB for this modification in the proposal and forwarded the ICR to OMB for approval. OMB deferred approval of this ICR and instructed NHTSA to resubmit the ICR with publication of the final rule. NHTSA is now resubmitting its request for revision of its existing CAFE information collection.
NHTSA's ICR describes the nature of the information collections for the CAFE program and their expected burden. As described in the NPRM, the ICR covers requirements for manufacturers to submit information on CAFE standards, exemptions, vehicles, technologies, and CAFE compliance test results. Manufacturers also provide information on any of the flexibilities and incentives they use during the model year to comply with CAFE standards. These reporting requirements are necessary to ensure compliance with its CAFE program.
In the NPRM, NHTSA proposed changes to the CAFE program's standardized reporting templates for manufacturers to submit information to NHTSA on their vehicle production and CAFE credits used to comply with the CAFE standards. In the ICR for the NPRM, NHTSA proposed modifications to the previously approved collection, including: (1) amending reporting elements related to vehicle classification on the pre-model year and mid-model year reports; (2) removing data elements related to AC and OC fuel consumption incentive values (FCIVs), in line with the AC and OC FCIV alternative pathways ending with MY 2026; (3) removing reporting requirements for credit trading in line with NHTSA's proposal to end credit trading with MY 2027, which includes credit trade contracts, credit allocation plans, credit transaction requests, and credit value reports; and (4) updating the pre-model year and mid-model year reporting templates to align with revised requirements. NHTSA is also removing reporting related to fuel consumption incentive values earned by full-size pickup trucks, which ended in MY 2024. As noted in the NPRM, these changes are expected to result in a decrease in burden to respondents. As a result of these changes, NHTSA estimated the total annual burden associated with the ICR would be 4,576 hours, a decrease of 285 hours from the previously approved collection which had an estimated burden of 4,861 hours.
While NHTSA did not receive any comments about its burden estimates, NHTSA did receive comments on the proposed changes to reporting requirements. NHTSA discusses these comments and the agency's response in the relevant sections above (See Section VI.B.4). After reviewing the comments, NHTSA is revising reporting requirements, as discussed in Section VI. Accordingly, the modifications to the ICR from NHTSA's previous approval are as follows: (1) amending reporting elements related to vehicle classification on the pre-model and mid-model reports as discussed in Section VI.B.4; (2) removing reporting requirements for credit trading in line with NHTSA ending the program for credits earned after MY 2027 (though credits earned through MY 2027 may be traded and used for up to five model years after they were used); (3) removing information collection requirements related to AC and OC FCIV petitions, which are set to end in MY 2026; and (4) updating the pre-model year and mid-model year reporting templates to
( printed page 62274)
align with finalized changes. NHTSA is also removing reporting related to fuel consumption incentive values earned by full-size pickup trucks, which ended in MY 2024. NHTSA determined that no changes to the burden estimates included in the NPRM are warranted. Therefore, for the ICR NHTSA is forwarding to OMB for approval, NHTSA estimates that the total burden for the collection is 4,576 hours and $0. For additional information, see the supporting documentation for this ICR that is posted to the docket.[1405]
Approach angle
means the smallest angle, in a plane side view of an automobile, formed by the level surface on which the automobile is standing and a line tangent to the front tire static loaded radius arc and touching the underside of the automobile forward of the front tire.
Axle clearance
means the vertical distance from the level surface on which an automobile is standing to the lowest point on the axle differential of the automobile.
Base tire (for passenger automobiles, non-passenger automobiles, and medium-duty passenger vehicles)
means the tire size specified as standard equipment by the manufacturer on each unique combination of a vehicle's footprint and model type.
Basic vehicle frontal area
is used as defined in 40 CFR 86.1803-01 for passenger automobiles, non-passenger automobiles, medium-duty passenger vehicles and Class 2b through 3 pickup trucks and vans. For heavy-duty tracts and vocational vehicles, it has the meaning given in 40 CFR 1037.801.
Breakover angle
means the supplement of the largest angle, in the plane side view of an automobile that can be formed by two lines tangent to the front and rear static loaded radii arcs and intersecting at a point on the underside of the automobile.
Cab-complete vehicle
means a vehicle that is first sold as an incomplete vehicle that substantially includes the vehicle cab section as defined in 40 CFR 1037.801. For example, vehicles known commercially as chassis-cabs, cab-chassis, box-deletes, bed-deletes, and cut-away vans are considered cab-complete vehicles. A cab includes a steering column and a passenger compartment. Note that a vehicle lacking some components of the cab is a cab-complete vehicle if it substantially includes the cab.
Cargo-carrying volume
means the luggage capacity or cargo volume index, as appropriate, and as those terms are defined in 40 CFR 600.315-08, in the case of automobiles to which either of these terms apply. With respect to automobiles to which neither of these terms apply, “cargo-carrying volume” means the total volume in cubic feet, rounded to the nearest 0.1 cubic feet, of either an automobile's enclosed non-seating space that is intended primarily for carrying cargo and is not accessible from the passenger compartment, or the space intended primarily for carrying cargo bounded in the front by a vertical plane that is perpendicular to the longitudinal centerline of the automobile and passes through the rearmost point on the rearmost seat and elsewhere by the automobile's interior surfaces.
Class 2b vehicles
are vehicles with a gross vehicle weight rating (GVWR) ranging from 8,501 to 10,000 pounds.
Class 3 through Class 8 vehicles
are vehicles with a gross vehicle weight rating (GVWR) of 10,001 pounds or more as defined in 49 CFR 565.15.
Commercial medium- and heavy-duty on-highway vehicle
means an on-highway vehicle with a gross vehicle weight rating of 10,000 pounds or more as defined in 49 U.S.C. 32901(a)(7).
Complete vehicle
has the meaning given to
completed vehicle
as defined in 49 CFR 567.3.
(1) For vehicles produced through model year (MY) 2027, the actual or the manufacturer's estimated weight of the vehicle in operational status with all standard equipment, and weight of fuel at nominal tank capacity, and the weight of optional equipment computed in accordance with 40 CFR 86.1832-01;
(2) For vehicles produced in MY 2028 and beyond, the actual weight of the vehicle in operational status, including the weight of all standard and all optional equipment installed on the vehicle as sold to the first retail purchaser, and the weight of the fuel at nominal tank capacity.
Dedicated vehicle
has the same meaning as dedicated automobile as defined in 49 U.S.C. 32901(a)(8).
Departure angle
means the smallest angle, in a plane side view of an automobile, formed by the level surface on which the automobile is standing and a line tangent to the rear tire static loaded radius arc and touching the underside of the automobile rearward of the rear tire.
Dual-fueled vehicle (multi-fuel, or flexible-fuel vehicle)
has the same meaning as dual fueled automobile as defined in 49 U.S.C. 32901(a)(9).
Electric vehicle
means a vehicle that does not include a combustion engine and is powered solely by an external source of electricity and/or solar power. Note that this does not include hybrid-electric or hydrogen combustion vehicles that use a chemical fuel such as gasoline, diesel fuel, or hydrogen. Electric vehicles may also be referred to as BEVs and fuel cell electric vehicles to distinguish them from hybrid-electric vehicles.
Emergency vehicle
means one of the following:
(1) For passenger automobiles, non-passenger automobiles, and medium-
( printed page 62275)
duty passenger vehicles, emergency vehicle has the meaning given in 49 U.S.C. 32902(e).
(2) For heavy-duty vehicles, emergency vehicle has the meaning given in 40 CFR 1037.801.
Footprint
is defined as the product of track width (measured in inches, calculated as the average of front and rear track widths, and rounded to the nearest tenth of an inch) times wheelbase (measured in inches and rounded to the nearest tenth of an inch), divided by 144 and then rounded to the nearest tenth of a square foot. For purposes of this definition, track width is the lateral distance between the centerlines of the base tires at ground, including the camber angle. For purposes of this definition, wheelbase is the longitudinal distance between front and rear wheel centerlines.
Full-size pickup truck
means a non-passenger automobile, including a medium-duty passenger vehicle, that meets the specifications in 40 CFR 86.1803-01 for a full-size pickup truck.
Gross axle weight rating (GAWR)
has the meaning given in 49 CFR 571.3.
Gross combination weight rating (GCWR)
has the meaning given in 49 CFR 571.3.
Gross vehicle weight rating (GVWR)
has the meaning given in 49 CFR 571.3.
Heavy-duty engine
means any engine used for (or for which the engine manufacturer could reasonably expect to be used for) motive power in a heavy-duty vehicle. For purposes of this definition in this part, the term “engine” includes internal combustion engines and other devices that convert chemical fuel into motive power. For example, a fuel cell and motor used in a heavy-duty vehicle is a heavy-duty engine. Heavy duty-engines include those engines subject to the standards in 49 CFR part 535.
Heavy-duty vehicle
means a vehicle as defined in § 523.6.
Hitch
means a device attached to the chassis of a vehicle for towing.
Incomplete vehicle
has the meaning given in 49 CFR 567.3.
Light truck
means a non-passenger automobile meeting the criteria in § 523.5. The term light truck includes medium-duty passenger vehicles that meet the criteria in § 523.5 for non-passenger automobiles.
Medium-duty passenger vehicle
means any complete or incomplete motor vehicle rated at more than 8,500 pounds GVWR and less than 10,000 pounds GVWR that is designed primarily to transport passengers, but does not include a vehicle that—
(1) Is an “incomplete truck,” meaning any truck that does not have the primary load carrying device or container attached; or
(2) Has a seating capacity of more than 12 persons; or
(3) Is designed for more than 9 persons in seating rearward of the driver's seat; or
(4) Is equipped with an open cargo area (for example, a pick-up truck box or bed) of 72.0 inches in interior length or more. A covered box not readily accessible from the passenger compartment will be considered an open cargo area for purposes of this definition. (See paragraph (1) of the definition of
medium-duty passenger vehicle
at 40 CFR 86.1803-01.)
Mild hybrid gasoline-electric vehicle
means a vehicle as defined by EPA in 40 CFR 86.1866-12(e).
Nominal tank capacity
means a fuel tank's volume as specified by the manufacturer.
Optional equipment
means any equipment or feature not standard on a vehicle model that is installed by the manufacturer or provided by the manufacturer for installation prior to a vehicle's first retail purchase.
Passenger-carrying volume
means the sum of the front seat volume and, if any, rear seat volume, as defined in 40 CFR 600.315-08, in the case of automobiles to which that term applies. With respect to automobiles to which that term does not apply, “passenger-carrying volume” means the sum in cubic feet, rounded to the nearest 0.1 cubic feet, of the volume of a vehicle's front seat and seats to the rear of the front seat, as applicable, calculated as follows with the head room, shoulder room, and leg room dimensions determined in accordance with the procedures outlined in SAE J1100 (incorporated by reference, see § 523.11).
(1) For front seat volume, divide 1,728 into the product of the following SAE dimensions, measured in inches to the nearest 0.1 inches, and round the quotient to the nearest 0.001 cubic feet.
(i) H61-Effective head room—front.
(ii) W3-Shoulder room—front.
(iii) L34-Maximum effective leg room-accelerator.
(2) For the volume of seats to the rear of the front seat, divide 1,728 into the product of the following SAE dimensions, measured in inches to the nearest 0.1 inches, and rounded the quotient to the nearest 0.001 cubic feet.
(i) H63-Effective head room—second.
(ii) W4-Shoulder room—second.
(iii) L51-Minimum effective leg room—second.
Pickup truck
means a non-passenger automobile that has a passenger compartment and an open cargo area (bed).
Pintle hooks
means a type of towing hitch that uses a tow ring configuration to secure to a hook or a ball combination for the purpose of towing.
Recreational vehicle or RV
means a motor vehicle equipped with living space and amenities found in a motor home.
Running clearance
means the distance from the surface on which an automobile is standing to the lowest point on the automobile, excluding unsprung weight.
Standard equipment
means those features or equipment which are marketed on a vehicle over which the purchaser can exercise no choice.
Static loaded radius arc
means a portion of a circle whose center is the center of a standard tire-rim combination of an automobile and whose radius is the distance from that center to the level surface on which the automobile is standing, measured with the automobile at curb weight, the wheel parallel to the vehicle's longitudinal centerline, and the tire inflated to the manufacturer's recommended pressure.
Strong hybrid gasoline-electric vehicle
means a vehicle as defined by EPA in 40 CFR 86.1866-12(e).
Temporary living quarters
means a space in the interior of an automobile in which people may temporarily live that includes sleeping surfaces, such as beds, and household conveniences, such as a sink, stove, refrigerator, or toilet.
Transmission class
has the meaning given in 40 CFR 600.002.
Transmission configuration
has the meaning given in 40 CFR 600.002.
Transmission type
has the meaning given in 40 CFR 86.1803.
Truck tractor
has the meaning given in 49 CFR 571.3 and 49 CFR 535.5(c). This includes most heavy-duty vehicles specifically designed for the primary purpose of pulling trailers, but does not include vehicles designed to carry other loads. For purposes of this definition “other loads” would not include loads carried in the cab, sleeper compartment, or toolboxes. Examples of vehicles
( printed page 62276)
similar to tractors but not tractors under this part include dromedary tractors, automobile haulers, straight trucks with trailers hitches, and tow trucks.
Van
means a vehicle with a body that fully encloses the driver and a cargo carrying or work performing compartment. The distance from the leading edge of the windshield to the foremost body section of vans is typically shorter than that of pickup trucks and sport utility vehicles.
Vocational tractor
means a tractor that is classified as a vocational vehicle according to 40 CFR 1037.630
Vocational vehicle (or heavy-duty vocational vehicle)
has the meaning given in § 523.8 and 49 CFR 535.5(b). This includes any vehicle that is equipped for a particular industry, trade, or occupation such as construction, heavy hauling, mining, logging, oil fields, or refuse and includes vehicles such as school buses, motorcoaches, and RVs.
Work truck
means a vehicle that is rated at more than 8,500 pounds and less than or equal to 10,000 pounds gross vehicle weight, and is not a medium-duty passenger vehicle as defined in 49 U.S.C. 32901(a)(19).
An automobile is any 4-wheeled vehicle propelled by fuel, or by alternative fuel, manufactured primarily for use on public streets, roads, and highways and rated at less than 10,000 pounds gross vehicle weight, except:
(a) A vehicle operated only on a rail line;
(b) A vehicle manufactured in different stages by 2 or more manufacturers, if no intermediate or final-stage manufacturer of that vehicle manufactures more than 10,000 multi-stage vehicles per year; or
A passenger automobile is any automobile (other than an automobile capable of off-highway operation) manufactured primarily for use in the transportation of not more than 10 individuals. A medium-duty passenger vehicle that does not meet the criteria for non-passenger motor vehicles in § 523.5 is a passenger automobile.
A non-passenger automobile means an automobile that is not a work truck and possesses one or more of the characteristics described in paragraph (a) of this section or meets the off-highway features described in paragraph (b) of this section. A medium-duty passenger vehicle that meets the criteria in either paragraph (a) or (b) of this section is a non-passenger automobile.
(a) An automobile not manufactured primarily for transporting 10 or fewer individuals, determined by the presence of at least one of the following chief characteristics:
(1) Transports more than 10 individuals;
(2) Provides temporary living quarters, as defined in § 523.2;
(3) Transports property on an open bed;
(4) Provides, as sold to the first retail purchaser, greater cargo-carrying than passenger-carrying volume, such as in a cargo van; if a vehicle is sold with two or more rows of seating, its cargo-carrying volume is determined with those seats installed, regardless of whether the manufacturer has described that seat as optional; or
(5) Permits expanded use of the automobile for cargo-carrying purposes or other non-passenger-carrying purposes through:
(i) For automobiles manufactured in model year 2022 through model year 2029, for vehicles equipped with at least 3 rows of designated seating positions as standard equipment, permit expanded use of the automobile for cargo-carrying purposes or other non-passenger-carrying purposes through the removal or stowing of foldable or pivoting seats so as to create a flat, leveled cargo surface extending from the forwardmost point of installation of those seats to the rear of the automobile's interior.
(ii) [Reserved]
(6) For automobiles manufactured in model year 2030 and beyond, as sold to the first retail purchaser, has a light-duty work factor (LDWF) value greater than or equal to 8500, calculated according to equation 1 to this paragraph (a).
Where:
GVWR
is the gross vehicle weight rating;
Cw
is the curb weight;
TWR
is the Trailer Weight Rating, determined in accordance with SAE J2807 (incorporated by reference, see § 523.11);
GVWR minus Cw
is the payload capacity.
(b) An automobile capable of off-highway operation, as indicated by the presence of the significant features contained in this paragraph (b):
(1)(i) Has 4-wheel drive; or
(ii) Is rated at more than 6,000 pounds gross vehicle weight; and
(2) For automobiles manufactured through model year 2029, has at least four of the following high ground clearance feature characteristics measured when the automobile is at curb weight, on a level surface, with the front wheels parallel to the automobile's longitudinal centerline, and the tires inflated to the manufacturer's recommended pressure—
(i) Approach angle of not less than 28 degrees.
(ii) Breakover angle of not less than 14 degrees.
(iii) Departure angle of not less than 20 degrees.
(iv) Running clearance of not less than 20 centimeters.
(v) Front and rear axle clearances of not less than 18 centimeters each.
(3) For automobiles manufactured in model year 2030 and beyond, has all four of the following high ground clearance feature characteristics measured when the automobile is at curb weight, on a level surface, with the front wheels parallel to the automobile's longitudinal centerline, and the tires inflated to the manufacturer's recommended pressure—
(i) Approach angle of not less than 28 degrees.
(ii) Breakover angle of not less than 14 degrees.
(iii) Departure angle of not less than 20 degrees.
(iv) Running clearance of not less than 20 centimeters.
(a) A heavy-duty vehicle is any commercial medium- or heavy-duty on-highway vehicle or a work truck, as defined in 49 U.S.C. 32901(a)(7) and (19). For the purpose of this section, heavy-duty vehicles are divided into three regulatory categories as follows:
(1) Heavy-duty pickup trucks and vans;
(2) Heavy-duty vocational vehicles; and
(3) Truck tractors with a GVWR above 26,000 pounds.
(b) The heavy-duty vehicle classification does not include vehicles excluded as specified in 49 CFR 535.3.
(a) Heavy-duty pickup trucks and vans are pickup trucks and vans with a gross vehicle weight rating between 8,501 pounds and 14,000 pounds (Class 2b through 3 vehicles) manufactured as complete vehicles by a single or final-stage manufacturer or manufactured as incomplete vehicles as designated by a manufacturer. See references in 40 CFR 86.1801-12, 40 CFR 86.1819-17, 40 CFR 1037.150, and 49 CFR 535.5(a).
(b) Heavy duty vehicles above 14,000 pounds GVWR may be optionally certified as heavy-duty pickup trucks and vans and comply with fuel consumption standards in 49 CFR 535.5(a), if properly included in a test group with similar vehicles at or below 14,000 pounds GVWR. Fuel consumption standards apply to these vehicles as if they were Class 3 heavy-duty vehicles. The work factor for these vehicles may not be greater than the largest work factor that applies for vehicles in the test group that are at or below 14,000 pounds GVWR (see 40 CFR 86.1819-14).
(c) Incomplete heavy-duty vehicles at or below 14,000 pounds GVWR may be optionally certified as heavy-duty pickup trucks and vans and comply with the fuel consumption standards in 49 CFR 535.5(a).
(a) A trailer means a motor vehicle with or without motive power, designed for carrying cargo and for being drawn by another motor vehicle as defined in 49 CFR 571.3. For the purpose of this part, heavy-duty trailers include only those trailers designed to be drawn by a truck tractor excluding non-box trailers other than flatbed trailers, tanker trailers, and container chassis, and those that are coupled to vehicles exclusively by pintle hooks or hitches instead of a fifth wheel. Heavy-duty trailers may be divided into different types and categories as follows:
(1) Box vans are trailers with enclosed cargo space that is permanently attached to the chassis, with fixed sides, nose, and roof. Tank trailers are not box vans.
(2) Box vans with front-mounted HVAC systems are refrigerated vans. Note that this includes systems that provide cooling, heating, or both. All other box vans are dry vans.
(3) Trailers that are not box vans are non-box trailers.
(4) Box vans with a length greater than 50 feet are long box vans. Other box vans are short box vans.
(5) The following types of equipment are not trailers:
(i) Containers that are not permanently mounted on chassis.
(ii) Dollies used to connect tandem trailers.
(iii) Equipment that serves similar purposes but are not intended to be pulled by a tractor.
(b) Heavy-duty trailers do not include trailers excluded in 49 CFR 535.3.
Certain material is incorporated by reference into this part with the approval of the Director of the Federal Register under 5 U.S.C. 552(a) and 1 CFR part 51. All approved incorporation by reference (IBR) material is available for inspection at the National Highway Traffic Safety Administration (NHTSA) and at the National Archives and Records Administration (NARA). Contact NHTSA at: 1200 New Jersey Avenue SE, Washington, D.C. 20590; (888) 327-4236;
CAFE_Mbox@dot.gov; www.nhtsa.gov.
For information on the availability of this material at NARA, visit
www.archives.gov/federal-register/cfr/ibr-locations.html
or email
fr.inspection@nara.gov.
The material may be obtained from: SAE International (SAE). SAE International, 400 Commonwealth Dr., Warrendale, PA 15096-0001; (877) 606-7323 (U.S. and Canada) or (724) 776-4970 (outside the U.S. and Canada) website:
www.sae.org.
(a) SAE J1100, Motor Vehicle Dimensions, revised November 2009, into § 523.2.
(b) SAE J2807, Performance Requirements for Determining Tow-Vehicle Gross Combination Weight Rating and Trailer Weight Rating, reaffirmed February 2024, into § 523.5.
2. Revise part 531 to read as follows:
PART 531—PASSENGER AUTOMOBILE AVERAGE FUEL ECONOMY STANDARDS
The purpose of this part is to increase the fuel economy of passenger automobiles by establishing minimum levels of average fuel economy for those vehicles.
(a)
Statutory terms.
(1) The terms
average fuel economy, manufacture,manufacturer,
and
model year
are used as defined in 49 U.S.C. 32901.
(2) The terms
automobile
and
passenger automobile
are used as defined in 49 U.S.C. 32901 and in accordance with the determination in part 523 of this chapter.
(b)
Other terms.
As used in this part, unless otherwise required by the context—
(1) The term
domestically manufactured passenger automobile
means the vehicle is deemed to be manufactured domestically under 49 U.S.C. 32904(b)(3) and 40 CFR 600.511-08.
(2) The term
footprint
has the meaning given in § 523.2 of this chapter.
(a) Except as provided in paragraph (c) of this section, for model years 2022 through 2031, a manufacturer's passenger automobile fleet shall comply with the fleet average fuel economy level calculated for that model year according to equation 1 to this paragraph (a) and the appropriate values in table 1 to this paragraph (a).
( printed page 62278)
Where:
CAFErequired
is the fleet average fuel economy standard for a given fleet (domestic passenger automobiles or imported passenger automobiles);
Subscript
i
is a designation of multiple groups of automobiles, where each group's designation,
i.e., i
= 1, 2, 3, etc., represents automobiles that share a unique model type and footprint within the applicable fleet, either domestic passenger automobiles or imported passenger automobiles;
Productioni
is the number of passenger automobiles produced for sale in the United States within each
ith
designation,
i.e.,
which share the same model type and footprint; and
TARGETi
is the fuel economy target in miles per gallon (mpg) applicable to the footprint of passenger automobiles within each
ith
designation,
i.e.,
which share the same model type and footprint, calculated according to equation 2 to this paragraph (a) and rounded to the nearest hundredth of a mpg,
i.e.,
35.455 = 35.46 mpg, and the summations in the numerator and denominator are both performed over all models in the fleet in question.
Equation 2 to Paragraph (a)
Where:
TARGET
is the fuel economy target (in mpg) applicable to vehicles of a given footprint (
FOOTPRINT,
in square feet);
Parameters
a, b, c,
and
d
are defined in Table 1 to this paragraph (a); and
The
MIN
and
MAX
functions take the minimum and maximum, respectively, of the included values.
Table 1 to Paragraph (
a
)—Parameters for the Passenger Automobile Fuel Economy Targets
[MYs 2022-2031]
Model year
Parameters
a
(mpg)
b
(mpg)
c
(gal/mi/ft2
)
d
(gal/mi)
2022
39.60
33.75
0.00039781
0.00814761
2023
39.96
34.06
0.00039423
0.00807428
2024
40.32
34.37
0.00039068
0.00800161
2025
40.69
34.68
0.00038716
0.0079296
2026
41.06
34.99
0.00038368
0.00785823
2027
41.43
35.31
0.00038023
0.00778751
2028
41.81
35.63
0.00037681
0.00771742
2029
42.19
35.95
0.00037342
0.00764796
2030
42.62
33.45
0.00064322
−0.00612481
2031
43.05
33.79
0.00063678
−0.00606357
(b) In addition to the requirements of paragraph (a) of this section, each manufacturer, other than manufacturers subject to standards in paragraph (c) of this section, shall also meet the minimum fleet standard for domestically manufactured passenger automobiles expressed in table 2 to this paragraph (b):
Table 2 to Paragraph (
b
)—Minimum Fuel Economy Standards for Domestically Manufactured Passenger Automobiles
[MYs 2022-2031]
Model
year
Minimum
standard
2022
34.4
2023
34.5
2024
35.1
2025
35.4
2026
35.7
2027
35.8
2028
36.1
2029
36.4
2030
36.3
2031
36.6
(c) The following manufacturers shall comply with the standards indicated in paragraphs (c)(1) through (4) of this section for the specified model years:
(1) Aston Martin Lagonda Limited.
( printed page 62279)
Table 3 to Paragraph (
c
)(1)—Average Fuel Economy Standards
Model
year
Miles per
gallon
2022
24.9
2023
24.9
(2) Koenigsegg.
Table 4 to Paragraph (
c
)(2)—Average Fuel Economy Standards
Model
year
Miles per
gallon
2022
16.9
2023
16.9
(3) McLaren.
Table 5 to Paragraph (
c
)(3)—Average Fuel Economy Standards
Model
year
Miles per
gallon
2022
24.6
2023
25.7
(4) Pagani.
Table 6 to Paragraph (
c
)(4)—Average Fuel Economy Standards
The fleet average fuel economy performance of all passenger automobiles manufactured for sale in the United States for a model year shall be determined in accordance with procedures established by the Administrator of the Environmental Protection Agency (EPA) under 49 U.S.C. 32904 and set forth in 40 CFR part 600.
Appendix A to Part 531—Example of Calculating a Fleet Average Fuel Economy Standard for a Passenger Automobile Fleet Under § 531.5(a)
Assume a hypothetical manufacturer (Manufacturer X) produces a fleet of passenger automobiles as follows:
Appendix A—Table I
Model type
Description
Base tire size
Wheelbase
(inches)
Track width F&R
average
(inches)
Footprint
(ft2
)
Volume
Fuel
economy target
standard
(mpg)
Group
Carline name
Basic engine
(L)
Transmission
class
1
PC A FWD
1.8
A5
2-door sedan
205/75R14
99.8
61.2
42.4
1,500
35.01
2
PC A FWD
1.8
M6
2-door sedan
215/70R15
99.8
60.9
42.2
2,000
35.14
3
PC A FWD
2.5
A6
4-door wagon
215/70R15
100.0
60.9
42.3
2,000
35.08
4
PC A AWD
1.8
A6
4-door wagon
235/60R15
100.0
61.2
42.5
1,000
35.95
5
PC A AWD
2.5
M6
2-door hatchback
225/65R16
99.6
59.5
41.2
3,000
35.81
6
PC B RWD
2.5
A6
4-door wagon
265/55R18
109.2
66.8
50.7
8,000
30.33
7
PC B RWD
2.5
A7
4-door sedan
235/65R17
109.2
67.8
51.4
2,000
29.99
8
PC C AWD
3.2
A7
4-door sedan
265/55R18
111.3
67.8
52.4
5,000
29.52
9
PC C FWD
3.2
M6
2-door coupe
225/65R16
111.3
67.2
51.9
3,000
29.76
Total
27,500
Note to Table I to this appendix: With the appropriate fuel economy targets determined for each unique model type and footprint combination, Manufacturer X's required fleet average fuel economy standard would be calculated as illustrated in Figure 1 to this appendix.
Appendix A Figure 1—Calculation of Manufacturer X's Fleet Average Fuel Economy
3. Revise part 533 to read as follows:
PART 533—NON-PASSENGER AUTOMOBILE FUEL ECONOMY STANDARDS
The purpose of this part is to increase the fuel economy of non-passenger automobiles by establishing minimum levels of average fuel economy for those vehicles.
(a)
Statutory terms.
(1) The terms
average fuel economy, average fuel economy standard,fuel economy, import,manufacture, manufacturer,
and
model year
are used as defined in 49 U.S.C. 32901.
(2) The term
automobile
is used as defined in 49 U.S.C. 32901 and in accordance with the determinations in part 523 of this chapter.
(b)
Other terms.
As used in this part, unless otherwise required by the context—
(1)
Non-passenger automobile
is used in accordance with the determinations in part 523 of this chapter.
(2)
Captive import
means, with respect to a non-passenger automobile, one that is not domestically manufactured, as defined in section 502(b)(2)(E) of the Motor Vehicle Information and Cost Savings Act, but that is imported in the 1980 model year or thereafter by a manufacturer whose principal place of business is in the United States.
(3)
4-wheel drive, general utility vehicle
means a 4-wheel drive, general purpose automobile capable of off-highway operation that has a wheelbase of not more than 280 centimeters, and that has a body shape similar to 1977 Jeep CJ-5 or CJ-7, or the 1977 Toyota Land Cruiser.
(4)
Basic engine
means a unique combination of manufacturer, engine displacement, number of cylinders, fuel system (as distinguished by number of carburetor barrels or use of fuel injection), and catalyst usage.
(5)
Limited product line non-passenger automobile
means a non-passenger automobile manufactured by a manufacturer whose light truck fleet is powered exclusively by basic engines that are not also used in passenger automobiles.
(6)
Footprint
has the meaning given in § 523.2 of this chapter.
Each manufacturer of non-passenger automobiles shall comply with the following fleet average fuel economy standards, expressed in miles per gallon, in the model year (MY) specified as applicable:
(a) For model years 2022-2031, a manufacturer's non-passenger automobile fleet shall comply with the fleet average fuel economy standard calculated for that model year according to equations 1 and 2 to this paragraph (a) and the appropriate values in table 1 to this paragraph (a).
Equation 1 to Paragraph (a)
Where:
CAFErequired
is the fleet average fuel economy standard for a given non-passenger automobile fleet;
Subscript
i
is a designation of multiple groups of non-passenger automobiles, where each group's designation,
i.e., i
= 1, 2, 3, etc., represents non-passenger automobiles that share a unique model type and footprint within the applicable fleet;
Productioni
is the number of non-passenger automobiles produced for sale in the United States within each
ith
designation,
i.e.,
which share the same model type and footprint; and
TARGETi
is the fuel economy target in miles per gallon (mpg) applicable to the footprint of non-passenger automobiles within each
ith
designation,
i.e.,
which share the same model type and footprint, calculated according to equation 2 to this paragraph (a) and rounded to the nearest hundredth of a mpg,
i.e.,
35.455 = 35.46 mpg, and the summations in the numerator and denominator are both performed over all models in the fleet in question.
Equation 2 to Paragraph (a)
Where:
TARGET
is the fuel economy target (in mpg) applicable to vehicles of a given footprint (
FOOTPRINT,
in square feet);
Parameters
a, b, c,
and d are defined in table 1 to this paragraph (a); and
The
MIN
and
MAX
functions take the minimum and maximum, respectively, of the included values.
Table 1 to Paragraph (
a
)—Parameters for the Non-Passenger Automobile Fuel Economy
(a) Any reference to a class of non-passenger automobiles manufactured for sale in the United States in a model year shall be deemed—
(1) To include all non-passenger automobiles in that class manufactured by persons who control, are controlled by, or are under common control with, such manufacturer;
(2) To include only automobiles that qualify as non-passenger vehicles in accordance with § 523.5 of this chapter; and
(3) To exclude all non-passenger automobiles in that class manufactured (within the meaning of paragraph (a)(1) of this section) during a model year by such manufacturer that are exported prior to the expiration of 30 days following the end of such model year.
(b) The fleet average fuel economy performance of all non-passenger automobiles manufactured for sale in the United States in a model year shall be determined in accordance with procedures established by the Administrator of the Environmental Protection Agency (EPA) under 49 U.S.C. 32904 and set forth in 40 CFR part 600.
Appendix A to Part 533—Example of Calculating a Fleet Average Fuel Economy Standard for a Non-passenger Automobile Fleet Under § 533.5(a)
Assume a hypothetical manufacturer (Manufacturer X) produces a fleet of non-passenger automobiles as follows:
Appendix A—Table I
Model type
Description
Base tire size
Wheelbase
(inch)
Track width F&R avg
(inch)
Footprint
(ft2
)
Volume
Fuel economy target standard
(mpg)
Group
Carline name
Basic engine
(L)
Transmission class
1
Pickup A 2WD
4
A5
Reg cab, MB
235/75R15
100.0
68.8
47.8
800
27.30
2
Pickup B 2WD
4
M5
Reg cab, MB
235/75R15
100.0
68.2
47.4
200
27.44
3
Pickup C 2WD
4.5
A5
Reg cab, LB
255/70R17
125.0
68.8
59.7
300
23.79
4
Pickup C 2WD
4
M5
Ext cab, MB
255/70R17
125.0
68.8
59.7
400
23.79
5
Pickup C 4WD
4.5
A5
Crew cab, SB
275/70R17
150.0
69.0
71.9
400
22.27
6
Pickup D 2WD
4.5
A6
Crew cab, SB
255/70R17
125.0
68.8
59.7
400
23.79
7
Pickup E 2WD
5
A6
Ext cab, LB
255/70R17
125.0
68.8
59.7
500
23.79
8
Pickup E 2WD
5
A6
Crew cab, MB
285/70R17
125.0
69.2
60.1
500
23.68
9
Pickup F 2WD
4.5
A5
Reg cab, LB
255/70R17
125.0
68.9
59.8
1,600
23.76
10
Pickup F 4WD
4.5
A5
Ext cab, MB
275/70R17
150.0
69.0
71.9
800
22.27
11
Pickup F 4WD
4.5
A5
Crew cab, SB
285/70R17
150.0
69.2
72.1
800
22.27
Total
6,700
Note to Table I to this appendix:With the appropriate fuel economy targets determined for each unique model type and footprint combination, Manufacturer X's required fleet average fuel economy standard would be calculated as illustrated in Figure 1 to this appendix:
( printed page 62282)
4. Revise part 536 to read as follows:
PART 536—TRANSFER AND TRADING OF FUEL ECONOMY CREDITS
This part establishes regulations governing the use and application of corporate average fuel economy (CAFE) credits up to three model years before and five model years after the model year in which the credit was earned. It also specifies requirements for manufacturers wishing to transfer fuel economy credits between their compliance categories. It also establishes regulations that allow manufacturers and other persons to trade fuel economy credits through model year 2027.
This part applies to all credits earned for exceeding applicable average fuel economy standards in a given model year for domestically manufactured passenger automobiles, imported passenger automobiles, and non-passenger automobiles.
(a)
Statutory terms.
All terms defined in 49 U.S.C. 32901(a) are used pursuant to their statutory meaning.
(b)
Other terms.
(1)
Above standard fuel economy
means, with respect to a compliance category, that the automobiles manufactured by a manufacturer in that compliance category in a particular model year have greater average fuel economy (calculated in a manner that reflects the incentives for alternative fuel automobiles per 49 U.S.C. 32905) than that manufacturer's fuel economy standard for that compliance category and model year.
(2)
Adjustment factor
means a factor used to adjust the value of a traded or transferred credit for compliance purposes to ensure that the compliance value of the credit when used reflects the total volume of oil saved when the credit was earned.
(3)
Below standard fuel economy
means, with respect to a compliance category, that the automobiles manufactured by a manufacturer in that compliance category in a particular model year have lower average fuel economy (calculated in a manner that reflects the incentives for alternative fuel automobiles per 49 U.S.C. 32905) than that manufacturer's fuel economy standard for that compliance category and model year.
(4)
Compliance
means a manufacturer achieves compliance in a particular compliance category when:
(i) The average fuel economy of the vehicles in that category exceed or meet the fuel economy standard for that category; or
(ii) The average fuel economy of the vehicles in that category do not meet the fuel economy standard for that category, but the manufacturer proffers a sufficient number of valid credits, adjusted for total oil savings, to cover the gap between the average fuel economy of the vehicles in that category and the required average fuel economy. A manufacturer achieves compliance for its fleet if the conditions in paragraph (b)(4)(i) of this section or this paragraph (b)(4)(ii) are simultaneously met for all compliance categories.
(5)
Compliance category
means any of three categories of automobiles subject to Federal fuel economy regulations in this chapter. The three compliance categories recognized by 49 U.S.C. 32903(g)(6) are domestically manufactured passenger automobiles, imported passenger automobiles, and non-passenger automobiles.
(6)
Credit holder (or holder)
means a legal person or entity that has valid possession of credits, either because they are a manufacturer who has earned credits by exceeding an applicable fuel economy standard in this chapter, or because they are a designated recipient who has received credits from another holder. Credit holders need not be manufacturers, though all manufacturers may be credit holders.
(7)
Credits (or fuel economy credits)
means an earned or purchased allowance recognizing that the average fuel economy of a particular manufacturer's vehicles within a particular compliance category and model year exceeds that manufacturer's fuel economy standard for that compliance category and model year. One credit is equal to 1-10 of a mile per gallon above the fuel economy standard per one vehicle within a compliance category. Credits are denominated according to model year in which they are earned (vintage), originating manufacturer, and compliance category.
(8)
Expiry date
means the model year after which fuel economy credits may no longer be used to achieve compliance with fuel economy regulations in this chapter. Expiry dates are calculated in terms of model years: For example, if a manufacturer earns credits for model year 2011, these credits may be used for compliance in model years 2008-2016.
(9)
Fleet
means all automobiles manufactured by a manufacturer in a particular model year and are subject to fuel economy standards under parts 531 and 533 of this chapter. For the purposes of this part, a manufacturer's fleet means all domestically manufactured and imported passenger automobiles and non-passenger automobiles. “Work trucks” and medium and heavy trucks are not included in this definition for purposes of this part.
(10)
Originating manufacturer
means the manufacturer that originally earned a particular credit. Each credit earned will be identified with the name of the originating manufacturer.
(11)
Trade
means the movement of credits from the account of a credit holder to the account of another credit holder within the same compliance category in which the credits were originally earned, in accordance with all applicable provisions under this part.
(12)
Transfer
means the movement of credits from one compliance category to another in accordance with all applicable provisions under this part. Subject to the credit transfer limitations of 49 U.S.C. 32903(g)(3), credits can also be transferred across compliance categories and banked or saved in that category to be carried forward or backwards later to address a credit shortfall.
(13)
Vintage
means, with respect to a credit, the model year in which the credit was earned.
(a)
Type and vintage.
In each credit account, credits are identified and distinguished by the manufacturer that earned the credits, the compliance category in which they were earned, and the model year in which they were earned (vintage).
(b)
Application of credits.
All credits earned and applied (
i.e.,
used to resolve an existing credit shortfall) are calculated, per 49 U.S.C. 32903(c), in tenths of a mile per gallon by which the average fuel economy of vehicles in a particular compliance category manufactured by a manufacturer in the model year in which the credits are earned exceeds the applicable average
( printed page 62283)
fuel economy standard, multiplied by the number of vehicles sold in that compliance category. However, credits that have been traded between credit holders or transferred between compliance categories are valued for compliance purposes using the adjustment factor specified in paragraph (c) of this section, pursuant to the “total oil savings” requirement of 49 U.S.C. 32903(f)(1).
(c)
Adjustment factor.
When traded or transferred fuel economy credits are applied, they are adjusted to ensure fuel oil savings is preserved. For traded credits, the user (or buyer) must multiply the calculated adjustment factor by the number of shortfall credits it plans to offset in order to determine the number of equivalent credits to acquire from the earner (or seller). For transferred credits, the user of credits must multiply the calculated adjustment factor by the number of shortfall credits it plans to offset to determine the number of equivalent credits to transfer from the compliance category holding the available credits. The adjustment factor is calculated according to the following equation in equation 1 to this paragraph (c):
Equation 1 to Paragraph (c)—Equation for Calculating Adjustment Factor
Where:
A
= Adjustment factor applied to traded and transferred credits. The quotient shall be rounded to 4 decimal places;
VMTe
= Lifetime vehicle miles traveled as provided in the following table 1 to this paragraph (c) for the model year and compliance category in which the credit was earned;
VMTu
= Lifetime vehicle miles traveled as provided in the following table 1 to this paragraph (c) for the model year and compliance category in which the credit is used for compliance;
MPGse
= Required fuel economy standard for the originating (earning) manufacturer, compliance category, and model year in which the credit was earned;
MPGae
= Actual fuel economy for the originating manufacturer, compliance category, and model year in which the credit was earned;
MPGsu
= Required fuel economy standard for the user (buying) manufacturer, compliance category, and model year in which the credit is used for compliance; and
MPGau
= Actual fuel economy for the user manufacturer, compliance category, and model year in which the credit is used for compliance.
Table 1 to Paragraph (
c
)—Lifetime Vehicle Miles Traveled
(a)
Accounts.
NHTSA maintains “accounts” for each credit holder. The account consists of a balance of credits in each compliance category and vintage held by the holder.
(b)
Who may hold credits.
Every manufacturer subject to fuel economy standards under part 531 or 533 of this chapter is automatically an account holder. If the manufacturer earns credits pursuant to this part, or receives credits from another party, so that the manufacturer's account has a non-zero balance, then the manufacturer is also a credit holder. Any party designated as a recipient of credits by a current credit holder will receive an account from NHTSA and become a credit holder, subject to the following conditions:
(1) A designated recipient must provide name, address, contact information, and a valid taxpayer identification number or Social Security number;
(2) NHTSA does not grant a request to open a new account by any party other than a party designated as a recipient of credits by a credit holder; and
(3) NHTSA maintains accounts with zero balances for a period of time, but reserves the right to close accounts that have had zero balances for more than 1 year.
(c)
Automatic debits and credits of accounts.
(1) To carry credits forward, backward, transfer credits, or trade credits into other credit accounts, a manufacturer or credit holder must submit a credit instruction to NHTSA. A credit instruction must detail and include:
(i) The credit holder(s) involved in the transaction.
(ii) The originating credits described by the amount of the credits, compliance category, and the vintage of the credits.
(iii) The recipient credit account(s) for banking or applying the originating credits described by the compliance category(ies), model year(s), and if applicable the adjusted credit amount(s) and adjustment factor(s).
(iv) For trades, a contract authorizing the trade signed by the manufacturers or credit holders or by managers legally authorized to obligate the sale and purchase of the traded credits.
(2) Upon receipt of a credit instruction from an existing credit holder, NHTSA verifies the presence of sufficient credits in the account(s) of the credit holder(s) involved as applicable and notifies the credit holder(s) that the credits will be debited from and/or credited to the accounts involved, as specified in the credit instruction. NHTSA determines if the credits can be debited or credited based upon the amount of available credits, accurate application of any adjustment factors and the credit requirements prescribed by this part that are applicable at the time the transaction is requested.
(3) After notifying the credit holder(s), all accounts involved are either credited or debited, as appropriate, in line with the credit instruction. Traded credits identified by a specific compliance category are deposited into the recipient's account in that same compliance category and model year. If a recipient of credits as identified in a credit instruction is not a current account holder, NHTSA establishes the credit recipient's account, subject to the conditions described in paragraph (b) of this section, and adds the credits to the newly opened account.
(4) NHTSA will automatically delete unused credits from holders' accounts when those credits reach their expiry date.
(5) Starting January 1, 2022, all parties trading credits must also provide NHTSA the price paid for the credits including a description of any other monetary or non-monetary terms affecting the price of the traded credits, such as any technology exchanged or shared in exchange for the credits, any other non-monetary payment for the credits, or any other agreements related to the trade.
(6) Starting September 1, 2022, manufacturers or credit holders issuing credit instructions or providing credit allocation plans as specified in
( printed page 62284)
paragraph (d) of this section, must use and submit the NHTSA Credit Template fillable form (Office of Management and Budget (OMB) Control No. 2127-0019, NHTSA Form 1475). In the case of a trade, manufacturers or credit holders buying traded credits must use the credit transactions template to submit trade instructions to NHTSA. Manufacturers or credit holders selling credits are not required to submit trade instructions. The NHTSA Credit Template must be signed by managers legally authorized to obligate the sale and/or purchase of the traded credits from both parties to the trade. The NHTSA Credit Template signed by both parties to the trade serves as an acknowledgement that the parties have agreed to trade a certain amount of credits, and does not dictate terms, conditions, or other business obligations of the parties.
(7) NHTSA will consider claims that information submitted to the agency under this section is entitled to confidential treatment under 5 U.S.C. 552(b) and under the provisions of part 512 of this chapter if the information is submitted in accordance with the procedures of part 512. The NHTSA Credit Template is available for download on the CAFE Public Information Center website. Manufacturers must submit the cost information to NHTSA in a PDF document along with the Credit Template through the CAFE email,
cafe@dot.gov.
NHTSA reserves the right to request additional information from the parties regarding the terms of the trade.
(d)
Compliance.
(1) NHTSA assesses compliance with fuel economy standards each year, utilizing the certified and reported CAFE data provided by the Environmental Protection Agency (EPA) for enforcement of the CAFE program pursuant to 49 U.S.C. 32904(e). Credit values are calculated based on the CAFE data from EPA. If a particular compliance category within a manufacturer's fleet has above standard fuel economy, NHTSA adds credits to the manufacturer's account for that compliance category and vintage in the appropriate amount by which the manufacturer has exceeded the applicable standard.
(2) If a manufacturer's vehicles in a particular compliance category have below standard fuel economy, NHTSA will provide written notification to the manufacturer that it has failed to meet a particular fleet target standard. The manufacturer will be required to confirm the shortfall and may also submit a plan indicating how it will allocate existing credits or earn, transfer and/or acquire credits to achieve compliance. If the manufacturer submits a plan, the plan must be submitted within 60 days of receiving agency notification.
(3) Credits used to offset shortfalls are subject to the three- and five-year limitations as described in § 536.6.
(4) Transferred credits are subject to the limitations specified by 49 U.S.C. 32903(g)(3) and this part.
(5) The value, when used for compliance, of any credits received via trade or transfer is adjusted, using the adjustment factor described in § 536.4(c), pursuant to 49 U.S.C. 32903(f)(1).
(6) Credit allocation plans received from a manufacturer will be reviewed and approved by NHTSA. Starting in model year 2022, credit holders must use the NHTSA Credit Template (OMB Control No. 2127-0019, NHTSA Forms 1475) to record the credit transactions. The template is a fillable form that has an option for recording and calculating credit transactions for credit allocation plans. The template calculates the required adjustments to the credits. The credit allocation plan and the completed transaction templates must be submitted to NHTSA. NHTSA will approve the credit allocation plan unless it finds that the proposed credits are unavailable or that it is unlikely that the plan will result in the manufacturer earning sufficient credits to offset the subject credit shortfall. If the plan is approved, NHTSA will revise the respective manufacturer's credit account accordingly. If the plan is rejected, NHTSA will notify the respective manufacturer and may request a revised plan.
(e)
Reporting.
(1) NHTSA periodically publishes the names and credit holdings of all credit holders. NHTSA does not publish individual transactions, nor respond to individual requests for updated balances from any party other than the account holder.
(2) NHTSA issues an annual credit status letter to each party that is a credit holder at that time. The letter to a credit holder includes a credit accounting record that identifies the credit status of the credit holder including any activity (earned, expired, transferred, traded, carry-forward and carry-back credit transactions/allocations) that took place during the identified activity period.
(a)
Carrying back and carrying forward of credits.
Credits earned in a compliance category may be applied by the manufacturer that earned them to carryback plans for that compliance category approved up to three years prior to the year in which the credits were earned, or may be held or applied for up to five model years after the year in which the credits were earned.
(b)
Transferring and trading of credits.
(1) Credits earned in a compliance category in model years 2022 through 2027 may be transferred or traded in accordance with all applicable provisions under this part.
(2) Credits earned in a compliance category in model year 2028 and beyond may be transferred or traded in accordance with all applicable provisions under this part. Credits earned in a compliance category in model year 2028 and beyond may not be traded.
(a) Carryback credits earned in a compliance category in any model year may be used in carryback plans approved by NHTSA, pursuant to 49 U.S.C. 32903(b), for up to three model years prior to the year in which the credit was earned.
(b) No credits from any source (earned, transferred, and/or traded) will be accepted in lieu of compliance if those credits are not identified as originating within one of the three model years after the model year of the confirmed shortfall.
(a)
Trading of credits.
If a credit holder wishes to trade credits to another party, the current credit holder and the receiving party must jointly issue an instruction to NHTSA, identifying the quantity, vintage, compliance category, and originator of the credits to be traded. If the recipient is not a current account holder, the recipient must provide sufficient information for NHTSA to establish an account for the recipient. Once an account has been established or identified for the recipient, NHTSA completes the trade by debiting the transferor's account and crediting the recipient's account. NHTSA will track the quantity, vintage, compliance category, and originator of all credits held or traded by all account holders.
(b)
Using traded credits to comply with fuel economy standards.
For credits earned in model years 2022 through 2027, and used to satisfy compliance obligations for model years 2019 through 2032 in accordance with all applicable provisions under this part:
(1) Manufacturers may use credits originally earned by another
( printed page 62285)
manufacturer in a particular compliance category to satisfy compliance obligations within the same compliance category.
(2) Once a manufacturer acquires by trade credits originally earned by another manufacturer in a particular compliance category, the manufacturer may transfer the credits to satisfy its compliance obligations in a different compliance category, but only to the extent that the CAFE increase attributable to the transferred credits does not exceed the limits in 49 U.S.C. 32903(g)(3). For any compliance category, the sum of a manufacturer's transferred credits earned by that manufacturer and transferred credits obtained by that manufacturer through trade must not exceed that limit.
(c)
Changes in corporate ownership and control.
Manufacturers must inform NHTSA of corporate relationship changes to ensure that credit accounts are identified correctly and credits are assigned and allocated properly.
(1) In general, if two manufacturers merge in any way, they must inform NHTSA how they plan to merge their credit accounts. NHTSA will subsequently assess corporate fuel economy and compliance status of the merged fleet instead of the original separate fleets.
(2) If a manufacturer divides or divests itself of a portion of its automobile manufacturing business, it must inform NHTSA how it plans to divide the manufacturer's credit holdings into two or more accounts. NHTSA will subsequently distribute holdings as directed by the manufacturer, subject to provision for reasonably anticipated compliance obligations.
(3) If a manufacturer is a successor to another manufacturer's business, it must inform NHTSA how it plans to allocate credits and resolve liabilities per part 534 of this chapter.
(d)
No short or forward sales.
NHTSA will not honor any instructions to trade or transfer more credits than are currently held in any account. NHTSA will not honor instructions to trade or transfer credits from any future vintage (
i.e.,
credits not yet earned). NHTSA will not participate in or facilitate contingent trades.
(e)
Cancellation of credits.
A credit holder may instruct NHTSA to cancel its currently held credits, specifying the originating manufacturer, vintage, and compliance category of the credits to be cancelled. These credits will be permanently null and void; NHTSA will remove the specific credits from the credit holder's account and will not reissue them to any other party.
(f)
Error or fraud in earning credits.
If NHTSA determines that a manufacturer has been credited, through error or fraud, with earning credits, NHTSA will cancel those credits if possible. If the manufacturer credited with having earned those credits has already traded them when the error or fraud is discovered, NHTSA will hold the receiving manufacturer responsible for returning the same or equivalent credits to NHTSA for cancellation.
(g)
Error or fraud in trading.
In general, all trades are final and irrevocable once executed, and may only be reversed by a new, mutually agreed transaction. If NHTSA executes an erroneous instruction to trade credits from one holder to another through error or fraud, NHTSA will reverse the transaction if possible. If those credits have been traded away, the recipient holder is responsible for obtaining the same or equivalent credits for return to the previous holder.
Use of credits with regard to the domestically manufactured passenger automobile minimum standard.
(a) Each manufacturer is responsible for compliance with both the minimum standard and the attribute-based standard set out in the chapter.
(b) In any particular model year, the domestically manufactured passenger automobile compliance category credit excess or shortfall is determined by comparing the actual CAFE value against either the required standard value or the minimum standard value, whichever is larger.
(d) If a manufacturer's average fuel economy level for domestically manufactured passenger automobiles is lower than the attribute-based standard, but higher than the minimum standard, then the manufacturer may achieve compliance with the attribute-based standard by applying credits.
(e) If a manufacturer's average fuel economy level for domestically manufactured passenger automobiles is lower than the minimum standard, then the difference between the minimum standard and the manufacturer's actual fuel economy level may only be relieved by the use of credits earned by that manufacturer within the domestic passenger automobile compliance category that have not been transferred or traded. If the manufacturer does not have available earned credits to offset a credit shortage below the minimum standard, then the manufacturer can submit a carry-back plan that indicates sufficient future credits will be earned in its domestic passenger automobile compliance category.
Treatment of dual-fuel and alternative fuel vehicles—consistency with 49 CFR part 538.
(a) The fuel economy of alternative fueled and dual fueled automobiles is calculated pursuant to EPA's regulations at 40 CFR 600.510-12 and included as part of EPA's calculation of a manufacturer's fleet average fuel economy for the model year and compliance category to which the alternative fueled or dual fueled automobile belongs, in accordance with 49 U.S.C. 32905 and limited by 49 U.S.C. 32906.
(b) If a manufacturer's calculated fuel economy for a particular compliance category, including any alternative fueled and dual fueled automobiles, is higher or lower than the applicable fuel economy standard, manufacturers will earn credits or must apply credits equal to the difference between the calculated fuel economy level in that compliance category and the applicable standard. Credits earned are the same as any other credits, and may be held, transferred, or traded by the manufacturer subject to the limitations of the statute and this part.
This part establishes requirements for automobile manufacturers to submit reports to the National Highway Traffic Safety Administration regarding their efforts to improve automotive fuel economy.
The purpose of this part is to obtain information to aid the National Highway Traffic Safety Administration in evaluating automobile manufacturers' plans for complying with average fuel economy standards and in preparing an annual review of the average fuel economy standards.
(a)
Statutory terms.
(1) The terms
average fuel economy standard, fuel, manufacture,
and
model year
are used as defined in 49 U.S.C. 32901.
(2) The term
manufacturer
is used as defined in 49 U.S.C. 32901 and in accordance with part 529 of this chapter.
(3) The terms
average fuel economy, fuel economy,
and
model type
are used as defined in subpart A of 40 CFR part 600.
(4) The terms
automobile, automobile capable of off-highway operation, non-passenger automobile,
and
passenger automobile
are used as defined in 49 U.S.C. 32901 and in accordance with the determinations in part 523 of this chapter.
(b)
Other terms.
(1) The term
loaded vehicle weight
is used as defined in subpart A of 40 CFR part 86.
(2) The terms
axle ratio, base level, body style, car line, combined fuel economy, engine code, equivalent test weight, gross vehicle weight, inertia weight, transmission class, vehicle configuration,
and
vehicle subconfiguration
are used as defined in subpart A of 40 CFR part 600.
(3) The terms
approach angle, axle clearance, breakover angle, cargo carrying volume, departure angle, passenger carrying volume, running clearance,
and
temporary living quarters
are used as defined in part 523 of this chapter.
(4) The term
incomplete automobile manufacturer
is used as defined in part 529 of this chapter.
(5) As used in this part, unless otherwise required by the context:
(i)
Administrator
means the Administrator of the National Highway Traffic Safety Administration or the Administrator's delegate.
(ii)
Current model year
means:
(A) In the case of a pre-model year report, the full model year immediately following the period during which that report is required by § 537.5(b) to be submitted.
(B) In the case of a mid-model year report, the model year during which that report is required by § 537.5(b) to be submitted.
(iii)
Average
means a production-weighted harmonic average.
(iv)
Total drive ratio
means the ratio of an automobile's engine rotational speed (in revolutions per minute) to the automobile's forward speed (in miles per hour).
(a) For each current model year, each manufacturer shall submit a pre-model year report, a mid-model year report, and, as required by § 537.8, supplementary reports.
(b)(1) The pre-model year report required by this part for each current model year must be submitted during the month of December (
e.g.,
the pre-model year report for the 1983 model year must be submitted during December 1982).
(2) The mid-model year report required by this part for each current model year must be submitted during the month of July (
e.g.,
the mid-model year report for the 1983 model year must be submitted during July 1983).
(3) Each supplementary report must be submitted in accordance with § 537.8(c).
(c) Each report required by this part must:
(1) Identify the report as a pre-model year report, mid-model year report, or supplementary report as appropriate;
(2) Identify the manufacturer submitting the report;
(3) State the full name, title, and address of the official responsible for preparing the report;
(4) Be submitted electronically to
cafe@dot.gov.
For each report, manufacturers should submit a confidential version and a non-confidential (
i.e.,
redacted) version. The confidential report should be accompanied by a request letter that contains supporting information, pursuant to § 512.8 of this chapter. Your request must also include a certificate, pursuant to § 512.4(b) of this chapter and part 512, Appendix A, of this chapter. The word “CONFIDENTIAL” must appear on the top of each page containing information claimed to be confidential. If an entire page is claimed to be confidential, the submitter must indicate clearly that the entire page is claimed to be confidential. If the information for which confidentiality is being requested is contained within a page, the submitter shall enclose each item of information that is claimed to be confidential within brackets: “[ ].” Confidential portions of electronic files submitted in other than their original format must be marked “Confidential Business Information” or “Entire Page Confidential Business Information” at the top of each page. If only a portion of a page is claimed to be confidential, that portion shall be designated by brackets. Files submitted in their original format that cannot be marked as described in this paragraph (c)(4) must, to the extent practicable, identify confidential information by alternative markings using existing attributes within the file or means that are accessible through use of the file's associated program. A representative from NHTSA's Office of Chief Counsel, as designated by NHTSA, should be copied on any submissions with confidential business information;
(5) Identify the current model year;
(6) Be written in the English language; and
(7)(i) Specify any part of the information or data in the report that the manufacturer believes should be withheld from public disclosure as trade secret or other confidential business information.
(ii) With respect to each item of information or data requested by the manufacturer to be withheld under 5 U.S.C. 552(b)(4) and 15 U.S.C. 2005(d)(1), the manufacturer shall:
(A) Show that the item is within the scope of sections 552(b)(4) and 2005(d)(1);
(B) Show that disclosure of the item would result in significant competitive damage;
(C) Specify the period during which the item must be withheld to avoid that damage; and
(D) Show that earlier disclosure would result in that damage.
(d) Beginning with model year 2023, each manufacturer shall generate reports required by this part using the NHTSA CAFE Projections Reporting Template (Office of Management and Budget (OMB) Control No. 2127-0019, NHTSA Form 1474). The template is a fillable form.
(1) Manufacturers must select the option to identify the report as a pre-model year report, mid-model year report, or supplementary report as appropriate.
(2) Manufacturers must complete all required information for the manufacturer and for all vehicles produced for the current model year required to comply with corporate average fuel economy (CAFE) standards. The manufacturer must identify the manufacturer submitting the report, including the full name, title, and address of the official responsible for preparing the report and a point of
( printed page 62287)
contact to answer questions concerning the report.
(3) Manufacturers must use the template to generate confidential and non-confidential reports for each of the compliance fleets (
i.e.,
domestic passenger automobile, imported passenger automobile, non-passenger automobile) produced by the manufacturer for the current model year. Manufacturers must submit a request for confidentiality in accordance with part 512 of this chapter to withhold projected production sales volume estimates from public disclosure. If the request is granted, NHTSA will withhold the projected production sales volume estimates from public disclosure until all the vehicles produced by the manufacturer have been made available for sale (usually 1 year after the current model year).
(4) Manufacturers must submit confidential reports and requests for confidentiality to NHTSA in accordance with § 537.12 and part 512 of this chapter using NHTSA's Confidential Business Information (CBI) Portal. Email copies of non-confidential (
i.e.,
redacted) reports to NHTSA's secure email address:
cafe@dot.gov.
(5) Manufacturers can withhold information on projected production sales volumes under 5 U.S.C. 552(b)(4) and 15 U.S.C. 2005(d)(1). In accordance, the manufacturer must:
(i) Show that the item is within the scope of sections 552(b)(4) and 2005(d)(1);
(ii) Show that disclosure of the item would result in significant competitive damage;
(iii) Specify the period during which the item must be withheld to avoid that damage; and
(iv) Show that earlier disclosure would result in that damage.
(e) Each report required by this part must be based upon all information and data available to the manufacturer 30 days before the report is submitted to the Administrator.
(a)
Pre-model year and mid-model year reports.
Except as provided in paragraph (c) of this section, each pre-model year report and the mid-model year report for each model year must contain the information required by § 537.7(a).
(b)
Supplementary report.
Except as provided in paragraph (c) of this section, each supplementary report for each model year must contain the information required by § 537.7(a)(1) and (2), as appropriate for the vehicle fleets produced by the manufacturer, in accordance with § 537.8(b)(1) through (4) as appropriate.
(c)
Exceptions.
The pre-model year report, mid-model year report, and supplementary report(s) submitted by an incomplete automobile manufacturer for any model year are not required to contain the information specified in § 537.7(c)(4)(xv) through (xviii) and (c)(5). The information provided by the incomplete automobile manufacturer under § 537.7(c) shall be according to base level instead of model type or carline.
(a)
Report submission requirements.
(1) Manufacturers must provide a report with the information required by paragraphs (b) and (c) of this section for each domestic and imported passenger automobile fleet, as specified in part 531 of this chapter, for the current model year.
(2) Manufacturers must provide a report with the information required by paragraphs (b) and (c) of this section for each non-passenger automobile fleet, as specified in part 533 of this chapter, for the current model year.
(3) For model year 2023 and later, for passenger automobiles specified in part 531 and non-passenger automobiles specified in part 533 of this chapter, manufacturers must provide the information for pre-model and mid-model year reports in accordance with the NHTSA CAFE Projections Reporting Template (OMB Control No. 2127-0019, NHTSA Form 1474). The required reporting template can be downloaded from NHTSA's website.
(i) Manufacturers are only required to provide the actual information on vehicles and technologies in production at the time the pre- and mid-model year reports are required. Otherwise, manufacturers must provide reasonable estimates or updated estimates where possible for pre-and mid-model year reports.
(ii) Manufacturers should attempt not to omit data, which should only be the done for products pending production and with unknown information at the time CAFE reports are prepared.
(b)
Projected average and required fuel economy.
(1) Manufacturers must state the projected average fuel economy for the manufacturer's automobiles determined in accordance with § 537.9 and based upon the fuel economy values and projected sales figures provided under paragraph (c)(2) of this section.
(2) Manufacturers must state the projected final average fuel economy that the manufacturer anticipates having if changes implemented during the model year will cause that average to be different from the average fuel economy projected under paragraph (b)(1) of this section.
(3) Manufacturers must state the projected required fuel economy for the manufacturer's passenger automobiles and non-passenger automobiles determined in accordance with §§ 531.5(a) and 533.5 of this chapter and based upon the projected sales figures provided under paragraph (c)(2) of this section. For each unique model type and footprint combination of the manufacturer's automobiles, the manufacturer must provide the information specified in paragraphs (b)(3)(i) and (ii) of this section in tabular form. The manufacturer must list the model types in order of increasing average inertia weight from top to bottom down the left side of the table and list the information categories in the order specified in paragraphs (b)(3)(i) and (ii) of this section from left to right across the top of the table. Other formats, such as those accepted by the Environmental Protection Agency (EPA), which contain all the information in a readily identifiable format, are also acceptable. For model year 2023 and later, for each unique model type and footprint combination of the manufacturer's automobiles, the manufacturer must provide the information specified in paragraphs (b)(3)(i) and (ii) of this section in accordance with the CAFE Projections Reporting Template (OMB Control No. 2127-0019, NHTSA Form 1474).
(i) In the case of passenger automobiles, manufacturers must report the following:
(A) Beginning model year 2013, base tire as defined in § 523.2 of this chapter;
(B) Beginning model year 2013, front axle, rear axle, and average track width as defined in § 523.2 of this chapter;
(C) Beginning model year 2013, wheelbase as defined in § 523.2 of this chapter;
(D) Beginning model year 2013, footprint as defined in § 523.2 of this chapter; and
(E) The fuel economy target value for each unique model type and footprint entry listed in accordance with the equation provided in part 531 of this chapter.
(ii) In the case of non-passenger automobiles, manufacturers must report the following:
(A) Beginning model year 2013, base tire as defined in § 523.2 of this chapter;
(B) Beginning model year 2013, front axle, rear axle, and average track width as defined in § 523.2 of this chapter;
( printed page 62288)
(C) Beginning model year 2013, wheelbase as defined in § 523.2 of this chapter;
(D) Beginning model year 2013, footprint as defined in § 523.2 of this chapter; and
(E) The fuel economy target value for each unique model type and footprint entry listed in accordance with the equation provided in part 533 of this chapter.
(4) Manufacturers must state the projected final required fuel economy that the manufacturer anticipates having if changes implemented during the model year will cause the targets to be different from the target fuel economy projected under paragraph (b)(3) of this section.
(5) Manufacturers must state whether the manufacturer believes that the projections it provides under paragraphs (b)(2) and (4) of this section, or if it does not provide an average or target under paragraphs (b)(2) and (4), the projections it provides under paragraphs (b)(1) and (3) of this section, sufficiently represent the manufacturer's average and target fuel economy for the current model year for purposes of the Act. In the case of a manufacturer that believes that the projections are not sufficiently representative for the purpose of determining the projected average fuel economy for the manufacturer's automobiles, the manufacturers must state the specific nature of any reason for the insufficiency and the specific additional testing or derivation of fuel economy values by analytical methods believed by the manufacturer necessary to eliminate the insufficiency and any plans of the manufacturer to undertake that testing or derivation voluntarily and submit the resulting data to EPA under 40 CFR 600.509-12.
(c)
Model type and configuration fuel economy and technical information.
(1) For each model type of the manufacturer's automobiles, the manufacturers must provide the information specified in paragraph (c)(2) of this section in tabular form. List the model types in order of increasing average inertia weight from top to bottom down the left side of the table and list the information categories in the order specified in paragraph (c)(2) of this section from left to right across the top of the table. For model year 2023 and later, CAFE reports required by this part shall for each model type of the manufacturer's automobiles provide the information specified in paragraphs (c)(2) and (4) of this section using the NHTSA CAFE Projections Reporting Template (OMB Control No. 2127-0019, NHTSA Form 1474) and list the model types in order of increasing average inertia weight from top to bottom.
(2)(i) Combined fuel economy; and
(ii) Projected sales for the current model year and total sales of all model types.
(3) For pre-model year reports not subject to § 537.5(d) of this chapter, for each vehicle configuration whose fuel economy was used to calculate the fuel economy values for a model type under paragraph (c)(2) of this section, manufacturers must provide the information specified in paragraph (c)(4) of this section.
(4)(i) Loaded vehicle weight;
(ii) Equivalent test weight;
(iii) Engine displacement, liters;
(iv) Society of Automotive Engineers (SAE) net rated power, kilowatts;
(v) SAE net horsepower;
(vi) Engine code;
(vii) Fuel system (number of carburetor barrels or, if fuel injection is used, so indicate);
(viii) Emission control system;
(ix) Transmission class;
(x) Number of forward speeds;
(xi) Existence of overdrive (indicate yes or no);
(xii) Total drive ratio (N/V);
(xiii) Axle ratio;
(xiv) Combined fuel economy;
(xv) Projected sales for the current model year;
(xvi)(A) In the case of passenger automobiles:
(
1) Interior volume index, determined in accordance with subpart D of 40 CFR part 600; and
(
2) Body style;
(B) In the case of non-passenger automobiles:
(
1) All functional ability characteristic metrics described in paragraph (c)(5)(i) of this section; and
(
2) All off-highway characteristic metrics described in (c)(5)(ii) of this section;
(xvii) Frontal area;
(xviii) Road load power at 50 miles per hour, if determined by the manufacturer for purposes other than compliance with this part to differ from the road load setting prescribed in 40 CFR 86.177-11(d); and
(xix) Optional equipment that the manufacturer is required under 40 CFR parts 86 and 600 to have actually installed on the vehicle configuration, or the weight of which must be included in the curb weight computation for the vehicle configuration under 40 CFR parts 86 and 600, for fuel economy testing purposes.
(5) For each vehicle subconfiguration of non-passenger automobile classified under part 523 of this chapter, provide the following information described in paragraphs (c)(5)(i) and (ii) of this section:
(i) For an automobile not manufactured primarily for transporting 10 or fewer passengers, determined by the presence of at least one chief non-passenger characteristic in accordance with § 523.5(a) of this chapter, provide:
(A) A yes or no confirmation for whether the number of designated seating positions is greater than ten. If yes, provide the number of designated seating positions;
(B) A yes or no confirmation for the presence of temporary living accommodations, such as a bed, sink, stove, refrigerator, or toilet. If yes, list the provided accommodations;
(C) A yes or no confirmation for the ability to transport property on an open bed. If yes, provide bed width and length in inches, measured to the nearest tenth of inch;
(D) Maximum passenger carrying volume and minimum cargo carrying volume, as defined in § 523.2 of this chapter, with all seats, as sold to the first retail purchaser, installed and in their passenger-carrying position; and
(E) For automobiles manufactured in model year 2022 through model year 2029:
(
1) A yes or no confirmation for the presence of three or more rows of designated seating positions;
(
2) A yes or no confirmation that the 2nd and 3rd row seating can be removed, stowed, or folded as described in § 523.5(a)(5) of this chapter;
(3)
A yes or no confirmation that the 2nd and 3rd rows create a flat, level surface when in their cargo-carrying configuration as described in § 523.5(a)(5) of this chapter.
(F) For automobiles manufactured in 2030 and beyond, provide the following for the calculation of the light duty work factor (LDWF):
(1)
Curb weight of the vehicle with the lowest calculated LDWF within the vehicle subconfiguration;
(2)
Gross vehicle weight rating (GVWR);
(3)
Trailer weight rating (TWR) determined in accordance with SAE J2807 NOV2024 (incorporated by reference, see § 523.11). If the vehicle subconfiguration has vehicles with different TWRs, provide the TWR for the vehicle with the lowest calculated LDWF.
(ii) For an automobile capable of off-highway operation, provide the features in paragraphs (c)(5)(ii)(A) through (D) of this section in accordance with § 523.5(b) of this chapter:
(A) A yes or no confirmation for the presence of 4-wheel drive;
(B) The gross vehicle weight rating (GVWR) in pounds;
( printed page 62289)
(C) Measured or calculated in accordance with § 523.5(b)(2), provide the value of:
(
1) Approach angle rounded to the nearest 0.1 degrees;
(
2) Breakover angle rounded to the nearest 0.1 degrees;
(
3) Departure angle rounded to the nearest 0.1 degrees; and
(
4) Running clearance rounded to the nearest 0.1 centimeters.
(D) For automobiles manufactured through model year 2029, measured or calculated in accordance with § 523.5(b)(2), provide the value of:
(
1) Front axle clearance rounded to the nearest 0.1 centimeters; and
(
2) Rear axle clearance rounded to the nearest 0.1 centimeters.
(6) Manufacturers must determine the fuel economy values provided under paragraphs (c)(2) and (4) of this section in accordance with § 537.9.
(7) For the model years specified in paragraphs (c)(7)(i) through (iii) of this section, manufacturers must identify any air-conditioning (AC), off-cycle and full-size pick-up truck technologies used each model year to calculate the average fuel economy specified in 40 CFR 600.510-12.
(i) For automobiles manufactured in years in which a manufacturer may generate fuel consumption improvement values pursuant to 40 CFR part 600, each manufacturer must provide a list of each air conditioning (AC) efficiency improvement technology utilized in its fleet(s) of vehicles for each model year for which the manufacturer qualifies for fuel consumption improvement values. For each technology identify vehicles by make and model types that have the technology, which compliance category those vehicles belong to, and the number of vehicles for each model equipped with the technology. For each compliance category (domestic passenger automobile, imported passenger automobile, and non-passenger automobile), report the AC fuel consumption improvement value in gallons/mile in accordance with the applicable equation specified in 40 CFR part 600.
(ii) For automobiles manufactured in model years in which a manufacturer may generate fuel consumption improvement values pursuant to 40 CFR part 600, each manufacturer must provide a list of off-cycle efficiency improvement technologies utilized in its fleet(s) of vehicles for each model year that is pending or approved by EPA for which the manufacturer qualifies for fuel consumption improvement values. For each technology, manufacturers must identify vehicles by make and model types that have the technology, which compliance category those vehicles belong to, the number of vehicles for each model equipped with the technology, and the associated off-cycle credits (grams/mile) available for each technology. For each compliance category (domestic passenger automobile, imported passenger automobile, and non-passenger automobile), manufacturers must calculate the fleet off-cycle fuel consumption improvement value in gallons/mile in accordance with the applicable equation specified in 40 CFR part 600.
(iii) For model years up to 2024, each manufacturer must provide a list of full-size pickup trucks in its fleet that meet the mild and strong hybrid vehicle definitions. For each mild and strong hybrid type, manufacturers must identify vehicles by make and model types that have the technology, the number of vehicles produced for each model equipped with the technology, the total number of full-size pickup trucks produced with and without the technology, the calculated percentage of hybrid vehicles relative to the total number of vehicles produced, and the associated full-size pickup truck credits (grams/mile) available for each technology. For the non-passenger automobile compliance category, manufacturers must calculate the fleet pickup truck fuel consumption improvement value in gallons/mile in accordance with the applicable equation specified in 40 CFR part 600.
(a)(1) Except as provided in paragraph (d) of this section, each manufacturer whose most recently submitted mid-model year report contained an average fuel economy projection under § 537.7(b)(2) or, if no average fuel economy was projected under that section, under § 537.7(b)(1) that was not less than the applicable average fuel economy standard in this chapter and who now projects an average fuel economy that is less than the applicable standard in this chapter shall file a supplementary report containing the information specified in paragraph (b)(1) of this section.
(2) Except as provided in paragraph (d) of this section, each manufacturer that determines that its average fuel economy for the current model year as projected under § 537.7(b)(2) or, if no average fuel economy was projected under § 537.7(b)(2), as projected under § 537.7(b)(1), is less representative than the manufacturer previously reported it to be under § 537.7(b)(3), this section, or both, shall file a supplementary report containing the information specified in paragraph (b)(2) of this section.
(3) For model years through 2022, each manufacturer whose mid-model year report omits any of the information specified in § 537.7(b) or (c) shall file a supplementary report containing the information specified in paragraph (b)(3) of this section.
(4) Starting model year 2023, each manufacturer whose mid-model year report omits any of the information shall resubmit the information with other information required in accordance with the NHTSA CAFE Projections Reporting Template (OMB Control No. 2127-0019, NHTSA Form 1474).
(b)(1) The supplementary report required by paragraph (a)(1) of this section must contain:
(i) Such revisions of and additions to the information previously submitted by the manufacturer under this part regarding the automobiles whose projected average fuel economy has decreased as specified in paragraph (a)(1) of this section as are necessary—
(A) To reflect the change and its cause; and
(B) To indicate a new projected average fuel economy based upon these additional measures.
(ii) An explanation of the cause of the decrease in average fuel economy that led to the manufacturer's having to submit the supplementary report required by paragraph (a)(1) of this section.
(2) The supplementary report required by paragraph (a)(2) of this section must contain:
(i) A statement of the specific nature of and reason for the insufficiency in the representativeness of the projected average fuel economy;
(ii) A statement of specific additional testing or derivation of fuel economy values by analytical methods believed by the manufacturer necessary to eliminate the insufficiency; and
(iii) A description of any plans of the manufacturer to undertake that testing or derivation voluntarily and submit the resulting data to the EPA under 40 CFR 600.509-12.
(3) The supplementary report required by paragraph (a)(3) of this section must contain:
(i) All of the information omitted from the mid-model year report under § 537.6(c); and
(ii) Such revisions of and additions to the information submitted by the manufacturer in its mid-model year report regarding the automobiles produced during the current model year as are necessary to reflect the information provided under paragraph (b)(3)(i) of this section.
( printed page 62290)
(4) The supplementary report required by paragraph (a)(4) of this section must contain:
(i) All information omitted from the mid-model year reports under § 537.6(c); and
(ii) Such revisions of and additions to the information submitted by the manufacturer in its pre-model or mid-model year reports regarding the automobiles produced during the current model year as are necessary to reflect the information provided under paragraph (b)(4)(i) of this section.
(c) Each report required by paragraph (a)(1), (2), (3), or (4) of this section must be submitted in accordance with § 537.5(c) not more than 45 days after the date on which the manufacturer determined, or could have determined with reasonable diligence, that the report was required.
(d) A supplementary report is not required to be submitted by the manufacturer under paragraph (a)(1) or (2) of this section:
(1) With respect to information submitted under this part before the most recent mid-model year report submitted by the manufacturer under this part; or
(2) When the date specified in paragraph (c) of this section occurs after the day by which the pre-model year report for the model year immediately following the current model year must be submitted by the manufacturer under this part.
(e) For model years 2008, 2009, and 2010, each manufacturer of non-passenger automobiles, as that term is defined in § 523.5 of this chapter, shall submit a report, not later than 45 days following the end of the model year, indicating whether the manufacturer is opting to comply with § 533.5(f) or (g) of this chapter.
Determination of fuel economy values and average fuel economy.
(a)
Vehicle subconfiguration fuel economy values.
(1) For each vehicle subconfiguration for which a fuel economy value is required under paragraph (c) of this section and has been determined and approved under 40 CFR part 600, the manufacturer shall submit that fuel economy value.
(2) For each vehicle subconfiguration specified in paragraph (a)(1) of this section for which a fuel economy value approved under 40 CFR part 600, does not exist, but for which a fuel economy value determined under 40 CFR part 600 exists, the manufacturer shall submit that fuel economy value.
(3) For each vehicle subconfiguration specified in paragraph (a)(1) of this section for which a fuel economy value has been neither determined nor approved under 40 CFR part 600, the manufacturer shall submit a fuel economy value based on tests or analyses comparable to those prescribed or permitted under 40 CFR part 600 and a description of the test procedures or analytical methods used.
(4) For each vehicle configuration for which a fuel economy value is required under paragraph (c) of this section and has been determined and approved under 40 CFR part 600, the manufacturer shall submit that fuel economy value.
(b)
Base level and model type fuel economy values.
For each base level and model type, the manufacturer shall submit a fuel economy value based on the values submitted under paragraph (a) of this section and calculated in the same manner as base level and model type fuel economy values are calculated for use under subpart F of 40 CFR part 600.
(c)
Average fuel economy.
Average fuel economy must be based upon fuel economy values calculated under paragraph (b) of this section for each model type and must be calculated in accordance with subpart F of 40 CFR part 600, except that fuel economy values for running changes and for new base levels are required only for those changes made or base levels added before the average fuel economy is required to be submitted under this part.
(a) A manufacturer may incorporate by reference in a report required by this part any document other than a report, petition, or application, or portion thereof submitted to any Federal department or agency more than two model years before the current model year.
(b) A manufacturer that incorporates by reference a document not previously submitted to the National Highway Traffic Safety Administration shall append that document to the report.
(c) A manufacturer that incorporates by reference a document shall clearly identify the document and, in the case of a document previously submitted to the National Highway Traffic Safety Administration, indicate the date on which and the person by whom the document was submitted to this agency.
Except as provided in § 537.12, any person may inspect the information and data submitted by a manufacturer under this part in the docket section of the National Highway Traffic Safety Administration. Any person may obtain copies of the information available for inspection under this section in accordance with the regulations of the Secretary of Transportation in part 7 of this title.
(a)
Treatment of confidential information.
Information made available under § 537.11 for public inspection does not include information for which confidentiality is requested under § 537.5(c)(7), is granted in accordance with section 505 of the Act and 5 U.S.C. 552(b) and is not subsequently released under paragraph (c) of this section in accordance with section 505 of the Act.
(b)
Denial of confidential treatment.
When the Administrator denies a manufacturer's request under § 537.5(c)(7) for confidential treatment of information, the Administrator gives the manufacturer written notice of the denial and reasons for it. Public disclosure of the information is not made until after the 10-day period immediately following the giving of the notice.
(c)
Release of confidential information.
After giving written notice to a manufacturer and allowing 10 days, when feasible, for the manufacturer to respond, the Administrator may make available for public inspection any information submitted under this part that is relevant to a proceeding under the Act, including information that was granted confidential treatment by the Administrator pursuant to a request by the manufacturer under § 537.5(c)(7).
PART 578—CIVIL AND CRIMINAL PENALTIES
6. The authority citation for part 578 continues to read as follows:
Civil penalties for violations of specified provisions of Title 49 of the United States Code.
* * * * *
(h) * * *
(2) Except as provided in 49 U.S.C. 32912(c), a manufacturer that violates a standard prescribed for a model year under 49 U.S.C. 32902 is liable to the United States Government for a civil penalty of $0 (for model years before
( printed page 62291)
model year 2019, the civil penalty is $5.50; for model years 2019 through 2021, the civil penalty is $14; for model year 2022 and later, the civil penalty is $0), multiplied by each .1 of a mile a gallon by which the applicable average fuel economy standard under that section exceeds the average fuel economy—
2.
Transportation Research Board and National Research Council, Effectiveness and Impact of Corporate Average Fuel Economy (CAFE) Standards, National Academies Press: Washington, DC (2002), available at:
www.nationalacademies.org/publications/10172
(accessed: June 18, 2026). This report describes at length and quantifies the potential safety problem with average fuel economy standards that specify a single numerical requirement for the entire industry, noting that smaller and lighter vehicles incentivized by those standards could be less safe for their occupants.
3.
In a hypothetical and simplified example, if the baseline passenger car fleet of vehicles with an identical footprint consisted of nine gasoline-powered vehicles achieving 30 mpg and one EV achieving 150 mpg, the baseline fleet to which stringency increases would apply would be measured at 42 mpg. When CAFE standards are set inconsistent with the statute because the analysis considers EV fuel economy, manufacturers of gasoline-powered vehicles would face a challenge in catching up to the overall fleet fuel economy, requiring disproportionate investment in fuel-saving technologies, and incentivizing the purchase of regulatory credits from the EV manufacturer.
4.
Section VI discusses NHTSA's amended regulatory definitions for passenger and non-passenger automobiles in detail and includes examples of manufacturers excluding or including specific features solely to meet regulatory definitions. Two examples discussed in more detail in Section VI include manufacturers discontinuing FWD versions of vehicles after NHTSA properly reclassified over one million FWD automobiles as passenger automobiles in line with EPCA and opting to instead manufacture only AWD or 4WD versions to keep more of their products in the non-passenger automobile fleets (74 FR 14196, Mar. 30, 2009), and manufacturers including aerodynamic technologies to increase on-highway functionality instead of opting to meet approach angle requirements, which would make the vehicle more capable of approaching off-highway obstacles and, thus, more off-highway capable.
5.
Non-plug-in hybrid vehicles are not dual-fueled vehicles under chapter 329 because any electricity generated by the electric motors or other electric components are generated solely by the petroleum-fueled engine and the batteries are incapable of charging from an external source: “a vehicle which is entirely dependent on a petroleum fuel for its motive power, regardless of whether electricity is used in the powertrain, is powered by petroleum.” 63 FR 66066 (Dec. 1, 1998).
12.
For a detailed discussion of the transition to new footprint-based standards curves as a result of vehicle reclassification please see Section III.A.
13.
Percentages in the table represent the year over year reduction in gal/mile applied to the mpg values on the target curves. The reduction in gal/mile results in an increased mpg.
14.
As an example, a vehicle owner who drives a light vehicle 15,000 miles per year and trades in a vehicle with fuel economy of 15 mpg for one with fuel economy of 20 mpg, will reduce their annual fuel consumption from 1,000 gallons to 750 gallons—saving 250 gallons annually. If, however, that owner trades in a vehicle with fuel economy of 30 mpg for one with fuel economy of 40 mpg, the owner's annual gasoline consumption would drop from 500 gallons/year to 375 gallons/year—a fuel savings of only 125 gallons even though the mpg improvement is twice as large. Going from 40 to 50 mpg would save only 75 gallons/year. Yet each additional fuel economy improvement becomes much more expensive as the easiest to achieve low-cost technological improvement options are exhausted.
16.
Generally, passenger cars have more stringent targets than light trucks regardless of footprint, and smaller vehicles will have more stringent targets than larger vehicles because smaller vehicles are generally more fuel efficient. No individual vehicle or vehicle model need meet its target exactly, but a manufacturer's compliance is determined by how its average fleet fuel economy compares to the average fuel economy of the targets of the vehicles it manufactures.
17.
NHTSA notes both that real-world fuel economy is generally 20-30 percent lower than the estimated required CAFE level stated above, because CAFE compliance is evaluated per 49 U.S.C. 32904(c) Testing and Calculation Procedures, which states that the EPA Administrator (responsible under EPCA/EISA for measuring vehicle fuel economy) must use the same procedures used for MY 1975 (weighted 55 percent urban cycle and 45 percent highway cycle) or comparable procedures. Colloquially, this is known as the 2-cycle test. The “real-world” or 5-cycle evaluation includes the 2-cycle tests and three additional tests that are used to adjust the city, and highway estimates to account for higher speeds, AC use, and colder temperatures. In addition to calculating vehicle fuel economy, EPA is responsible for providing the fuel economy data that is used on the fuel economy label on all new cars and light trucks, which uses the “real-world” values. In 2006, EPA revised the test methods used to determine fuel economy estimates (city and highway) appearing on the fuel economy label of all new cars and light trucks sold in the United States, effective with MY 2008 vehicles.
18.
NHTSA's analysis reflects that almost all manufacturers make the technological improvements prompted by CAFE standards at times that coincide with existing product “refresh” and “redesign” cycles, rather than unrealistically applying new technology every year regardless of those cycles. It is significantly more cost effective to make fuel economy-improving technology updates when a vehicle is being updated. See the Final TSD and preamble Section II for additional discussion about manufacturer refresh and redesign cycles.
19.
There is no legal requirement for combined passenger car and light truck fleets, but NHTSApresents information this way in recognition of the fact that many readers will be accustomed to seing such a value.
22.
In rulemakings such as this one, where the agency is reducing the stringency of CAFE standards, the application of additional fuel-saving technologies may no longer be necessary when standards are reduced relative to a reference baseline level. Therefore any costs associated with meeting higher fuel economy standards in that baseline become cost savings when standards decrease in stringency. Negative benefits reflect a reduction in this category, while negative entries for costs reflect savings to manufacturers and vehicle buyers. Overall positive net benefits indicate that the reduction in benefits is outweighed by the total cost savings.
23.
The bulk of the analysis for passenger cars and light trucks presents a “model year” perspective rather than a “calendar year” perspective. The model year perspective considers the lifetime impacts attributable to all passenger cars and light trucks produced through MY 2031, accounting for the operation of these vehicles over their entire lives (with some MY 2031 vehicles estimated to be in service as late as CY 2070). This approach emphasizes the role of the model years for which new standards are being finalized. The calendar year perspective, on the other hand, includes the annual impacts attributable to all vehicles estimated to be in service in each calendar year for which the analysis includes a representation of the entire registered light-duty fleet. For this final rule, this calendar year perspective covers each of CYs 2024-2050. Compared to the model year perspective, the calendar year perspective includes model years of vehicles produced in the longer term, beyond those model years for which standards are being finalized.
27.
Administratively closed refers to model years for which the Secretary of Transportation has provided notification pursuant to 49 U.S.C. 32903(b)(2)(B), specifying the penalty due for the average fuel economy of that manufacturer being less than the applicable standard prescribed under sec. 32902 of that title.
35.
For a detailed discussion of the transition to new footprint-based standards curves as a result of vehicle reclassification please see Section III.A.
36.
Vehicle footprint is roughly measured as the rectangle that is made by the four points where the vehicle's tires touch the ground. Generally, passenger cars have more stringent targets than light trucks regardless of footprint, and smaller vehicles will have more stringent targets than larger vehicles. No individual vehicle or vehicle model need meet its target exactly, but a manufacturer's compliance is determined by how its average fleet fuel economy compares to the average fuel economy of the targets of the vehicles it manufactures.
38.
For a detailed discussion of the transition to new footprint-based standards curves as a result of vehicle reclassification, please see Section III.A.
52.
Because the CAFE Model is publicly available, anyone can develop their own initial forecast (or other inputs) for the Model to use. The DOT-developed Market Data Input File that contains the forecast for this final rule is available on NHTSA's website at
www.nhtsa.gov/corporate-average-fuel-economy/cafe-compliance-and-effects-modeling-system
(accessed: May 25, 2026).
56.
As part of the Argonne simulation effort, individual technology combinations simulated in Autonomie were paired with Argonne's BatPaC model to estimate the battery cost associated with each technology combination based on characteristics of the simulated vehicle and its level of electrification. Information regarding Argonne's BatPaC model is available at
www.anl.gov/cse/electrochemical-chemical-TEA.
In addition, the impact of engine technologies on fuel consumption, torque, and other metrics was characterized using GT-POWER simulation modeling in combination with other engine modeling that was conducted by IAV Automotive Engineering, Inc. (IAV). The engine characterization “maps” resulting from this analysis were used as inputs for the Autonomie full-vehicle simulation modeling. Information regarding GT-POWER is available at
www.gtisoft.com/gt-power/.
57.
Note that the CAFE Model does not simulate the potential for manufacturers to carry CAFE credits back (
i.e.,
borrow) from future model years or acquire and use CAFE compliance credits from other manufacturers. NHTSA believes that there is significant uncertainty in how manufacturers may choose to use these particular flexibilities in the future: for example, though it is reasonably foreseeable that a manufacturer who over-complies in 1 year may “coast” through several subsequent years relying on that prior improvement rather than continuing to make technology improvements year after year, it is harder to assume with confidence that manufacturers will rely on future technology investments to offset prior-year shortfalls, or whether and how manufacturers will trade credits with market competitors rather than make their own technology investments.
58.
NHTSA reviewed manufacturers' announcements regarding nameplate refresh and redesign for MYs 2025 and 2026. If the actual refresh or redesign misaligned with what was in the Market Data Input File for the NPRM, NHTSA updated the Market Data Input File to reflect the actual refresh or redesign year of the nameplate. The specific updates for nameplate refresh and redesign years can be found in Docket No. NHTSA-2025-0491 titled, “2026_FRM_Refresh_Redesign_Update.xlsx.”
60.
To ensure EVs were excluded from the analysis, EV platforms were realigned to not share a powertrain with an ICE, SHEV, or PHEV variant. If a vehicle platform included both ICE and EV powertrains, the EV variant(s) were assigned its own platform.
63.
As discussed in prior rulemakings, a manufacturer may have some vehicle models that exceed their target and some that are below their target. Compliance with a fleet average standard is determined by comparing the fleet average standard (based on the production-weighted average of the target levels for each model) with fleet average performance (based on the production-weighted average of the performance of each model). This is inherent in the statutory structure of CAFE, which requires NHTSA to set
corporate average
standards.
71.
Fox, J. and Monette, G., Generalized collinearity diagnostics,
Journal of the American Statistical Association,
Vol. 87(417): 178-83 (1992),
doi.org/10.1080/01621459.1992.10475190
(accessed: July 28, 2026).
78.
See Merriam-Webster “algorithm.” Broadly, an algorithm is a step-by-step procedure for solving a problem or accomplishing some end. More specifically, an algorithm is a procedure for solving a mathematical problem (as of finding the greatest common divisor) in a finite number of steps that frequently involves repetition of an operation.
79.
Per 49 U.S.C. 32902(h), dedicated alternative fueled vehicles, such as EVs, are excluded from this analysis. For dual-fueled vehicles, the analysis uses a fuel economy value for the vehicles operating only on gasoline or diesel fuel.
Id.
82.
As explained throughout this section, a NHTSA input is a specific number or datapoint used by the Model, and NHTSA's assumptions are based on
judgment after careful consideration of available evidence. An assumption can be an underlying reason for the
use
of a specific datapoint, function, or modeling process. For example, an input might be the fuel economy value of the Ford Mustang, whereas the assumption is that the Ford Mustang's fuel economy value reported in Ford's CAFE compliance data should be used in NHTSA's modeling.
83.
The Argonne report is titled “Vehicle Simulation Process to Support the Analysis for MY 2027 and Beyond CAFE and MY 2030 and Beyond HDPUV FE Standards.” However, for ease of use and consistency with the Final TSD it is referred to as “CAFE Analysis Autonomie Documentation.”
85.
This file also includes information about the amount of fuel consumption improvement values a manufacturer currently generates for compliance purposes under EPA's regulations and information on EPA's regulatory limits on generating FCIVs for each model year in the analysis. For this analysis the FCIVs will go to 0 in MY 2028 for the regulatory alternatives, as discussed in preamble Section II.D.8.
89.
In general, most vehicles produced for sale in the United States have been designed to use “regular” gasoline, or 87 octane. See EIA, Gasoline Explained: What is octane?, last revised: Nov. 17, 2022, available at:
www.eia.gov/energyexplained/gasoline/octane-in-depth.php
(accessed: May 25, 2026).
90.
Manufacturers could increase their production of one type of vehicle with higher fuel economy, like the hybrid version of a conventional vehicle model, to meet the standards. For example, Ford has conventional and hybrid versions of its F-150 pickup truck, and Toyota has conventional, hybrid, and plug-in hybrid versions of its RAV4 sport utility vehicle.
91.
For each technology option, the analysis includes distinct technology cost and effectiveness values for 10 different types of vehicles, resulting in nearly half a million different technology effectiveness and cost data points.
92.
TURBO0 is the baseline turbocharged engine and TURBOD is TURBO0 with the addition of cylinder deactivation (DEAC). Chapter 3 of the Final TSD provides more discussion on engine technologies.
93.
ADEACD is a dual-overhead camshaft engine with advanced cylinder deactivation. Chapter 3 of the Final TSD provides more discussion on engine technologies.
94.
Each numeric engine, transmission, or platform code designates important information about that vehicle's technology; for example, a vehicle's 6-digit transmission code includes information about the manufacturer, the vehicle's drive configuration (
e.g.,
front-wheel drive, all-wheel drive, 4WD, or rear-wheel drive), transmission type, number of gears (
i.e.,
a 6-speed transmission has 6 gears), and the transmission variant.
99.
Like the transmission codes discussed above, the engine codes include information identifying the manufacturer, engine displacement (how many liters the engine is), whether the engine is naturally aspirated or force-inducted (turbocharged), and other unique engine attributes.
102.
NHTSA is statutorily required to use the two-cycle tests to measure vehicle fuel economy in the CAFE program.
See 49 U.S.C. 32904(c) (“Testing and calculation procedures. . . . [T]he Administrator shall use the same procedures for passenger automobiles the Administrator used for model year 1975 (weighted 55 percent urban cycle and 45 percent highway cycle), or procedures that give comparable results.”).
105.
A parallel strong hybrid powertrain is fundamentally similar to a conventional powertrain but adds one electric motor to improve efficiency. Final TSD Chapter 3 shows all of the parallel strong hybrid powertrain options that NHTSA has modeled in this analysis.
108.
Engine knock occurs when combustion of some of the air/fuel mixture in the cylinder does not result from propagation of the flame front ignited by the spark plug; rather one or more pockets of air/fuel mixture explode outside of the envelope of the normal combustion front. Engine knock can result in unsteady operation and damage to the engine.
109.
A2Mac1: Automotive Benchmarking (proprietary data), available at:
www.a2mac1.com
(accessed: May 28, 2026). A2Mac1 is subscription-based benchmarking service that conducts vehicle and component teardown analyses. Annually, A2Mac1 removes individual components from production vehicles, such as oil pans, electric machines, engines, and transmissions, among many other components. These components are weighed and documented for key specifications, which are then available to subscribers.
112.
EPA, Proposed Determination on the Appropriateness of the Model Year 2022-2025 Light-Duty Vehicle Greenhouse Gas Emissions Standards under the Midterm Evaluation: Technical Support Document, EPA-420-R-16-020, EPA: Washington, DC, pp. 2-265—2-266 (2016), available at:
downloads.regulations.gov/EPA-HQ-OAR-2022-0829-0230/attachment_1.pdf
(accessed: May 28, 2026).
113.
North American Council for Freight Efficiency, Research & Analysis Are Fundamental, last revised: 2025, available at:
www.nacfe.org/research/overview
(accessed: May 28, 2026).
114.
See NHTSA-2021-0053-1492, at 134 (“Vehicle design parameters are never static. With each new generation of a vehicle, manufacturers seek to improve vehicle utility, performance, and other characteristics based on research of customer expectations and desires, and to add innovative features that improve the customer experience. [NHTSA and EPA] have historically sought to maintain the performance characteristics of vehicles modeled with fuel economy-improving technologies. Auto Innovators encourages the agencies to maintain a performance-neutral approach to the analysis, to the extent possible. Auto Innovators appreciates that the agencies continue to consider high-speed acceleration, gradeability, towing, range, traction, and interior room (including headroom) in the analysis when sizing powertrains and evaluating pathways for road-load reductions. All of these parameters should be considered separately, not just in combination. (For example, we do not support an approach where various acceleration times are added together to create a single `performance' statistic. Manufacturers must provide all types of performance, not just one or two to the detriment of others.)”).
115.
SAE, Performance Requirements for Determining Tow-Vehicle Gross Combination Weight Rating and Trailer Weight Rating, SAE Standard J2807_202411, SAE International: Warrendale, PA (2024), available at:
doi.org/10.4271/J2807_202411
(accessed: May 28, 2026).
118.
Merriam-Webster, Definition: Regression analysis, last revised: 2026, available at:
www.merriam-webster.com/dictionary/regression%20analysis
(accessed: May 28, 2026) (“the use of mathematical and statistical techniques to estimate one variable from another especially by the application of regression coefficients, regression curves, regression equations, or regression lines to empirical data”). In this case, NHTSA is estimating engine weight by looking at the relationship between engine weight and engine power.
119.
2015 NAS Report, at p. 256. It is likely that manufacturers have made improvements in the product lifetime and development cycles for engines since this NAS report and the report that NAS relied on, but NHTSA does not have data on how much. NHTSA believes that it is still reasonable to conclude that generating an all-new engine or transmission design with little to no carryover from the previous generation would be a notable investment.
124.
49 U.S.C. 32904(c) (EPA “shall measure fuel economy for each model and calculate average fuel economy for a manufacturer under testing and calculation procedures prescribed by the Administrator. However, except under section 32908 of this title, the Administrator shall use the same procedures for passenger automobiles the Administrator used for model year 1975 (weighted 55 percent urban cycle and 45 percent highway cycle), or procedures that give comparable results.”).
125.
NHTSA applied a certain percentage difference between the 2-cycle test value and 5-cycle test value to represent the gap in compliance fuel economy and real-world fuel economy. See FRIA Chapter 4.3.1 for further discussion.
127.
Rogozhin, A.
et al.,
Automobile Industry Retail Price Equivalent and Indirect Cost Multipliers, EPA-420-R-09-003, EPA: Ann Arbor, MI (2009), available at:
nepis.epa.gov/Exe/ZyPDF.cgi/P100AGJ1.PDF?Dockey=P100AGJ1.PDF
(accessed: May 28, 2026); Spinney, B.
et al.,
Advanced Air Bag Systems Cost, Weight, and Lead Time Analysis Summary Report, National Highway Traffic Safety Administration: Washington, DC (1999).
129.
See The Alliance, Docket No. EPA-HQ-OAR-2018-0283-6186, at 143 (Oct. 26, 2018) (“The Alliance supports the use of retail price equivalents in the compliance cost modeling”).
134.
Grieco, P.
et al.,
The evolution of market power in the U.S. automobile industry,
The Quarterly Journal of Economics,
Vol. 139(2): pp. 1201-53 (2024), available at:
doi.org/10.1093/qje/qjad047
(accessed: May 28, 2026).
137.
NHTSA uses statically projected cumulative volume production estimates because the CAFE Model does not support dynamic projections of cumulative volume at this time.
138.
Simons, J., Cost and Weight Added by the Federal Motor Vehicle Safety Standards for MY 1968-2012 Passenger Cars and LTVs, Report No. DOT HS 812 354, NHTSA: Washington D.C., pp. 30-33 (2017), available at:
downloads.regulations.gov/NHTSA-2021-0053-1643/attachment_44.pdf
(accessed: May 28, 2026); Argote, L.
et al.,
The Acquisition and Depreciation of Knowledge in a Manufacturing Organization—Turnover and Plant Productivity, Working Paper, Graduate School of Industrial Administration, Carnegie Mellon University (1997); Benkard, C., Learning and forgetting: the dynamics of aircraft production,
The American Economic Review,
Vol. 90(4): pp. 1034-54 (2000), available at:
www.aeaweb.org/articles?id=10.1257/aer.90.4.1034
(accessed: May 28, 2026); Epple, D.
et al.,
Organizational learning curves: a method for investigating intra-plant transfer of knowledge acquired through learning by doing,
Organization Science,
Vol. 2(1): pp. 58-70 (1991), available at:
www.jstor.org/stable/2634939
(accessed: May 28, 2026); Epple, D.
et al.,
An empirical investigation of the microstructure of knowledge acquisition and transfer through learning by doing,
Operations Research,
Vol. 44(1): pp. 77-86 (1996), available at:
ideas.repec.org/a/inm/oropre/v44y1996i1p77-86.html
(accessed: May 28, 2026); Levitt, S.
et al.,
Toward an understanding of learning by doing: evidence from an automobile assembly plant,
Journal of Political Economy,
Vol. 121(4): pp. 643-81 (2013), available at:
www.nber.org/papers/w18017
(accessed: May 28, 2026).
141.
26 U.S.C. 45X. If a manufacturer produces a battery module without battery cells, it is eligible to claim up to $45 per kWh for the battery module. Two other provisions of the AMPC are not modeled at this time; (1) a credit equal to 10 percent of the manufacturing cost of electrode active materials and (2) a credit equal to 10 percent of the manufacturing cost of critical minerals for battery production. NHTSA is not modeling these credits directly because of how battery costs are estimated, and to avoid the potential to double-count the tax credits if they are included into other analyses that feed into NHTSA's inputs. For a full account of the credit and any limitations, please refer to the statutory text.
144.
Vehicle price and consumer income limitations apply to section 30D credits, as well. See Congressional Research Service, Tax Provisions in the Inflation Reduction Act of 2022 (H.R. 5376) (2022), available at:
www.congress.gov/crs-product/R47202
(accessed: May 28, 2026).
145.
See Internal Revenue Service, Frequently Asked Questions Related to New, Previously-Owned and Qualified Commercial Clean Vehicle Credits, FS-2022-42, Media Relations Office: Washington, DC, Q4 and Q8 (2022), available at:
www.irs.gov/pub/taxpros/fs-2022-42.pdf
(accessed: May 28, 2026).
151.
U.S. Department of Energy, Estimating Federal Tax Incentives for Heavy Duty Electric Vehicle Infrastructure and for Acquiring Electric Vehicles Weighing Less Than 14,000 Pounds, Memorandum (2024), available at:
downloads.regulations.gov/EERE-2021-VT-0033-0056/content.pdf
(May 28, 2026).
153.
States have additional mechanisms to amend or remove tax incentives or rebates. Sometimes, even after these programs are enacted, uncertainty persists. See Farah, N., The Untimely Death of America's “Most Equitable” EV Rebate, last revised: Jan. 30, 2023, available at:
www.eenews.net/articles/the-untimely-death-of-americas-most-equitable-ev-rebate/
(accessed: May 28, 2026).
154.
This fuel cost savings is calculated using the miles driven over 3 years, based on the assumption that consumers are likely to buy vehicles with fuel economy-improving technology that pays for itself within 3 years.
156.
Pilla, S.
et al.,
Parametric Design Study of McPherson Strut to Stabilizer Bar Link Bracket Weld Fatigue Using Design for Six Sigma and Taguchi Approach, SAE Technical Paper 2021-01-0235, SAE International (2021), available at:
doi.org/10.4271/2021-01-0235
(accessed: May 28, 2026).
157.
Note: Due to the diversity of definitions industry employs for technology terms, or in describing the specific application of technology, the terms defined here may differ from how the technology is defined in some parts of the industry.
159.
Ibid,
containing a complete discussion on fundamentals of engine characteristics, such as torque, torque maps, engine load, power density, brake mean effective pressure (BMEP), combustion cycles, and components.
160.
See Tula Technology, Inc., Dynamic Skip Fire, last revised: 2026, available at:
www.tulatech.com/combustion-engine/
(accessed: May 28, 2026), discussing how the company's proprietary cylinder deactivation technology operates in real-world situations. NHTSA's modeled ADEAC system is not based on this specific system, and therefore the effectiveness improvement is different in NHTSA's analysis than with this system; however, the theory still applies.
162.
LIVC is a method manufacturers use to reduce the effective compression ratio and allow the expansion ratio to be greater than the compression ratio resulting in improved fuel economy but reduced power density. Further technical discussion on HCR and Atkinson engines are discussed in Final TSD Chapter 3.1.1.2.3. The 2015 NAS Report, Appendix D, includes a short discussion on thermodynamic engine cycles.
163.
Note that even if an engine has a compression ratio of 12.5:1 or greater, it does not necessarily mean it is an HCR engine in NHTSA's analysis, as discussed below. NHTSA looks at a number of factors to perform baseline engine assignments.
164.
Variable valve actuation is a general term used to describe any single or combination of VVT, VVL, and variable valve duration used to dynamically alter an engine's valvetrain during operation.
165.
Engine knock in spark ignition engines occurs when combustion of some of the air/fuel mixture in the cylinder does not result from propagation of the flame front ignited by the spark plug rather, one or more pockets of air/fuel mixture explode outside of the envelope of the normal combustion front.
168.
2024 EPA Automotive Trends Report at 54 (“As vehicles have moved towards engines with a lower number of cylinders, the total engine size, or displacement, is also at an all-time low.”). The discussion below describes why NHTSA does not believe manufacturers will increase the displacement of HCR engines to make the necessary power because of the negative impacts it has on fuel efficiency.
171.
Supplemental Comments of Toyota, Notice of Proposed Rulemaking: Safer Affordable Fuel-Efficient Vehicles Rule, Docket ID No: NHTSA-2018-0067 and Docket No. EPA-HQ-OAR-2018-0283, at 6; Feng, R.
et al.
Investigations of Atkinson Cycle Converted from Conventional Otto Cycle Gasoline Engine, SAE Technical Paper 2016-01-0680, SAE International: Warrendale, VA (2016), available at:
www.sae.org/publications/technical-papers/content/2016-01-0680/
(accessed: May 28, 2026).
172.
See Tucker, S., What Is Payload: A Complete Guide. Kelly Blue Book, last revised: Feb. 2, 2023, available at:
www.kbb.com/car-advice/payload-guide/#link3
(accessed: May 28, 2026). (“Roughly speaking, payload capacity is the amount of weight a vehicle can carry, and towing capacity is the amount of weight it can pull. Automakers often refer to carrying weight in the bed of a truck as hauling to distinguish it from carrying weight in a trailer or towing.”).
173.
See Supplemental Comments of Toyota, Docket No. NHTSA-2018-0067 and Docket No. EPA-HQ-OAR-2018-0283, at 6, 8 (Mar. 25, 2019), available at:
www.regulations.gov/comment/NHTSA-2018-0067-12376
(accessed: May 28, 2026) (Supplemental Toyota Comments) (“Tacoma has a greater coefficient of drag from a larger frontal area, greater tire rolling resistance from larger tires with a more aggressive tread, and higher driveline losses from 4WD. Similarly, the towing, payload, and off-road capability of pick-up trucks necessitate greater emphasis on engine torque and horsepower over fuel economy. This translates into engine specifications such as a larger displacement and a higher stroke-to-bore ratio . . . . Tacoma's higher road load and more severe utility requirements push engine operation more frequently to the less efficient regions of the engine map and limit the level of Atkinson operation . . . . This endeavor is not a simple substitution where the performance of a shared technology is universal. Consideration of specific vehicle requirements during the vehicle design and engineering process determine the best applicable powertrain.”).
174.
To maintain performance neutrality when sizing powertrains and selecting technologies, NHTSA performs a series of simulations in Autonomie, which are further discussed in the Final TSD Chapter 2.3.4 and in the CAFE Analysis Autonomie Documentation. The concept of performance neutrality is discussed in detail above in Section II.C.2.c, Technology Effectiveness Values, and additional reasons why NHTSA maintains a performance neutral analysis are discussed in Section II.C.2.f, Technology Applicability Equations and Rules.
176.
National Research Council, Assessment of Technologies for Improving Fuel Economy of Light-Duty Vehicles—2025-2035, The National Academies Press: Washington, DC (2021), available at:
doi.org/10.17226/26092
(accessed: May 28, 2026) (hereinafter, “2021 NAS report”).
180.
NHTSA is aware of the PPC technology from two different manufacturers that is planned to be included on a relatively low volume of vehicles for MY 2027.
181.
NHTSA assigns each engine code technology that most closely corresponds to an engine map; for most technologies, one box on the technology tree corresponds to one engine map that corresponds to one engine code.
185.
See the Market Data Input File. As an example, the reported total system horsepower for the Ford Maverick HEV is also 191 HP, well below the 405 HP threshold. See also the Lexus LC/LS 500h: the Lexus LC/LS 500h also uses premium fuel to reach this performance level.
186.
As discussed in detail in Sections II.C.2.c and II.C.2.f above, NHTSA maintains a performance-neutral analysis to capture only the costs and benefits of manufacturers adding fuel economy-improving technology to their vehicles in response to CAFE standards.
188.
See SAE, Performance Requirements for Determining Tow-Vehicle Gross Combination Weight Rating and Trailer Weight Rating, SAE Standard J2807_202411, SAE International: Warrendale, PA (2024), available at:
doi.org/10.4271/J2807_202411
(accessed: May 28, 2026); Reed, T., SAE J207 Tow Tests—The Standard,
MotorTrend
(2015), available at:
www.motortrend.com/how-to/1502-sae-j2807-tow-tests-the-standard/
(accessed: May 28, 2026). When stating “increased payload and towing requirements,” NHTSA is referring to a defined set of requirements that manufacturers follow to ensure the manufacturer's vehicle can meet a set of performance measurements when building a tow vehicle to give consumers the ability to “cross-shop” between different manufacturers' vehicles. As discussed in detail above in Sections II.C.2.c and II.C.2.f, NHTSA maintains a performance-neutral analysis to ensure that the analysis is only accounting for the costs and benefits of manufacturers adding technology in response to CAFE standards. This means that adoption features, like the HCR application restriction, are applied to a vehicle that begins the analysis with specific performance measurements, like a pickup truck, where application of the specific technology would likely not allow the vehicle to meet the manufacturer's baseline performance measurements.
189.
ICCT asked NHTSA to stop quoting a 2019 Toyota comment explaining why NHTSA does not allow HCR engines in pickup trucks, stating that Toyota's purpose in explaining that the Tacoma and Camry achieve different effectiveness improvements using their HCR engines is being
misinterpreted. See NHTSA-2018-0067-12387 NHTSA disagrees. Toyota's comment is still relevant for this final rule as the limitations of the technology have not changed, which Toyota describes in the context of comparing why the technology provides a benefit in the Camry that one should not expect to see in the Tacoma. See Supplemental Toyota Comments at 6, 8. Note that Toyota also submitted a second set of supplemental comments (NHTSA-2018-0067-12431) that confirms NHTSA's understanding of the most important concept to support NHTSA's decision to limit HCR adoption on pickup trucks, which is that Atkinson operation is limited on pickup trucks. See Supplemental Comments of Toyota Motor North America, Inc., in the NHTSA Docket No. NHTSA-2018-0067-12376-A1, at 8-9 in
Regulations.gov. See Supplemental Comments of Toyota, Docket No. NHTSA-2018-0067 and Docket No. EPA-HQ-OAR-2018-0283, at 2-3 (July 15, 2019), available at:
www.regulations.gov/comment/NHTSA-2018-0067-12431
(accessed: May 28, 2026).
191.
Three manufacturers that meet the criteria (near 100 percent turbo downsized fleet, and future hybrid systems are based on turbo downsized engines) described and are excluded: BMW, Mercedes-Benz, and Jaguar Land Rover.
194.
ICCT has disagreed with NHTSA's HCR restrictions in the past, and while NHTSA has made attempts to better explain its position on HCR technology and where NHTSA believes it is appropriate, NHTSA's justification has remained the same. NHTSA does not believe the HCR technology is applicable to these types of vehicles because of the nature of how the technology works, and removing the restrictions would present an unrealistic pathway to compliance for manufacturers that is not maximum feasible.
200.
This weblink has additional information on the GT-POWER tool: Gamma Technologies, GT-POWER: Industry Leading Engine Simulation Software, available at:
www.gtisoft.com/gt-power/
(accessed: May 28, 2026).
203.
It is also important to note that regulation of fuels used for determining CAFE compliance is outside the scope of NHTSA's authority. 49 U.S.C. 32904(c).
204.
Friedrich, I.
et al.,
Automatic Model Calibration for Engine-Process Simulation with Heat-Release Prediction, SAE Technical Paper 2006-01-0655, SAE International: Warrendale, VA (2006), available at:
doi.org/10.4271/2006-01-0655
(accessed: May 28, 2026); Rezaei, R.
et al.,
Zero-Dimensional Modeling of Combustion and Heat Release Rate in DI Diesel Engines,
SAE International Journal Of Engines.
Vol. 5(3) at 874-85 (2012), available at:
doi.org/10.4271/2012-01-1065
(accessed: May 28, 2026); Berndt, R.
et al.,
Multistage Supercharging for Downsizing with Reduced Compression Ratio,
MTZ Worldwide.
Vol. 76: pp. 10-11 (2015), available at:
doi.org/10.1007/s38313-015-0036-4
(accessed: May 28, 2026); Neukirchner, H.
et al.,
Symbiosis of Energy Recovery and Downsizing,
MTZ Worldwide,
Vol. 75: pp. 4-9 (2014), available at:
doi.org/10.1007/s38313-014-0219-4
(accessed: May 28, 2026).
209.
National Research Council, Assessment of Fuel Economy Technologies for Light-Duty Vehicles, The National Academies Press: Washington, DC, p. 107 (2011), available at:
doi.org/10.17226/12924
(accessed: May 28, 2026) (hereinafter, “2011 NAS report”).
215.
In some instances, such as with the benchmarked Honda hybrid engine, the models used in this final rule analysis show better effectiveness improvements than EPA's engine map models. As both models—like any two different models—seek to simulate real world performance through slightly different approaches to quantitative analysis, the results will inherently vary.
219.
Table S.2, at pp. 7-8 of National Research Council, Cost, Effectiveness, and Deployment of Fuel Economy Technologies for Light-Duty Vehicles, The National Academies Press: Washington, DC (2015), available at:
doi.org/10.17226/21744
(accessed: May 28, 2026) (hereinafter, “2015 NAS report”).
221.
NESCCAF, Reducing Greenhouse Gas Emissions from Light-Duty Motor Vehicles, Final Report, NESCCAF: Boston, MA (2004), available at:
www.nesccaf.org/documents/rpt040923ghglightduty.pdf
(accessed: May 28, 2026).
222.
Note that eCVT transmissions are only coupled with hybrid electric drivetrains and are therefore not included as a standalone transmission option on the CAFE Model's technology pathways.
223.
See 2015 NAS Report at p. 191. HEG improvements for transmissions represent incremental advancements in technology that improve efficiency, such as reduced friction seals, bearings and clutches, super finishing of gearbox parts, and improved lubrication. These advancements are all aimed at reducing frictional and other parasitic loads in transmissions to improve efficiency. NHTSA considers three levels of HEG improvements in this analysis based on the NAS 2015 recommendations and CBI data.
229.
Argonne National Laboratory, Downloadable Dynamometer Database, last revised: 2025, available at:
www.anl.gov/taps/downloadable-dynamometer-database
(accessed: May 28, 2026); Kim, N.
et al.,
Advanced Automatic Transmission
Model Validation Using Dynamometer Test Data, SAE 2014-01-1778, Presented at SAE 2014 World Congress & Exhibition, Apr. 8, 2014, Detroit, MI (2014), available at:
www.sae.org/publications/technical-papers/content/2014-01-1778/
(accessed: May 28, 2026); Kim, N.
et al.,
Development of a model of the dual clutch transmission in autonomie and validation with dynamometer test data,
International Journal of Automotive Technologies,
Vol. 15: pp. 263-71 (2014), available at:
doi.org/10.1007/s12239-014-0027-5
(accessed: May 28, 2026).
231.
49 U.S.C. 32902(h)(1) and (2). In determining maximum feasible fuel economy levels, “the Secretary of Transportation—(1) may not consider the fuel economy of dedicated automobiles; [and] (2) shall consider dual fueled automobiles to be operated only on gasoline or diesel fuel.”
232.
NHTSA has estimated two sets of technology effectiveness values using the Argonne full-vehicle simulations: one set does not include the electrification portion of PHEVs, and one set includes the combined fuel economy for both ICE operation and electric operation. Final TSD Chapter 3.3 has more information.
234.
See 2015 NAS Report, at p. 130 (“During braking, the kinetic energy of a conventional vehicle is converted into heat in the brakes and is thus lost. An electric motor/generator connected to the drivetrain can act as a generator and return a portion of the braking energy to the battery for reuse. This is called regenerative braking. Regenerative braking is most effective in urban driving and in the urban dynamometer driving schedule (UDDS) cycle, in which about 50 percent of the propulsion energy ends up in the brakes (NRC 2011, 18).”).
235.
Kapadia, J.
et al.,
Powersplit or Parallel—Selecting the Right Hybrid Architecture,
SAE International Journal of Alternative Power,
Vol. 6(1): pp. 68-76 (2017), available at:
doi.org/10.4271/2017-01-1154
(accessed: May 28, 2026) (hereinafter, “Kapadia
et al.
(2017)”). Parallel hybrids architecture typically adds the electrical system components to an existing conventional powertrain.
239.
Some PHEVs operate in charge-depleting mode (
i.e.,
“electric-only” operation—depleting the high-voltage battery's charge) before operating in charge-sustaining mode (similar to strong hybrid operation, the gasoline and electric powertrains work together), while other (blended) PHEVs switch between charge-depleting mode and charge-sustaining mode during operation.
248.
Ram Trucks, The Ram 1500 REV: Range-extended Electric Truck, last revised: 2026, available at:
www.ramtrucks.com/electric/1500-rev.html
(accessed: May 26, 2026).
249.
Further, if an EREV existed that only used the engine to charge its battery and could not be operated in a charge-sustaining mode (
i.e.,
could not be only operated on gasoline or another fuel), it would be an electric vehicle and would not be considered in NHTSA's standard-setting analysis per the limits in 32902(h).
256.
This engine type is designated as Eng26 in the list of engine map models used in the analysis. Final TSD Chapter 3.1.1.2.3 provides more information.
257.
NHTSA is aware that some Hyundai vehicles use six-speed transmissions, and some Ford vehicles use 10-speed transmissions, but NHTSA has observed that the majority of P2s use eight-speed transmissions.
262.
Iliev, S.
et al.,
Vehicle Technology Assessment, Model Development, and Validation of a 2021 Toyota RAV4 Prime, DOT HS 813 356, NHTSA: Washington, D.C. (2023), available at:
downloads.regulations.gov/NHTSA-2023-0022-0010/attachment_6.pdf
(accessed: May 28, 2026).
271.
Burress, T.
et al.,
Evaluation of the 2007 Toyota Camry Hybrid Synergy Drive System, ORNL: Washington, DC (2008), available at:
doi.org/10.2172/928684
(accessed: May 28, 2026) (hereinafter, “Burress
et al.
(2008)”); Olszewski, M., Annual Progress Report for the Power Electronics and Electric Machinery Program, ORNL/TM-2011/263, Oak Ridge National Laboratory: Washington, DC (2011), available at:
info.ornl.gov/sites/publications/files/Pub31483.pdf
(accessed: May 28, 2026) (hereinafter, “Olszewski (2011)”).
285.
PHEV testing is broken into several phases based on SAE J1711: charge-sustaining on the city and HWFET cycle, and charge-depleting on the city and HWFET cycles.
287.
See 49 U.S.C. 32904(c) (“Testing and calculation procedures . . . . [T]he Administrator shall use the same procedures for passenger automobiles the Administrator used for model year
1975 (weighted 55 percent urban cycle and 45 percent highway cycle), or procedures that give comparable results.”).
288.
Atkinson Engine Peak Efficiency is based on 2017 Prius peak efficiency scaled up to 41 percent. CAFE Analysis Autonomie Documentation at p. 138. See ANL—All Assumptions_Summary_NPRM_022021.xlsx, ANL—Summary of Main Component Performance Assumptions_NPRM_022021.xlsx, Argonne Autonomie Model Documentation_NPRM.pdf and ANL—Data Dictionary_NPRM_022021.XLSX, which can be found in the rulemaking docket (NHTSA-2023-0022) by filtering for Supporting & Related Material.
292.
Hummel, P.
et al.,
UBS Evidence Lab Electric Car Teardown—Disruption Ahead?, UBS: Zurich, Switzerland (2017), available at:
neo.ubs.com/shared/d1ZTxnvF2k
(accessed: May 28, 2026); A2Mac1, Automotive Benchmarking (proprietary data), available at:
portal.a2mac1.com/
(accessed: May 28, 2026).
293.
See Docket Submission of Ex Parte Meetings Prior to Publication of the Corporate Average Fuel Economy Standards for Passenger Cars and Light
Trucks for Model Years 2027-2032 and Fuel Efficiency Standards for Heavy-Duty Pickup Trucks and Vans for Model Years 2030-2035 Notice of Proposed Rulemaking memorandum, which can be found in the rulemaking docket (NHTSA-2023-0022) by filtering for Supporting & Related Material.
297.
Rho Motion, EV Battery subscriptions, available at:
rhomotion.com/
(accessed: May 28, 2026); International Energy Agency, Global EV Outlook 2023: Catching Up with Climate Ambitions, International Energy Agency: Paris, France (2023), available at
www.iea.org/reports/global-ev-outlook-2023
(accessed: May 28, 2026).
298.
For this analysis, 2021$ costs have been updated to 2024$; this is not reflected directly in the base Battery Cost csv file, however, as this conversion was performed external to the file itself.
302.
Argonne National Laboratory, Cost Analysis and Projections for U.S.-Manufactured Automotive Lithium-Ion Batteries, ANL/CSE-24/1, Argonne National Laboratory: Lemont, IL (2024), available at:
publications.anl.gov/anlpubs/2024/01/187177.pdf
(accessed: May 28, 2026) (hereinafter, “ANL/CSE-24/1”).
304.
Zhou, Y.
et al.,
Lithium-Ion Battery Supply Chain for E-Drive Vehicles in the United States: 2010-2020, ANL/ESD-21/3, Argonne National Laboratory: Argonne, IL (2021), available at:
publications.anl.gov/anlpubs/2021/04/167369.pdf
(accessed: May 28, 2026); Gohlke, D.
et al.,
Quantification of Commercially Planned Battery Component Supply in North America Through 2035, Final Report, ANL-24/14, Argonne National Laboratory: Alexandria, VA (2024), available at:
publications.anl.gov/anlpubs/2024/03/187735.pdf
(accessed: May 28, 2026).
313.
Battery cathode chemistries considered in this project include nickel-based materials (NMC622, NMC811, NMC95, and LMNO) as well as lower cost LFP cathodes; varying percentages of silicon content (5%, 15%, and 35%) within a graphite anode were considered, as well.
327.
A technology cost walk is the step-by-step cost transaction the model performs when a vehicle adopts technology, allowing cost changes to be attributed to specific technology changes.
328.
Moawad, A.
et al.,
Assessment of Vehicle Sizing, Energy Consumption and Cost Through Large Scale Simulation of Advanced Vehicle Technologies, ANL/ESD-15/28, Argonne National Laboratory: Argonne, IL (2016), available at:
doi.org/10.2172/1245199
(accessed: May 28, 2026).
330.
Islam, E.
et al.,
Energy Consumption and Cost Reduction of Future Light-Duty Vehicles Through Advanced Vehicle Technologies: A Modeling Simulation Study Through 2050, ANL/ESD-19/10, Argonne National Laboratory: Lemont, IL (2020), available at:
publications.anl.gov/anlpubs/2020/08/161542.pdf
(accessed: May 28, 2026); Islam, E.
et al.,
A Comprehensive Simulation Study to Evaluate Future Vehicle Energy and Cost Reduction Potential, ANL/ESD-22/6, Argonne National Laboratory: Lemont, IL (2022), available at:
publications.anl.gov/anlpubs/2023/11/179337.pdf
(accessed: May 28, 2026).
333.
Note that in the previous analysis associated with the MYs 2024-2026 final rule, there was a sixth level of mass reduction available as a pathway to compliance. For this analysis, this pathway was removed because it relied on extensive use of carbon fiber composite technology to an extent that is only found in purpose-built racing cars and a few hundred road legal sports cars costing hundreds of thousands of dollars. Final TSD Chapter 3.4 provides additional discussion on the decision to include five mass reduction levels in this analysis.
334.
Glider mass reduction can sometimes enable a smaller engine while maintaining performance neutrality. Smaller engines typically weigh less than bigger ones. NHTSA captures any changes in the resultant fuel savings associated with powertrain mass reduction and downsizing via the Autonomie simulation. Autonomie calculates a hypothetical vehicle's theoretical fuel mileage using a mass reduction to the vehicle curb weight equal to the sum of mass savings to the glider plus the mass savings associated with the downsized powertrain.
337.
For this final rule, NHTSA did correct an error in the NPRM market data input file that effectively skipped light trucks under 50k vehicles by nameplate. NHTSA has since corrected the market data file such that SKIP is applied to light trucks as discussed in Final TSD Chapter 3.4.3.
339.
The body design categories NHTSA uses are 3-box and 2-box pickup trucks. A 3-box has a box in the middle for the passenger compartment, a box
in the front for the engine and a box in the rear for the luggage compartment. A 2-box has a box in front for the engine and then the passenger and luggage box are combined into a single box.
341.
See the Final TSD for CAFE standards for MYs 2024-2026 and Chapter 3.4 of the Final TSD accompanying this rulemaking for more information about carbon fiber.
343.
A2Mac1, Automotive Benchmarking (proprietary data), available at:
portal.a2mac1.com/
(accessed: May 28, 2026). The A2Mac1 database tool is widely used by industry and academia to determine the bill of materials (a list of the raw materials, sub-assemblies, parts, and quantities needed to manufacture an end-product) and mass of each component in the vehicle system.
344.
Though NHTSA does not account for mass reduction in transmissions, NHTSA does reflect design improvements as part of mass reduction when going from, for example, an older AT6 to a newer AT8 that has similar if not lower mass.
350.
This analysis applied the cost estimates per pound derived from passenger cars to all passenger car segments, and the cost estimates per pound derived from full-size pickup trucks to all light-duty truck and SUV segments. The cost estimates per pound for carbon fiber (MR5) were the same for all segments.
353.
See,
e.g.,
Pannone, G., Technical Analysis of Vehicle Load Reduction Potential for Advanced Clean Cars, Final Report, California Air Resources Board and The California Environmental Protection Agency: Sacramento, CA (2015), available at:
ww2.arb.ca.gov/sites/default/files/2020-04/13_313_ac.pdf
(accessed: May 28, 2026). The graph on p. 20 shows how the aerodynamic force becomes the dominant load force at higher speeds.
354.
Larose, G.
et al.,
Evaluation of the Aerodynamics of Drag Reduction Technologies for Light-Duty Vehicles: A Comprehensive Wind Tunnel Study,
SAE International Journal of Passenger Cars—Mechanical Systems,
Vol. 9(2): pp. 772-84 (2016), available at:
doi.org/10.4271/2016-01-1613
(accessed: May 28, 2026).
355.
These assignments do not necessarily match the body styles that manufacturers use for marketing purposes. Instead, NHTSA makes these assignments based on engineering judgment and the categories used in the modeling, considering how this affects a vehicle's AERO and vehicle technology class assignments.
359.
See Technical Analysis of Vehicle Load Reduction by CONTROLTEC for California Air Resources Board (Apr. 29, 2015). NHTSA determined the industry-average baseline RRC using a CONTROLTEC study prepared for the CARB in addition to considering CBI submitted by vehicle manufacturers prior to the 2018 light-duty NPRM analysis. The RRC values used in this study were a combination of manufacturer information, estimates from coast-down tests for some vehicles, and application of tire RRC values across other vehicles on the same platform. The average RRC from surveying 1,358 vehicle models by the CONTROLTEC study is 0.009. The CONTROLTEC study compared the findings of their survey with values provided by the U.S. Tire Manufacturers Association for original equipment tires. The average RRC from the data provided by the U.S. Tire Manufacturers Association is 0.0092, compared to the average of 0.009 from CONTROLTEC.
360.
See The Safer Affordable Fuel-Efficient (SAFE) Vehicles Rule for Model Years 2021-2026 Passenger Cars and Light Trucks, Docket No. NHTSA-2018-0067-11985.
361.
See NHTSA, Evaluation of Rolling Resistance and Wet Grip Performance of OEM Stock Tires Obtained from NCAP Crash Tested Vehicles Phase One and Two, Memorandum, NHTSA: Washington, DC, Docket No. NHTSA-2021-0053 (2021), available at:
downloads.regulations.gov/NHTSA-2021-0053-0010/attachment_3.pdf
(accessed: May 28, 2026); CONTROLTEC, LLC, Technical Analysis of Vehicle Load Reduction, California Air Resources Board: Sacramento, CA, Docket No. NHTSA-2021-0053-0010 (2015), available at:
ww2.arb.ca.gov/sites/default/files/classic/research/apr/past/13-313.pdf
(accessed: May 28, 2026); Evans, L.
et al.,
NHTSA Tire Fuel Efficiency Consumer Information Program Development: Phase 2—Effects of Tire Rolling Resistance Levels on Traction, Treadwear, and Vehicle Fuel Economy, DOT HS 811 154, NHTSA: Washington, DC, Docket No NHTSA-2008-0121-0035 (2009), available at:
downloads.regulations.gov/NHTSA-2008-0121-0035/attachment_1.pdf
(accessed: May 25, 2026).
364.
See Transportation Research Board, Tires and Passenger Vehicle Fuel Economy: Informing Consumers, Improving Performance, Special Report 286, The National Academies Press: Washington, DC (2006), available at:
nap.nationalacademies.org/catalog/11620/tires-and-passenger-vehicle-fuel-economy-informing-consumers-improving-performance
(accessed: May 28, 2026); NHTSA, Corporate Average Fuel Economy for MY 2011 Passenger Cars and Light Trucks, Final Regulatory Impact Analysis, NHTSA: Washington, DC (2009), available at:
www.nhtsa.gov/sites/nhtsa.gov/files/cafe_final_rule_my2011_fria.pdf
(accessed: May 28, 206); EPA and NHTSA, Joint Technical Support Document: Rulemaking to Establish Light-Duty Vehicle Greenhouse Gas Emission Standards and Corporate Average Fuel Economy Standards, EPA-420-R-10-901, EPA and NHTSA: Washington, DC, p. 3-77 (2010), available at:
www.nhtsa.gov/sites/nhtsa.gov/files/final_joint_tsd.pdf
(accessed: May
28, 2026); EPA and NHTSA, Draft Technical Assessment Report: Midterm Evaluation of Light-Duty Vehicle Greenhouse Gas Emission Standards and Corporate Average Fuel Economy Standards for Model Years 2022-2025, EPA-420-D-16-900, EPA and NHTSA: Washington, DC, pp. 5-153 and 154, 5-419 (2016), available at:
www.nhtsa.gov/sites/nhtsa.gov/files/draft-tar-final.pdf
(accessed: May 28, 2026). In brief, the estimates for ROLL10 are based on the incremental $5 value for four tires and a spare tire in the NAS/NRC Special Report and confidential manufacturer comments that provided a wide range of cost estimates. The estimates for ROLL20 are based on incremental interpolated ROLL10 costs for four tires (as NHTSA and EPA believed that ROLL20 technology would not be used for the spare tire) and are seen to be fairly consistent with CBI suggestions by tire suppliers.
365.
See 49 U.S.C 32904(c) (“The Administrator shall measure fuel economy for each model and calculate average fuel economy for a manufacturer under testing and calculation procedures prescribed by the Administrator . . . [T]he Administrator shall use the same procedures for passenger automobiles the Administrator used for model year 1975 (weighted 55 percent urban cycle and 45 percent highway cycle), or procedures that give comparable results.”).
368.
EPA and NHTSA, Joint Technical Support Document: Final Rulemaking for 2017-2025 Light-Duty Vehicle Greenhouse Gas Emission Standards and Corporate Average Fuel Economy Standards, EPA-420-R-12-901, EPA and NHTSA: Washington, DC (2012), available at:
www.nhtsa.gov/sites/nhtsa.gov/files/joint_final_tsd.pdf
(accessed: May 28, 2026).
369.
EPA, Proposed Determination on the Appropriateness of the Model Year 2022-2025 Light-Duty Vehicle Greenhouse Gas Emissions Standards under the Midterm Evaluation: Technical Support Document, EPA-420-R-16-020, EPA: Washington, DC (2016), available at:
downloads.regulations.gov/EPA-HQ-OAR-2022-0829-0230/attachment_1.pdf
(accessed: May 28, 2026).
375.
Similarly, for the proposal NHTSA used the Alternative Transportation case from the 2025 AEO for projections related to macroeconomic variables and fuel prices, and its Alternative Electricity case for electricity price forecasts. For the 2026 AEO, the EIA combined these two cases into the case that NHTSA is using in this final rule.
382.
Some survey data such as Consumer Reports shows consumers with lower payback periods (around 24 months). However, the methodology employed by surveys like Consumer Reports are less rigorous than the revealed preferences data from the other sources, which is why Circular A-4 directs the agencies to attempt to use studies that rely on revealed preferences when feasible.
390.
Greene, D.
et al.,
Consumer willingness to pay for vehicle attributes: What do we know?,
Transportation Research Part A: Policy and Practice,
Vol. 118(c): pp. 258-79 (2018), available at:
www.sciencedirect.com/science/article/abs/pii/S0965856417308546
(accessed: May 28, 2026).
395.
NHTSA also considers other approaches, such as assuming the full fleet in future model years would be composed of gasoline-powered vehicles or holding the current market penetration rate for dedicate automobiles constant. Final TSD Chapter 4.2.1.2 provides more discussion of the selected approach and alternatives considered.
396.
The CAFE Model currently operates as if all costs incurred by the manufacturer as a consequence of meeting regulatory requirements, whether those costs are the cost of additional technology applied to vehicles in order to improve fleetwide fuel economy or civil penalties paid when fleets fail to achieve their standard, are “passed through” to buyers of new vehicles in the form of price increases.
398.
The CAFE Model does not assign different preferences between technologies, and outside the standard-setting restrictions, the Model will apply technology on a cost-effectiveness basis. Similarly, outside of the sales response to changes in regulatory costs, consumers are assumed to be indifferent to specific technology pathways and will demand the same vehicles despite any changes in technological composition.
399.
NHTSA's experience partly reflects the fact that these models are highly sensitive to their data inputs and estimation procedures, and even versions that fit well when calibrated to data from a single period—usually a cross section of vehicles and shoppers or actual buyers—often produce unreliable forecasts for future periods, which NHTSA's regulatory analyses invariably require. This occurs because they are often unresponsive to shifts in economic conditions or consumer preferences, and also because it is difficult to incorporate factors such as the introduction of new model offerings—particularly those utilizing advances in technology or vehicle design—or shifts in manufacturers' pricing strategies into their representations of choices and forecasts of future sales or market shares. For these reasons, most vehicle choice models have been better suited for analysis of the determinants of historical variation in sales patterns than for forecasting future sales, volumes and market shares of particular categories.
400.
See Jacobsen, M.
et al.,
The Effects of New-Vehicle Price Changes on New- and Used-Vehicle Markets and Scrappage, EPA-420-R-21-019, EPA: Washington, DC (2021), available at:
cfpub.epa.gov/si/si_public_record_Report.cfm?Lab=OTAQ&dirEntryId=352754
(accessed: June 2, 2026) (reporting a range of estimates, with a value of approximately −0.4 representing an upper bound of this range). NHTSA selects this point estimate for the central case and explores alternative values in the sensitivity analysis.
404.
Leard, B., Estimating Consumer Substitution Between New and Used Passenger Vehicles, Working Paper 19-01 (revised Aug. 2021), Resources for the Future: Washington, DC (2021), available at:
media.rff.org/documents/WP_19-01_rev_2021.pdf
(accessed: May 28, 2026).
406.
NHTSA describes this literature review and the calibrated logit model in more detail in the accompanying docket memo “Calibrated Estimates for Projecting Light-Duty Fleet Share in the CAFE Model.”
410.
Some possible reasons for why durability may have changed are new automakers entering the market or general changes to manufacturing practices like switching some models from a car chassis to a truck chassis.
421.
Dimitropoulos, A.
et al.,
The Rebound Effect in Road Transport: A Meta-analysis of Empirical Studies, OECD Environment Working Papers, No. 113, OECD Publishing: Paris, France (2016), available at:
dx.doi.org/10.1787/8516ab3a-en
(accessed: June 2, 2026).
422.
ICCT, Docket No. NHTSA-2025-0491-5246 (citing Gillingham, K., Policy Brief: The Rebound Effect and the Rollback of Fuel Economy Standards (2018), available at:
resources.environment.yale.edu/gillingham/Gillingham_ReboundFuelEconomyStds.pdf
(accessed: June 2, 2026)); NRDC
et al.,
Docket No. NHTSA-2025-0491-5928-A2, at 91-98.
427.
This is not the first time that the agency has re-examined the existing rebound literature. In the agency's 2020 final rule, the agency used an estimate of 20 percent. In its 2021 proposal, it lowered its estimate of the rebound to 15 percent. The agency then lowered its estimate yet again for the final rule to 10 percent. As shown in Final TSD Chapter 4.3.4, there were no studies published over that time period that influenced the agency's decision.
428.
The various pollutants include carbon monoxide (CO), volatile organic compounds (VOCs), nitrogen oxides (NOX), sulfur oxides (SOX), particulate matter with a diameter of 2.5-micron (µm) or less (PM2.5), carbon dioxide (CO2), methane (CH4), and nitrous oxide (N2
O).
429.
While NHTSA considers the impacts of this rulemaking on the levels of various pollutant emissions, the main analysis does not include a monetization of any changes in levels of CO2, CH4, and N2
O emissions. (An analysis using the domestic-only valuation of those emissions is included in a sensitivity case). Monetized changes in criteria pollutant emissions are discussed in the preamble Section II.G and Chapter 6.2.2 of the Final TSD.
430.
Emissions from HFC leakage from air conditioner systems are not captured in the CAFE Model analysis due to limitations in the pollutants modeled by MOVES5.
431.
Argonne National Laboratory, The Research and Development Greenhouse Gases, Regulated Emissions, and Energy Use in Technologies (R&D GREET) Model 2025 (2025), last revised: Dec. 2025, available at:
greet.anl.gov/
(accessed: June 2, 2026).
432.
CPAC Foundation Center for Regulatory Freedom (CPAC-CRF), Docket No. NHTSA-2025-0491-5054, at 3, 8-9; NACAA, Docket No. NHTSA-2025-0491-5884, at 14-15; ME DEP, Docket No. NHTSA-2025-0490-0026, at 6.
435.
The one exception is that downstream CO2
emission factors were generated based on the carbon content and mass density per unit of each specific type of fuel assuming each fuel's entire carbon content is converted to CO2
emissions during combustion. See Final TSD Chapter 5.3 for further discussion.
438.
EPA, Brake and Tire Wear Emissions from Onroad Vehicles in MOVES5, EPA-420-R-24-012, EPA: Washington, DC, pp. 1-69 (2024), available at:
nepis.epa.gov/Exe/ZyPDF.cgi?Dockey=P101CTUW.pdf
(accessed: June 3, 2026).
439.
The Climate Reality Project (Climate Reality), Docket No. NHTSA-2025-0491-4896, at 2; Puget Sound Clean Air Agency (PSCAA), Docket No. NHTSA-2025-0491-4918, at 2-3; Cleveland, Docket No. NHTSA-2025-0491-4840, at 2, 4-6; AVE, Docket No. NHTSA-2025-0490-0033, at 5; Southern Environmental Law Center (SELC), Docket No. NHTSA-2025-0490-0035, at 5-11; NACAA, Docket No. NHTSA-2025-0491-5884, at 1, 8-11; South Coast Air Quality Management District (South Coast AQMD), Docket No. NHTSA-2025-0490-0064, at 3-4; ME DEP, Docket No. NHTSA-2025-0490-0026, at 6; City of Madison, Wisconsin (Madison), Docket No. NHTSA-2025-0491-6063, at 1-2; NRDC
et al.,
Docket No. NHTSA-2025-0491-5928, at 9-10, 15.
440.
As the health incidences for the different source sectors are all based on the emission of 1 ton of the same pollutants, NOX, SOX, and directly emitted PM2.5, differences in the incidence per ton values arise from differences in the geographic distribution of each pollutant's emissions, which in turn affects the number of people exposed to the estimated concentrations of each pollutant.
441.
EPA, Estimating the Benefit per Ton of Reducing PM2.5
Precursors from 17 Sectors, EPA: Washington, DC, pp. 1-108 (2018), available at:
19january2017snapshot.epa.gov/benmap/estimating-benefit-ton-reducing-pm25-precursors-17-sectors_.html
(accessed: June 5, 2026); Fann, N.
et al.,
Assessing Human Health PM2.5
and Ozone Impacts from U.S. Oil and Natural Gas Sector Emissions in 2025,
Environmental Science & Technology,
Vol. 52(15), pp. 8095-103 (2018), available at:
doi.org/10.1021/acs.est.8b02050
(accessed: June 5, 2026) (hereinafter, “Fann
et al.”); Wolfe, P.
et al.,
Monetized Health Benefits Attributable to Mobile Source Emission Reductions Across the United States in 2025,
The Science of the Total Environment,
Vol. 650 (Pt 2), pp. 2490-98 (2019), available at:
doi.org/10.1016/j.scitotenv.2018.09.273
(accessed: June 5, 2026) (hereinafter, “Wolfe
et al.”). Health incidence per ton values corresponding to this paper were sent by EPA staff.
442.
Some CAFE Model upstream emissions components do not correspond to any single EPA source sector identified in available literature, so NHTSA determined the most reasonable approach was to use a weighted average of different source sectors to generate those values. NHTSA is also aware that EPA in 2023 updated its estimated benefits for reducing PM2.5
from several sources, but those do not include mobile sources (which include the vehicles subject to CAFE standards). NHTSA has thus retained the PM2.5
incidence per ton values from the previous CAFE analysis for consistency with the current mobile source emissions estimates.
449.
Changes in tax revenues are a transfer and not an economic externality as traditionally defined, but NHTSA groups tax revenue changes together with other external costs because fuel taxes fund government activities affecting society as a whole rather than only consumers or manufacturers.
450.
This table presents the societal costs and benefits. Costs and benefits that affect only the consumer analysis, such as sales taxes, insurance costs, and reallocated VMT, are intentionally omitted from this table. Chapters 8.2.3 and 8.3.3 of the FRIA describe consumer-specific costs and benefits.
451.
These costs are discussed qualitatively but not monetized in the central analysis.
452.
Because taxes are transfers from consumers to governments, a portion of the Savings in Retail Fuel Costs includes taxes avoided. The Loss in Fuel Tax Revenue is completely offset within the Savings in Retail Fuel Costs.
453.
These impacts are discussed qualitatively but not monetized in the central analysis.
454.
The CAFE Model computes select health impacts resulting from population exposure to PM2.5
associated with emissions from directly emitted PM and two precursors to PM2.5
(NOX
and SOX). The analysis considers the effects of both downstream and upstream emissions.
455.
While NHTSA recognizes that some manufacturers may defray their regulatory costs for meeting increased fuel economy standards through more complex pricing strategies, the agency lacks sufficient insight into manufacturer pricing strategies to analyze such alternative approaches.
456.
OMB's Circular A-4 explains that the “net reduction in the total surplus (consumer plus producer) is a real cost to society,” and recommends that changes in consumer or producer surplus should be monetized “when they are significant.”
457.
For example, Leard
et al.
(2023) finds that consumers value performance improvements at three times the rate at which they value improvements in fuel economy and that forgone improvements in performance from recent changes in CAFE standards have essentially offset consumer welfare improvements from the fully valued savings in fuel costs. Klier and Linn (2016) find that if performance trade-offs resulted from a hypothetical 10-percent increase in regulatory stringency, U.S. consumers would value the resulting fuel economy gains at levels approximately 65-85-percent greater than their willingness to pay for any associated forgone horsepower. Reynaert (2021) finds that the European Union's emission standards caused manufacturers to choose between fuel economy and performance, and that the standards were ultimately not welfare improving. In addition to forgoing technological improvements that would improve performance, economists have also modeled manufacturers trading off performance for fuel economy at a fixed level of technology in order to reduce compliance costs (Whitefoot
et al.
(2017)).
458.
As explained in Chapter 6.1.3 of the Final TSD, consumers value the first 10 years of discounted fuel savings but are unwilling to pay for more than 3 years, because the value of fuel savings during years 4 through 10 is offset by the cost of sacrifices in improvements to vehicles' other attributes.
459.
As explained in Final TSD Chapter 2.3.5, NHTSA attempts to maintain performance neutrality when a technology is applied to a vehicle so that the change is only applied to improving fuel economy.
460.
ICCT, Docket No. NHTSA-2025-0491-5240-A1, at 8; NRDC
et al.,
Docket No. NHTSA-2025-0491-5928-A2, at 87-89; IPI, Docket No. NHTSA-2025-0491-6015-A2, at 20-59; ZETA, Docket No. NHTSA-2025-0491-6039, at Appendix 24-34; Attorneys General, Docket No. NHTSA-2025-0491-6064-A4, at 27-29.
461.
Rather than modeling the change in different types of trips for each driver in response to a change in the cost of driving, and then valuing each separately, NHTSA assumes that because drivers accept the risks of accidents, and costs of fuel when they voluntarily drive additional miles, they must derive some benefit.
464.
NRDC
et al.,
Docket No. NHTSA-2025-0491-5928-A2, at 87-89; ZETA, Docket No. NHTSA-2025-0491-6039, at Appendix 42; Attorneys General, Docket No. NHTSA-2025-0491-6064-A4, at 27.
469.
Grieco, P. et al., The evolution of market power in the U.S. automobile industry,
The Quarterly Journal of Economics,
Vol. 139(2): pp. 1201-53 (2024), available at:
doi.org/10.1093/qje/qjad047
(accessed: June 5, 2026).
470.
The authors measure consumer demand for horsepower and vehicle size explicitly and capture other vehicle characteristics like safety features and improved electronics through unobserved vehicle quality.
474.
For example, Knittel (2011) and Klier and Linn (2016) estimate a tradeoff of between 3-6 percent improvement in horsepower (which is a determinant of acceleration) for every 1 percent improvement in fuel economy. Watten and Anderson (2025) find an average rate of around 1.4 percent improvement in horsepower to weight for every 1 percent improvement in fuel economy, though the rate varies over time and is closer to 2 percent in recent years.
476.
Cleveland, Docket No. NHTSA-2025-0491-4840, at 2, 10; OCT, Docket No. NHTSA-2025-0491-4903, at 3; New York State Department of Environmental Conservation (NY DEC), Docket No. NHTSA-2025-0491-5058, at 3; U.S. Climate Alliance, Docket No. NHTSA-2025-0491-5065, at 2; ICCT, Docket No. NHTSA-2025-0491-5240, at 18; NACAA, Docket No. NHTSA-2025-0491-5884, at 15.
480.
NHTSA does not estimate benefits associated with reallocating travel among vehicles of different ages, because there is no associated change in total VMT until the rebound effect is introduced. Chapter 6.1.5 of the Final TSD explains NHTSA's methodology for reallocating travel and discusses whether any benefits would result as well as how they would be measured. NHTSA sought comment on its methodology for calculating the benefits from reallocated mileage, as well as on whether it is reasonable to assume that reduced sales of new vehicles leads to a transfer of some travel to older models and any welfare implications of such a transfer.
486.
As discussed in Section II.F above, though other criteria pollutants are currently regulated, only impacts from these three pollutants are calculated because they are emitted regularly by refineries and motor vehicles, cause the most severe effects on human health, and have been the subject of extensive research to quantify and monetize their health impacts. NHTSA's regulatory analysis does not attempt to quantify the adverse health effects of air toxics, which are emitted during fuel production and use, or ozone, which is formed in the atmosphere by emissions of regulated pollutants.
488.
American Lung Association (ALA), Docket No. NHTSA-2025-0491-5977, at 1-3; Oregon Department of Environmental Quality (OR DEQ), Docket No. NHTSA-2025-0491-5937, at 4-5; Change the Chamber (CTC), Docket No. NHTSA-2025-0491-4904, at 2-3; NRDC
et al.,
Docket No. NHTSA-2025-0491-5928, Appendix A, at 7-9; IPI, Docket No. NHTSA-2025-0491-6015, at 15.
494.
Cleveland, Docket No. NHTSA-2025-0491-4840, at 2, 7-10; OCT, Docket No. NHTSA-2025-0491-4903, at 3-4; ICCT, Docket No. NHTSA-2025-0491-5240, at 7; Institute for Policy Integrity at New York University School of Law, Center for Climate and Energy Solutions, Clean Air Task Force, Earthjustice, Environmental Defense Fund, Montana Environmental Information Center, Natural Resources Defense Council, Sierra Club, and Union of Concerned Scientists (IPI
et al.), Docket No. NHTSA-2025-0491-5758, at i-iii; NRDC
et al.,
Docket No. NHTSA-2025-0491-5928, Appendix A, at 62-64; ZETA, Docket No. NHTSA-2025-0491-6039, at 6; Lucid, Docket No. NHTSA-2025-0491-6043, at 10; Attorneys General, Docket No. NHTSA-2025-0491-6064, Detailed Comments, at 81-87.
504.
See for example: Brown, S., New estimates of the security costs of U.S. oil consumption,
Energy Policy,
Vol. 113: pp. 171-92 (2018), available at:
doi.org/10.1016/j.enpol.2017.11.003
(accessed: June 9, 2026); Brown, S., & Huntington, H., Assessing the U.S. oil security premium,
Energy Economics,
Vol. 38: pp. 118-27 (2013), available at: 10.1016/j.eneco.2013.03.010 (accessed: May 26, 2026).
507.
Matthew Sparks, Docket No. NHTSA-2025-0491-4821, at 2; Cleveland, Docket No. NHTSA-2025-0491-4840, at 10-11; CPAC-CRF, Docket No. NHTSA-2025-0491-5054, at 7.
522.
Hollowell, W.
et al.,
Evaluation of Different ADS Material Concepts using Various Safety Metrics, Presented at 27th International Technical Conference on the Enhanced Safety of Vehicles, April 3-6, 2023, Yokohama, Japan, NHTSA (2023); Gunti, R.
et al.,
An enhanced methodology for lightweighting a vehicle design considering front crashworthiness and pedestrian impact safety requirements,
Procedia Engineering,
Vol. 173(5): pp. 623-30 (2017), available at:
doi.org/10.1016/j.proeng.2016.12.118
(accessed: June 5, 2026).
523.
Hollowell, W.
et al.,
Evaluation of Different ADS Material Concepts using Various Safety Metrics, Presented at 27th International Technical Conference on the Enhanced Safety of Vehicles, April 3-6, 2023, Yokohama, Japan, NHTSA (2023); Gunti, R.
et al.,
An enhanced methodology for lightweighting a vehicle design considering front crashworthiness and pedestrian impact safety requirements,
Procedia Engineering,
Vol. 173(5): pp. 623-30 (2017), available at:
doi.org/10.1016/j.proeng.2016.12.118
(accessed: June 5, 2026).
530.
Chuang, E.
et al.,
Under the Hood: EPA and DOT's Models Overlook Hidden Attributes of Fuel Efficiency Improvements Policy Integrity, Institute for Policy Integrity, New York University School of Law: New York, NY (2026), available at:
policyintegrity.org/files/publications/Cars_Hidden_Externalities_Report.pdf
(accessed: May 28, 2026).
531.
NRDC
et al.,
Docket No. NHTSA-2025-0491-5982, Appendix A, (“NHTSA lacks support for its finding that the existing standards are significantly degrading highway safety.”), p. 42.; Consumer Reports, Docket No. NHTSA-2025-0491-5926, at Section 5.3, p. 12.
553.
Note that the percentage changes from one year to the next are applied to the footprint functions that define the standards, rather than to an average or summary mpg value corresponding to a given footprint function. The PC and LT target curve function coefficients are defined in Equation III-1 and Equation III-2, respectively. See Final TSD Chapter 1.2.1 for a complete discussion of the footprint curve functions and how they are calculated.
555.
Mean fit level here refers to standards developed based on the relationship between fuel consumption and footprint using ordinary least-squares without any further adjustment. NHTSA examined fleetwide compliance and found that around half of the vehicles produced in the MY 2022 fleet complied with these standards. For the mean fit minus standard deviation, NHTSA reasoned that focusing on the central mass of the distribution of vehicles' fuel economy values would seem to be a good indicator that the finalized level was technologically feasible and economically practicable.
557.
To compensate for stringency changes associated with vehicle reclassification, NHTSA assumed in the NPRM different growth rates for the alternative standards for MYs 2027-2029.
558.
As discussed in more detail in Section II, NHTSA's assumptions about market-driven fuel economy improvements in the absence of regulatory requirements involve manufacturer application of technology that pays for itself within 36 months. This assumption is based on manufacturer statements over successive CAFE rulemakings and is supported by the relevant literature.
560.
Because NHTSA does not receive final model year data in the same format from EPA as manufacturers submit their pre-model year data and final model year data to the agency, NHTSA cannot simply remove Excel rows with dedicated vehicles as the agency did to create its MY 2022 and MY 2024 Market Data Input Files. For purposes of this analysis, NHTSA believes that final model year data are the appropriate source to use.
575.
The LT CAFE target function coefficients established in the 2024 final rule are identical for MY 2027 and MY 2028. As a result, the MY 2027 and MY 2028 lines overlap with each other.
577.
Domestic passenger car standard equals the larger of two values: the value computed based on the manufacturer's domestic passenger car fleet, and the minimum domestic passenger car standard for the model year. The minimum domestic passenger car standard is set equal to 92 percent of the average fuel economy for the entire passenger car fleet in the model year as projected by NHTSA when the standards are promulgated.
578.
Calculated achieved fuel economy does not include the effects of AC/OC adjustments.
579.
Calculated achieved fuel economy does not include the effects of AC/OC adjustments.
580.
Calculated achieved fuel economy does not include the effects of AC/OC adjustments.
581.
Domestic passenger car standard equals the larger of two values: the value computed based on the manufacturer's domestic passenger car fleet, and the minimum domestic passenger car standard for the model year. The minimum domestic passenger car standard is set equal to 92 percent of the average fuel economy for the entire passenger car fleet in the model year as projected by NHTSA when the standards are promulgated.
582.
Calculated achieved fuel economy does not include the effects of AC/OC adjustments.
583.
Calculated achieved fuel economy does not include the effects of AC/OC adjustments.
584.
Calculated achieved fuel economy does not include the effects of AC/OC adjustments.
585.
Domestic passenger car standard equals the larger of two values: the value computed based on the manufacturer's domestic passenger car fleet, and the minimum domestic passenger car standard for the model year. The minimum domestic passenger car standard is set equal to 92 percent of the average fuel economy for the entire passenger car fleet in the model year as projected by NHTSA when the standards are promulgated.
586.
Calculated achieved fuel economy does not include the effects of AC/OC adjustments.
587.
Calculated achieved fuel economy does not include the effects of AC/OC adjustments.
589.
Over-compliance can be the result of multiple factors including projected “inheritance” of technologies (
e.g.,
changes to engines shared across multiple vehicle model/configurations) applied in earlier model years, future technology cost reductions (
e.g.,
decreased technology costs due to learning), and changes in fuel prices that affect technology cost effectiveness. As in all past rulemakings over the last decade, NHTSA assumes that, beyond fuel economy changes in response to CAFE standards, manufacturers may also improve fuel economy via technologies that would pay for themselves within the first 36 months of vehicle operation (this rule assumes 36 months, prior rules assumed 30 months).
590.
NHTSA's standard-setting analysis does not consider factors prohibited under 49 U.S.C. 32902(h), including the application of compliance credits and consideration of fuel economy attributable to alternative fuel sources. For plug-in hybrid vehicles, this means only the gasoline-powered operation (
i.e.,
non-electric fuel economy, or charge sustaining mode operation only) is considered when selecting technology to meet the standards.
591.
Due to the statutory constraints imposed on the analysis by EPCA that exclude consideration of AFVs, BEVs are not considered as a compliance option within the CAFE Model in any model year. Similarly, PHEVs can be introduced by the CAFE Model, but only their charge-sustaining fuel economy value (as opposed to their charge-depleting fuel economy value) is considered in this analysis.
592.
As discussed in the Final TSD, the technology costs considered in the CAFE Model reflect a markup factor to account for manufacturer profits and other retail costs. For more detail regarding the calculation of technology costs, see the CAFE Model Documentation.
595.
Some of these external benefits and costs result from changes in economic and environmental externalities from supplying or consuming fuel, while others do not involve changes in such externalities but are similar in that they are borne by parties other than those whose actions impose them.
596.
NHTSA also accounts for changes in fuel tax revenue that occur as a result of changes in fuel consumption. Changes in tax revenues are considered a transfer and not an economic externality as defined traditionally, but NHTSA groups these with social costs instead of private costs because that loss in revenue affects society as a whole as opposed to impacting only consumers or manufacturers. The offsetting changes in costs to consumers are accounted for in the estimates of fuel cost savings, which are valued at retail prices inclusive of taxes.
598.
These rows report total vehicle units observed during the period. For example, about 1,765 million units are modeled in the on-road fleet for CYs 2024-2030. On average, this represents approximately 252 million vehicles in the on-road fleet for each calendar year in this calendar year cohort; this is the highest average across all cohorts.
599.
These rows report total miles traveled during the period. For example, 21,570 billion miles traveled in CYs 2024-2030. On average, this represents approximately 3.08 trillion annual miles traveled for each calendar year in this calendar year cohort.
600.
While NHTSA considers the impacts of this rulemaking on the levels of CO2, CH4, and N2
O emissions, the analysis does not include a monetization of any changes.
602.
Premature mortality includes deaths that are estimated to occur before the normally expected life span of persons within a group defined by specific demographic characteristics.
603.
The CAFE Model estimates overall health costs, which includes all the mortality and morbidity impacts outlined in Table IV-31. For further discussion of the calculation of monetized health impacts, see Final TSD Chapter 6.2.2.
604.
In contrast to an uncertainty analysis, where many assumptions are varied simultaneously, the sensitivity analyses included here vary a single assumption and provide information about the influence of each individual factor, rather than suggesting that an alternative assumption would have justified a different Preferred Alternative.
605.
NHTSA's sensitivity cases applying a monetized value to changes in Non-Criteria Emissions (NCEs) use NCE values derived from the 2019 EPA Regulatory Impact Analysis for the Repeal of the Clean Power Plan. EPA, Regulatory Impact Analysis for the Repeal of the Clean Power Plan, and the Emission Guidelines for Greenhouse Gas Emissions From Existing Electric Utility Generating Units, EPA-452/R-19-003 EPA: Washington, D.C. (2019), available at:
www.epa.gov/sites/default/files/2019-06/documents/utilities_ria_final_cpp_repeal_and_ace_2019-06.pdf
(accessed: June 5, 2026). These values (per metric ton) range from $8.98 (2024) to $13.98 (2050) for CO2.
The specific values used for this sensitivity at both three percent and seven percent discount rates can be found in the Parameters Input ile associated with these sensitivity cases.
606.
Estimates for CH4
and N2
O are the same as those used in the 2020 SAFE rule, updated to 2024$. These estimates are based on those prepared by the EPA, including a 2017 update to the analysis of the 2016 Rule, “Oil and Natural Gas Sector: Emission Standards for New, Reconstructed, and Modified Sources” (81 FR 35824). See EPA, Estimated Cost Savings and Forgone Benefits Associated with the Proposed Rule, “Oil and Natural Gas: Emission Standards for New, Reconstructed, and Modified Sources: Stay of Certain Requirements,” Memorandum (2017), available at:
www.epa.gov/sites/default/files/2017-11/documents/oilgas_memo_proposed-stay_2017-10.pdf
(accessed: July 23, 2026). These values (per metric ton) range from $268.58 to $474.37 for CH4,
and $3144.65 to $5033.59 for N20 (3% discount rate, 2024 dollars). The specific values used for this sensitivity at both three percent and seven percent discount rates can be found in the Parameters Input File associated with these sensitivity cases.
609.
NHTSA received a comment from an individual commenter stating that the Secretary of Transportation issued an interpretation that DOT does not have authority to regulate fuel economy,
see
Docket No. NHTSA-2025-0491-0024. NHTSA believes this is a misunderstanding of the June 2025 interpretive rule, as DOT does have the authority to regulate fuel economy, and is finalizing a rule to do so through MY 2031,
see49 U.S.C. 32902.
613.
See 63 FR 66066 (Dec. 1, 1998). Non-plug-in hybrid vehicles are not dual-fueled vehicles under Chapter 329 because any electricity generated by the electric motors or other electric components are generated solely by the petroleum-fueled engine and the batteries are incapable of charging from an external source: “a vehicle which is entirely dependent on a petroleum fuel for its motive power, regardless of whether electricity is used in the powertrain, is powered by petroleum.”
616.
See, e.g.,49 U.S.C. 32902(a) (specifying that prescription of standards by regulation shall occur at least 18 months before the beginning of the
model year); 49 U.S.C. 32902(b)(3) (specifying that standards shall be based on 1 or more vehicle attributes related to fuel economy and expressed in the form of a mathematical function).
622.
49 FR 41250, 41255 (Oct. 22, 1984) (referencing the EPCA Conference Report's statement that “[a]n amendment which has the effect of making an average fuel economy standard less stringent can be promulgated at any time prior to the beginning of the model year in question,” the APA's definition of a “rule,” and the agency's belief that Congress intended to provide certainty and finality for manufacturers' planning purposes and that Congress intended standards to “encourage the achievement of particular fuel economy levels rather than simply ratifying past conduct.”); 53 FR 14241-14302 (Apr. 28, 1988) (explaining that retroactive downward adjustments were inconsistent with the statutory scheme as inferred by congressionally imposed credit and civil penalty provisions, equity considerations, the APA, and General Motors' perceived theories of Congressional intent).
See also
Gen. Motors Corp. v. Nat'l Highway Traffic Safety Admin., 898 F.2d 165 (D.C. Cir. 1990).
623.
49 U.S.C. 32911(b) (“A manufacturer of automobiles commits a violation if the manufacturer fails to comply with an applicable average fuel economy standard under section 32902 of this title.”).
624.
See 87 FR 39439, 39441 (July 1, 2022) (explaining that NHTSA has previously granted retroactive low-volume exemptions when administrative delays prevented determinations on petitions prior to the beginning of the model year, reasoning that denying relief would effectively nullify a Congressionally-mandated program. To avoid unfairly penalizing manufacturers for agency inaction (in particular, when manufacturers had submitted timely and complete petitions for exemption to the agency), NHTSA interpreted EPCA to authorize retroactive exemptions).
638.
NRDC
et al.,
Docket No. NHTSA-2025-0491-5928-A2, at 23; UCS, Docket No. NHTSA-2025-0491-6027-A1, at 4; ZETA, Docket No. NHTSA-2025-0491-6039-A1, at 1; IPI, Docket No. NHTSA-2025-0491-6015-A2, at 88; SELC, Docket No. NHTSA-2025-0490-0035, at 2; Lucid, Docket No. NHTSA-2025-0491-6043, at 6-7; Attorneys General, Docket No. NHTSA-2025-0491-6064-A2, at 98-100; S. Sotomayor, Docket No. NHTSA-2025-0491-4888; Will Schmidt and Juan Fernandez, Docket No. NHTSA-2025-0491-3469, at 3.
639.
ZETA, Docket No. NHTSA-2025-0491-6039-A1, at 2; NRDC
et al.,
Docket No. NHTSA-2025-0491-5928-A2, at 24; Attorneys General, Docket No. NHTSA-2025-0491-6064-A2, at 98-99.
648.
Will Schmidt and Juan Fernandez, Docket No. NHTSA-2025-0491-3469, at 3 (stating that one cannot amend a concluded model year any more than one can “amend yesterday's weather.”).
673.
SELC, Docket No. NHTSA-2025-0490-0035, at 3-4; NACAA, Docket No. NHTSA-2025-0491-5884, at 14; NRDC
et al.,
Docket No. NHTSA-2025-0491-5928-A2, at 24; IPI, Docket No. NHTSA-2025-0491-6015-A2, at 91; ZETA, Docket No. NHTSA-2025-0491-6039-A1, at 11; Attorneys General, Docket No. NHTSA-2025-0491-6064-A2, at 100-101; ME DEP, Docket No. NHTSA-2025-0490-0026, at 2; ALA, Docket No. NHTSA-2025-0491-5977, at 2; Will Schmidt and Juan Fernandez, Docket No. NHTSA-2025-0491-3469, at 3.
682.
ZETA, Docket No. NHTSA-2025-0491-6039-A1, at 11; IPI, Docket No. NHTSA-2025-0491-6015-A2, at 92; Attorneys General, Docket No. NHTSA-2025-0491-6064-A2, at 100-101.
691.
See 85 FR 24174, 25186 (Apr. 30, 2020) (although the agency finalized a different set of standards, it considered and explained that net benefits appear to be maximized under the two percent/three percent alternative, which proposed to raise passenger car standards at two percent per year and light truck standards at three percent per year); 89 FR 52540, 52547 (June 24, 2024) (explaining that after consideration of relevant data and comments, an alternative that raised passenger car stringency at two percent per year and held light truck stringency at zero percent per year for two years, followed by two percent increases, was maximum feasible).
692.
49 U.S.C. 32902(b)(4). In the CAFE program, “domestically manufactured” is defined by Congress in 49 U.S.C. 32904(b). The definition roughly provides that a passenger car is “domestically manufactured” as long as at least 75 percent of the cost to the manufacturer is attributable to value added in the United States, Canada, or Mexico, unless the assembly of the vehicle is completed in Canada or Mexico and the vehicle is imported into the United States more than 30 days after the end of the model year.
693.
49 U.S.C. 32902(b)(4). Since Congress established the statutory requirement, “92 percent” has always been greater than 27.5 mpg and foreseeably will continue to be so in the future.
694.
77 FR 62624, 63028 (Oct. 15, 2012) (explaining that the agency does not read EISA as precluding “any change, ever, in the minimum standard after it is first promulgated for a model year” and that “the language of the statute suggests that the 92 percent should be determined anew any time the passenger car standards are revised”); 85 FR 24174, 25124 (Apr. 30, 2020); 87 FR 25710, 25962 (May 2, 2022).
695.
74 FR 14196, 14410 (May 29, 2009) (“NHTSA calculated 92 percent of the final projected passenger car standards as the minimum standard, which for MY 2011 is 27.8.”); 75 FR 25324, 25614 (May 7, 2010); 89 FR 52540, 52792 (June 24, 2024).
700.
49 U.S.C. 32902(b)(2)(B) (“For model years 2021 through 2030, the average fuel economy required to be attained by each fleet of passenger and non-passenger automobiles manufactured for sale in the United States shall be the maximum feasible average fuel economy standard for each fleet for that model year.”).
744.
Congresswoman Doris Matsui
et al.,
Docket No. NHTSA-2025-0491-6065, at 1; Save the Sound, Docket No. NHTSA-2025-0490-0060, at 3; ALA, Docket No. NHTSA-2025-0491-5977, at 2.
771.
See, e.g.,
California Assembly Bill 32 of 2006, which mandated that “[t]he regulations adopted by the [California Air Resources Board] pursuant to this section shall achieve the maximum technologically feasible and cost-effective reductions in greenhouse gas emissions from those sources or categories of sources, in furtherance of achieving the statewide greenhouse gas emissions limit.”
See also
California Assembly Bill 1493 of 2002, which provided that “the [California Air Resources Board] shall develop and adopt regulations that achieve the maximum feasible and cost-effective reduction of greenhouse gas emissions from motor vehicles.” These environmental regulatory schemes, which drive California's climate agenda still today, vary greatly from the CAFE program.
772.
77 FR at 63015 (“It is important to remember that technological feasibility must also be balanced with the other of the four statutory factors. Thus, while `technological feasibility' can drive standards higher by assuming the use of technologies that are not yet commercial, `maximum feasible' is also defined in terms of economic practicability, for example, which might caution the agency against basing standards (even fairly distant standards)
entirely
on such technologies.”); 85 FR at 25130-1 (citing 77 FR 63015 (“Contrary to the assertion by several commenters that NHTSA has historically claimed that it
must
set technology-forcing standards, NHTSA has previously described the technological feasibility factor as
allowing
the agency to set standards that force the development and application of new fuel-efficient technologies.”)).
775.
85 FR 24174, at 25130-1 (“In response to commenters' apparent confusion regarding NHTSA's statement that it did not consider technologies that improved fuel economy in `similar ways' as other technologies discussed in the NPRM, the meaning behind that statement was discussed at greater length in the section of the NPRM that substantively covered those technologies. For example, in discussing the `HCR2' technology, the agencies explained that while the agencies were not modeling HCR2 expressly due to concerns that it remained `entirely speculative,' `[t]he CAFE model allows for incremental improvement over existing HCR1 technologies with the addition of improved accessory devices (IACC), a technology that is available to be applied on many baseline MY 2016 vehicles with HCR1 engines and may be applied as part of a pathway of compliance to further improve the effectiveness of existing HCR1 engines.' In this and in other instances, technologies included in the analysis improved fuel economy in similar ways to other technologies not included. Here, HCR1, when combined with IACC, results in `a step past' HCR1, which is similar to the unproven HCR2.”).
776.
89 FR at 25601 (“Turbocharging allows a larger naturally aspirated engine to be reduced in size or displacement while still doing the same amount of work, and its fuel efficiency improvements are, in part, due to the reduced displacement. DEAC effectively makes an engine with a particular displacement intermittently offer some of the fuel economy benefits of a smaller-displacement engine by deactivating cylinders when the work demand does not require the full engine displacement and reactivating them as-needed to meet higher work demands; the greater the displacement of the deactivated cylinders, the greater the fuel economy benefit.”).
778.
See Ctr. for Auto Safety
v.
NHTSA,
793 F.2d 1322 (D.C. Cir. 1986) (Administrator's consideration of market demand as component of economic practicability found to be reasonable);
see also Public Citizen
v.
NHTSA,
848 F.2d 256 (D.C. Cir. 1988) (Congress established broad guidelines in the fuel economy statute; agency's decision to set lower standards was a reasonable accommodation of conflicting policies).
782.
NRDC
et al.,
Docket No. NHTSA-2025-0491-5928-A2, at 46; IPI, Docket No. NHTSA-2025-0491-6015-A2, at 5-6; Attorneys General, Docket No. NHTSA-2025-0491-6064-A2, at 62; ZETA, Docket No. NHTSA-2025-0491-6039-A1, at 3.
784.
IPI, Docket No. NHTSA-2025-0491-6015-A2, at 6; ZETA, Docket No. NHTSA-2025-0491-6039-A1, at 5; Attorneys General, Docket No. NHTSA-2025-0491-6064-A2, at 59-60.
791.
See, e.g., Ctr. for Auto Safety
v.
Nat'l Highway Traffic Safety Admin.,
793 F.2d 1322, 1340 (D.C. Cir. 1986). The court determined, independent from NHTSA's own analysis, that “a standard with harsh economic consequences for the auto industry also would represent an unreasonable balancing of EPCA's policies.”
792.
See,
e.g.,85 FR 24174, 24213-14 (April 30, 2020) (“ `Economic practicability' refers to whether a standard is one `
within the financial capability of the industry,
but not so stringent as to' lead to `adverse economic consequences, such as a significant loss of jobs or the unreasonable elimination of consumer choice.' ” (emphasis added) (citing to the same text in 67 FR 77015, 77021 (Dec. 16, 2002))).
793.
See, e.g.,90 FR 56438, at 56517 (“Safety trade-offs associated with MR have occurred in the past, particularly before standards were attribute-based, because manufacturers chose, in response to standards, to build smaller and lighter vehicles; these smaller, lighter vehicles did not fare as well in crashes as larger, heavier vehicles, on average. Though NHTSA now uses attribute-based standards, in part to reduce or eliminate the incentive to downsize vehicles to comply with the standards, NHTSA is mindful of the possibility of related safety trade-offs.”).
798.
As originally enacted as part of Public Law 94-163, that subsection was designated as sec. 502(d) of the Motor Vehicle Information and Cost Savings Act.
800.
See
Public Law 103-272, 108 Stat. 745 (July 5, 1994) (to revise, codify, and enact without substantive changes certain laws related to transportation).
805.
NHTSA is actively petitioning for formal recognition and a declaration that CARB's CO2
emission standards and ZEV mandate are inherently unenforceable. See
United States
v.
CARB,
No. 2:26-cv-847 (E.D. Cal.)
816.
The term “Section 177” States refers to States which had previously elected to adopt California's standards in lieu of Federal requirements, as allowed under section 177 of the CAA when a valid California standard (
i.e.,
a standard for which a waiver has been granted) is in place.
818.
NHTSA is actively seeking a judicial declaration that CARB's CO2
emission standards and ZEV mandate are preempted by EPCA and unenforceable. See
United States
v.
CARB,
No. 2:26-cv-847 (E.D. Cal.).
824.
EIA, Annual Energy Outlook 2026: Case Descriptions, EIA: Washington, DC (2026), available at
www.eia.gov/outlooks/aeo/assumptions/pdf/case_descriptions.pdf
(accessed: May 29, 2026). The Alternative Electricity and Alternative Transportation Combination case further explores the impact of policy uncertainty by combining the assumptions in the Alternative Electricity and Alternative Transportation cases. Those cases are described in more detail on page 6 of the Case Descriptions report.
825.
42 FR 63184, 63192 (Dec. 15, 1977) (“A major reason for this need [to reduce petroleum consumption] is that the importation of large quantities of petroleum creates serious balance of payments and foreign policy problems. The United States currently spends approximately $45 billion annually for imported petroleum. But for this large expenditure, the current large U.S. trade deficit would be a surplus.”).
826.
EIA, Today in Energy: Recent Improvements in Petroleum Trade Balance Mitigate U.S. Trade Deficit, last revised: July 21, 2014, available at:
www.eia.gov/todayinenergy/detail.php?id=17191
(accessed: May 28, 2026).
828.
Though future changes in trade policy and its potential macroeconomic impacts remain a source of uncertainty in EIA's outlooks, the most recent Short Term Energy Outlook projects U.S. crude oil production to increase from around 13.6 million barrels per day in 2025 to 13.8 million barrels per day in 2026, and U.S. crude oil inventories (excluding SPR) are expected to increase by about 5 percent from 2025 to 2026. See EIA, Short-Term Energy Outlook, last revised: July 7, 2026, available at:
www.eia.gov/outlooks/steo/.
834.
NRDC
et al.,
Docket No. NHTSA-2025-0491-5928-A2, at 52; ZETA, Docket No. NHTSA-2025-0491-6039-A1, at 6; Attorneys General, Docket No. NHTSA-2025-0491-6064-A2, at 72.
837.
NRDC
et al.,
Docket No. NHTSA-2025-0491-5928-A2, at 54 (citing EIA, Frequently Asked Questions (FAQs): How Much Petroleum Does the United States Import and Export?, available at:
www.eia.gov/tools/faqs/faq.php?id=727&t=6
(accessed: May 28, 2026)).
867.
See, e.g.,49 U.S.C. 32912(c)(1)(A)(i) (discussing the circumstances in which the Secretary can increase the civil penalty rate; specifically, when it “will result in, or substantially further, substantial energy conservation for automobiles . . . .”).
868.
Massachusetts
v.
E.P.A.,
549 U.S. 497, 532 (2007) (“But that DOT sets mileage standards in no way licenses EPA to shirk its environmental responsibilities. EPA has been charged with protecting the public's “health” and “welfare,” 42 U.S.C. 7521(a)(1), a statutory obligation wholly independent of DOT's mandate to promote energy efficiency. See Energy Policy and Conservation Act, § 2(5), 89 Stat. 874, 42 U.S.C. 6201(5). The two obligations may overlap, but there is no reason to think the two agencies cannot both administer their obligations and yet avoid inconsistency.”).
869.
While the U.S. continues to maintain a significant military presence in critical maritime transit corridors, such as the Strait of Hormuz, to ensure the stability of global energy markets and the free flow of commerce, such deployments serve a broad range of strategic, diplomatic, and security objectives that extend far beyond the protection of petroleum supplies. The specific operational requirements and mission profiles of U.S. forces in these regions are dictated by complex geopolitical dynamics and defense obligations that remain independent of domestic fuel consumption levels. Consequently, the incremental reductions in oil demand projected to result from the CAFE standards are not of a magnitude that would reasonably be expected to alter the scale or necessity of existing military missions dedicated to safeguarding the production and transportation of energy resources across the globe.
873.
See,
e.g.,
EIA, Recent U.S. Imports of Oil Tend to Be Heavier Than Domestic Production, last revised: May 6, 2016, available at:
www.eia.gov/todayinenergy/detail.php?id=26132
(accessed: May 12, 2026).
890.
See
H.R. Rep. No. 94-340, at 6-10, 87-88 (1975) (available in the docket for this rulemaking) (“In 1973 the embargo affected 14 percent of U.S. petroleum consumption and precipitated a $10- to $20-billion drop in GNP . . . In June of 1973 the average selling price for regular gasoline was reported to be approximately 38.8 cents per gallon, including tax. By June of 1974 that price had increased to 55.1 cents per gallon, an addition in excess of 42 percent. Yet in the same period, gasoline demand went from 6.8 million barrels per day to 7.0 million barrels per day. In other words, gasoline demand actually increased by 2.9 percent even though prices had jumped by over 42 . . . Part B of title V of the bill establishes a long range program for improving automobile fuel economy by requiring manufacturers and importers to meet increasingly stringent average fuel economy standards, and to disclose the fuel economy of each new automobile sold in the United States.”).
897.
Energy Policy Act of 1992, Public Law 102-486 (1992) (“Title V of the Motor Vehicle Information and Cost Savings Act (15 U.S.C. 2001et seq.) is amended . . . in section 502(e)—(A) by striking `alcohol powered automobiles or natural gas powered' and inserting in lieu thereof `dedicated' ”).
900.
In 1994, Congress restated the laws related to transportation in one comprehensive title in the recodification of title 49 of the United States Code,
see
S. Rep. No. 103-265 (1994); H.R. Rep. No. 103-180 (1993). The recodification, which was enacted to restate without substantive change all transportation laws in one title, substituted simple language for “awkward and obsolete terms,” and eliminated superseded, executed, and obsolete laws. The standard changes made uniformly throughout the revised section are explained in a report preceding the law. Important for this interpretation, “[t]he words `may not' are used in a prohibitory sense, as `is not authorized to' and `is not permitted to.' ”
908.
Joint States, Docket No. NHTSA-2025-0491-6017, at 2; U.S. Chamber of Commerce, Docket No. NHTSA-2025-0490-0030, at 2; PMI, Docket No. NHTSA-2025-0491-5001-A2, at 21; IER, Docket No. NHTSA-2025-0491-6029, at 3.
911.
API, Docket No. NHTSA-2025-0490-0053, at 3; IER, Docket No. NHTSA-2025-0491-6029, at 3; U.S. Chamber of Commerce, Docket No. NHTSA-2025-0490-0030, at 2; PMI, Docket No. NHTSA-2025-0491-5001-A2, at 57-8; Diana Furchtgott-Roth, Docket No. NHTSA-2025-0491-5765-A1, at 1-4.
912.
U.S. Chamber of Commerce, Docket No. NHTSA-2025-0490-0030, at 2; API, Docket No. NHTSA-2025-0490-0053, at 3; IER, Docket No. NHTSA-2025-0491-6029, at 3; PMI, Docket No. NHTSA-2025-0491-5001-A2, at 58; Diana Furchtgott-Roth, Docket No. NHTSA-2025-0491-5765-A1, at 1-4; NACS
et al.,
Docket No. NHTSA-2025-0491-6034, at 2-5.
914.
NRDC
et al.,
Docket No. NHTSA-2025-0491-5928-A2, at 13; Attorneys General, Docket No. NHTSA-2025-0491-6064-A2, at 38; South Coast AQMD, Docket No. NHTSA-2025-0490-0064, at 1-2; ZETA, Docket No. NHTSA-2025-0491-6039-A1, at 9; Sabin
et al.,
Docket No. NHTSA-2025-0491-5808, at 8; NACAA, Docket No. NHTSA-2025-0491-5884, at 2, 11-12.
917.
NRDC
et al.,
Docket No. NHTSA-2025-0491-5928-A2, at 16; Sabin
et al.,
Docket No. NHTSA-2025-0491-5808, at 7-8; ZETA, Docket No. NHTSA-2025-0491-6039-A1, at 10; Attorneys General, Docket No. NHTSA-2025-0491-6064-A2, at 43-47.
921.
ZETA, Docket No. NHTSA-2025-0491-6039-A1, at 9; Oakley Vincent (O Kevin Vincent), Docket No. NHTSA-2025-0491-6036, at 1-2; NACAA, Docket No. NHTSA-2025-0491-5884, at 12.
930.
NRDC
et al.,
Docket No. NHTSA-2025-0491-5928-A2, at 17; Attorneys General, Docket No. NHTSA-2025-0491-6064-A2, at 44-49; GreenLatinos, Docket No. NHTSA-2025-0491-4967, at 1.
934.
See Center for Biological Diversity
v.
NHTSA, 538 F.3d 1172, 1203-04 (9th Cir. 2008) (upholding NHTSA's analysis of vehicle safety issues associated with weight in connection with the MYs 2008-2011 light truck CAFE rulemaking).
940.
See the 2010 final rule, which considered among the regulatory alternatives one that maximized net benefits, but explained that nothing in EPCA or EISA mandated that NHTSA choose CAFE standards that maximize net benefits (75 FR 25324, 25606 (May 7, 2010)); the 2012 final rule, which also considered among the regulatory alternatives one that maximized net benefits, and also explained that nothing in EPCA or EISA mandated that NHTSA choose CAFE standards that maximize net benefits, in fact, directly rejecting the regulatory alternative that maximized net benefits as beyond maximum feasible for the MYs 2017-2025 timeframe (77 FR 62624 (Oct. 15, 2012)); and the 2020 final rule, which stated that if the difference in net benefits between regulatory alternatives was within $20 billion, it was relatively small in the total context of the program and therefore the agency did not believe that the point at which net benefits were maximized was meaningful for determining maximum feasible CAFE standards in that final rule.
942.
See DOT, Ensuring Reliance Upon Sound Economic Analysis in Department of Transportation Policies, Programs, and Activities, DOT Order 2100.7, DOT: Washington, DC (2025), available at:
www.transportation.gov/mission/ensuring-reliance-upon-sound-economic-analysis-department-transportation-policies-programs
(accessed: May 29, 2026), which requires DOT rulemaking activities to be based on sound economic principles and analysis supported by rigorous cost-benefit requirements and data-driven decisions regardless of whether the rulemaking falls below the economic threshold required for review by the Office of Information and Regulatory Affairs.
946.
NHTSA notes that in all modern CAFE analyses NHTSA employed a threshold at which regulatory costs (technology costs plus civil penalty payments) would be indicative that a standard exceeded maximum feasibility. NHTSA's longstanding position that a standard that would require significant civil penalty payment would exceed maximum feasibility remains unchanged.
947.
49 U.S.C. 32902(h). It could be considered evading the statutory prohibition to instead consider an alternative means of addressing a shortfall, such as through the use of credit application.
965.
NHTSA is finalizing a few additional technical amendments in this final rule that were not included in the NPRM. NHTSA's conclusion that there is good cause to finalize these without notice and comment is discussed in this section.
969.
86 FR 49602 (Sept. 3, 2021); 88 FR 56128 (Aug. 17, 2023). See also
Regulations.gov, Learn About the Regulatory Process, available at:
www.regulations.gov/learn
(accessed: May 28, 2026) (“In a typical case, an agency will allow 60 days for public comment. However, in some cases, they provide either shorter or longer comment periods.”).
977.
Seven Cnty. Infrastructure Coal.
v.
Eagle Cnty., Colorado, 145 S. Ct. 1497 (2025); see also
Sierra Club
v.
FERC,
145 F.4th 74, 88-9 (D.C. Cir. 2025).
978.
See
Seven Cnty. Infrastructure Coal.
v.
Eagle Cnty., Colorado, 145 S. Ct. 1497, 1504 (2025) (“Courts should defer to agencies' discretionary decisions about where to draw the line when considering indirect environmental effects and whether to analyze effects from other projects separate in time or place. See
Department of Transportation
v.
Public Citizen, 541 U.S. 752, 767, 124 S. Ct. 2204, 159 L.Ed.2d 60. In sum, when assessing significant environmental effects and feasible alternatives for purposes of NEPA, an agency will invariably make a series of fact-dependent, context-specific, and policy-laden choices about the depth and breadth of its inquiry—and also about the length, content, and level of detail of the resulting EIS. Courts should afford substantial deference and should not micromanage those agency choices so long as they fall within a broad zone of reasonableness.”).
984.
See
CPAC-CRF, Docket No. NHTSA-2025-0491-5054, at 9, 11; China WTO/TBT National Notification & Enquiry Center (China WTO/TBT), Docket No. NHTSA-2025-0491-5056, at 4; Daniel Anderson, Docket No. NHTSA-2025-0491-5042.
988.
See, e.g., Phoenix Hydro Corp.
v.
FERC, 775 F.2d 1187, 1191 (D.C. Cir. 1985);
Alabama Educ. Ass'n
v.
Chao, 455 F.3d 386, 392 (D.C. Cir. 2006) (quoting
Motor Vehicle Mfrs. Ass'n of U.S., Inc.
v.
State Farm Mut. Auto. Ins. Co.,
463 U.S. 29, 57 (1983));
Encino Motorcars, LLC
v.
Navarro, 136 S. Ct. 2117, 2125 (2016);
FCC
v.
Fox Television Stations, Inc.,
556 U.S. 502 (2009).
991.
In accordance with E.O. 12866 and Circular A-4, to evaluate properly the benefits and costs of regulations and their alternatives, agencies must identify a “no-action” baseline: what the world will be like if the final rule is not adopted.
992.
42 U.S.C. 7507. Other States have adopted California's ZEV program requirements under sec. 177 of the Clean Air Act (so-called “Section 177 states”).
993.
Fuel economy for EVs is determined using the PEF set by the Department of Energy. For example, one EV manufacturer had a fuel economy performance of 739.9 and 751.9 miles per gallon for its MY 2020 domestic passenger and light truck fleets as compared to the 43.4 and 30.2 miles per gallon overall performance of the same fleets for all manufacturers.
995.
Provisional performance values are based on non-final fuel economy performance (
i.e.,
submitted to NHTSA as part of manufacturers' pre- and mid-model year reports, but not EPA final compliance data) and are subject to change based on final verified fuel economy values and sales volumes.
998.
The stringency of the MYs 2024-2026 standards was one reason why NHTSA held non-passenger automobile standards flat in MYs 2027-2028 in the 2024 final rule.
See 89 FR 52540, 52848 (June 24, 2024) (“Further stringency increases at a comparable rate, immediately on the heels of the increases for model years 2024-2026, may therefore be beyond maximum feasible for model years 2027-2032.”).
999.
See,
e.g.,
Isidore, C., Ford Just Reported a Massive Loss on Every Electric Vehicle It Sold, last revised: Apr. 25, 2024, CNN, available at:
www.cnn.com/2024/04/24/business/ford-earnings-ev-losses
(accessed: May 28, 2026); Miller, C., GM's Electric Vehicles Finally Earned More Than They Cost to Make, Car and Driver, last revised: Jan. 29, 2025, Car and Driver, available at:
www.caranddriver.com/news/a63608612/gm-stops-losing-money-on-evs/
(accessed: May 28, 2026) (noting that GM's “variable profit positive” metric does not include “fixed costs such as creating new assembly lines, so GM's massive investments in its EV factories and the engineering of the new models are taken out of the equation.”). The production costs of EVs greatly exceed the manufacturers' current EV sales revenues and are cross-subsidized by the sale of gasoline- and diesel-powered vehicles. If the production of EVs actually did increase at the rate previously projected by NHTSA, which would require an unrealistic jump in consumer demand for EVs, automakers would no longer be able to subsidize the full extent of their losses on EVs through price increases on gasoline- and diesel-powered vehicles.
1000.
Manufacturers cannot easily add a new production line to an existing assembly facility to produce an EV, given differences in manufacturing processes and facility needs. Instead, manufacturers generally either convert an existing facility away from internal combustion vehicle assembly or build a new facility—adding to overall costs and reducing production capacity for internal combustion vehicles. Similarly, suppliers cannot simply add a propulsion battery production line to an existing facility, and much of the expertise and intellectual property for such technologies exists overseas—especially in China. These all add substantial expense for manufacturers, which is passed along to consumers in the form of higher prices.
1001.
87 FR 25888 (May 2, 2022). As the agency conceded in the previous rulemaking, there are massive costs involved with not only converting the fleets, but also the “ancillary costs of electric vehicles, such as building additional charging stations [and] improving the grid.” This includes costs borne by utility companies, and passed on to rate payers, to expand infrastructure to support an increased number of households charging vehicles at home or charging locations at private businesses or public locations—including high-powered DC fast charge equipment.
1002.
While internal combustion vehicles are also susceptible to fire risks (generally after a very severe high-speed crash), the risks presented by electric vehicle battery fires is on a significantly higher scale and can be presented in surprising situations.
See, e.g.,
Institute for Energy Research (IER), Hurricane Ian Is not a Friend of Electric Vehicles, last revised: Oct. 20, 2022, available at:
www.instituteforenergyresearch.org/renewable/hurricane-ian-is-not-a-friend-of-electric-vehicles/
(accessed: May 29, 2026). As happened in Hurricane Ian, during emergencies, these battery fires can force “local fire departments to divert resources away from hurricane recovery to control and contain the fires.” And these “fires can become life-threatening if water-damaged electric cars are parked near houses or in garages. Some Florida homes were lost to fires caused by flooded electric vehicles.”
1003.
See Larsson, F.
et al.,
Toxic fluoride gas emissions from lithium-ion battery fires,
Scientific Reports,
Vol. 7: 10018 (2017), available at:
doi.org/10.1038/s41598-017-09784-z
(accessed: May 29, 2026). While electric vehicle fires occur less frequently than conventional vehicle fires on a fleet-wide basis, when lithium-ion battery thermal runaway events do occur, they generate intense heat and toxic fluoride gas emissions, making them more difficult to extinguish than conventional vehicle fires and increasing the costs and management challenges of maintaining effective first responder capabilities. See also International Association of Fire Chiefs (IAFC), IAFC's Fire Department Response to Electric Vehicle Fire's Bulletin, available at:
www.iafc.org/topics-and-tools/resources/resource/iafc-s-fire-department-response-to-electric-vehicle-fires-bulletin
(accessed: May 29, 2026). The unique operational hazards associated with suppressing these batteries are forcing fire departments around the country to expend significant resources to purchase equipment capable of managing prolonged and unpredictable battery fires.
1029.
NRDC
et al.,
Docket No. NHTSA-2025-0491-5928-A2, at 77-81; ZETA, Docket No. NHTSA-2025-0491-6039-A1, at 7-9; Attorneys General, Docket No. NHTSA-2025-0491-6064-A2, at 29-34.
1038.
Sabin
et al.,
Docket No. NHTSA-2025-0491-5808, at 9-10; Colorado State Agencies, Docket No. NHTSA-2025-0491-4975, at 2; Attorneys General, Docket No. NHTSA-2025-0491-6064-A2, at 35-36.
1053.
NRDC
et al.,
Docket No. NHTSA-2025-0491-5928-A2, at 46-50; ZETA, Docket No. NHTSA-
2025-0491-6039-A1, at 5; Attorneys General, Docket No. NHTSA-2025-0491-6064-A2, at 59-62, 89-92.
1056.
NRDC
et al.,
Docket No. NHTSA-2025-0491-5928-A2, at 47; ZETA, Docket No. NHTSA-2025-0491-6039-A1, at 4; Attorneys General, Docket No. NHTSA-2025-0491-6064-A2, at 38-39, 50.
1057.
NRDC
et al.,
Docket No. NHTSA-2025-0491-5928-A2, at 48; ZETA, Docket No. NHTSA-2025-0491-6039-A1, at 4; Attorneys General, Docket No. NHTSA-2025-0491-6064-A2, at 50.
1069.
EIA, Hybrid Vehicle Sales Continue to Rise as Electric and Plug-In Vehicle Shares Remain Flat, last revised: May 30, 2025, available at:
www.eia.gov/todayinenergy/detail.php?id=65384#:~:text=
About%2022%25%20of%20light%2Dduty,the%20first%20quarter%20of%202024 (accessed: July 20, 2026).
1083.
Phase-in caps and the phase-in start year determine the maximum adoption rate for a given technology in a particular model year. Phase-in caps do not dictate how much a technology is applied by the model; rather, they represent how much of the fleet could have adopted the technology by a given model year. Note that phase-in caps limit technology adoption but not necessarily the maximum technology penetration. For instance, consider a phase-in cap on SHEVPS technology of 0.5 percent per year with a phase-in start year of MY 2000. For an OEM that does not have any SHEVPS vehicles in its MY 2024 fleet, their maximum SHEVPS adoption is limited to 13 percent in MY 2025 (
i.e.,
0.50 percent year over year accruing for 26 years, MY 2000 to MY 2025). However, if an OEM has 50 percent SHEVPS vehicles in their MY 2024 fleet, with a phase-in cap of 0.50 percent per year, it is limited to 51 percent SHEVPS adoption in MY 2026.
1084.
In MY 2028, Ford's domestic car fleet represents approximately eight percent of the manufacturer's light-duty sales and contains the Mustang (five percent of Ford's light-duty sales), Corsair (two percent), and Escape (one percent). After reclassification, the Bronco Sport enters the fleet and shifts this regulatory class into compliance.
1111.
EIA, Today in Energy: United States Produces More Crude Oil Than Any Country, Ever, last revised: Mar. 11, 2024, available at:
www.eia.gov/todayinenergy/detail.php?id=61545#
(accessed: May 29, 2026).
1114.
Thorbecke, C., Gas Hits Highest Price in 6 years, Fuel Outages Persist Despite Colonial Pipeline Restart, last revised: May 17, 2021, available at:
abcnews.go.com/US/gas-hits-highest-price-years-fuel-outages-persist/story?id=77735010
(accessed: May 29, 2026) (gas prices in Southern States jumped 18-21 cents, while the national average rose eight cents).
1134.
Attorneys General, Docket No. NHTSA-2025-0491-6064-A2, at 73 (citing International Energy Agency (IEA), Oil 2025: Analysis and Forecast to 2030, IEA: Paris, France, p. 6 (2025), available at:
www.iea.org/reports/oil-2025
(accessed: May 28, 2026)).
1150.
Parry, I., & Darmstadter, J., The Costs of U.S. Oil Dependency, Resources for the Future Discussion Paper 03-59, Resources for the Future: Washington, DC (2003), available at:
www.rff.org/documents/1541/RFF-DP-03-59.pdf
(accessed: June 11, 2026).
1151.
See for example: Brown, S., New estimates of the security costs of U.S. oil consumption,
Energy Policy,
Vol. 113: pp. 171—92 (2018), available at:
doi.org/10.1016/j.enpol.2017.11.003
(accessed: June 9, 2026); Brown, S., & Huntington, H., Assessing the U.S. oil security premium,
Energy Economics,
Vol. 38: pp. 118—27 (2013), available at: 10.1016/j.eneco.2013.03.010 (accessed: May 26, 2026).
1159.
ZETA, Docket No. NHTSA-2025-0491-6039-A1, at 6; Attorneys General, Docket No. NHTSA-2025-0491-6064-A2, at 81-88; NRDC
et al.,
Docket No. NHTSA-2025-0491-5928-A2, at 62-64.
1161.
Attorneys General, Docket No. NHTSA-2025-0491-6064-A2, at 81-82; ZETA, Docket No. NHTSA-2025-0491-6039-A1, at 6; NRDC
et al.,
Docket No. NHTSA-2025-0491-5928-A2, at 62-64.
1170.
As is discussed in Chapter 8 of the FRIA, NHTSA estimates the benefits and costs of the regulatory alternatives under consideration from both model year and calendar year perspectives. The estimates shown here are for the model year approach.
1174.
NRDC
et al.,
Docket No. NHTSA-2025-0491-5948, at 7-8; CPAC-CRF, Docket No. NHTSA-2025-0491-5054, at 9; Daniel Anderson, Docket No. NHTSA-2025-0491-5042.
1177.
Total light-duty vehicle fuel consumption from 2024 to 2050 under the No-Action Alternative is projected to be 2,867 billion gasoline gallon equivalents (GGE).
1178.
The light-duty vehicle equivalency is based on an average per‐vehicle emissions estimate, which includes both tailpipe CO2
emissions and associated upstream emissions from fuel production and distribution. MOVES, the GREET model, and EPA analysis project that the average light-duty vehicle will account for 4.66 metric tons of CO2
emissions in 2035.
1180.
See, e.g.,
NRDC
et al.,
Docket No. NHTSA-2025-0491-5948, at 4-10. Additional comments about the scope of the environmental analysis are addressed in Appendix C of the Final SEIS.
1187.
NRDC
et al.,
Docket No. NHTSA-2025-0491-5928-A2, at 111-112; ZETA, Docket No. NHTSA-2025-0491-6039-A1, at 11-12; S. Sotomayor, Docket No. NHTSA-2025-0491-4888.
1196.
As prescribed in 49 U.S.C. 32901(a)(19)(B), an MDPV is “defined in section 86.1803-01 of title 40, Code of Federal Regulations, as in effect on the date of the enactment of the Ten-in-Ten Fuel Economy Act.” In accordance with the statutory definition, NHTSA defines MDPV at 49 CFR 523.2 as any complete or incomplete motor vehicle rated at more than 8,500 pounds GVWR and less than GVWR that is designed primarily to transport passengers, but does not include a vehicle that: (1) Is an “incomplete truck” meaning any truck that does not have the primary load carrying device or container attached; or (2) Has a seating capacity of more than 12 persons; or (3) Is designed for more than nine persons in seating rearward of the driver's seat; or (4) Is equipped with an open cargo area (for example, a pickup truck box or bed) of 72.0 inches in interior length or more. A covered box not readily accessible from the passenger compartment will be considered an open cargo area for purposes of this definition.
1197.
See “heavy-duty vehicle” definition in 40 CFR 86.1803-01. MDPVs are classified as either passenger automobiles or light trucks depending on whether they meet the criteria to be a non-passenger automobile under 49 CFR 523.5. If the MDPV is classified as a non-passenger automobile by meeting the requirements in 49 CFR 523.5, it is subject to the requirements in 49 CFR part 533. If the MDPV does not meet the criteria in 49 CFR 523.5 to be a non-passenger automobile, then it is classified as a passenger automobile and subject to the requirements in 49 CFR part 531.
1203.
In accordance with 49 U.S.C. 32903(g)(3)(C), the maximum increase in any compliance category attributable to transferred credits is 2.0 mpg.
1204.
In accordance with 49 U.S.C. 32903(f)(2) and (g)(4), manufacturers are restricted from using traded and transferred credits to resolve MDPCS shortfalls.
1219.
DOE, Composition of New U.S. Light-Duty Vehicles by Vehicle Type, last revised: Jan. 2024, available at:
afdc.energy.gov/data/10306
(accessed: June 5, 2026).
1220.
This is based on MY 2024 mid-model year reporting and includes dedicated alternative fuel automobiles. Considering only vehicles that are powered by internal combustion engines, the share of automobiles classified as non-passenger automobiles is 67.9 percent.
1222.
The catalog of reference specification sheets (broken down by manufacturer, by nameplate) used to populate and confirm missing information for vehicle reclassification is available on NHTSA's website. BMW Data, Ferrari Data, FCA Data, Ford Data, Hyundai Data, Ineos Data, Kia Data, Mazda Data, Mercedes Data, Nissan Data, Subaru Data, Toyota Data, Volvo Data, GM Data, Honda Data, Mitsubishi Data, VW Data, and JLR Data.
1226.
The first criterion is set in statute and NHTSA thus does not have authority to change it by regulation. While the third criterion is also set in statute, EPCA (as amended by EISA) provides the Secretary of Transportation with the flexibility to decide by regulation a significant feature (except 4-wheel drive) indicating that the automobile was designed for off-highway operation.
1234.
Porsche, Docket No. NHTSA-2025-0490-0044-A1, at 4; Stellantis, Docket No. NHTSA-2025-0491-5968-A1 at 6; The Alliance, Docket No. NHTSA-2025-0491-5707-A1, at 6.
1245.
All percentages described were evaluated using “Non-Passenger_FRM_Analysis.xlsx” in Docket No. NHTSA-2025-0491, tab “Existing Reg Classification.”
1246.
The Kia Seltos has a running clearance of 7.3 inches (~18.5 cm), below the 20 cm threshold. It has an approach angle of 28.0 degrees, meeting the minimum threshold.
1247.
An approach angle less than the minimum required departure angle for off-highway capability would mean that the automobiles represented in this bullet are geometrically more capable off-highway when driven in reverse.
1249.
In this same rulemaking, NHTSA is revising standards to ensure that manufacturers can meet the CAFE standards while also producing vehicles that consumers want to purchase.
1252.
NHTSA evaluated original manufacturer cataloged archives for vehicles that would have been classified as non-passenger via the off-highway pathway in 1975 using publicly available resources found at
autocatalogarchive.com/index-brand/
(accessed: June 18, 2026) and
www.jeepdatabase.com/
(accessed: June 18, 2026).
1266.
NHTSA does not believe that a significant number of consumers shopping for offroad vehicles evaluate CAFE classification as part of their decision-making process.
1267.
NHTSA evaluated original manufacturer cataloged archives for vehicles that would have been classified as non-passenger via the off-highway pathway in 1975 using publicly available resources found at
autocatalogarchive.com/index-brand/
(accessed: June 18, 2026) and
www.jeepdatabase.com/
(accessed: June 18, 2026).
1271.
See Non-Passenger_FRM_Analysis.xlsx, Docket No. NHTSA-2025-0491, tab “Existing Reg Classification,” filtered on compliance pathways (a)(2) and (a)(4) with BEVs removed.
1281.
Per 49 CFR 571.110 S.3, rated cargo load can be calculated as the vehicle capacity weight (payload capacity) minus 68 kg (150 lbs.) times the vehicle's designated seating capacity.
1282.
These sub-bullets reflect the finalized changes to criteria for off-highway capability, which are discussed in detail in preamble Section VI.B.1.b and Final TSD Chapter 2.7.
1285.
SAE, Performance Requirements for Determining Tow-Vehicle Gross Combination Weight Rating and Trailer Weight Rating, SAE Standard J2807_202411, SAE International: Warrendale, PA (2024), available at:
doi.org/10.4271/J2807_202411
(accessed: June 5, 2026).
1286.
The proposed weighting in the NPRM was
2/3
of towing capacity and
1/3
of payload capacity, with a threshold of greater than or equal to 5500, calculated in pounds.
1289.
The Alliance, Docket No. NHTSA-2025-0491-5707-A1, at 8, -A2 at 24-25; Stellantis, Docket No. NHTSA-2025-0491-5968-A1, at 7-8; Ford, Docket No. NHTSA-2025-0491-5821-A1, at 1-3.
1292.
SAE, Performance Requirements for Determining Tow-Vehicle Gross Combination Weight Rating and Trailer Weight Rating, SAE Standard J2807_202411, SAE International: Warrendale, PA (2024), available at:
doi.org/10.4271/J2807_202411
(accessed: May 28, 2026).
1298.
See Non-Passenger_FRM_Analysis.xlsx, which can be found in the rulemaking docket (NHTSA-2025-0491) in tab LDWF_Analysis for data and tabs LDWF Histogram and TWR Survival Analysis for figures.
1307.
In DOE's final rule (89 FR 22041, Mar. 29, 2024), DOE explained that “by significantly overvaluing the fuel savings effects of EVs in a mature EV market with CAFE standards in place, the fuel content factor [in the PEF] will disincentivize both increased production of EVs and increased deployment of more efficient ICE vehicles,” which DOE concludes “results in higher petroleum use than would otherwise occur.”
1308.
In EPA's Apr. 18, 2024, final rule (89 FR 27842), EPA noted that EVs are “receiving a windfall of credits [for AC efficiency technologies] that fails to correspond to any real-world reduction in vehicle emissions” and that there is “no technical basis for providing BEVs with off-cycle credits.”
1315.
Ferrari, Docket No. NHTSA-2025-0491-5062, at 4; MEMA, Docket No. NHTSA-2025-0491-5989, at 12; NRDC
et al.,
Docket No. NHTSA-2025-0491-5928-A1, at 14; ME DEP, Docket No. NHTSA-2025-0490-0026, at 4-5; ZETA, Docket No. NHTSA-2025-0491-6039, at 13-14.
1316.
NRDC
et al.,
Docket No. NHTSA-2025-0491-5928-A1, at 14; China WTO/TBT, Docket No. NHTSA-2025-0491-5056, at 3; ZETA, Docket No. NHTSA-2025-0491-6039-A1, at 13-15.
1323.
Attorneys General, Docket No. NHTSA-2025-0491-6064, at 6; ZETA, Docket No. NHTSA-2025-0491-6039-A1, at 12; Kharisma Montes de Oca, Docket No. NHTSA-2025-0491-4552, at 1; The Alliance, Docket No. NHTSA-2025-0491-5707-A1, at 12.
1325.
ZETA, Docket No. NHTSA-2025-0491-6039, at 14. NHTSA notes that while ZETA stated that NHTSA was proposing to end features that resulted in EVs having artificially high fuel economy values, DOE sets the PEF for EVs and EPA established the FCIV program that included BEVs until EPA issued its 2024 final rule (89 FR 27842) that prevents EVs from generating FCIVs starting in MY 2027. It appears ZETA misunderstood the difference between NHTSA's analysis supporting the setting of fuel economy standards and how manufacturers' fuel economy values are calculated for compliance purposes.
1347.
Nissan, Docket No. NHTSA-2025-0491-5857, at 7; Porsche, Docket No. NHTSA-2025-0490-0044, at 1; Stellantis, Docket No. NHTSA-2025-0491-5968-A2, at 6; Ford, Docket No. NHTSA-2025-0491-5821-A1, at 1-3, Mercedes-Benz, Docket No. NHTSA-2025-0491-5854-A1, at 4; Volkswagen, Docket No. NHTSA-2025-0491-5036-A1, at 2; Kia, Docket No. NHTSA-2025-0491-5123, at 5; and The Alliance, Docket No. NHTSA-2025-0491-5707-A1, at 8-9 and -A2, at 27-28.
1351.
SAE, Performance Requirements for Determining Tow-Vehicle Gross Combination Weight Rating and Trailer Weight Rating, SAE Standard J2807_202411, SAE International: Warrendale, PA (2024), available at:
doi.org/10.4271/J2807_202411
(accessed: May 28, 2026).
1352.
Further discussion on why NHTSA is moving forward with requiring TWR instead of GCWR can be found in preamble Section VI.B.1 and Final TSD Chapter 2.7.
1355.
For similar reasons, the court also held that the statute authorizing EPA to regulate the emissions of “motor vehicles” does not encompass trailers.
Id.
at 1200-03. The court affirmed, however, that both agencies still “can regulate
tractors
based on the trailers they pull.”
Id.
at 1208 (emphasis original). Moreover, NHTSA is still authorized to regulate trailers in other contexts, such as under 49 U.S.C. chapter 301.
See 49 U.S.C. 30102(a)(7) (defining “motor vehicle” to include “a vehicle . . . drawn by mechanical power”);
Truck Trailer Mfrs. Ass'n, Inc.,
17 F.4th at 1207 (“A trailer is `drawn by mechanical power.' ”).
1358.
DOT Order 5610.1D, sec. 26.l (“Mitigation means measures that avoid, minimize, or compensate for environmental impacts caused by a proposed action or alternatives . . . . While NEPA requires consideration of mitigation, it does not mandate the form or adoption of any mitigation.”).
1368.
NACAA, Docket No. NHTSA-2025-0491-5884, at 2, 5-8; Minnesota state agencies, Docket No. NHTSA-2025-0491-5847, at 2-4; CT DEEP, Docket No. NHTSA-2025-0491-5930, at 3-4; Attorneys General, Docket No. NHTSA-2025-0491-6064-A3, at 4; Sabin
et al.,
Docket No. NHTSA-2025-0491-5808, at 2-6.
1374.
ME DEP, Docket No. NHTSA-2025-0490-0026, at 6; OR DEQ, Docket No. NHTSA-2025-0491-5937, at 5; NACAA, Docket No. NHTSA-2025-0491-5884, at 7-8, 11; South Coast AQMD, Docket No. NHTSA-2025-0490-0064, at 2-5.
1377.
Dep't of Transp.
v.
Pub. Citizen,
541 U.S. 752, 772 (2004) (“The emissions from the Mexican trucks are not `direct' because they will not occur at the same time or at the same place as the promulgation of the regulations.”). NHTSA's final rule would establish fuel economy standards for MYs 2022-2031 passenger cars and light trucks; any emissions increases would occur in a different place and well after promulgation of the final rule.
1382.
See, e.g., Dep't of Transp.
v.
Pub. Citizen,
541 U.S. 752, 772-73 (2004);
S. Coast Air Quality Mgmt. Dist.
v.
Fed. Energy Regulatory Comm'n,
621 F.3d 1085, 1101 (9th Cir. 2010).
1385.
See 50 CFR 402.14(a) (“Each Federal agency shall review its actions at the earliest possible time to determine whether any action may affect listed species or critical habitat.”).
1390.
See DOI, Guidance on the Applicability of the Endangered Species Act Consultation Requirements to Proposed Actions Involving the Emissions of Greenhouse Gases, Solicitor's Opinion No. M-37017, DOI: Washington, DC (2008), available at:
www.doi.gov/sites/doi.opengov.ibmcloud.com/files/uploads/M-37017.pdf
(accessed: June 11, 2026).
1397.
Classified in NAICS under Subsector 336—Transportation Equipment Manufacturing for Automobile and Light Duty Motor Vehicle Manufacturing (336110). See U.S. Small Business Administration, Table of Size Standards, effective March 17, 2023, U.S. Small Business Administration: Washington, DC (2023), available at:
www.sba.gov/document/support-table-size-standards
(accessed: June 10, 2026).
Use this for formal legal and research references to the published document.
91 FR 61988
Web Citation
Suggested Web Citation
Use this when citing the archival web version of the document.
“The Safer Affordable Fuel-Efficient (SAFE) Vehicles Rule III for Model Years 2022 to 2031 Passenger Cars and Light Trucks,” thefederalregister.org (September 30, 2026), https://thefederalregister.org/documents/2026-19964/the-safer-affordable-fuel-efficient-safe-vehicles-rule-iii-for-model-years-2022-to-2031-passenger-cars-and-light-trucks.
 www.regulations.gov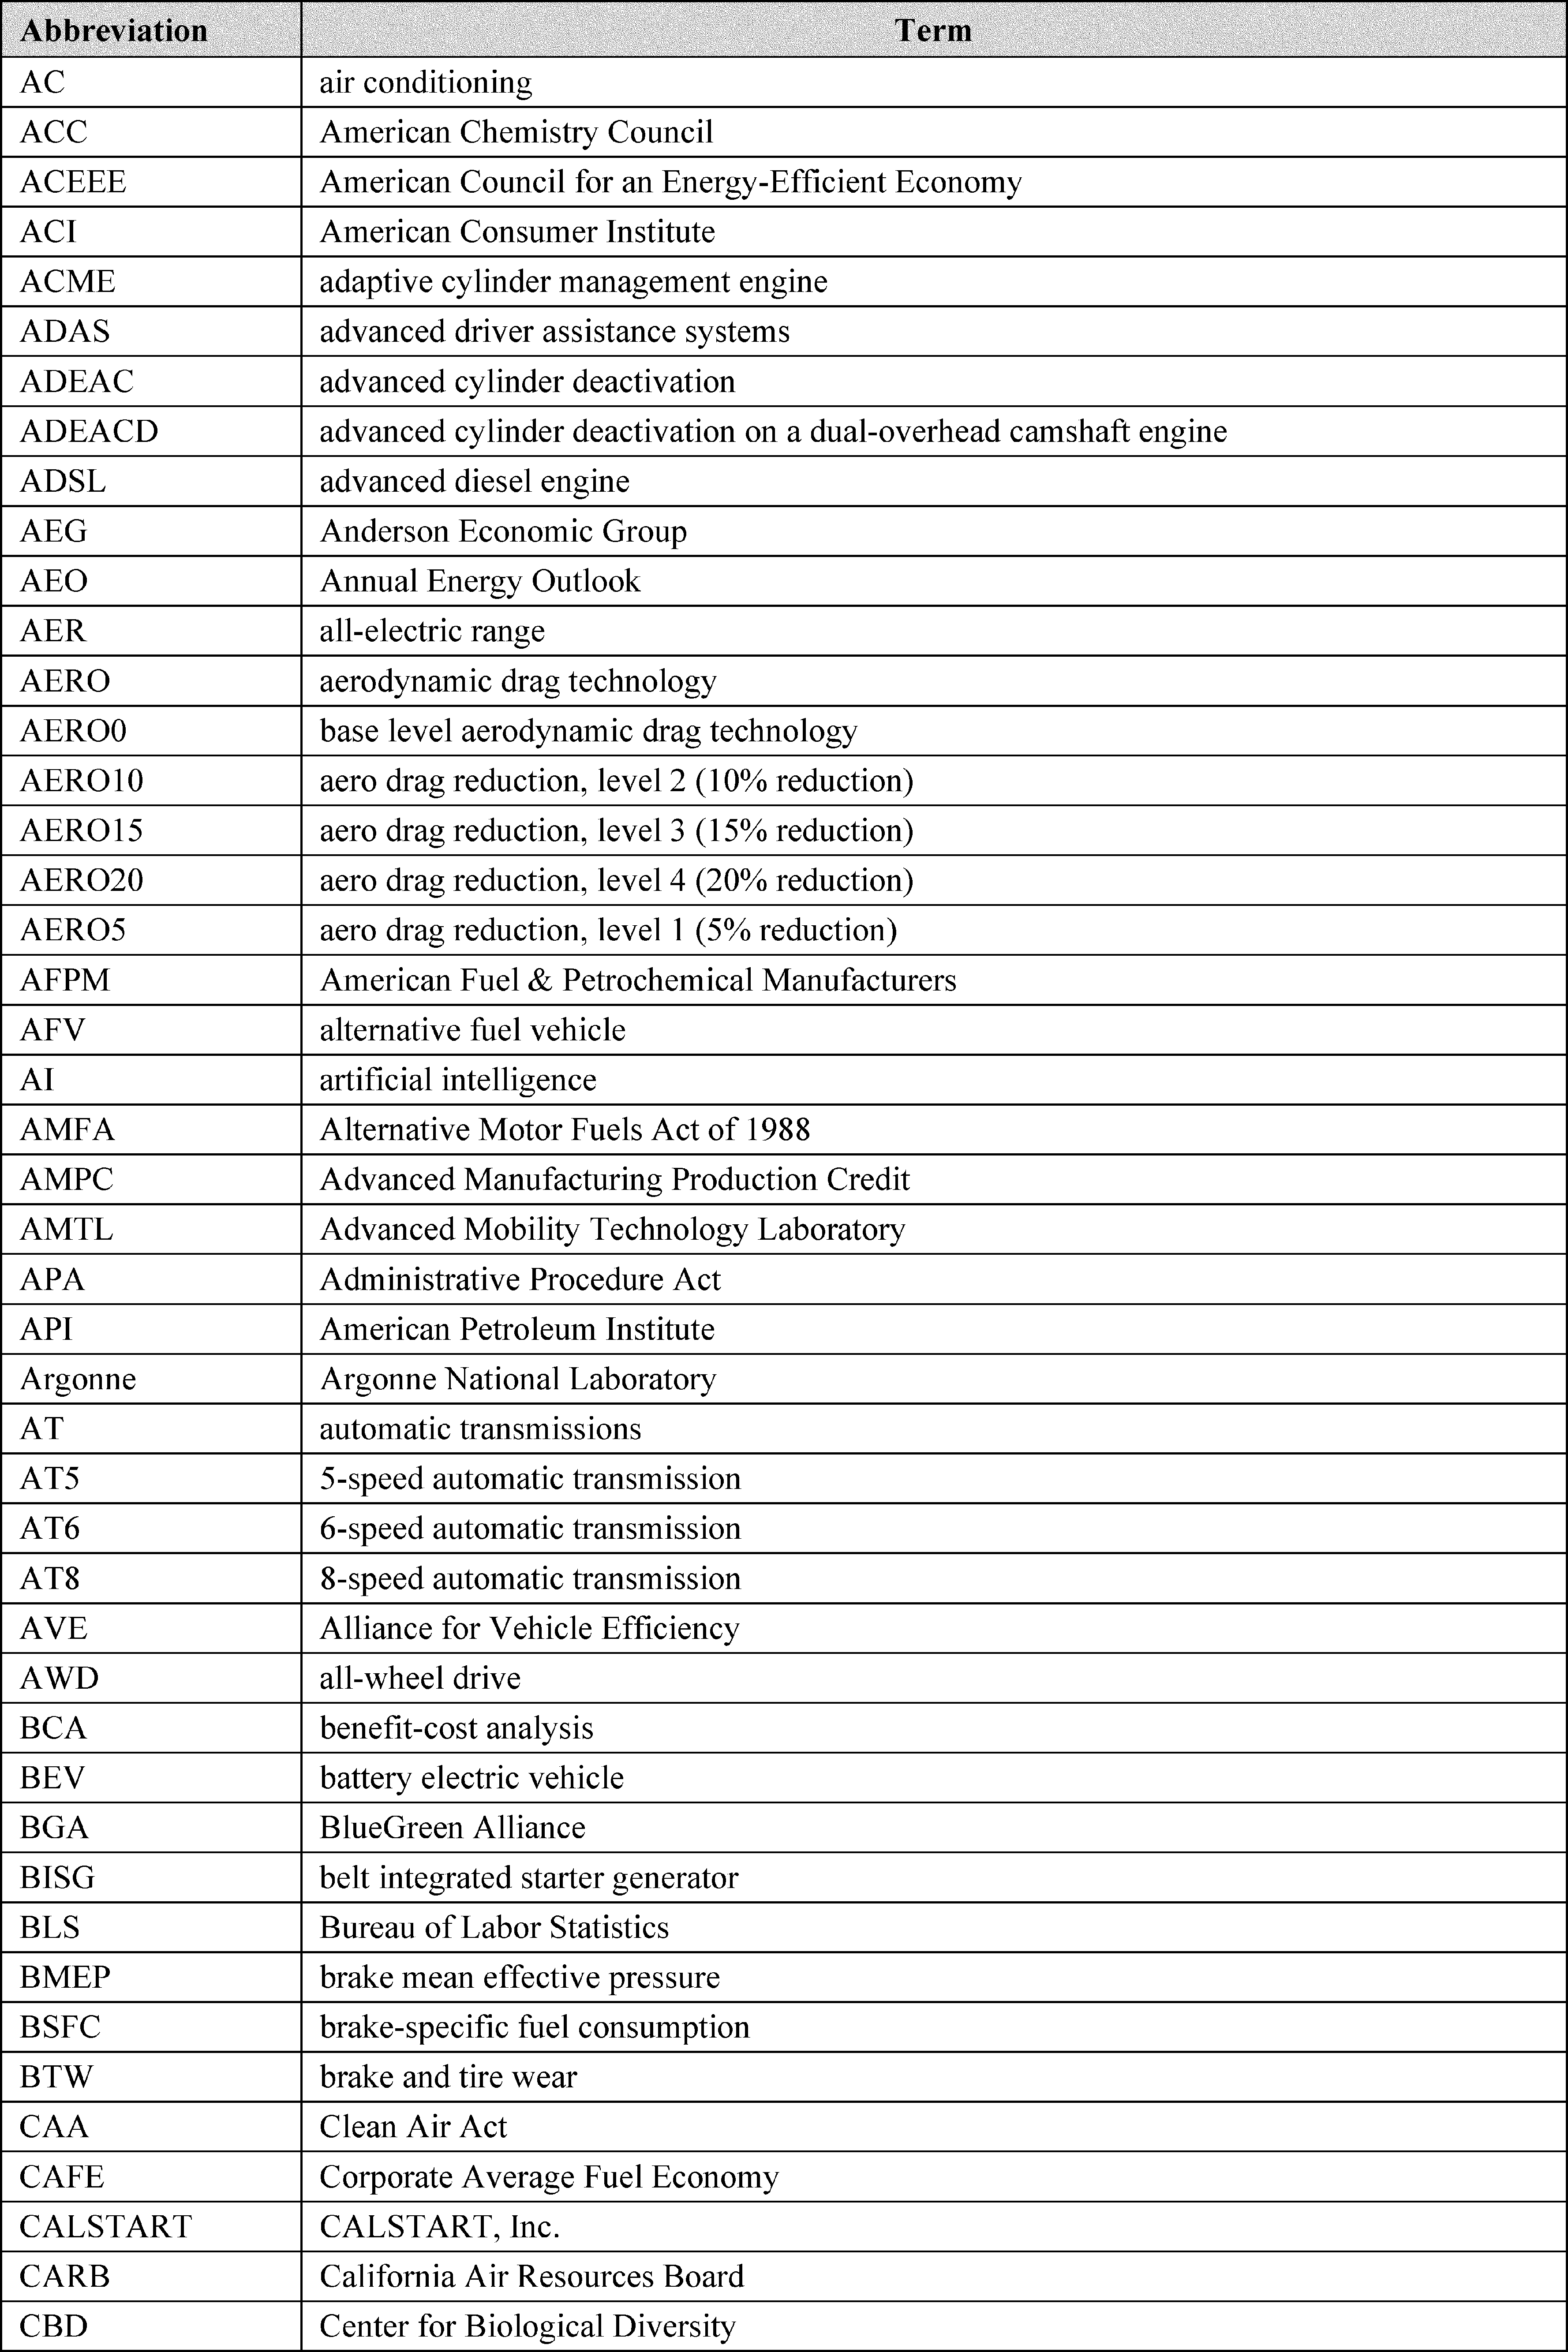
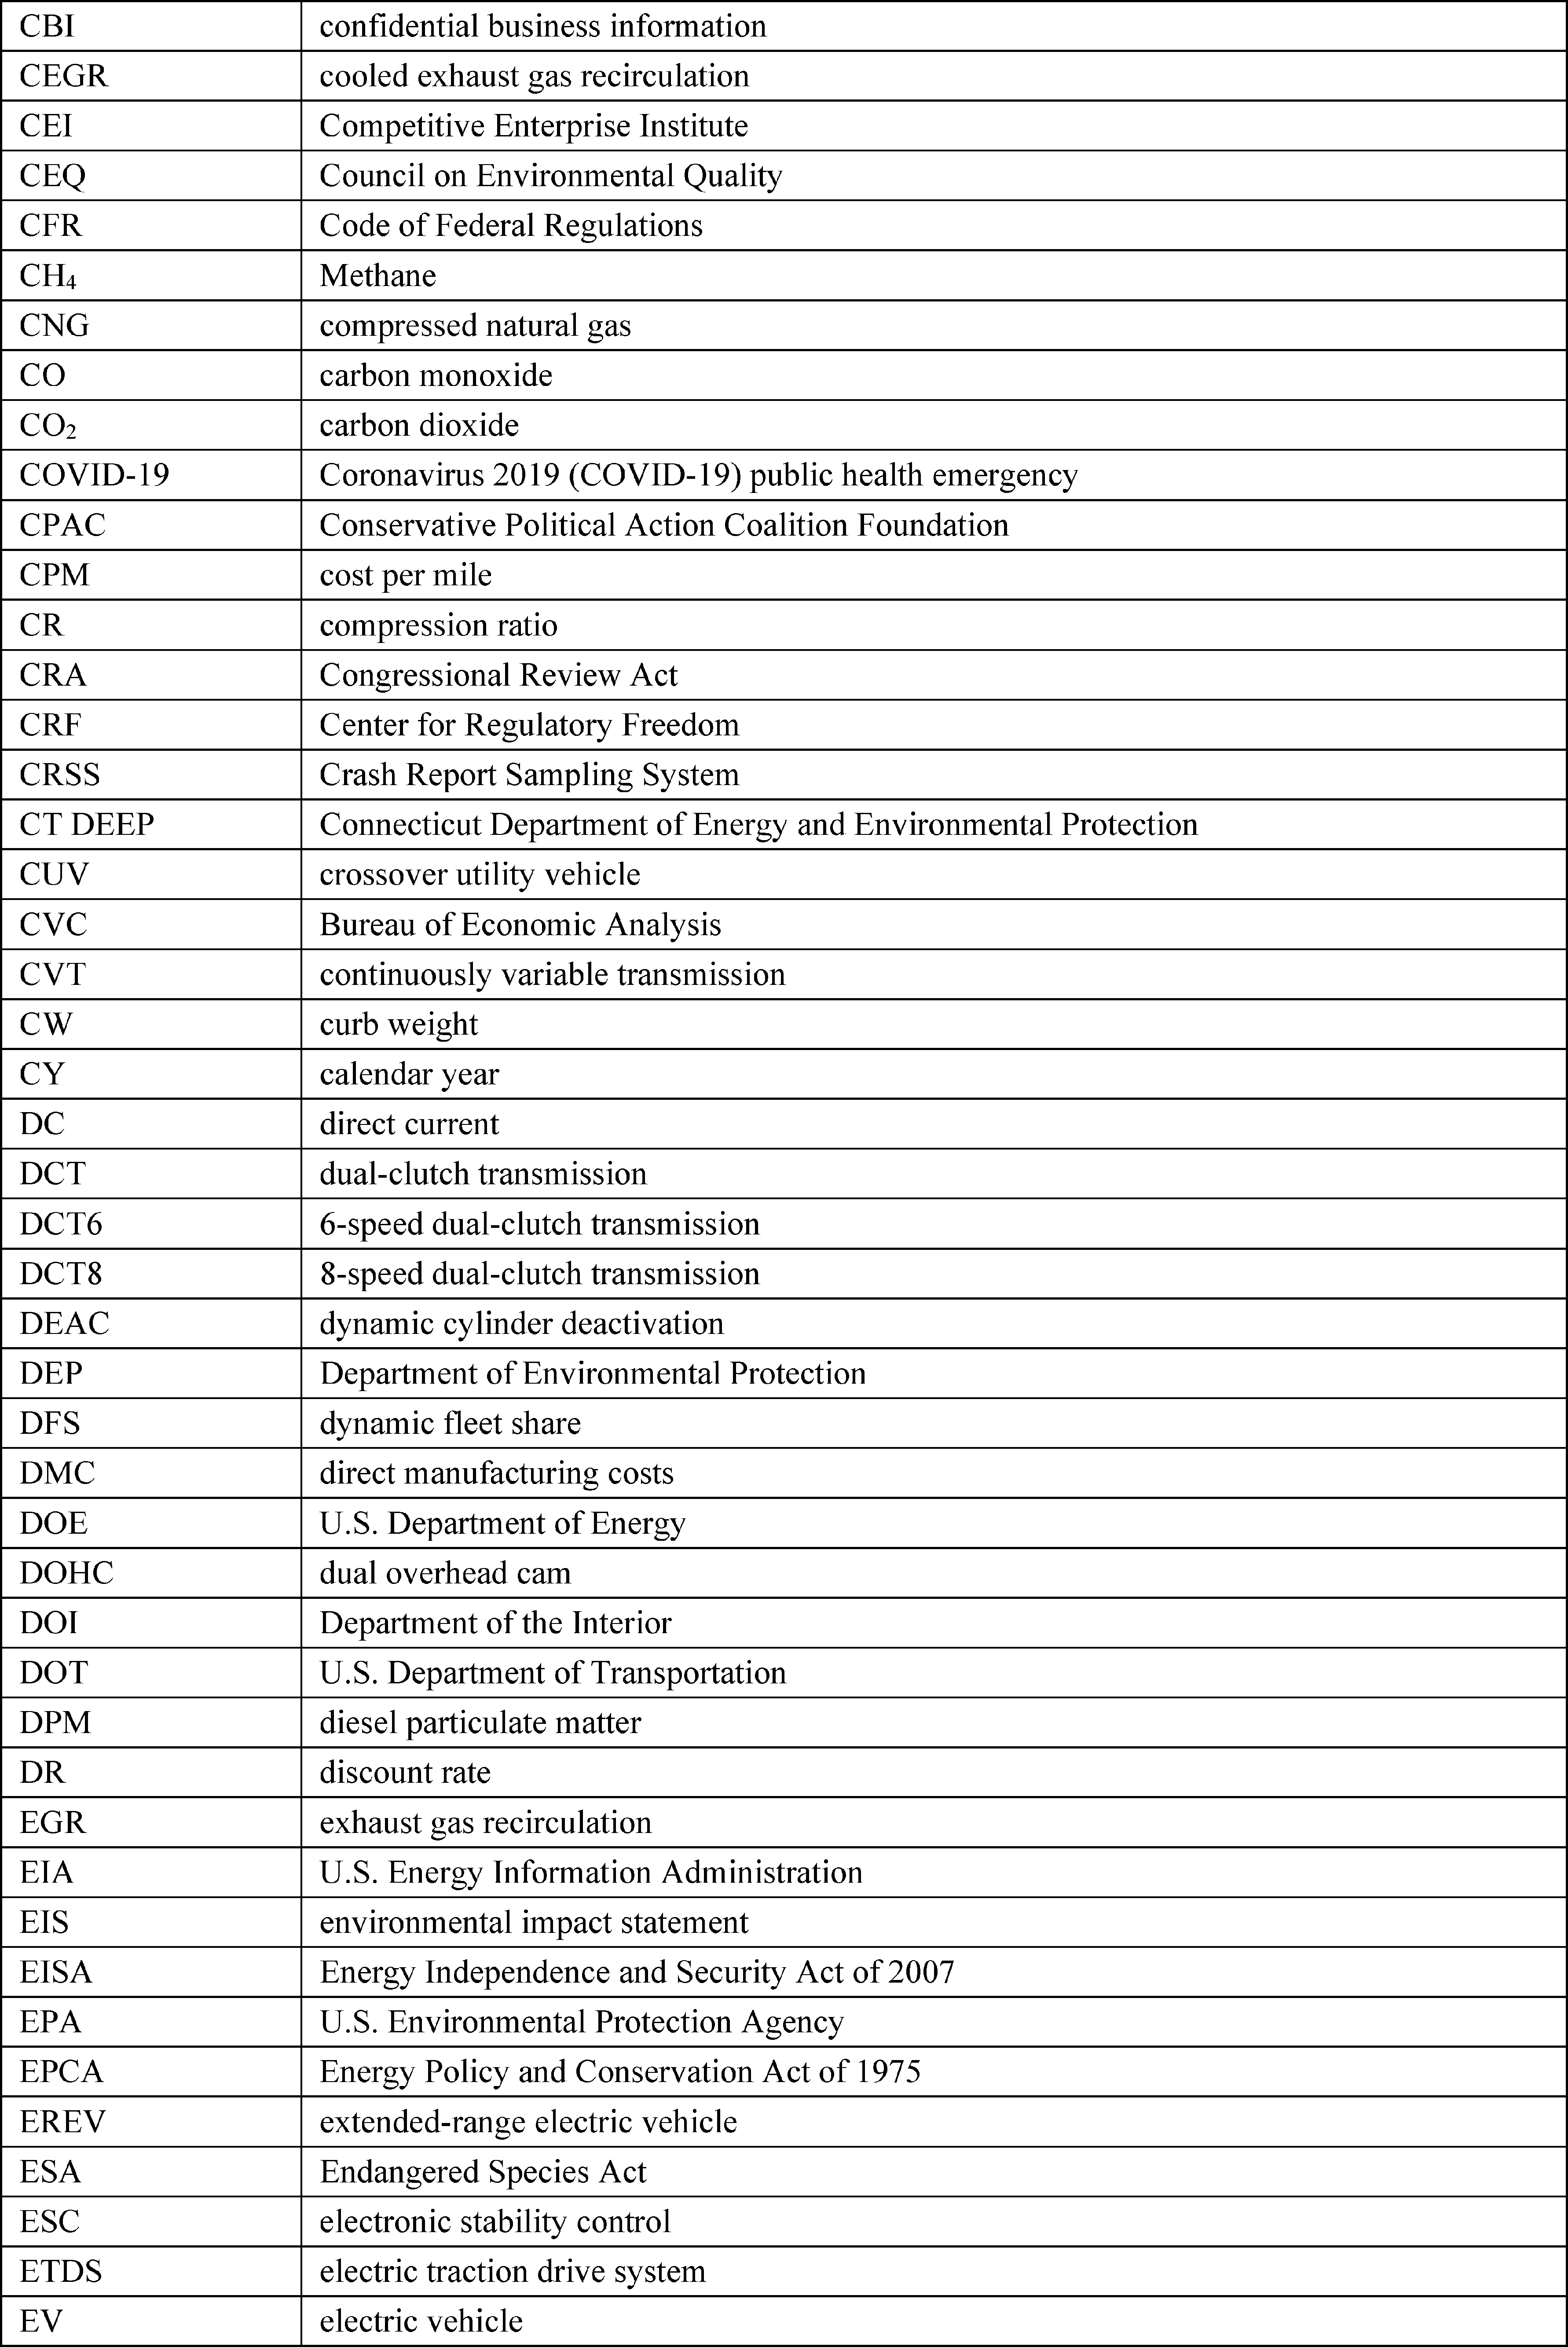
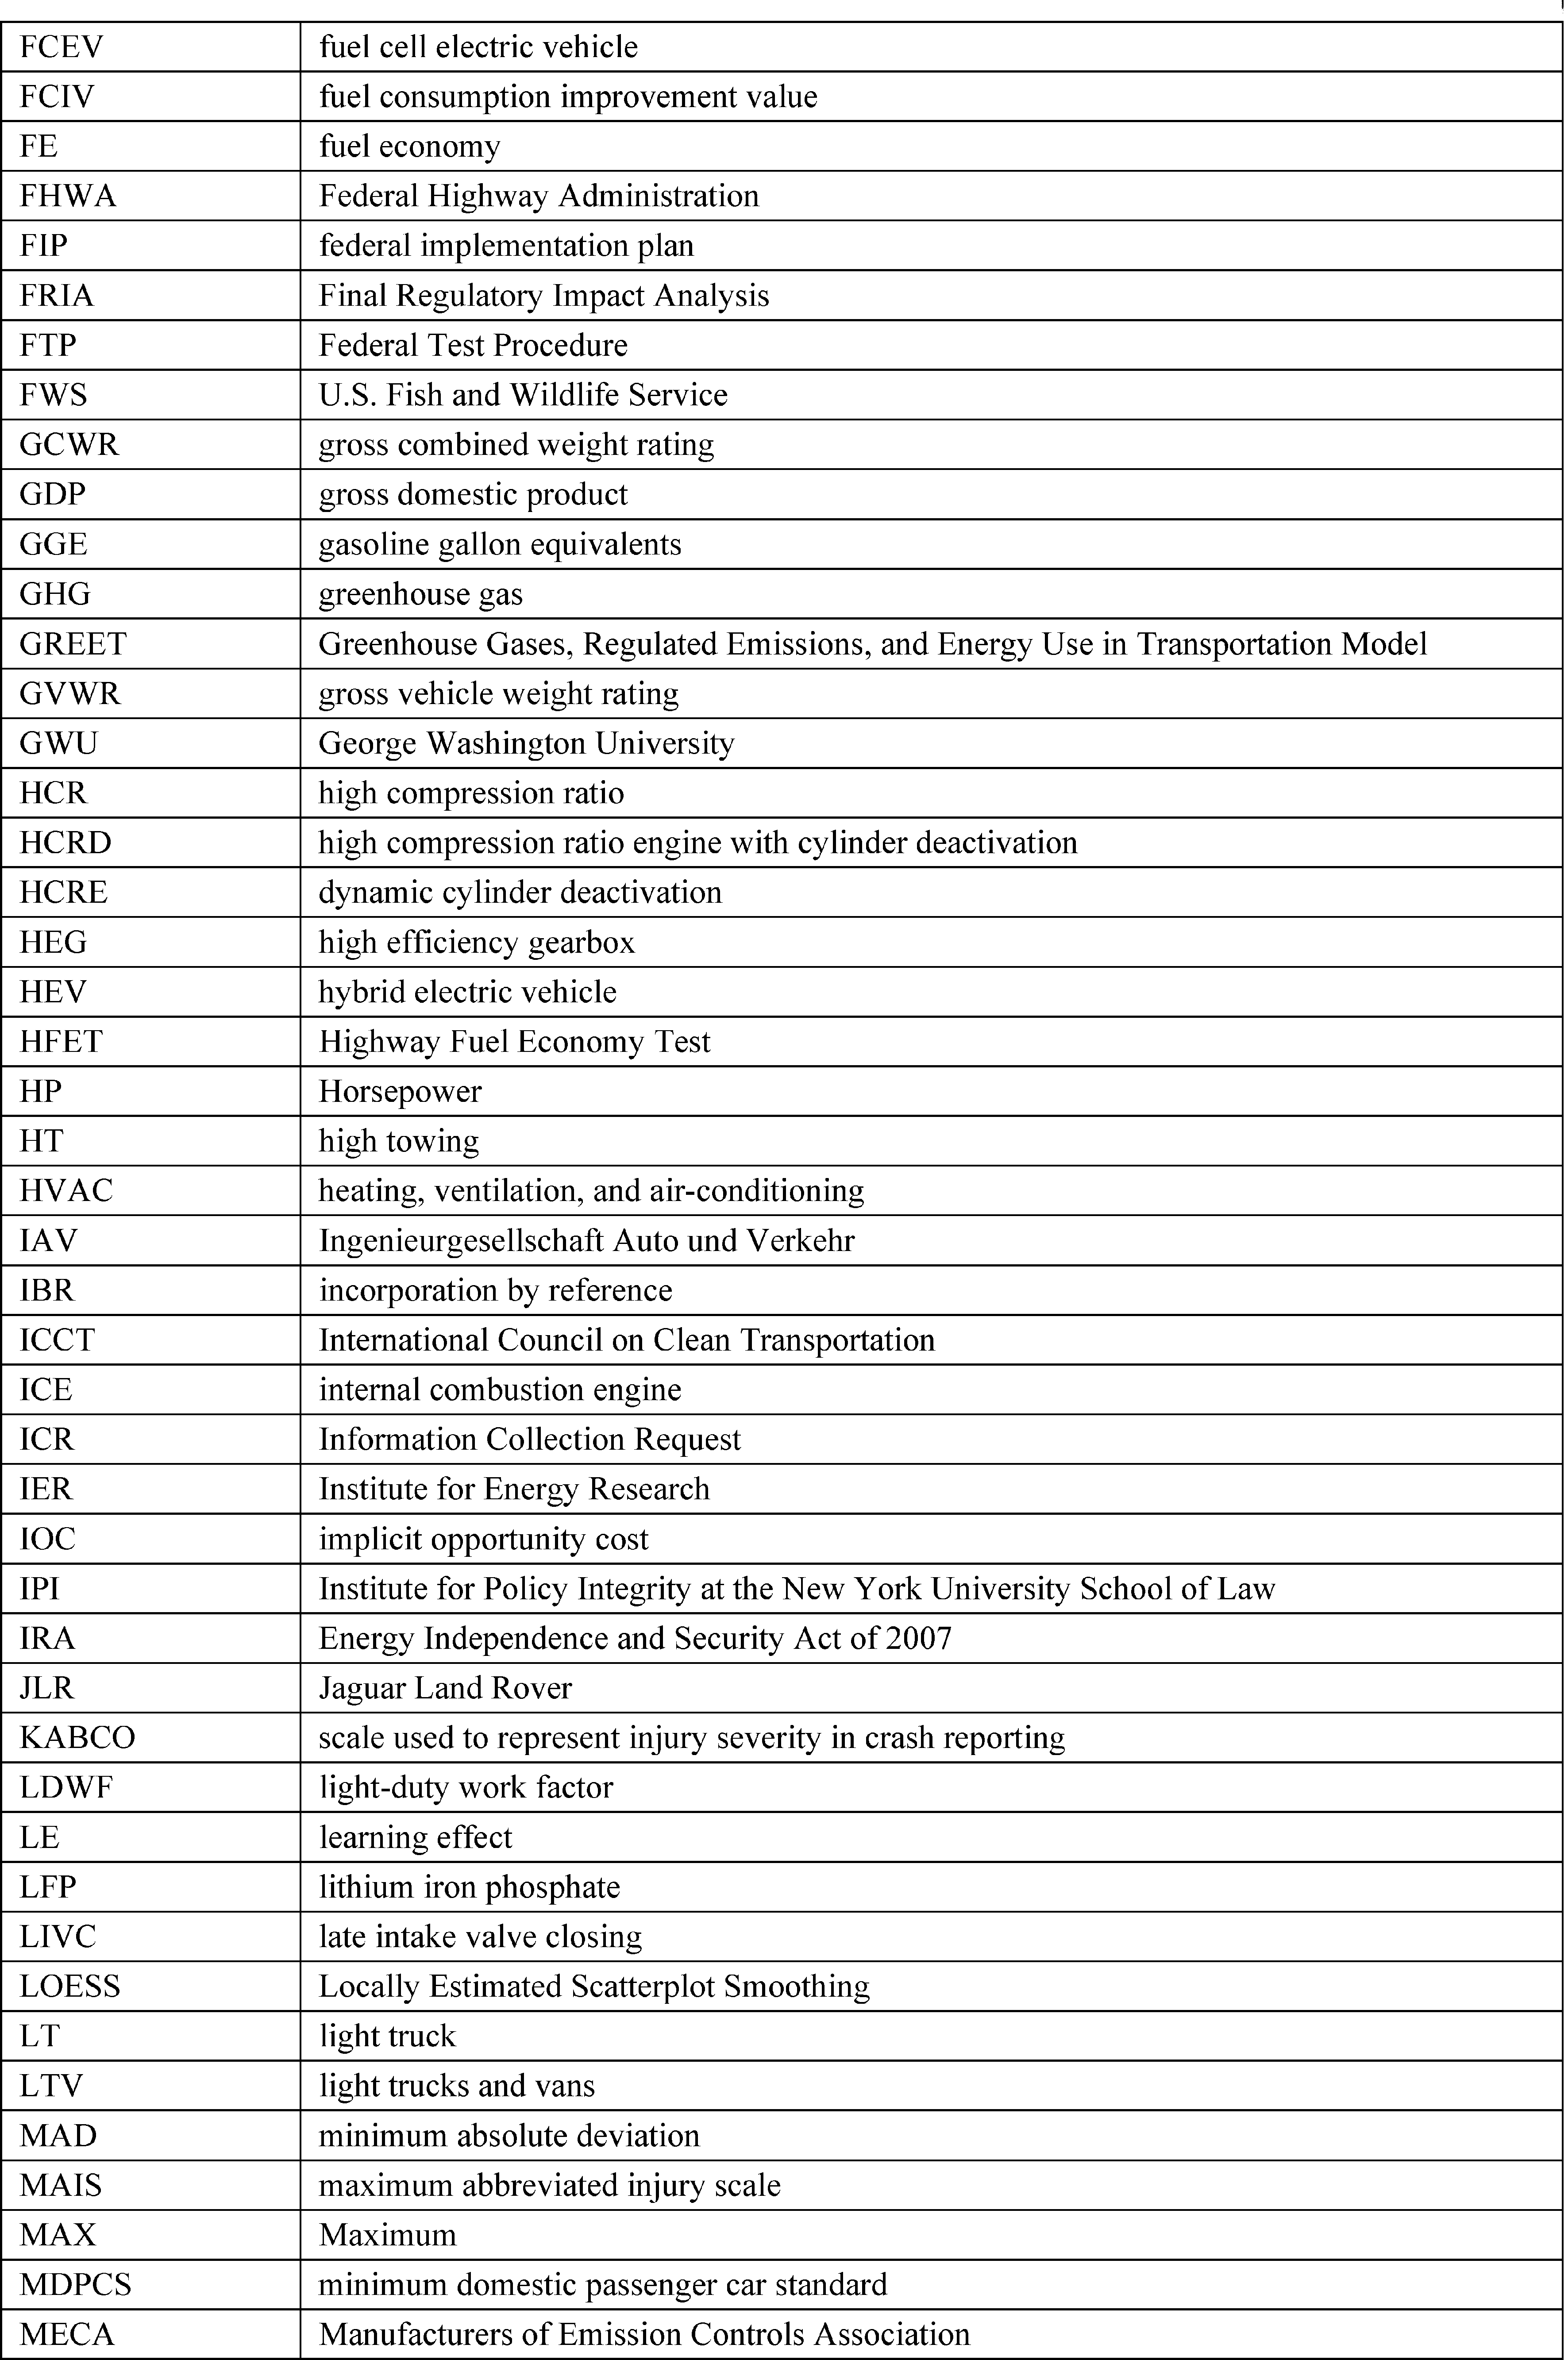
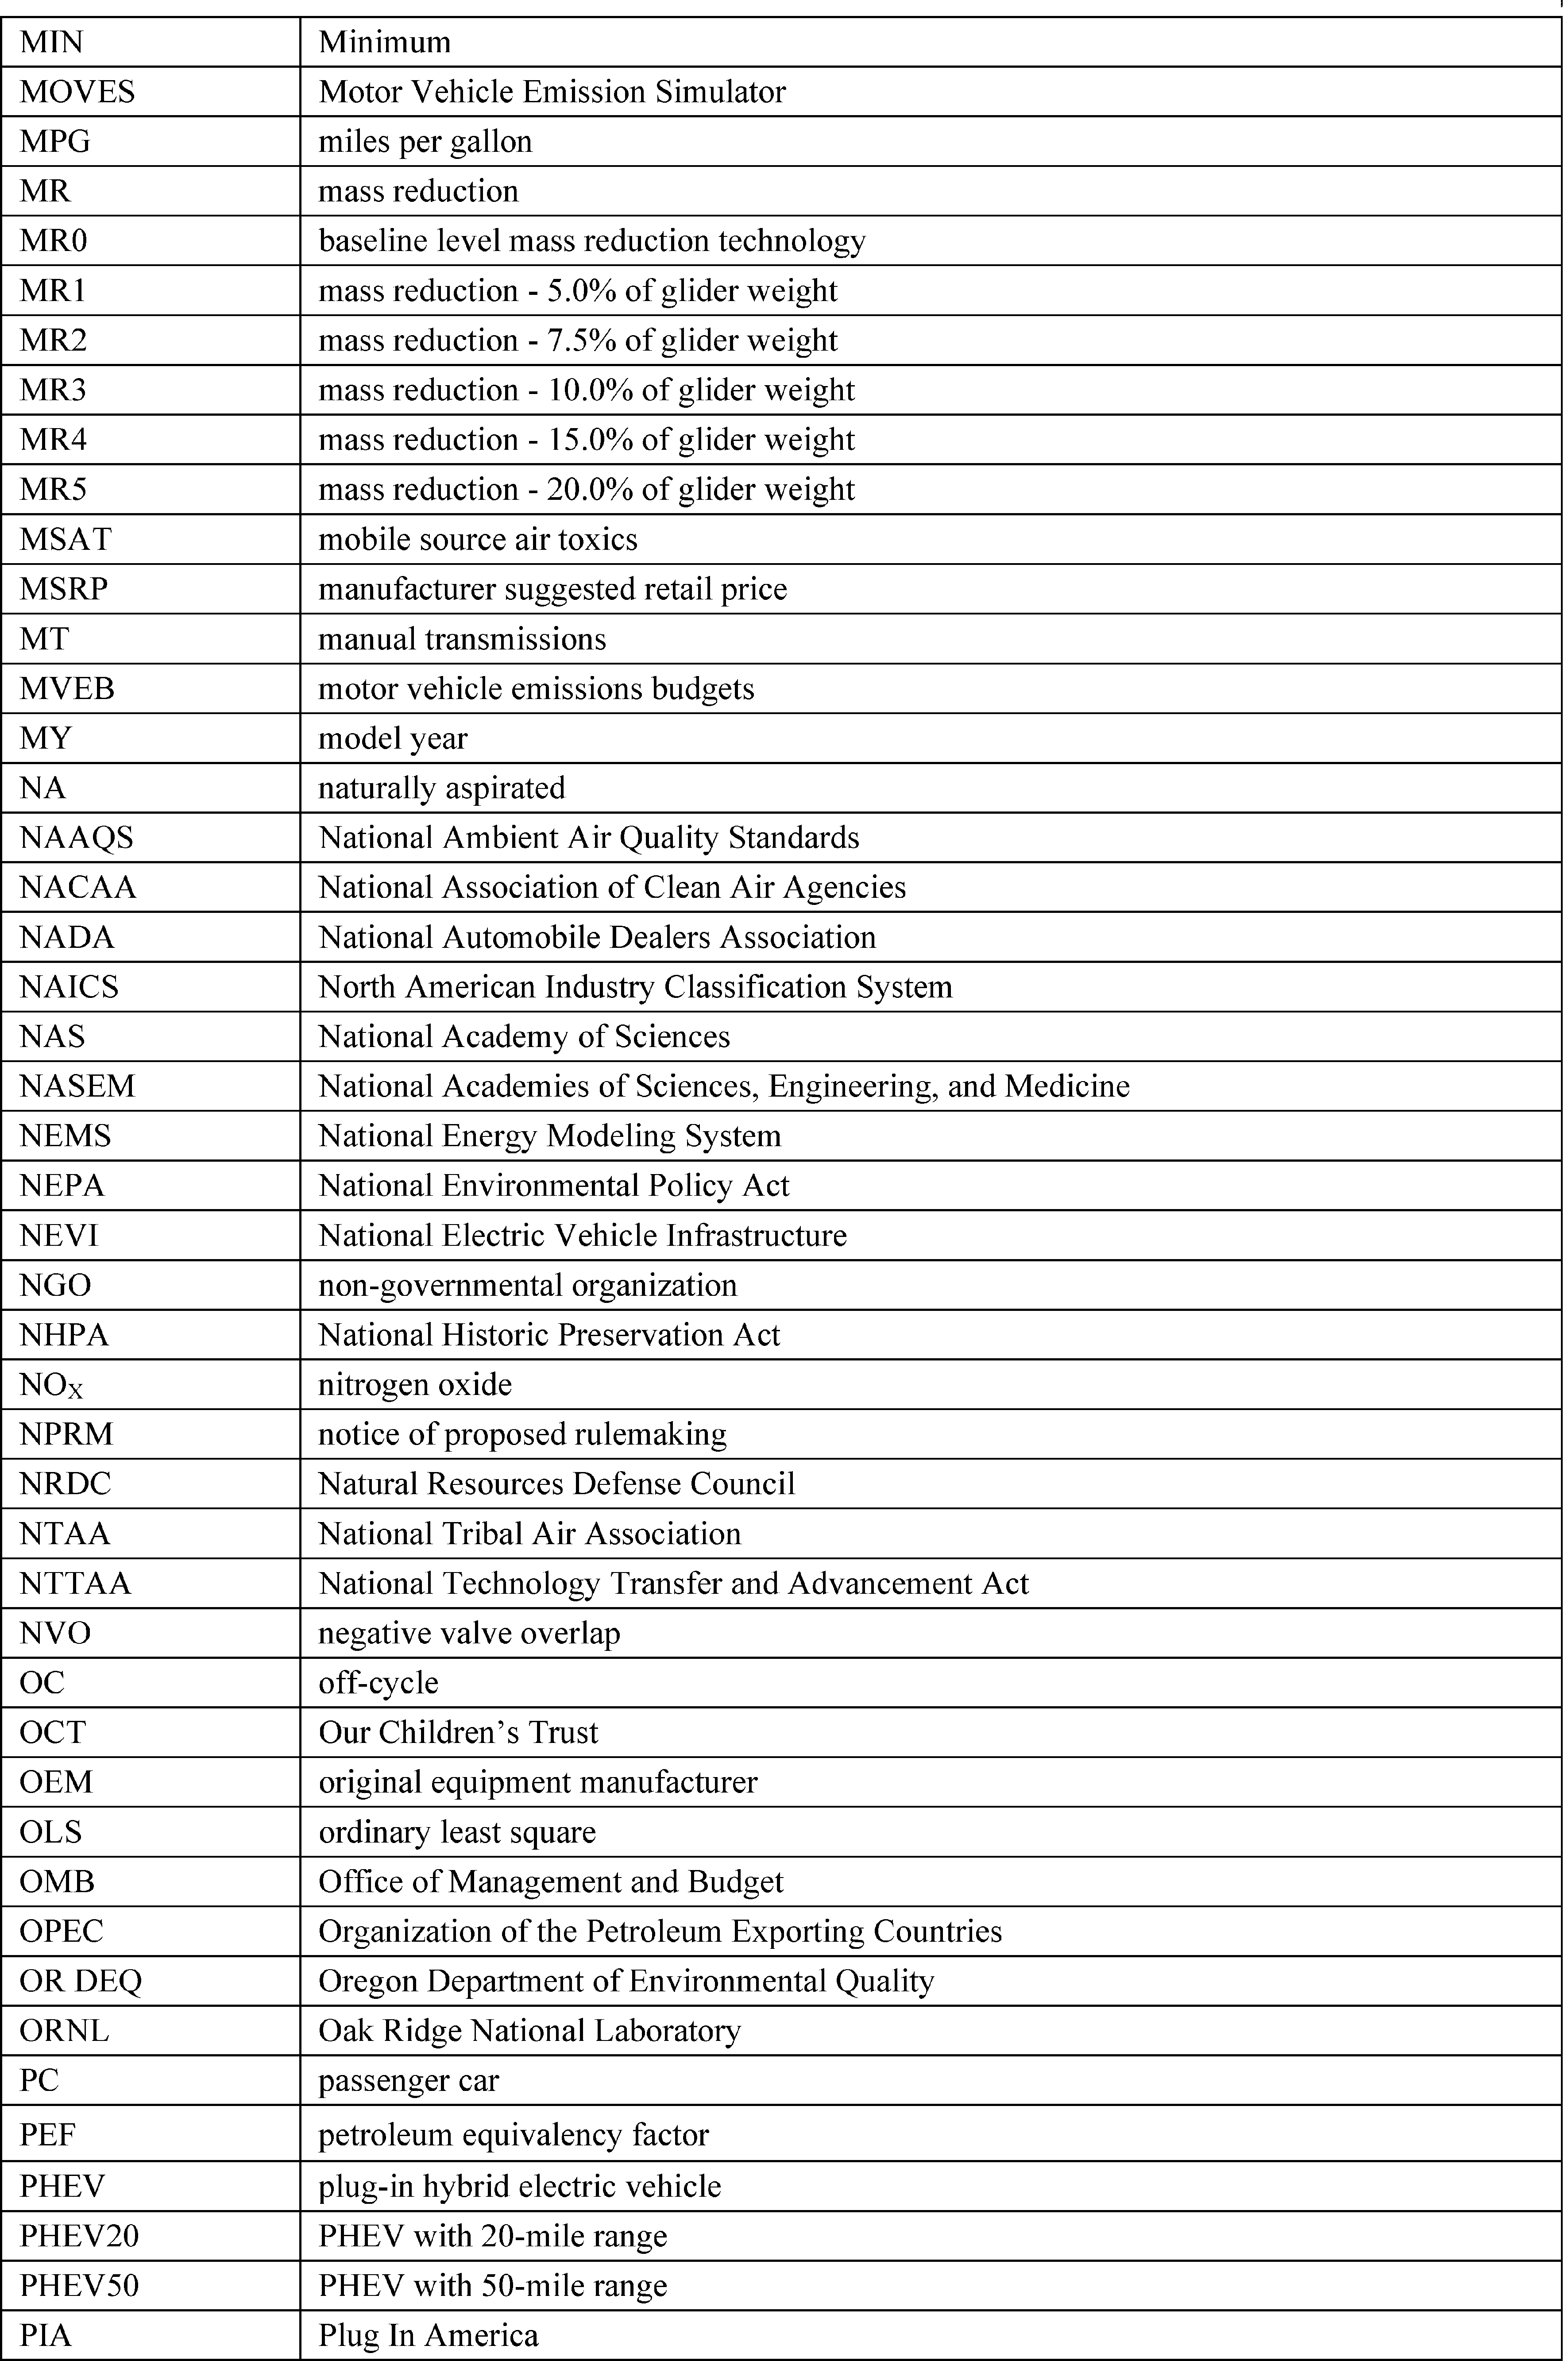
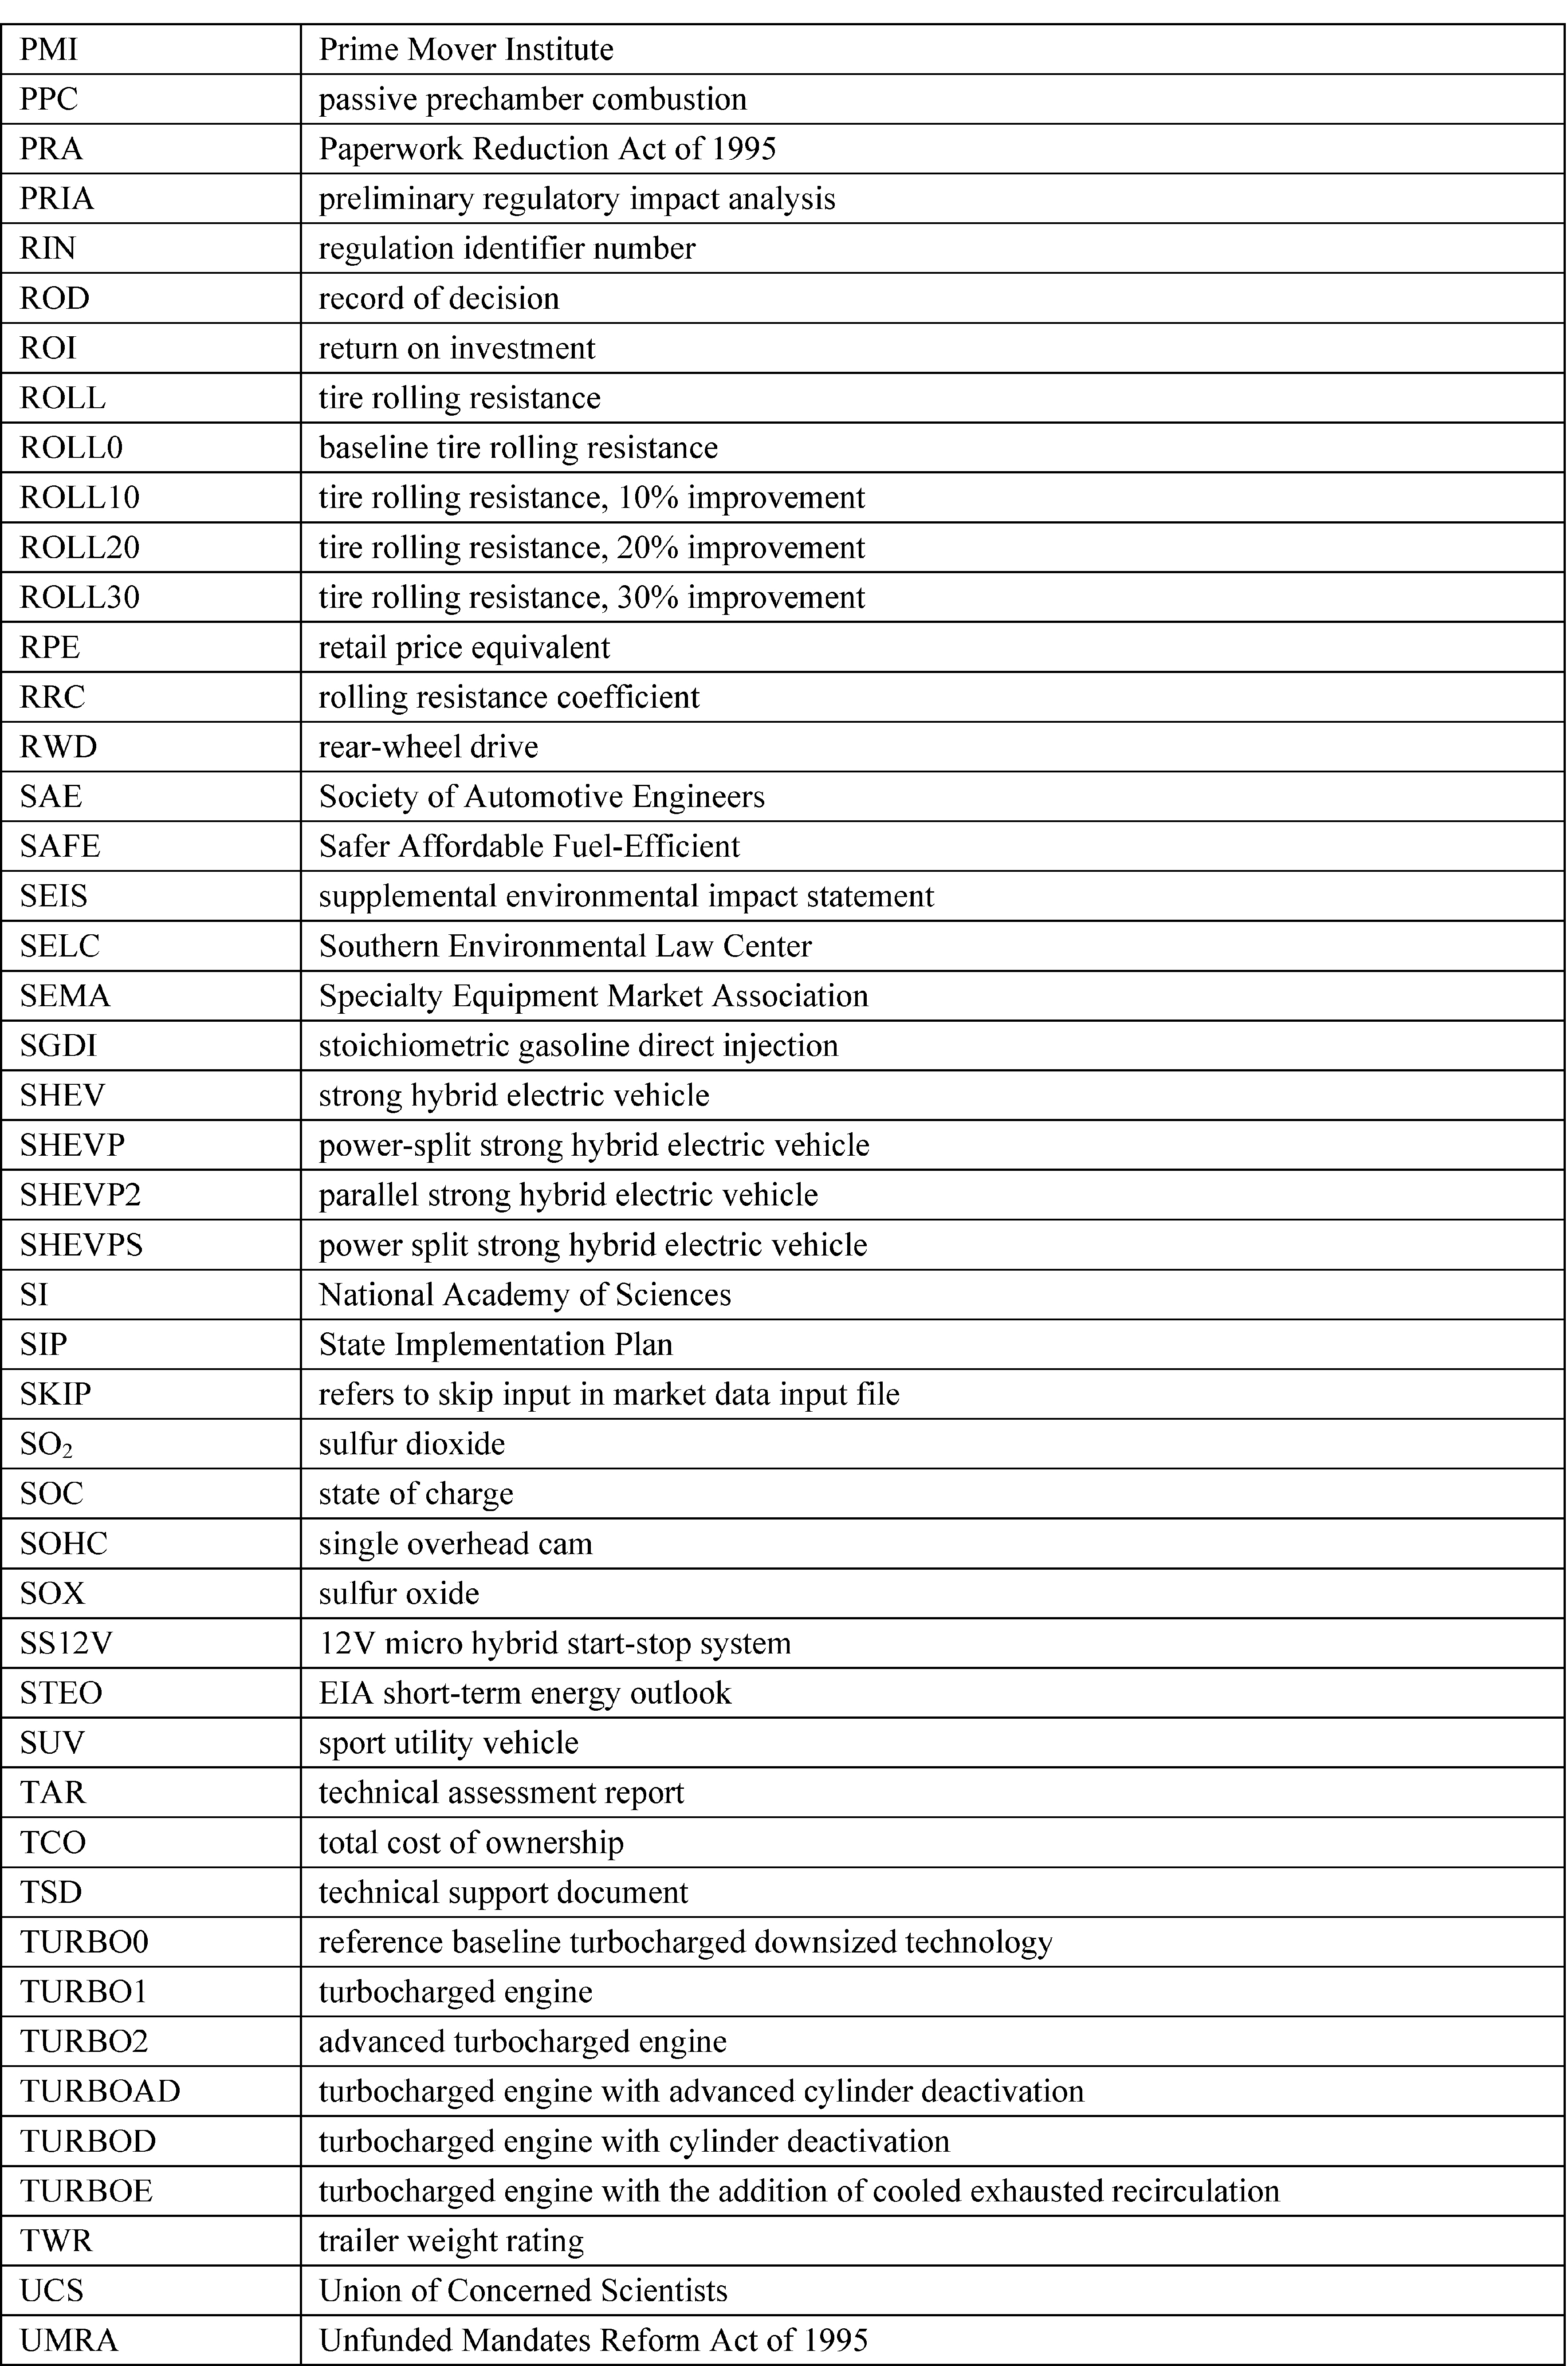
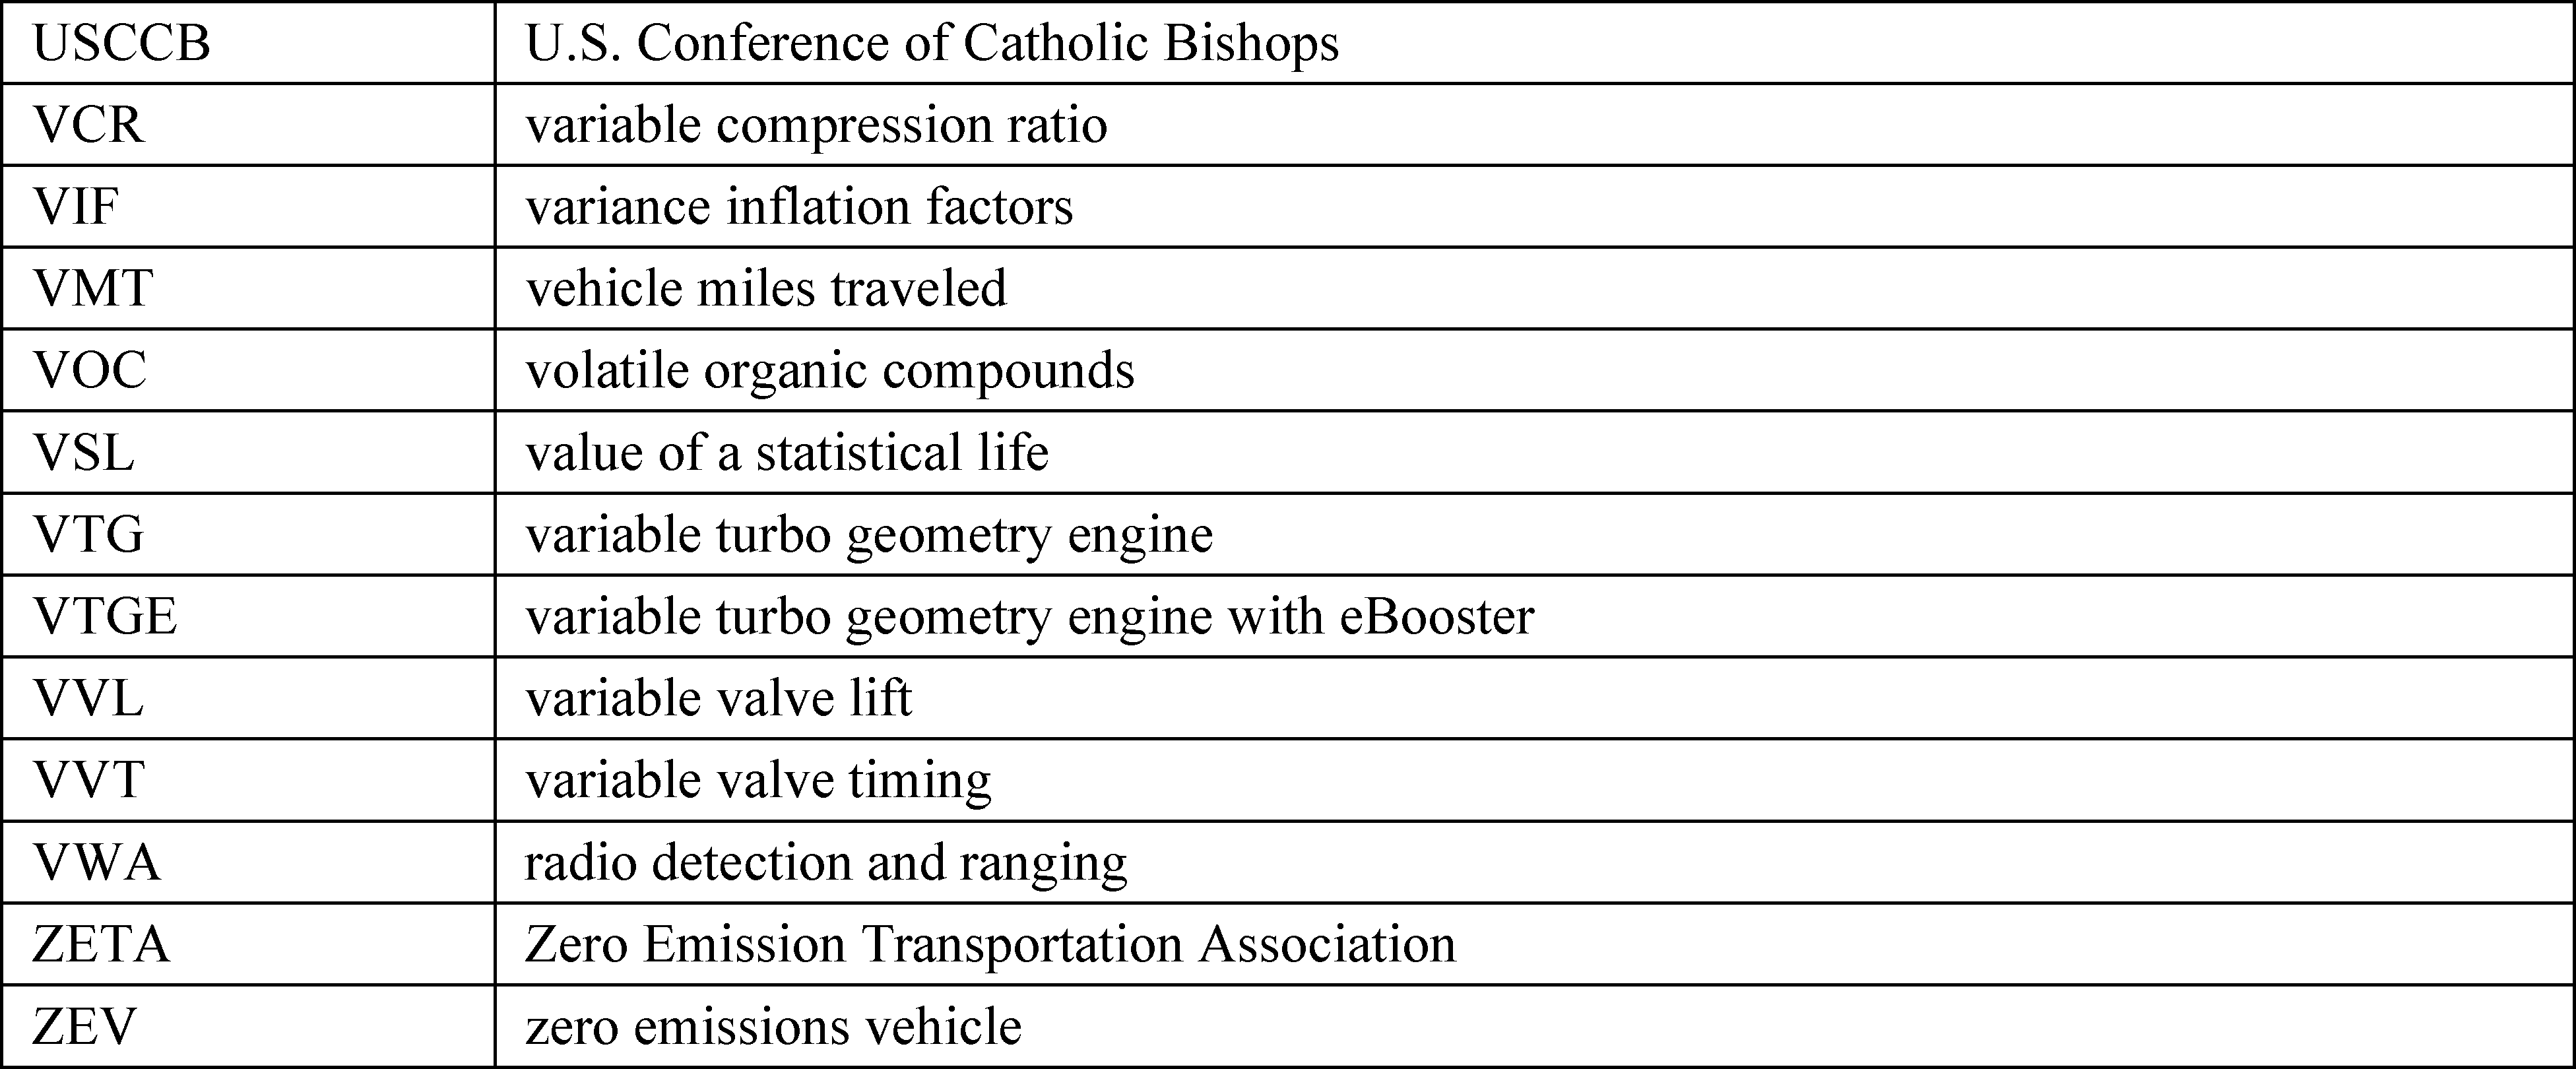
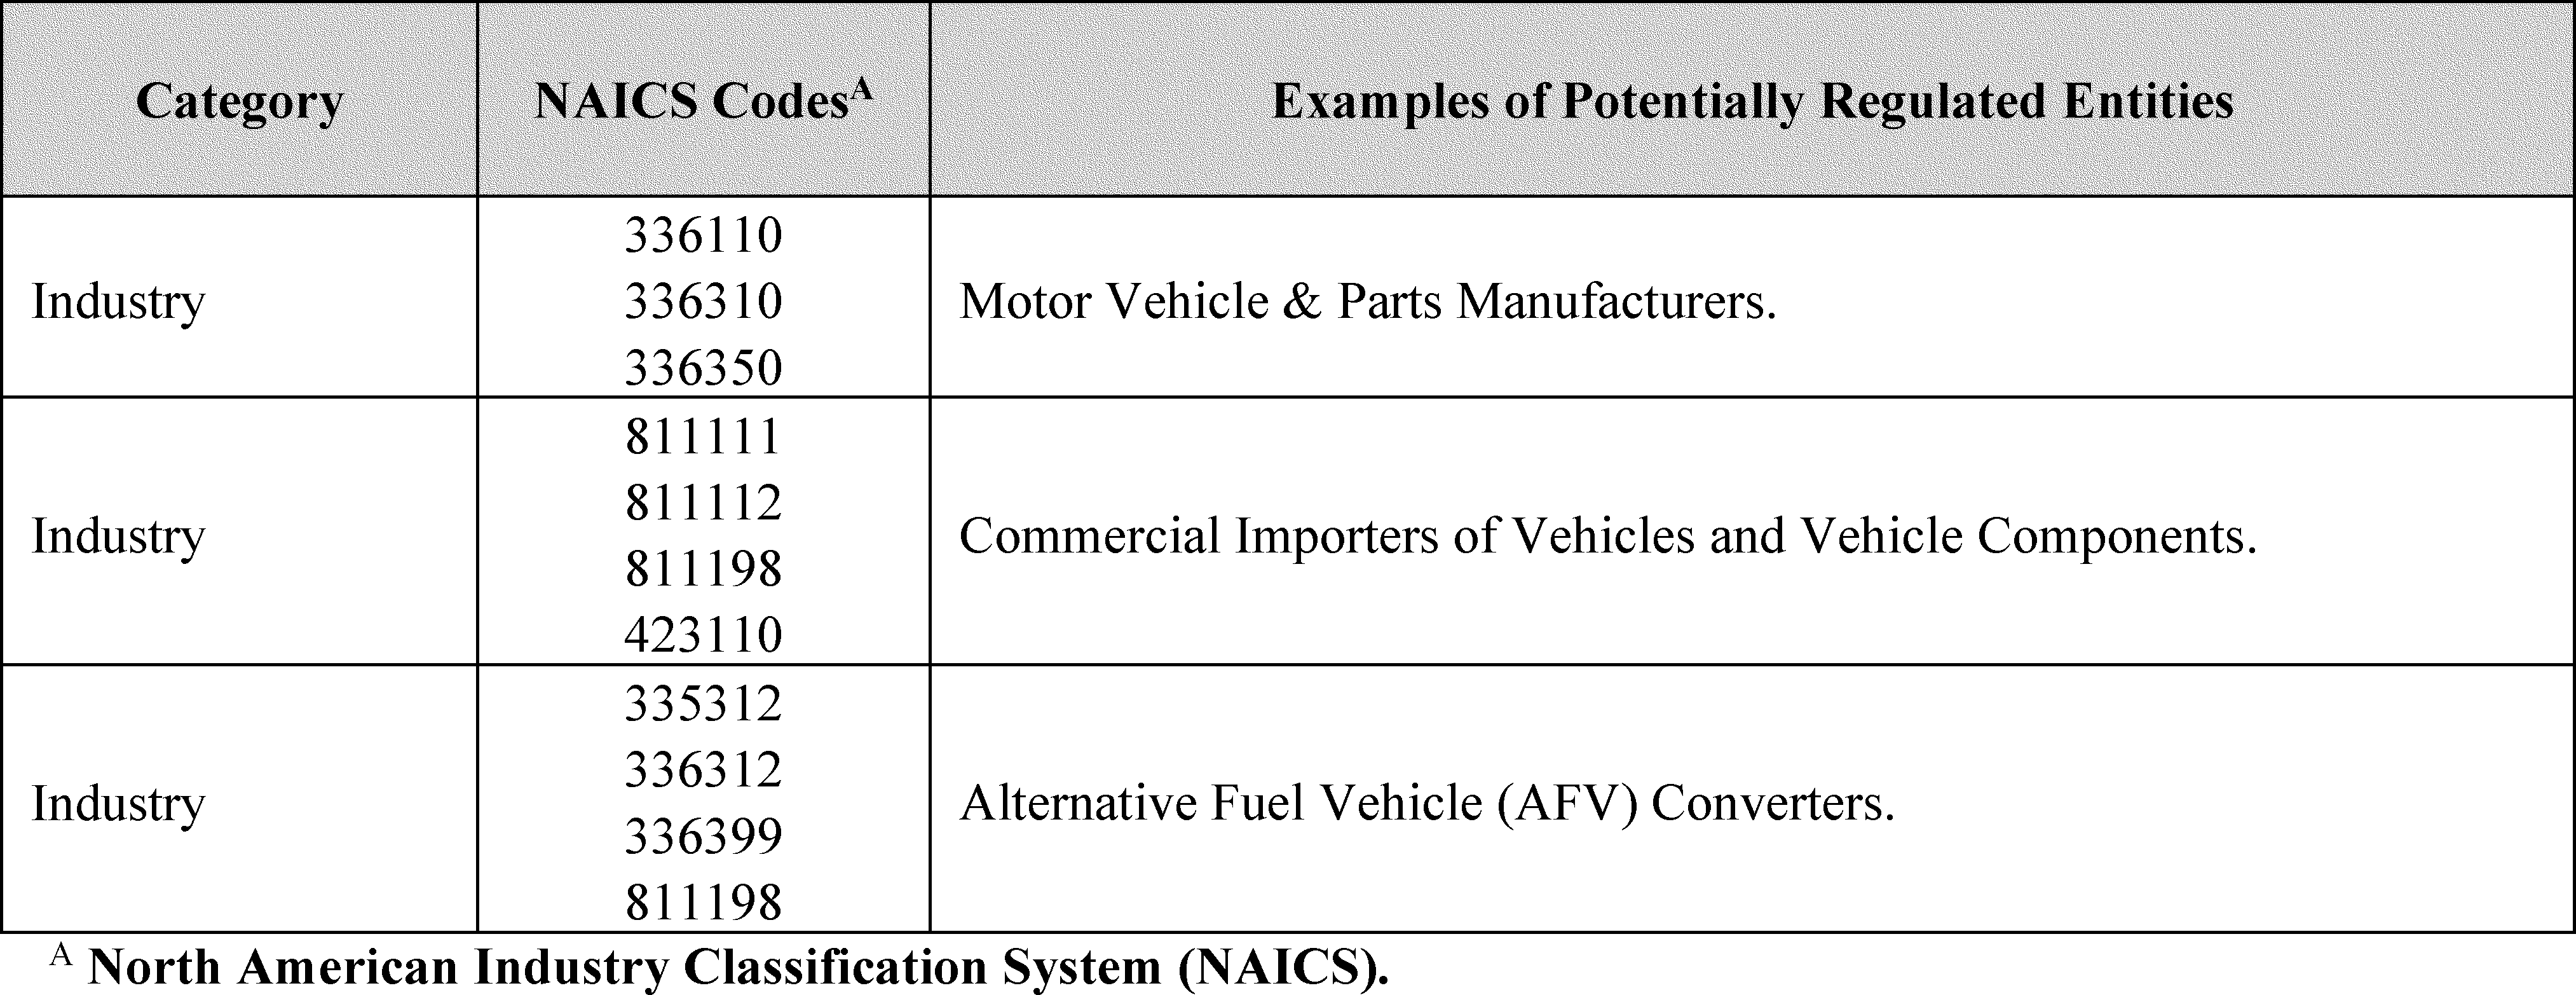
 chapter 329 of Title 49 of the U.S. Code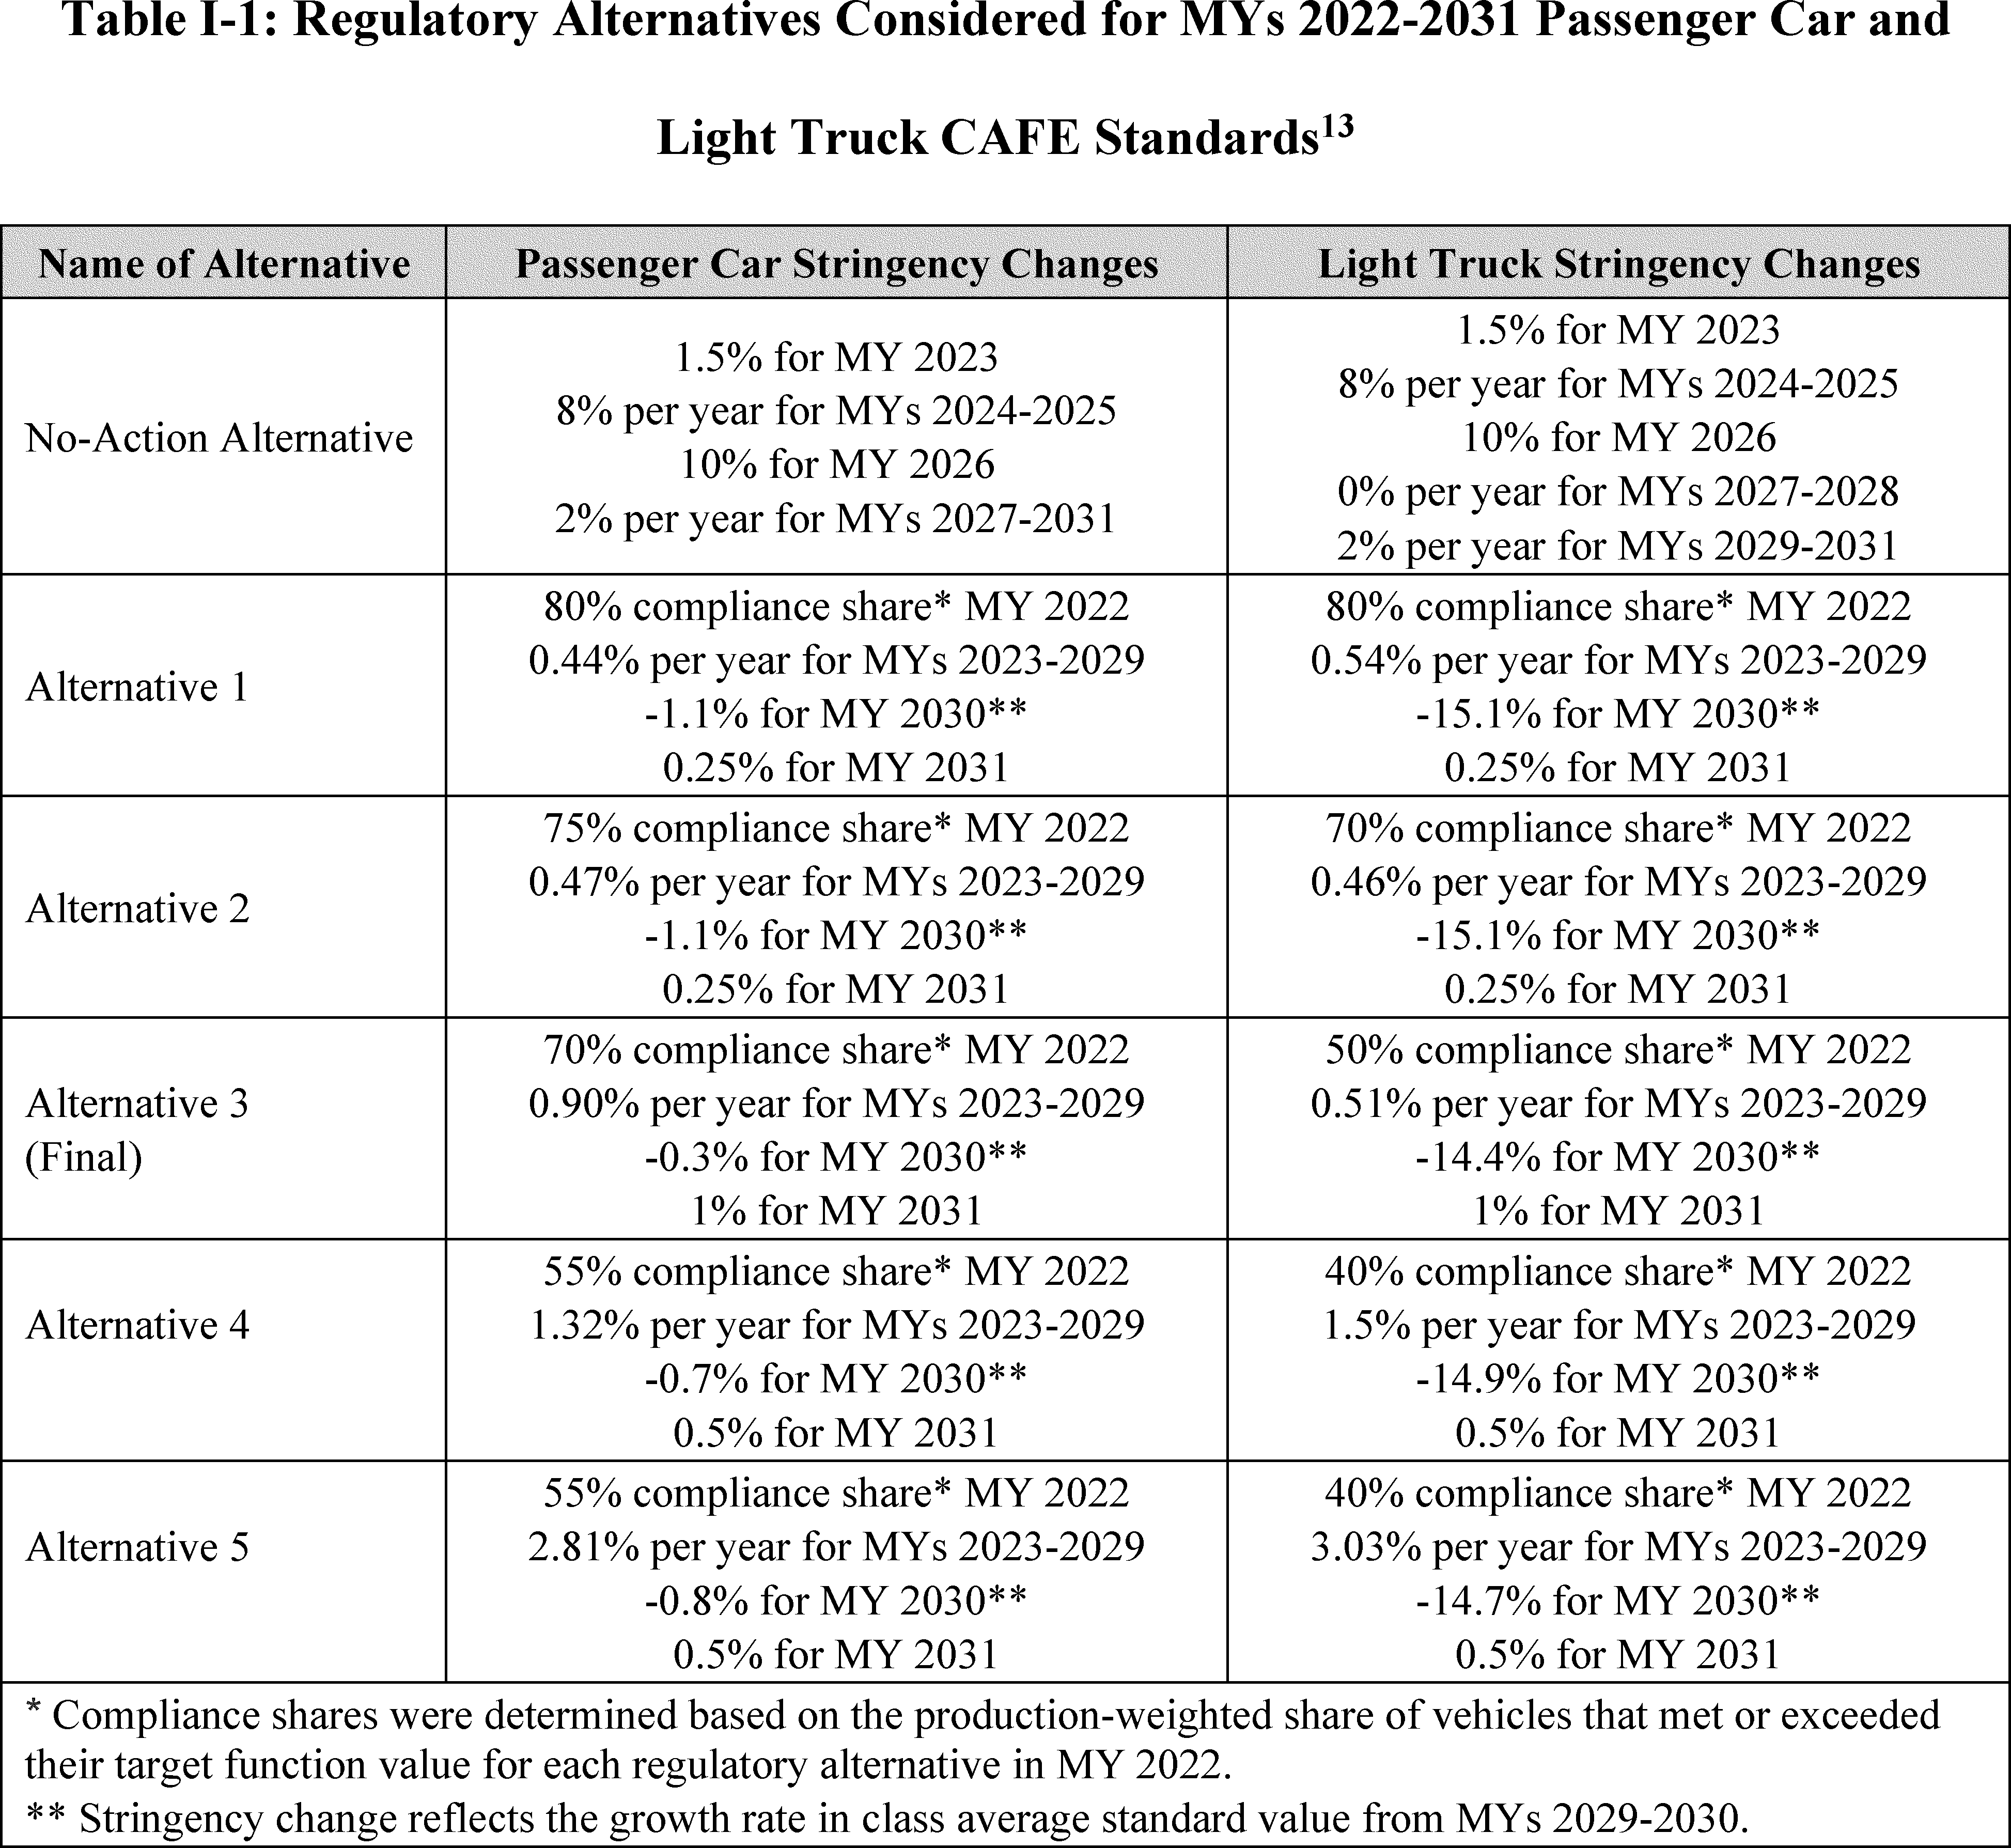
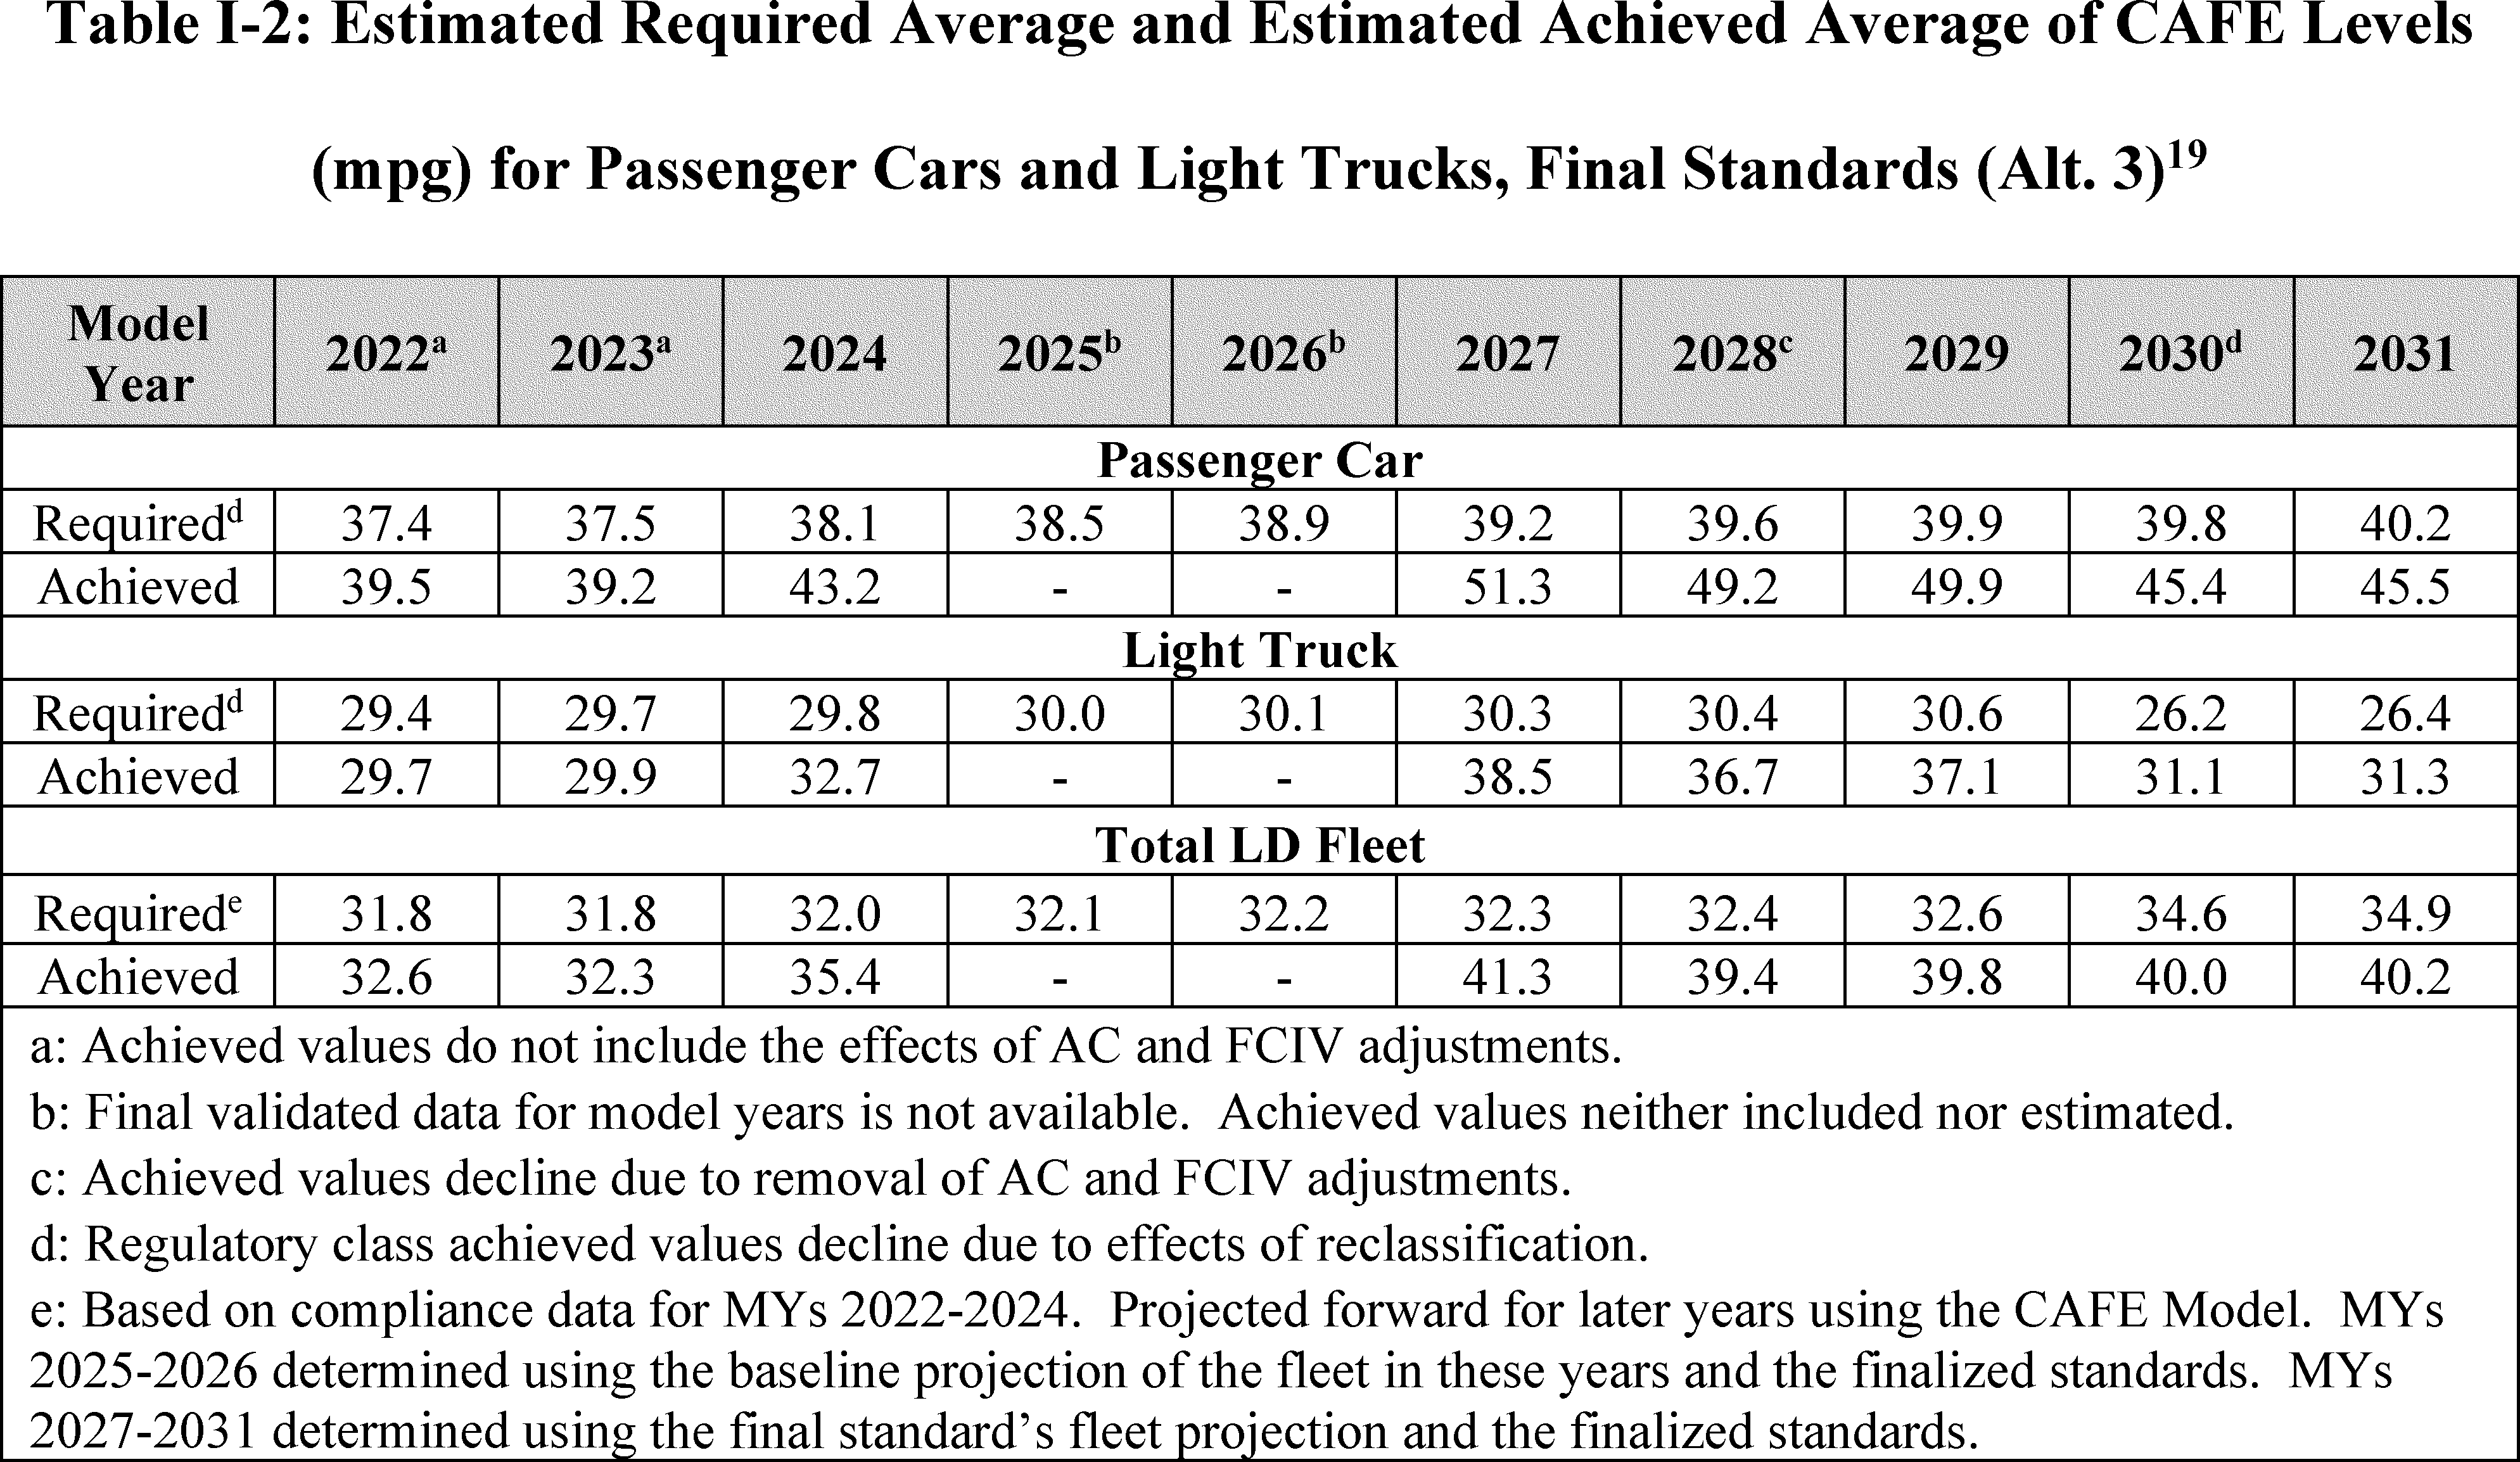
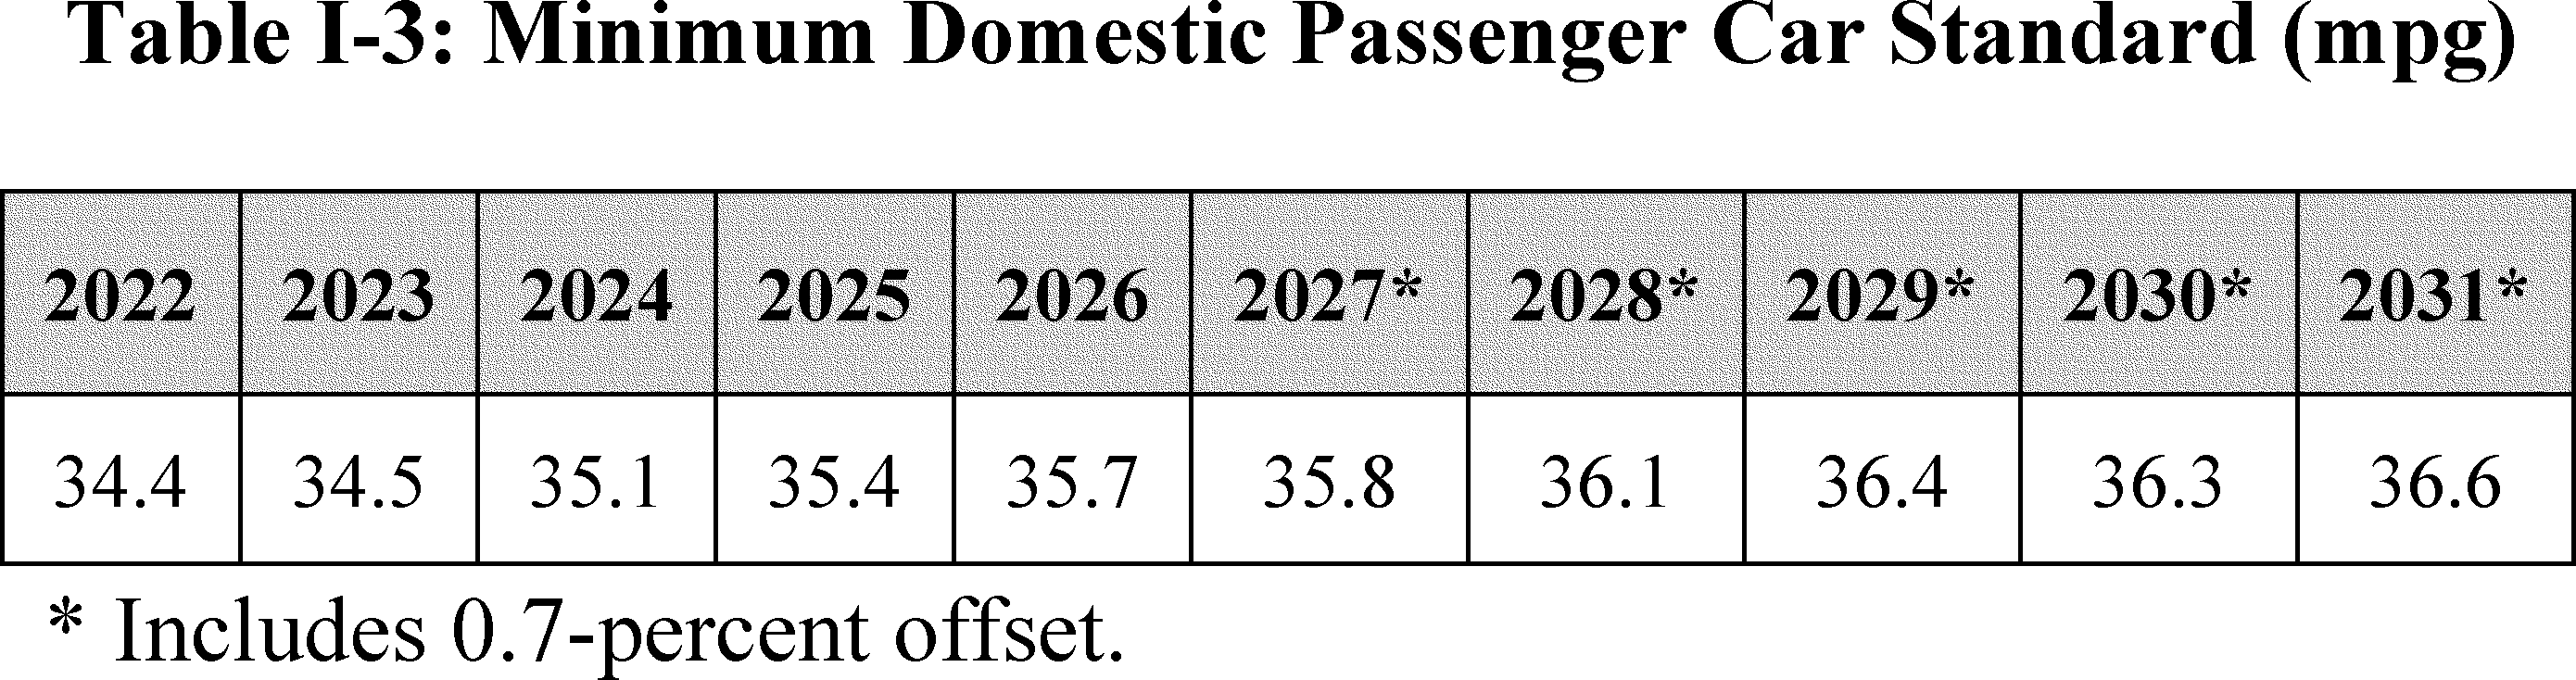
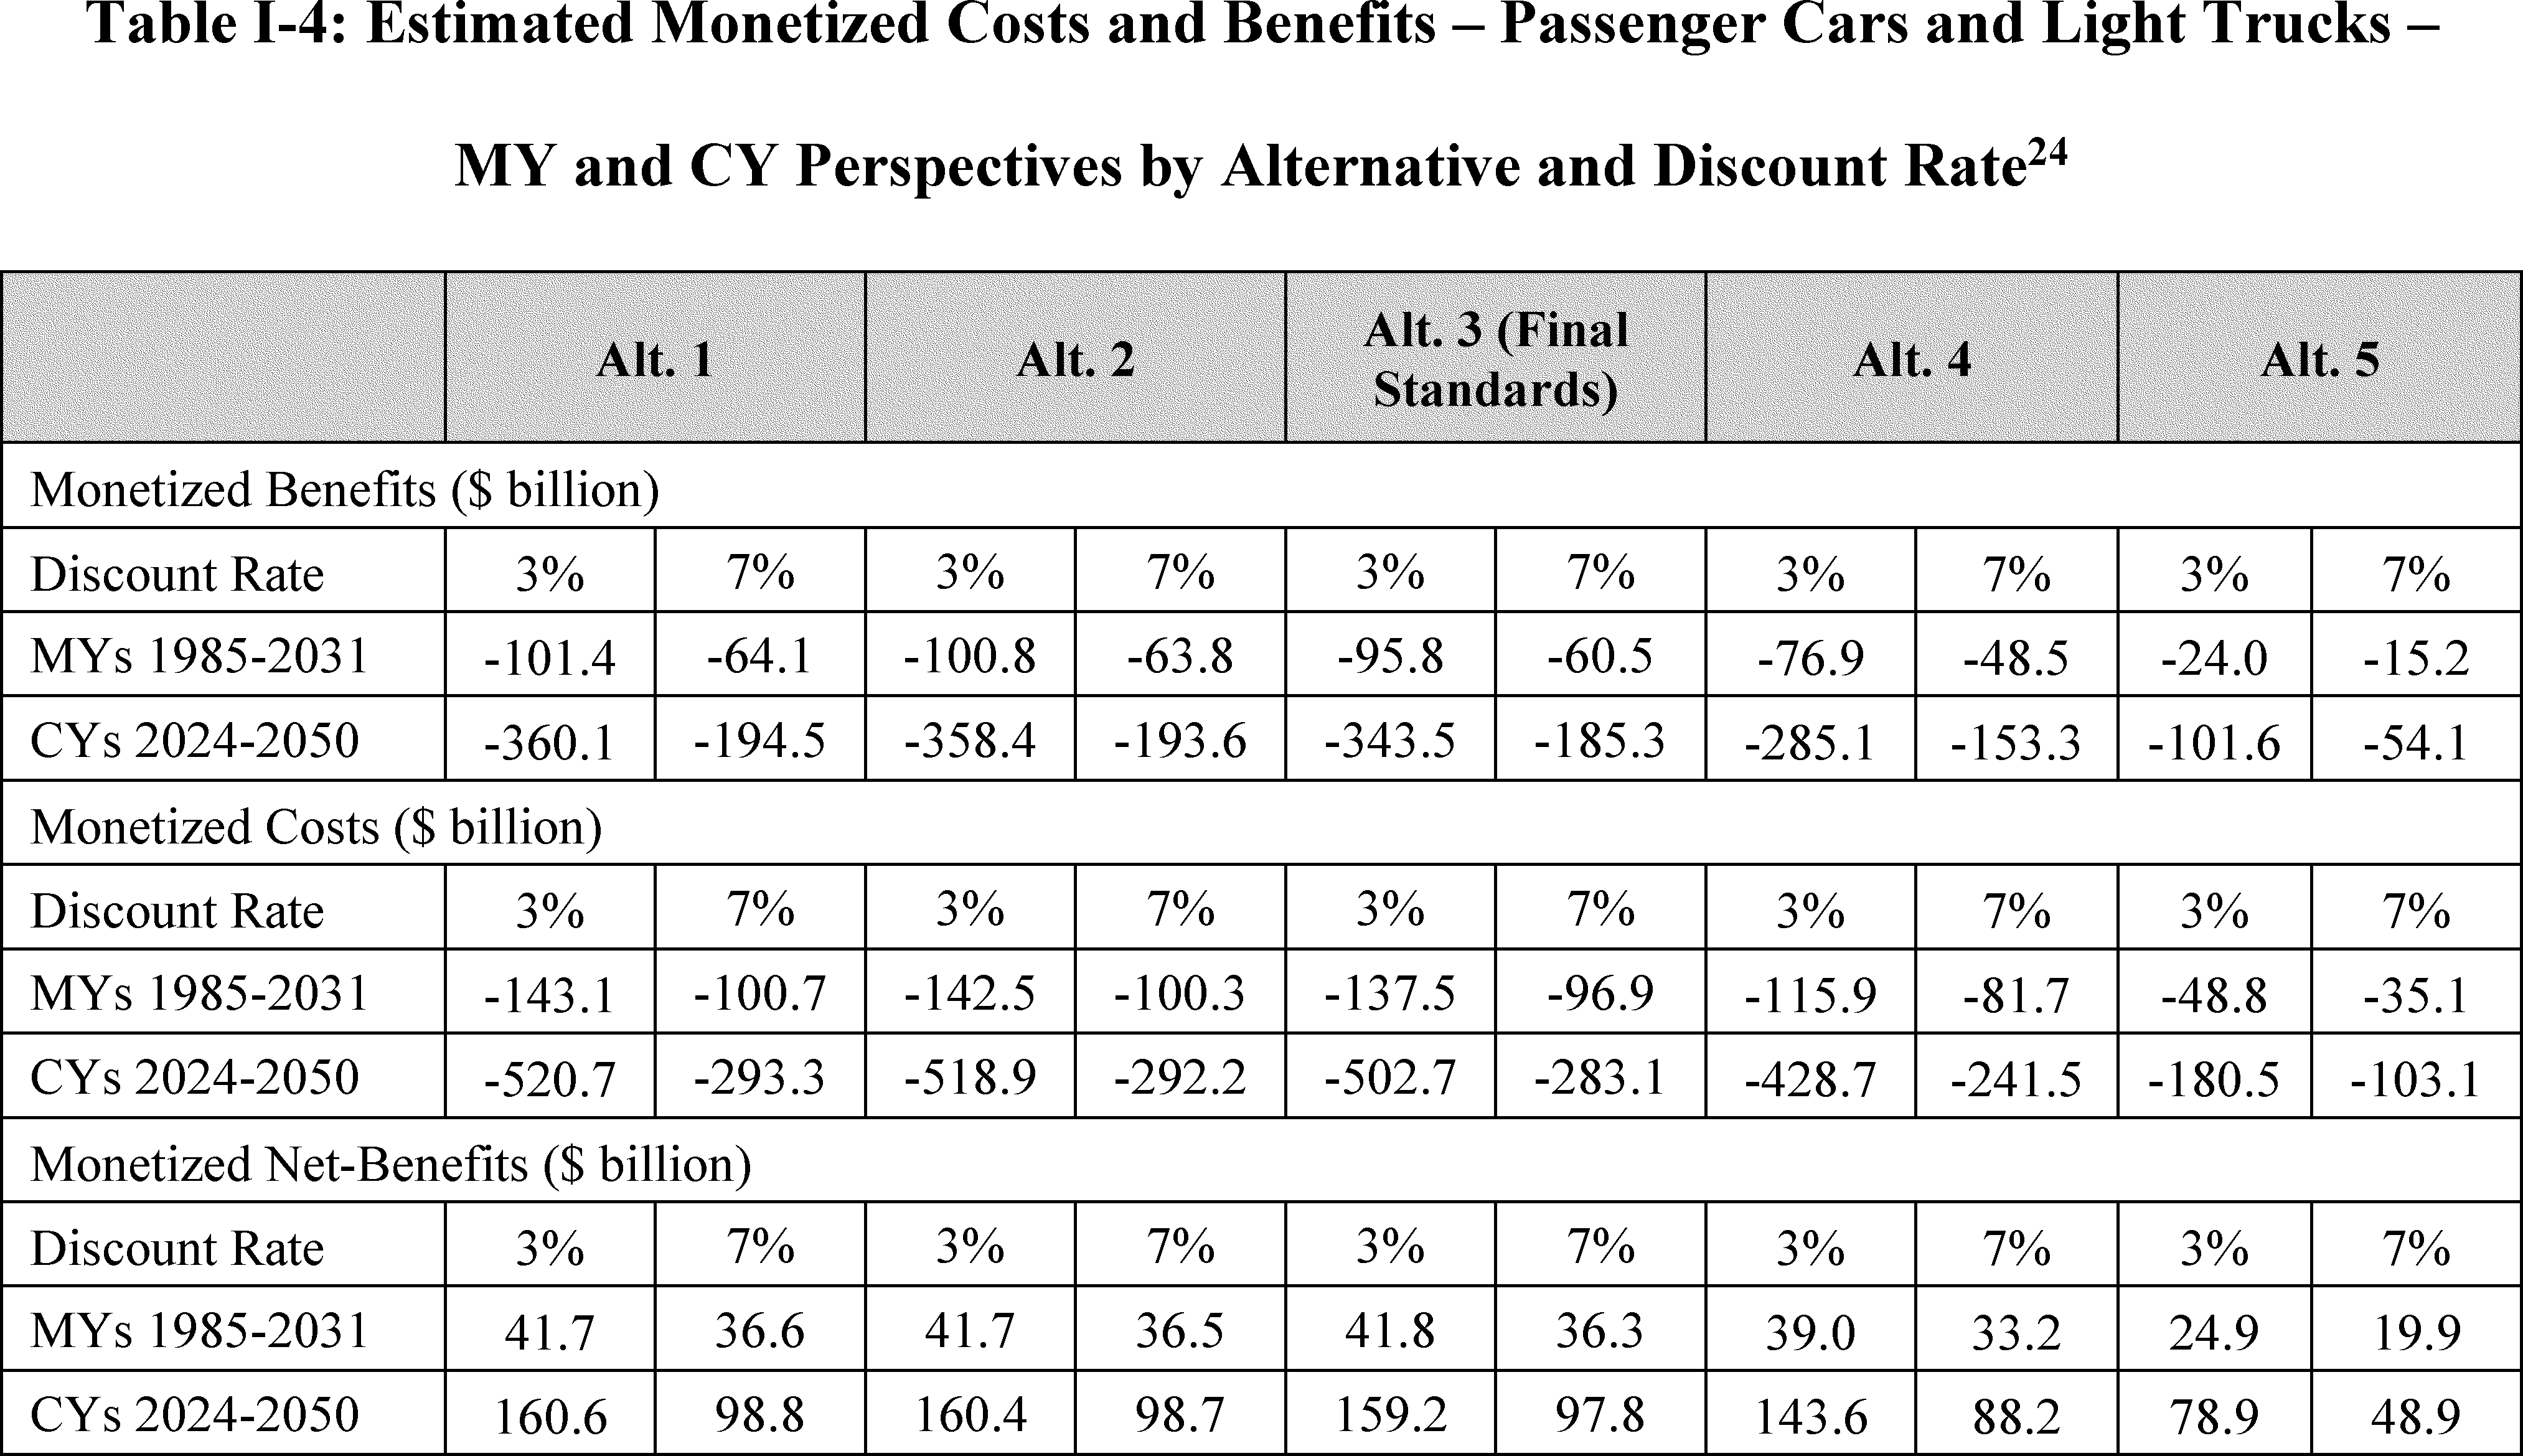
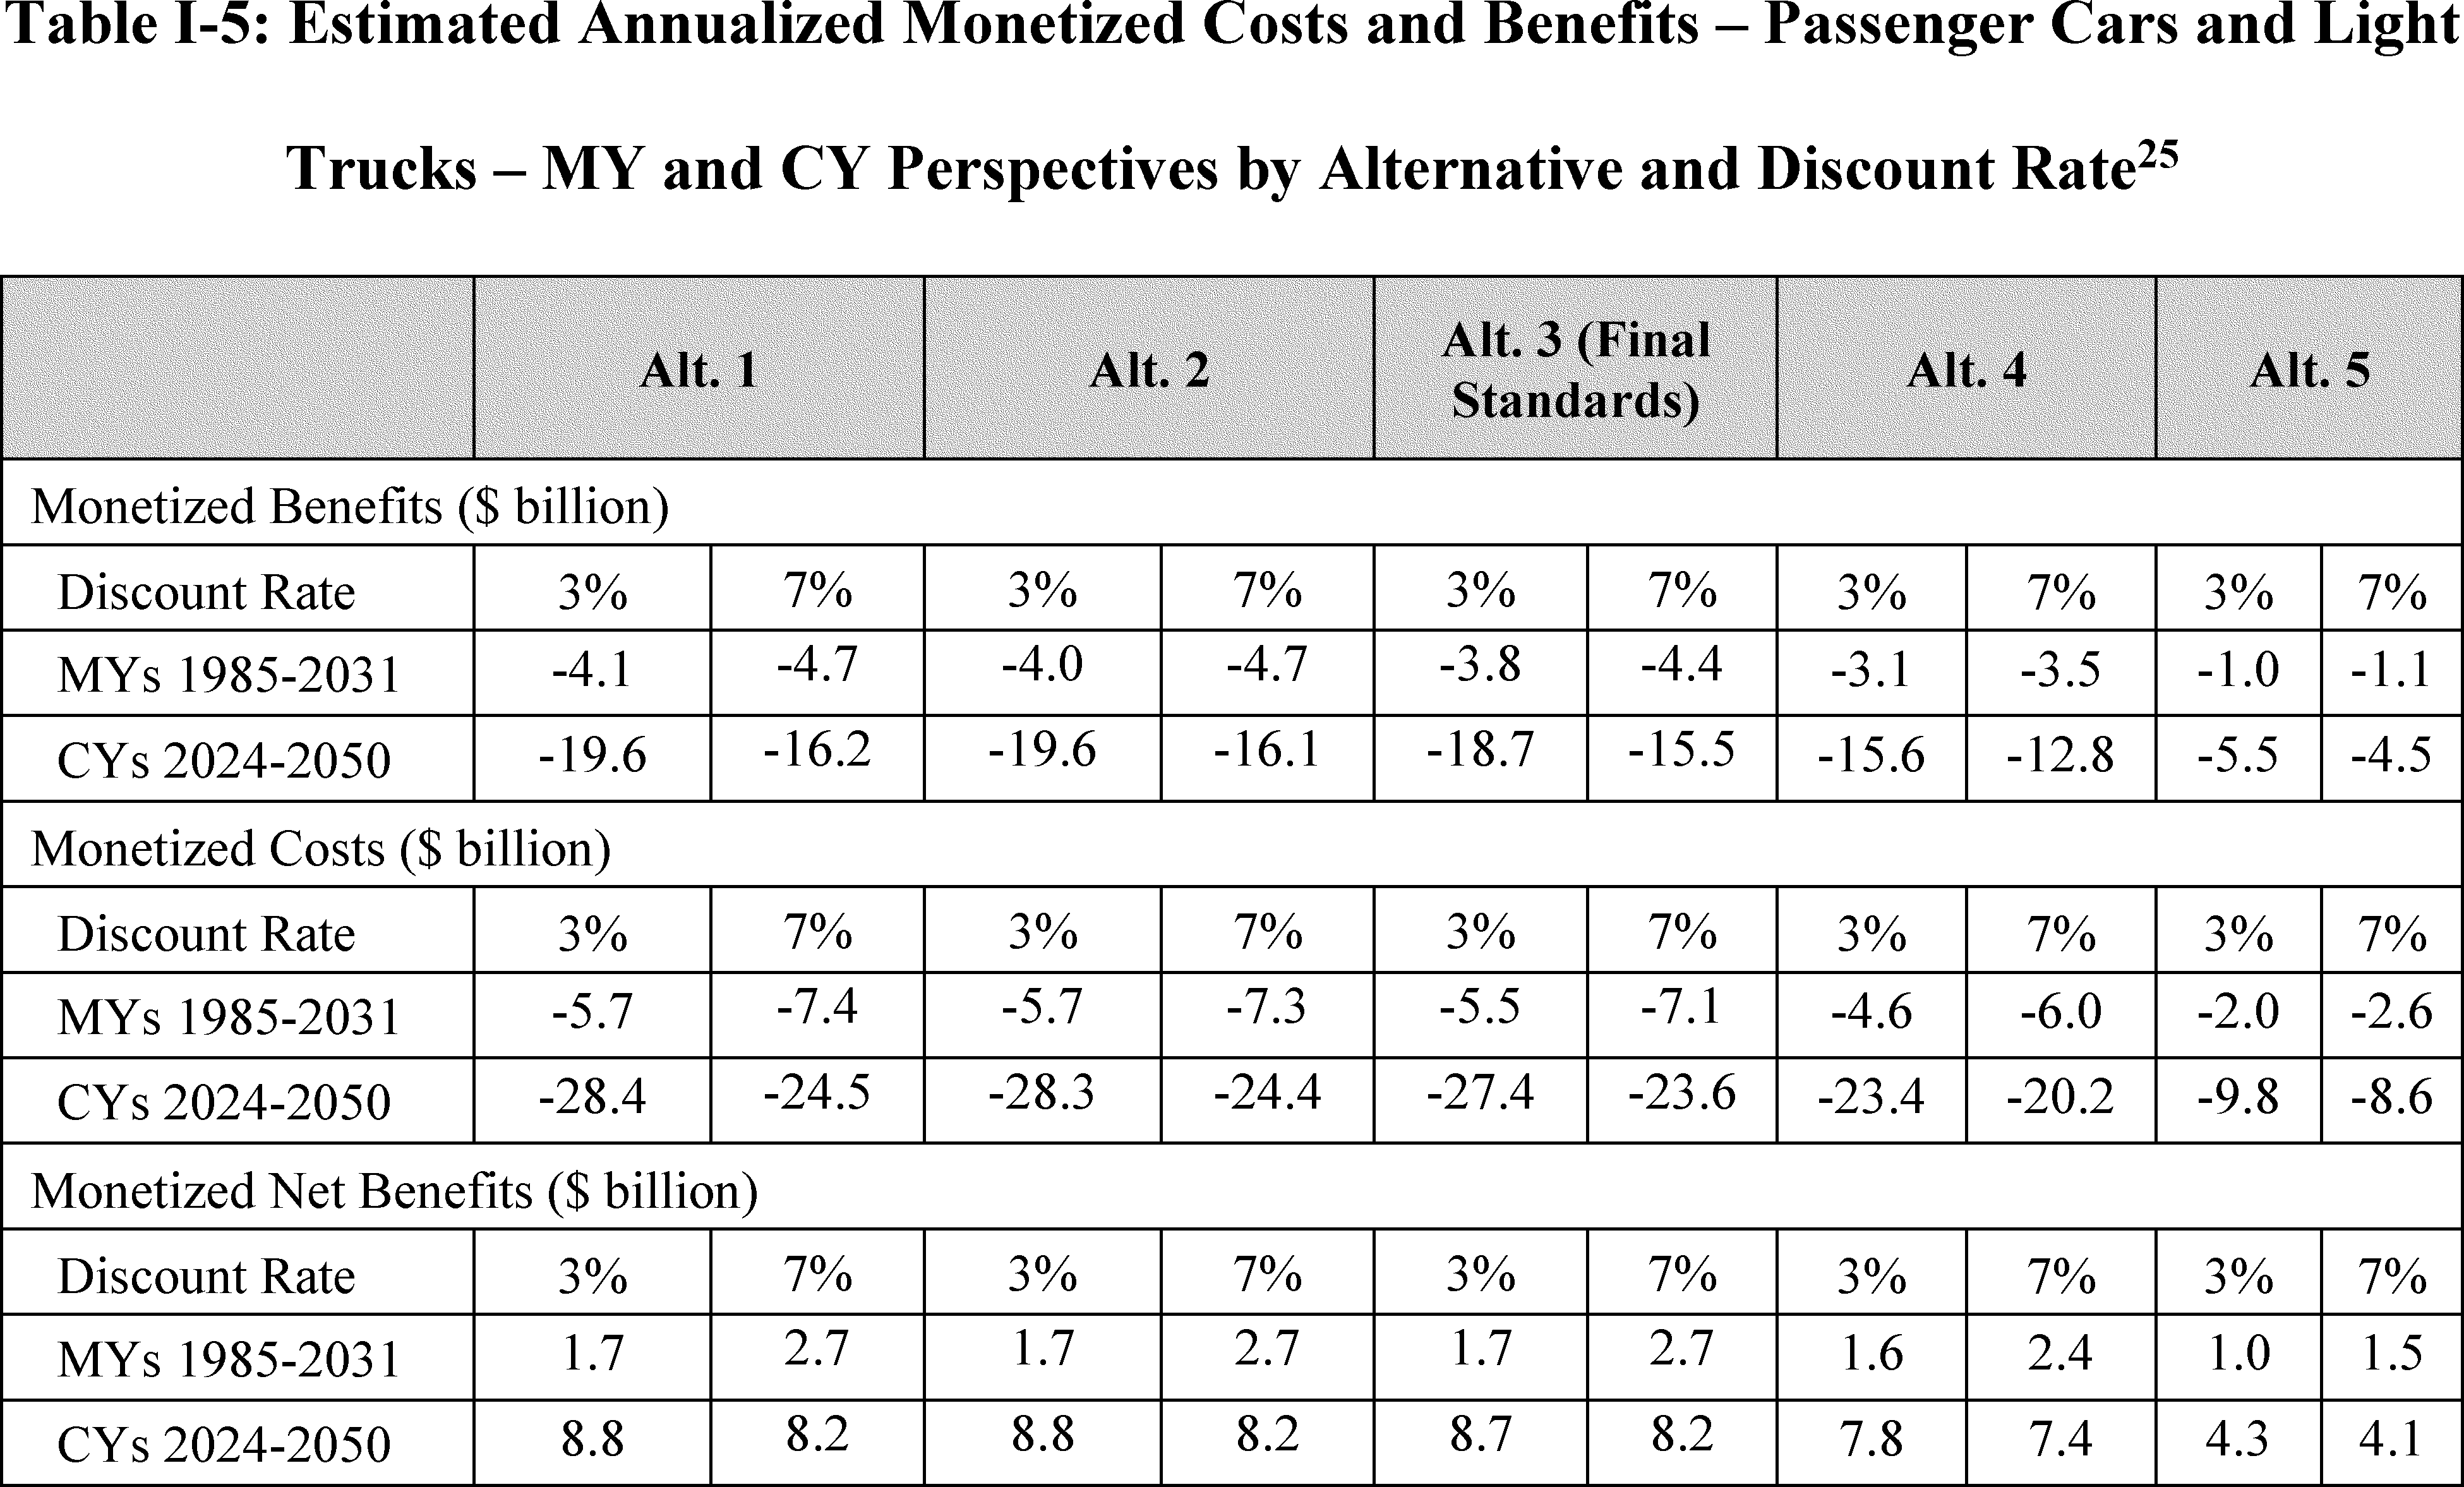
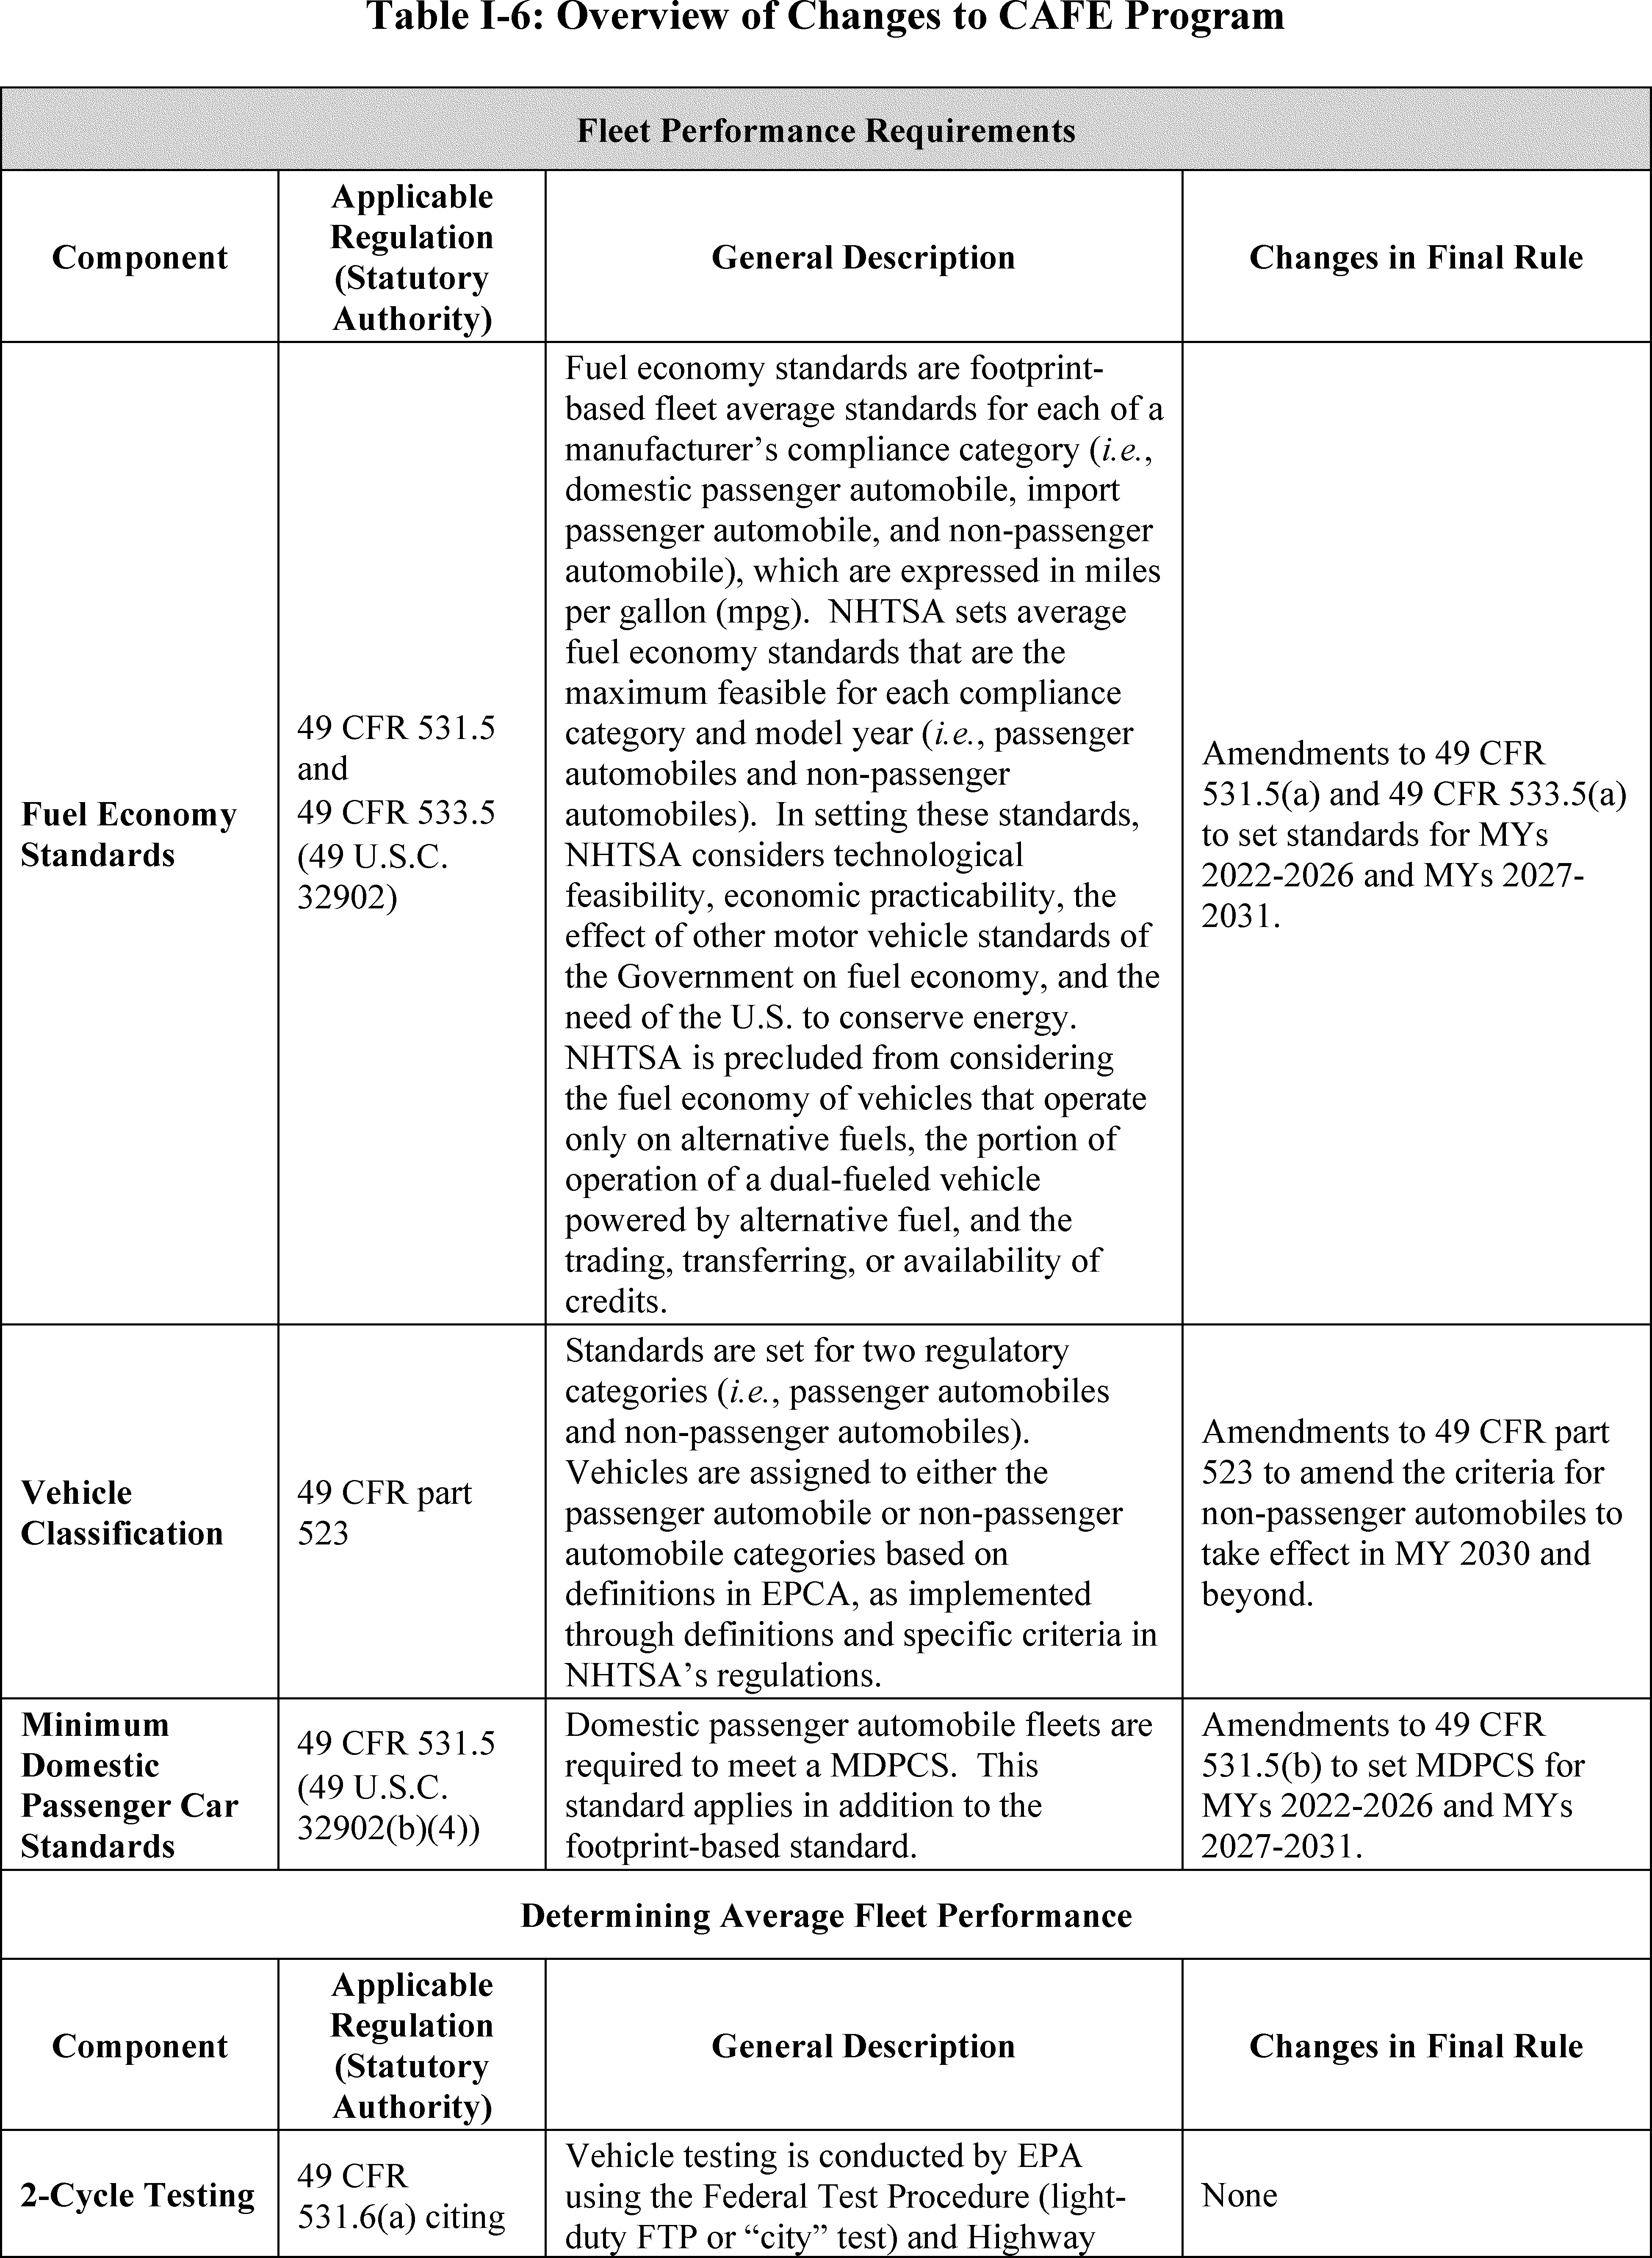
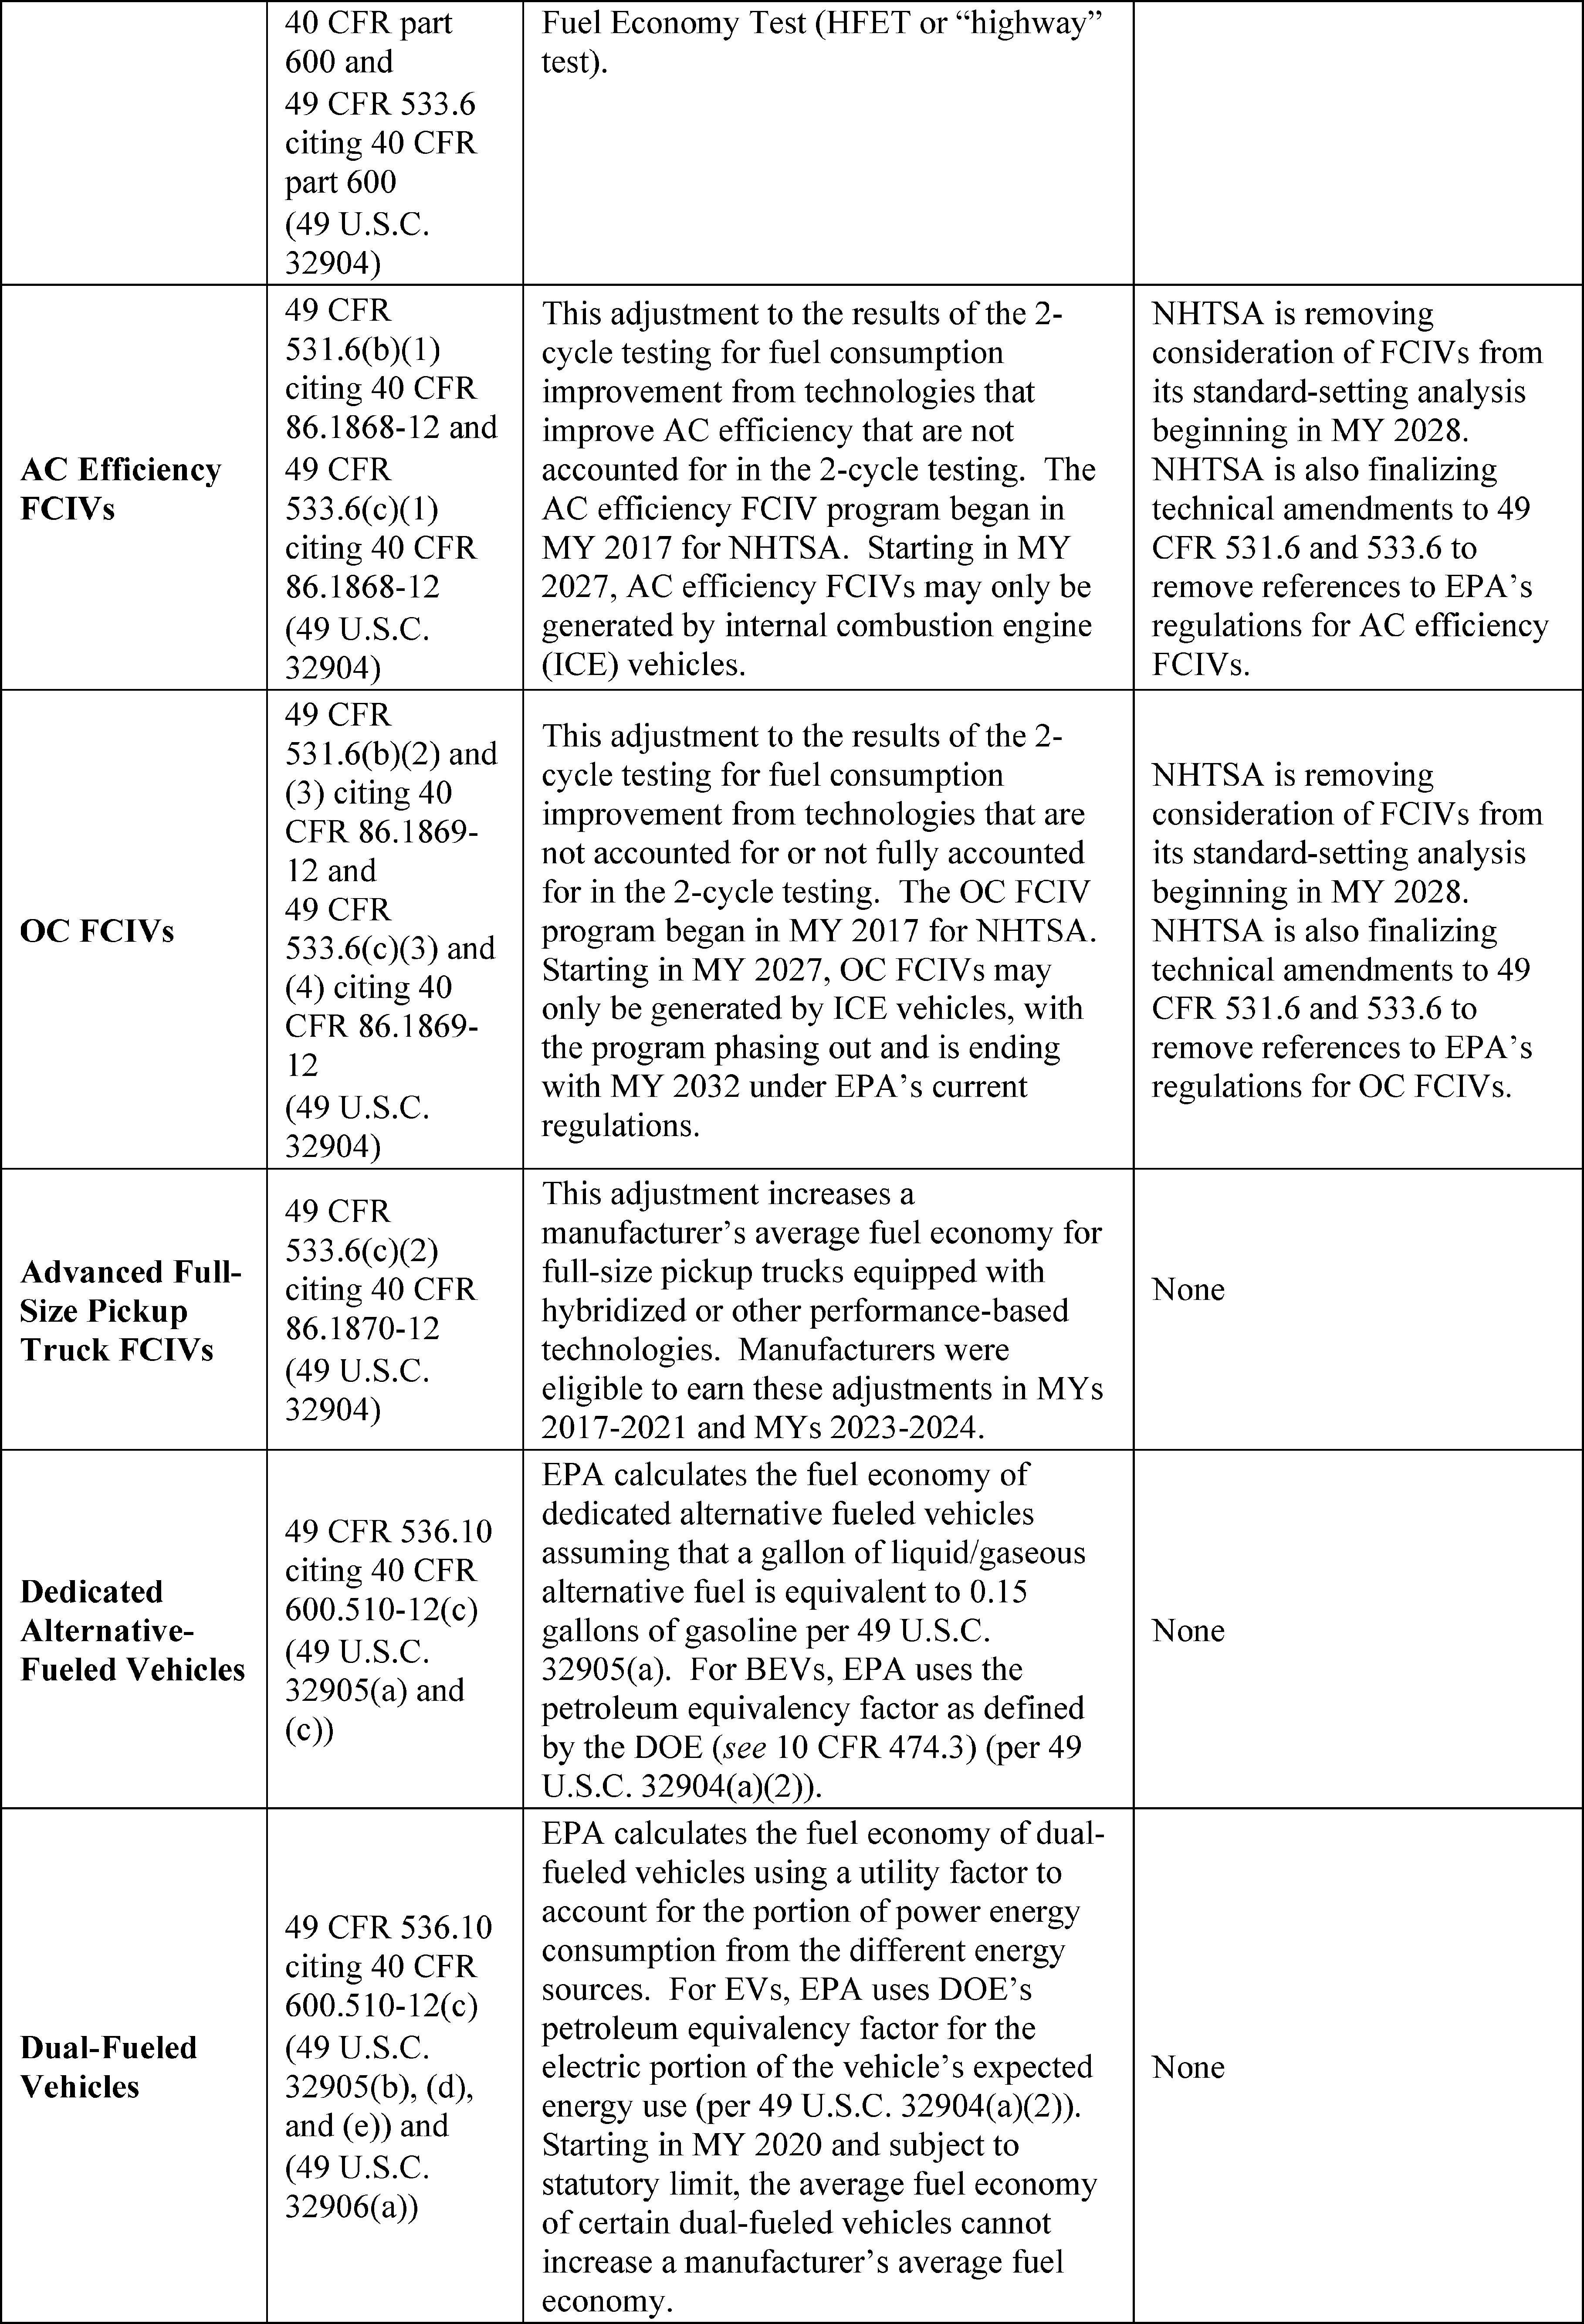
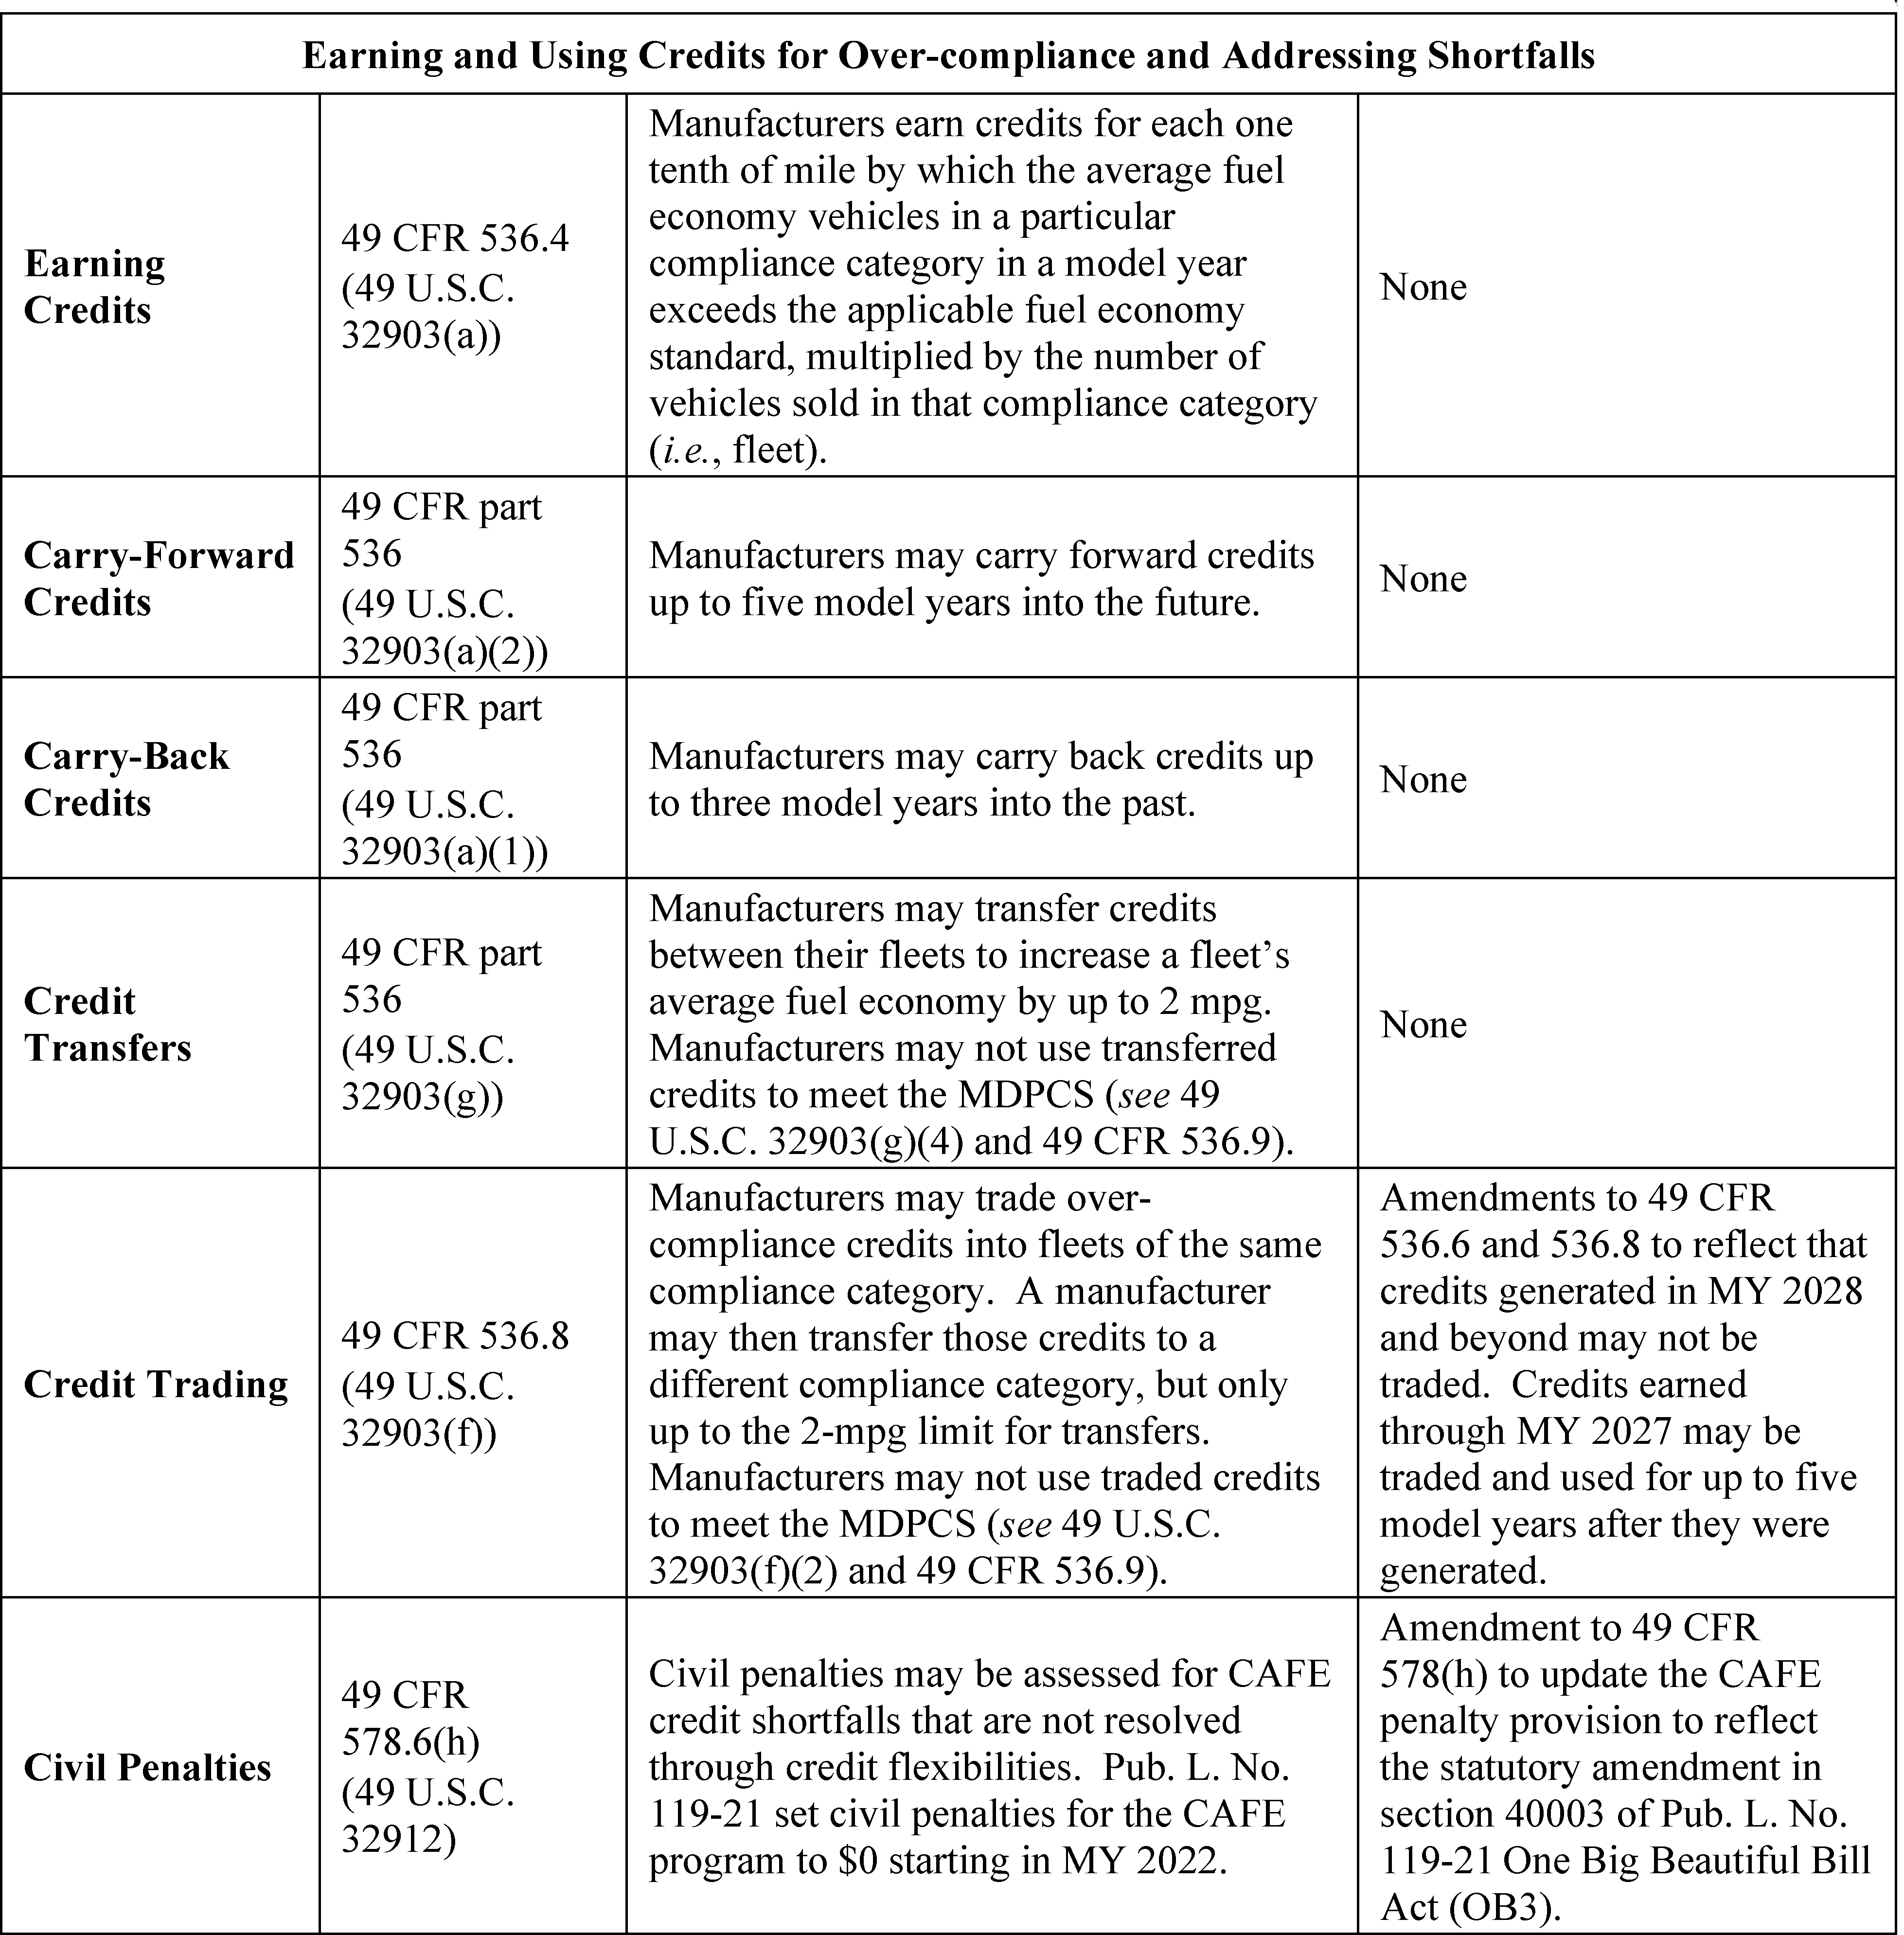
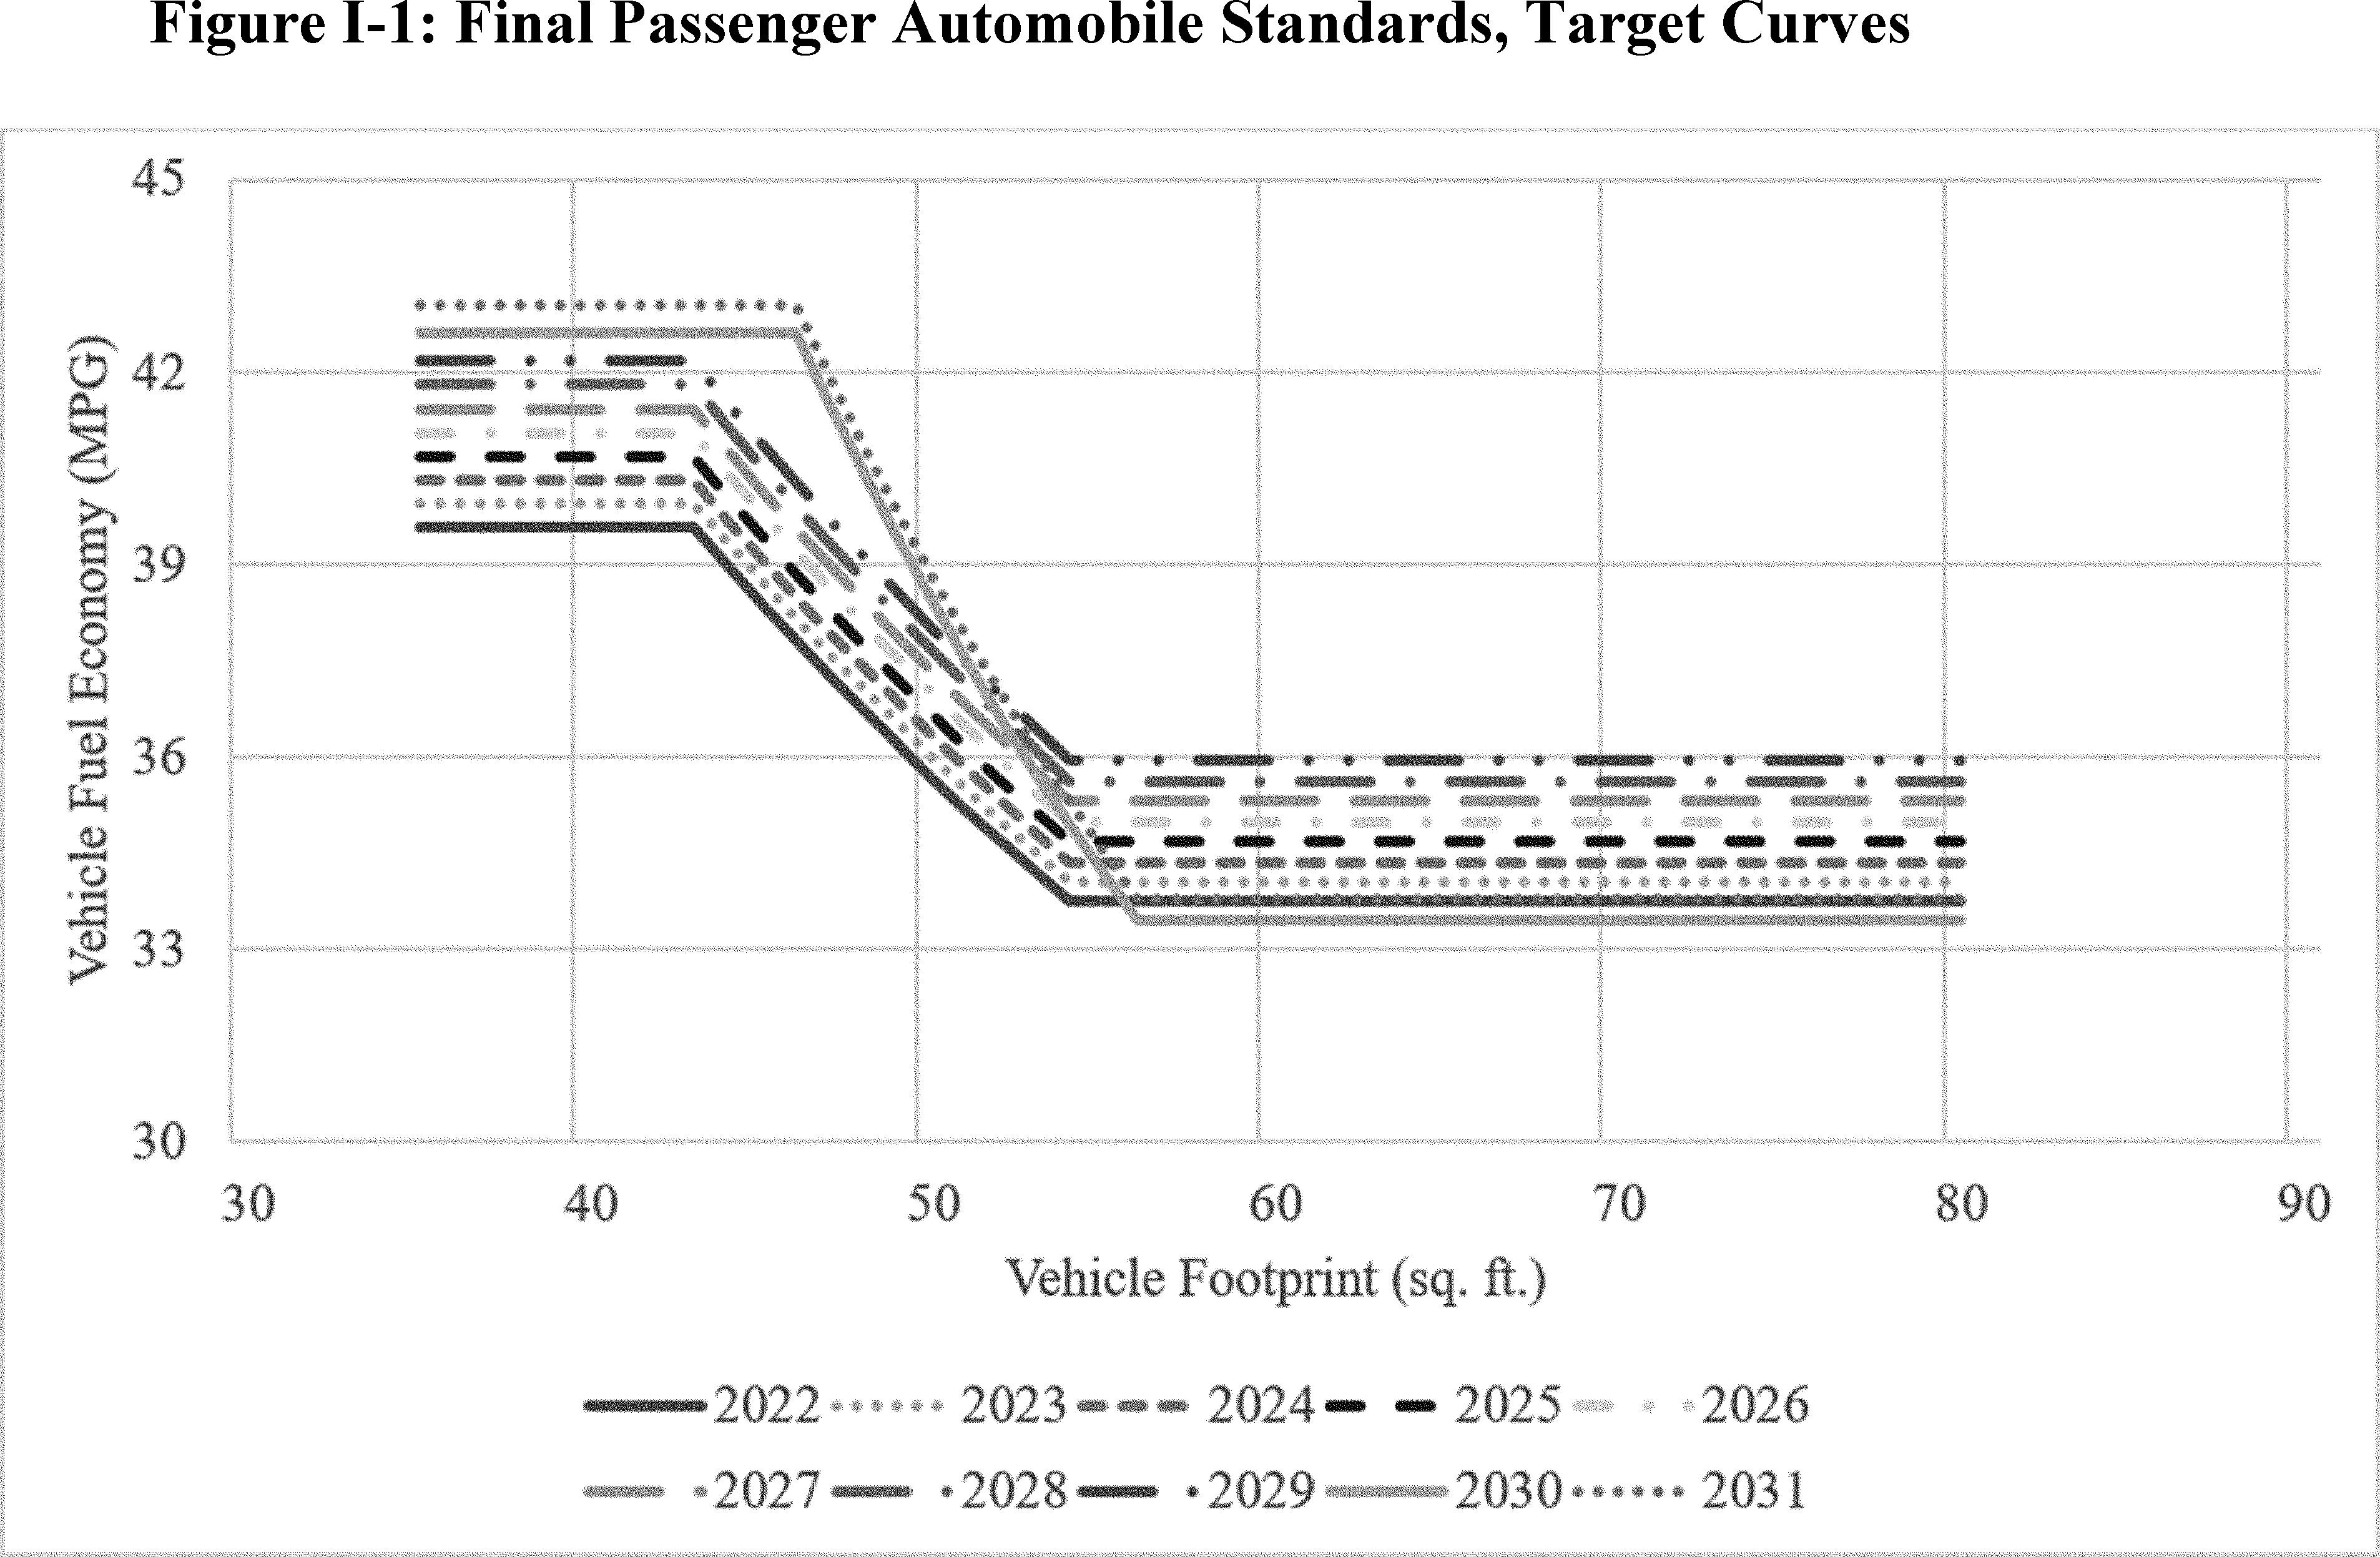
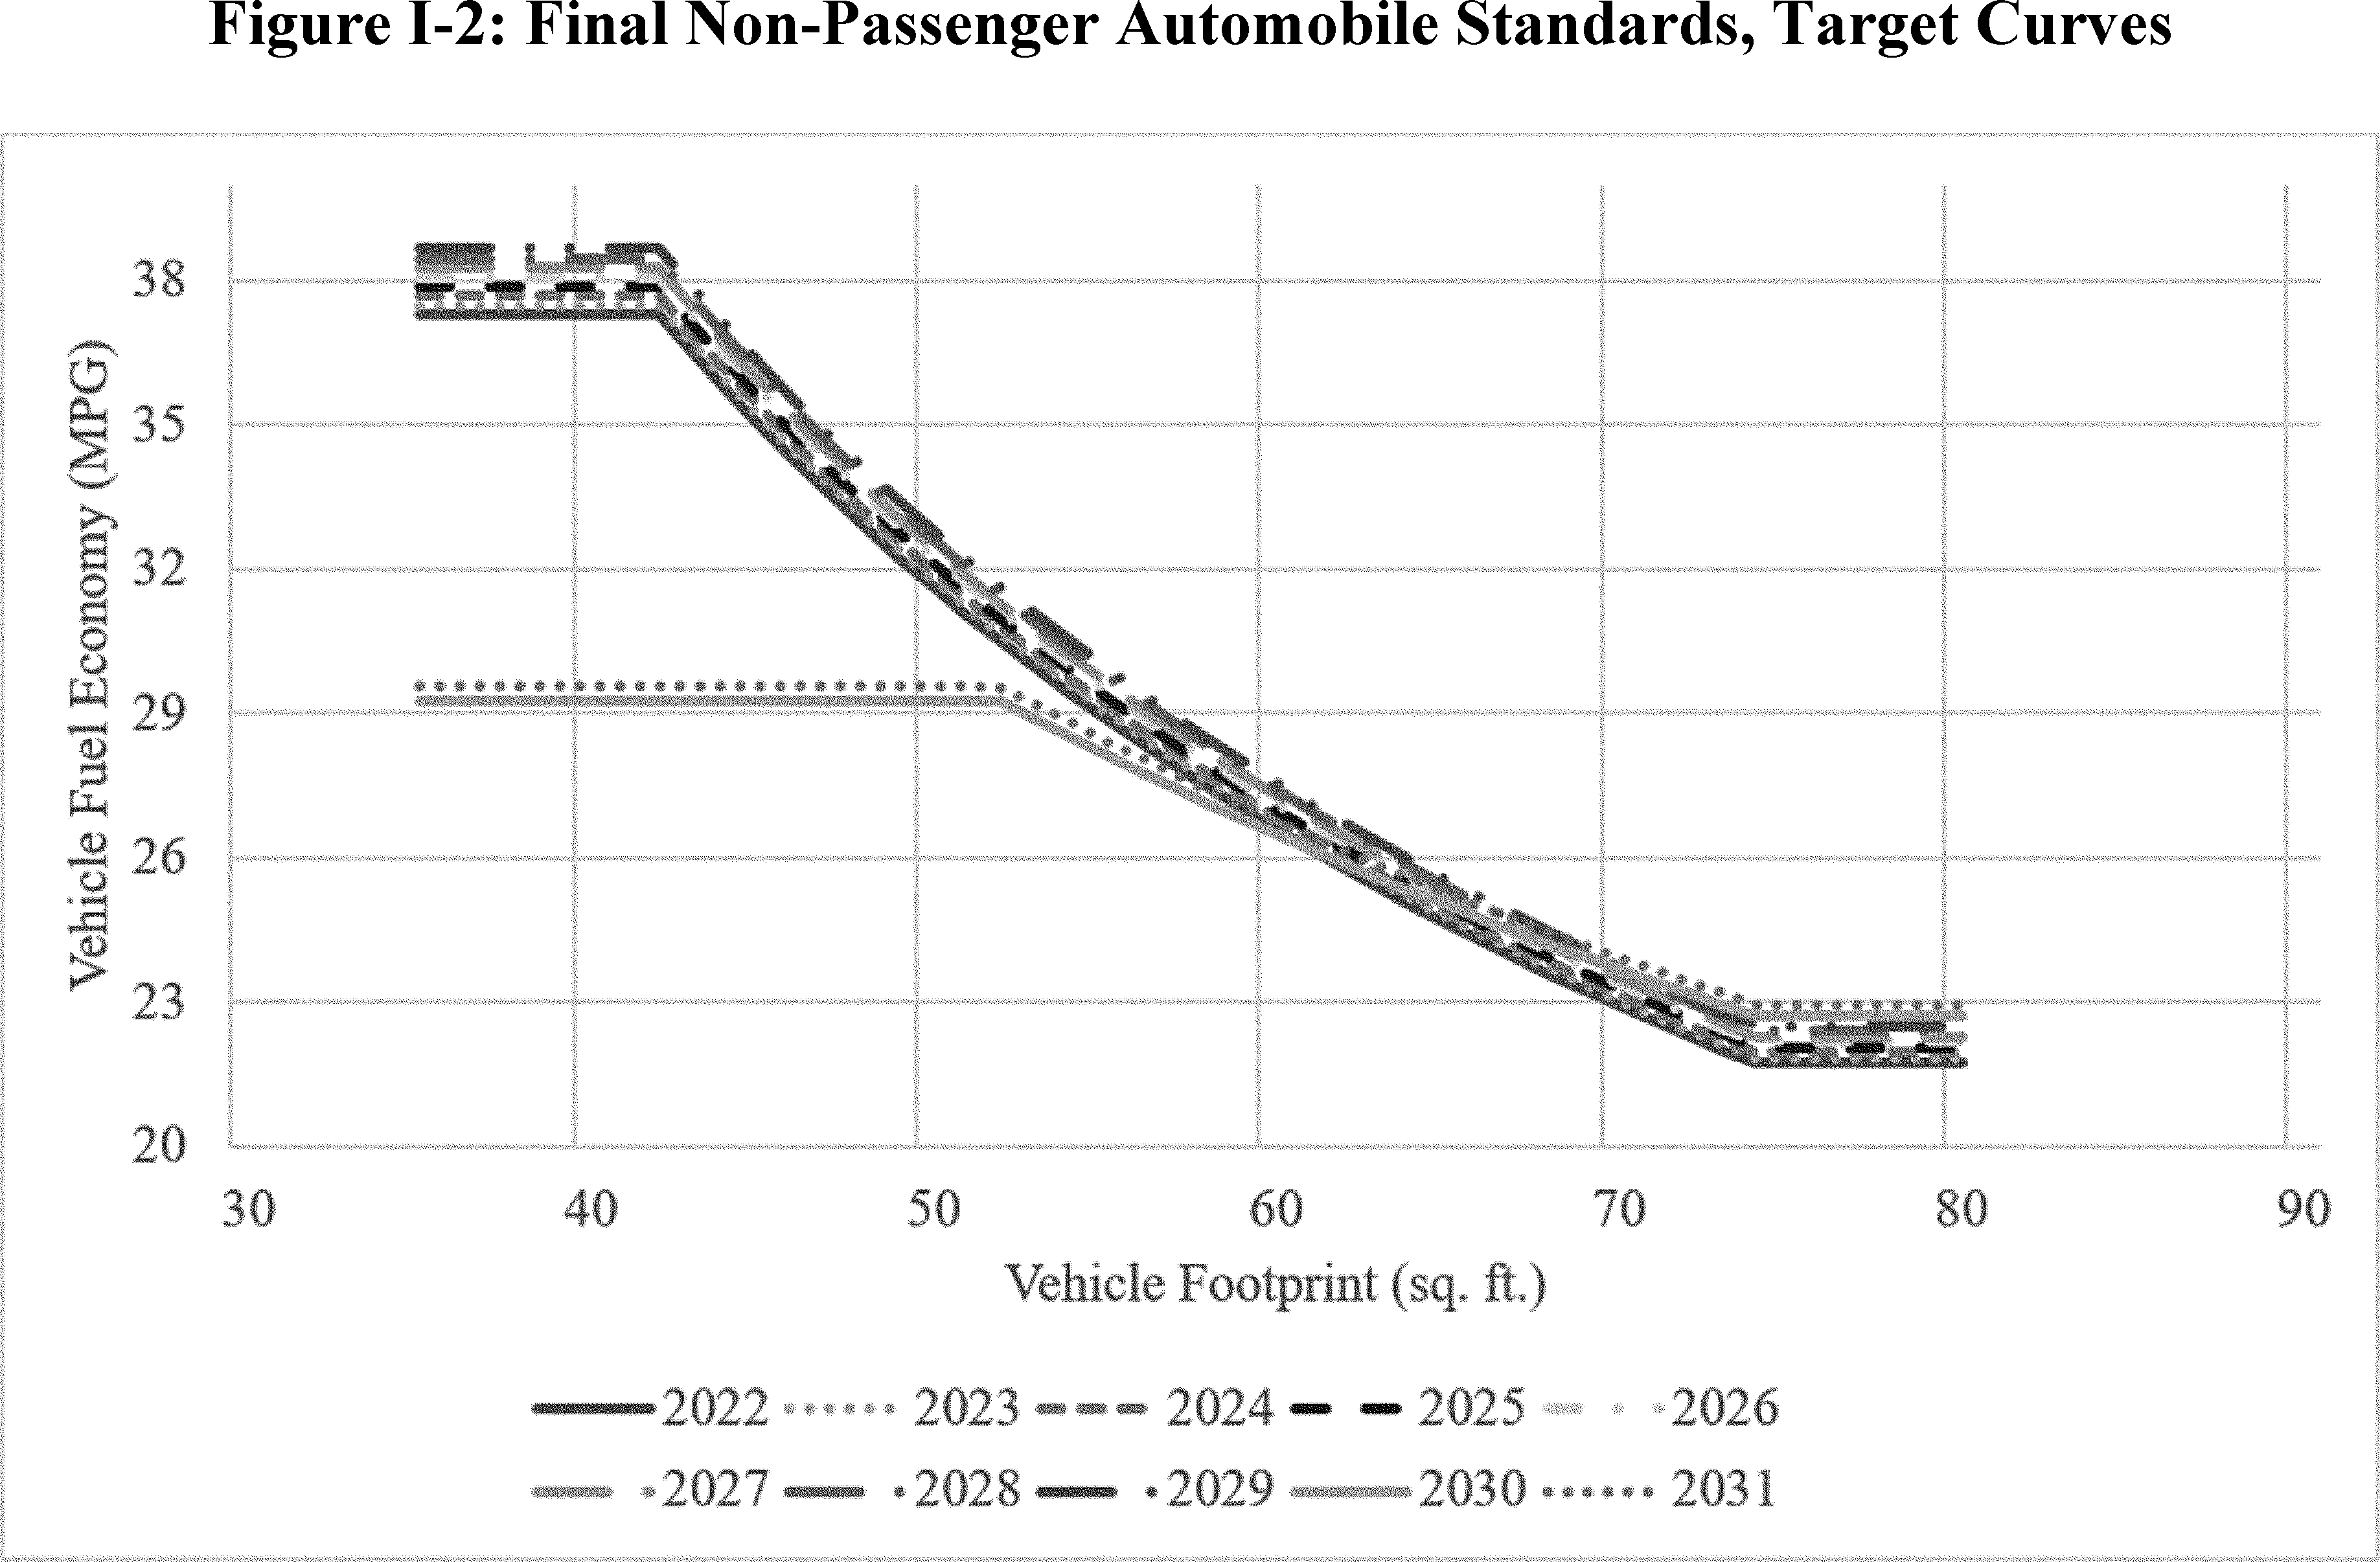


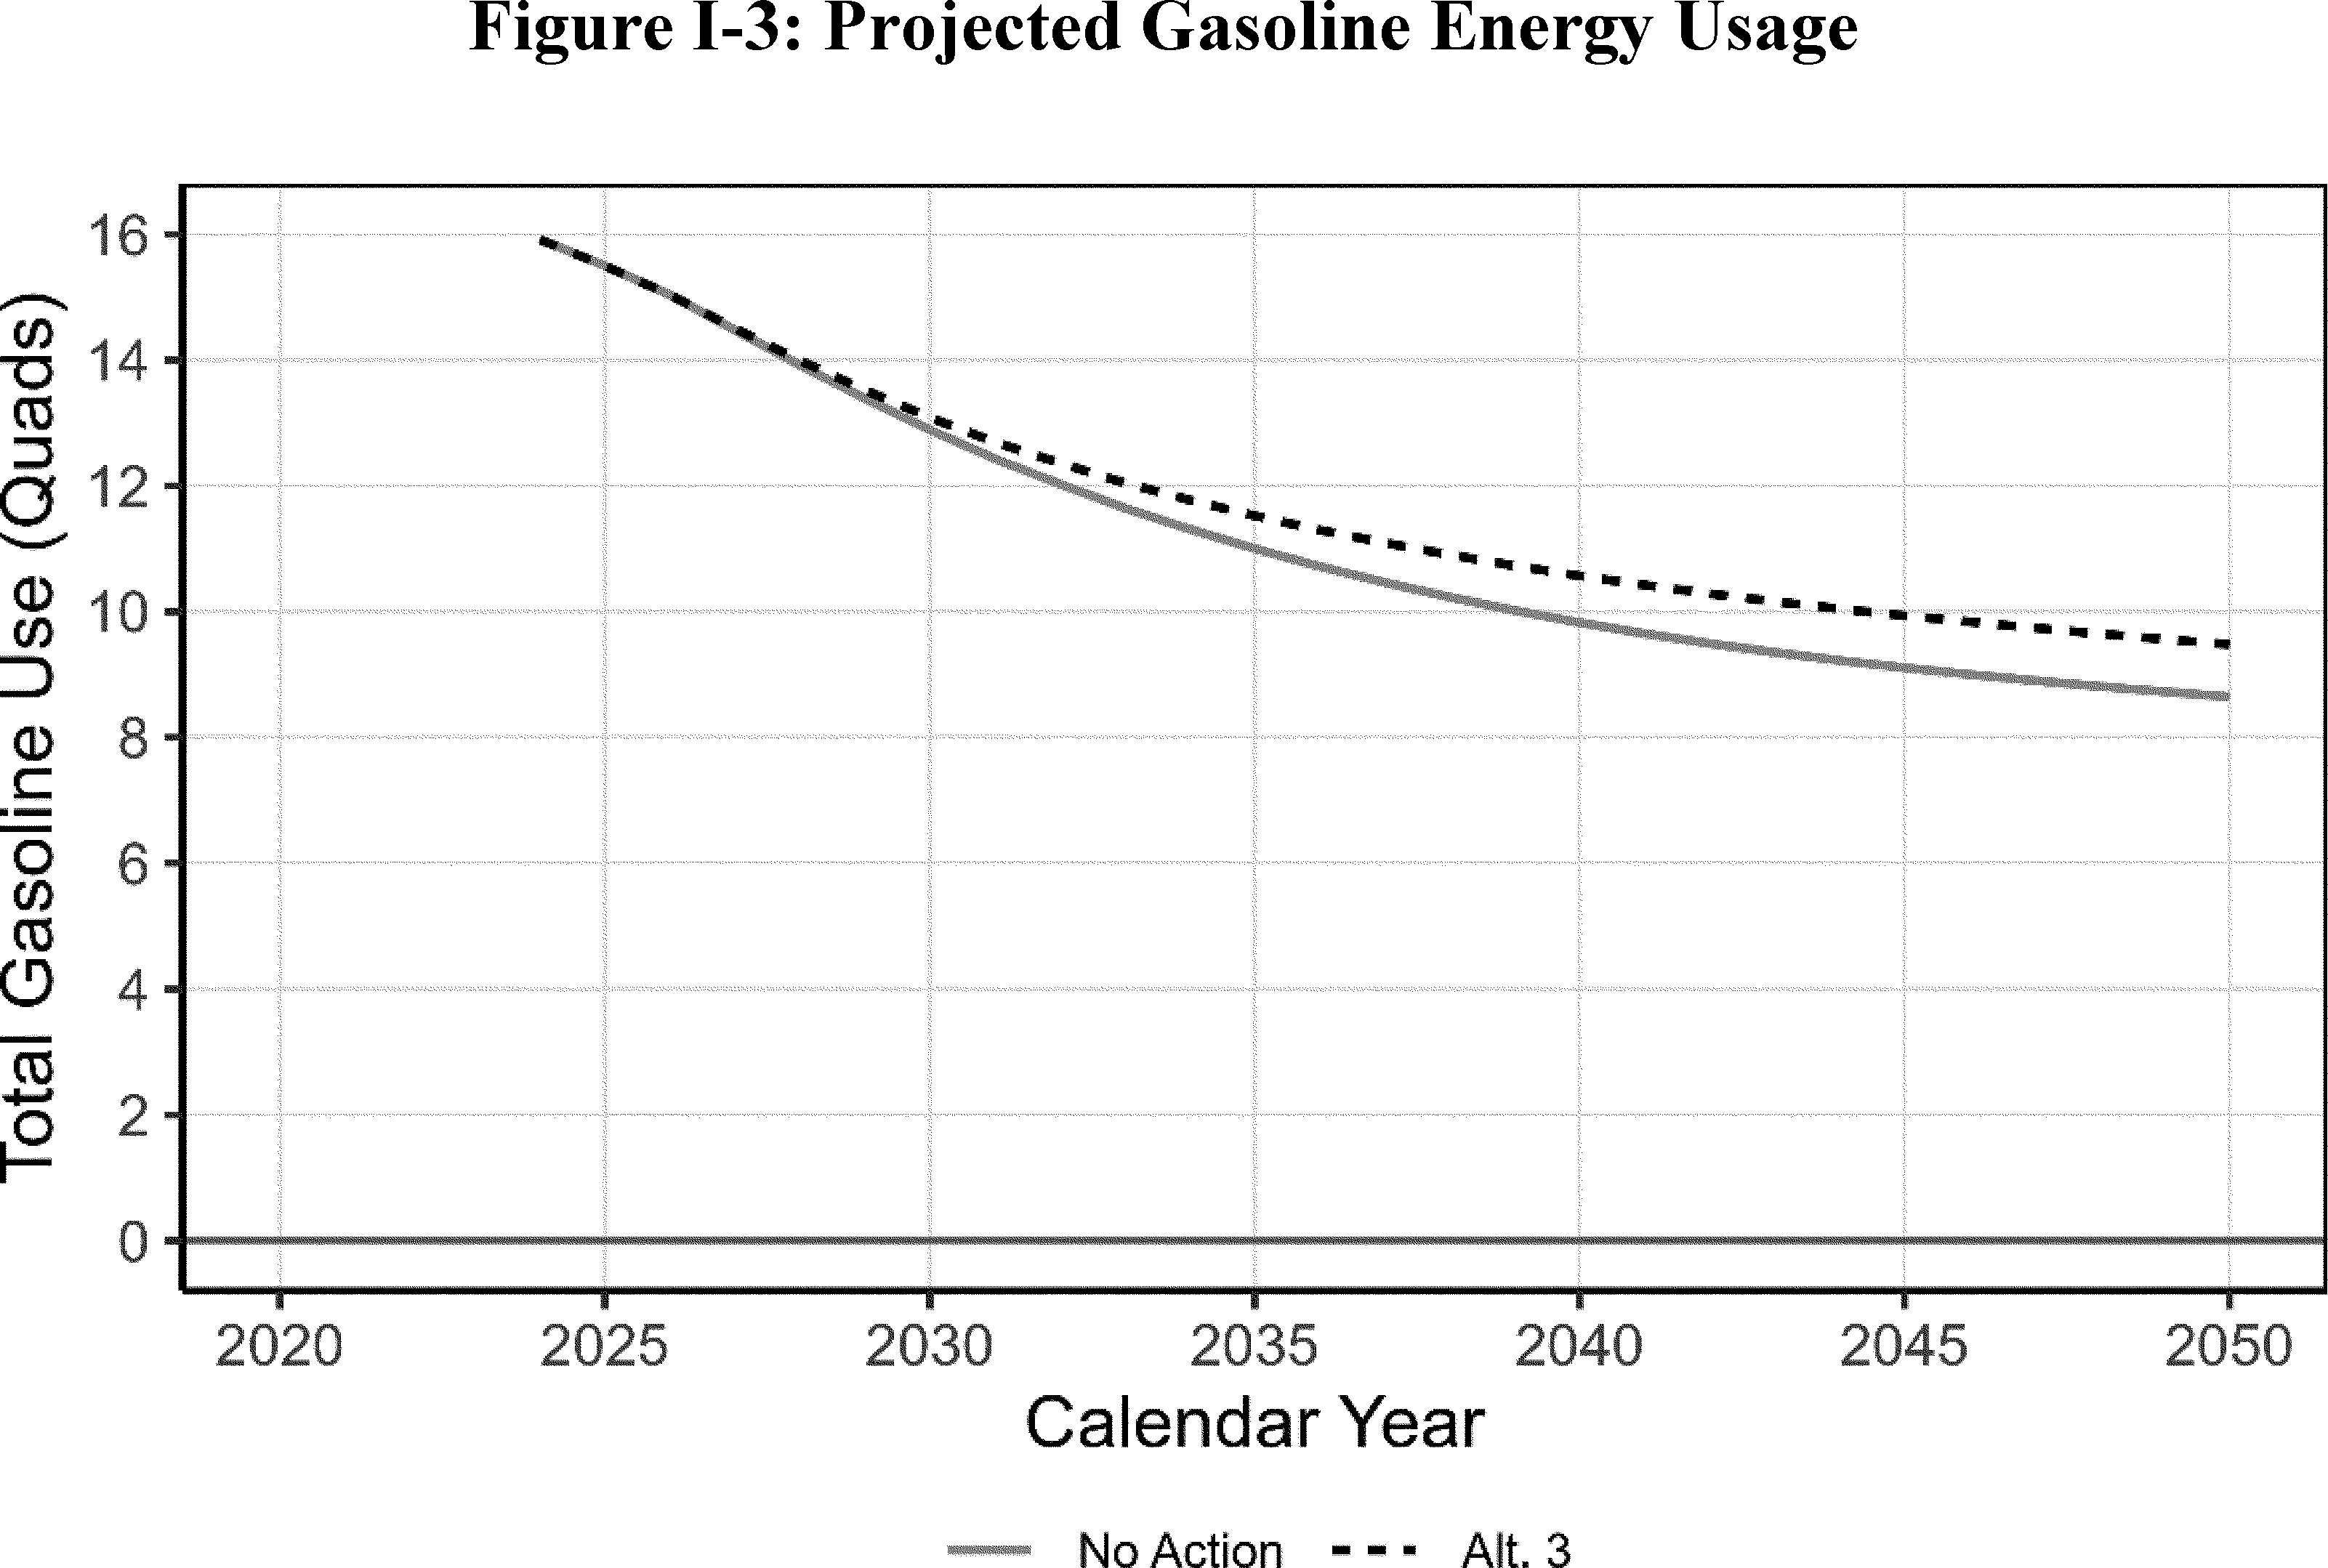
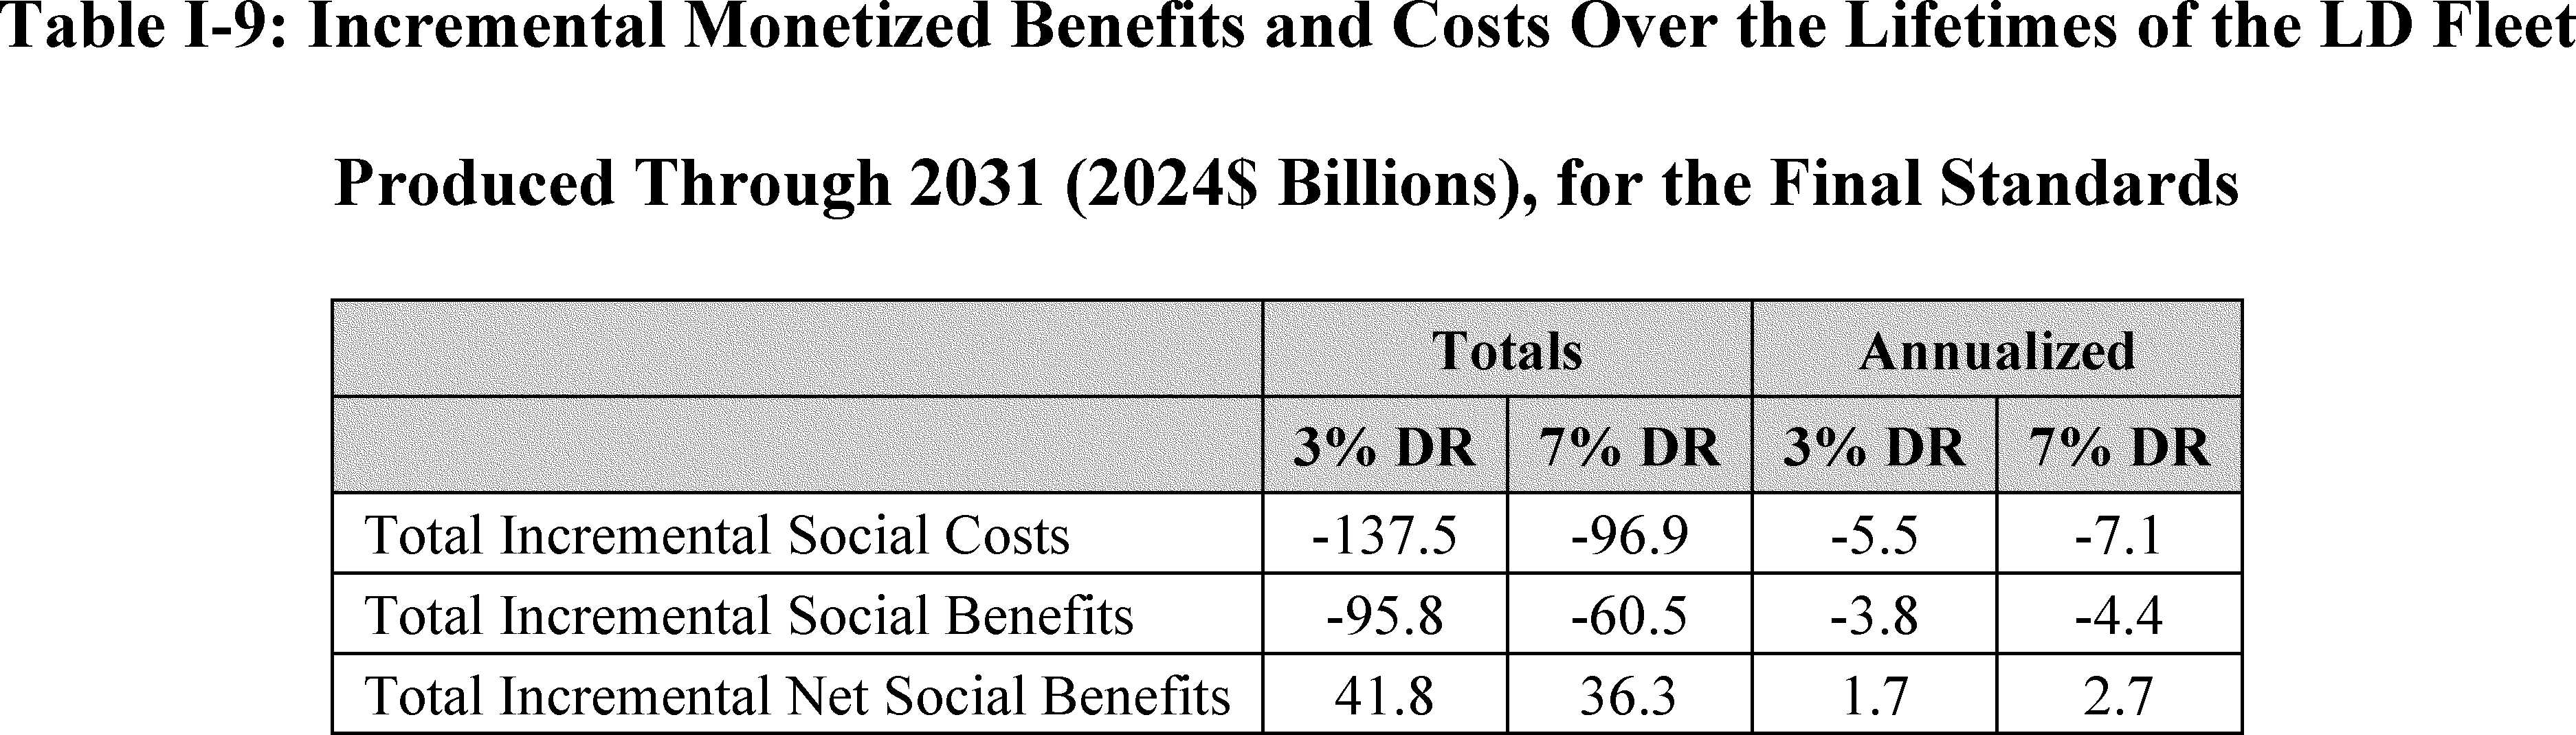
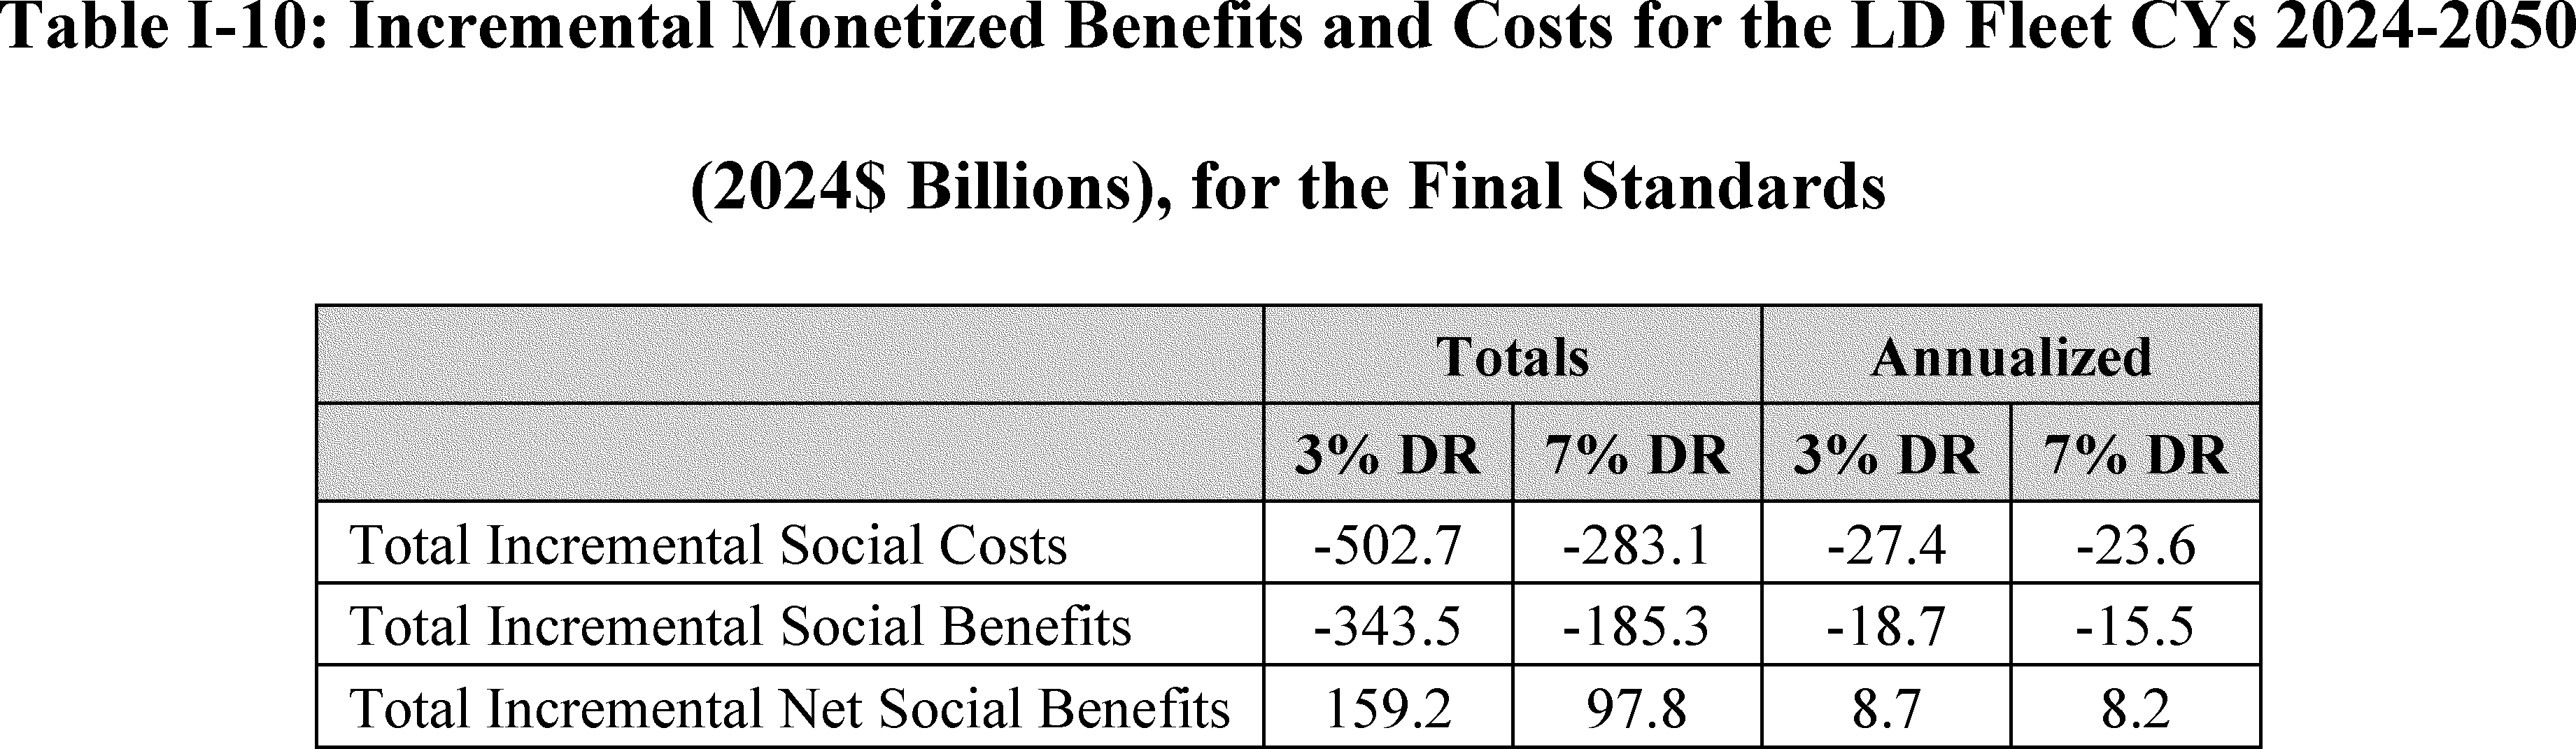


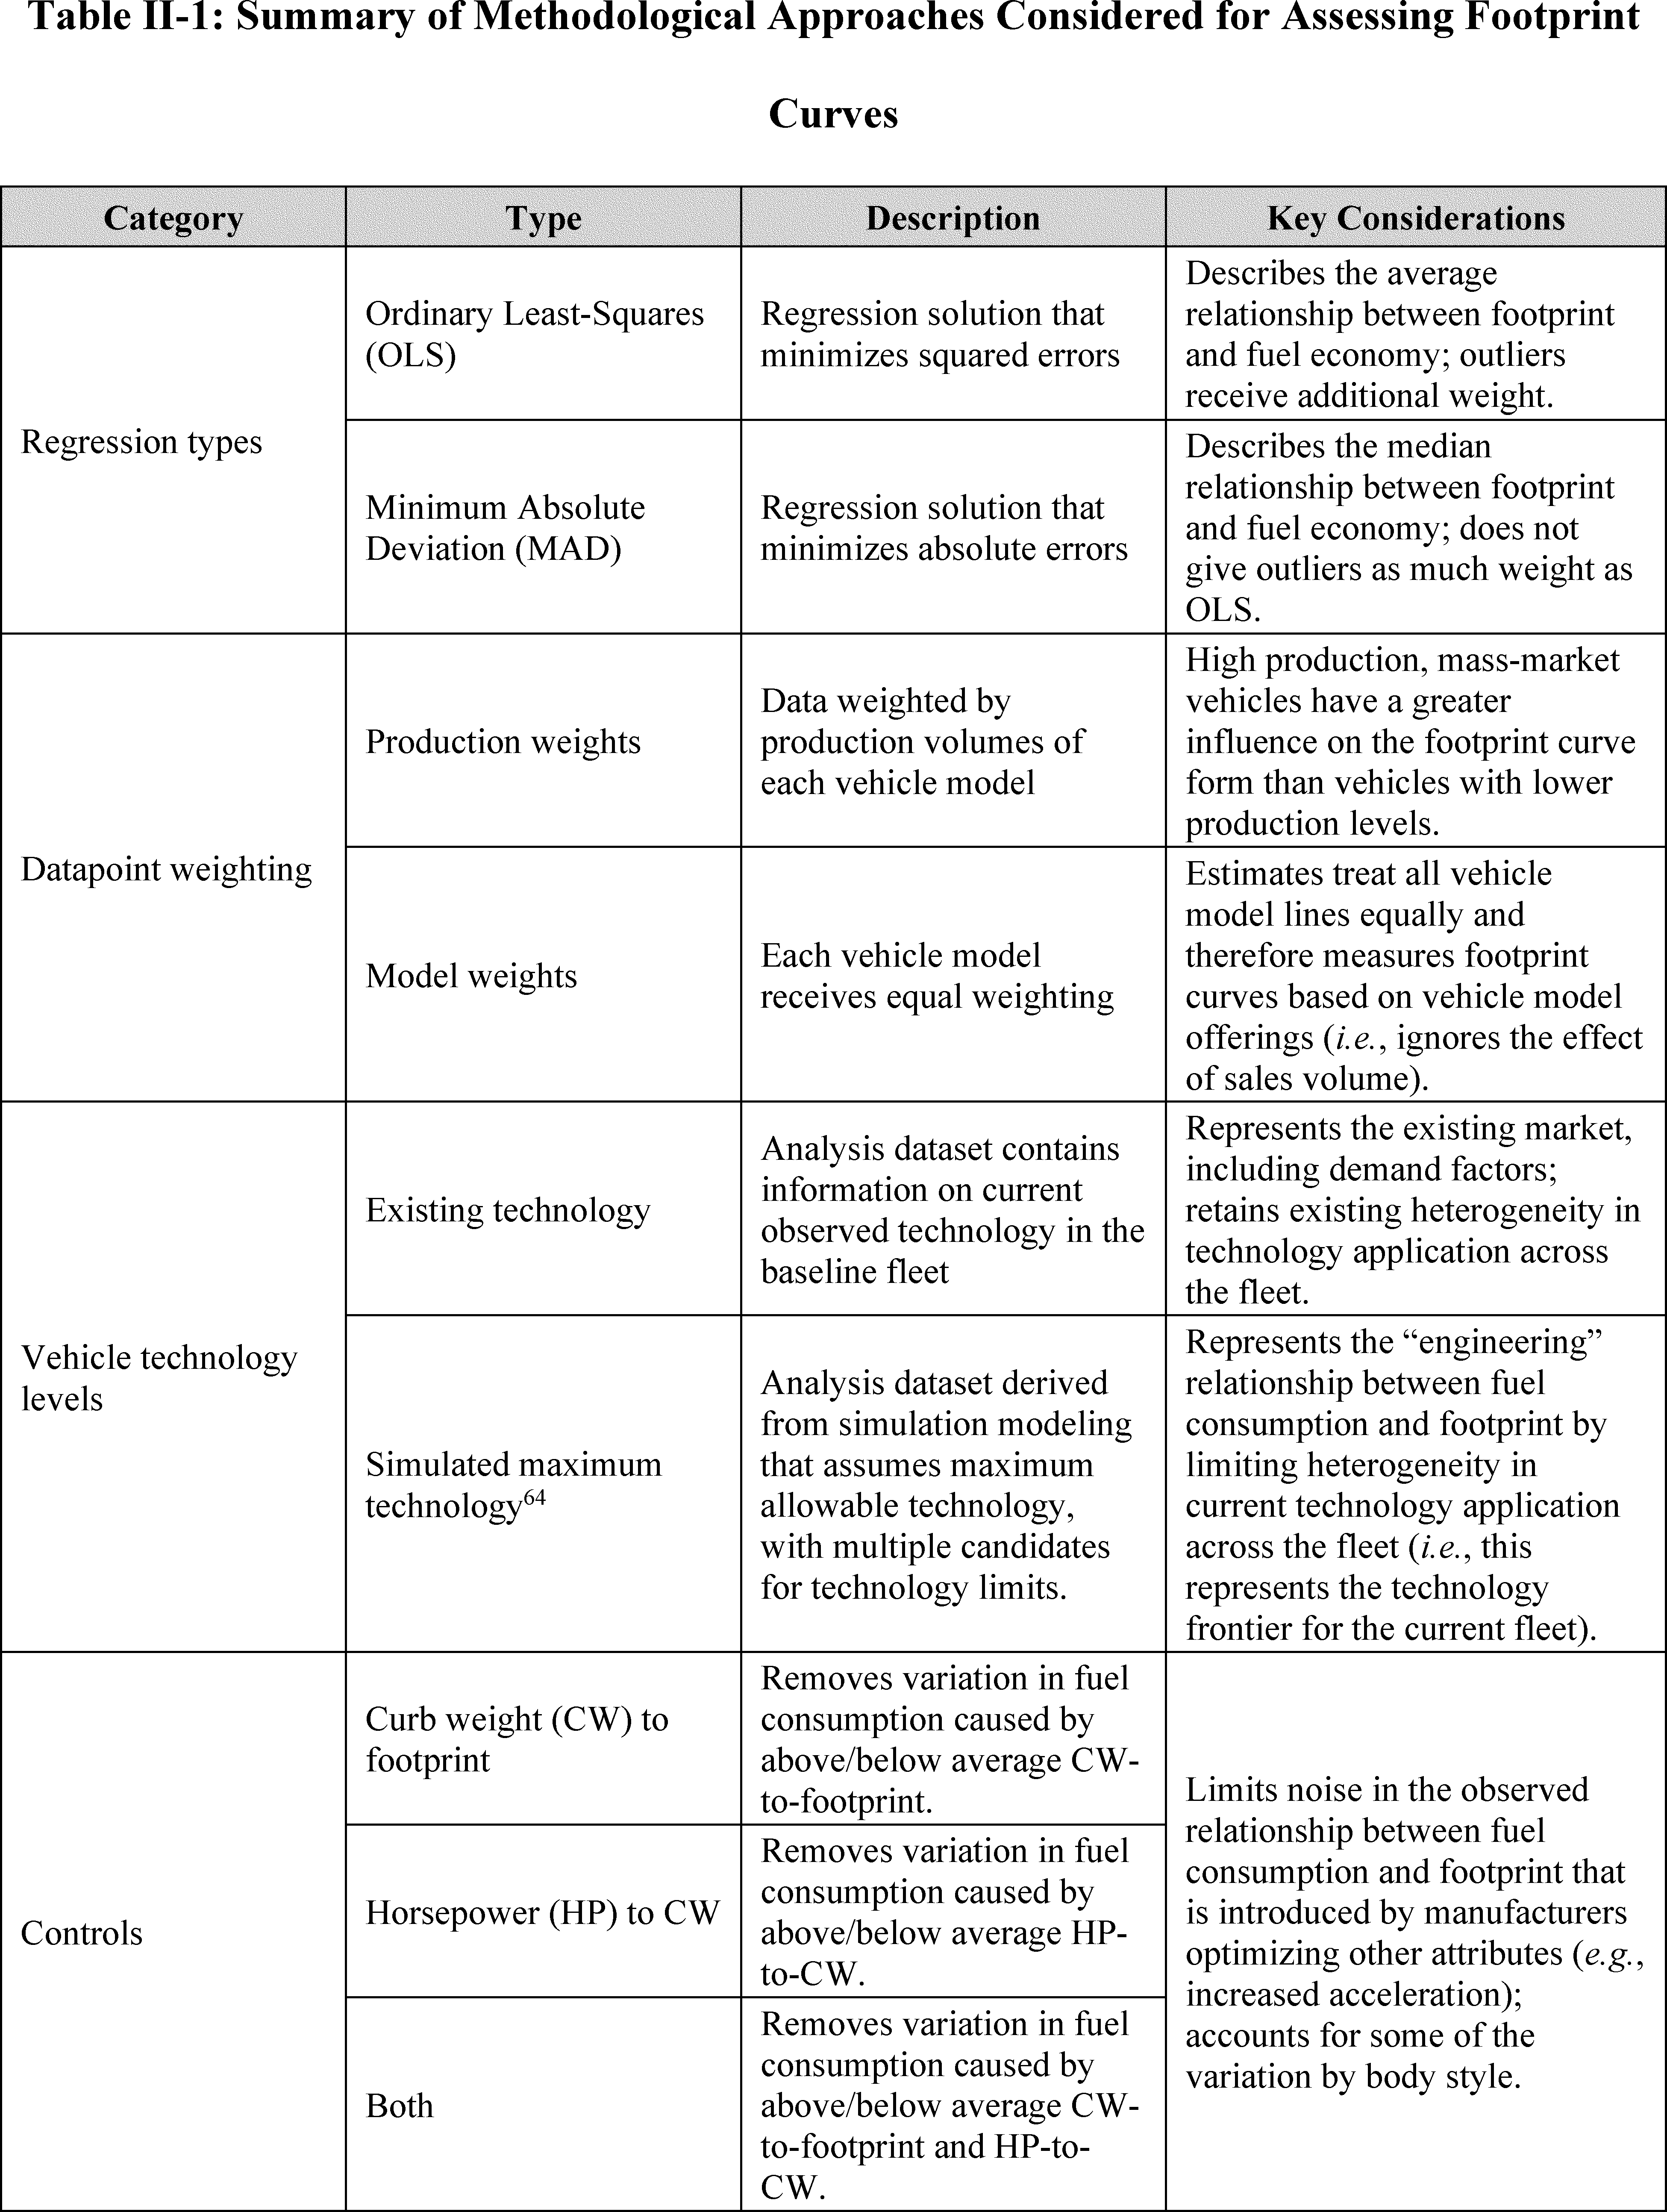
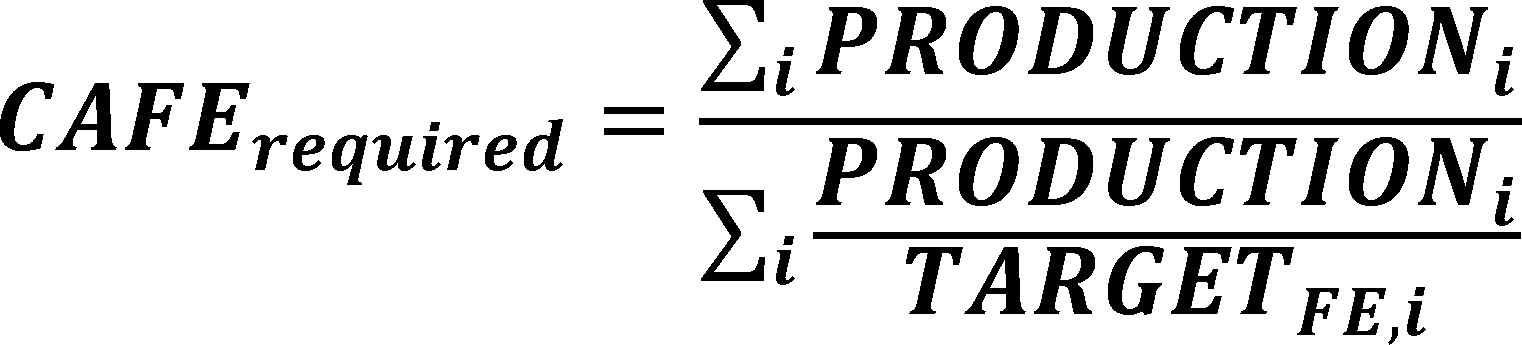
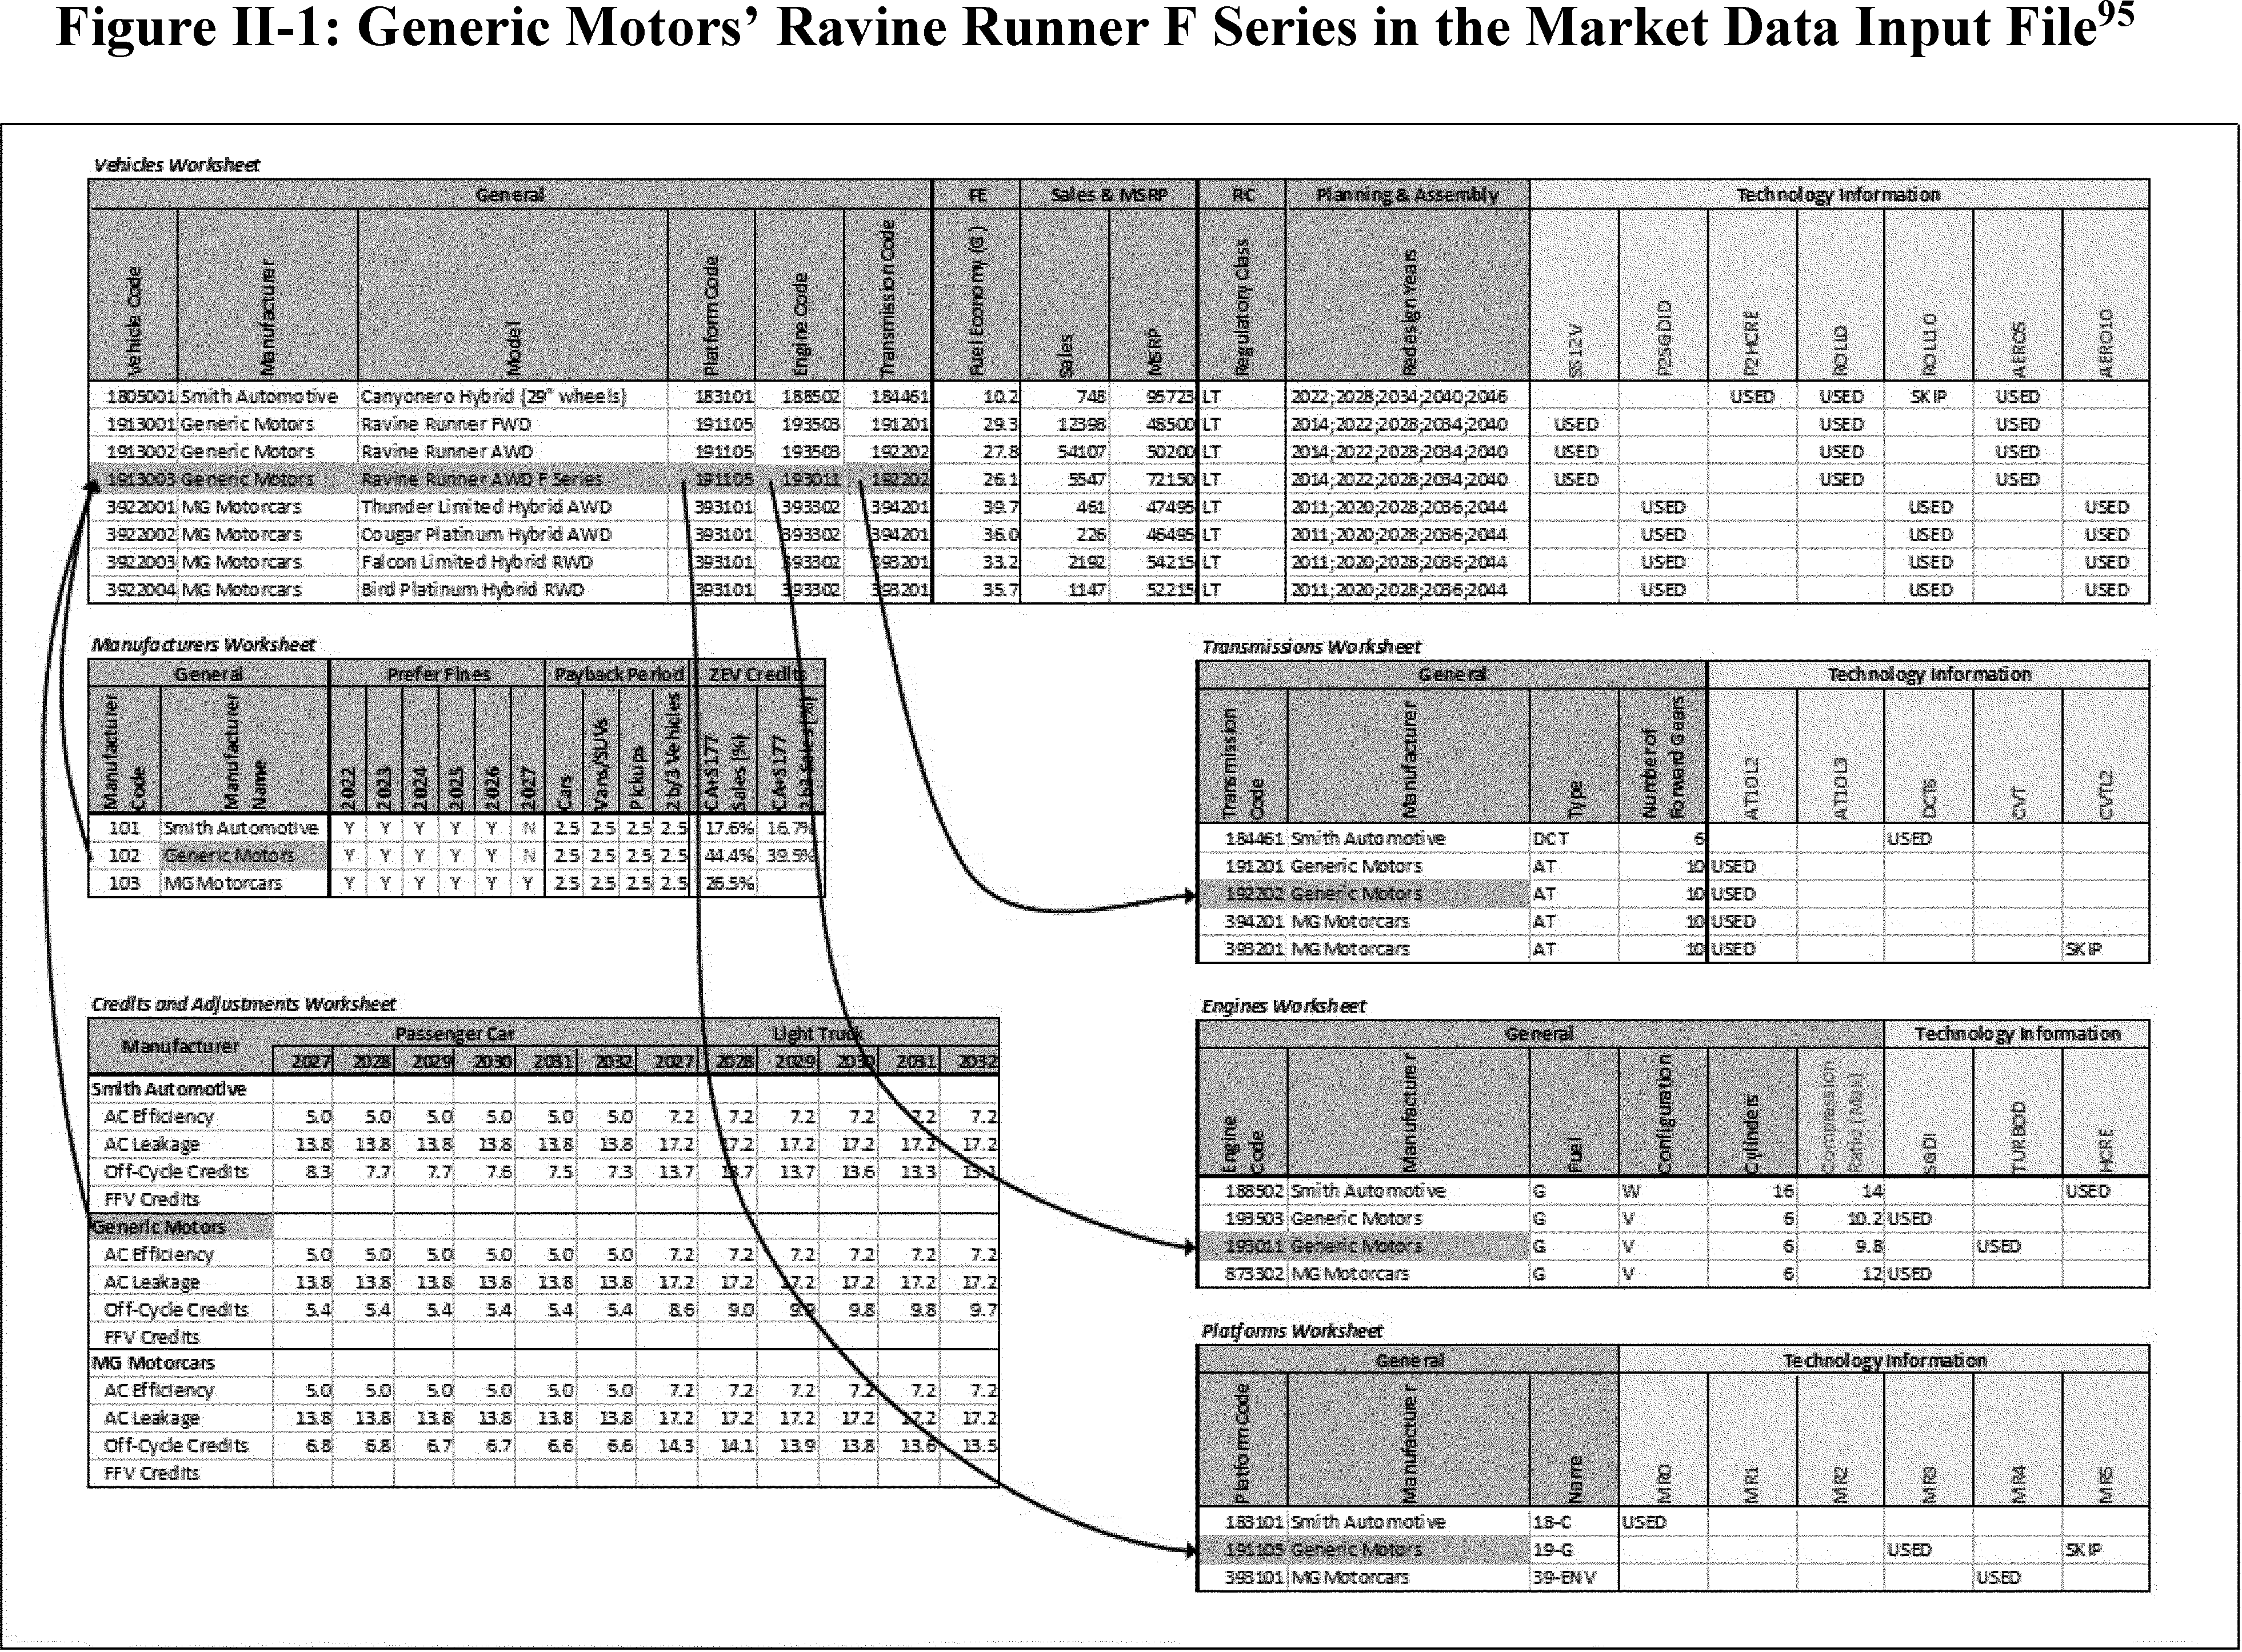
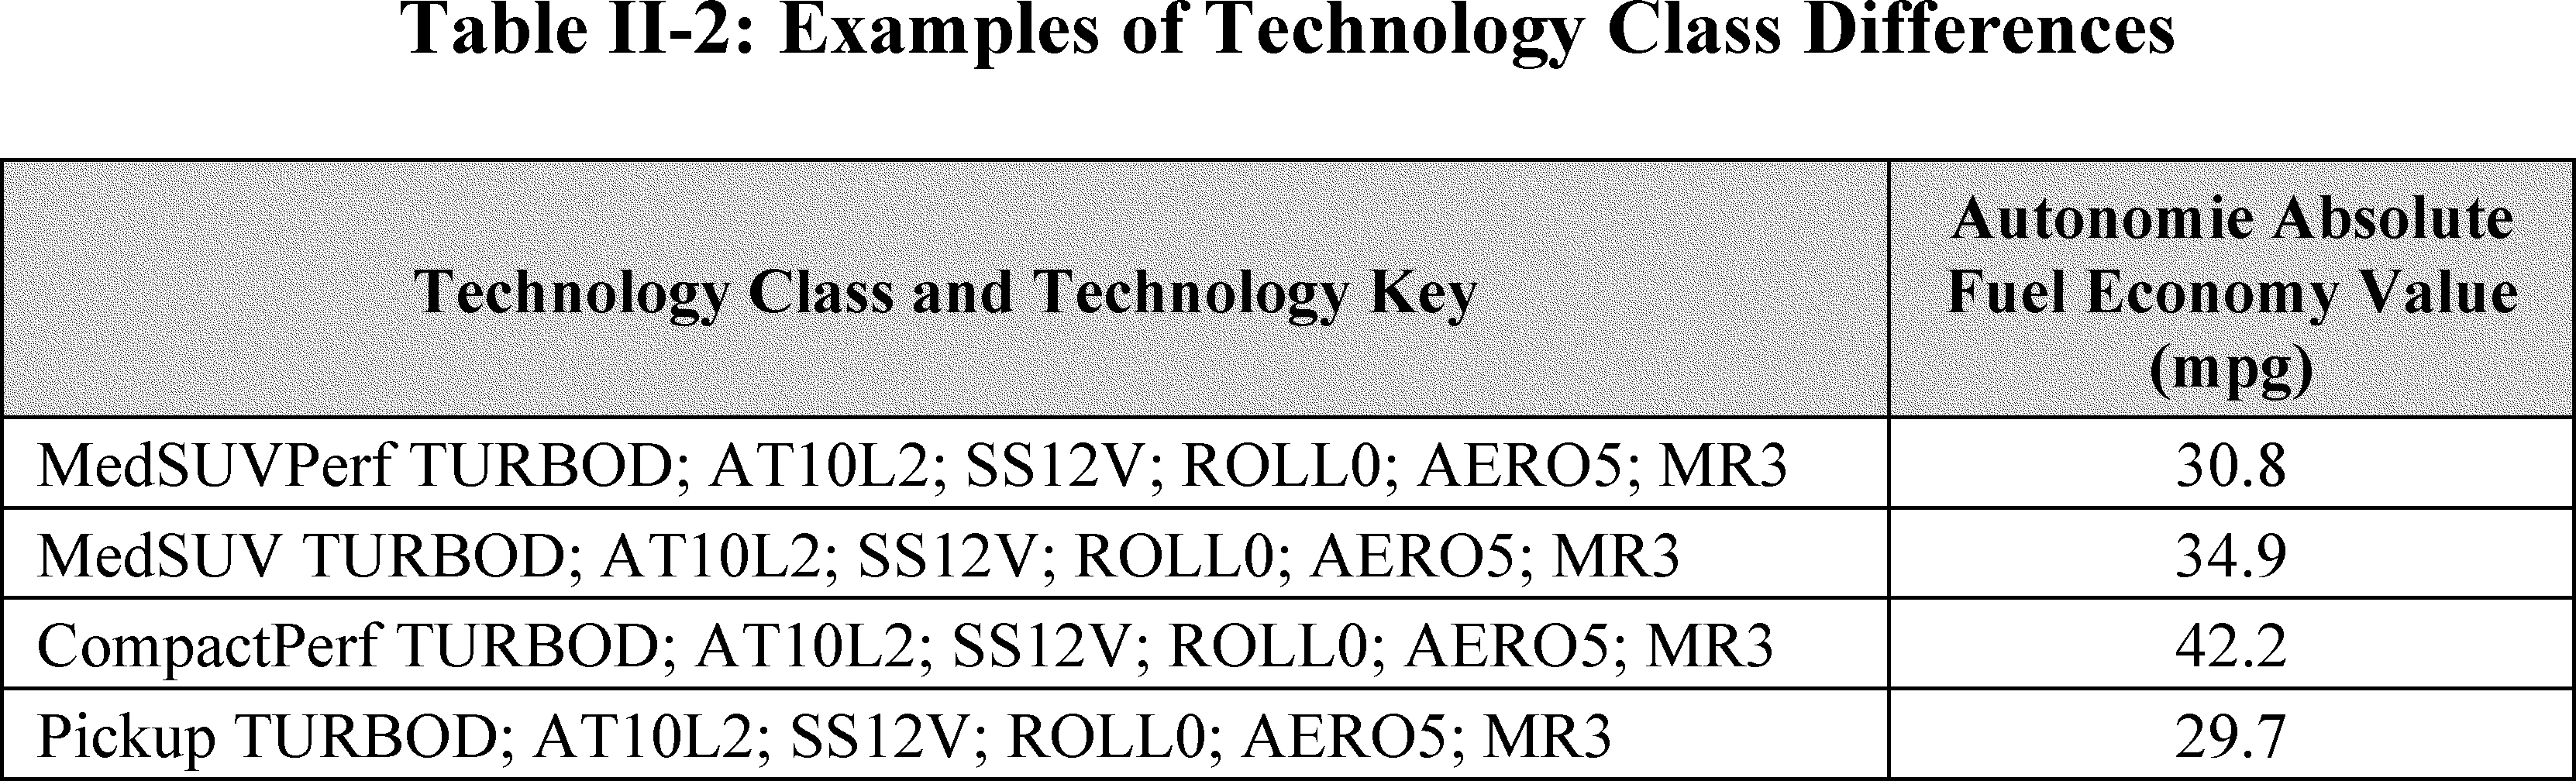
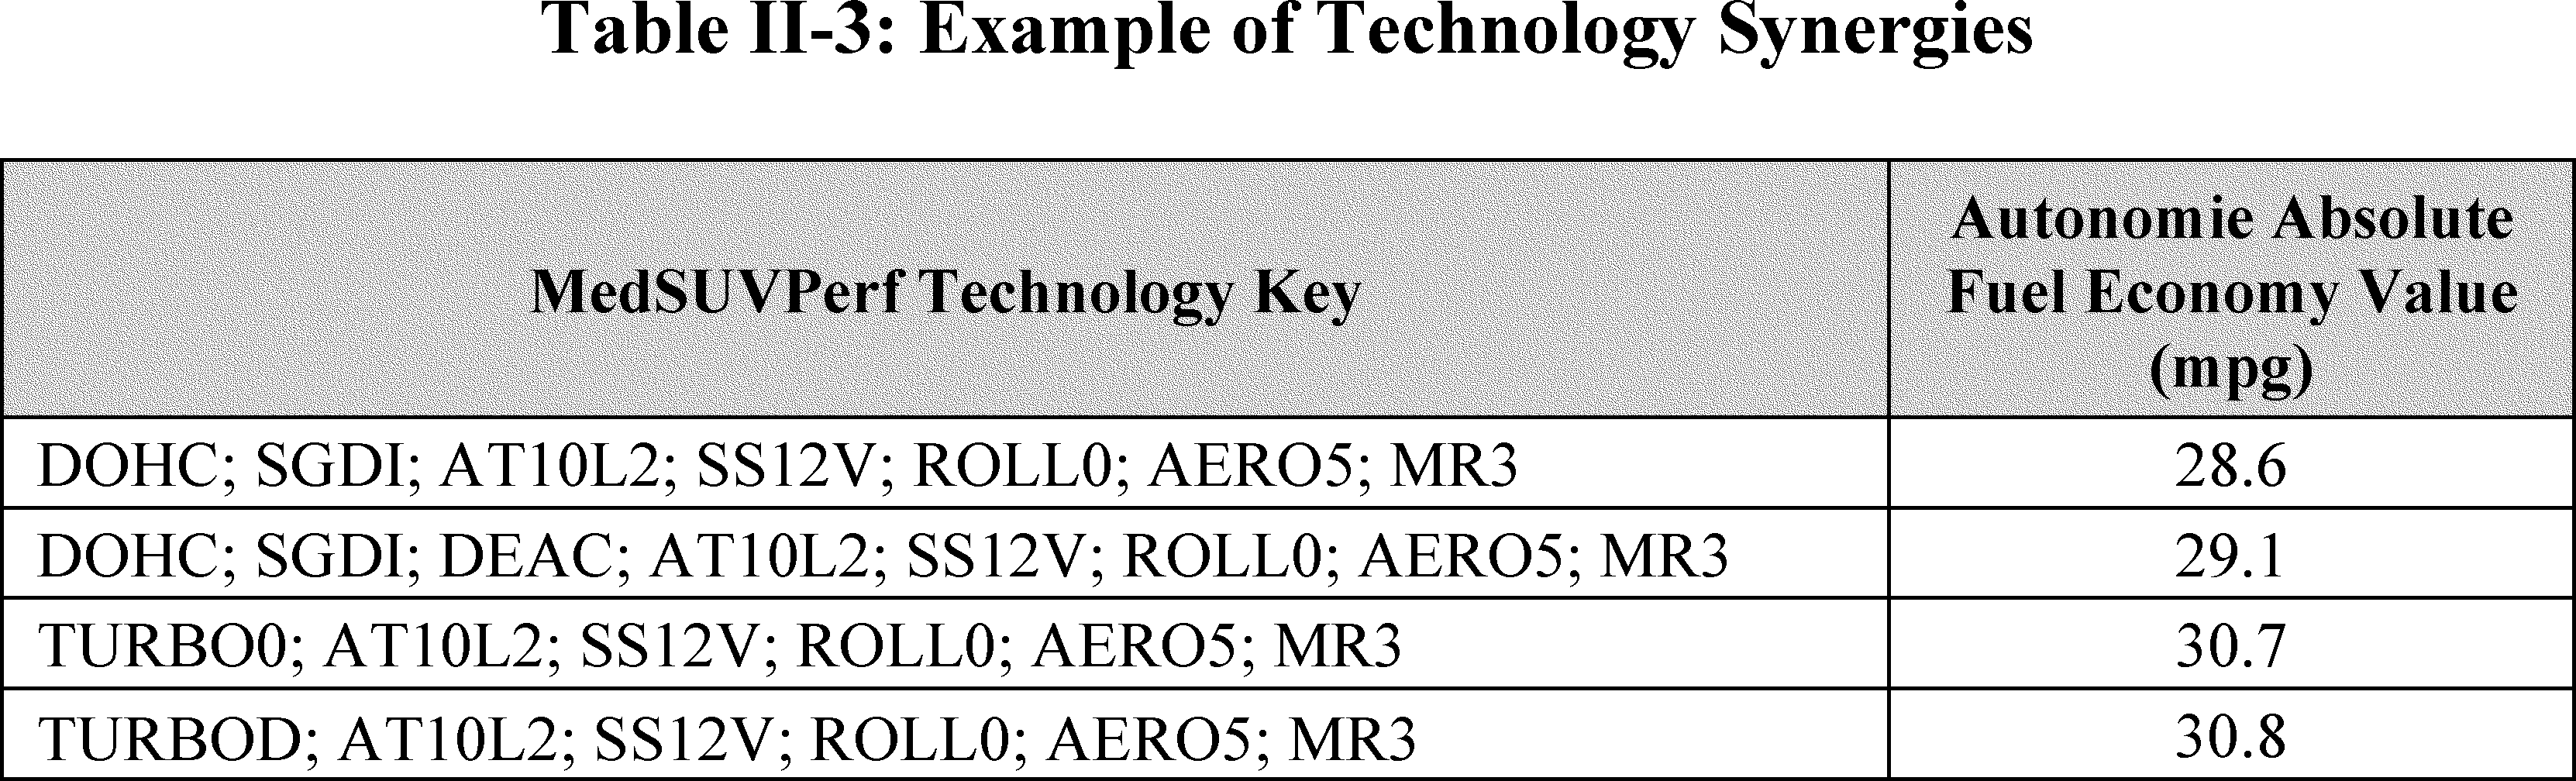
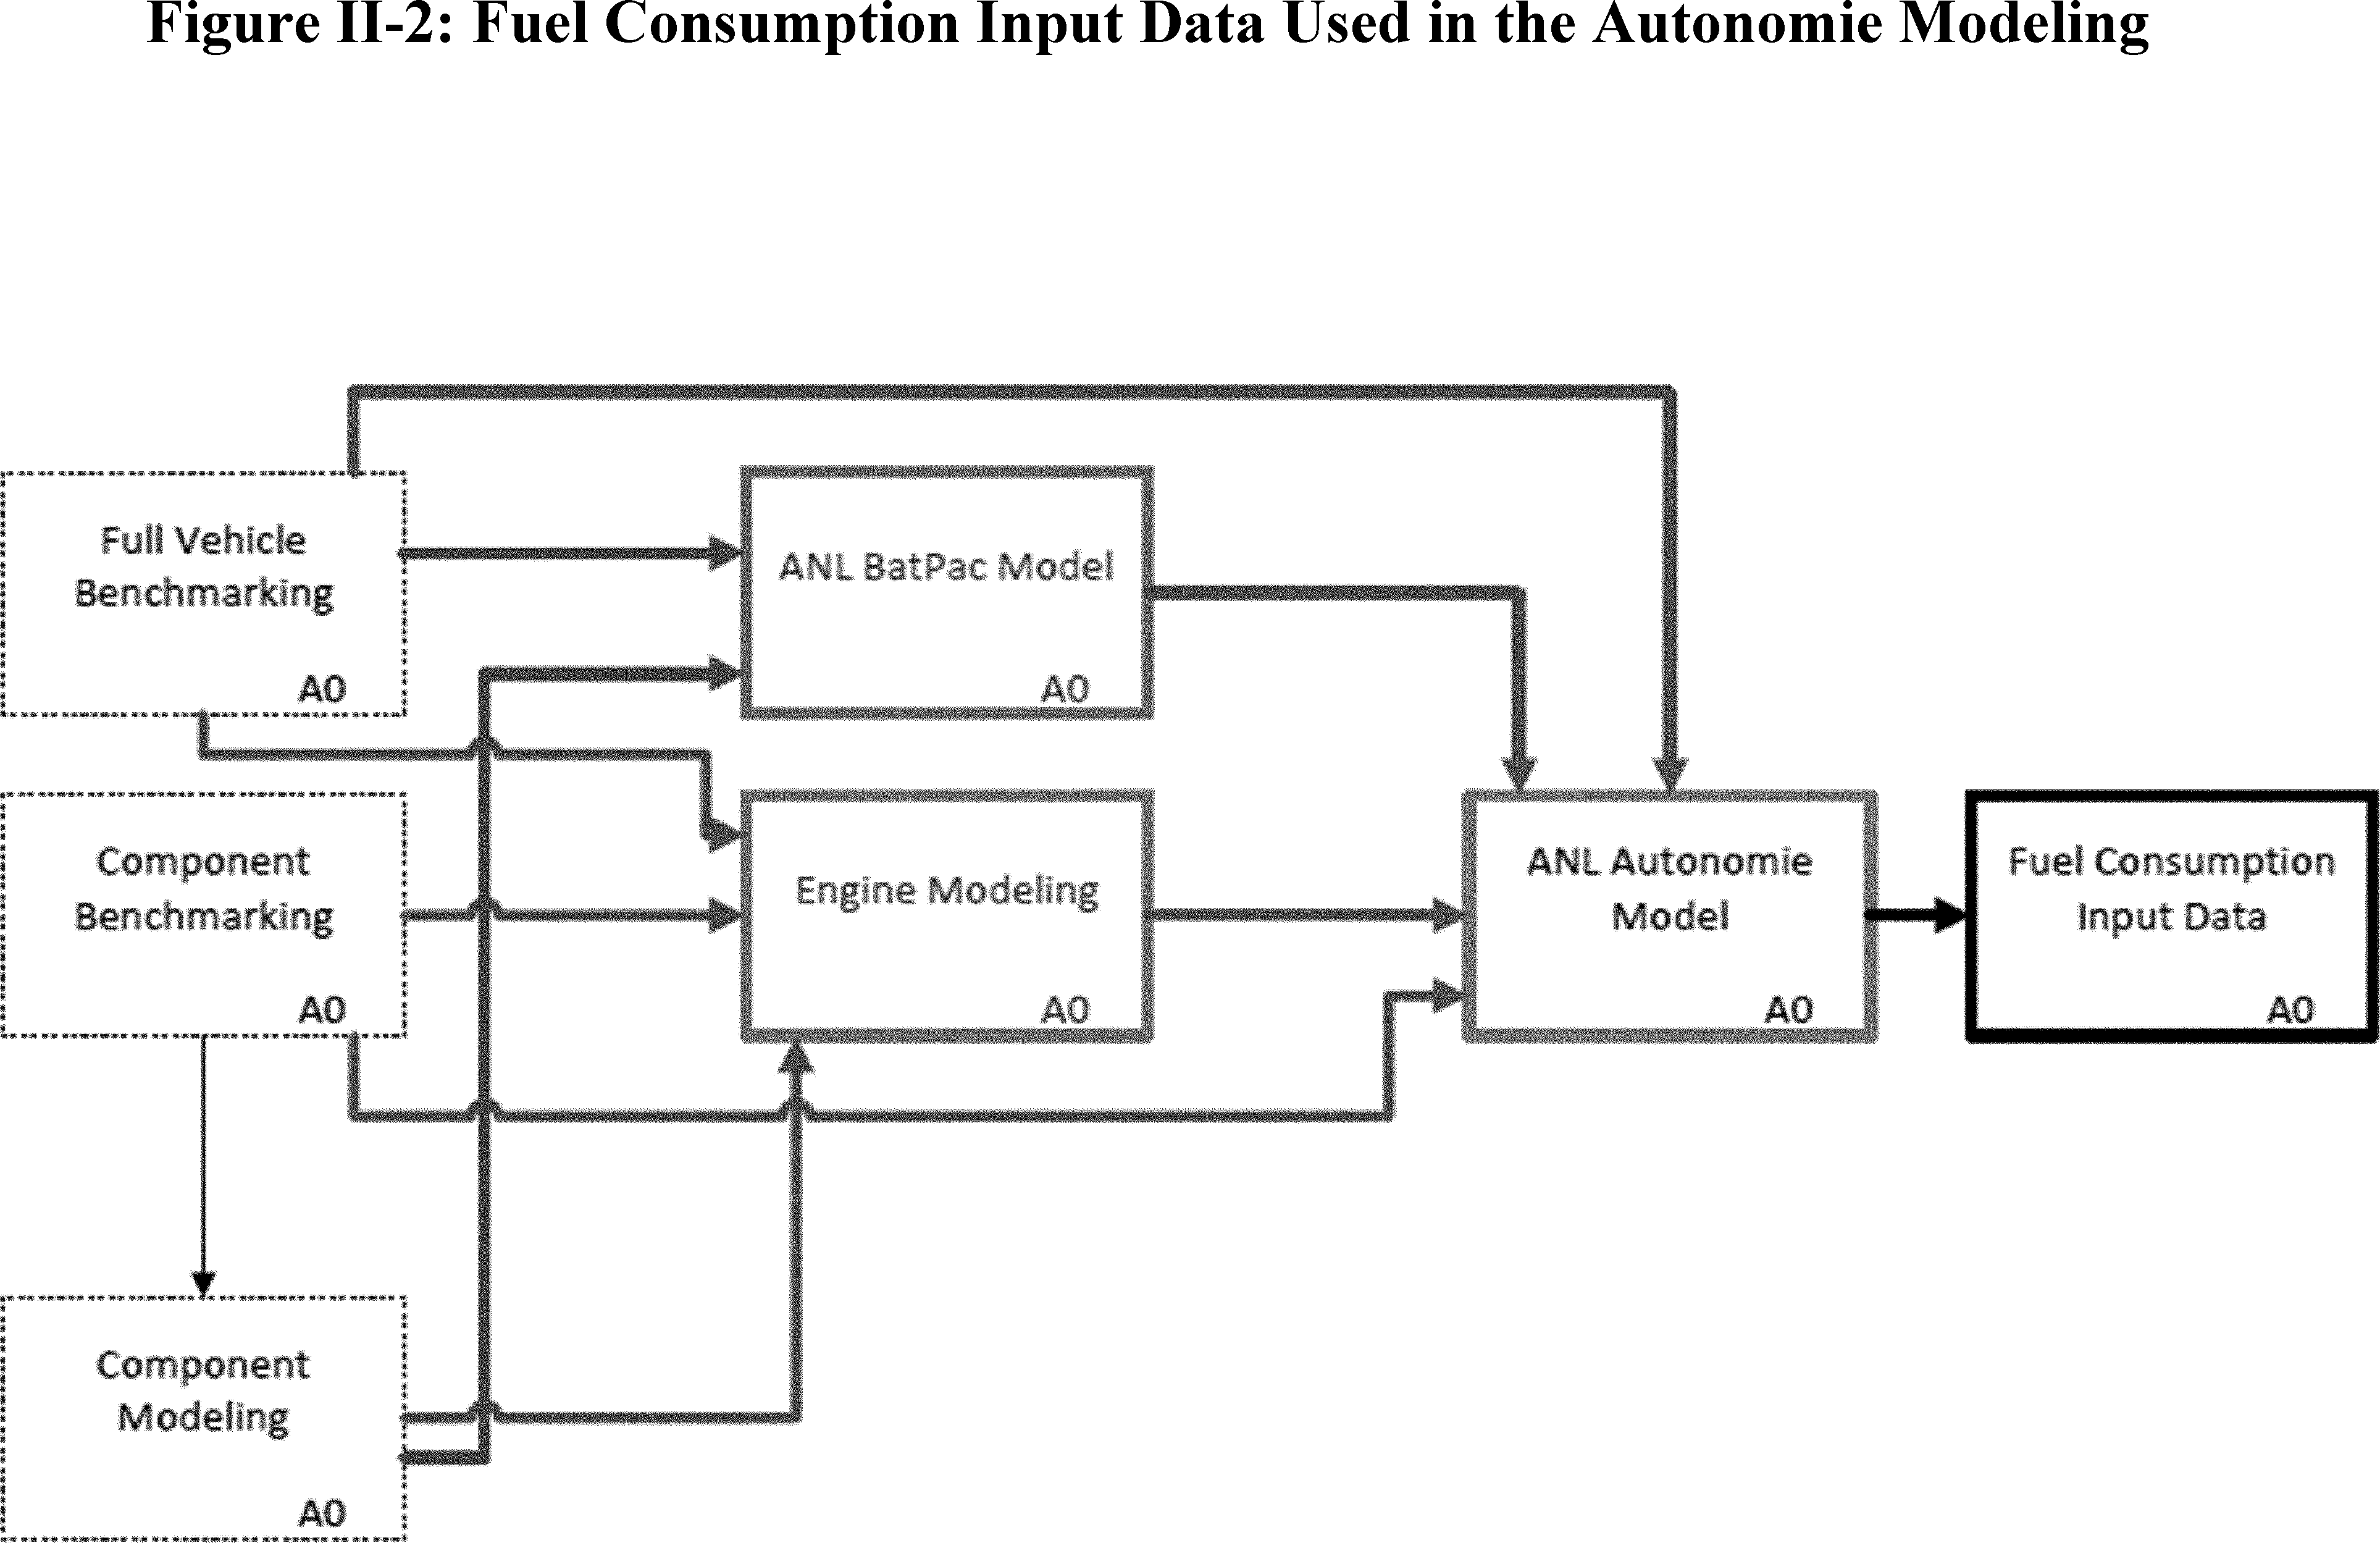
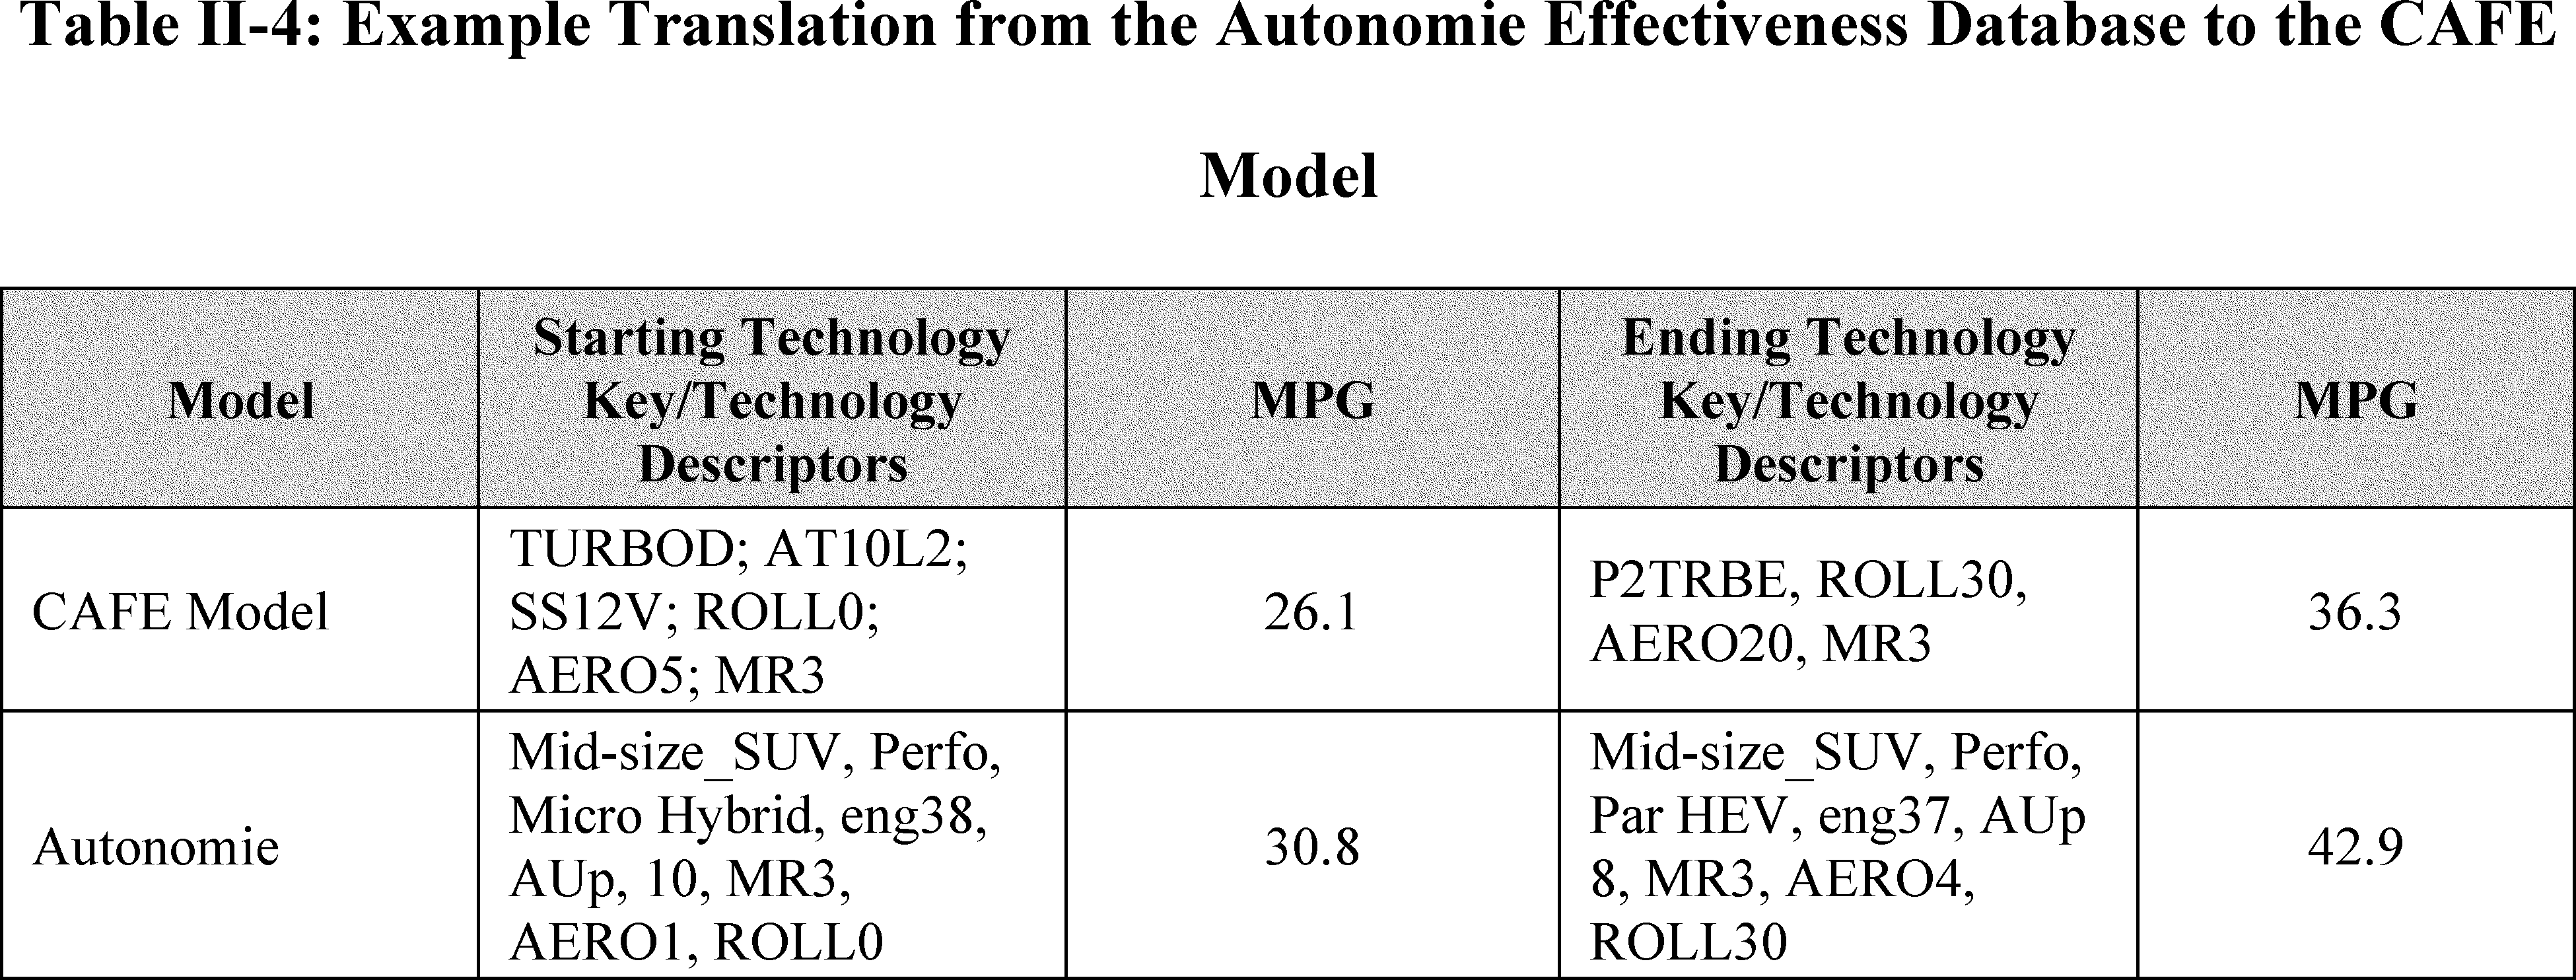
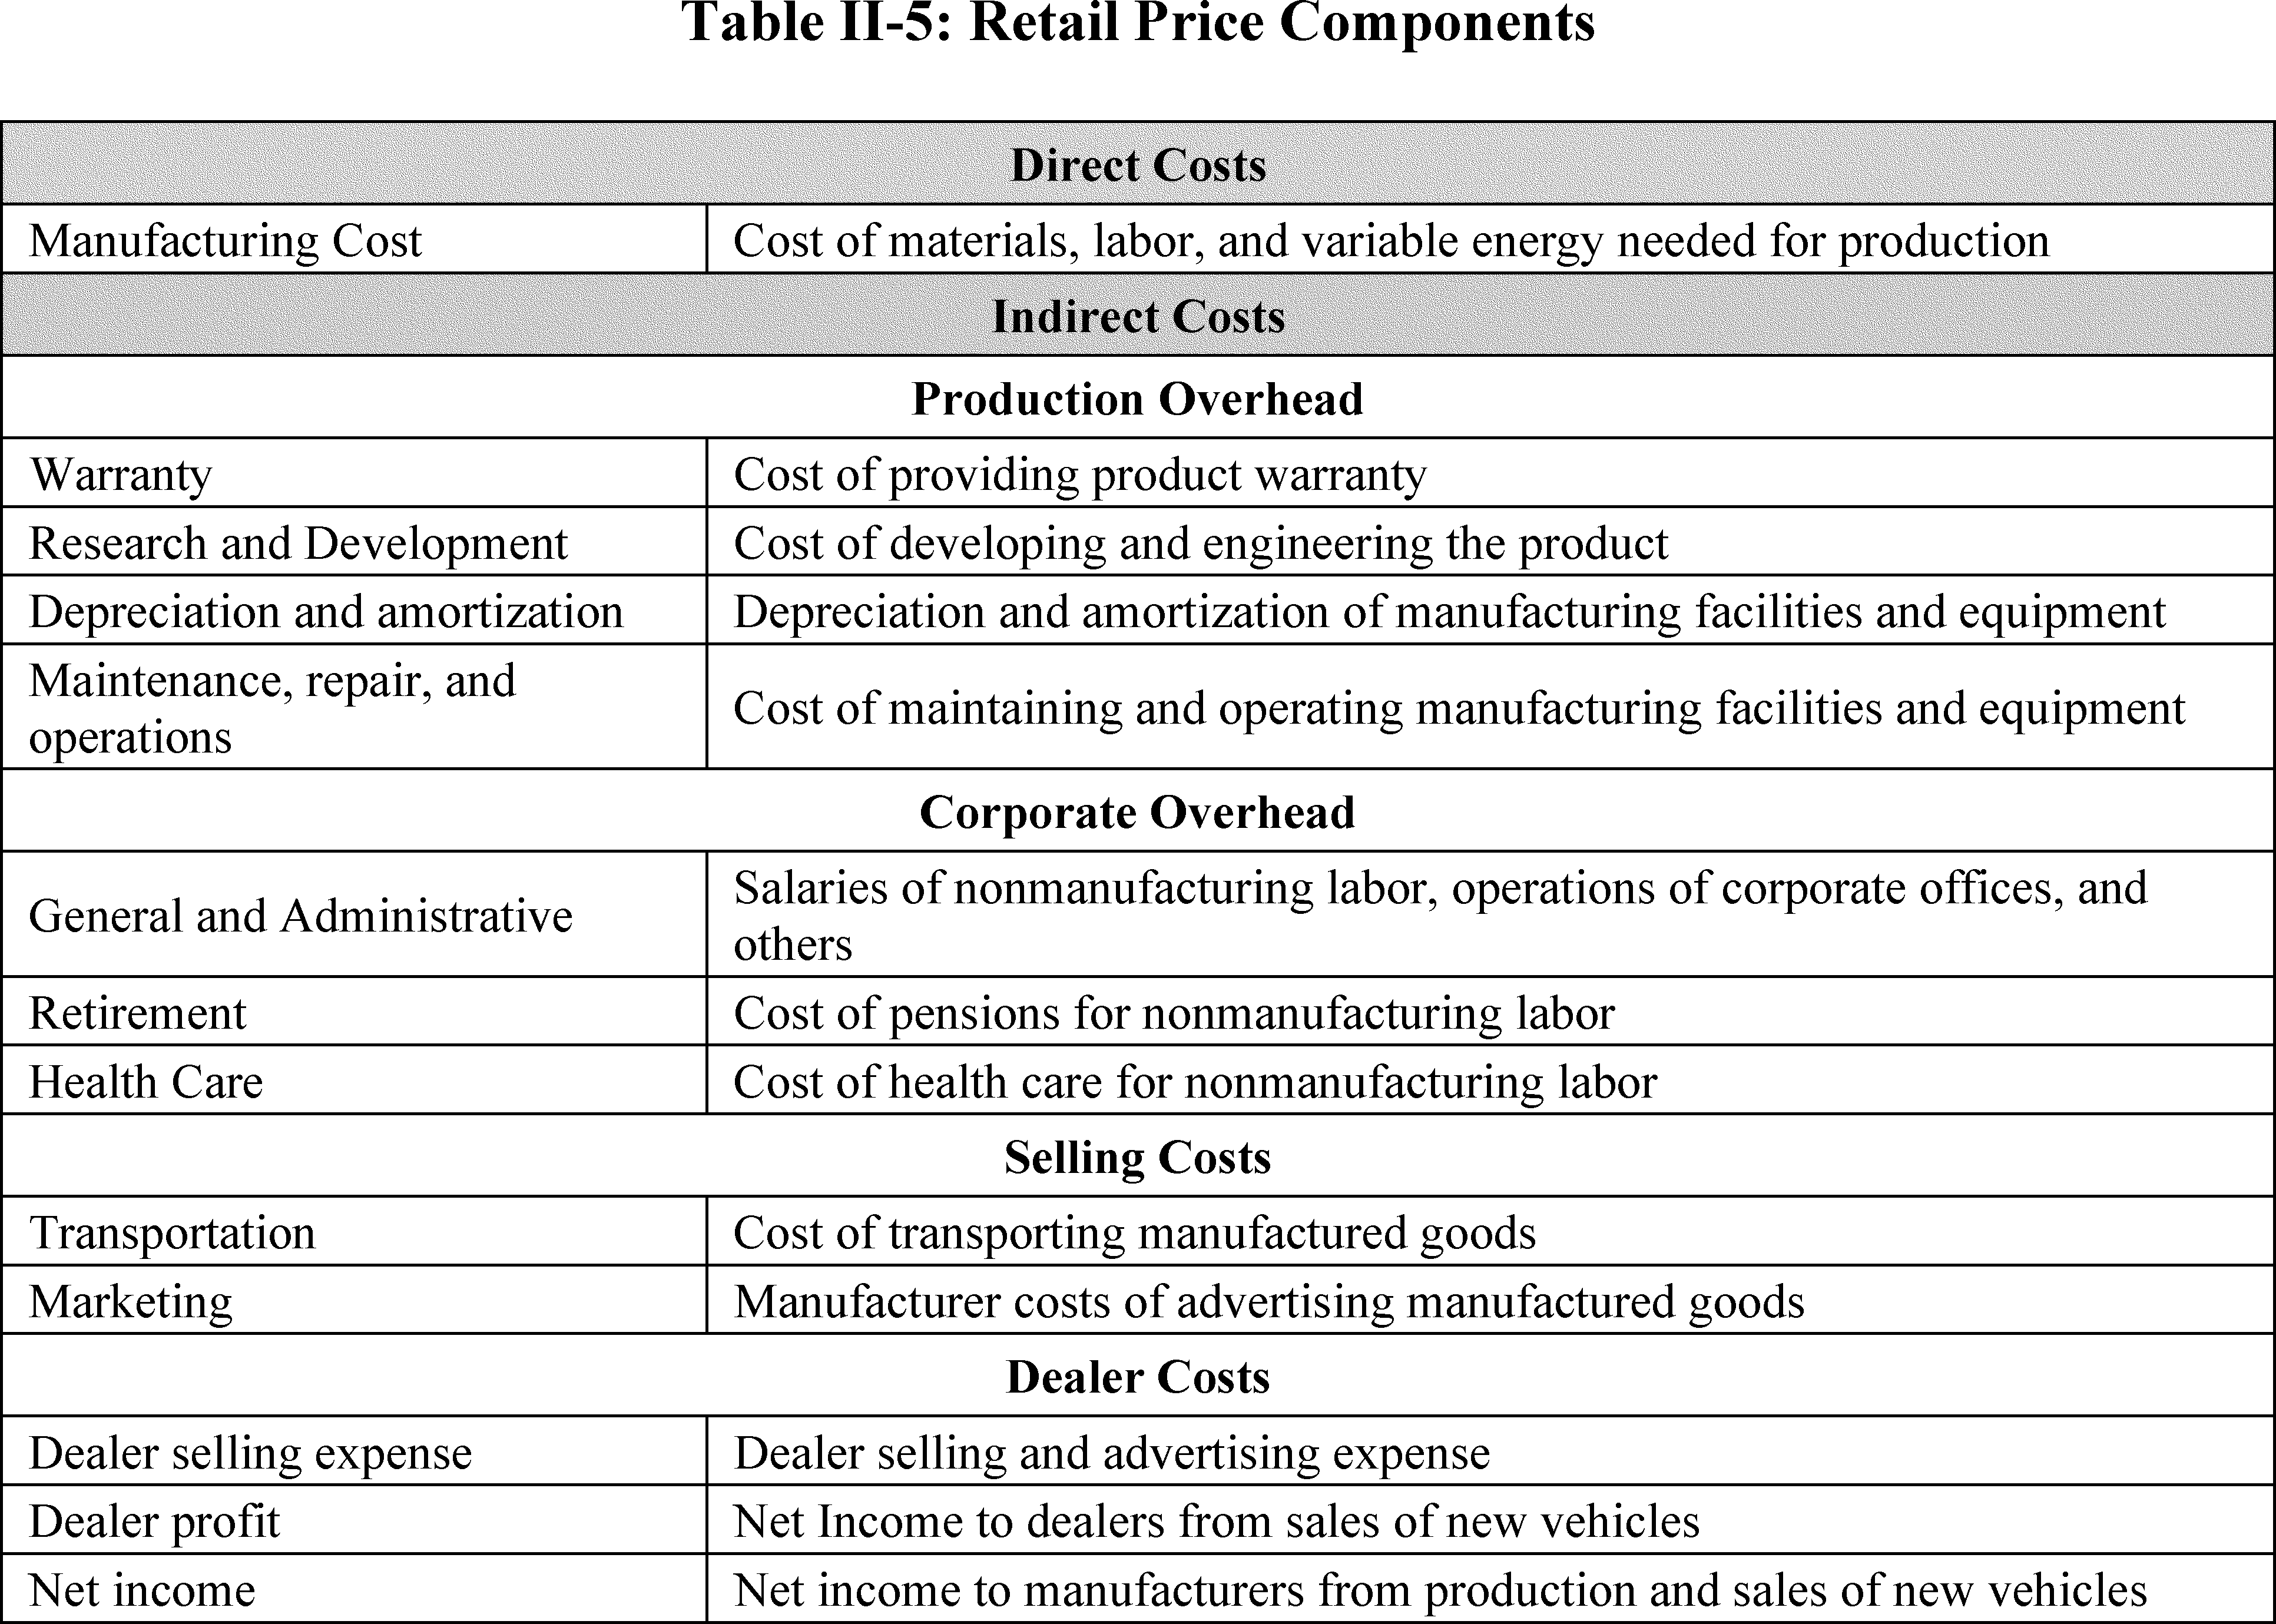
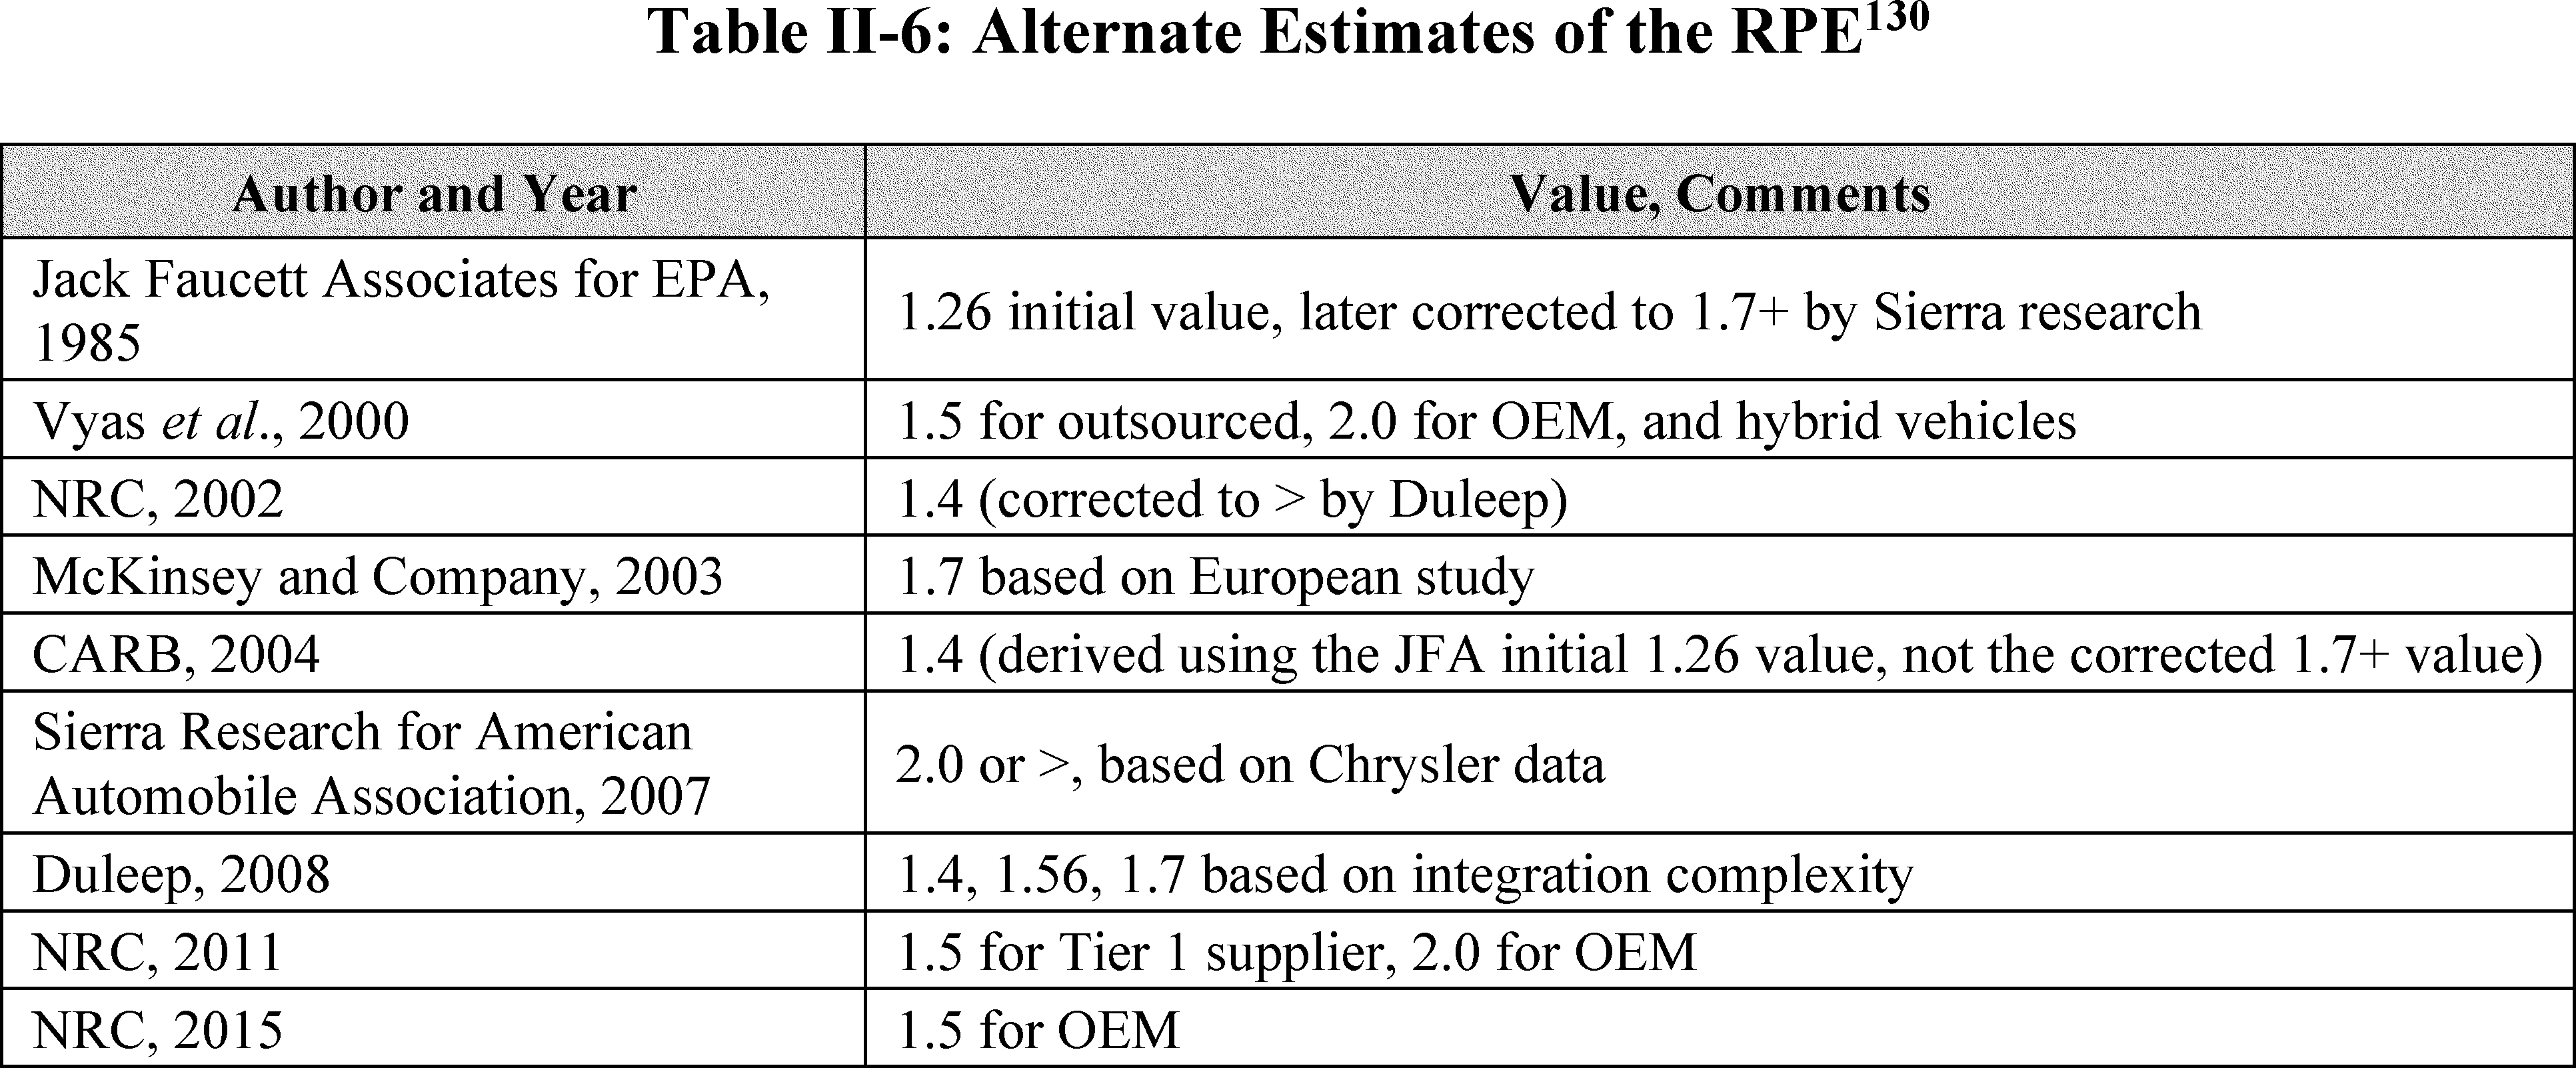
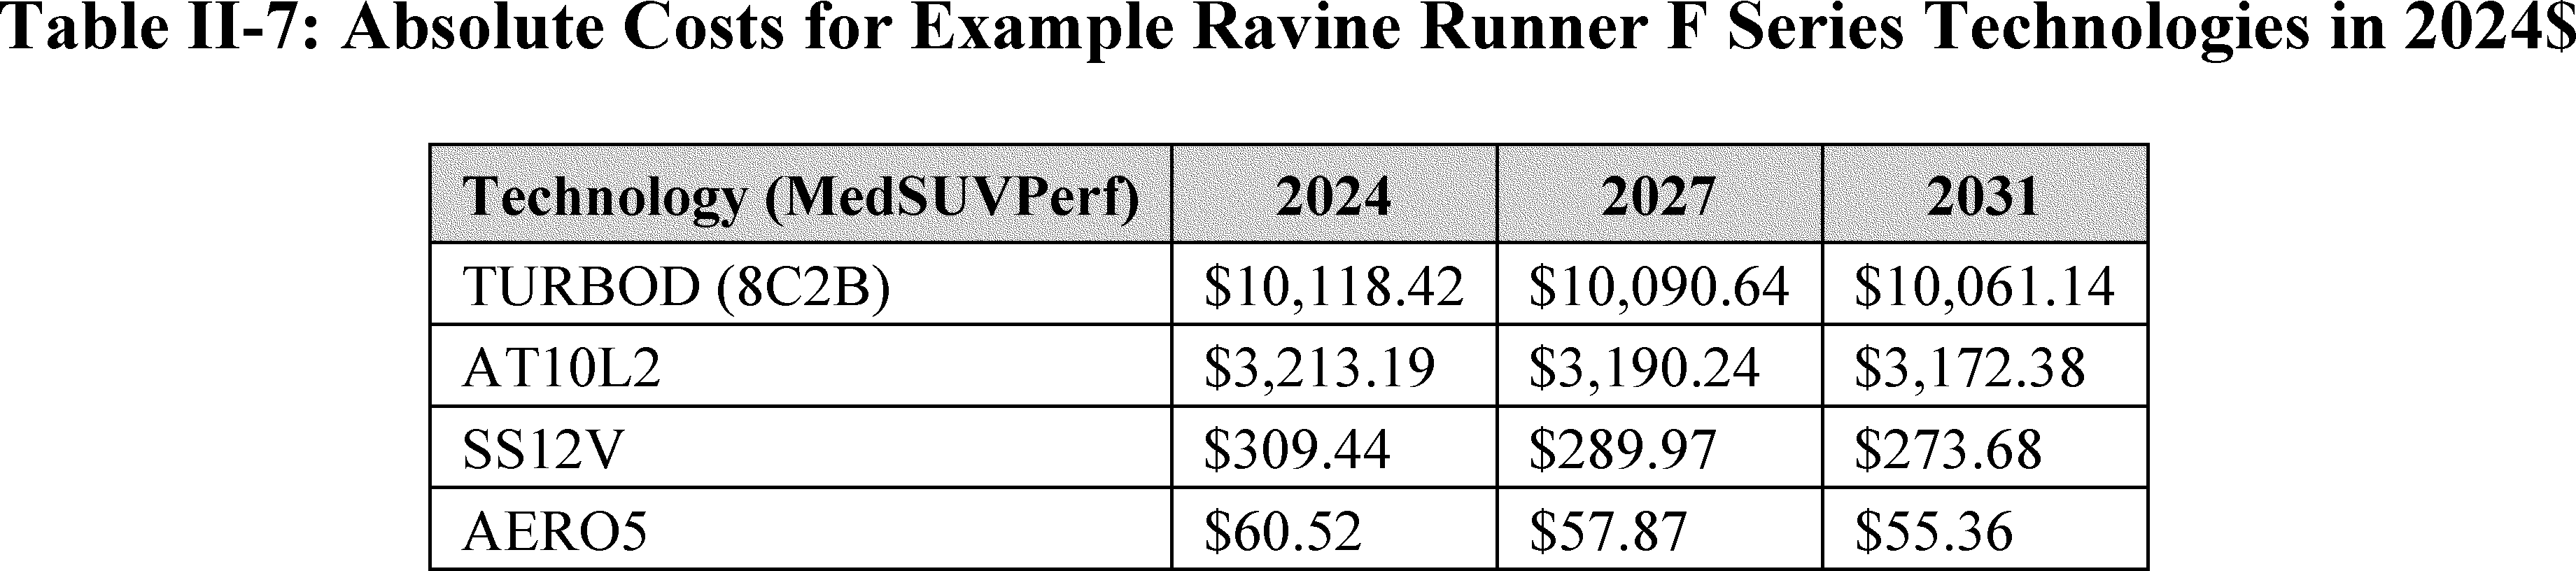

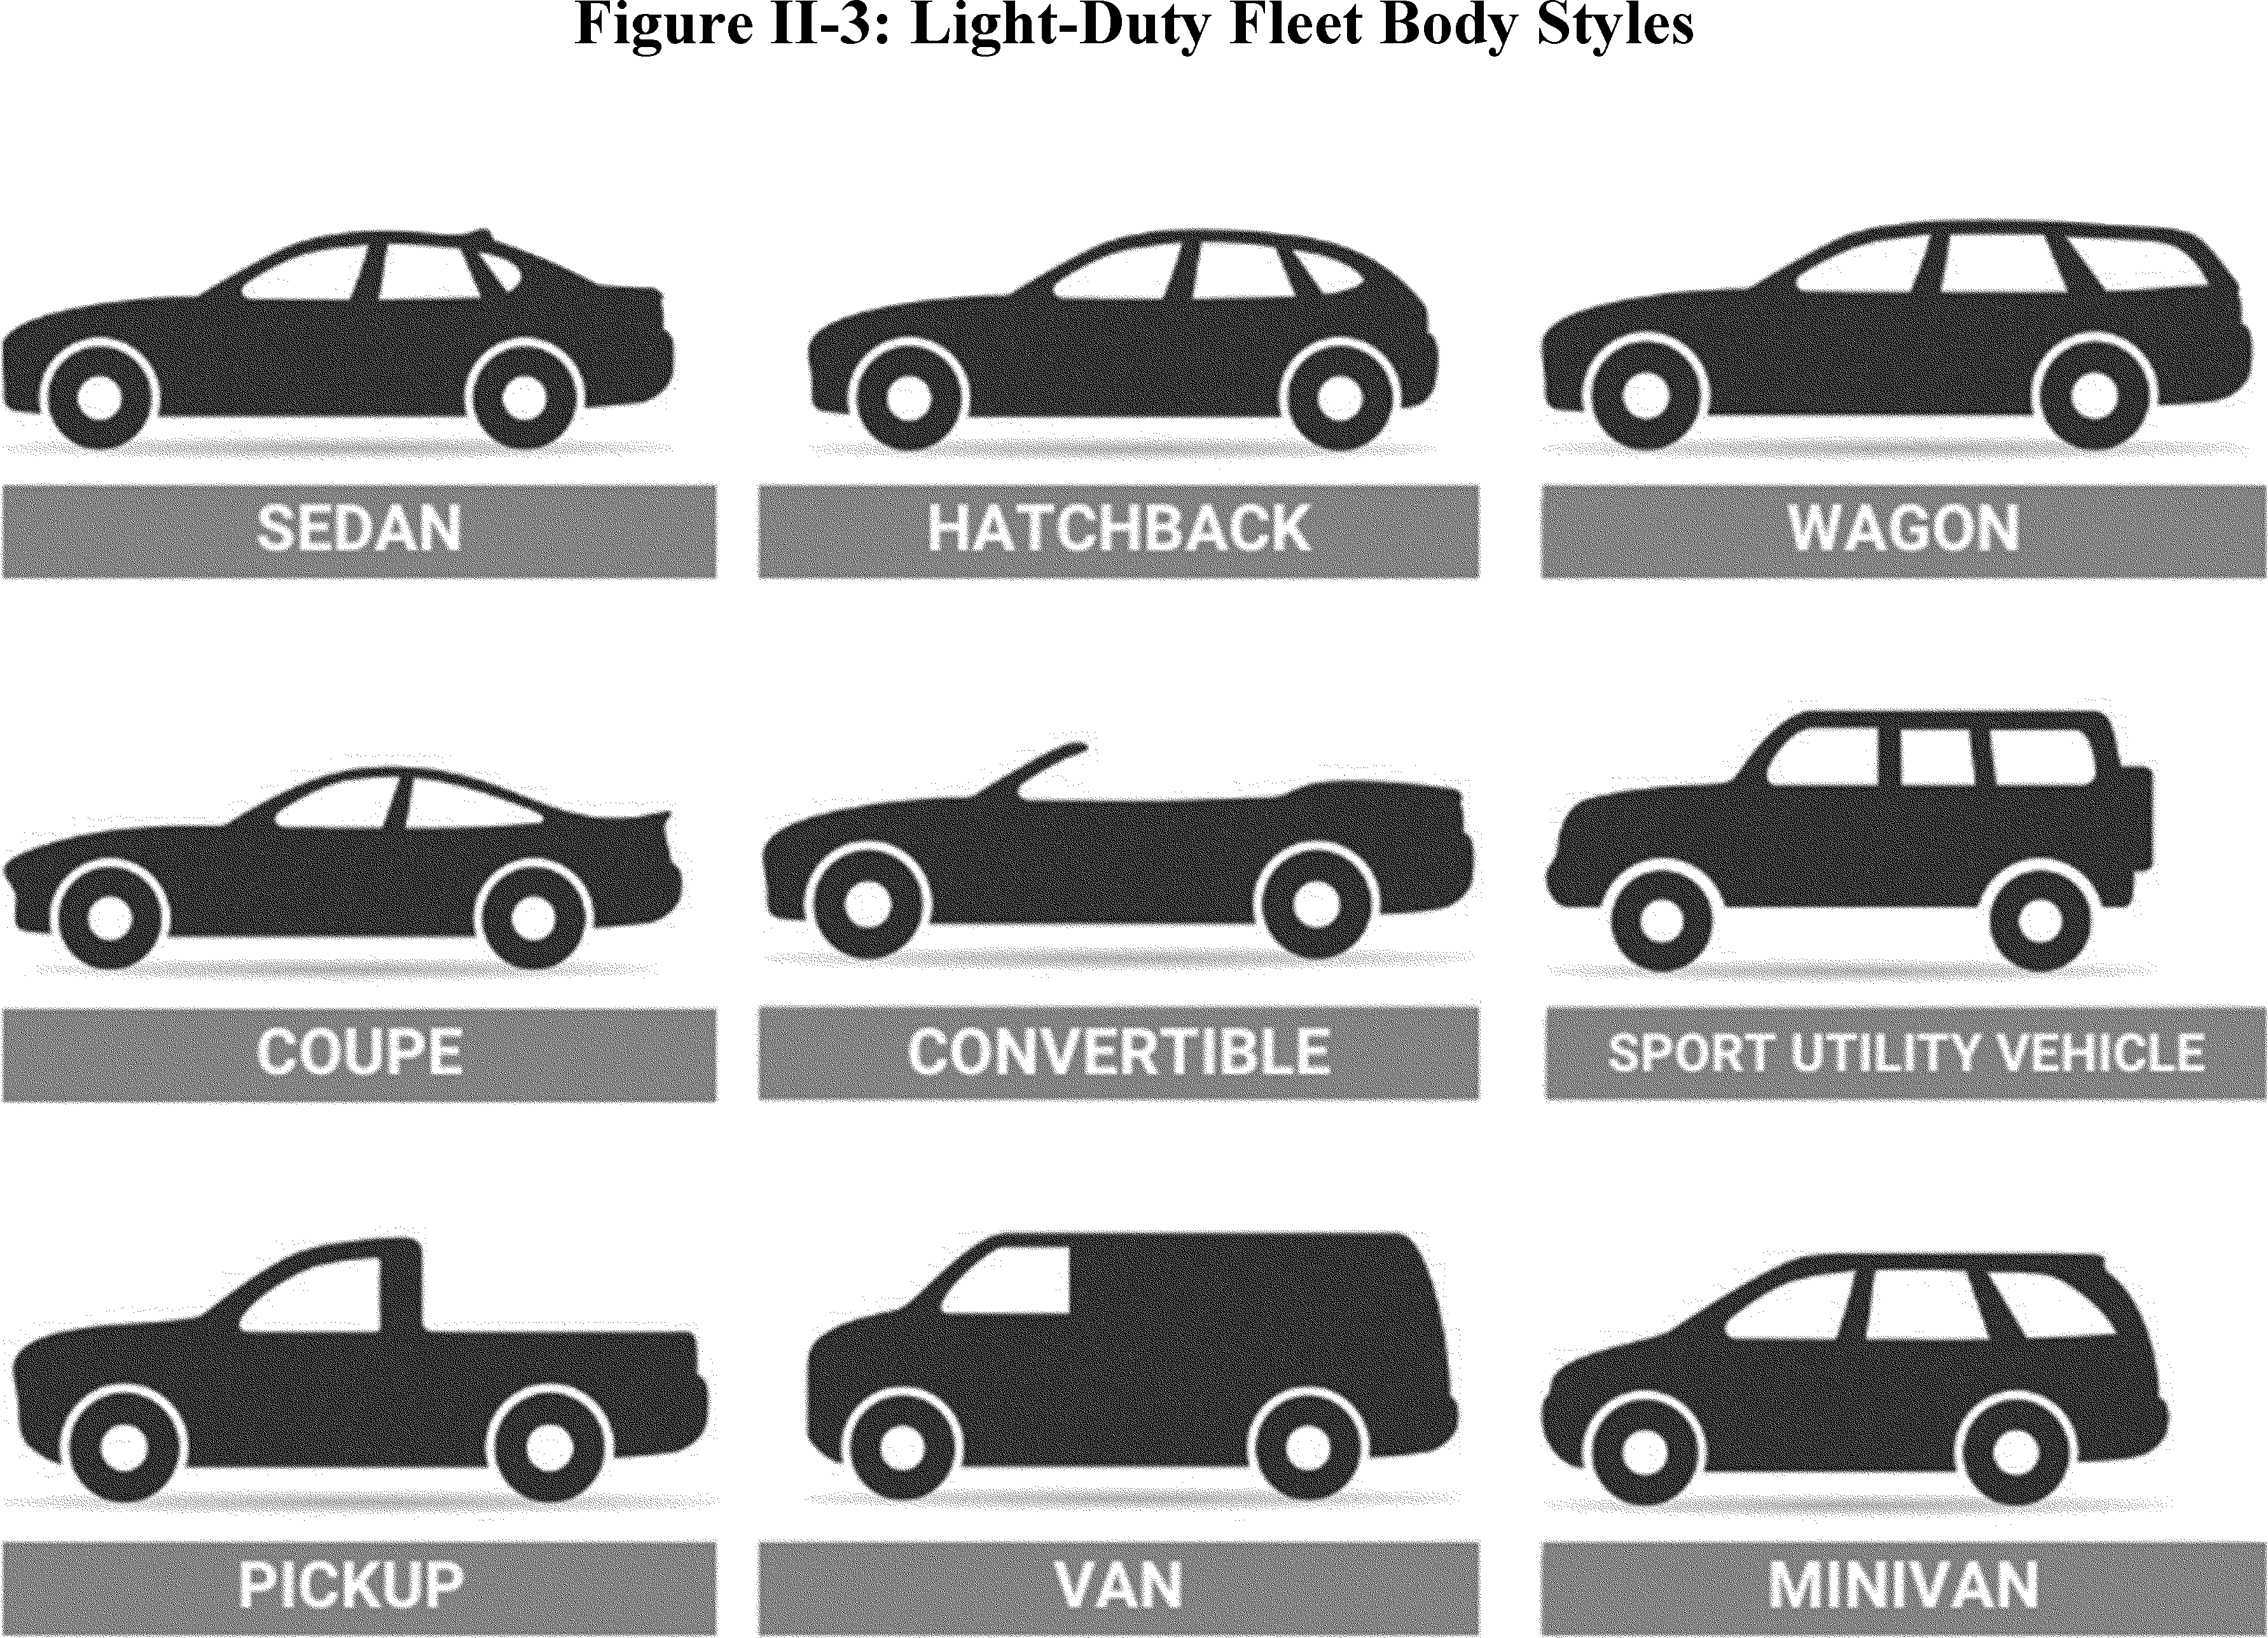
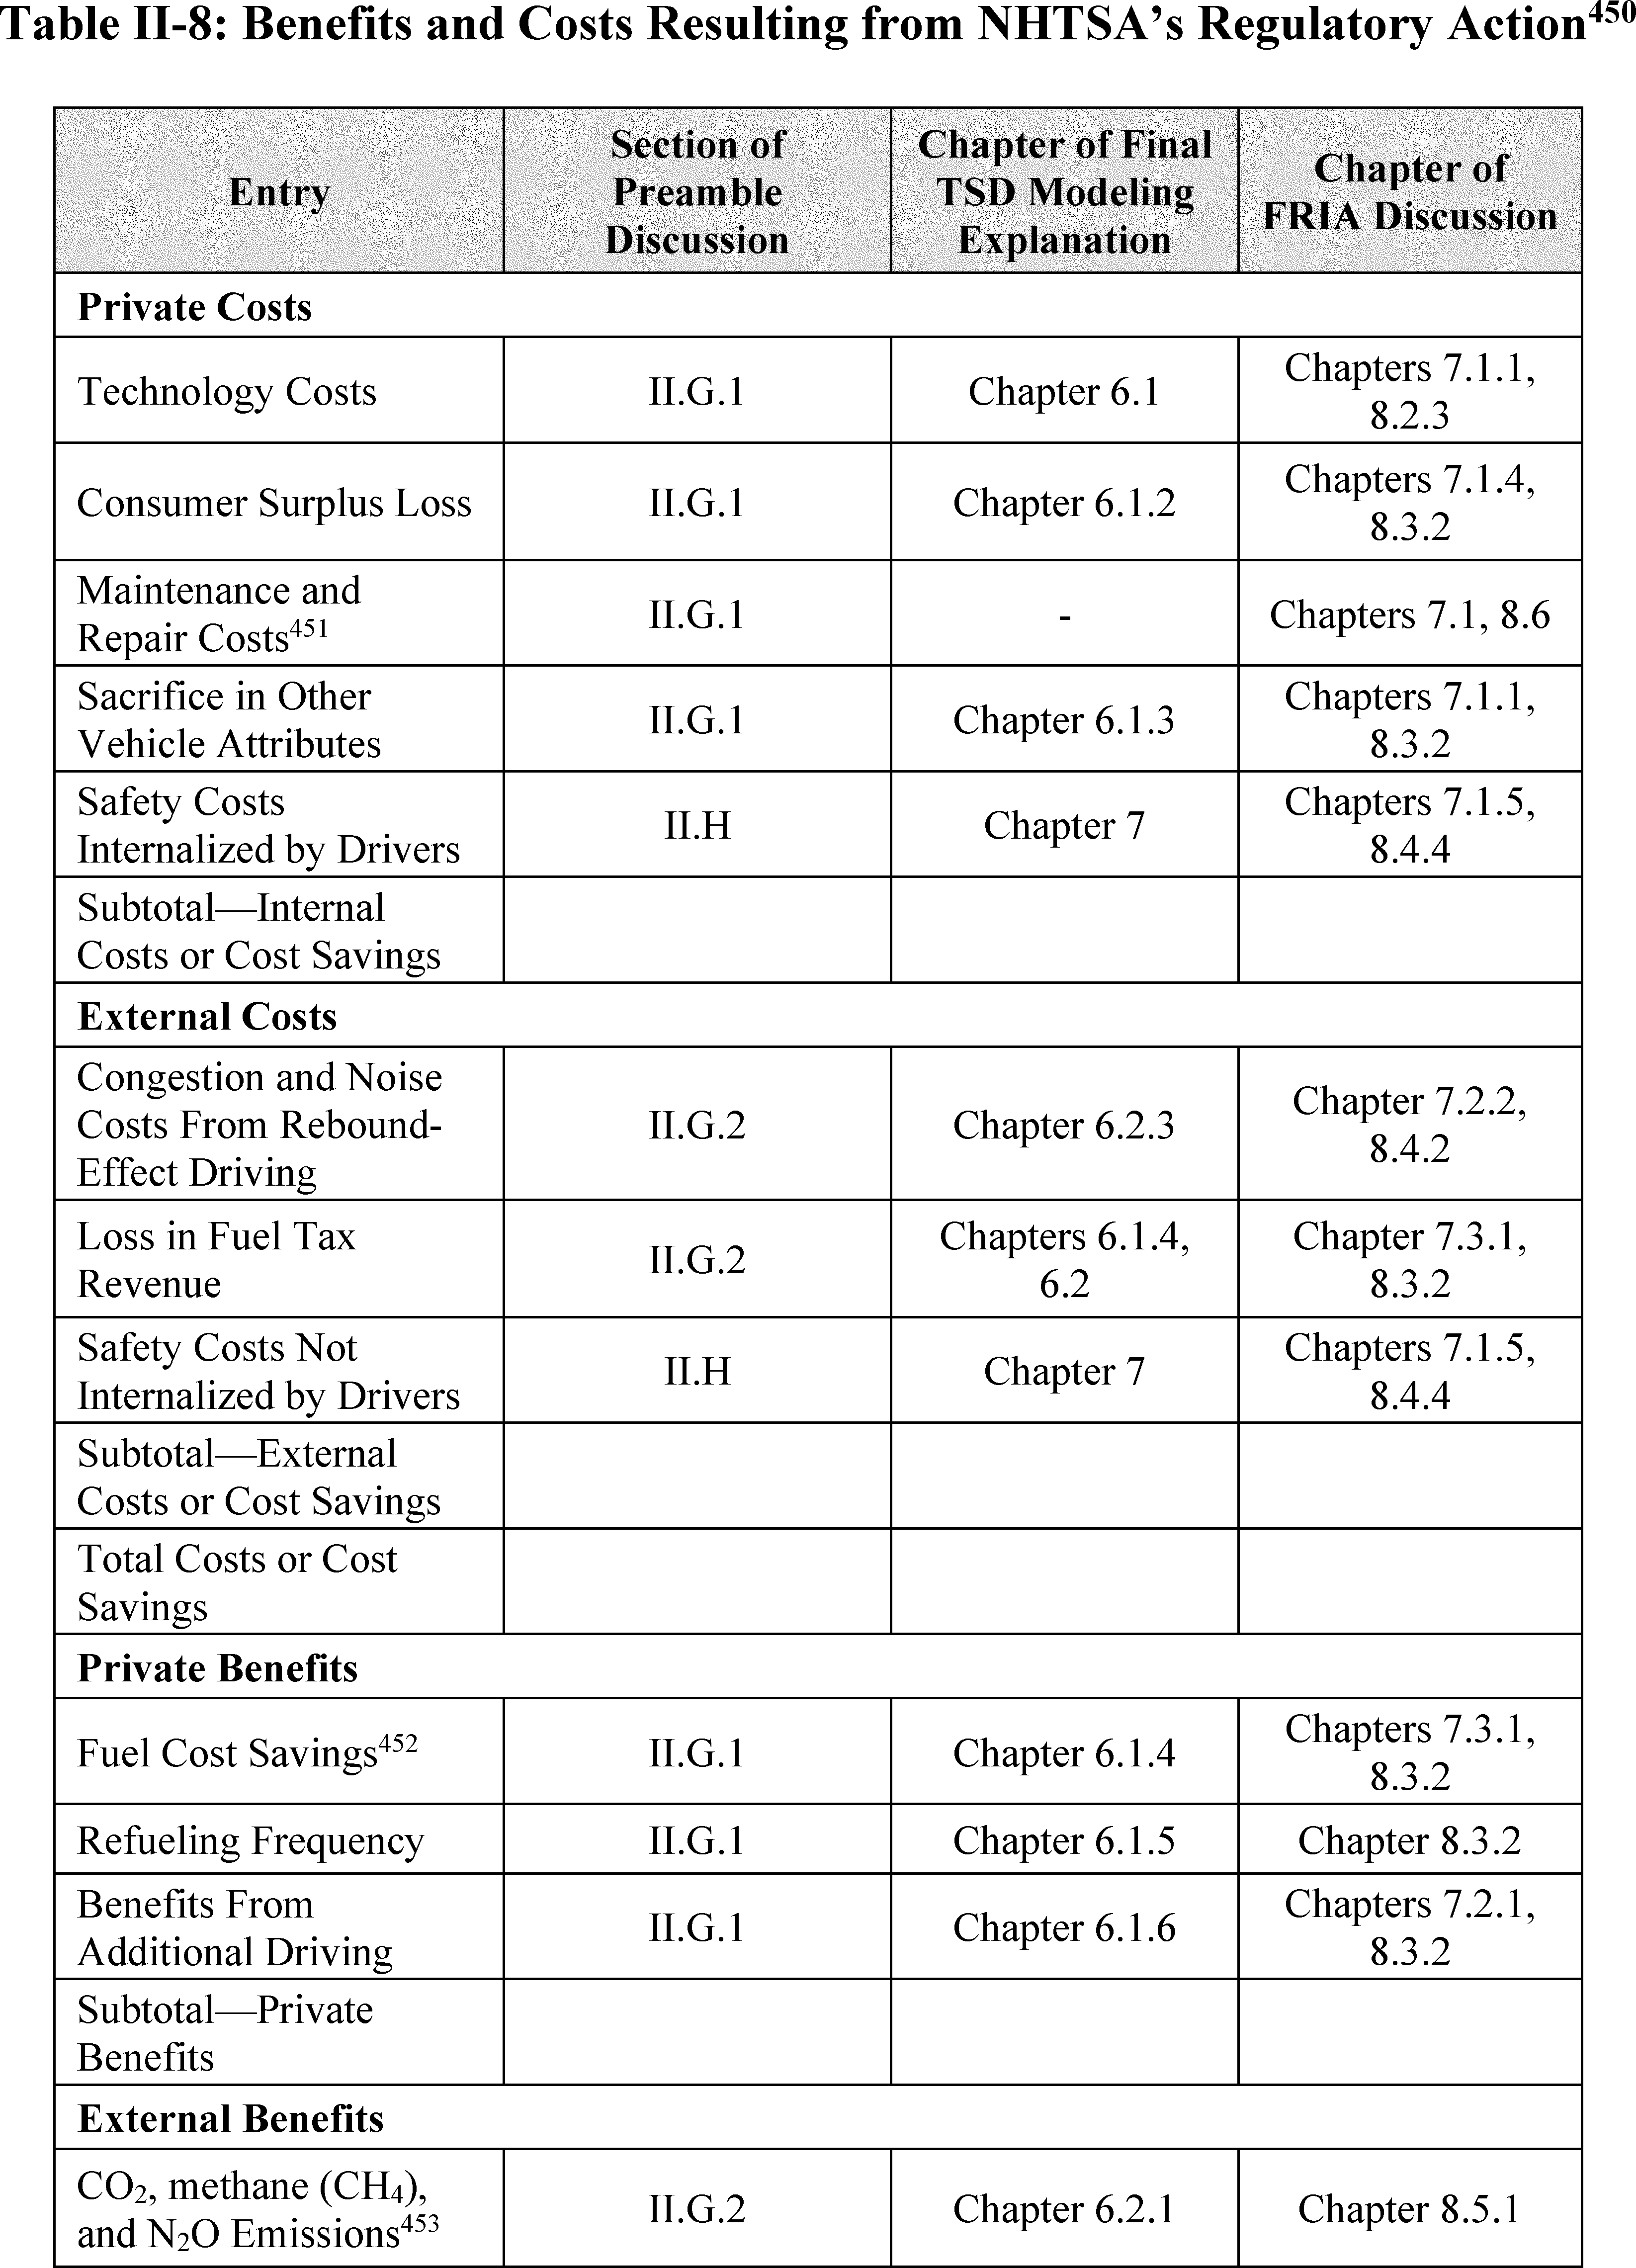
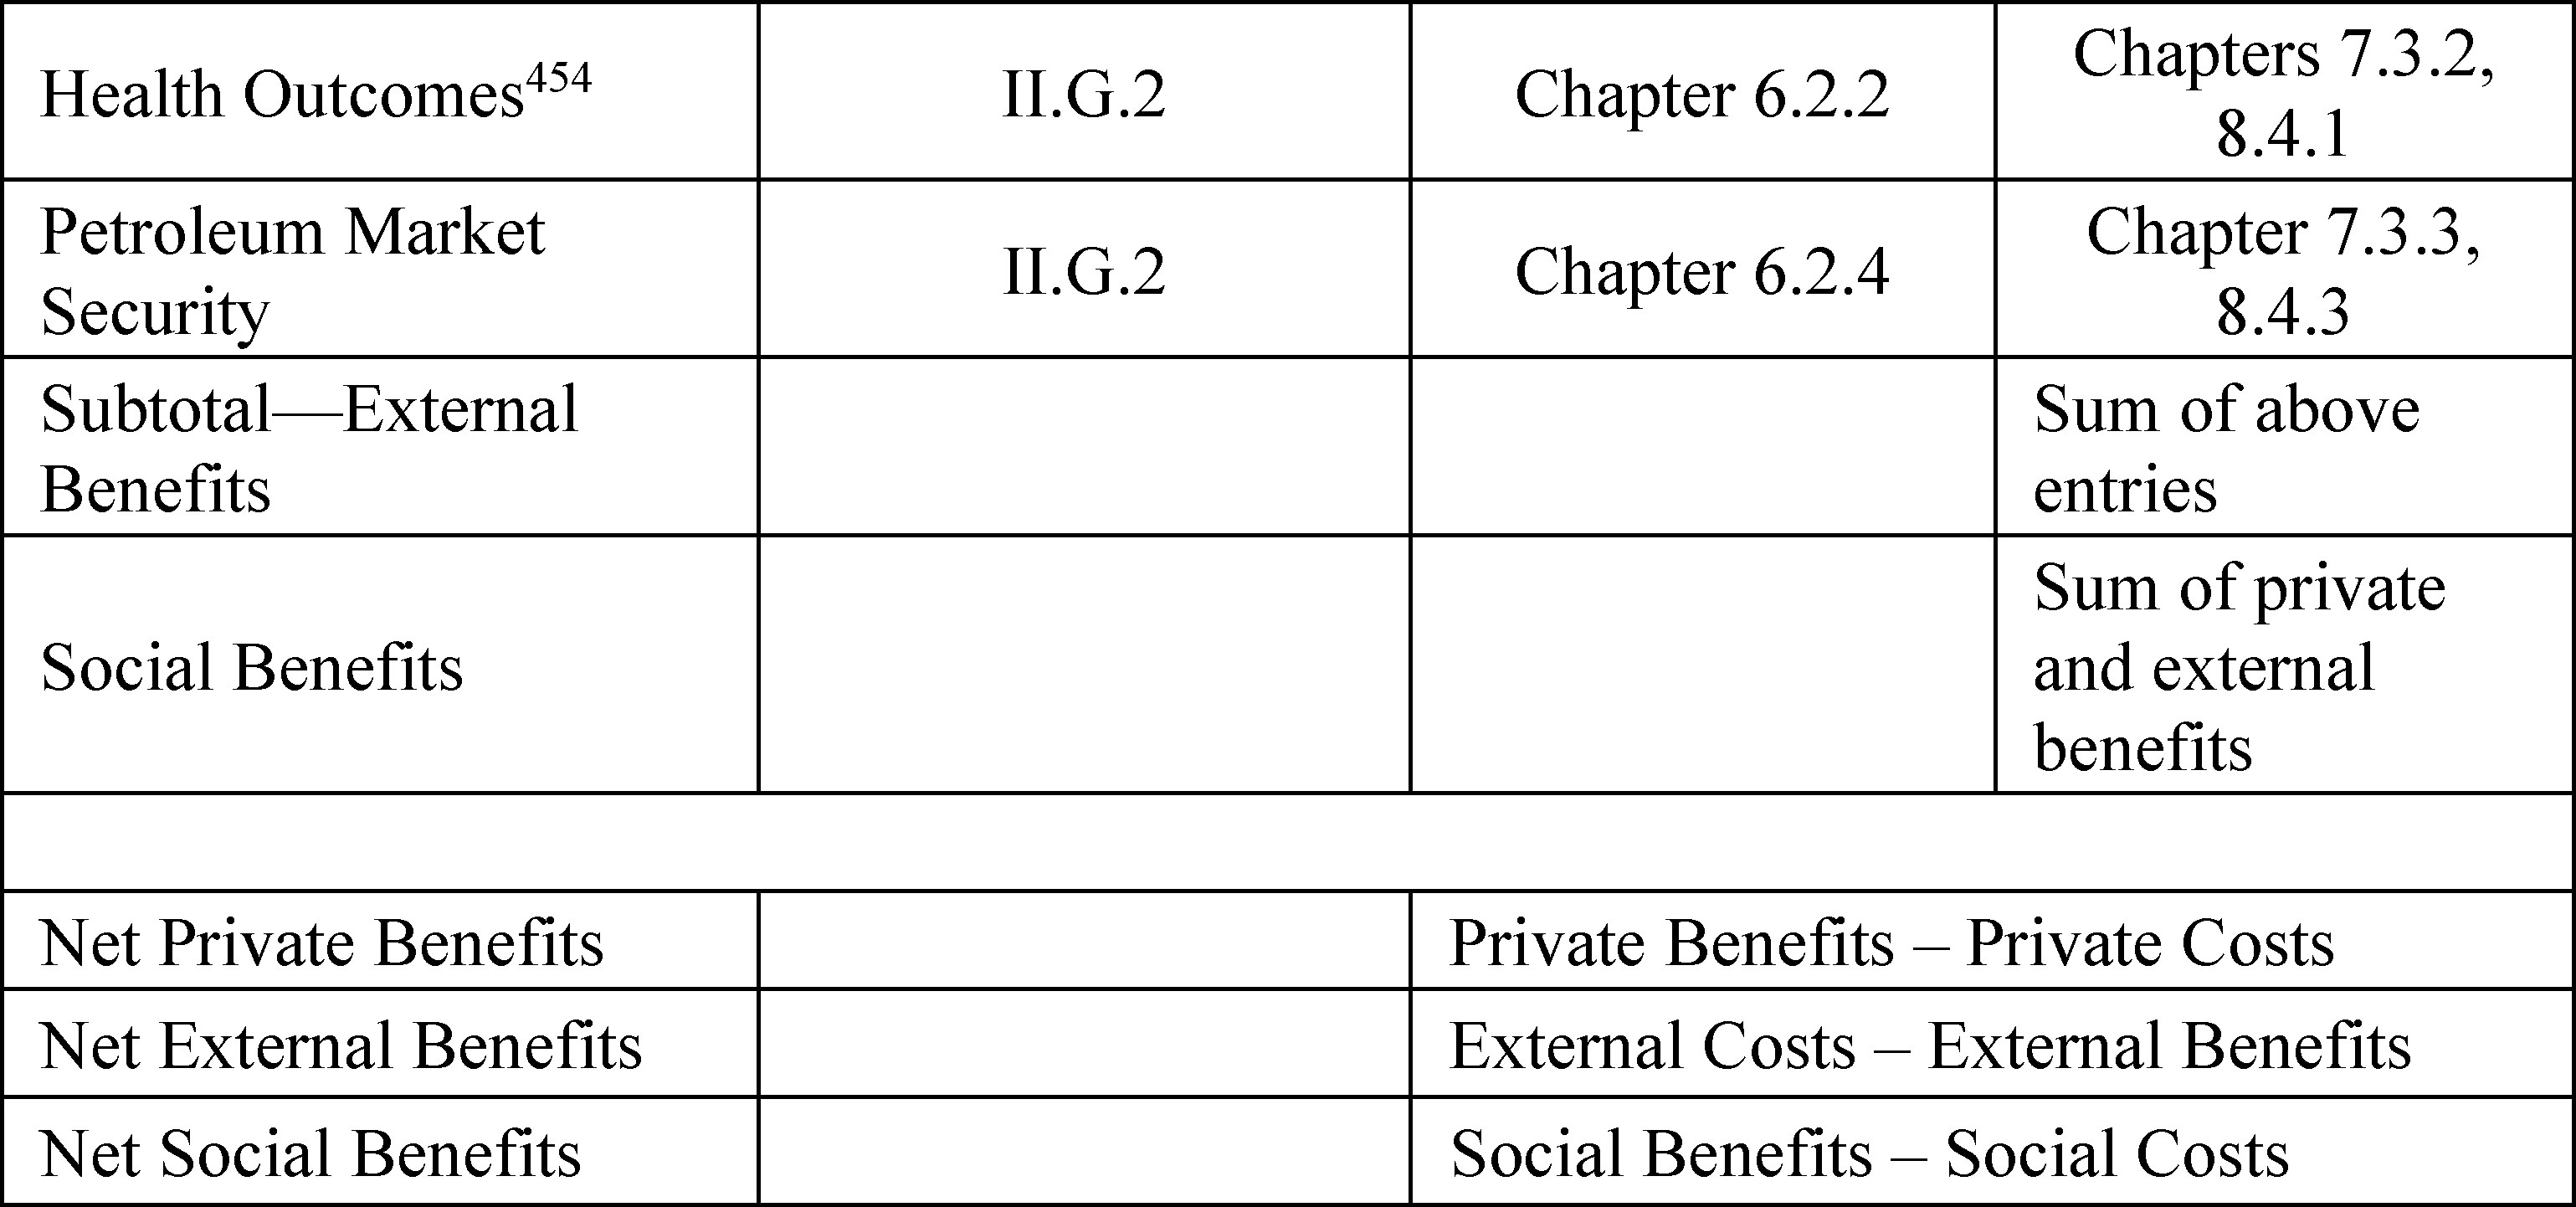
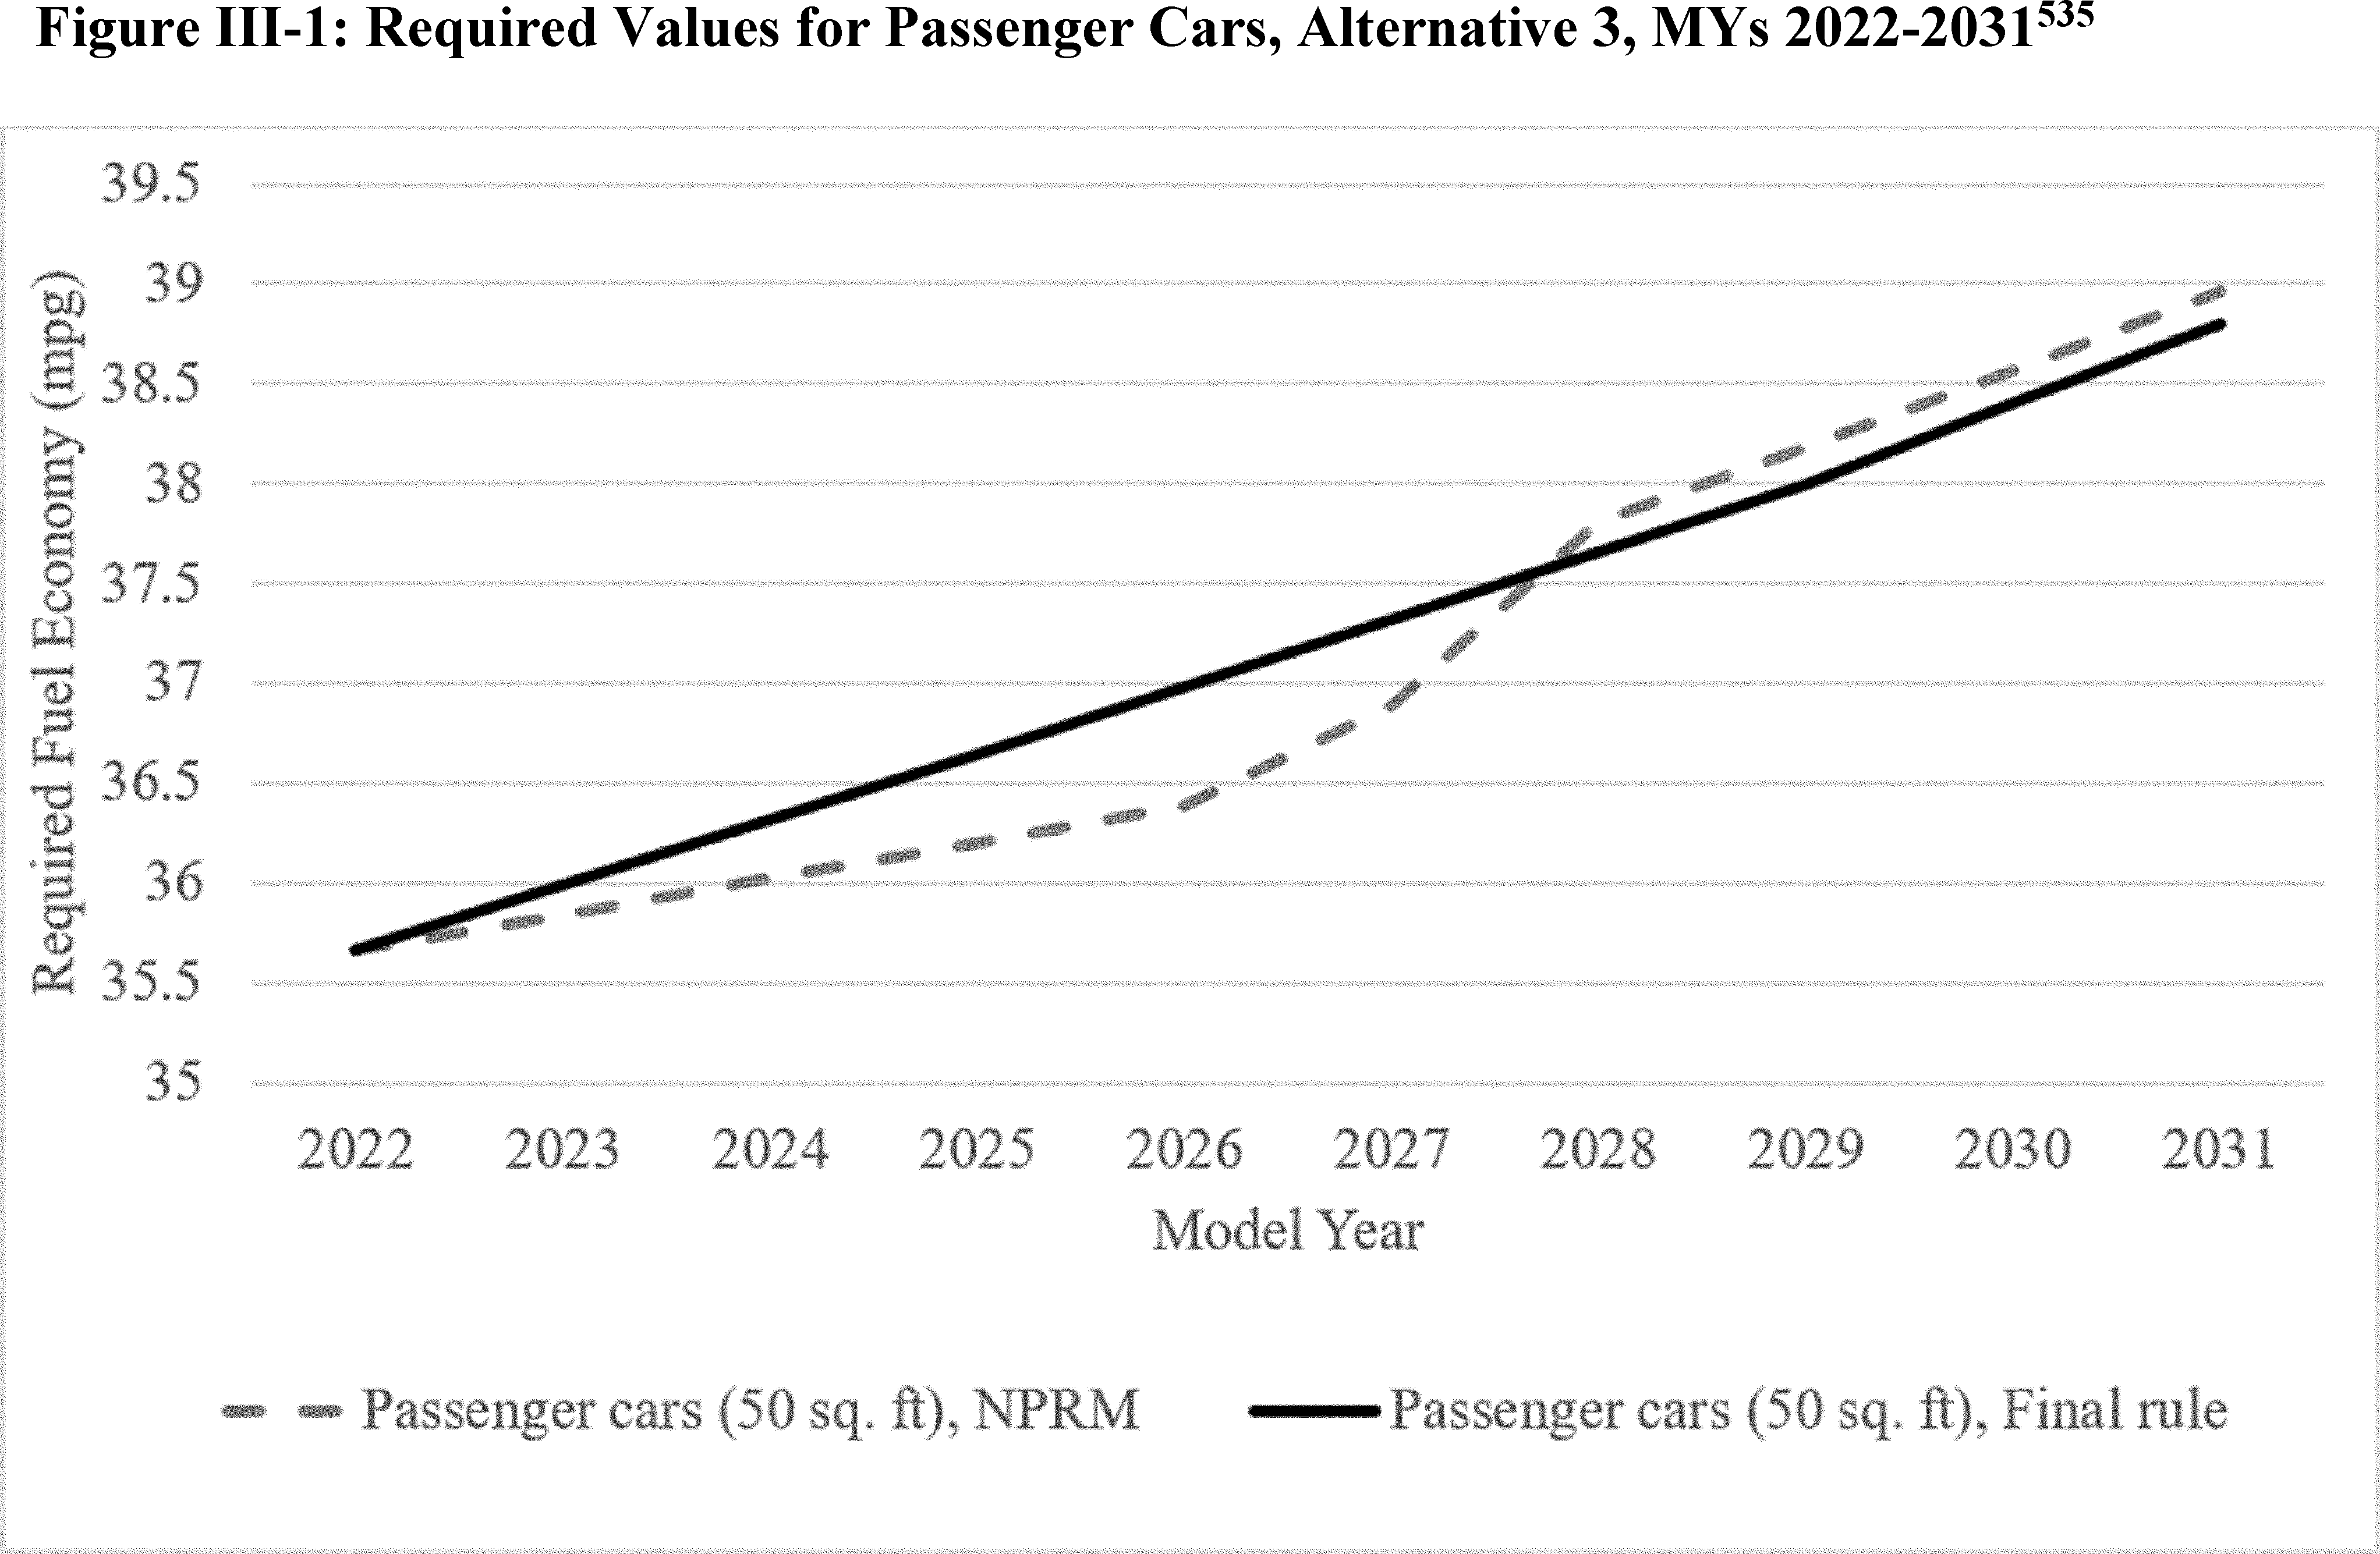
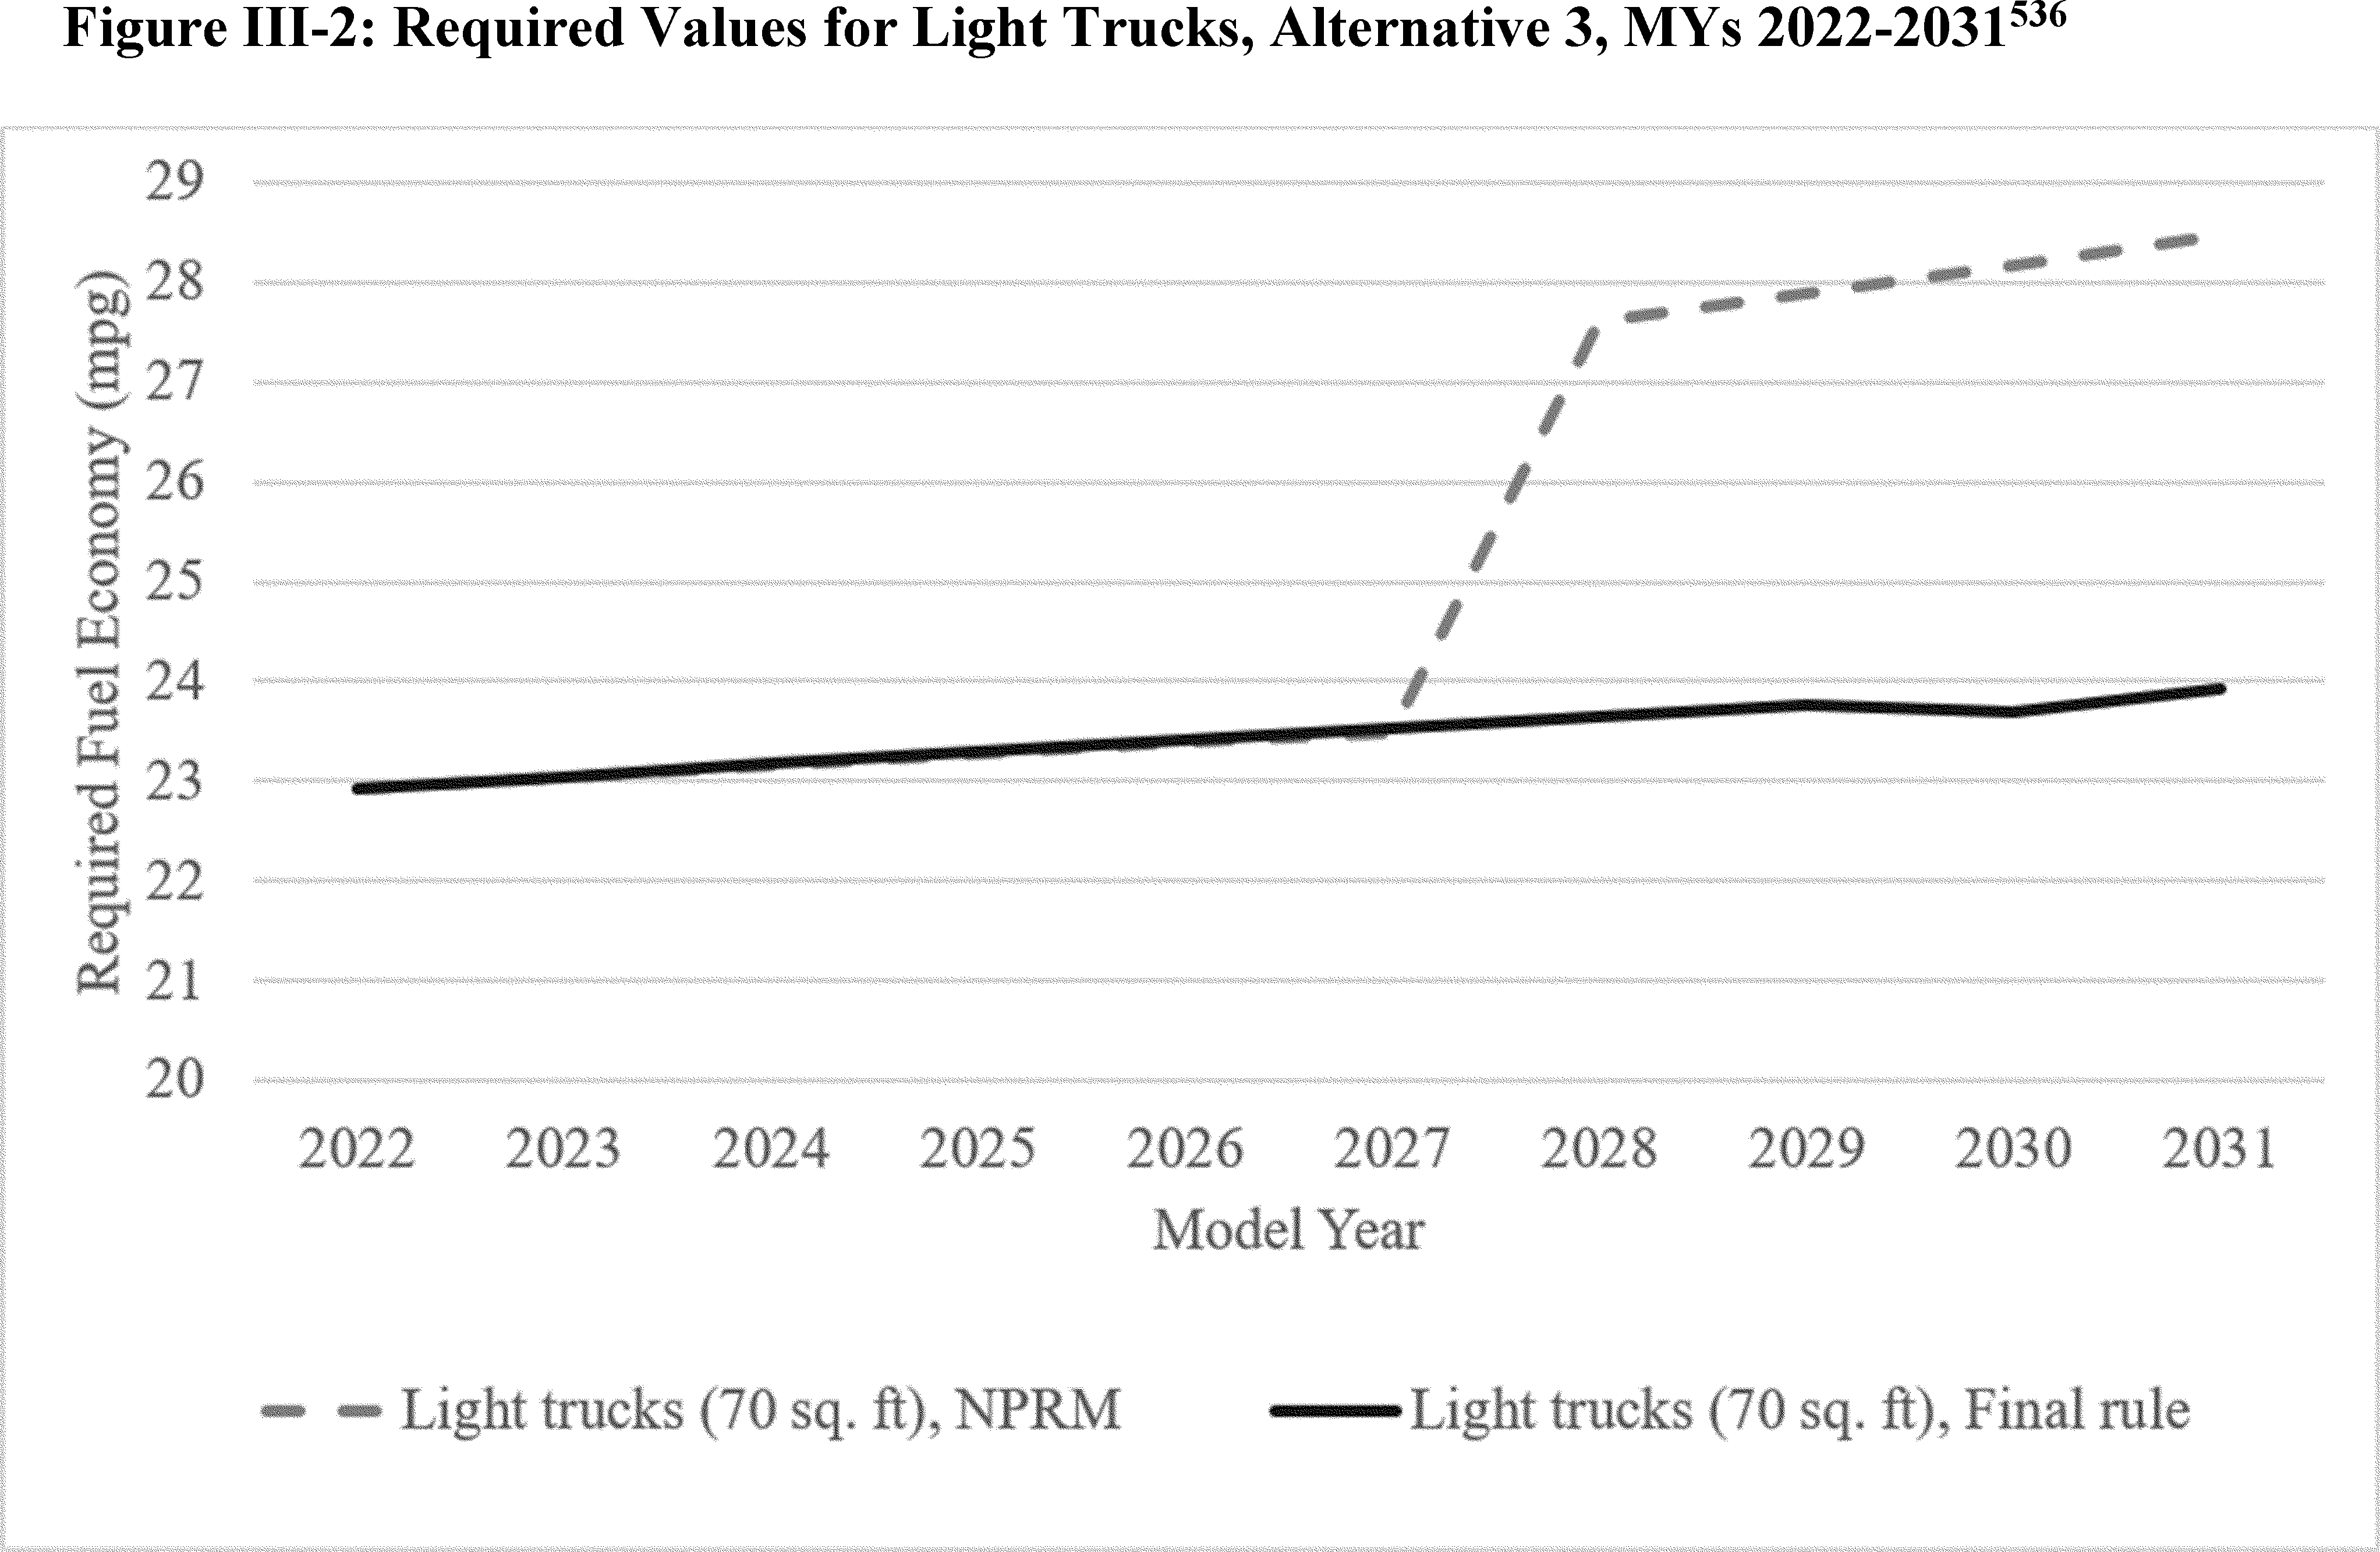


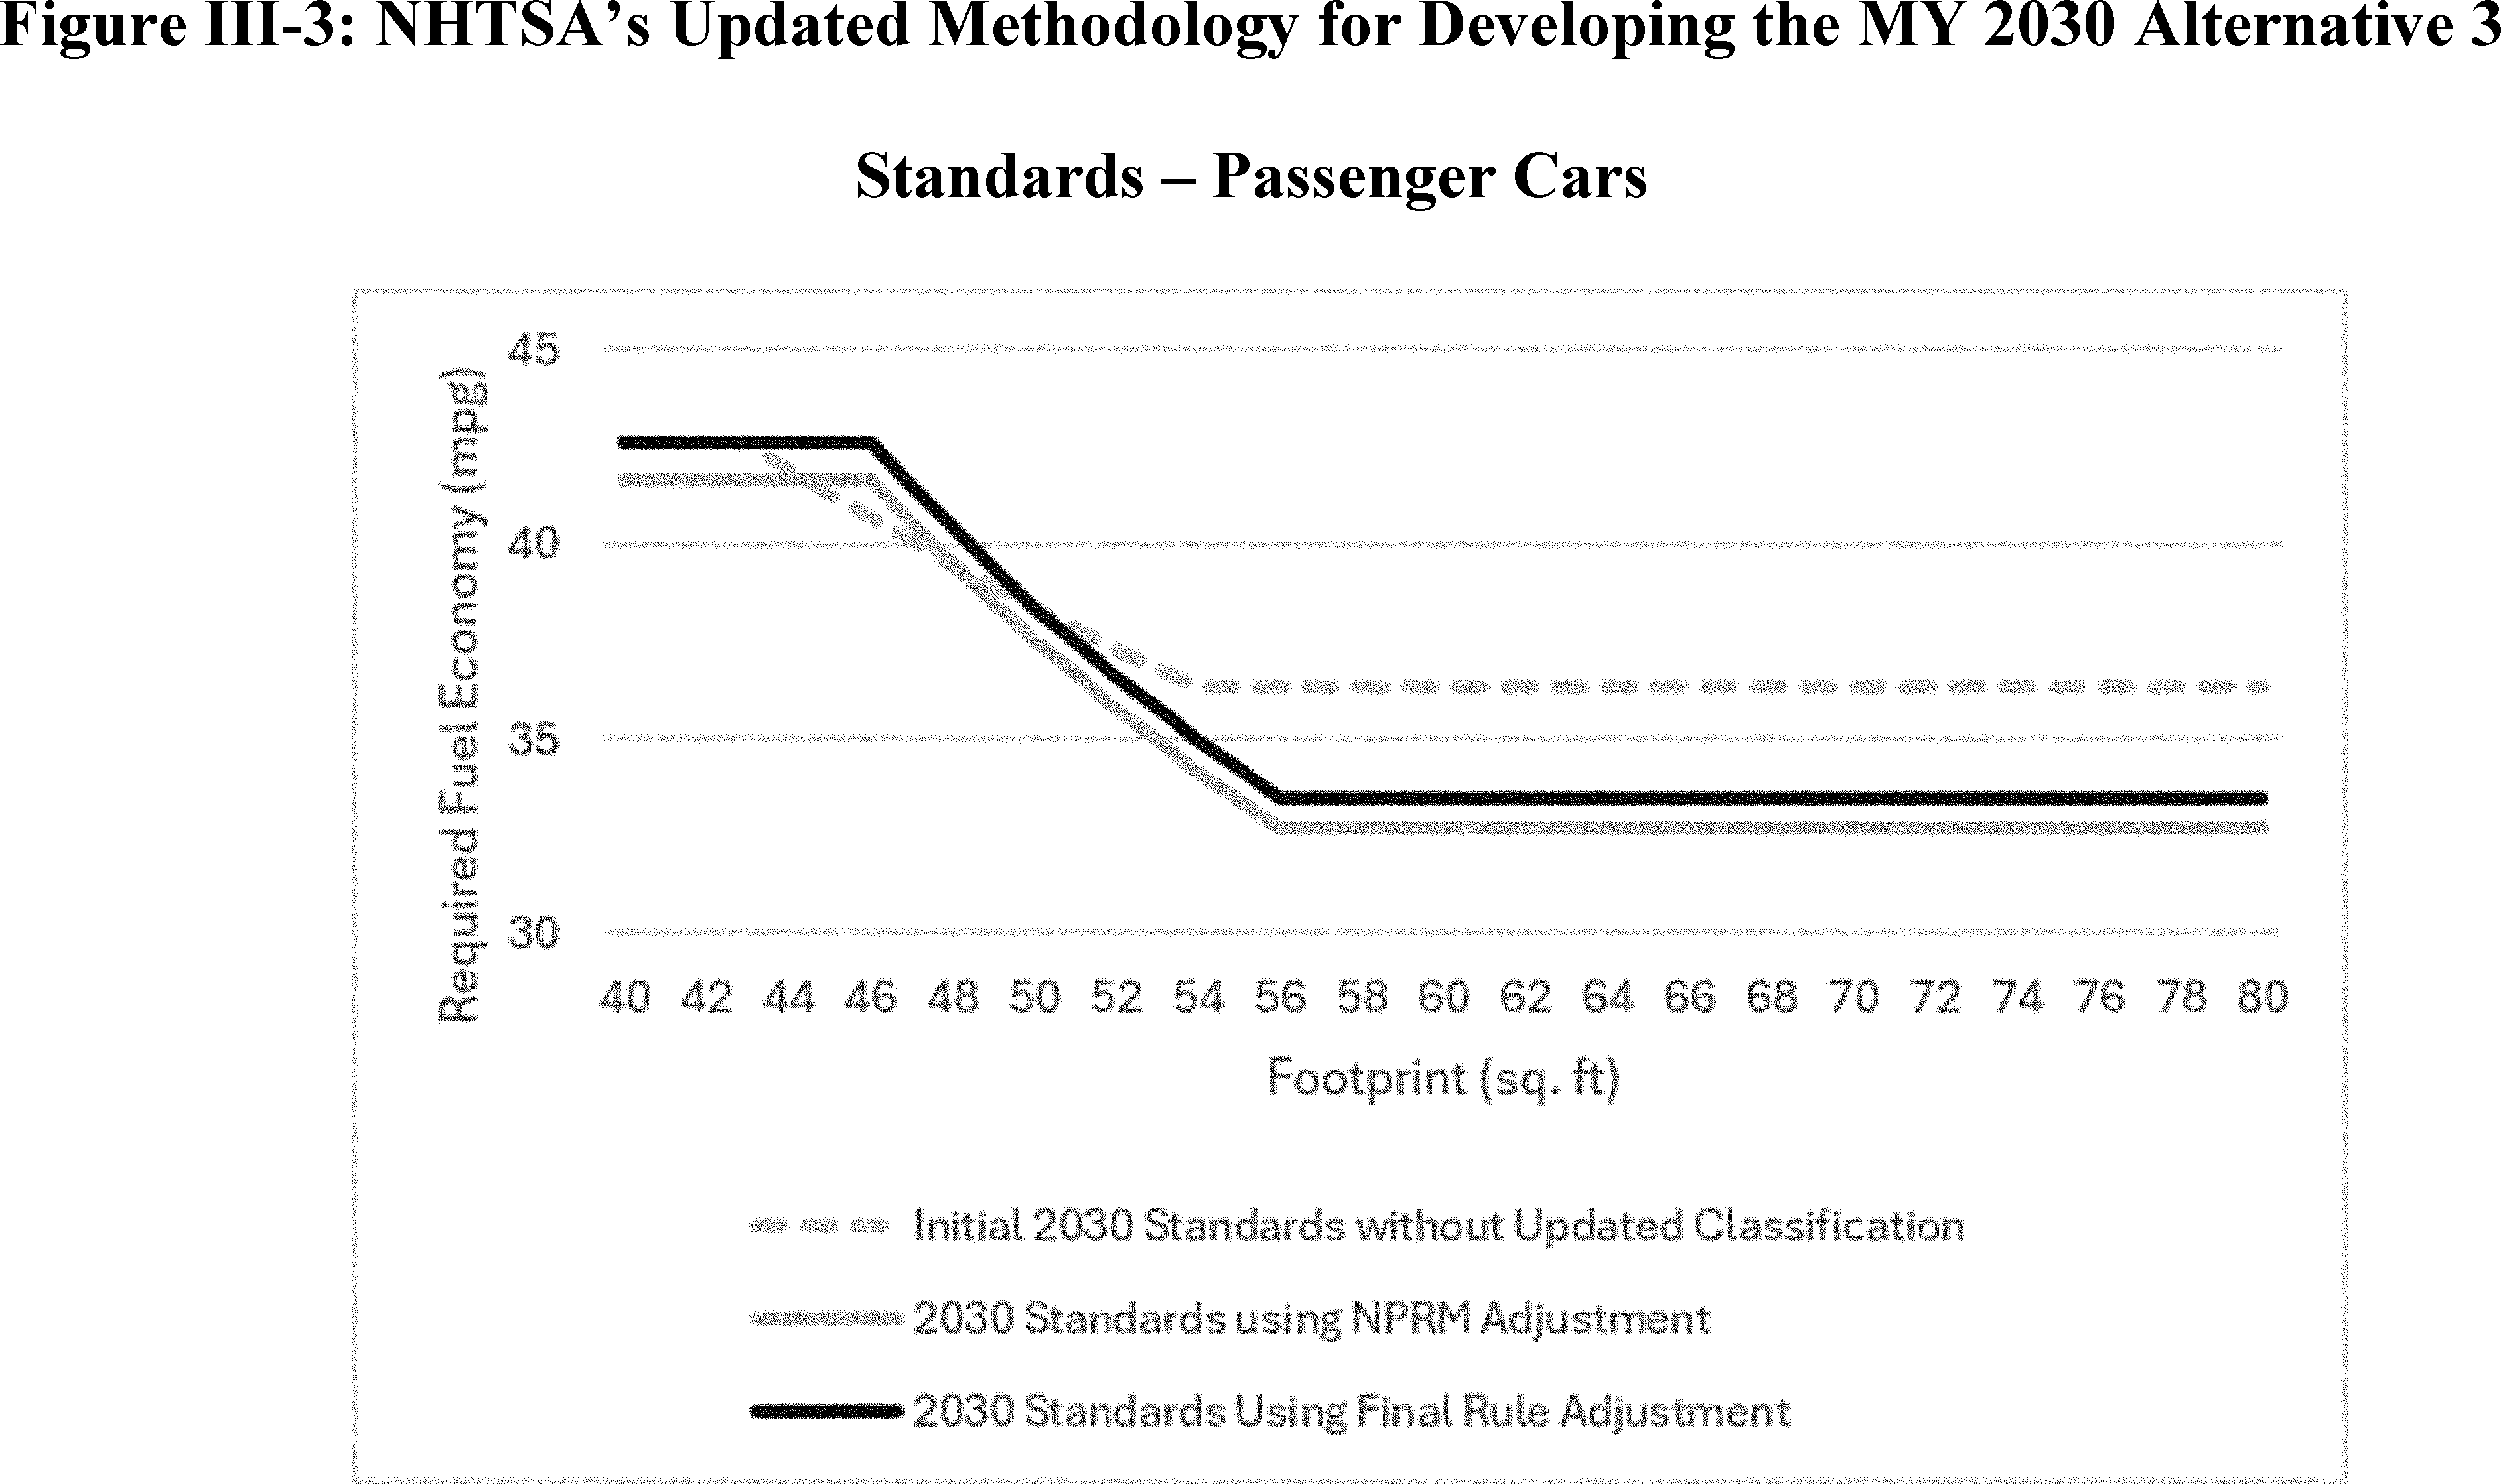
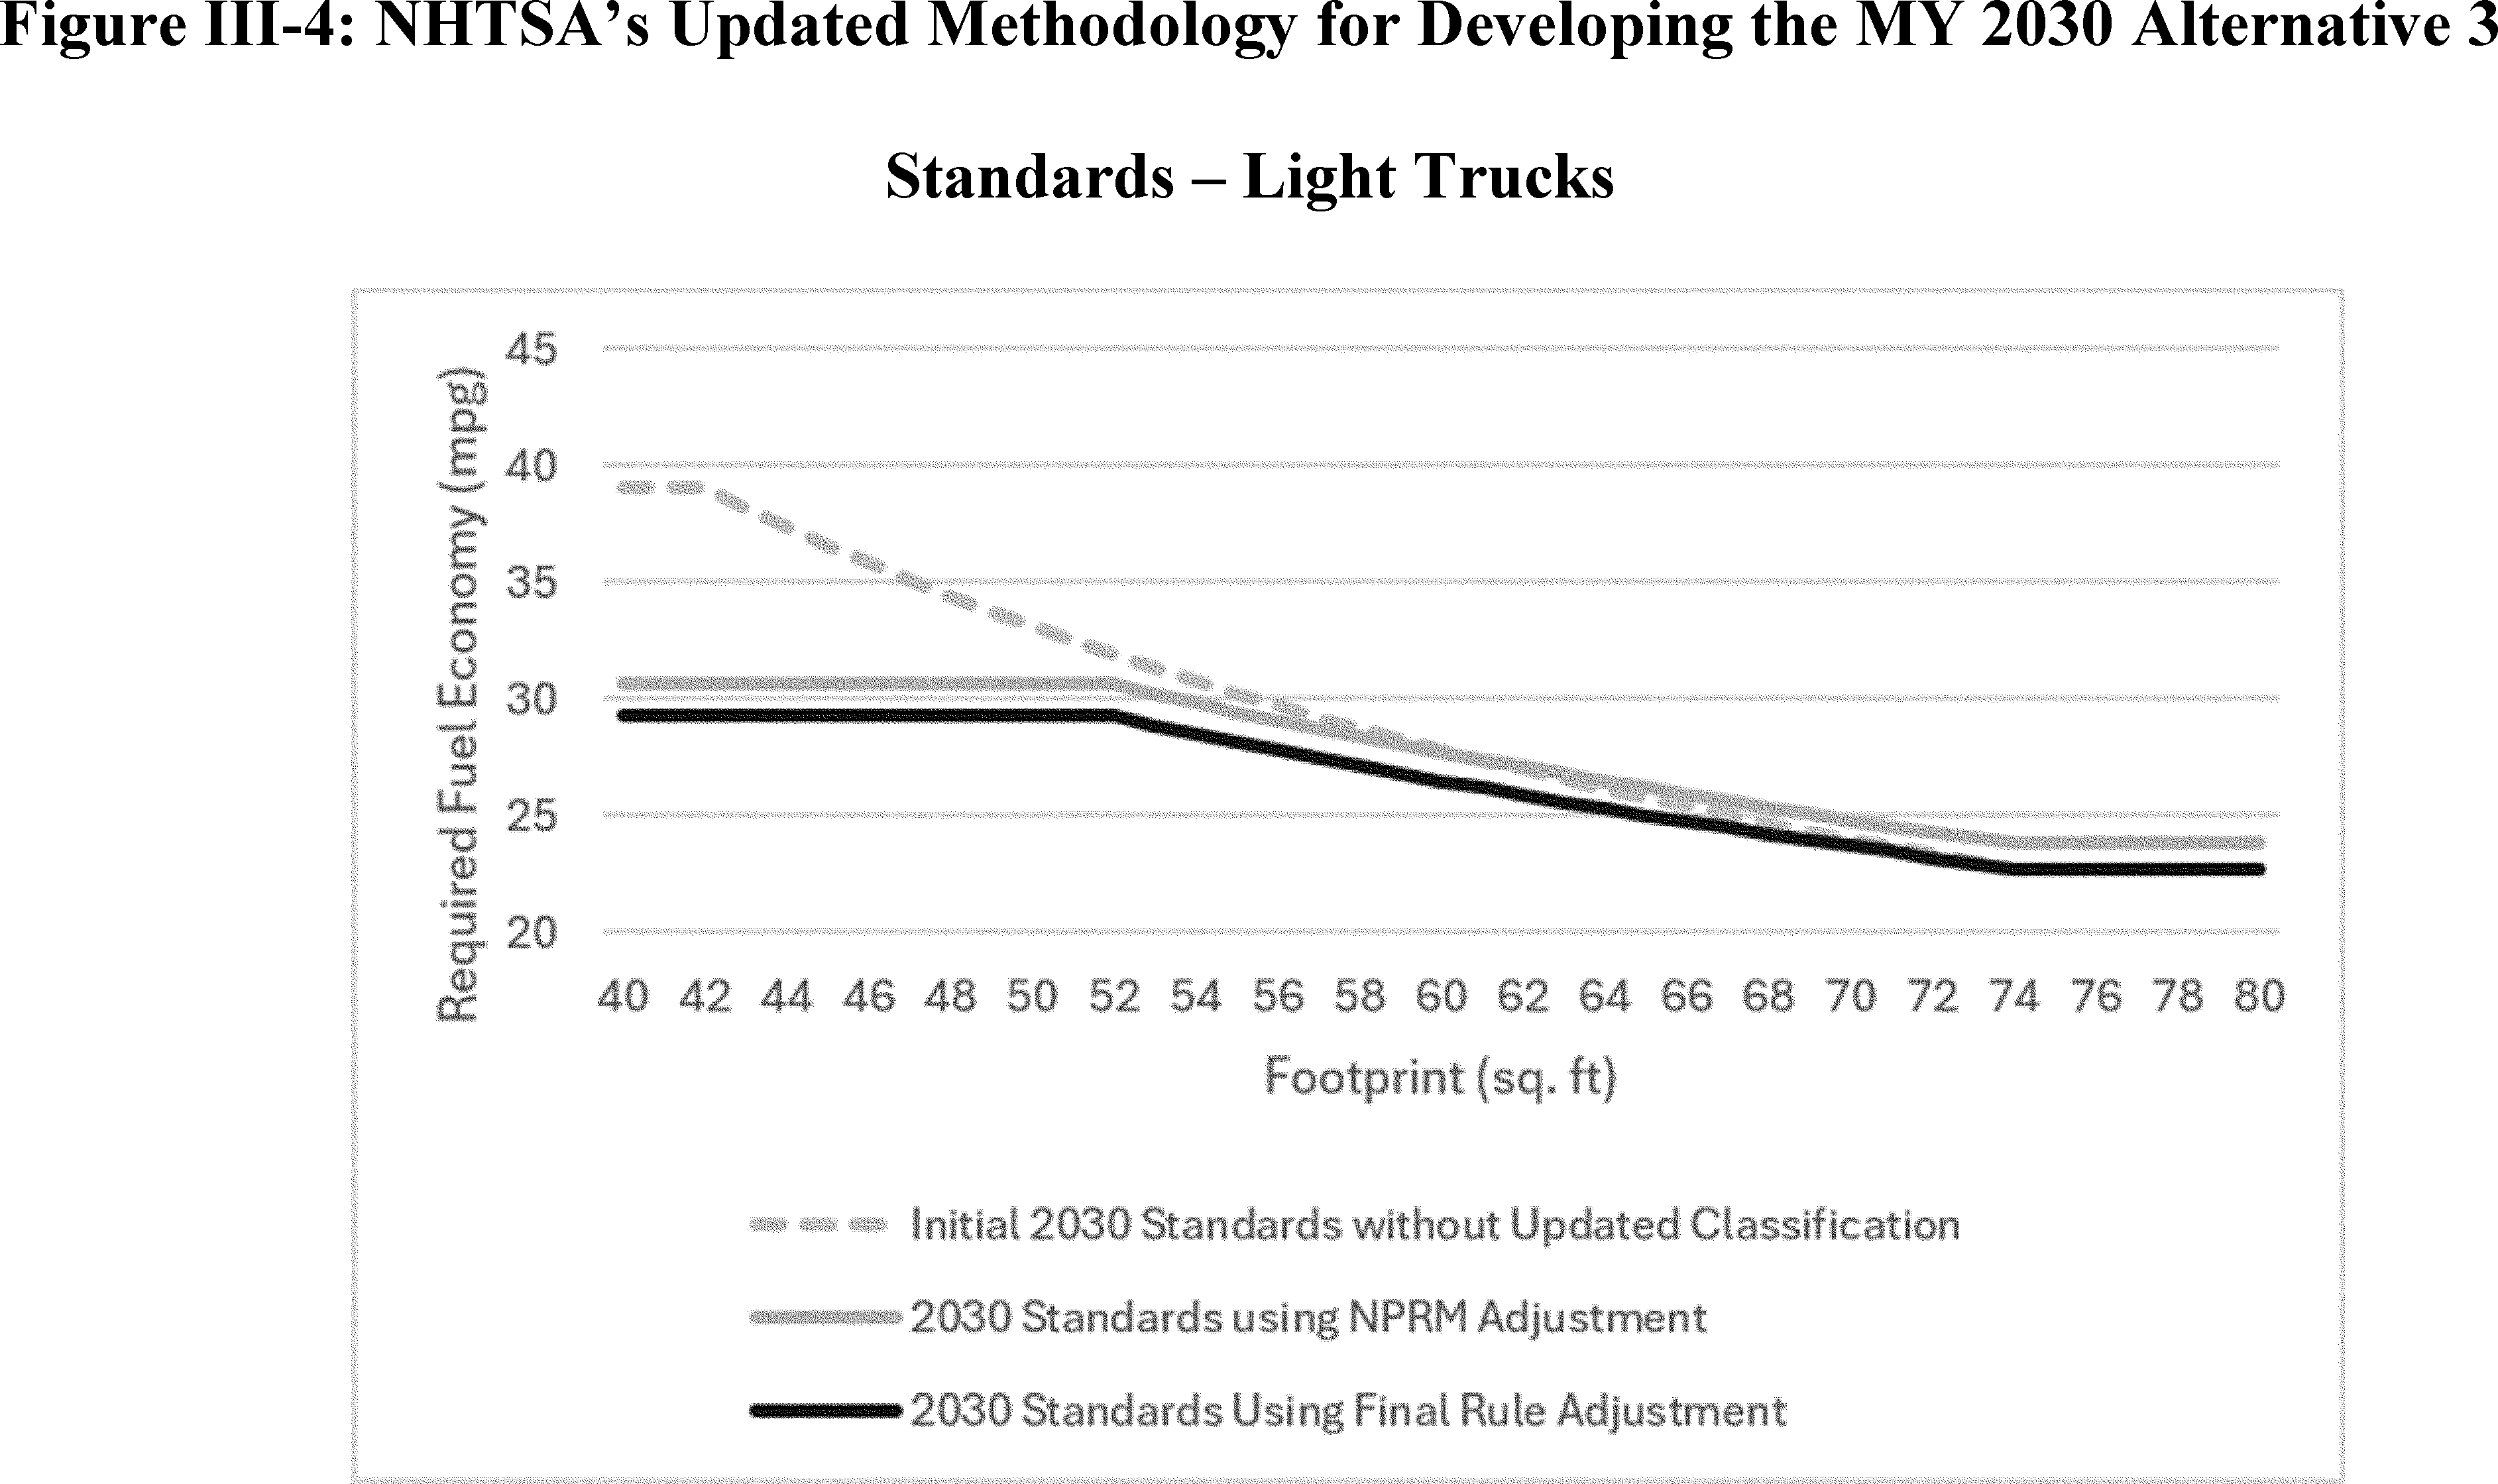
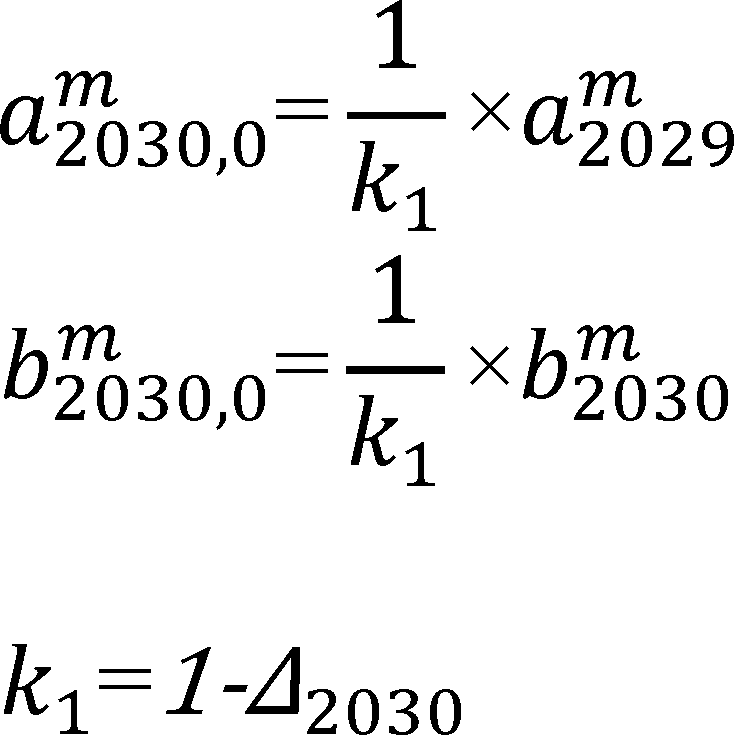
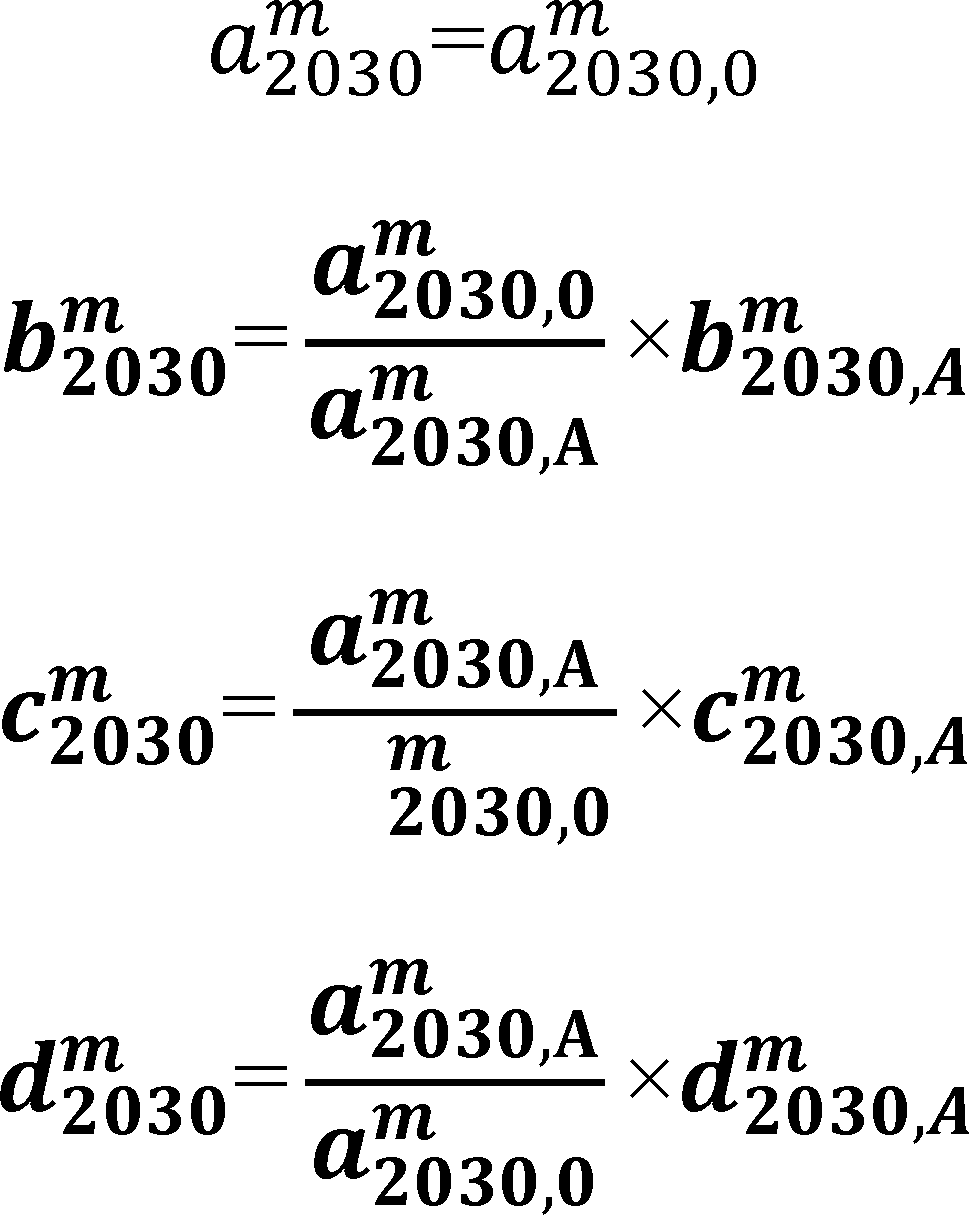
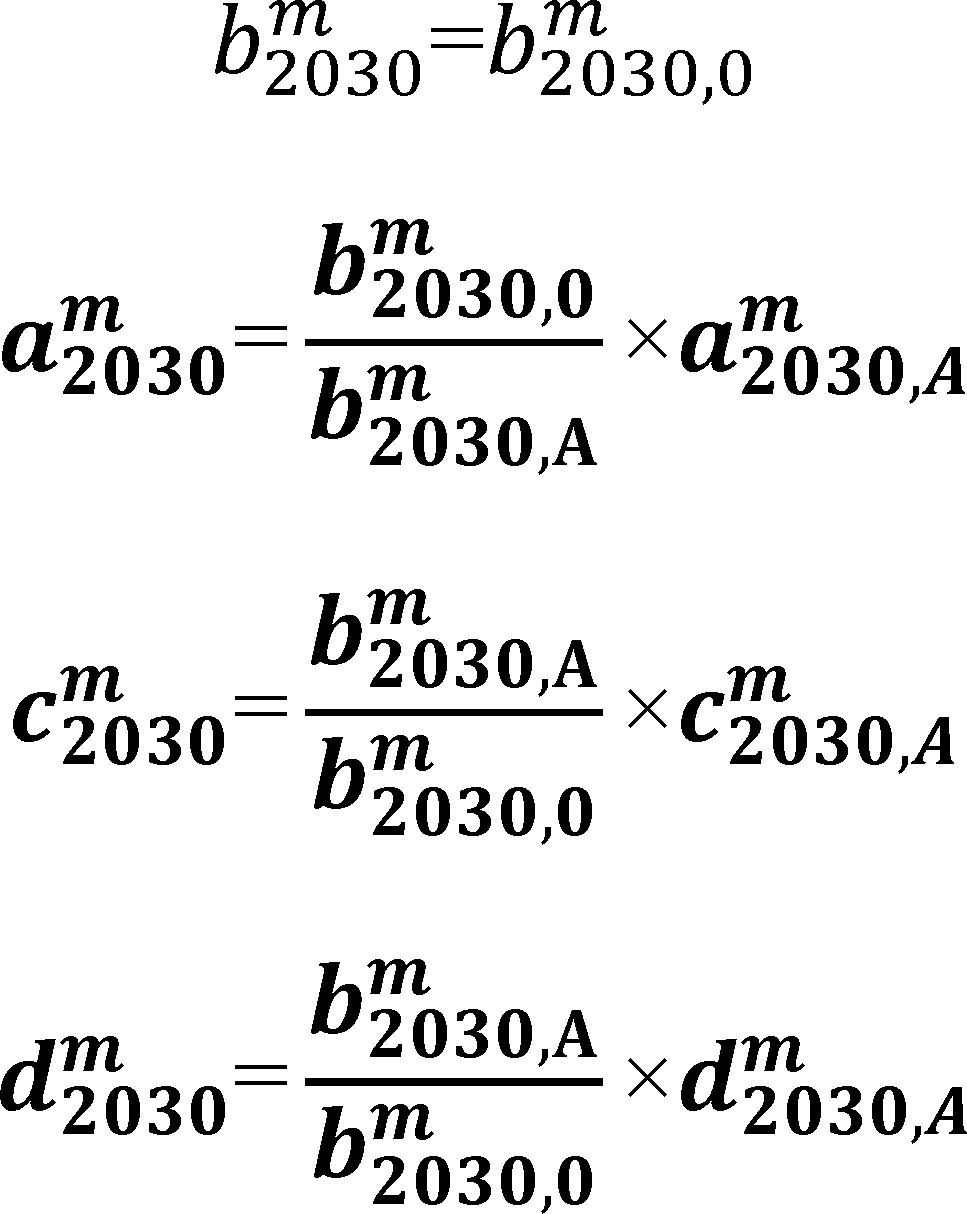
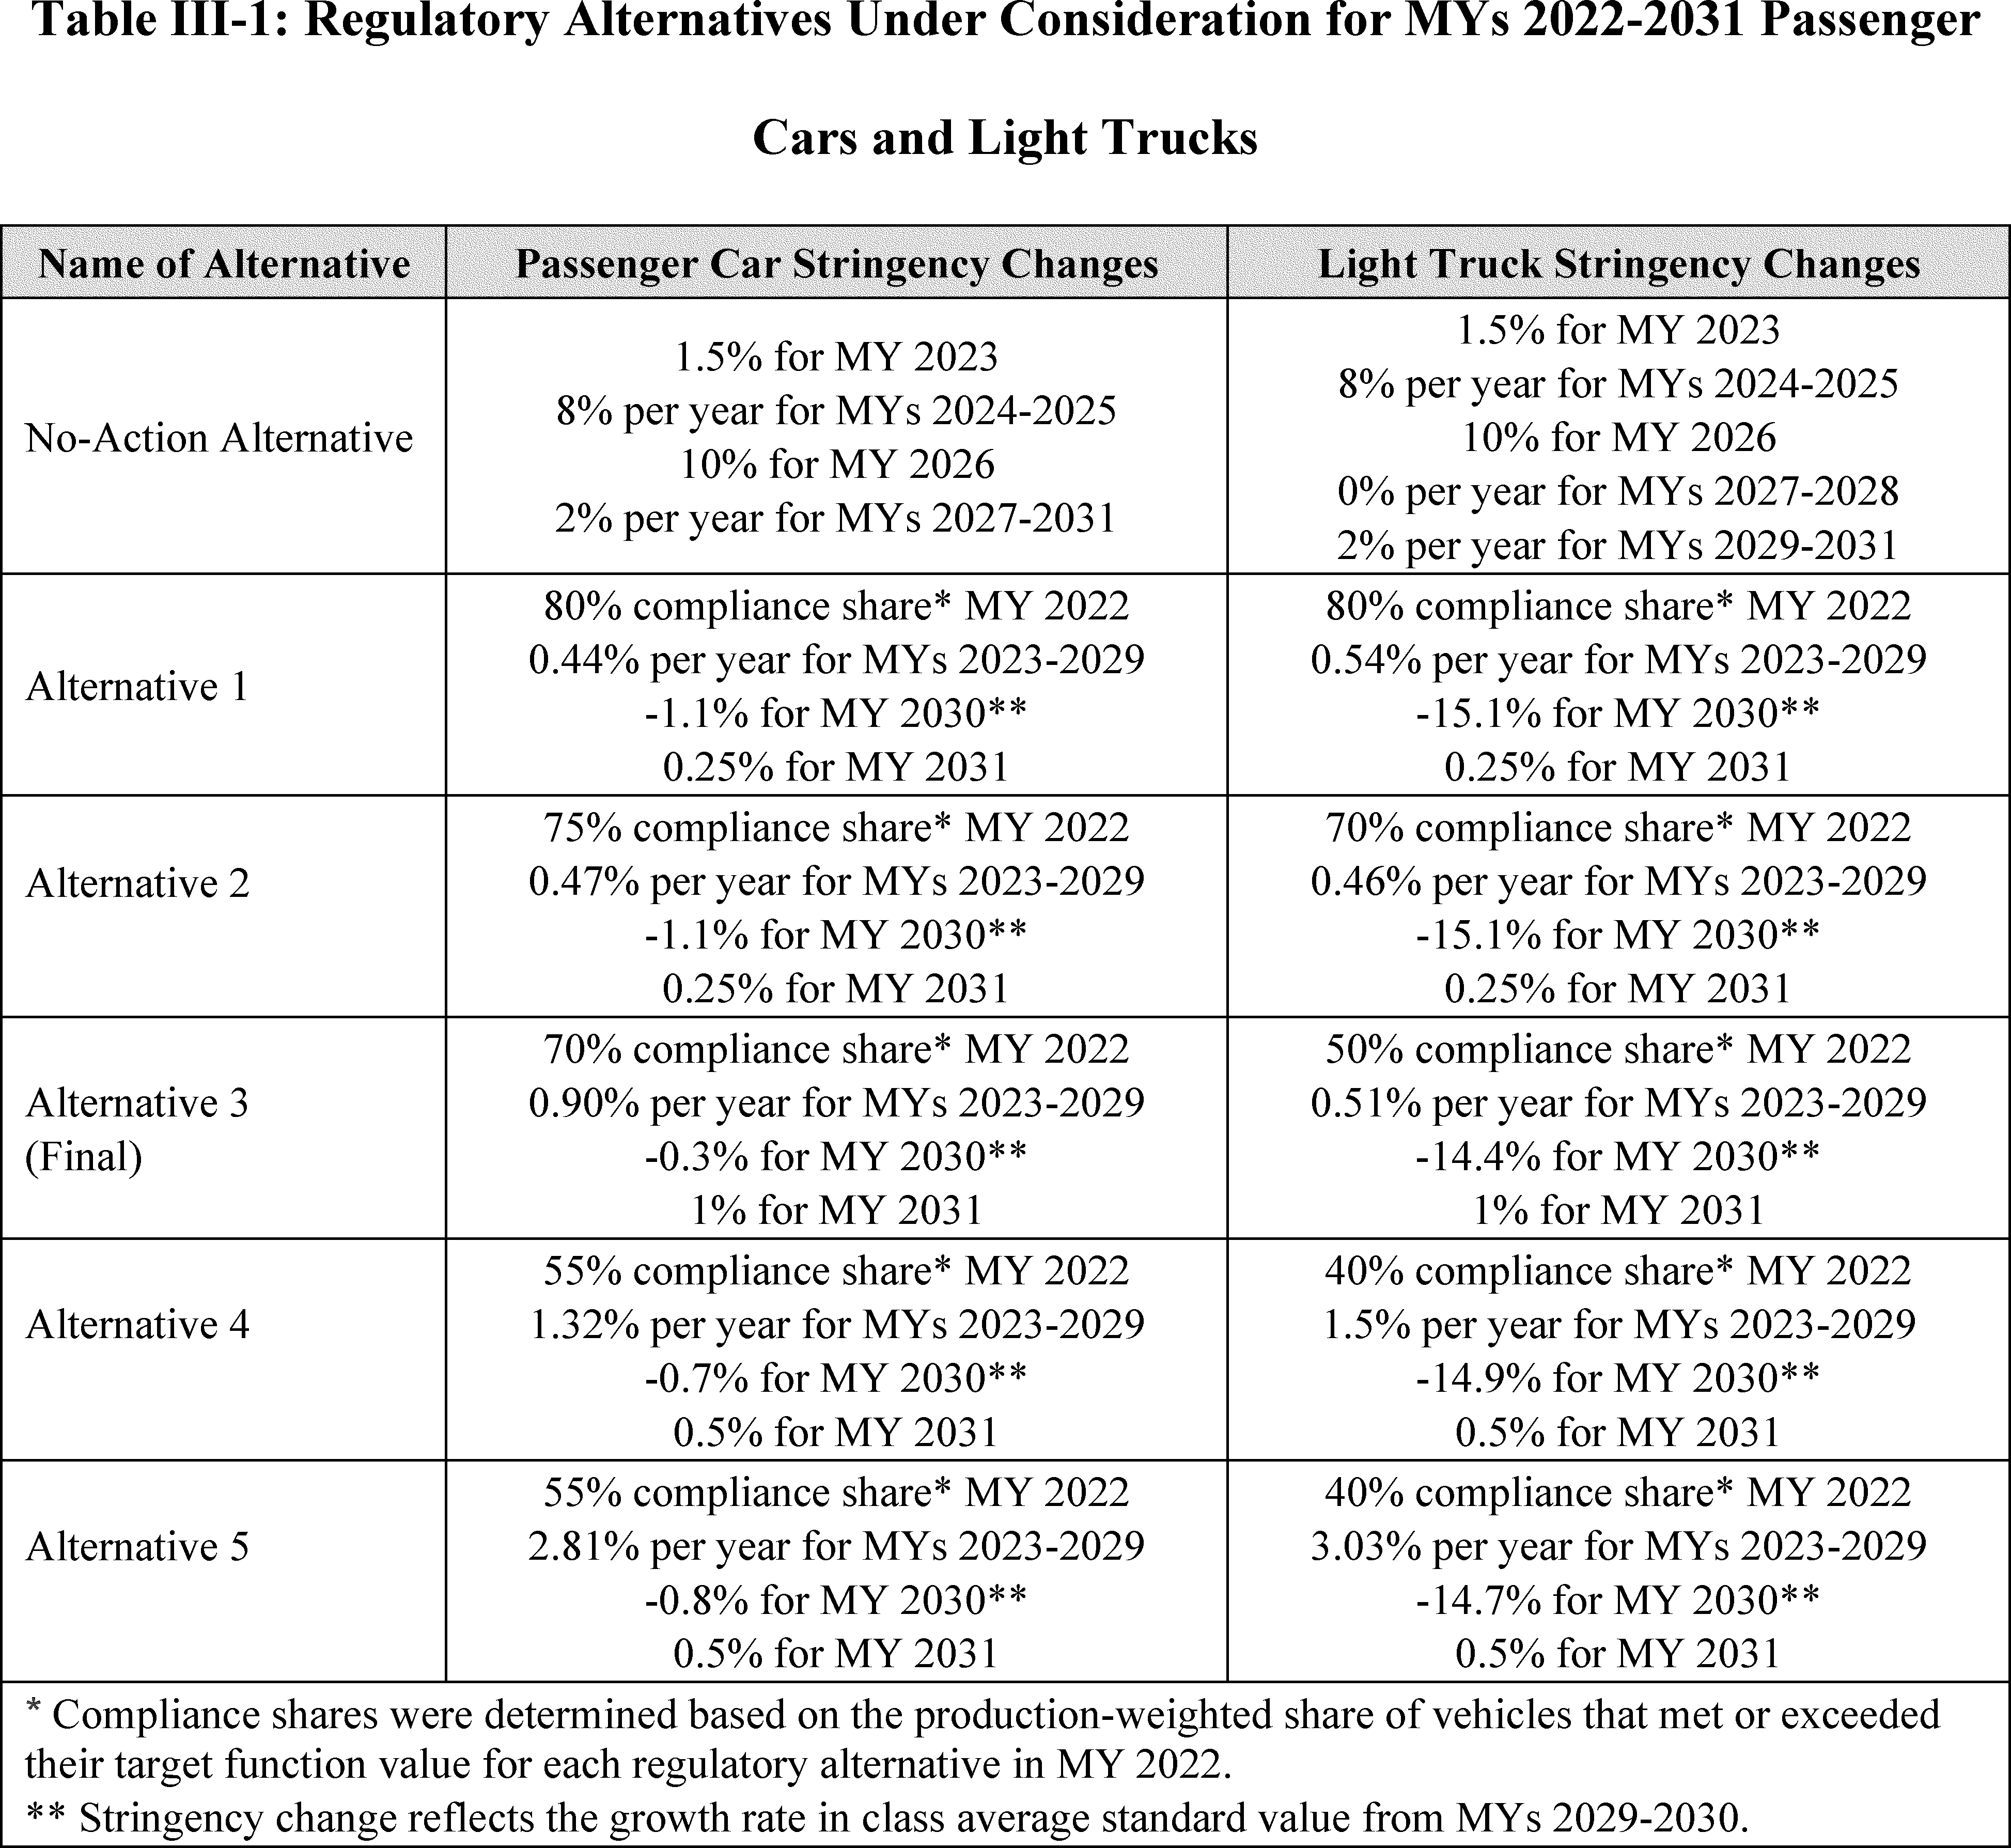
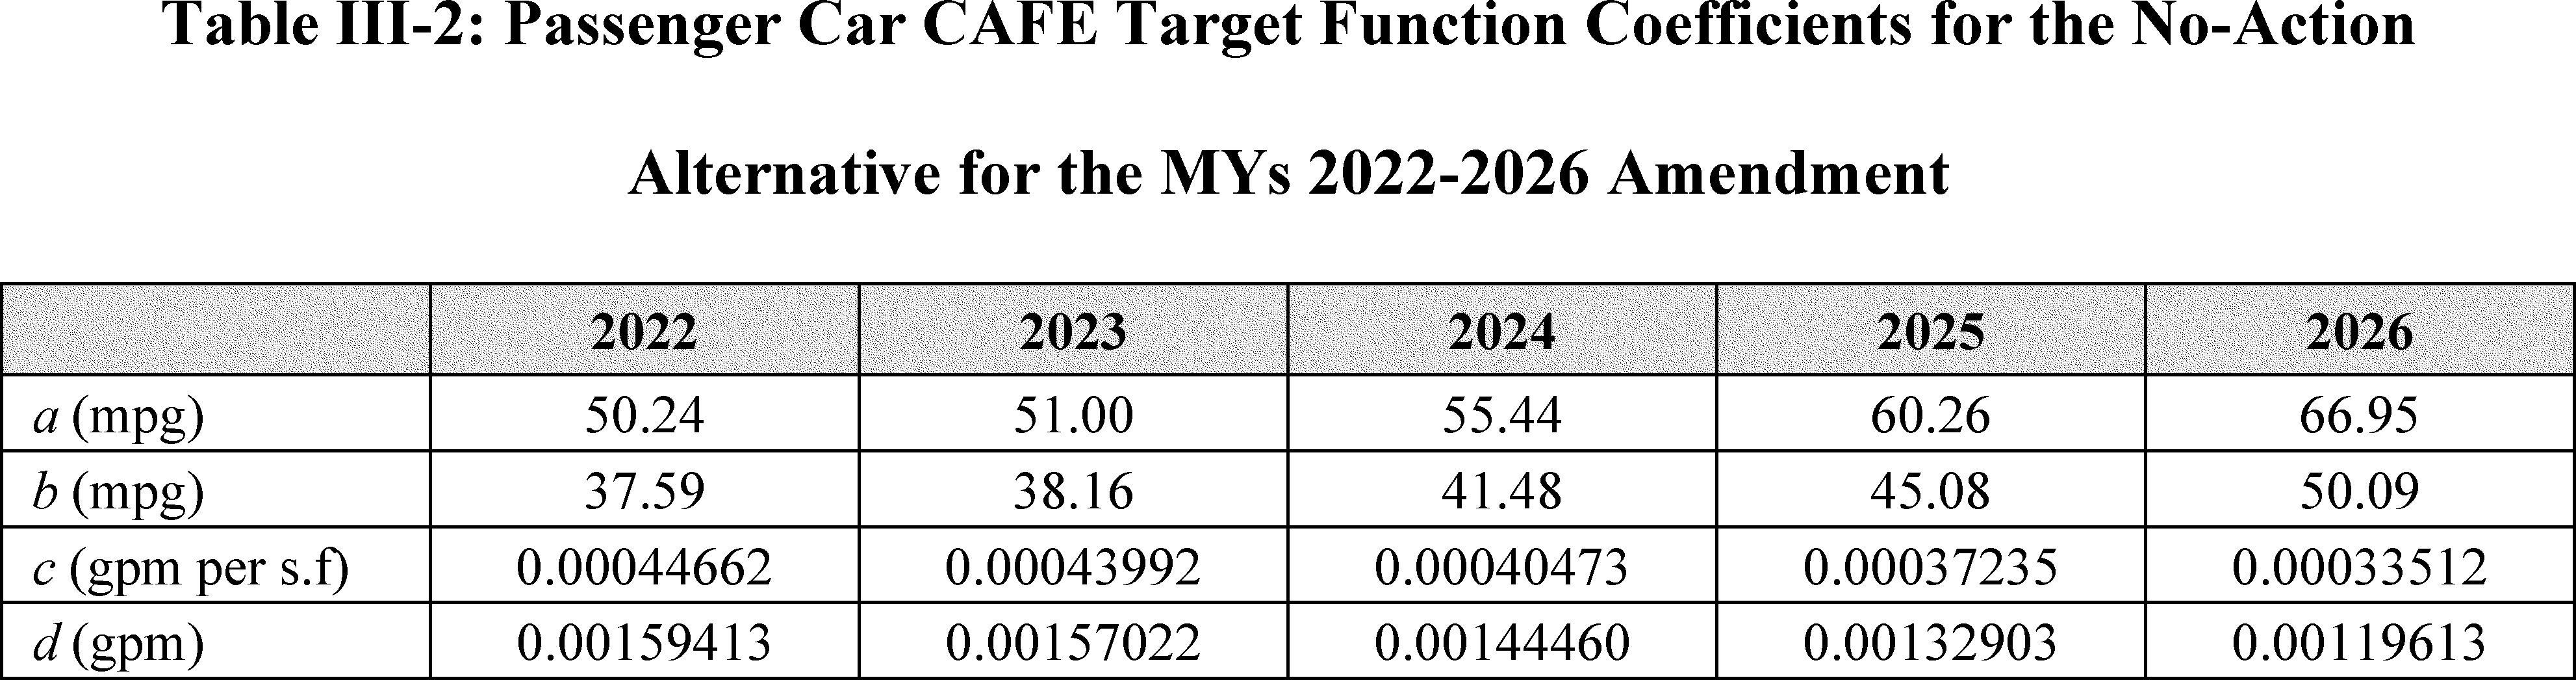
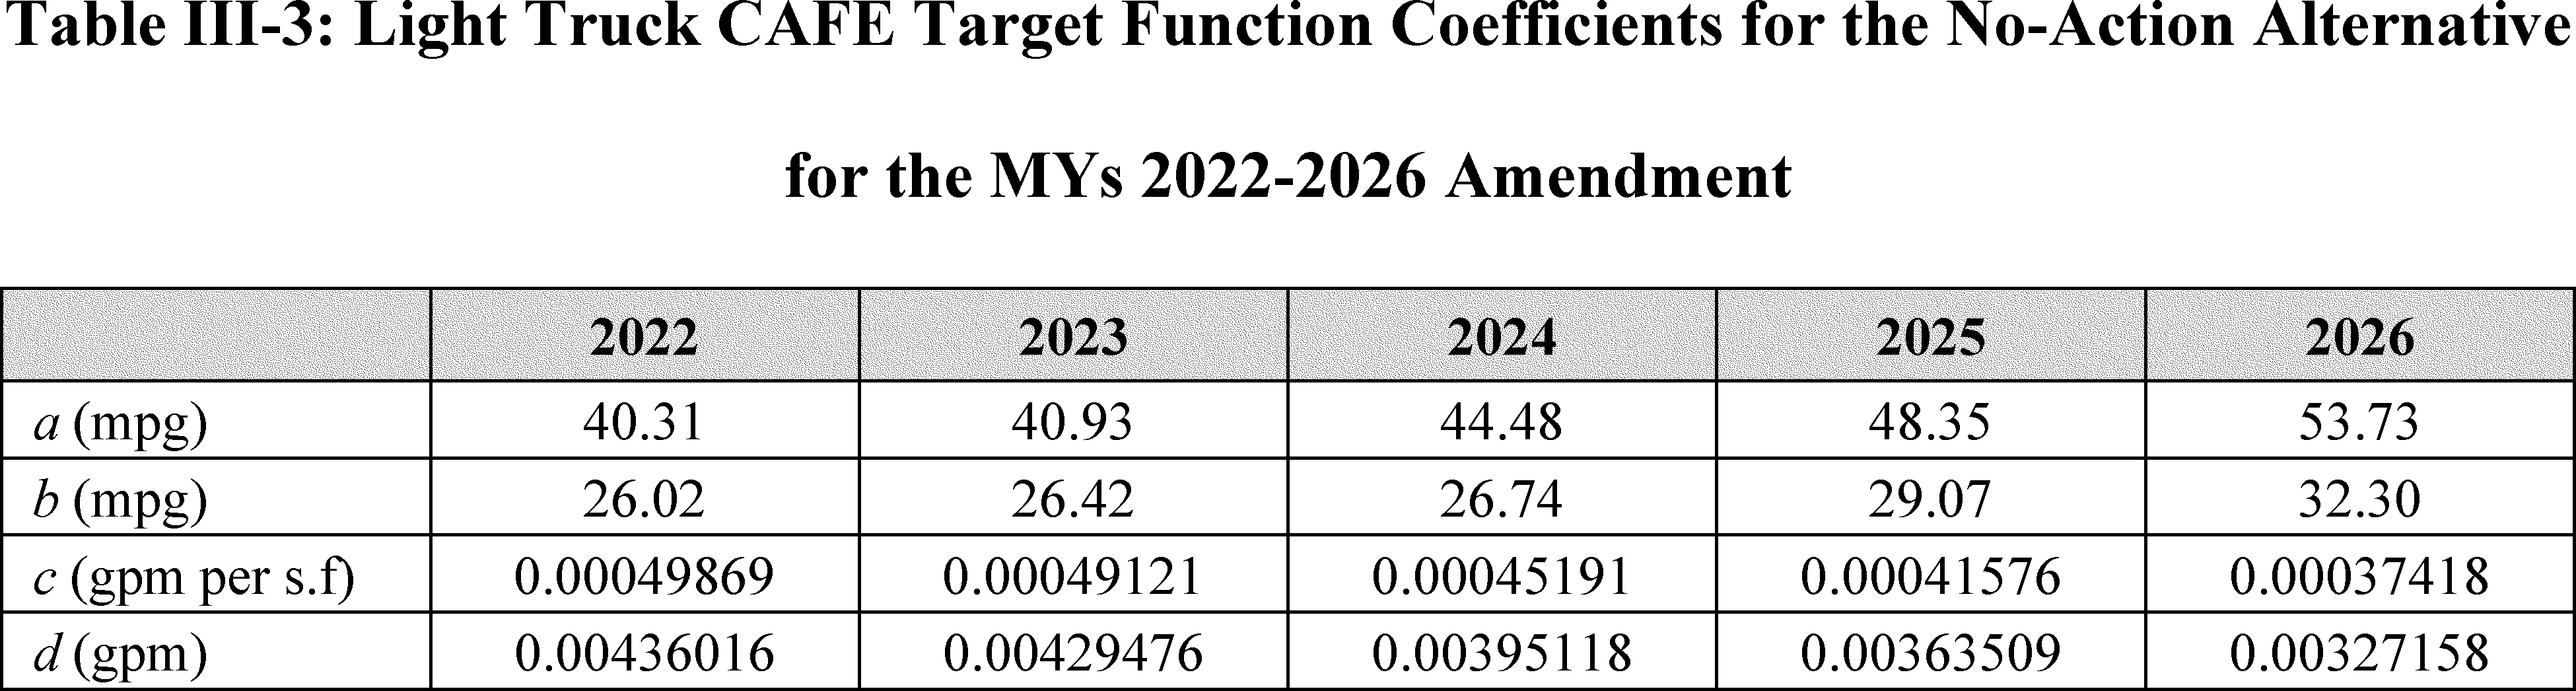
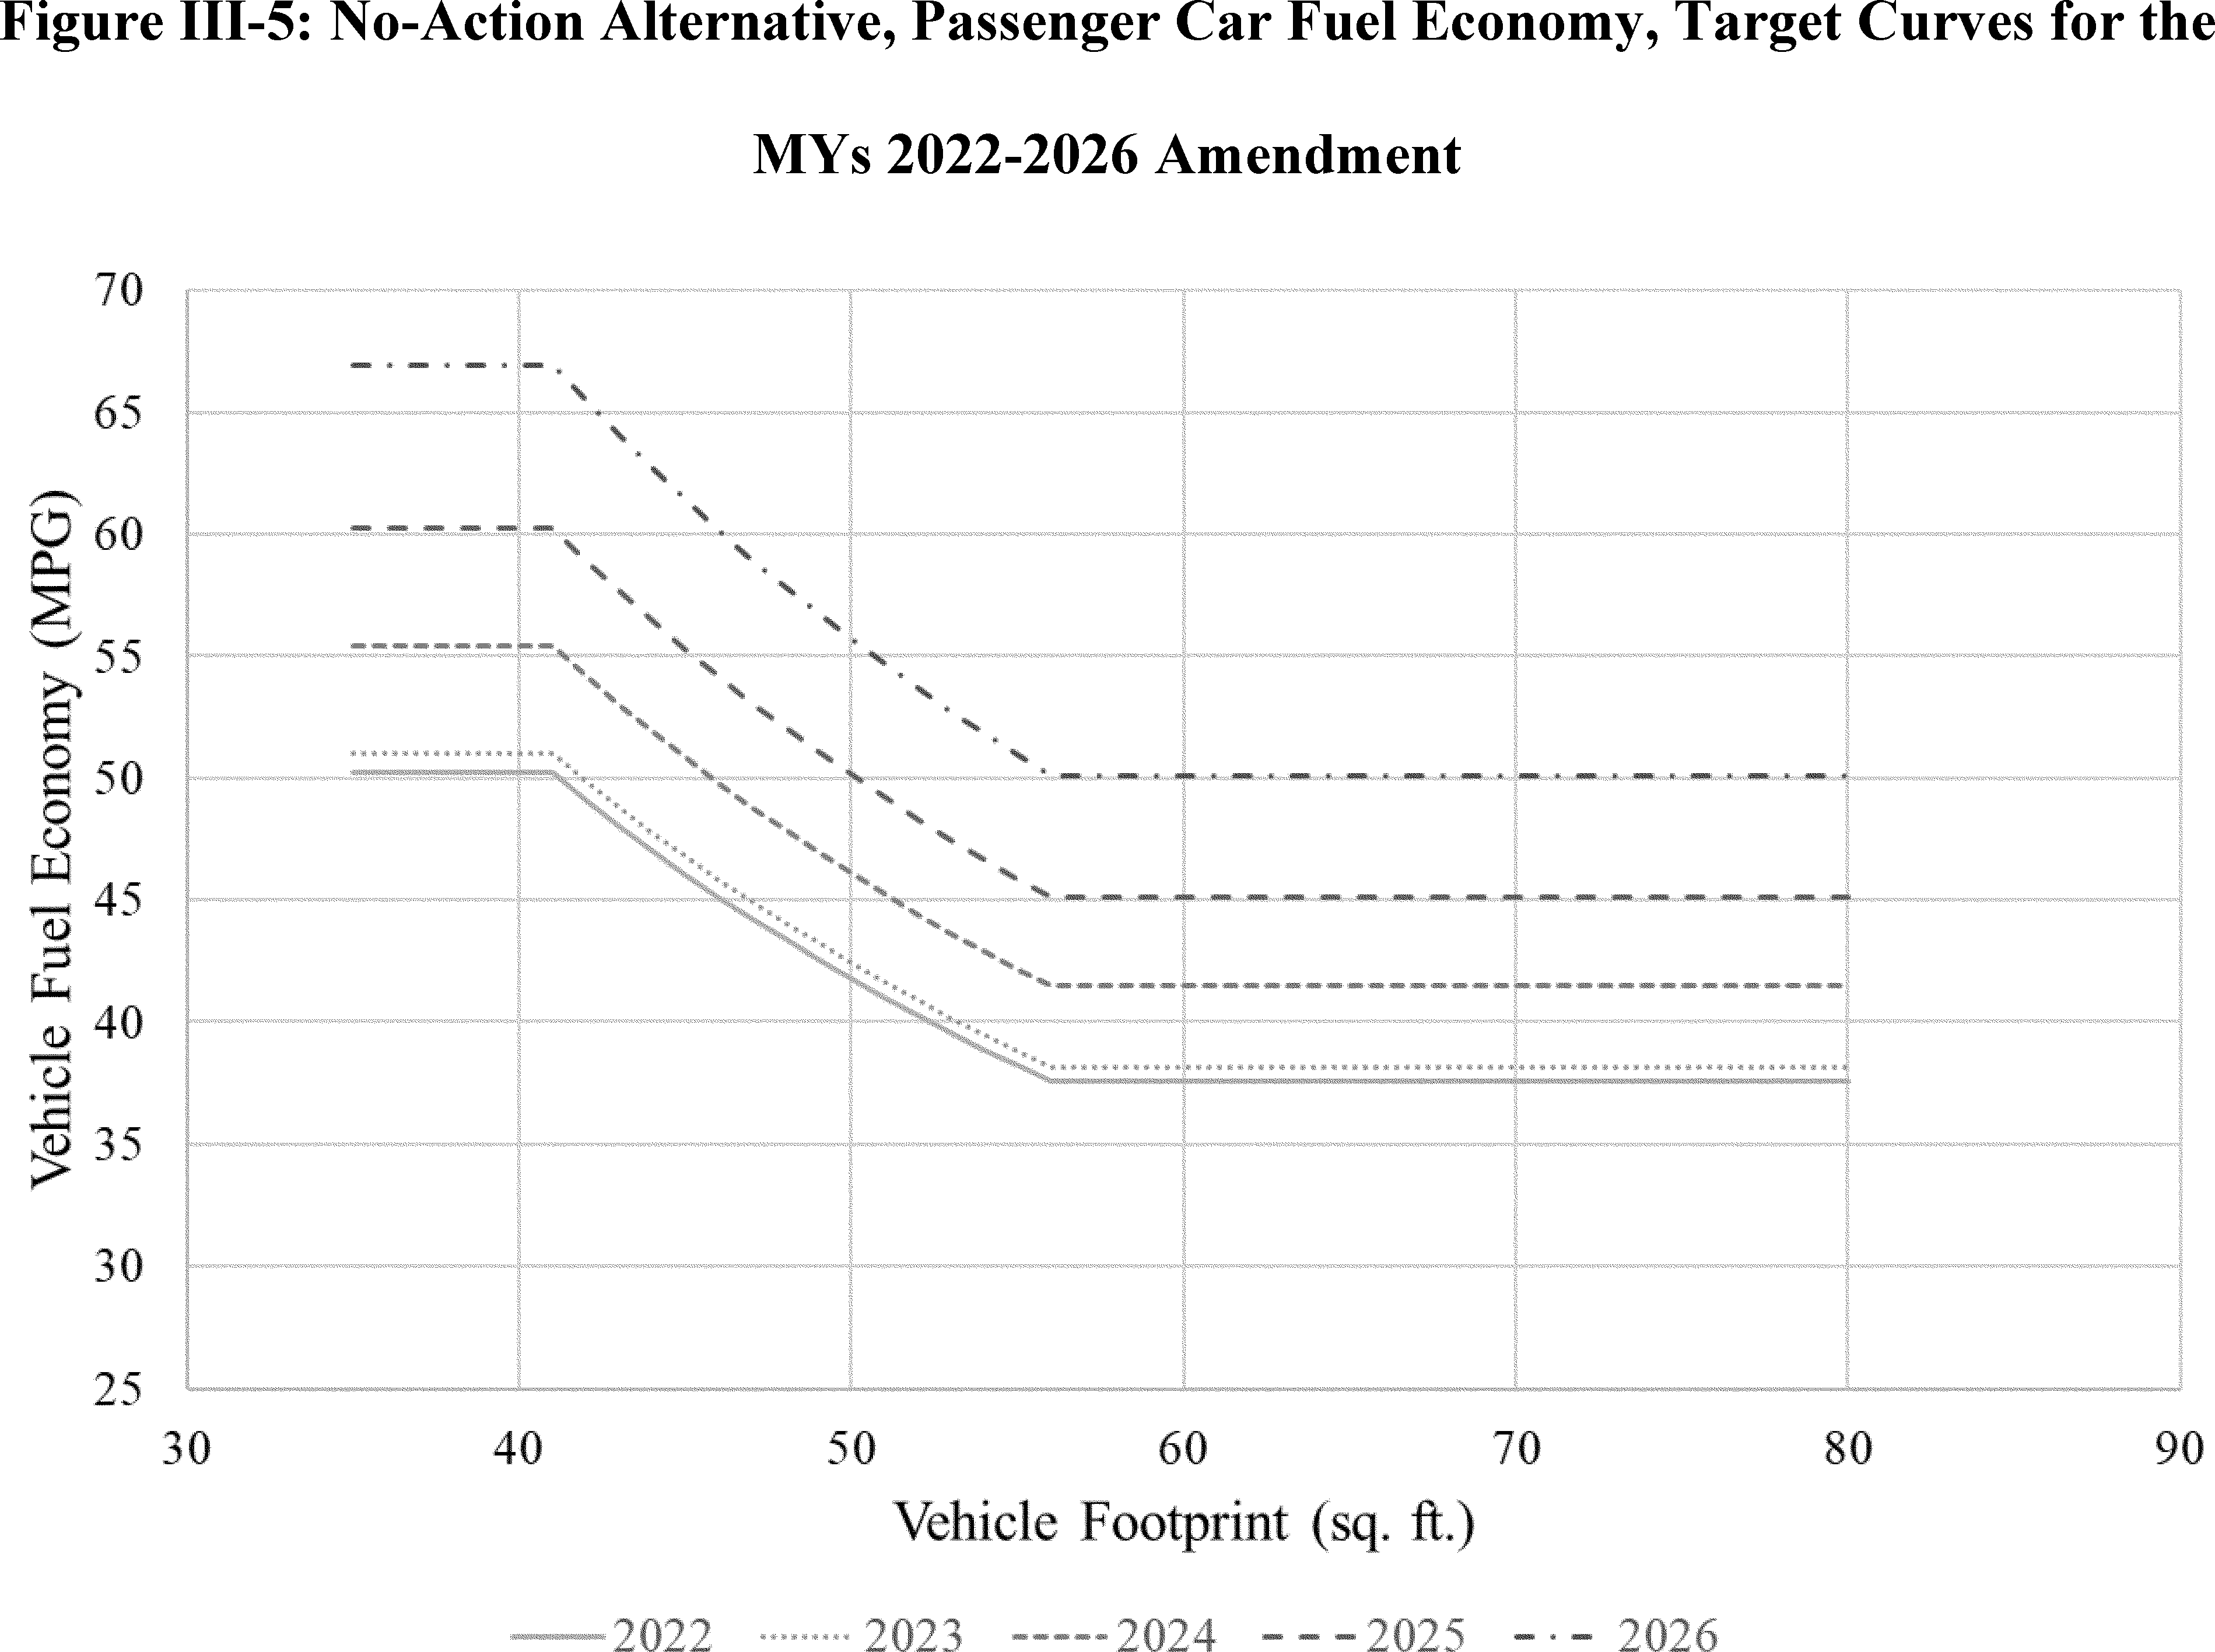
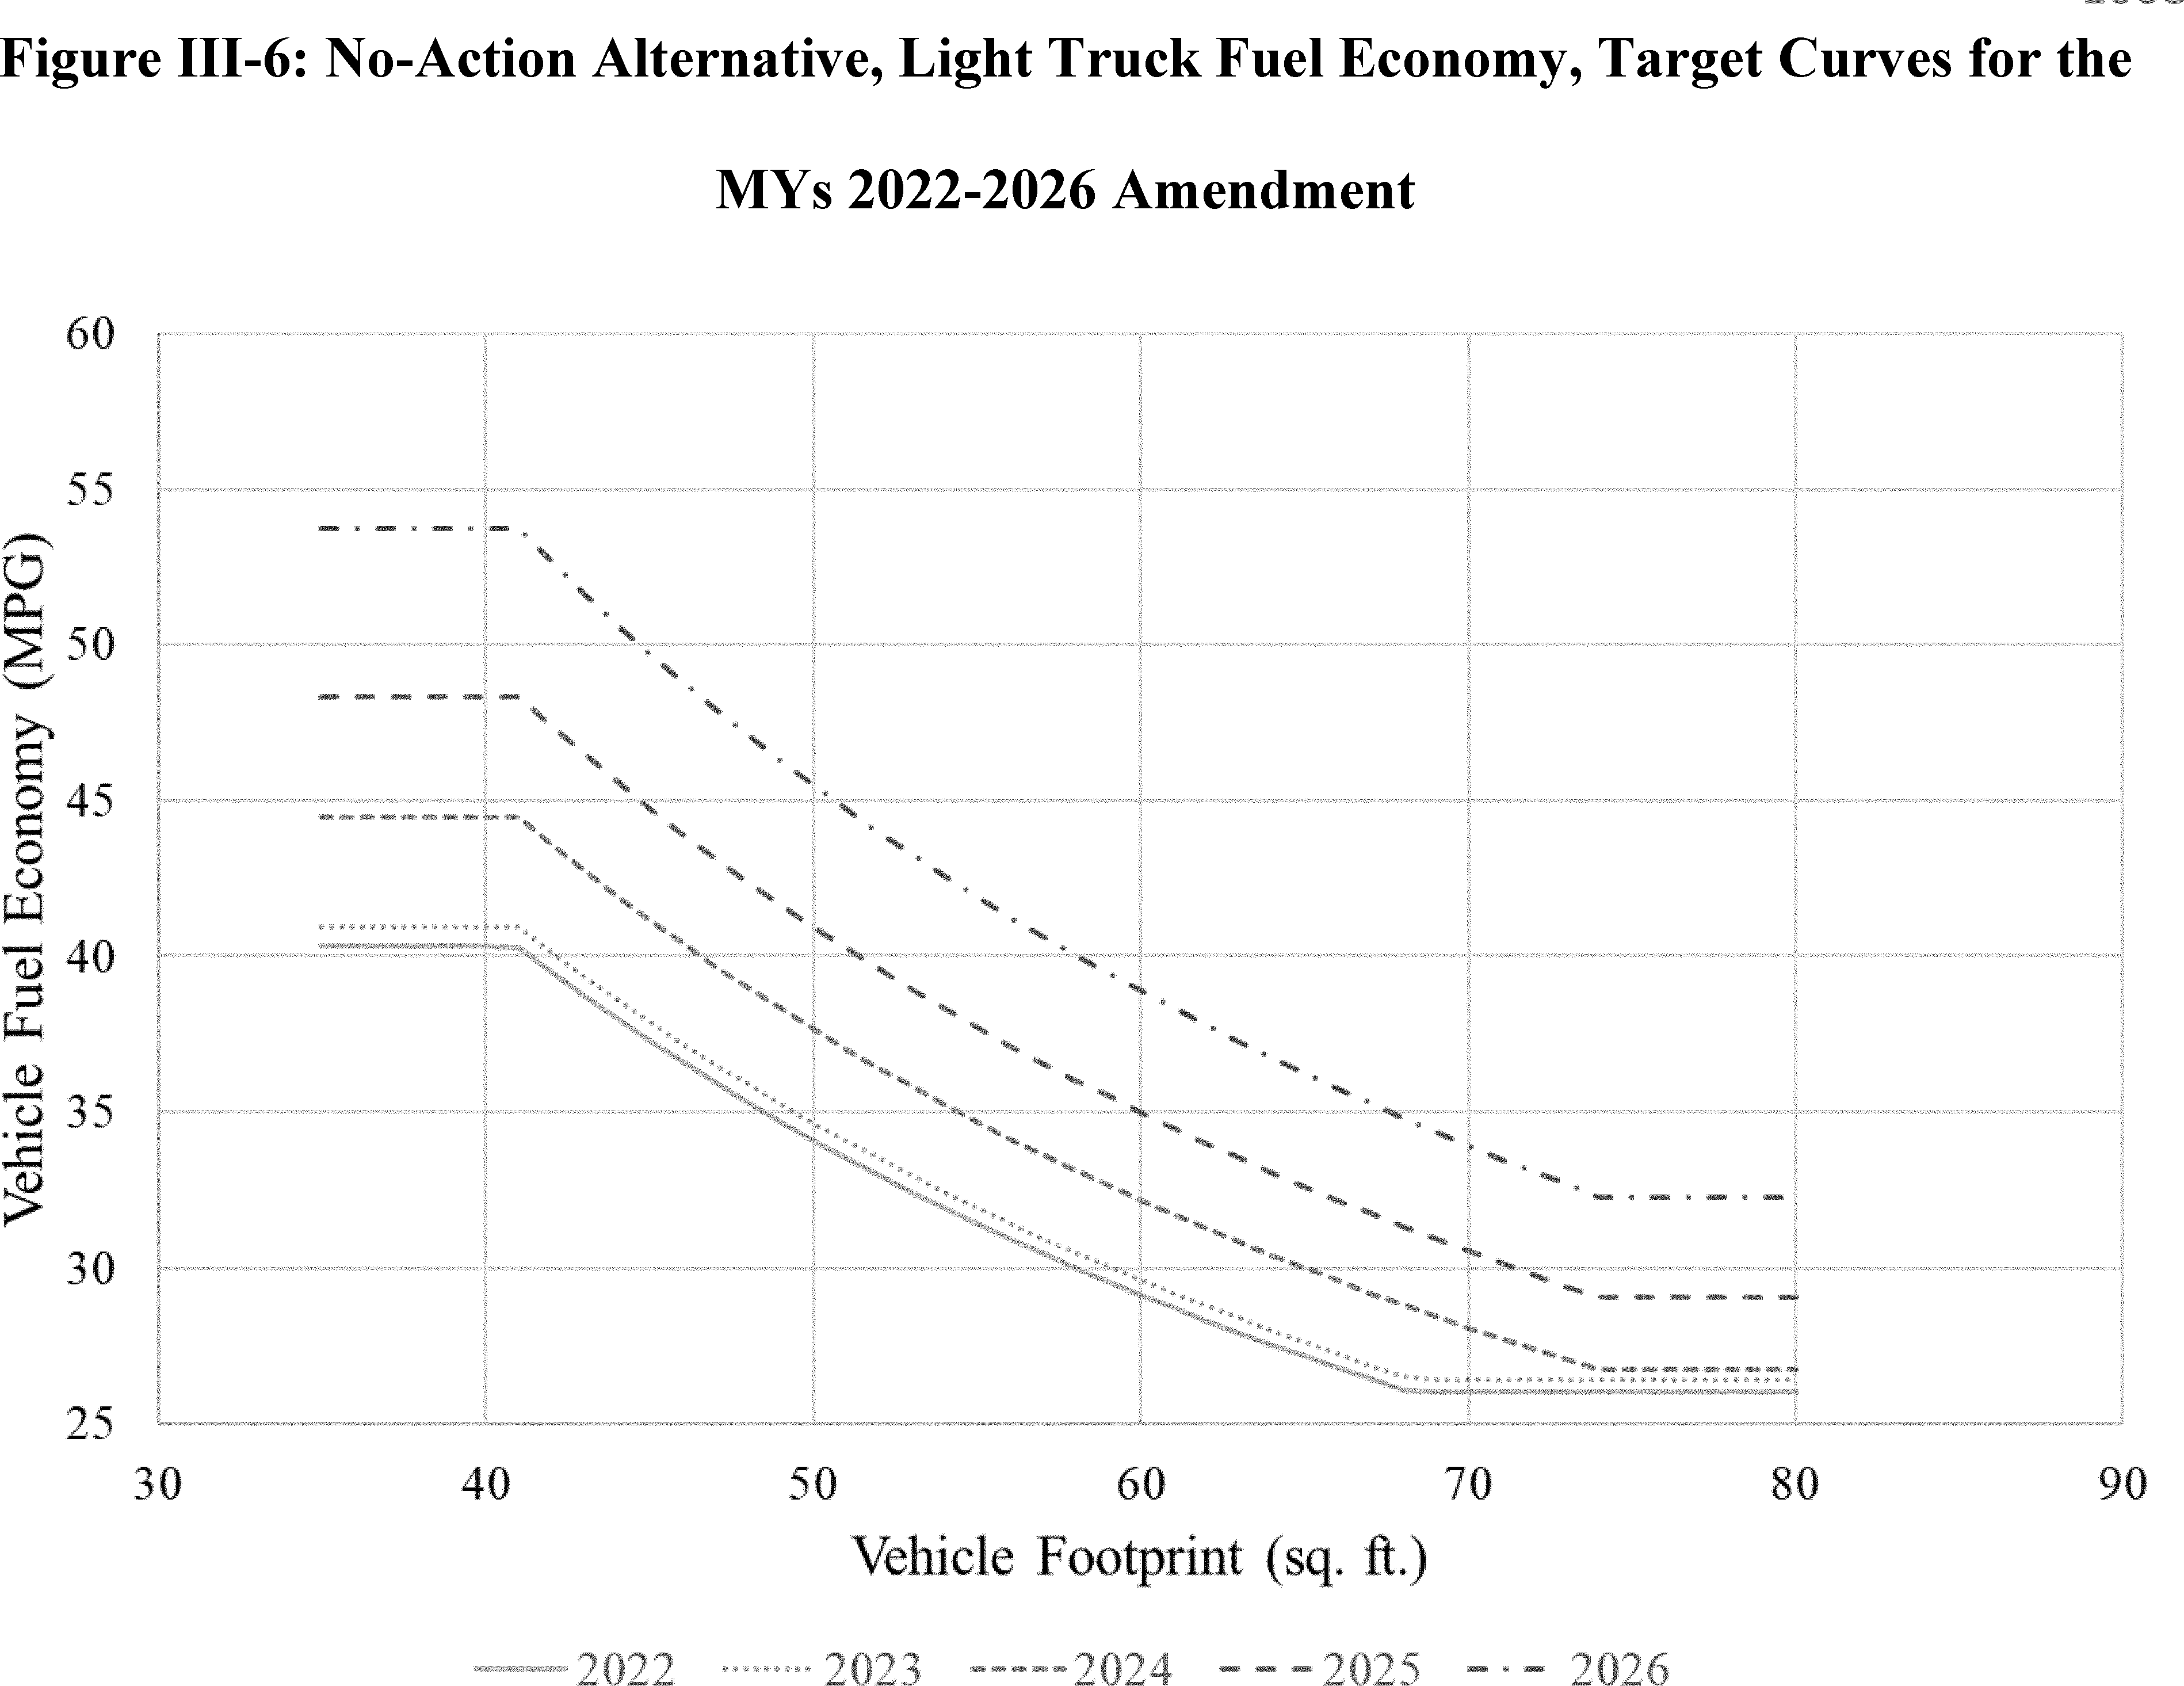

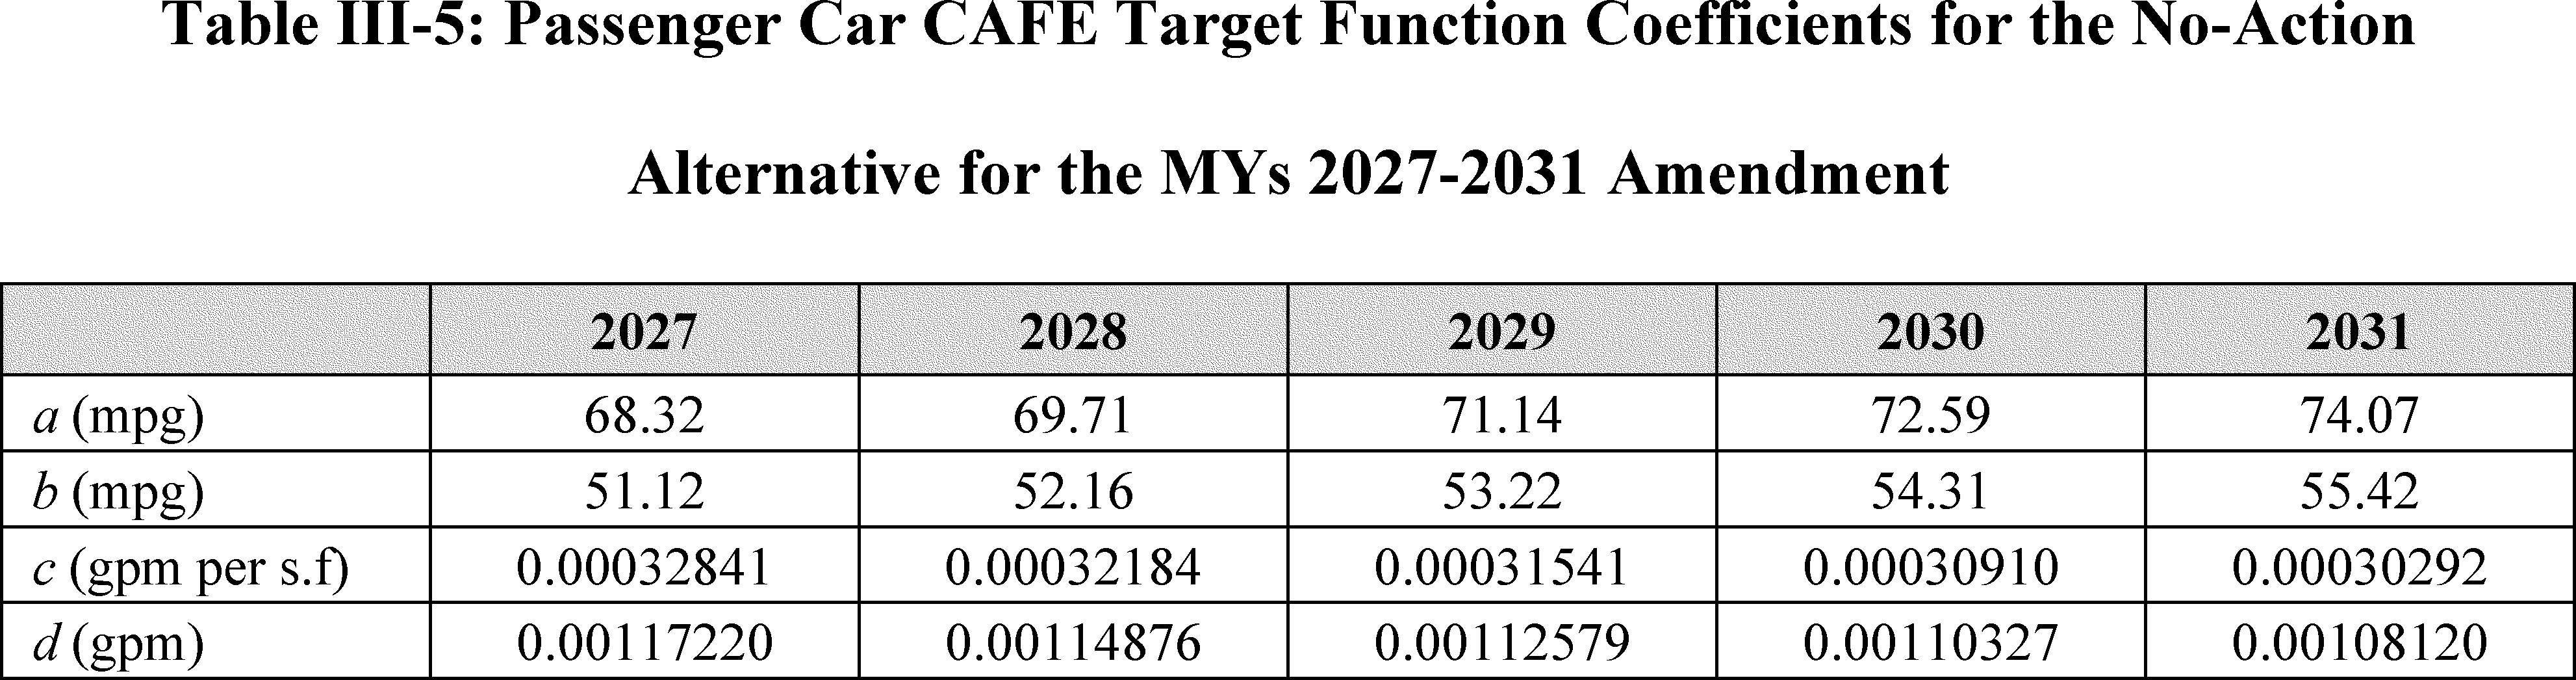
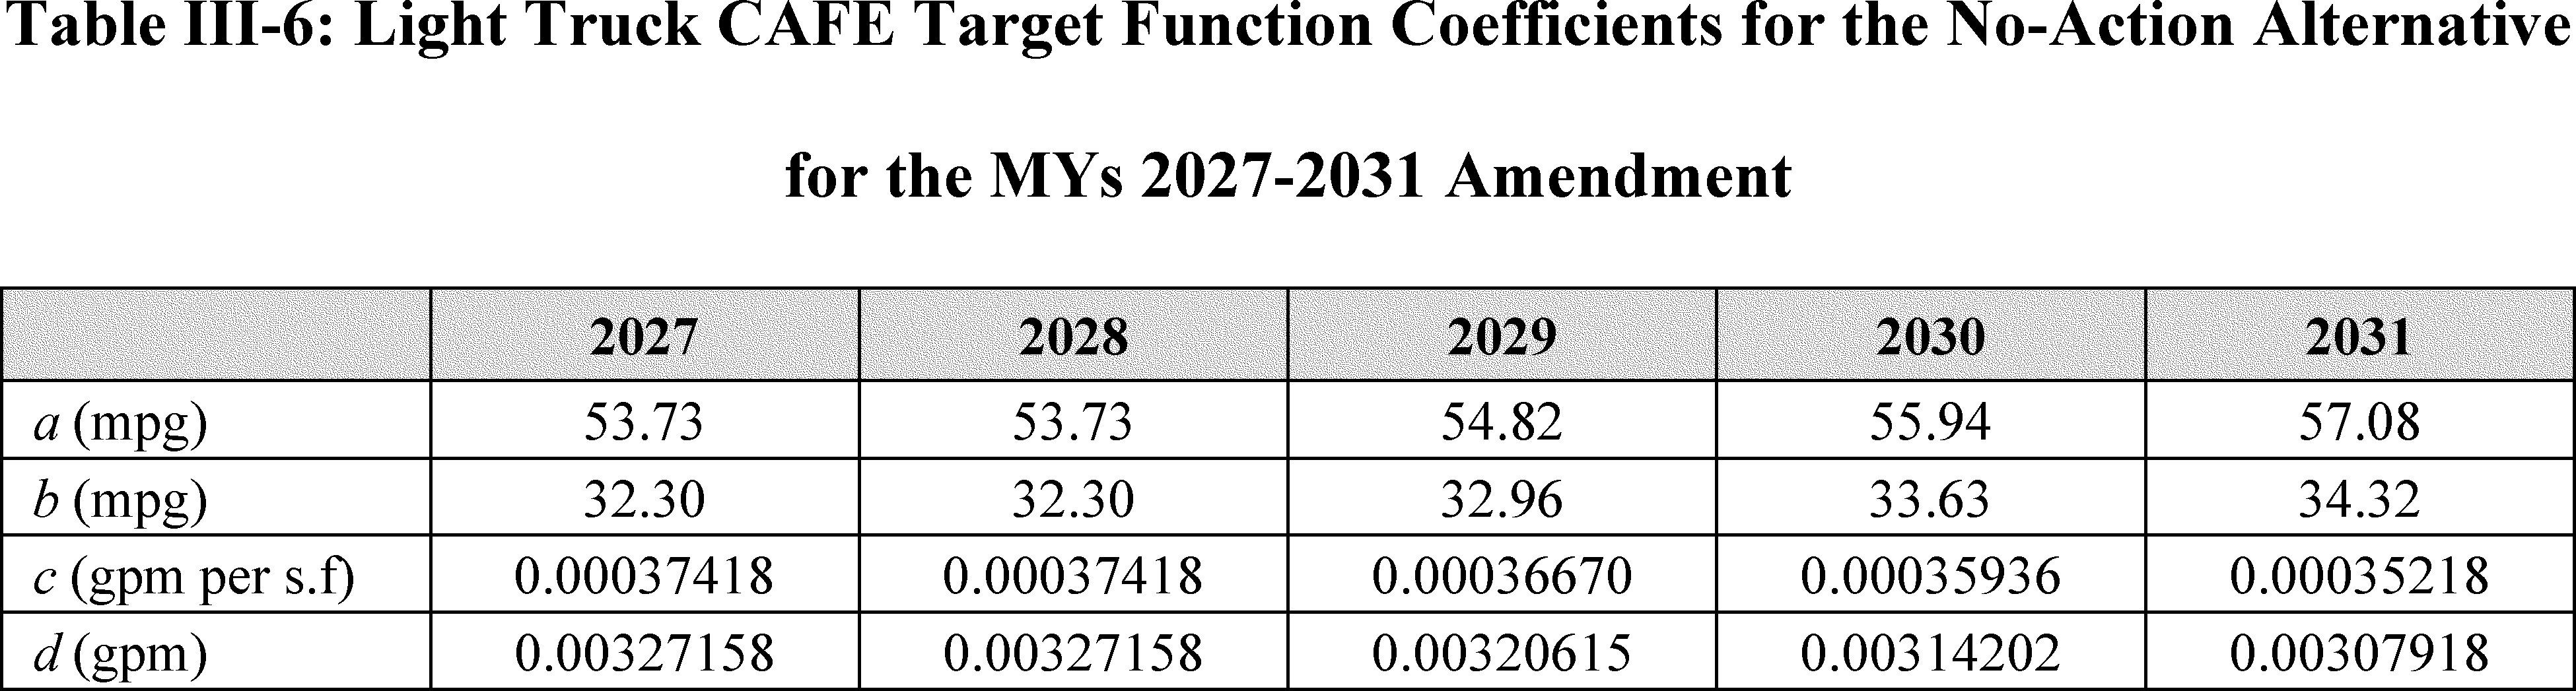
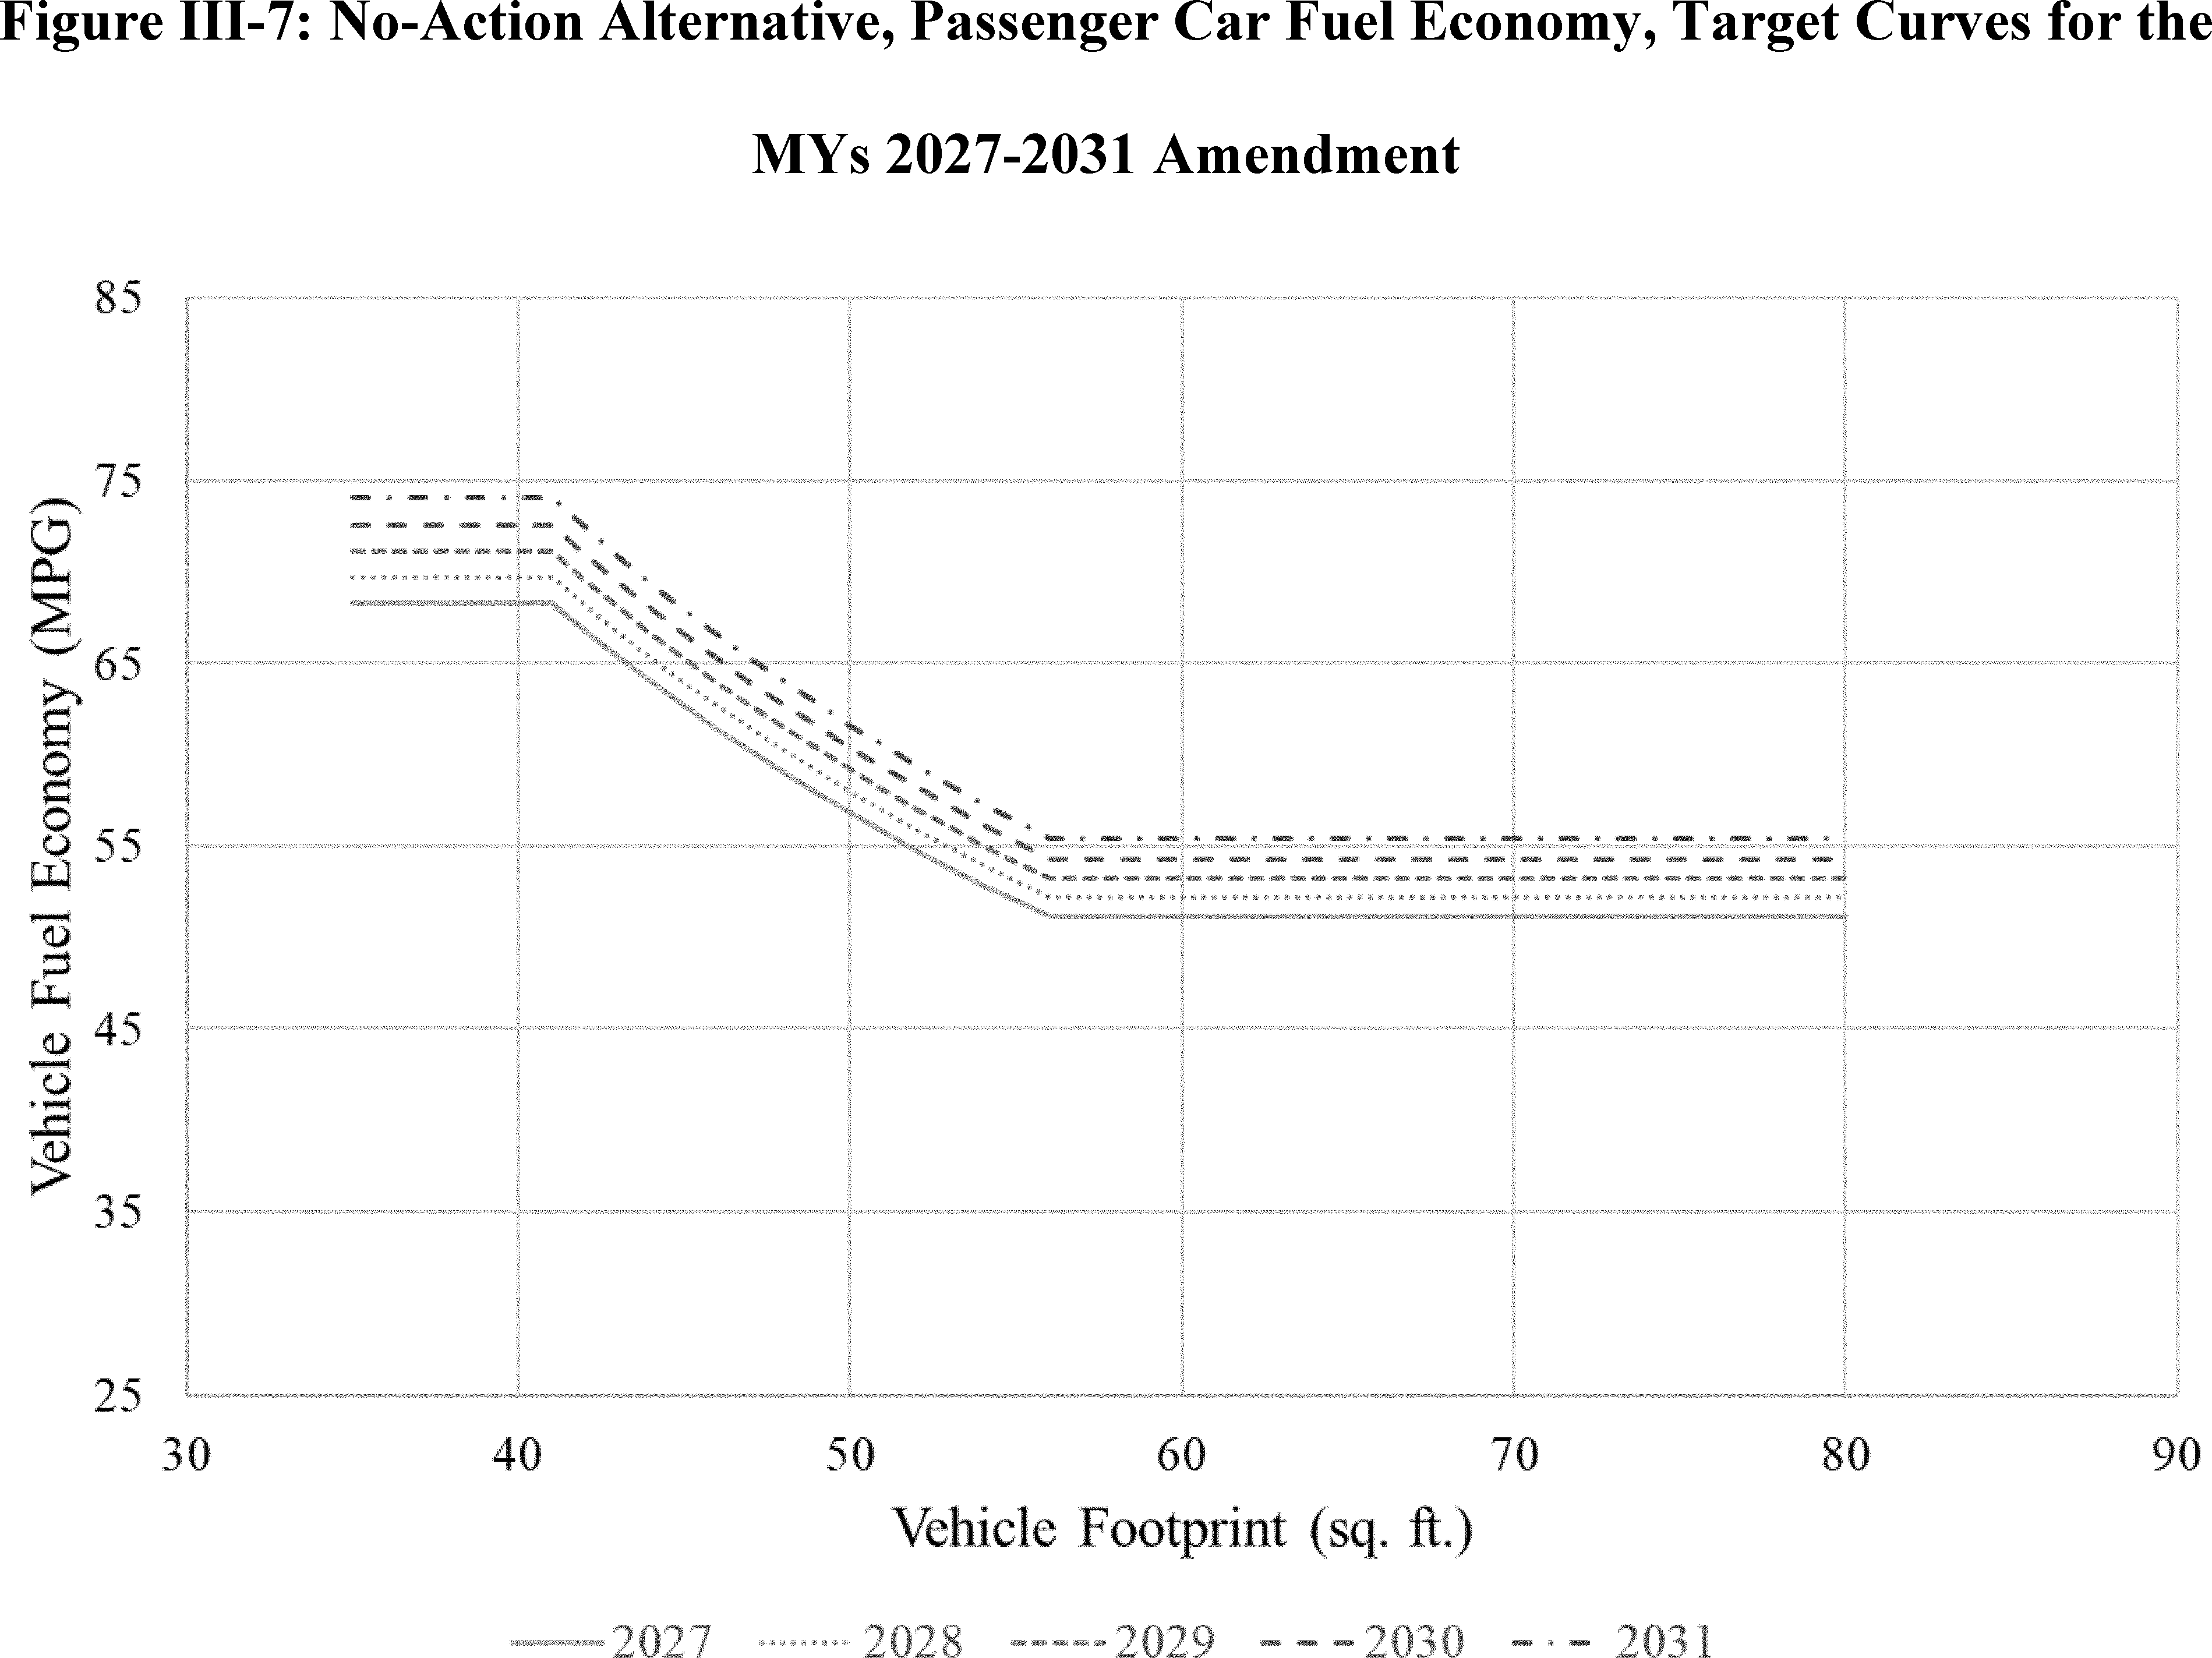
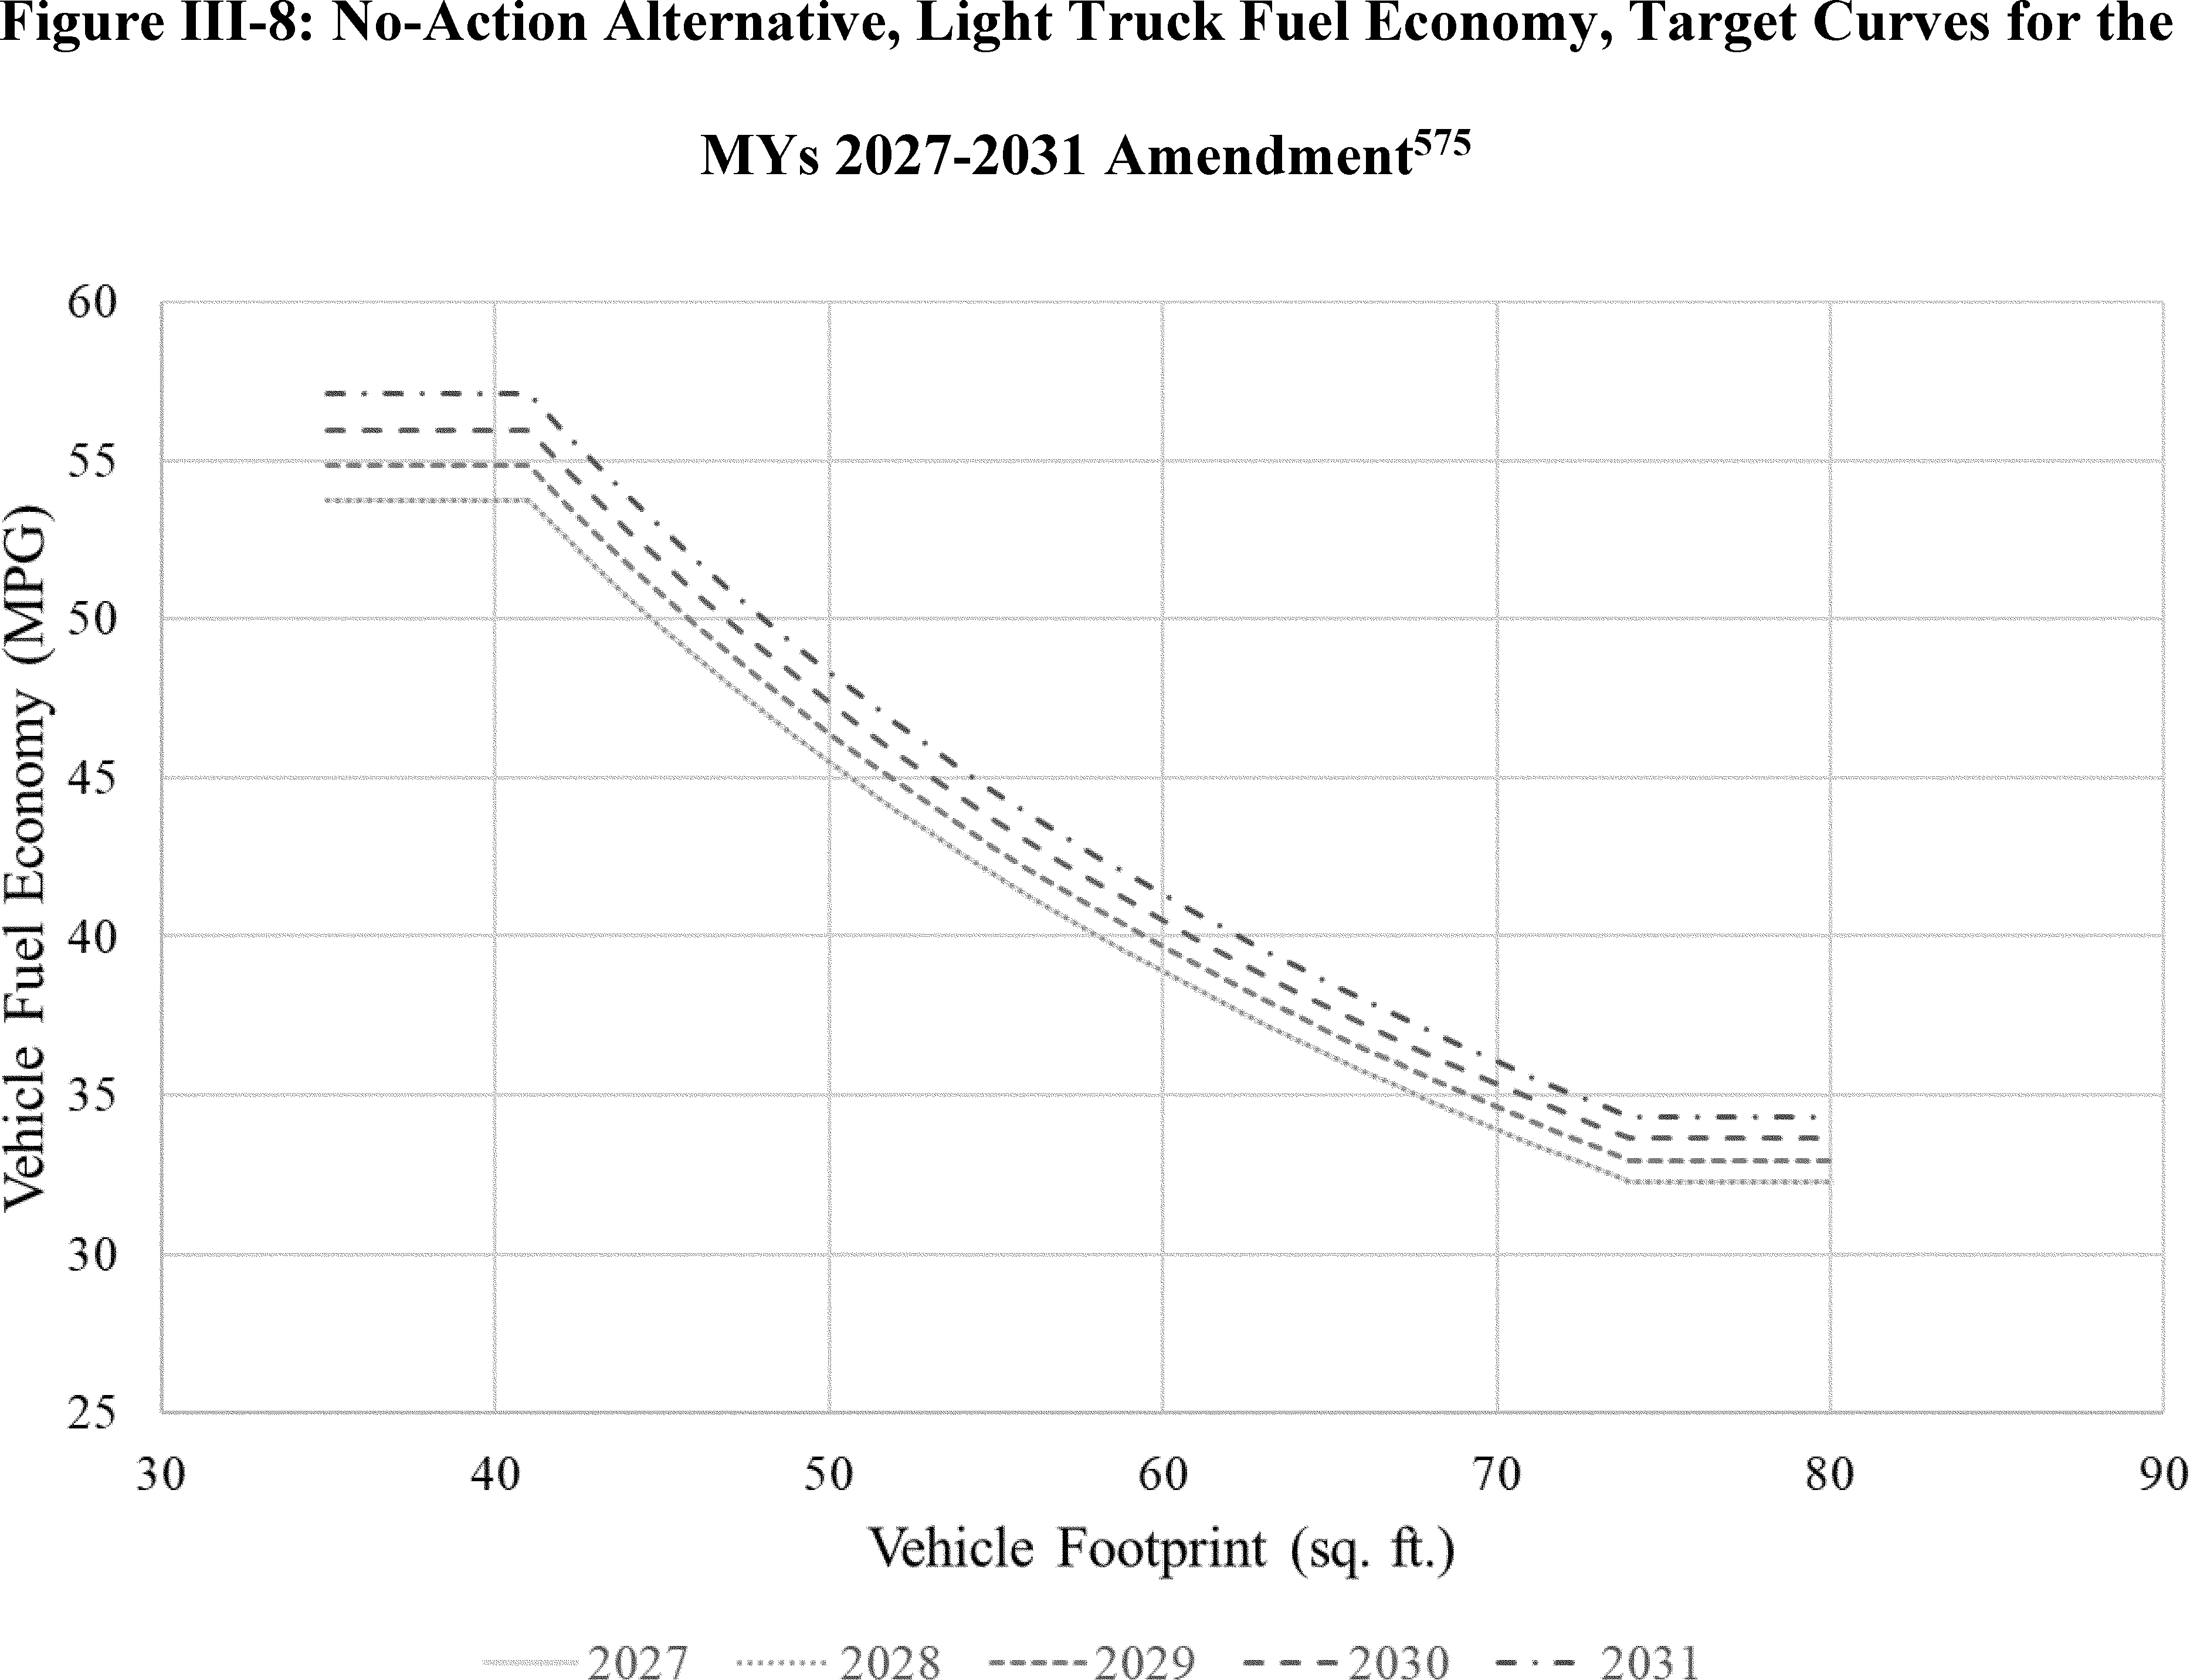

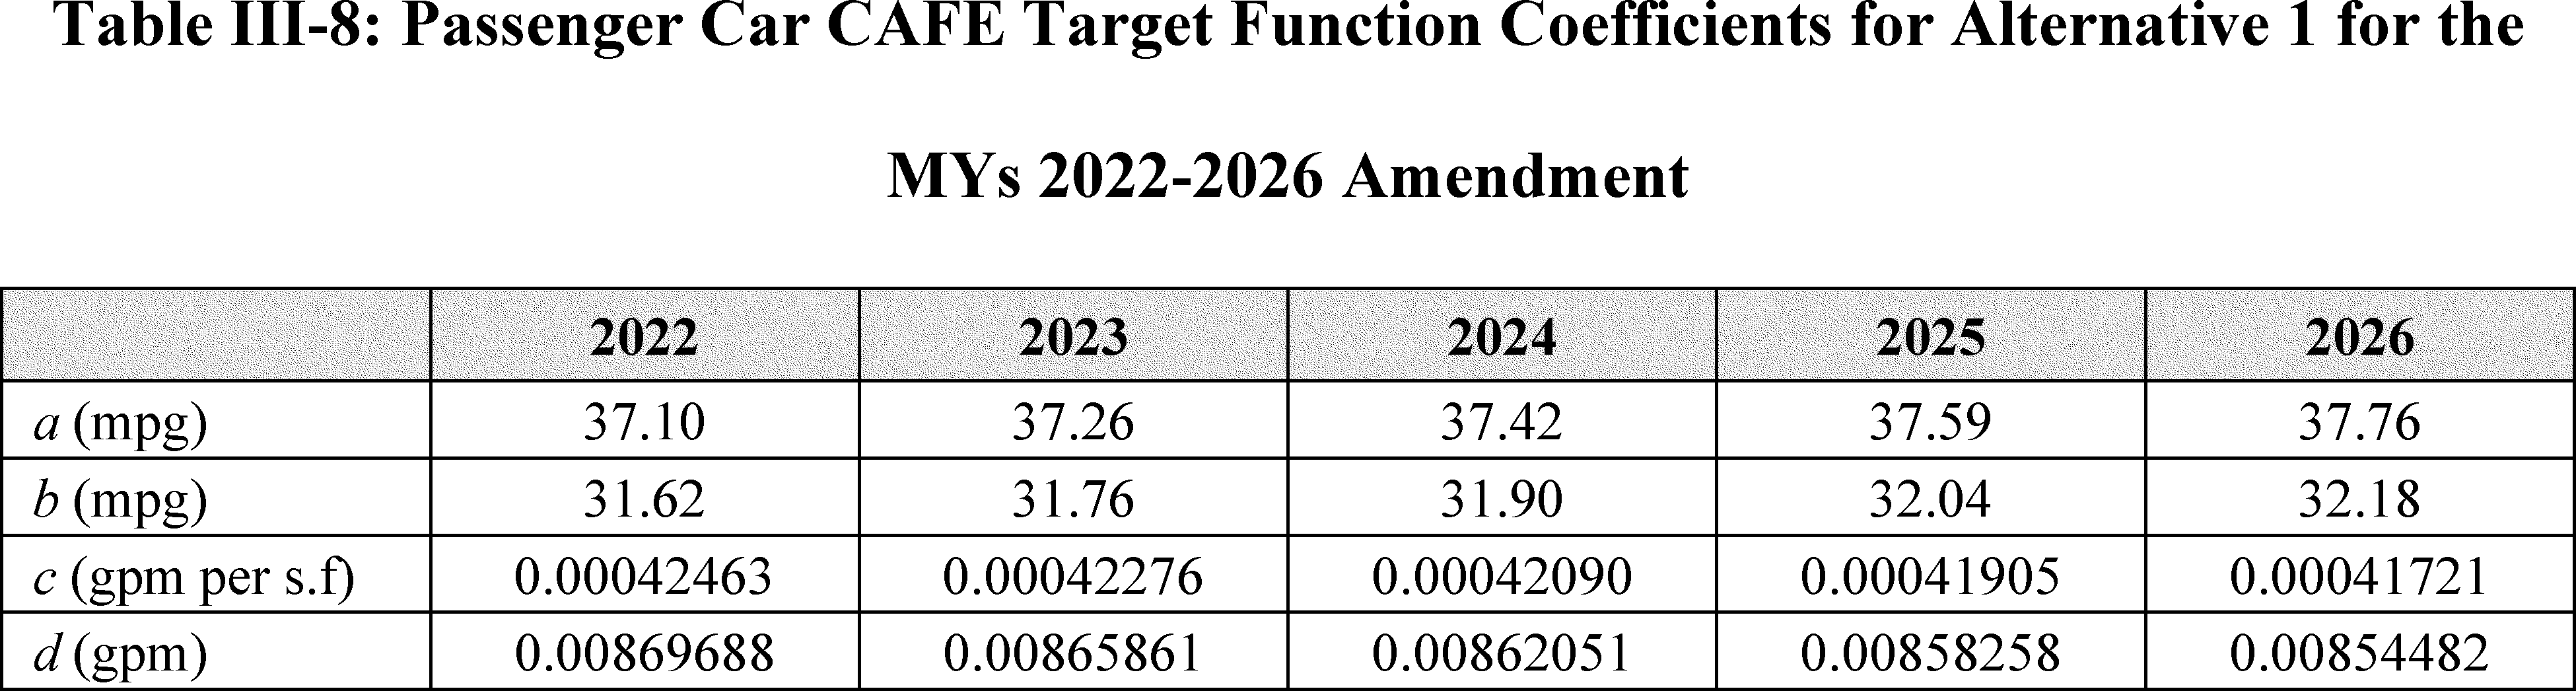
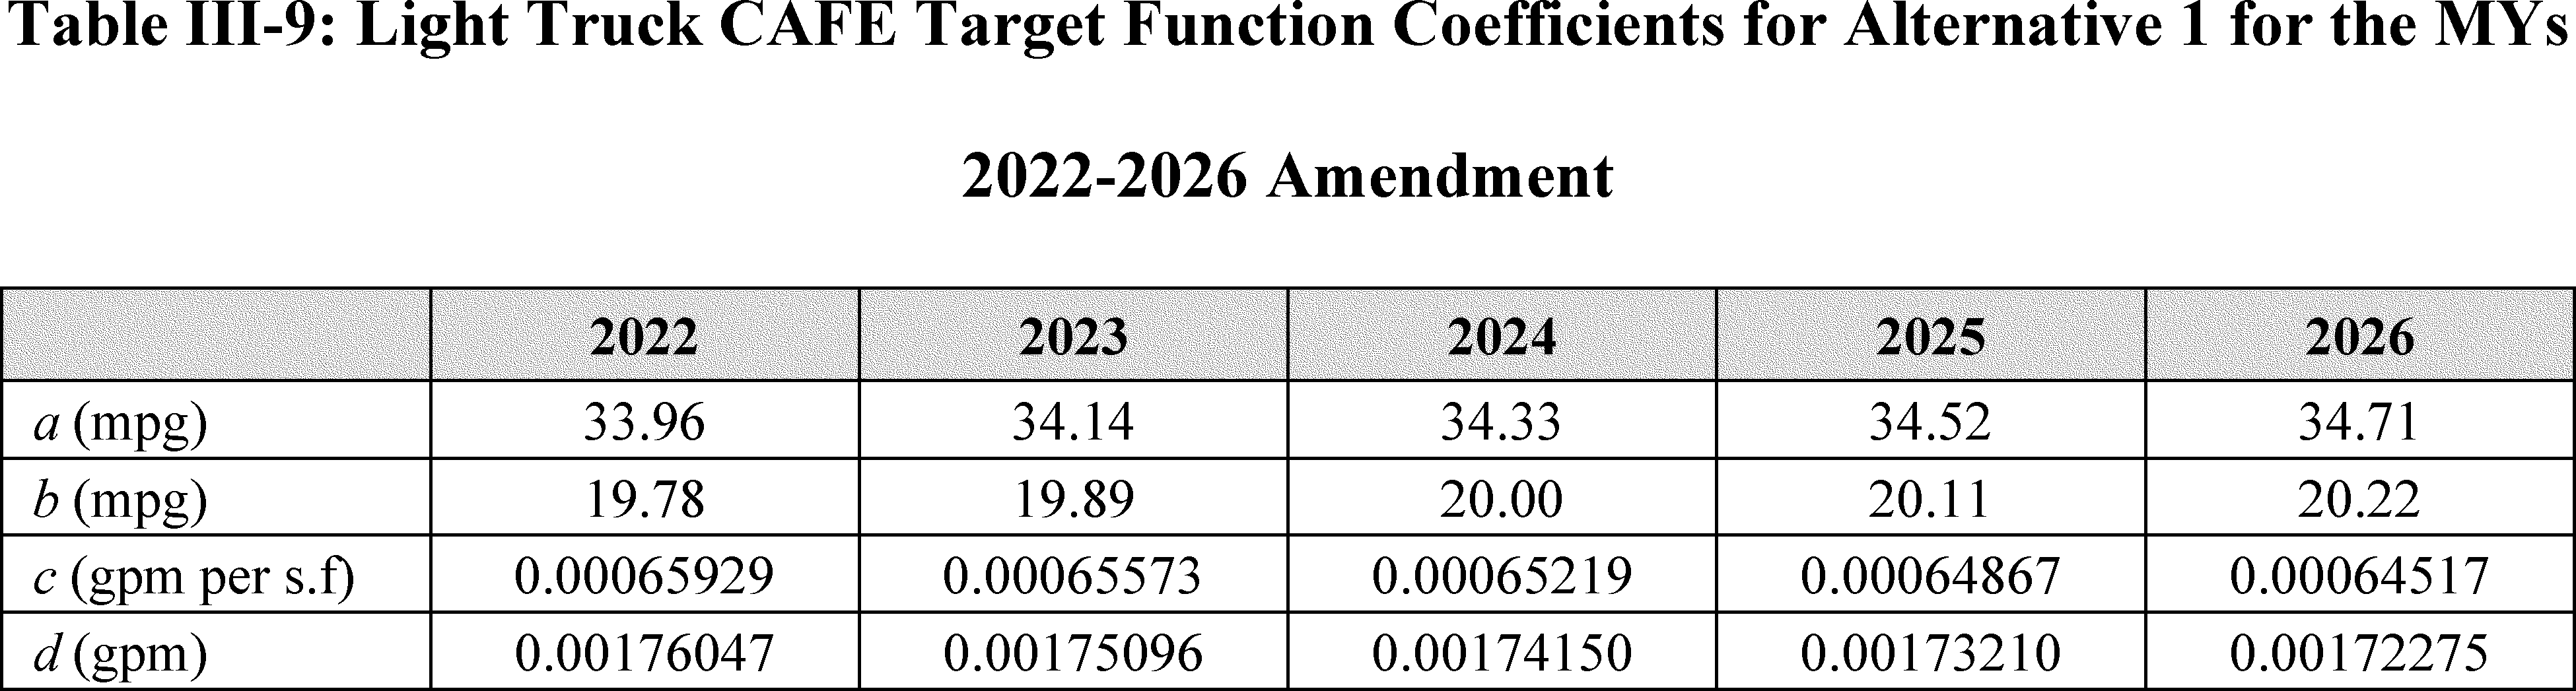
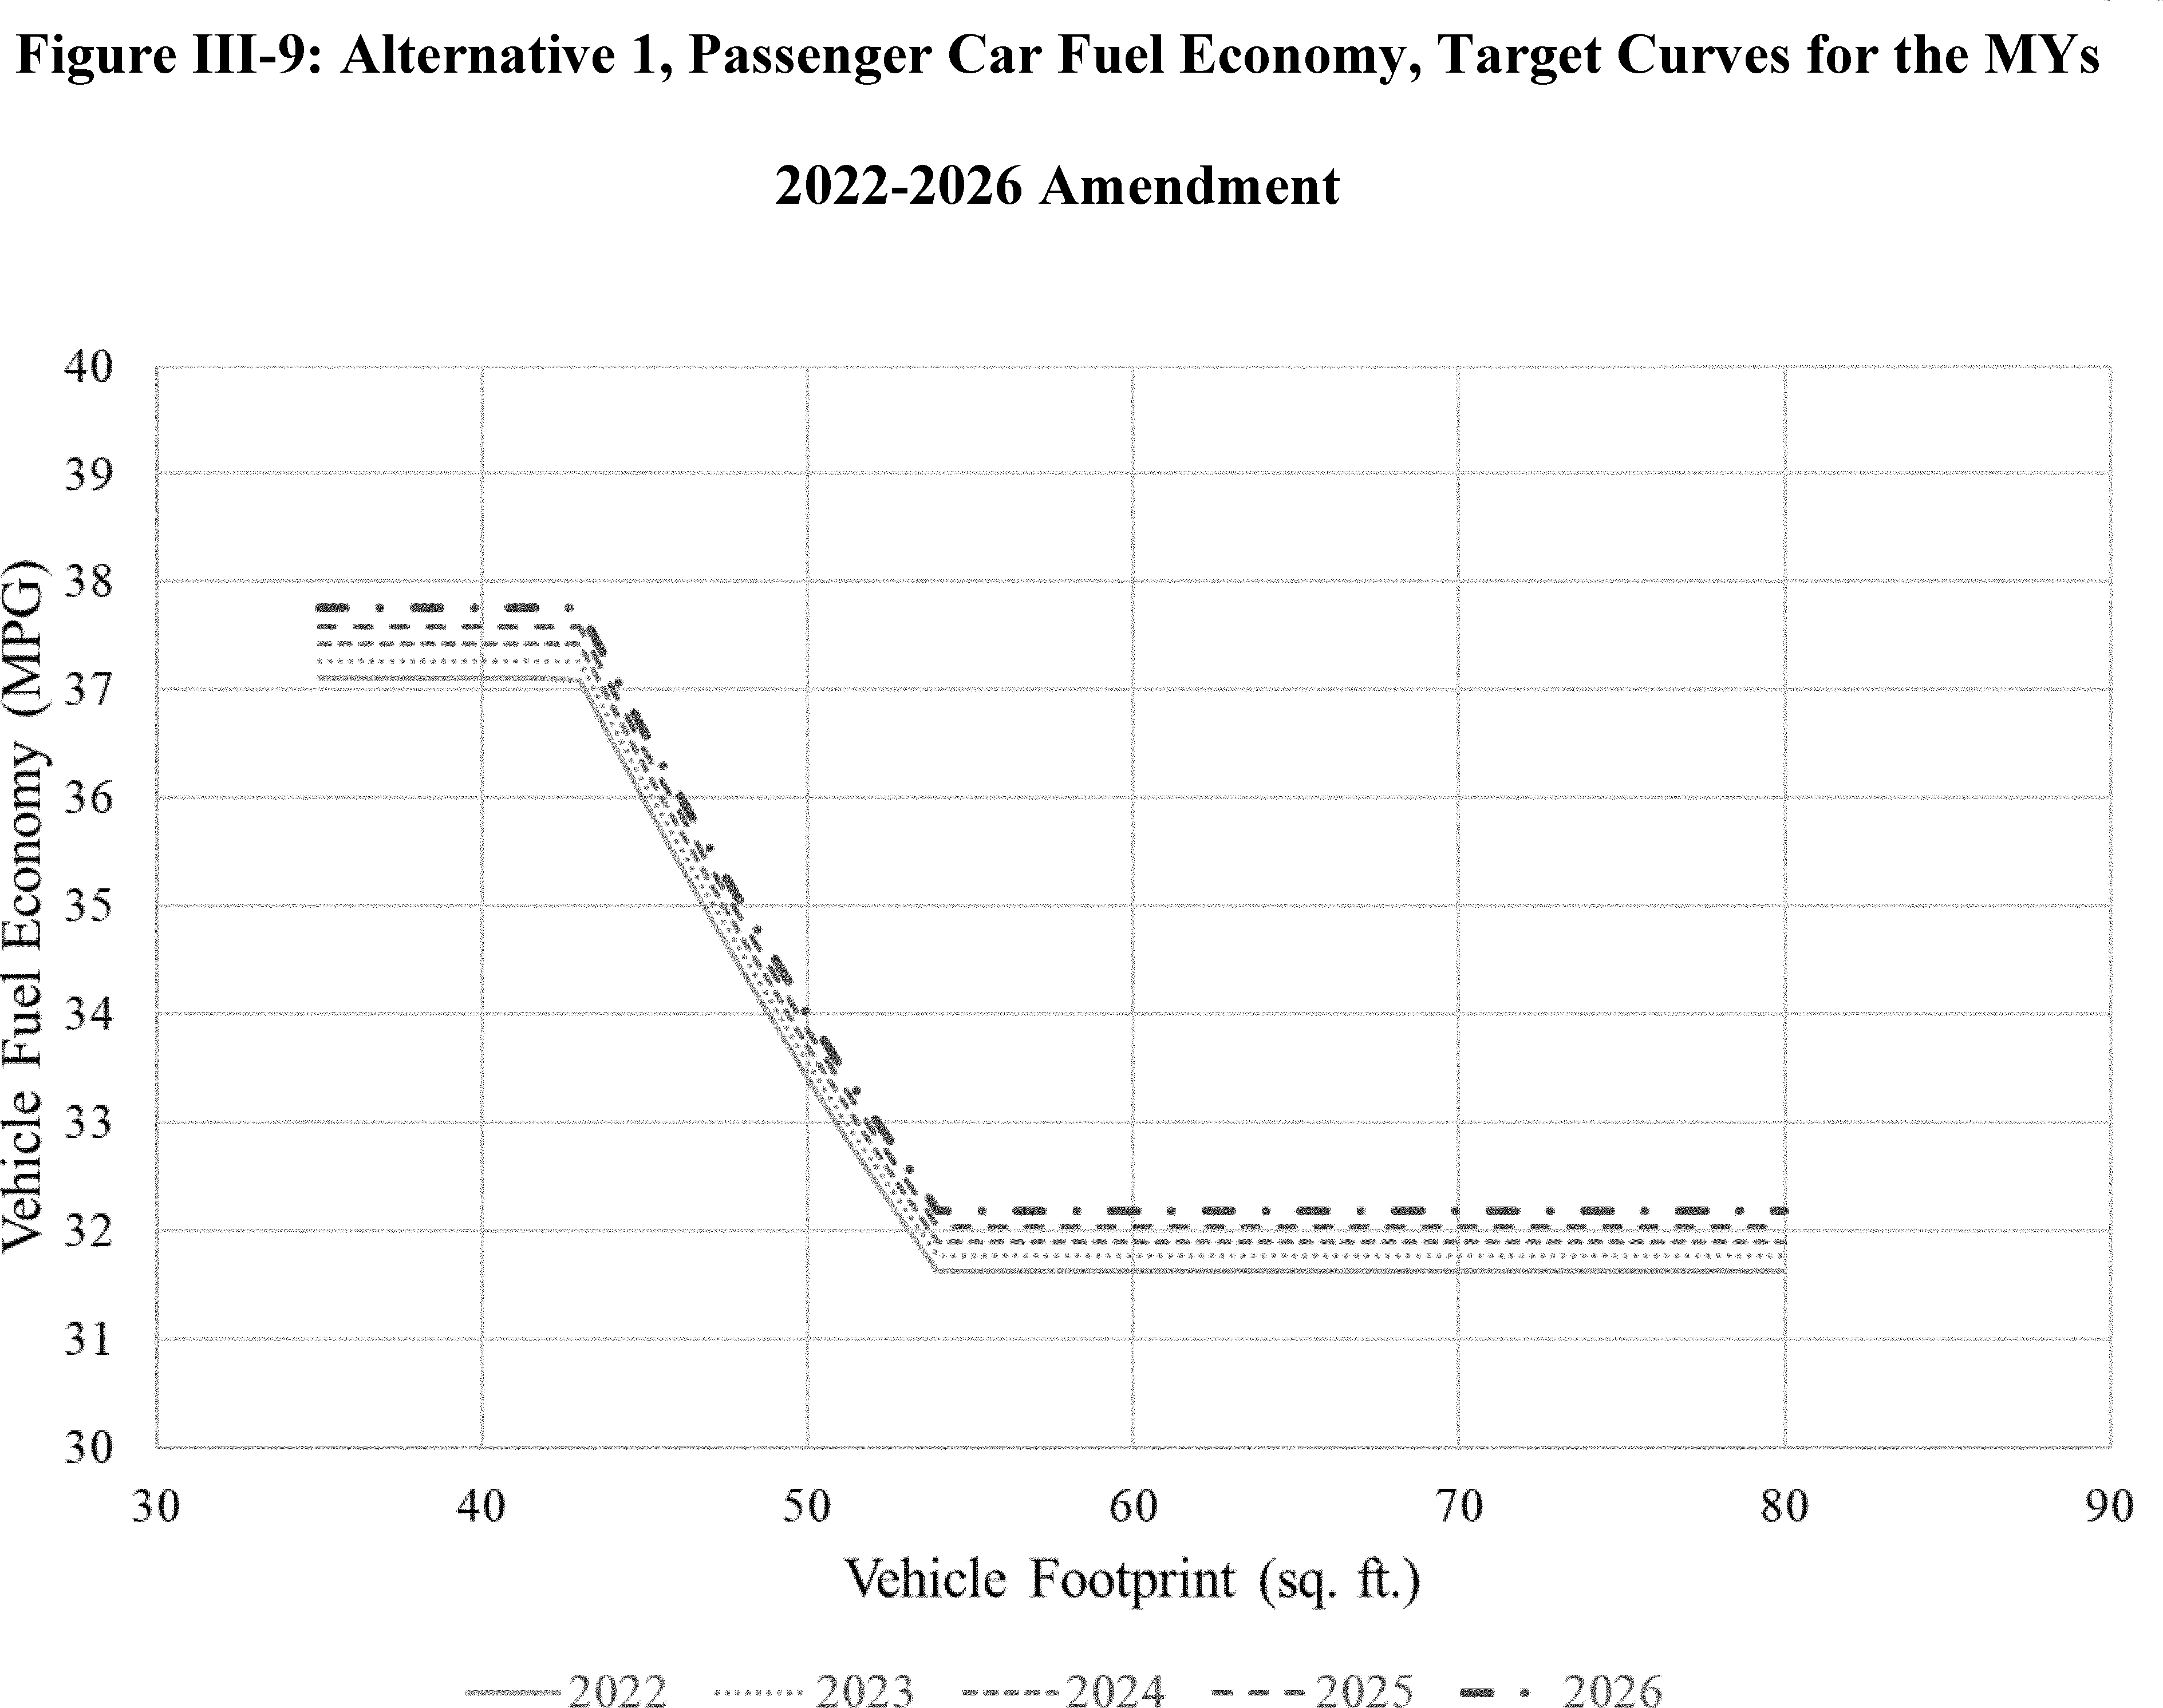
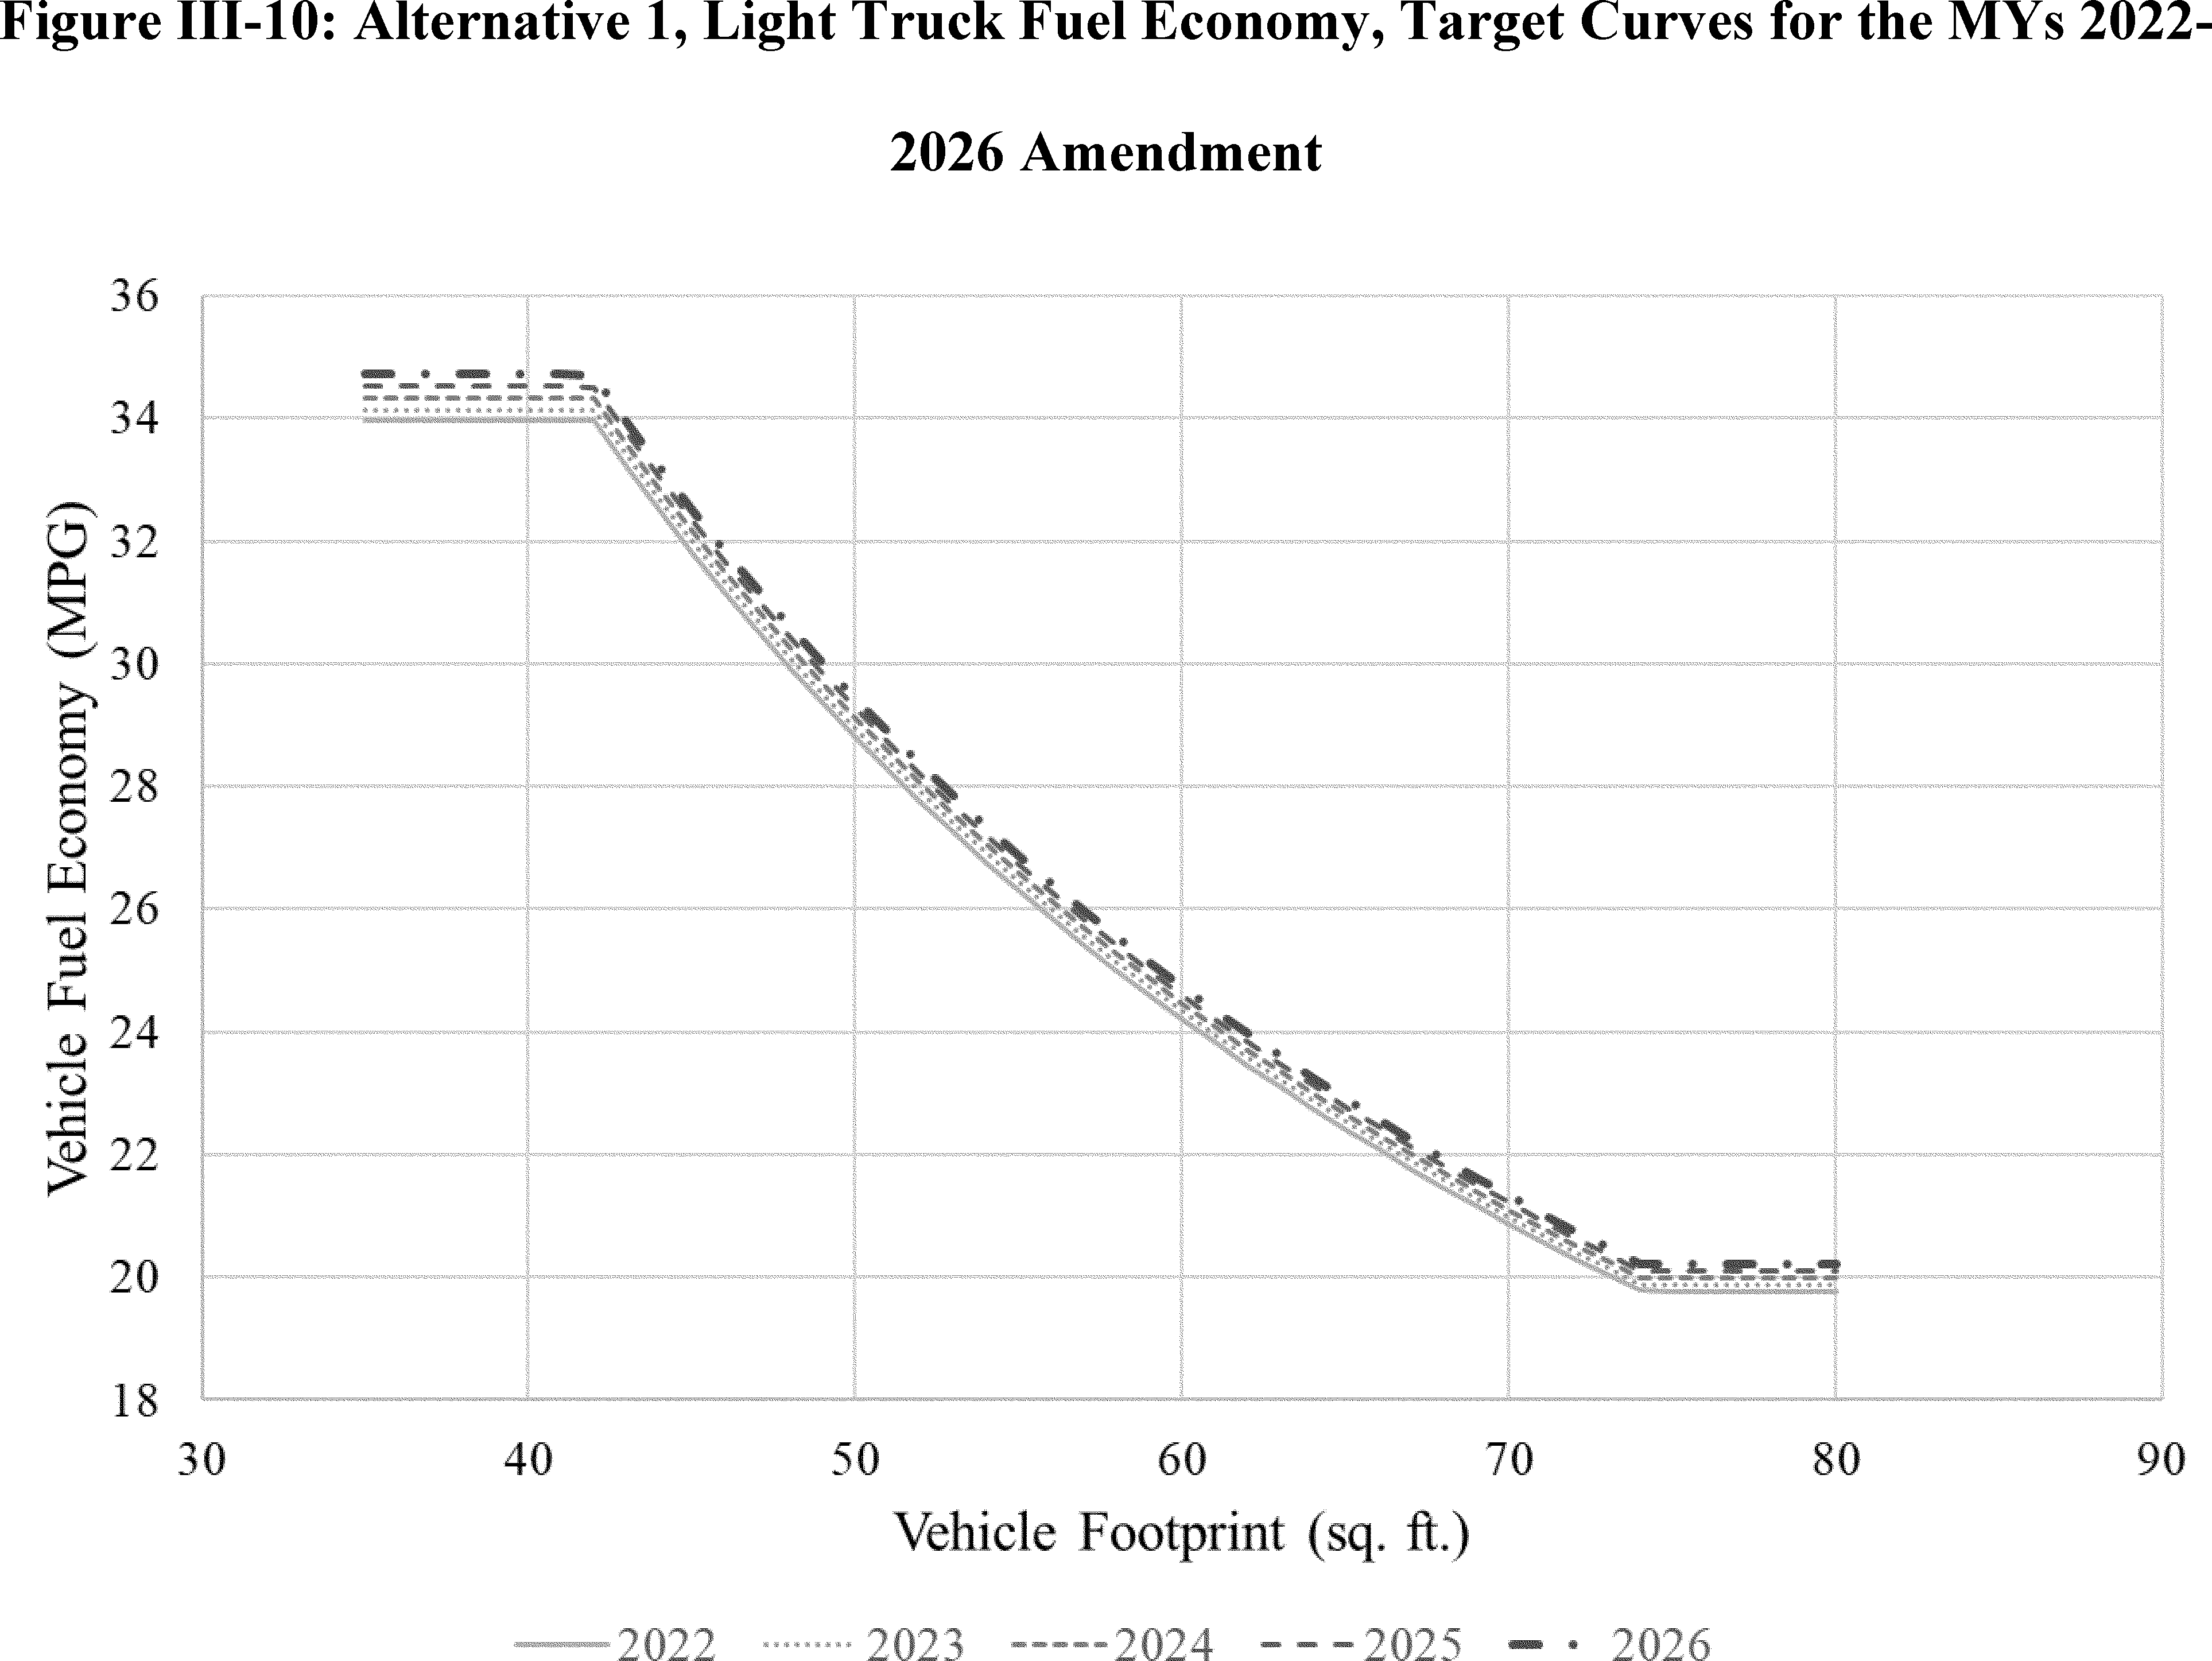

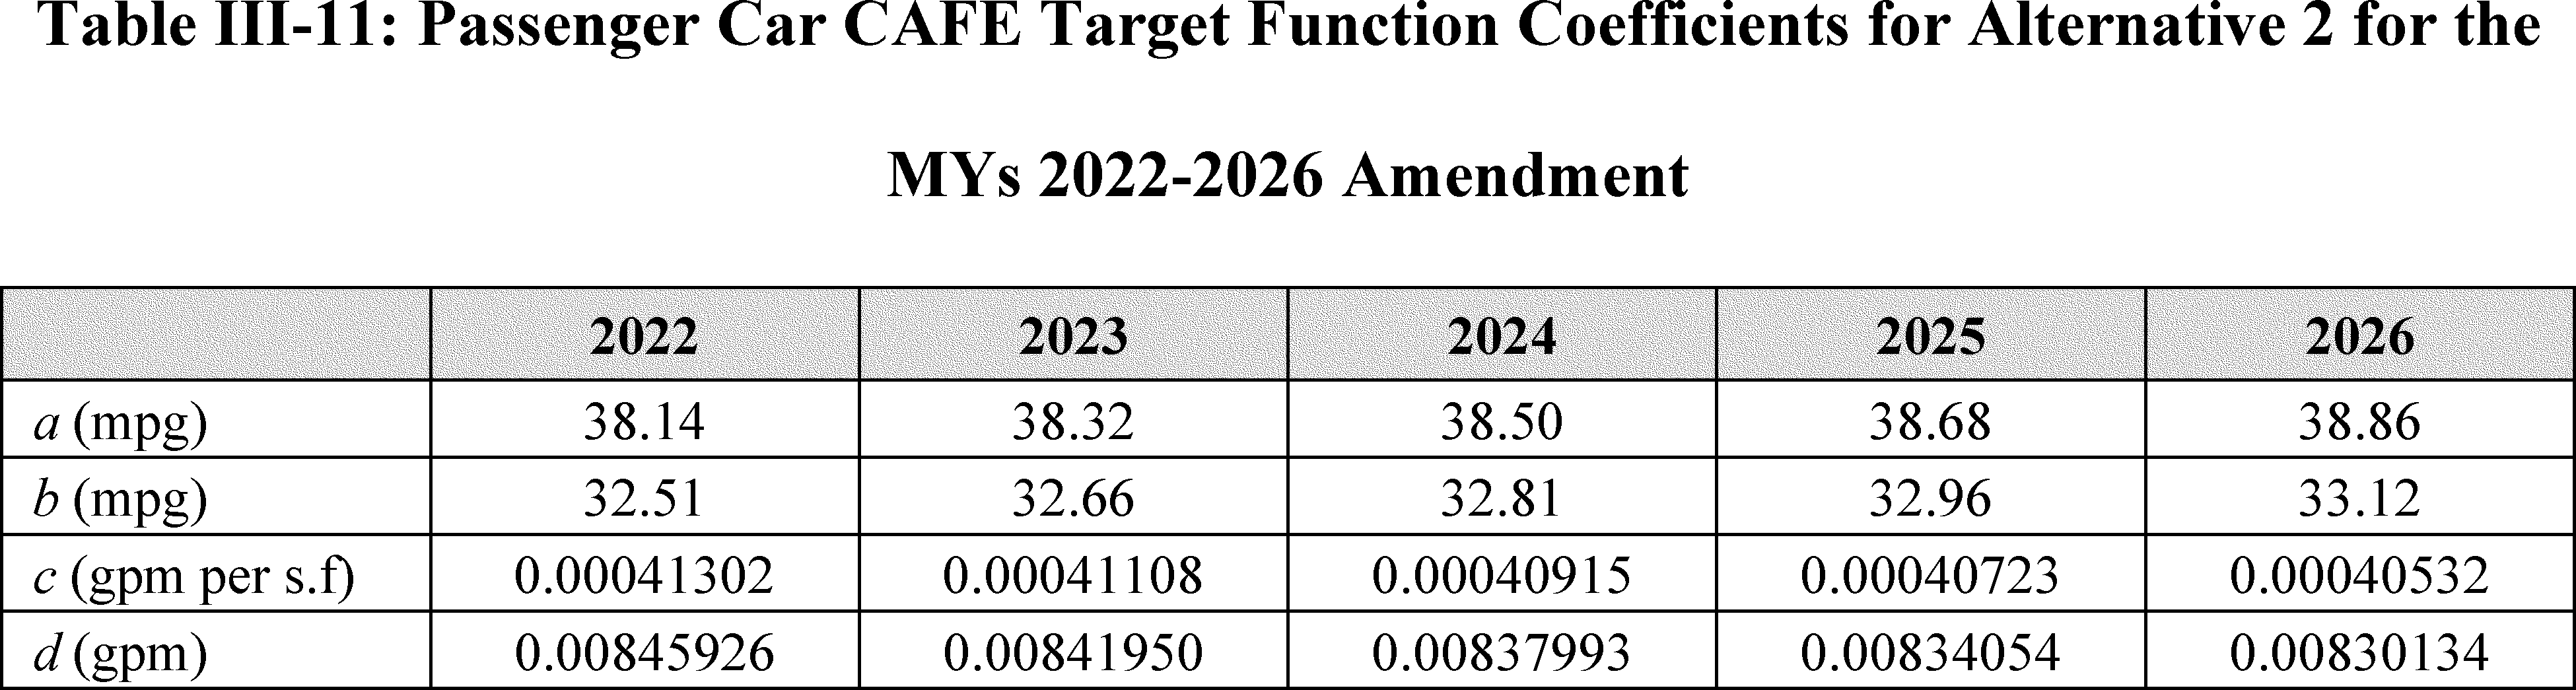
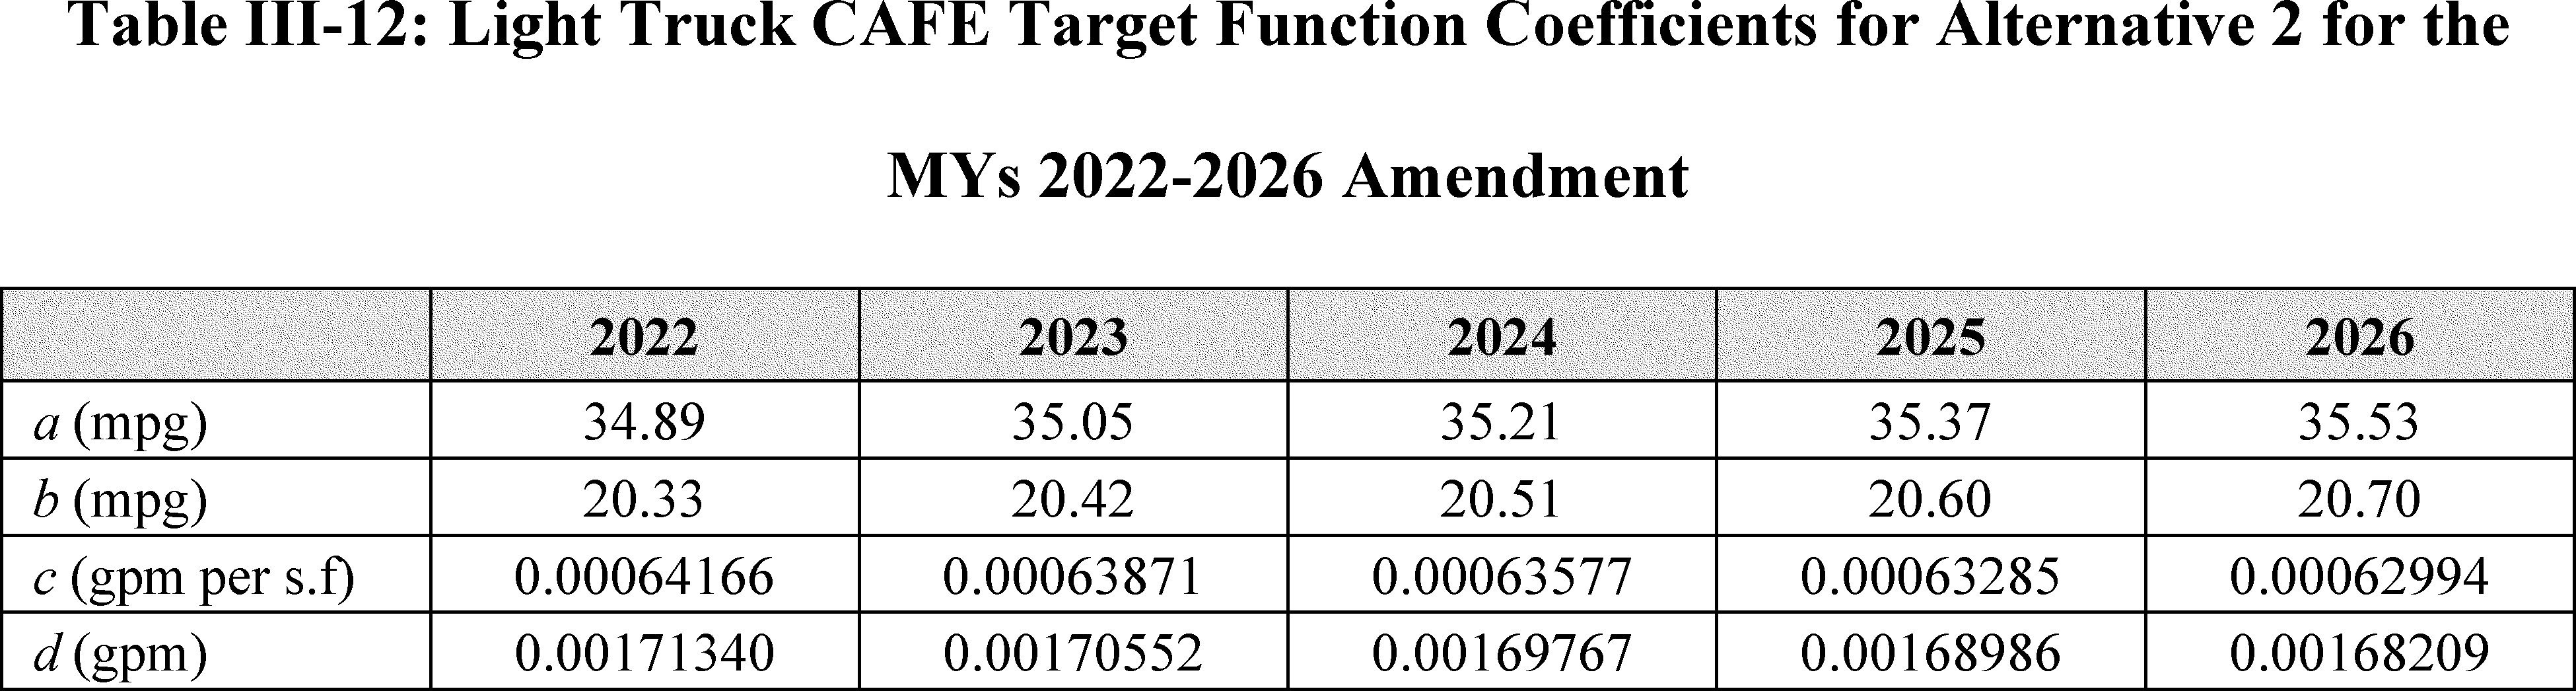
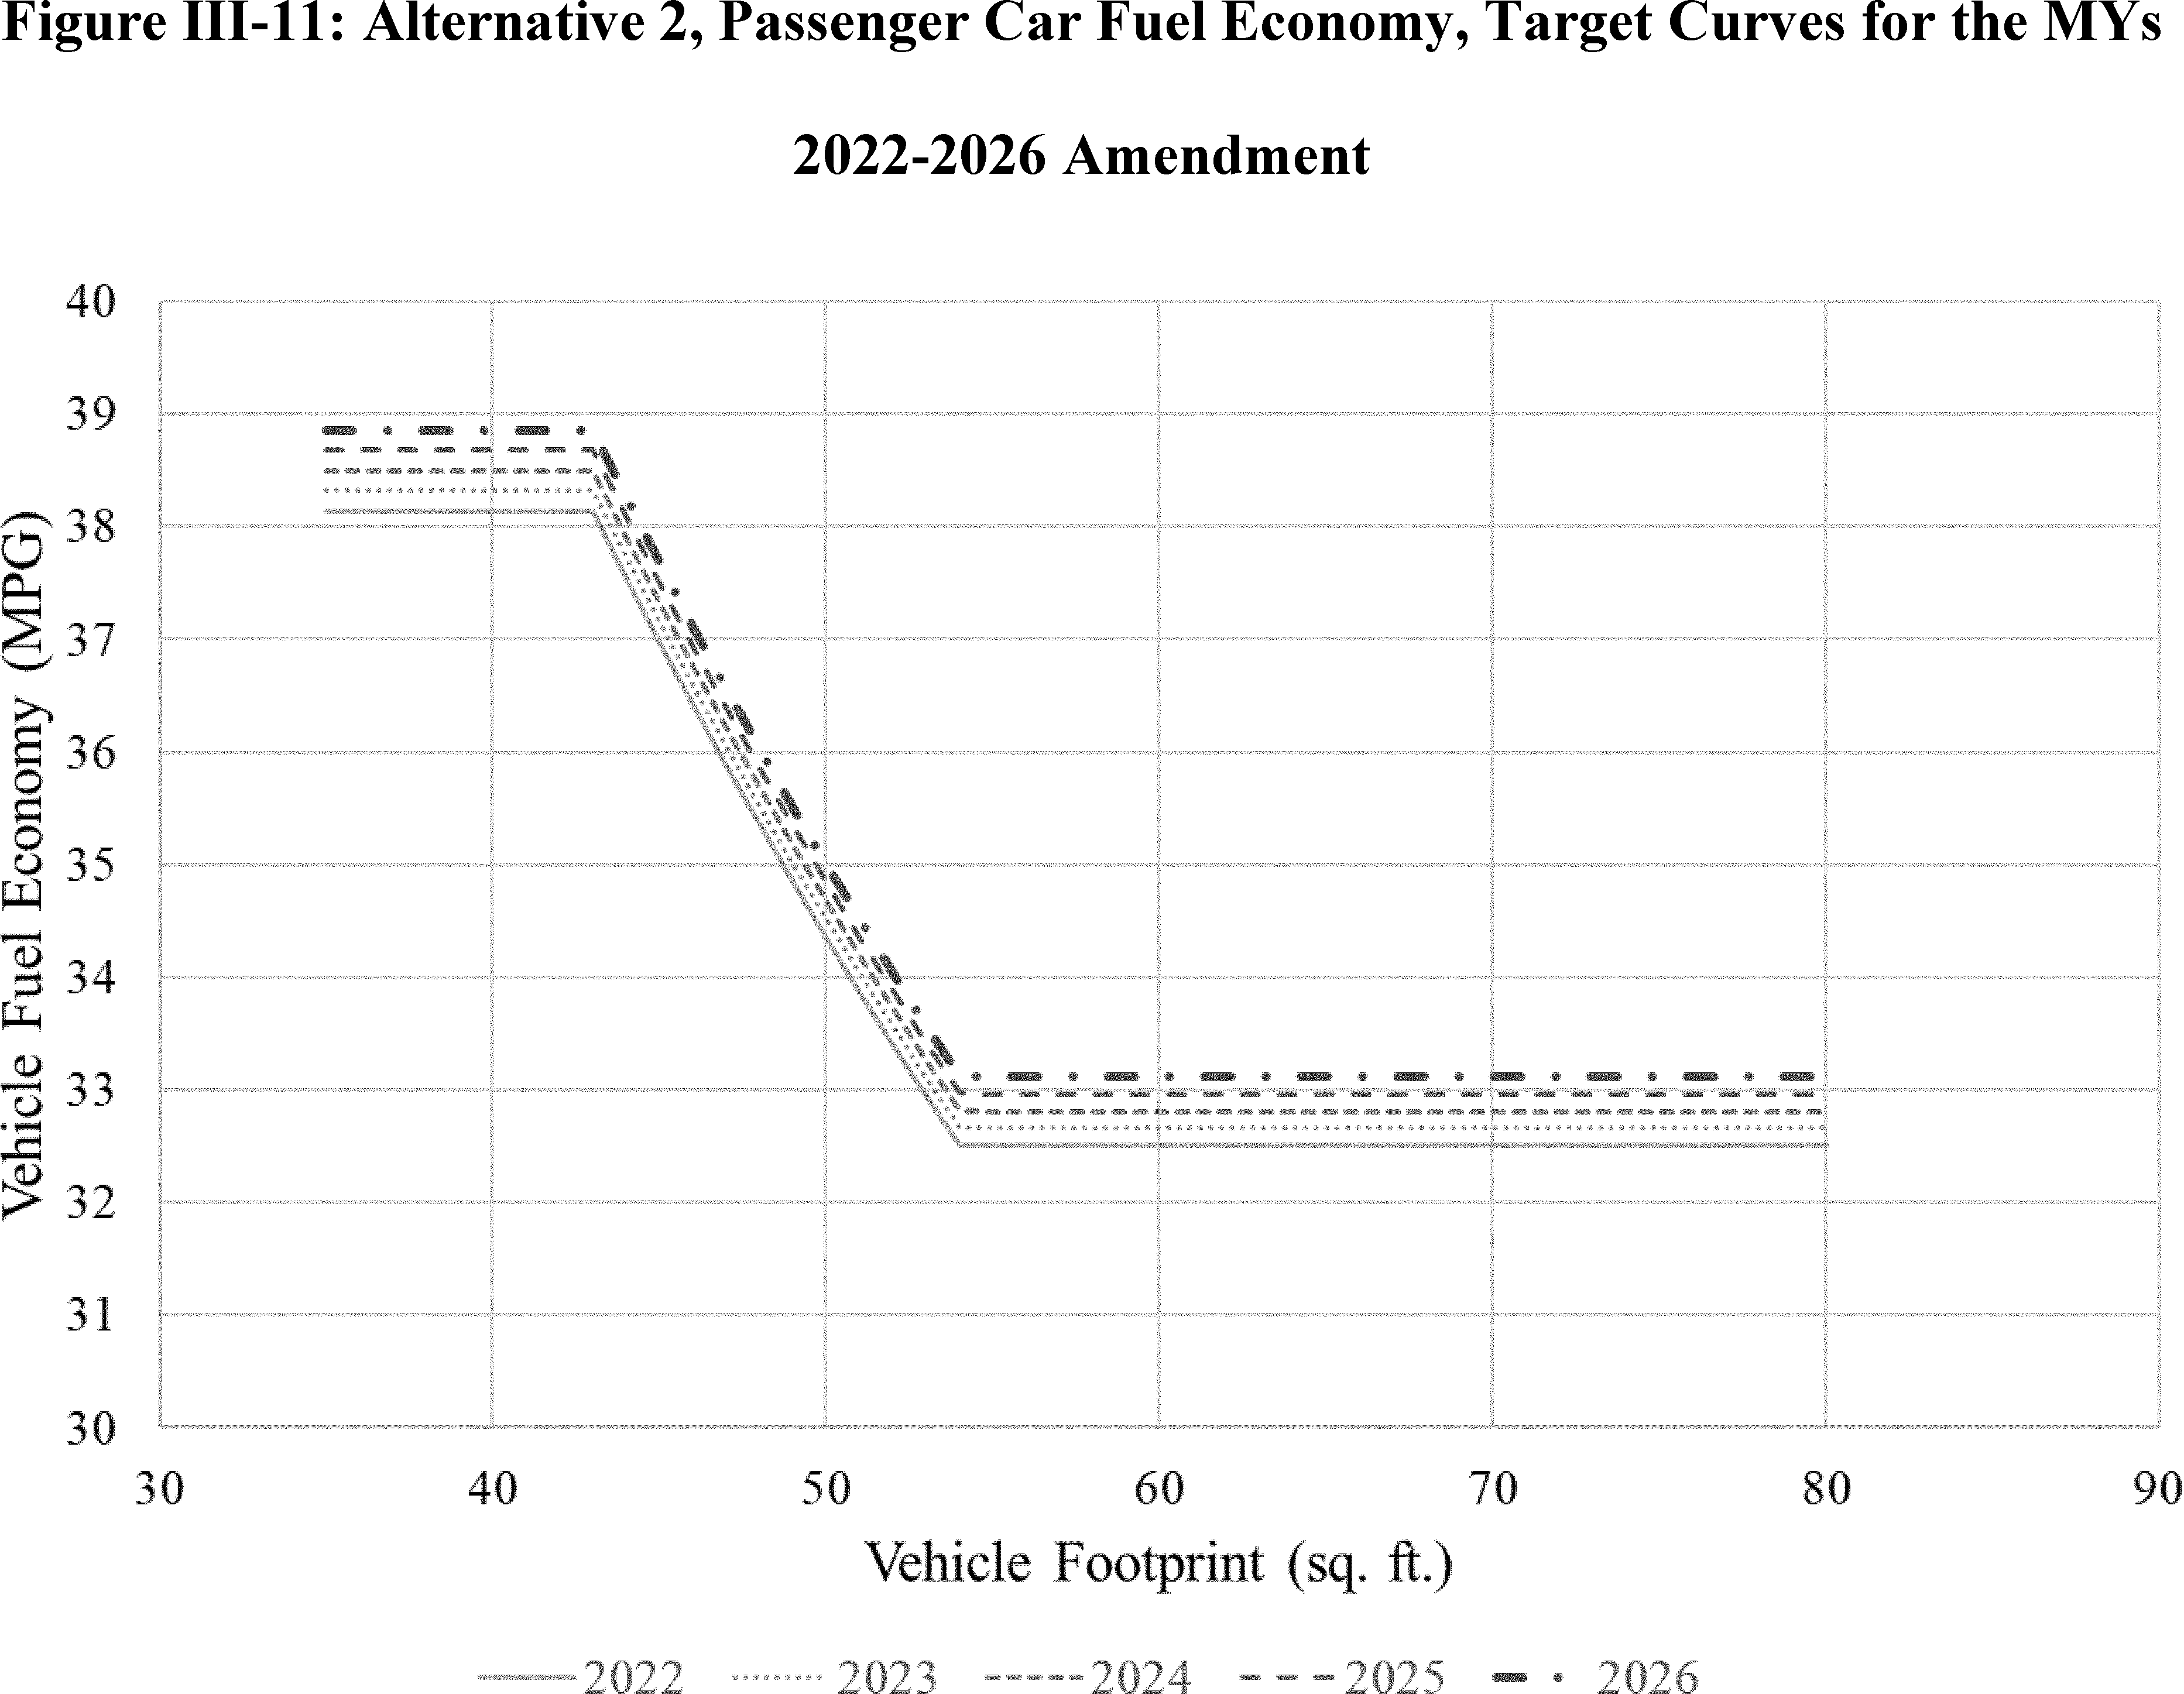
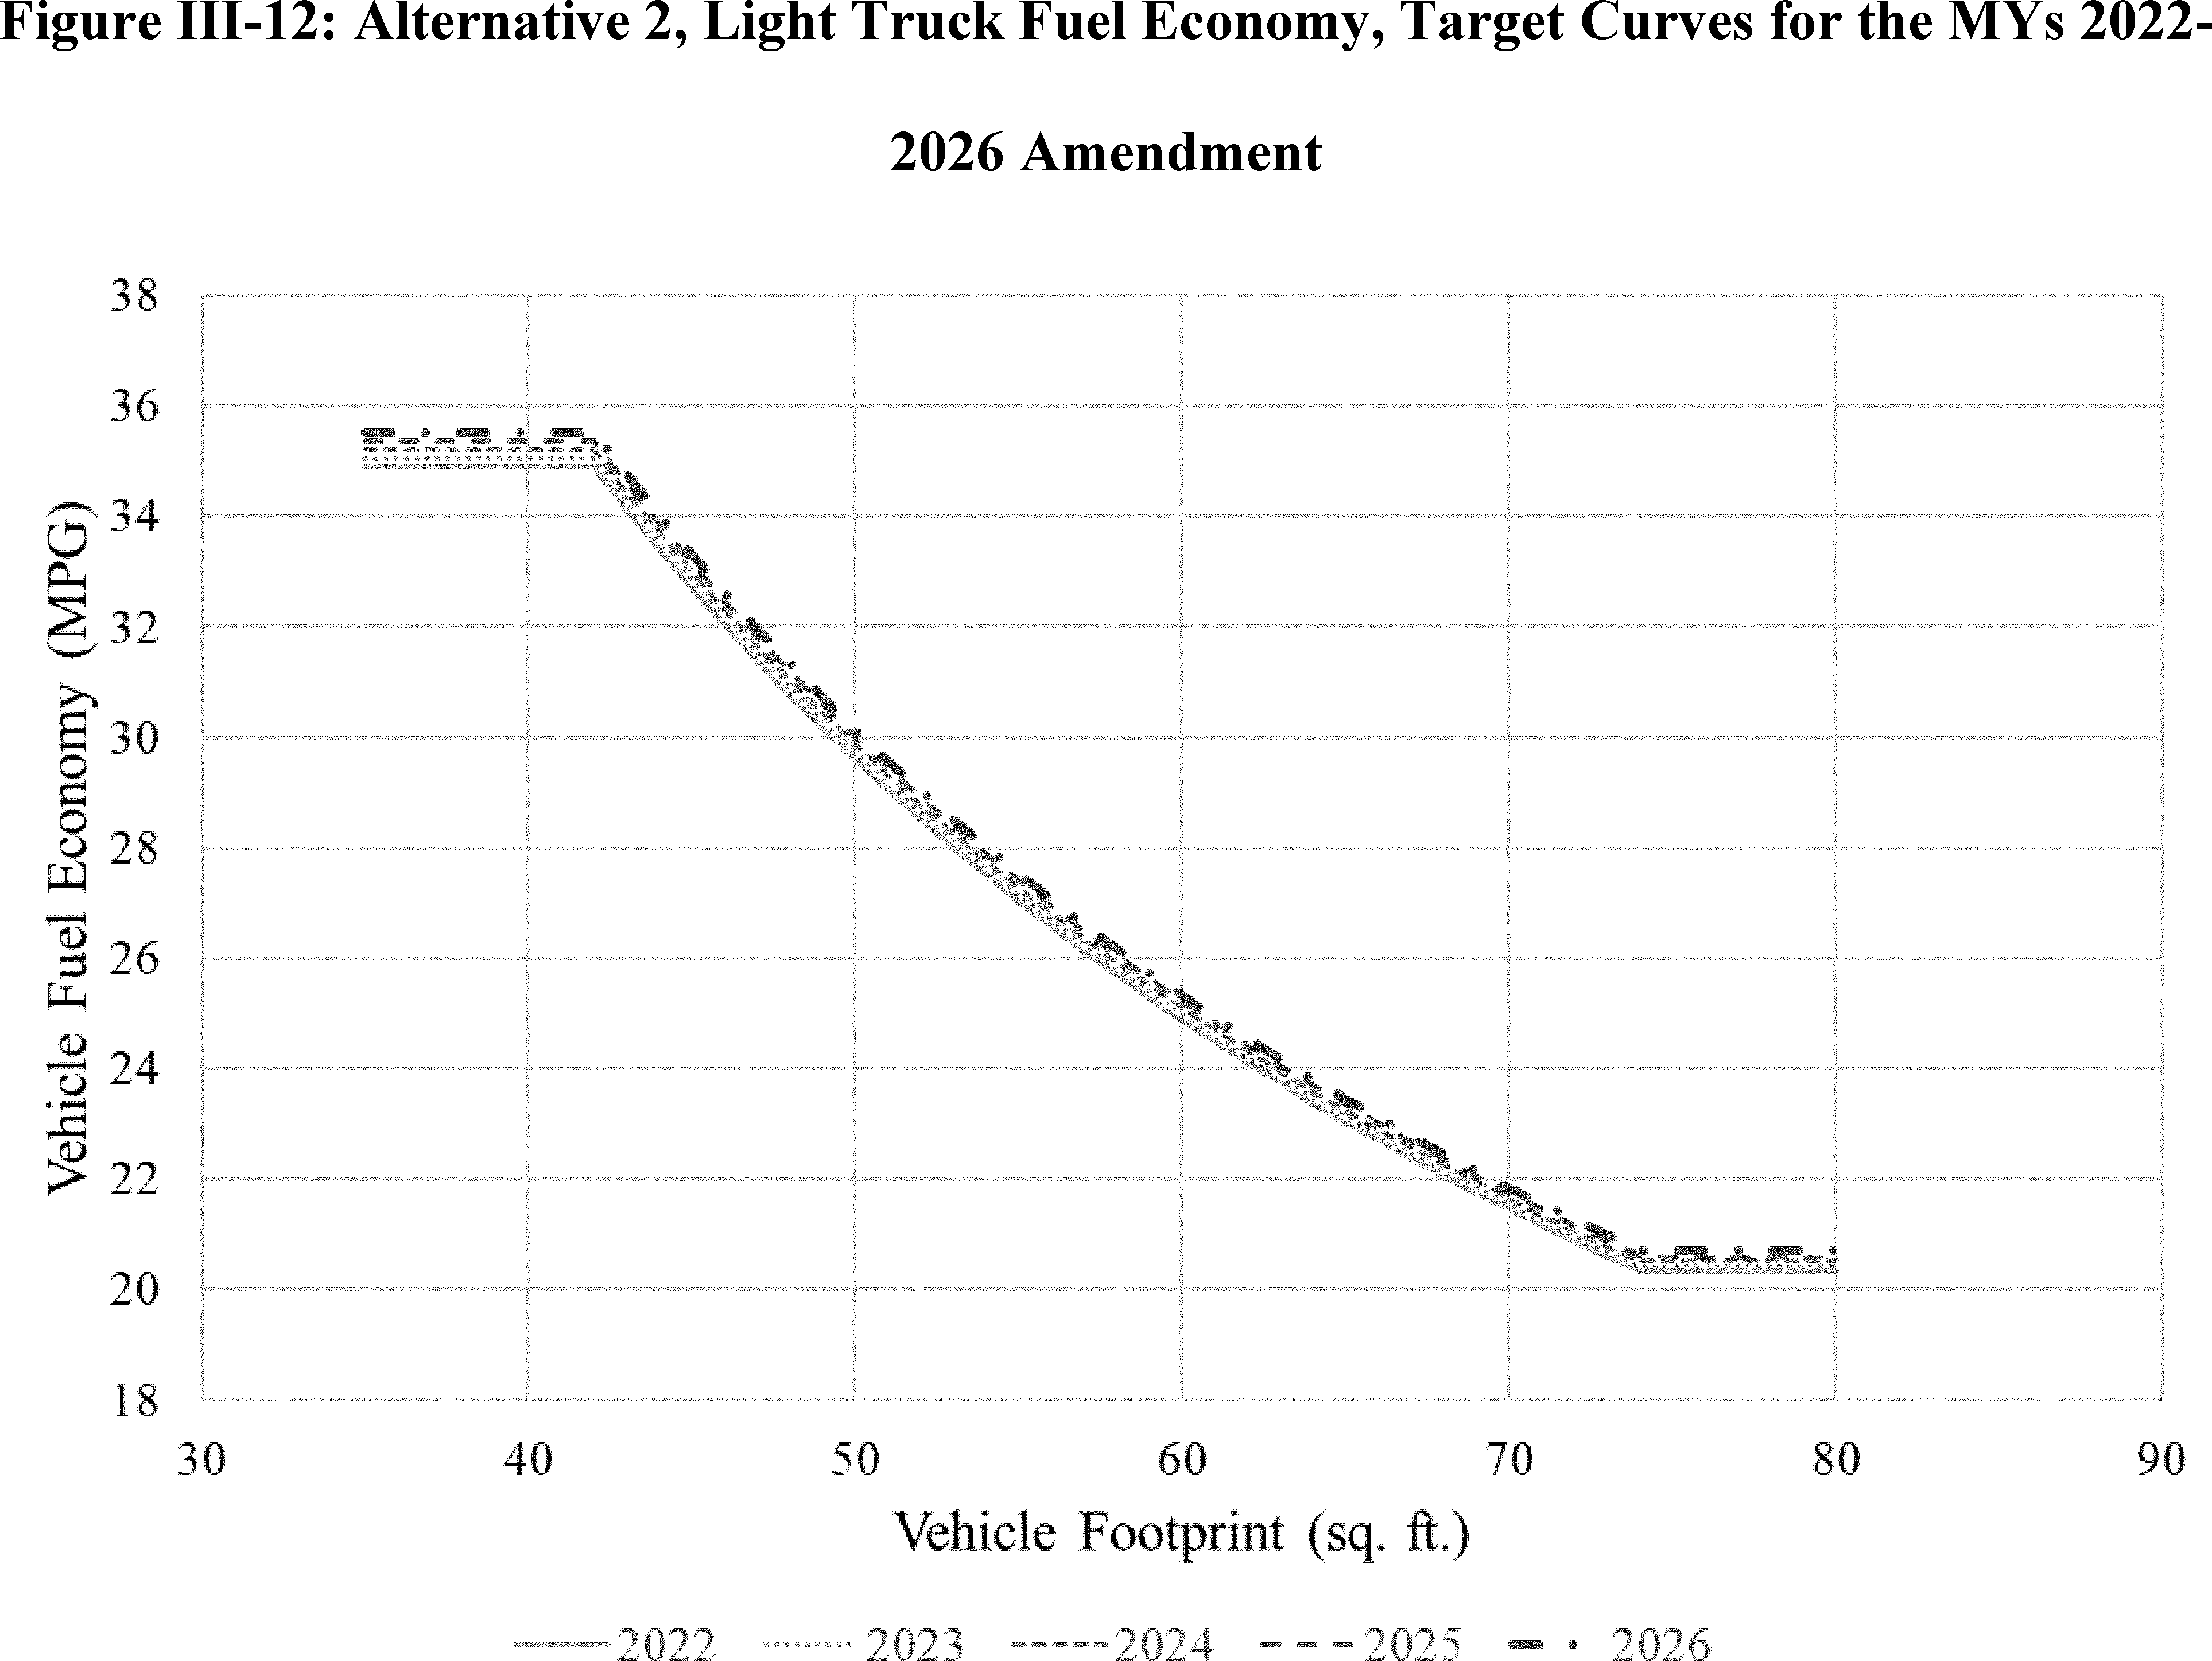

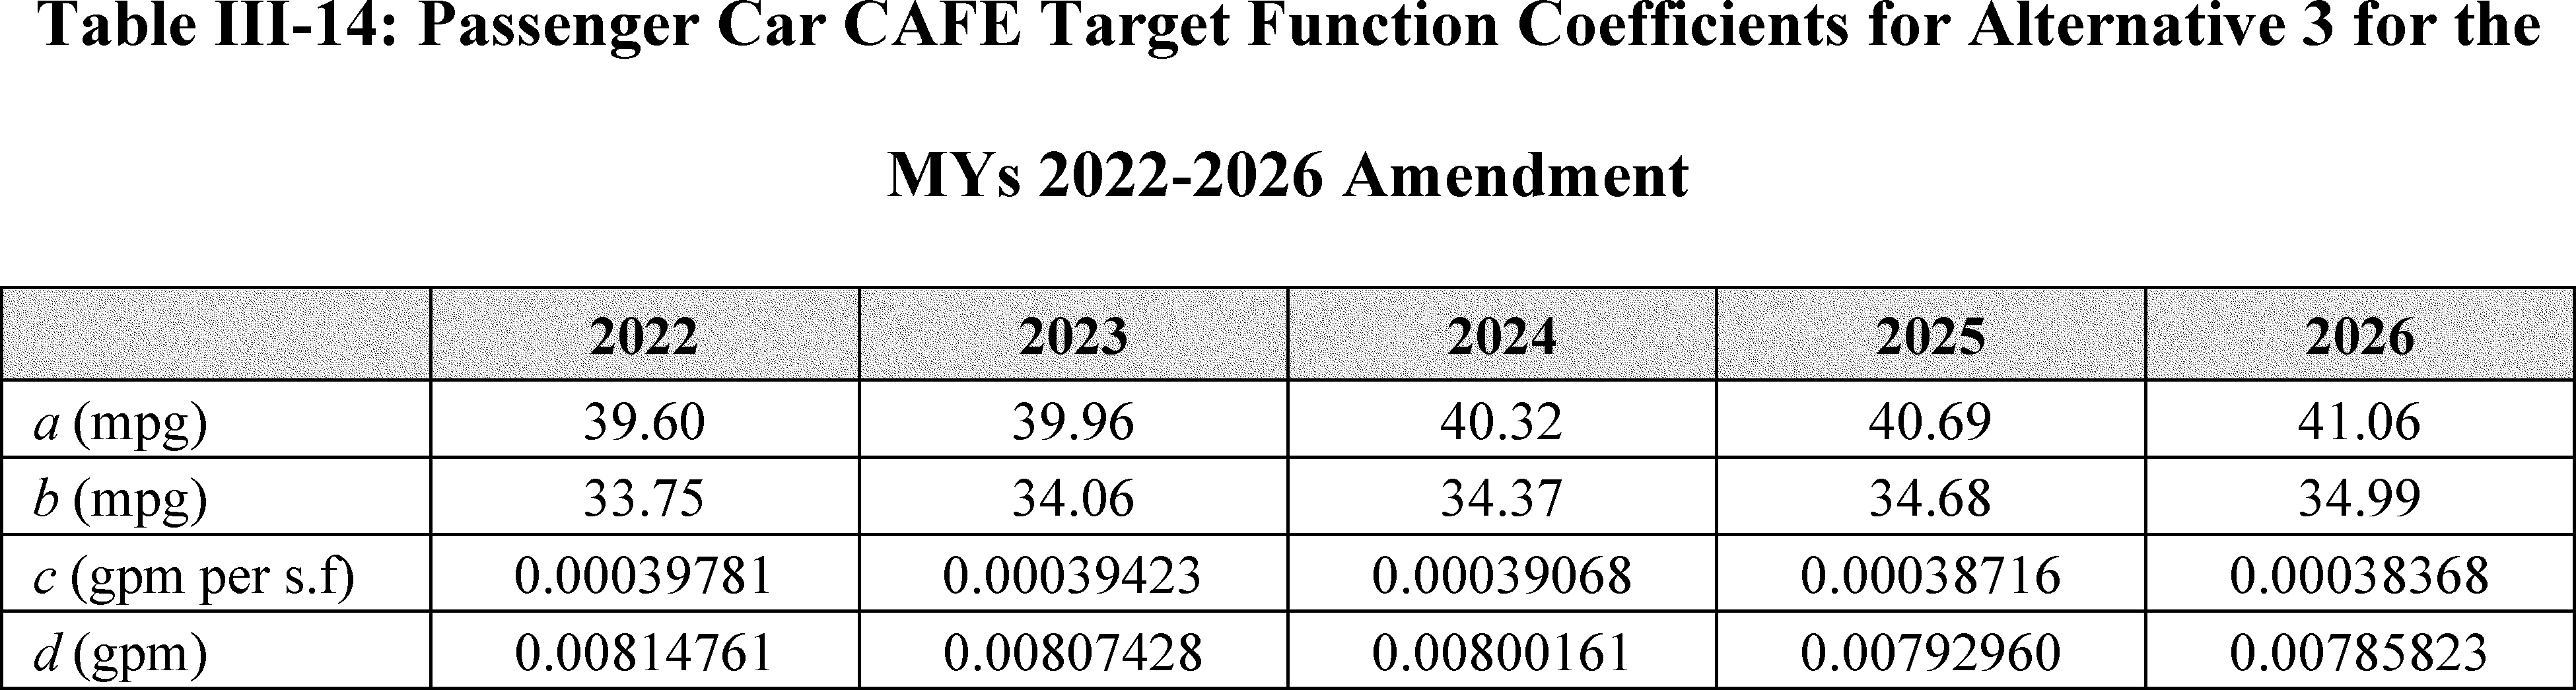
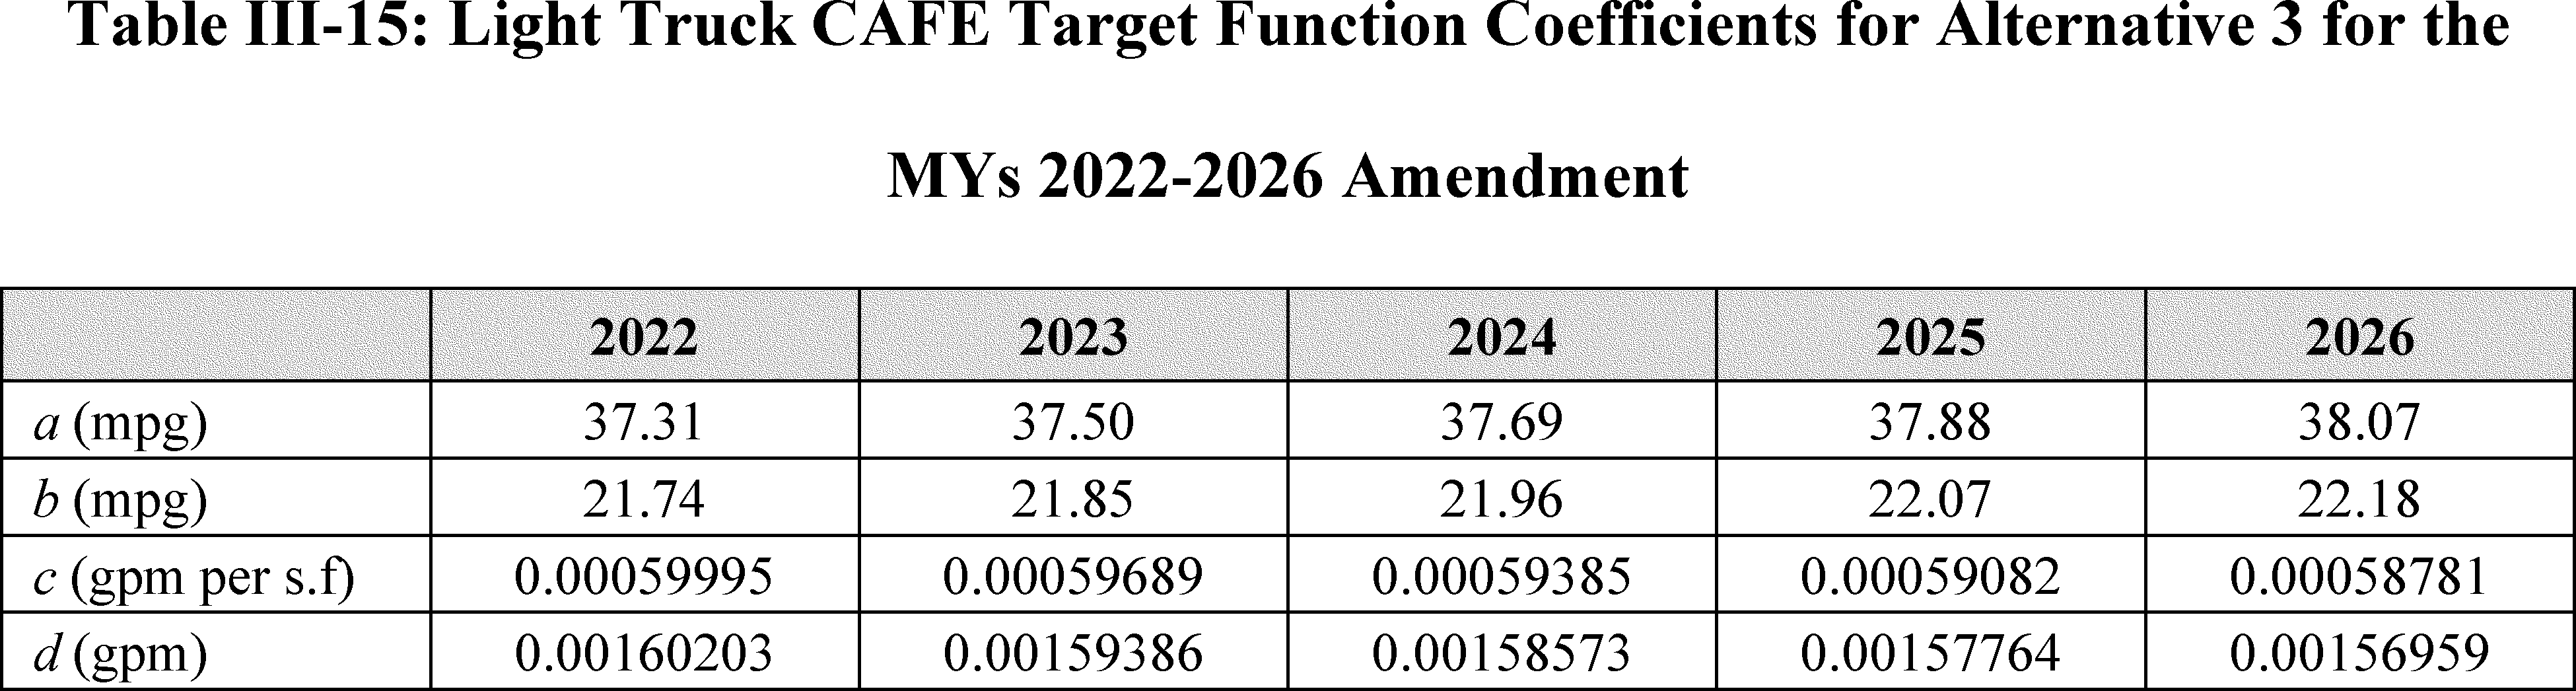
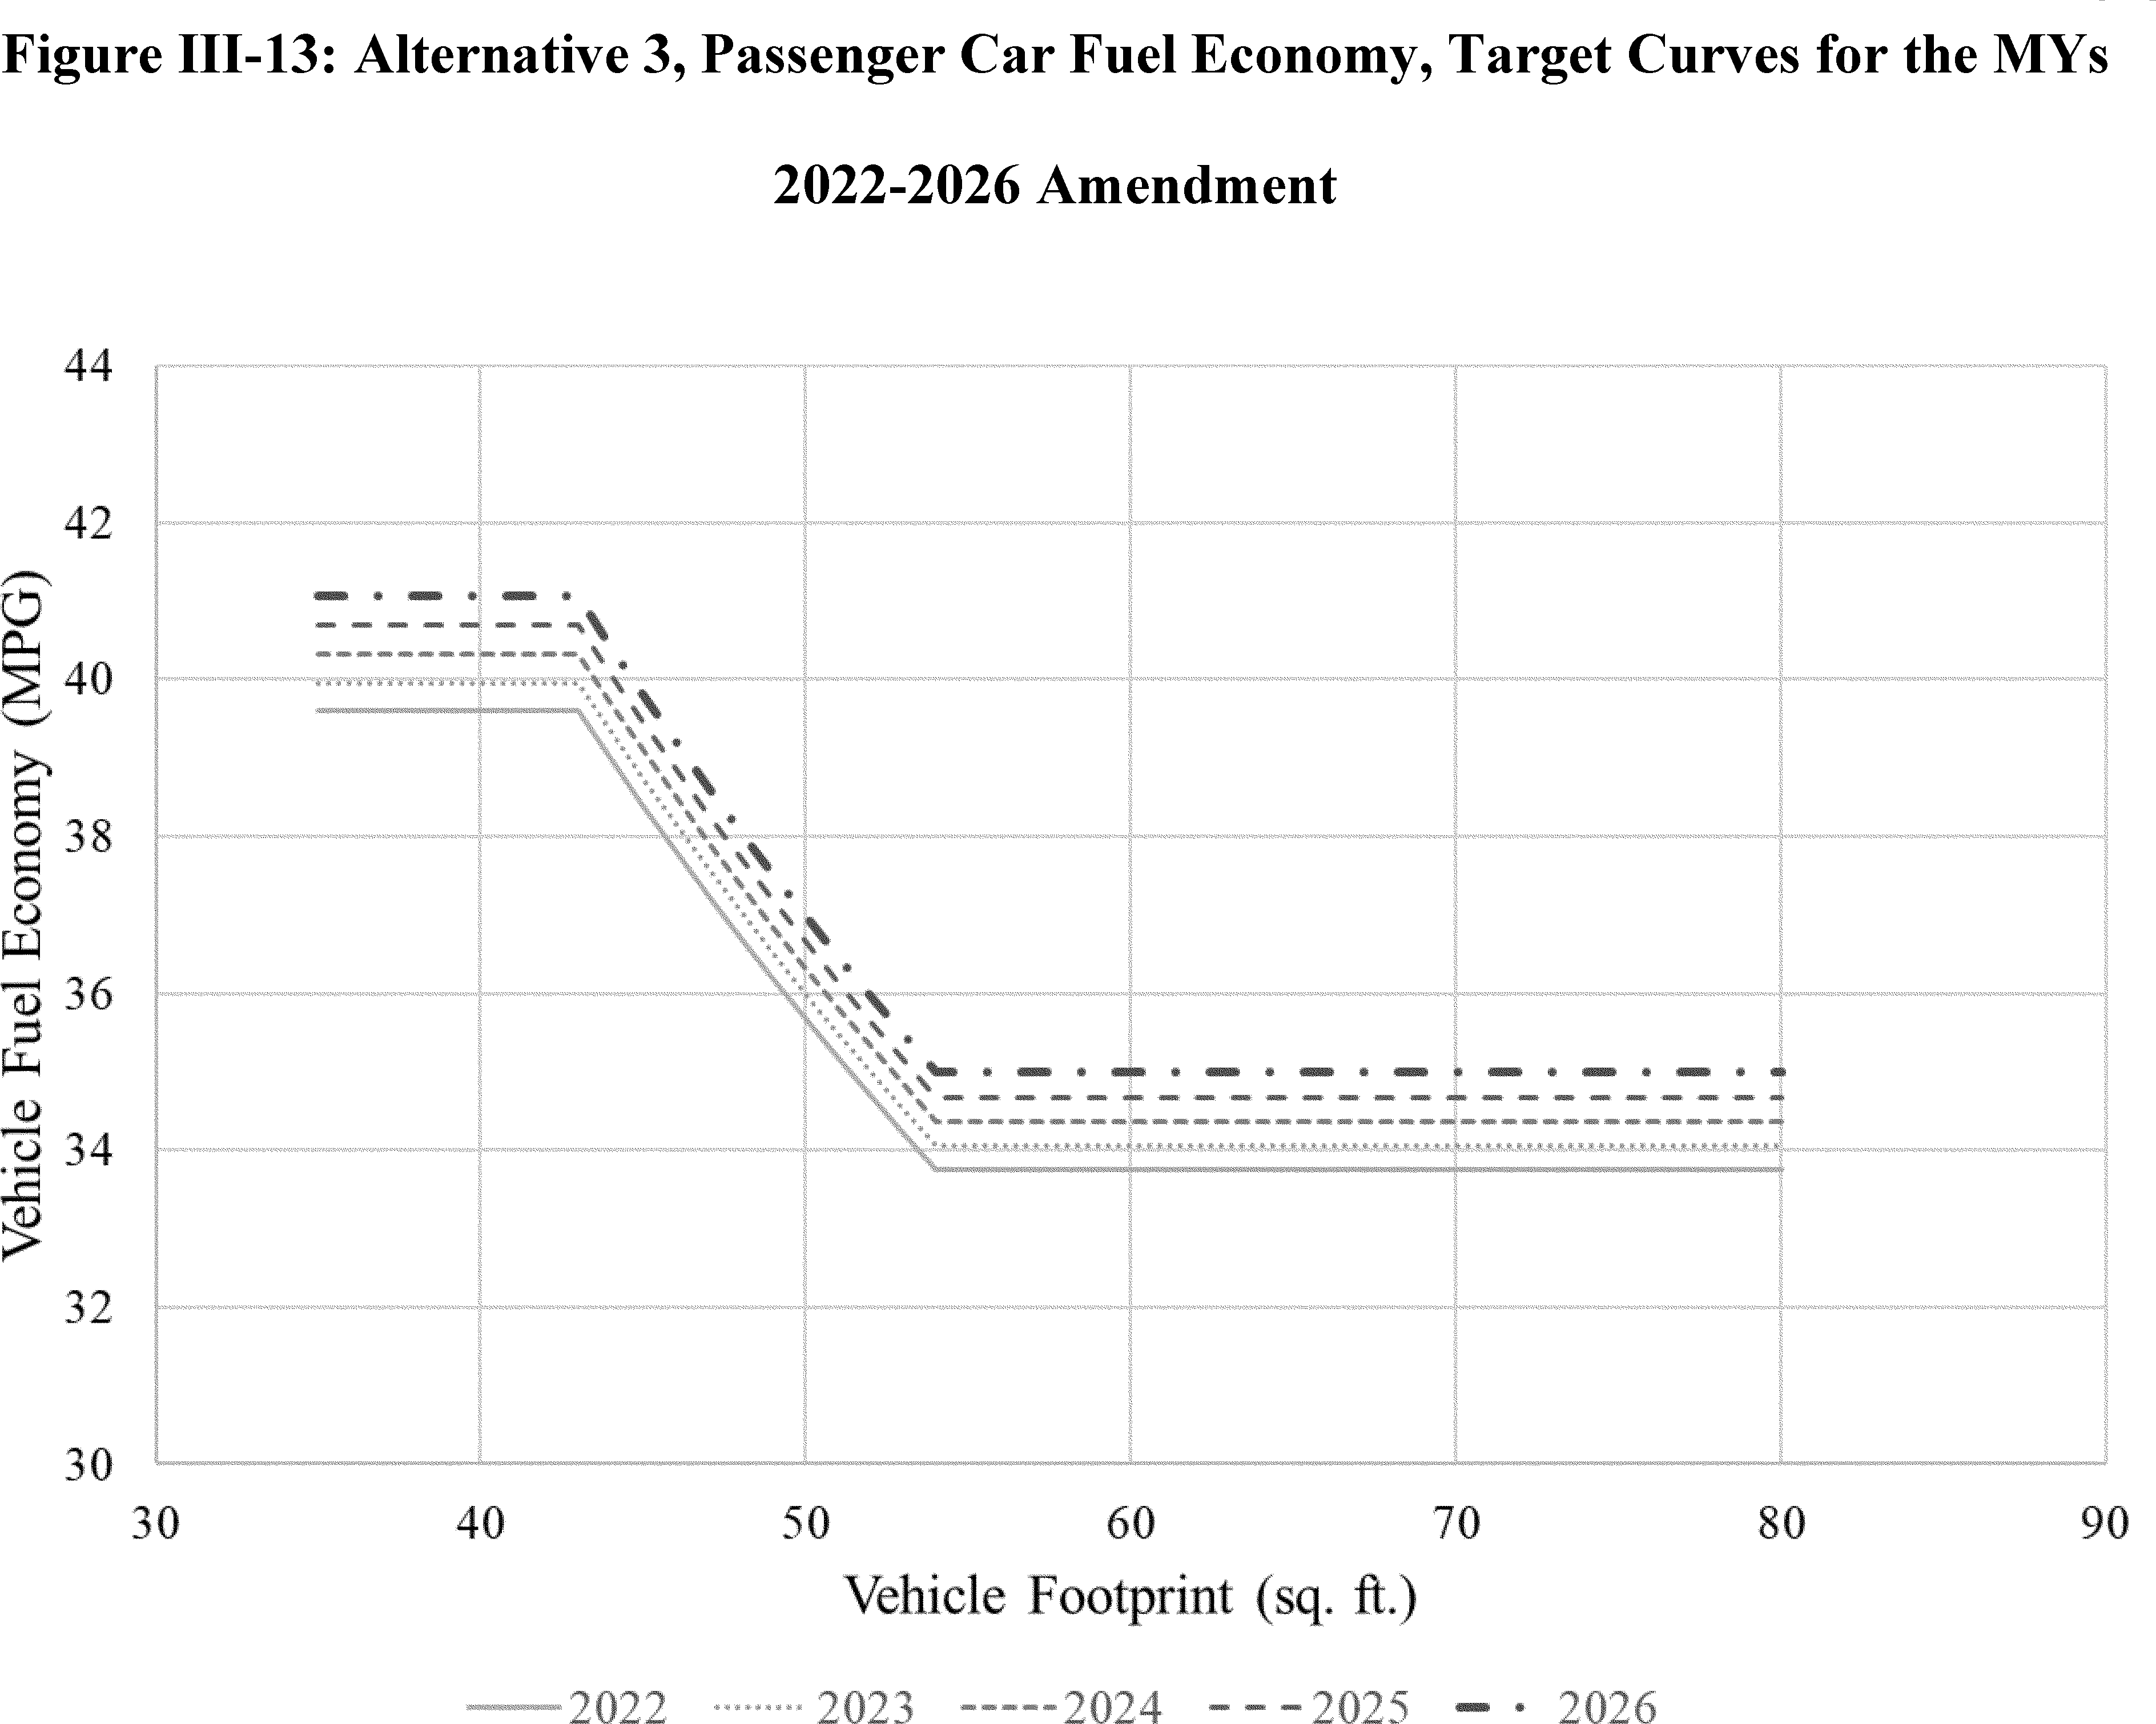
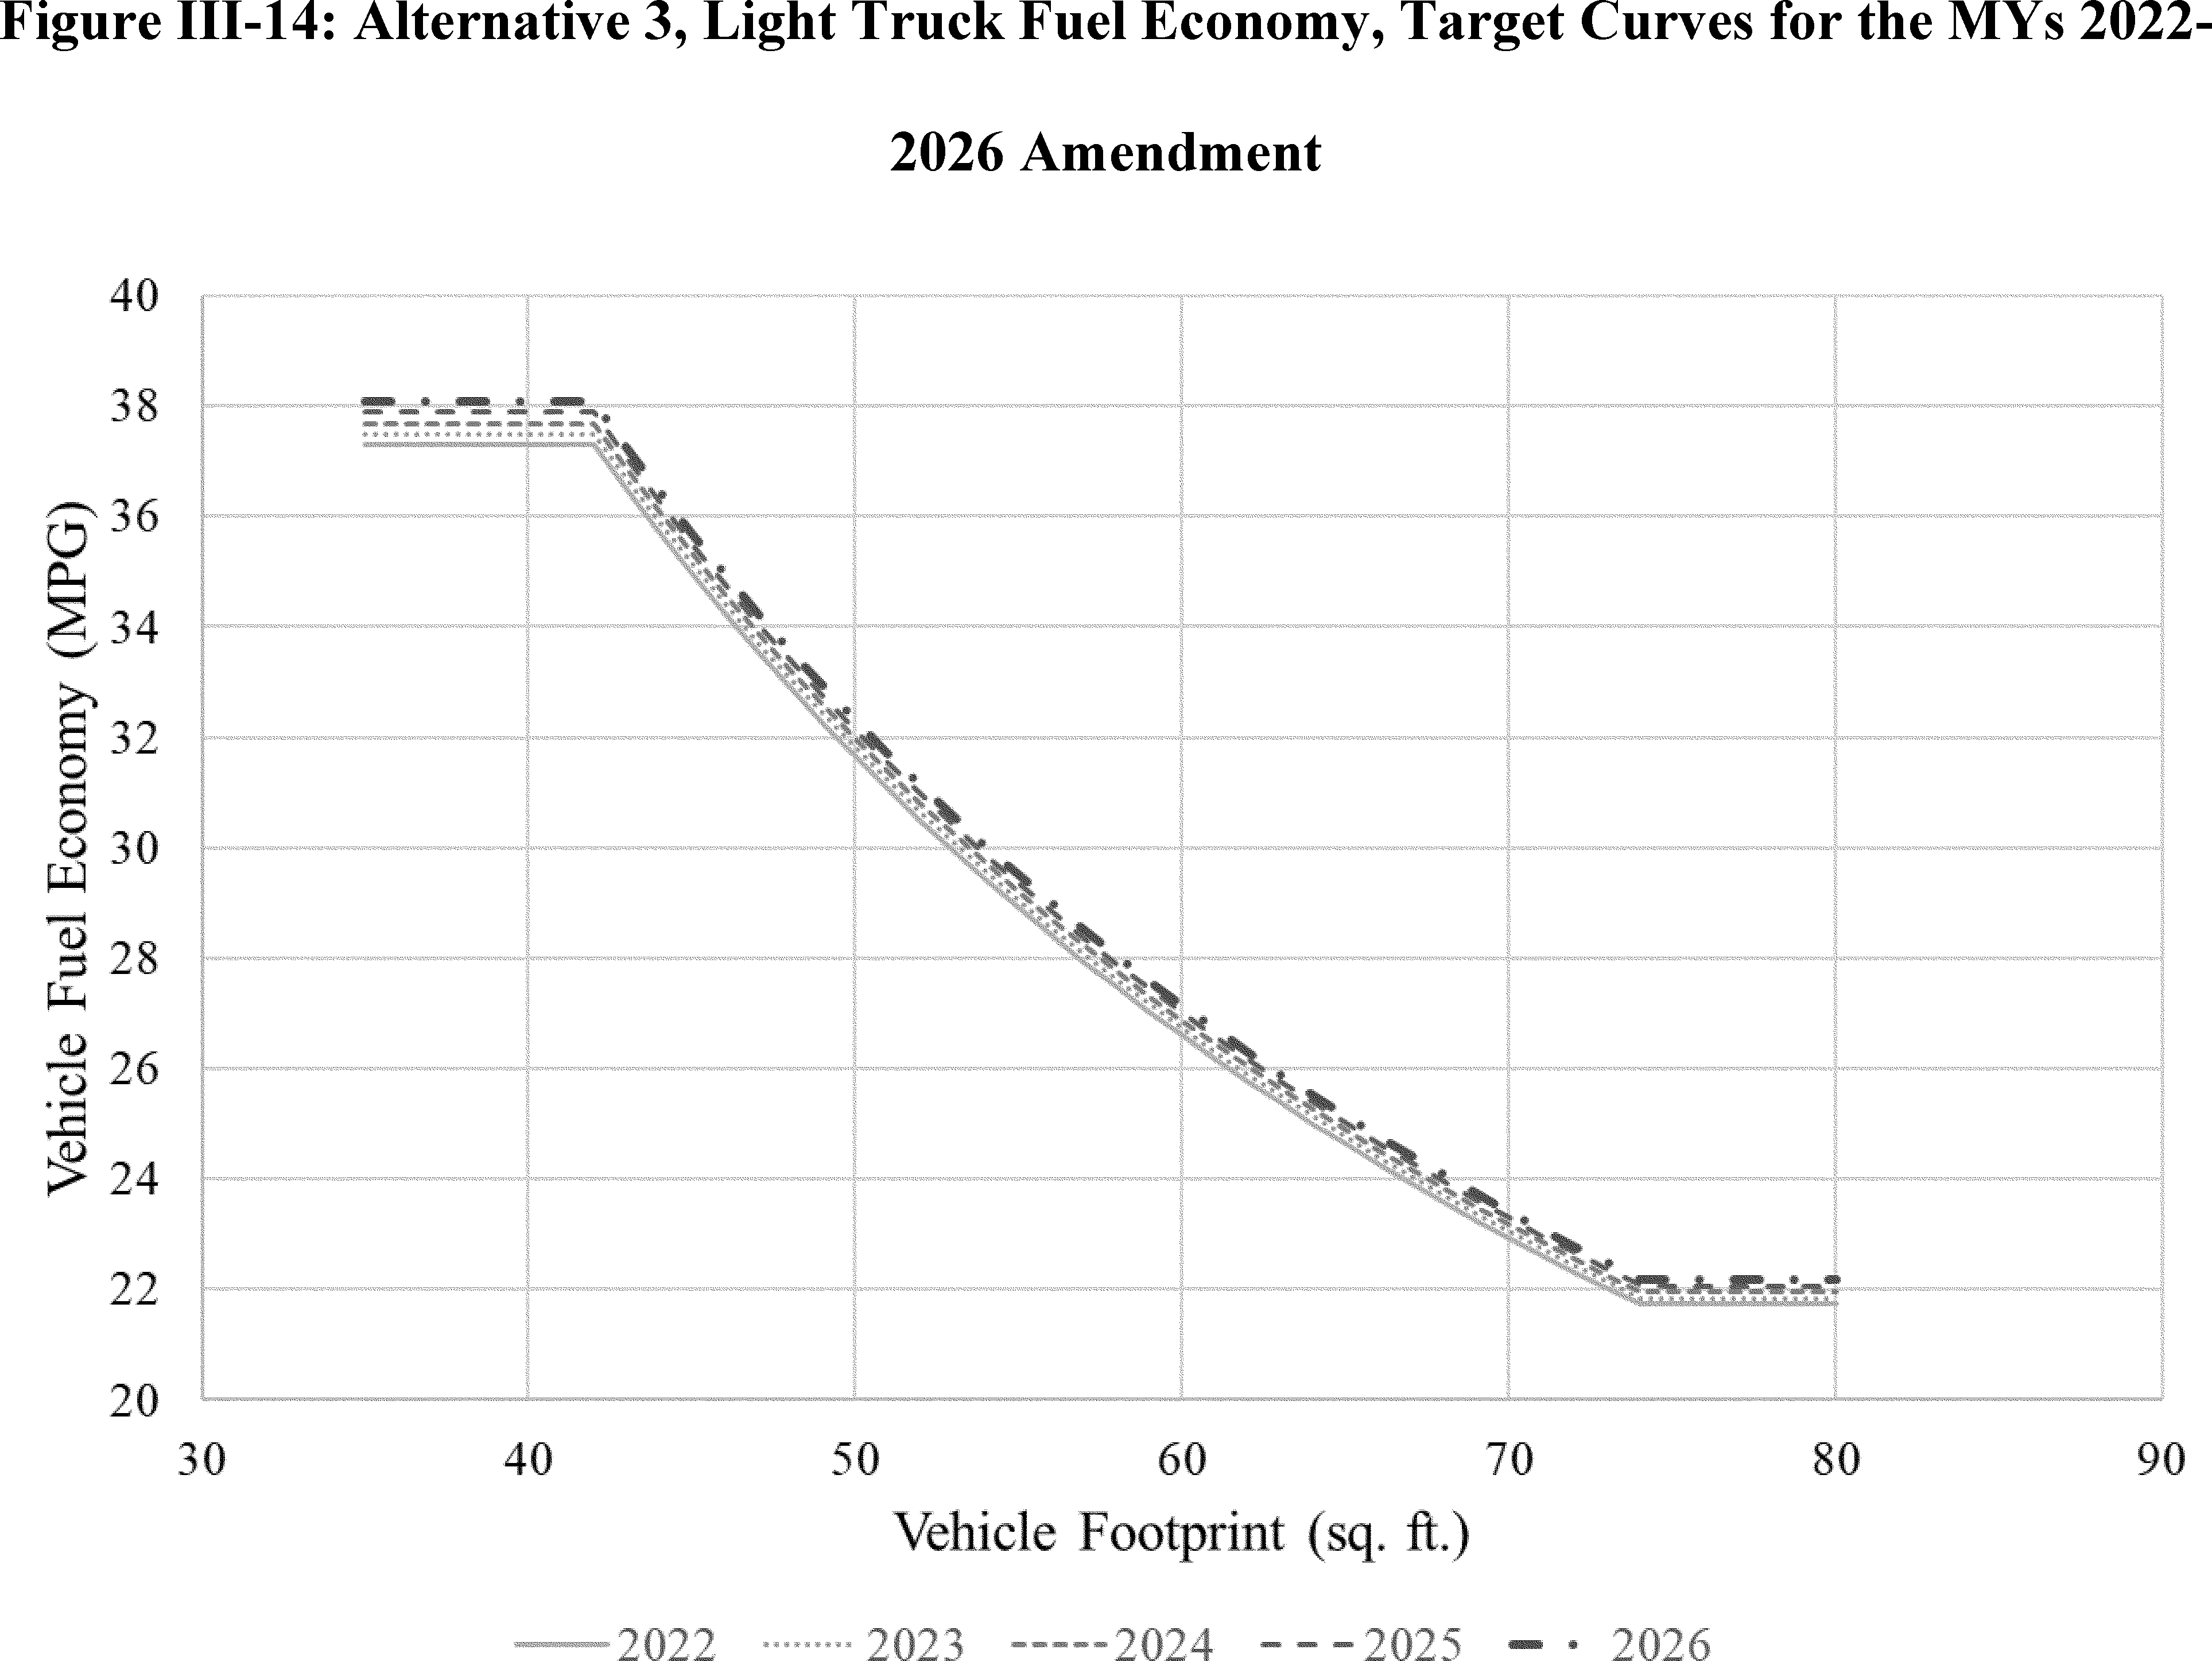

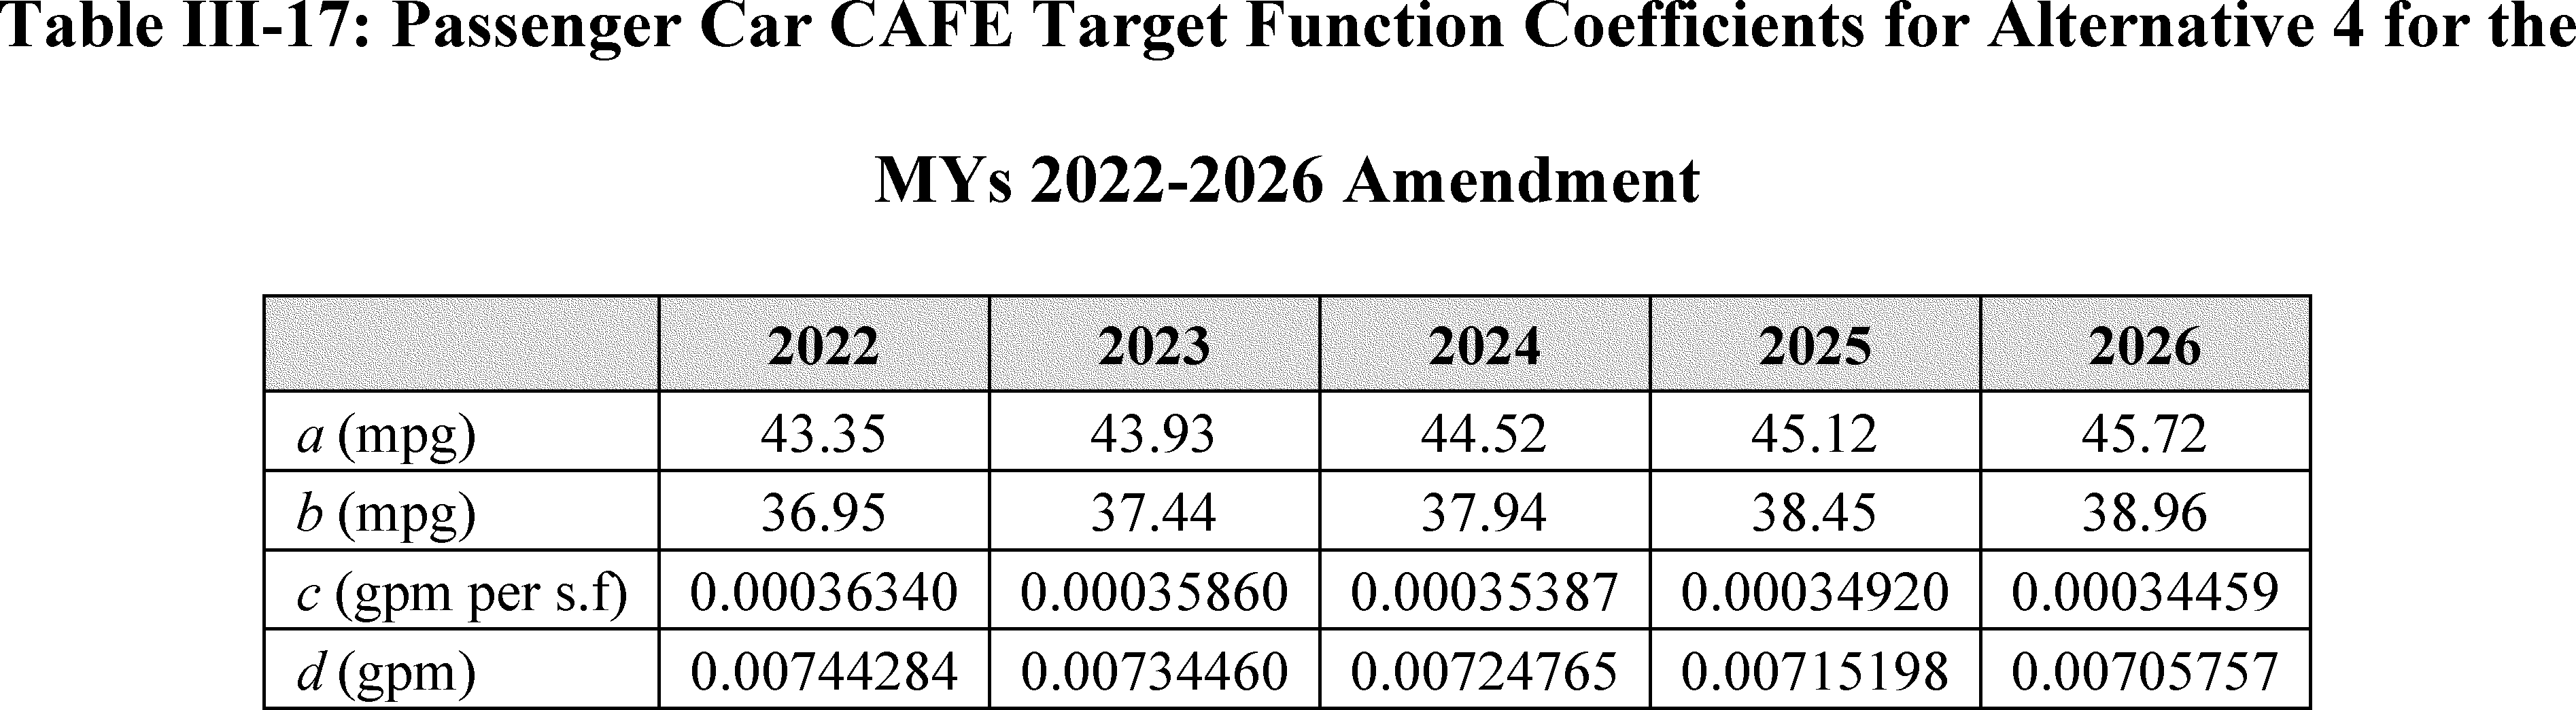
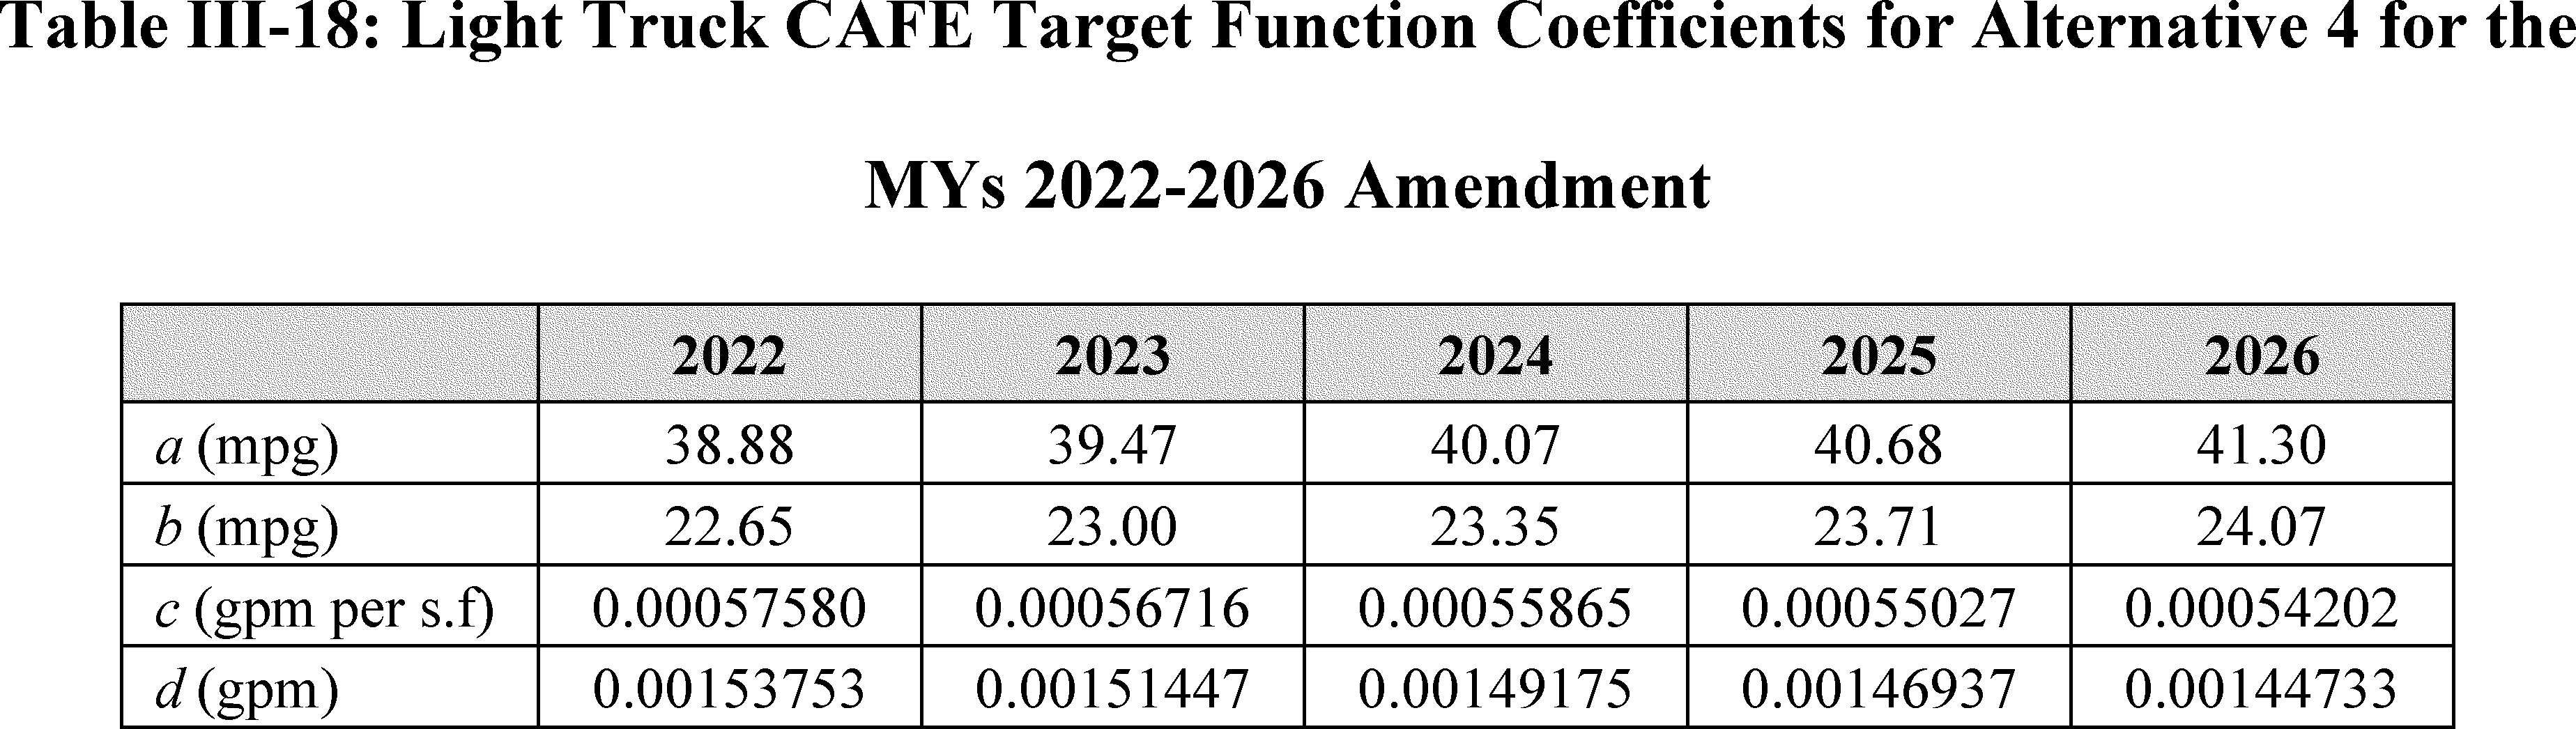
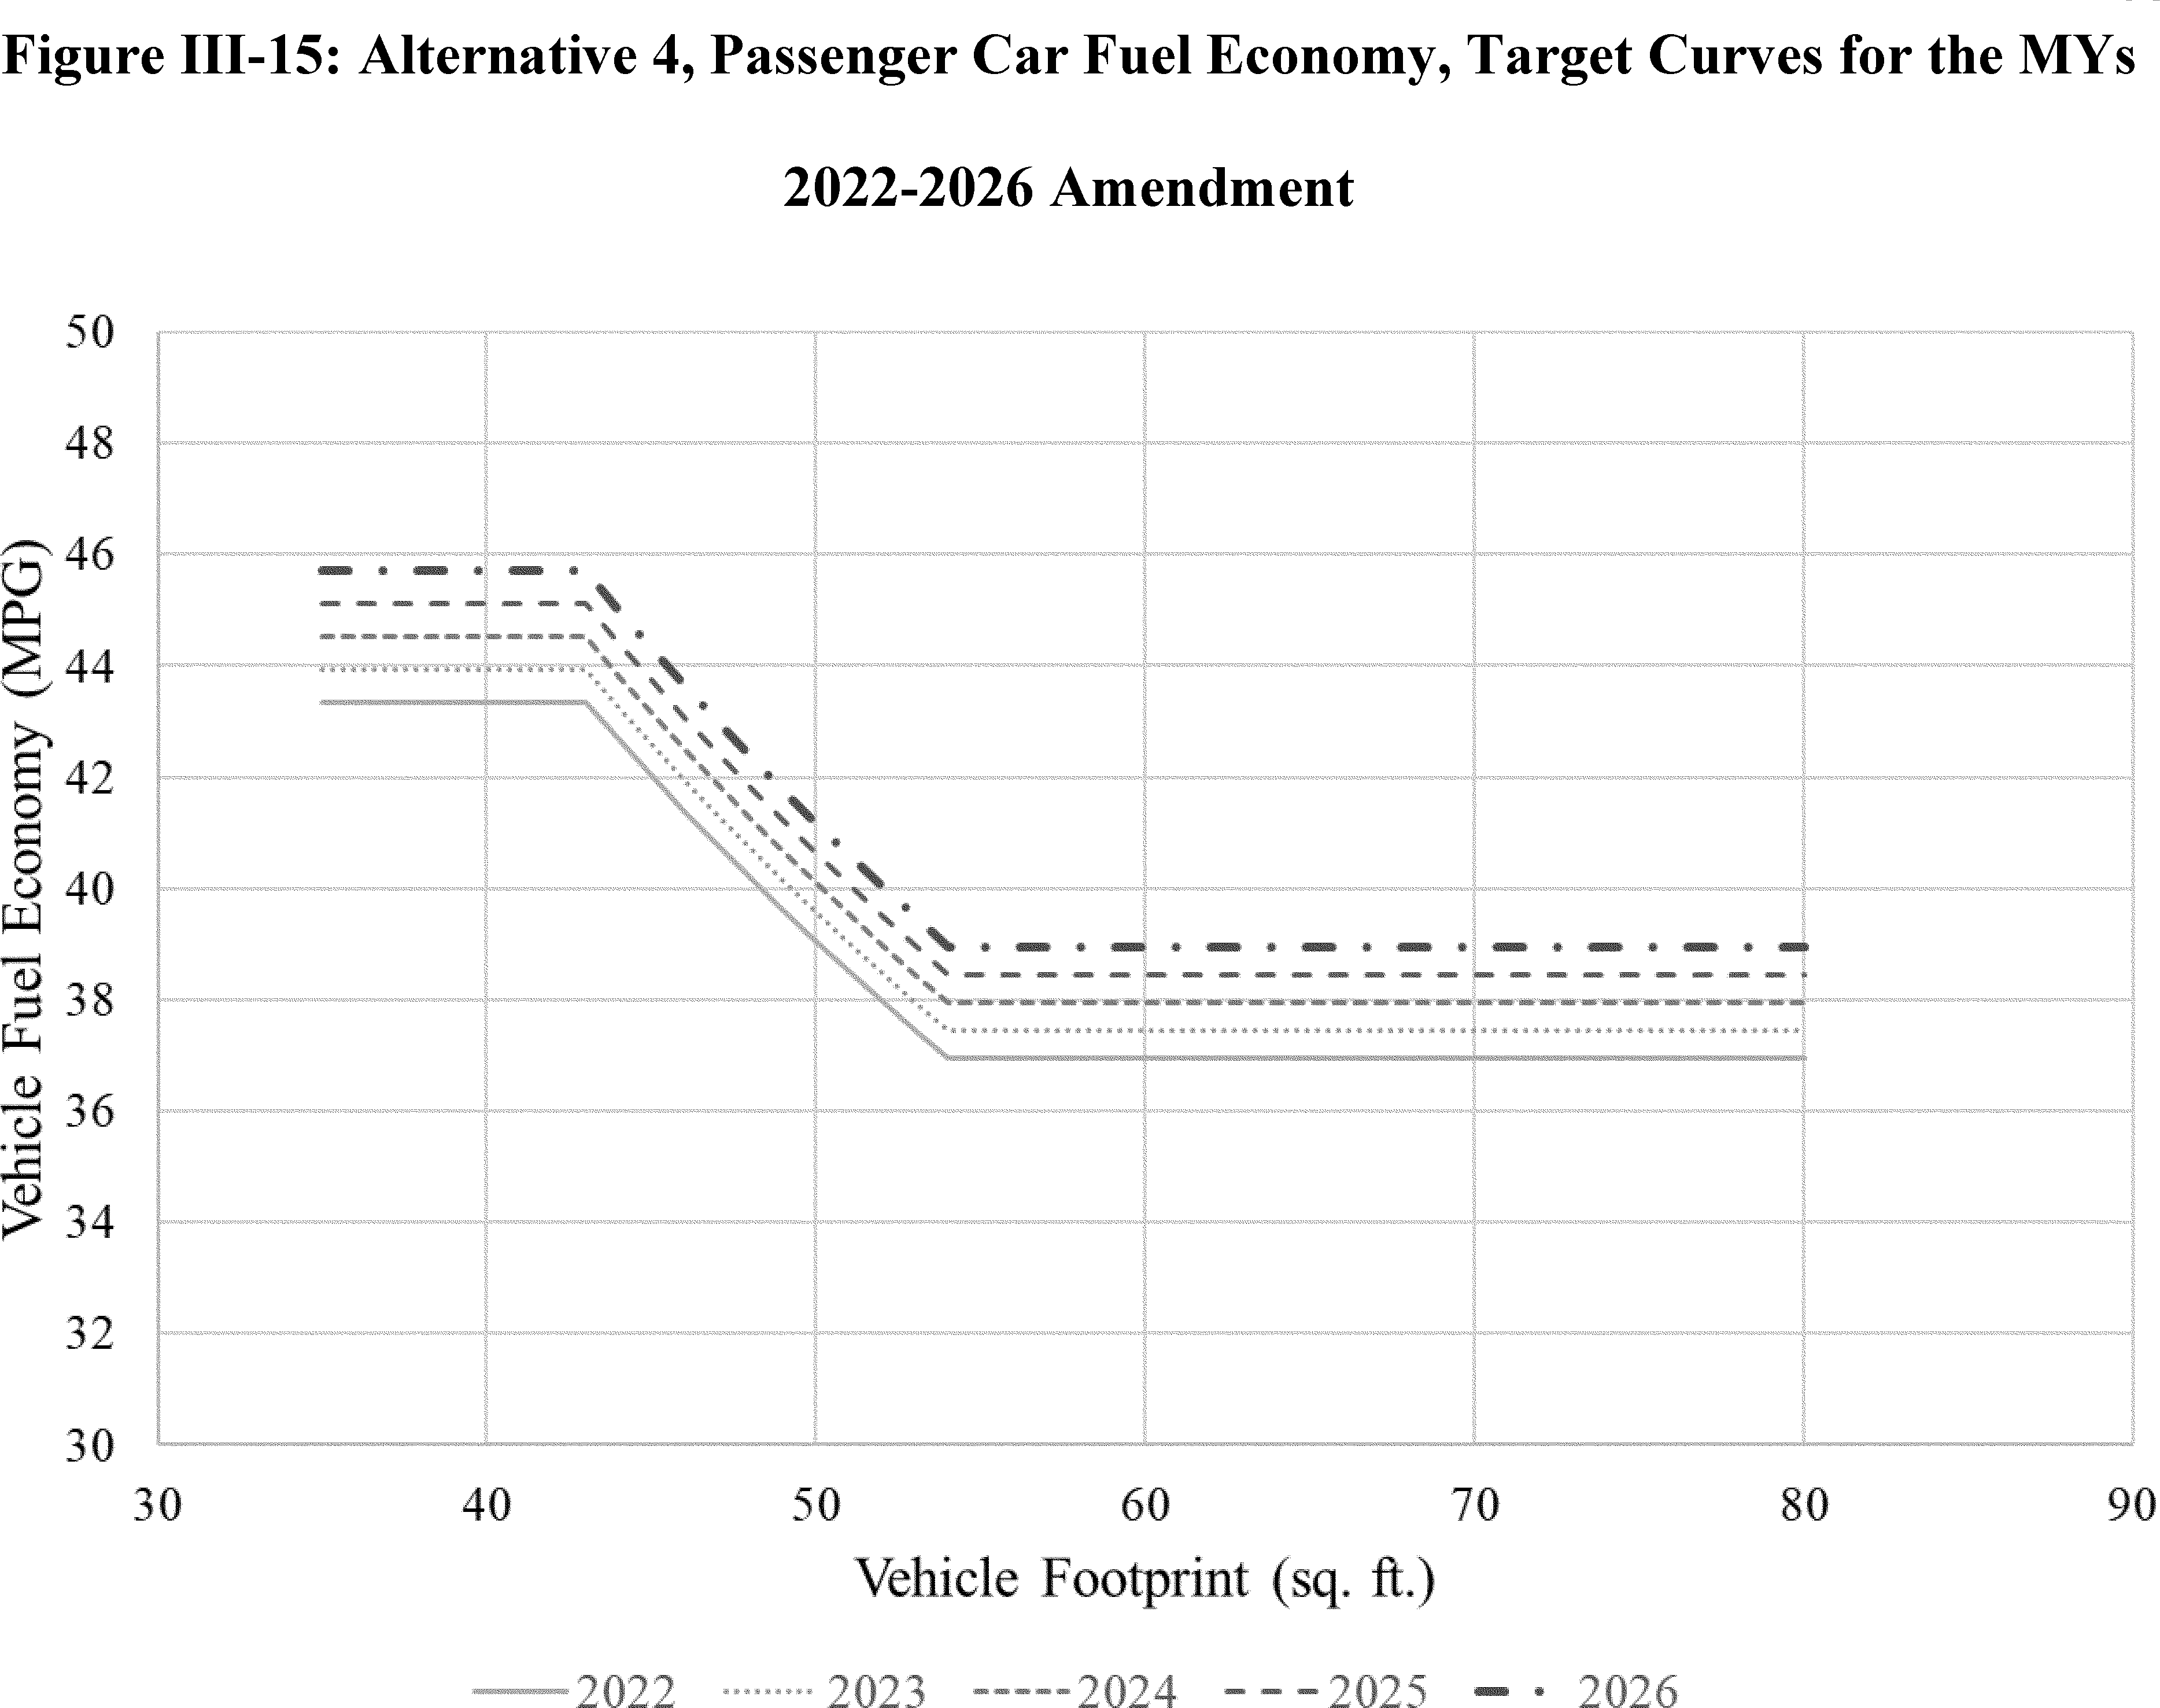
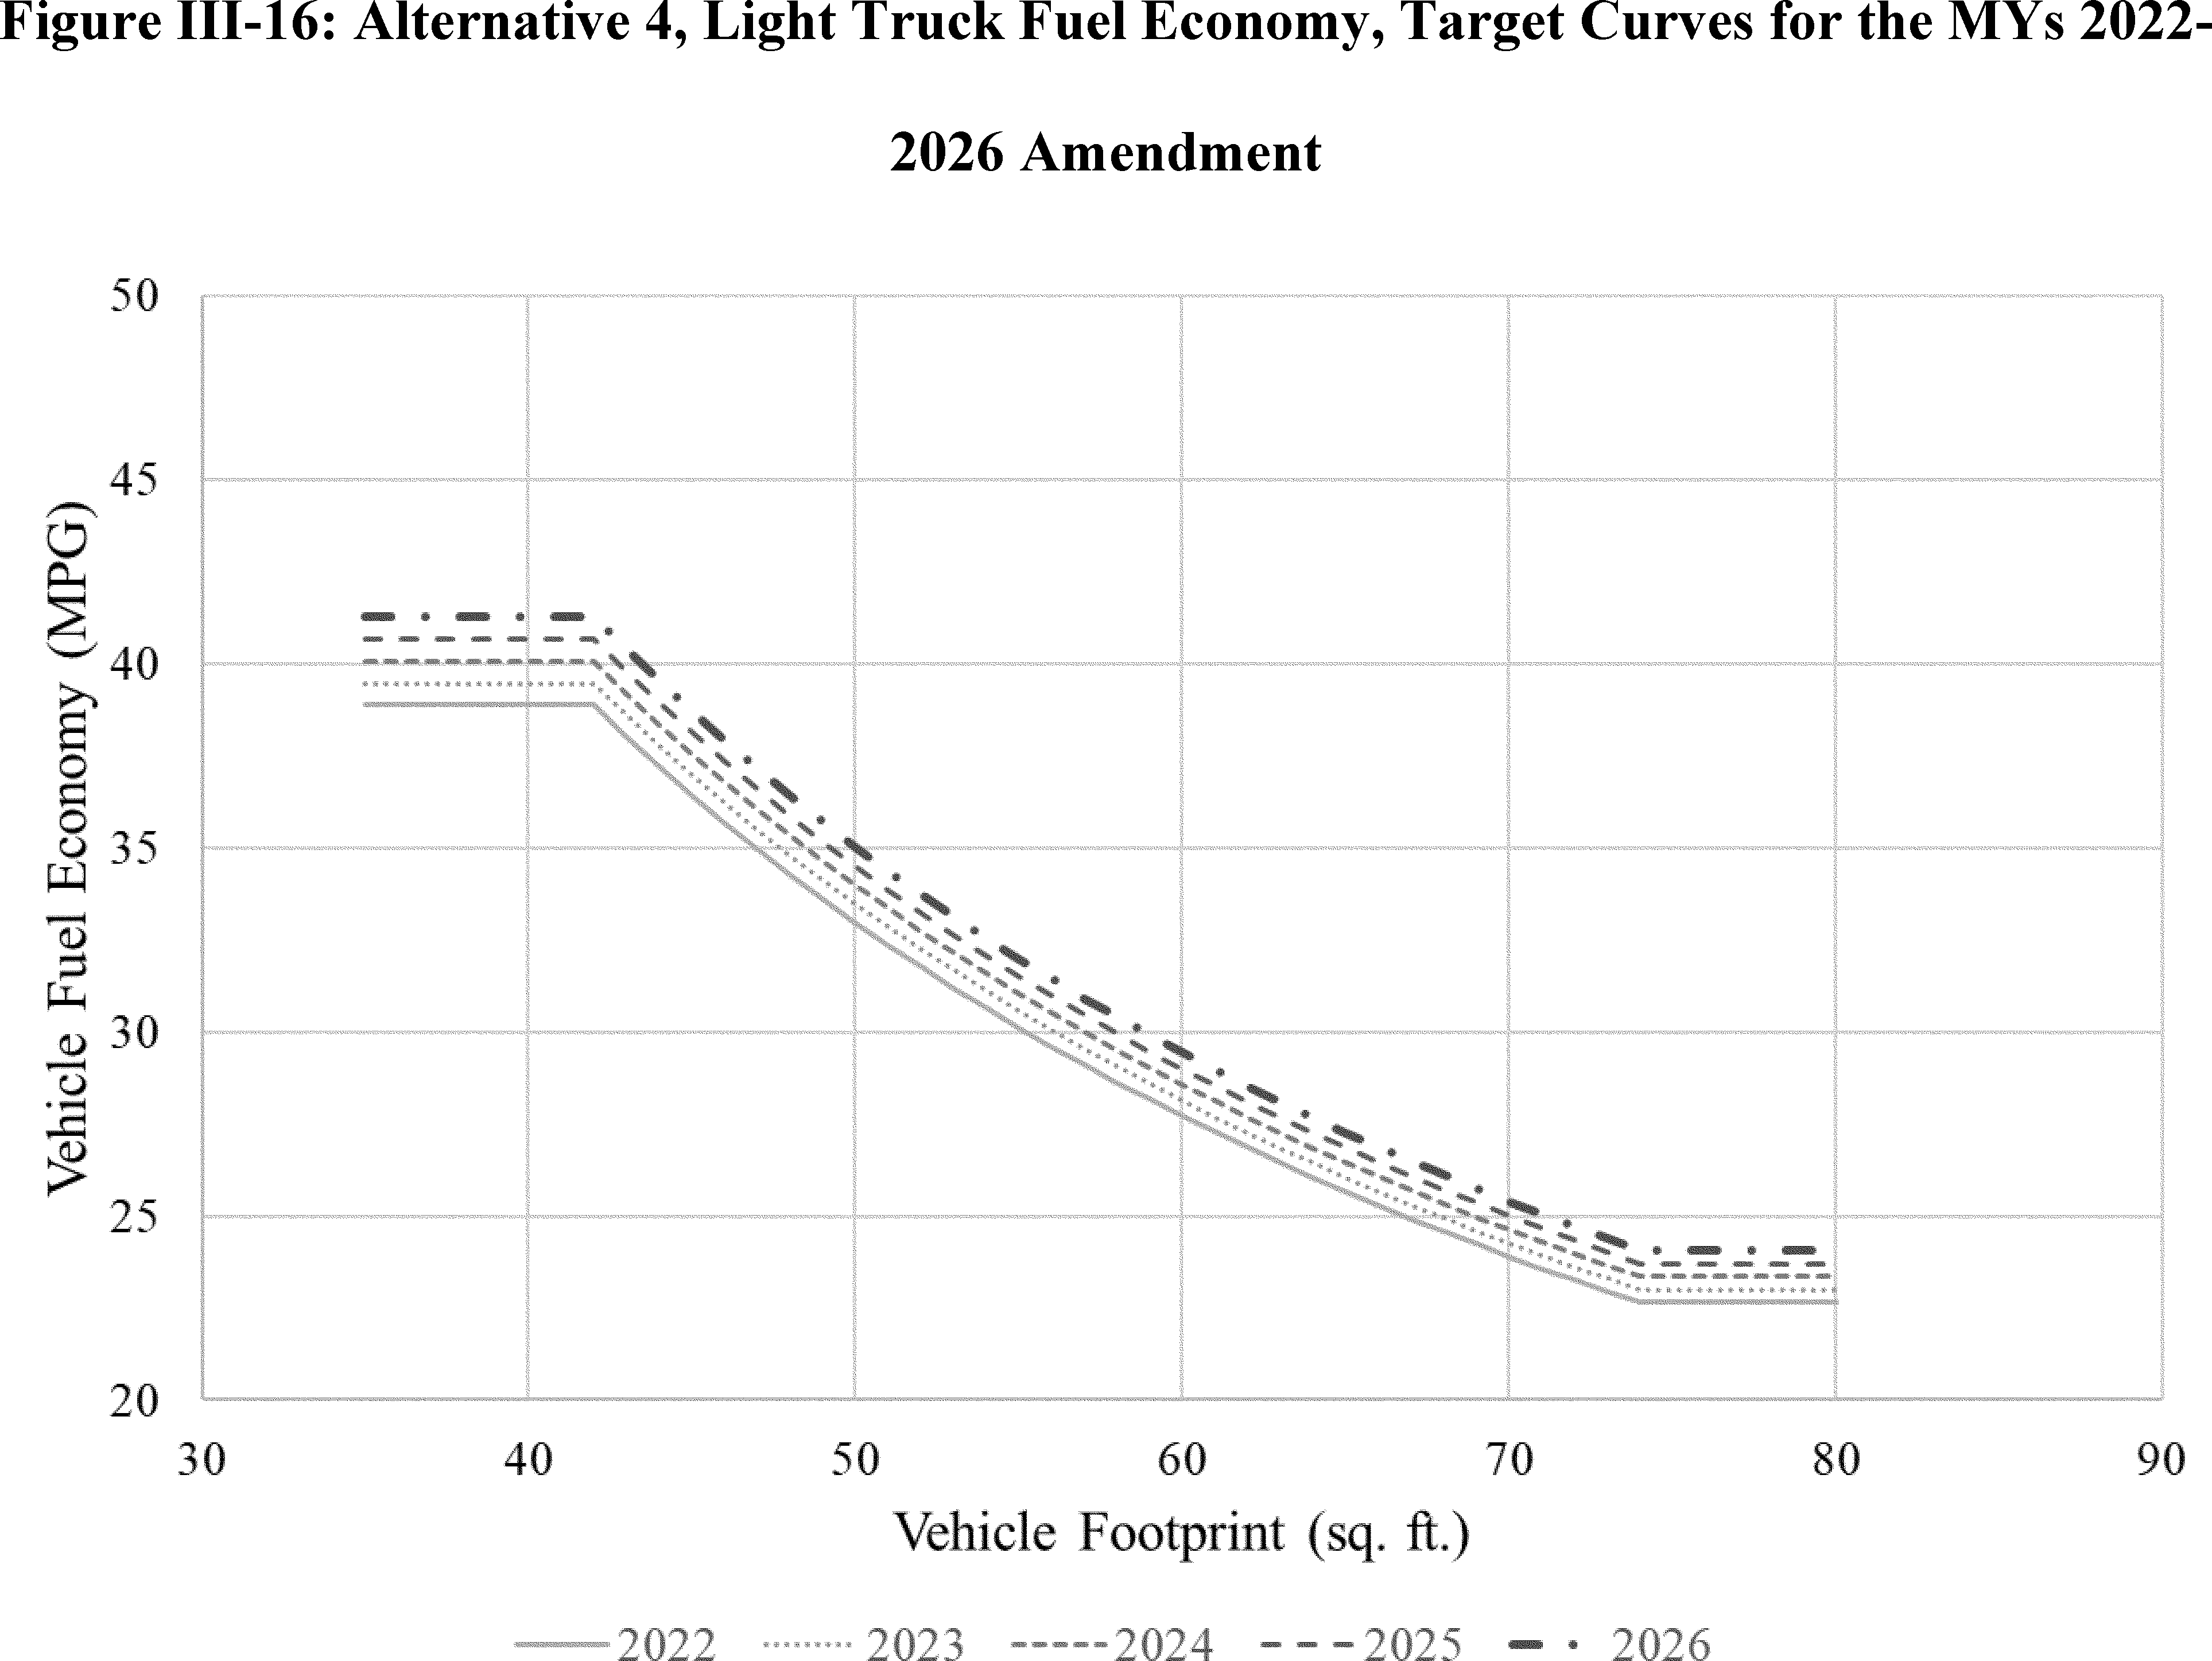

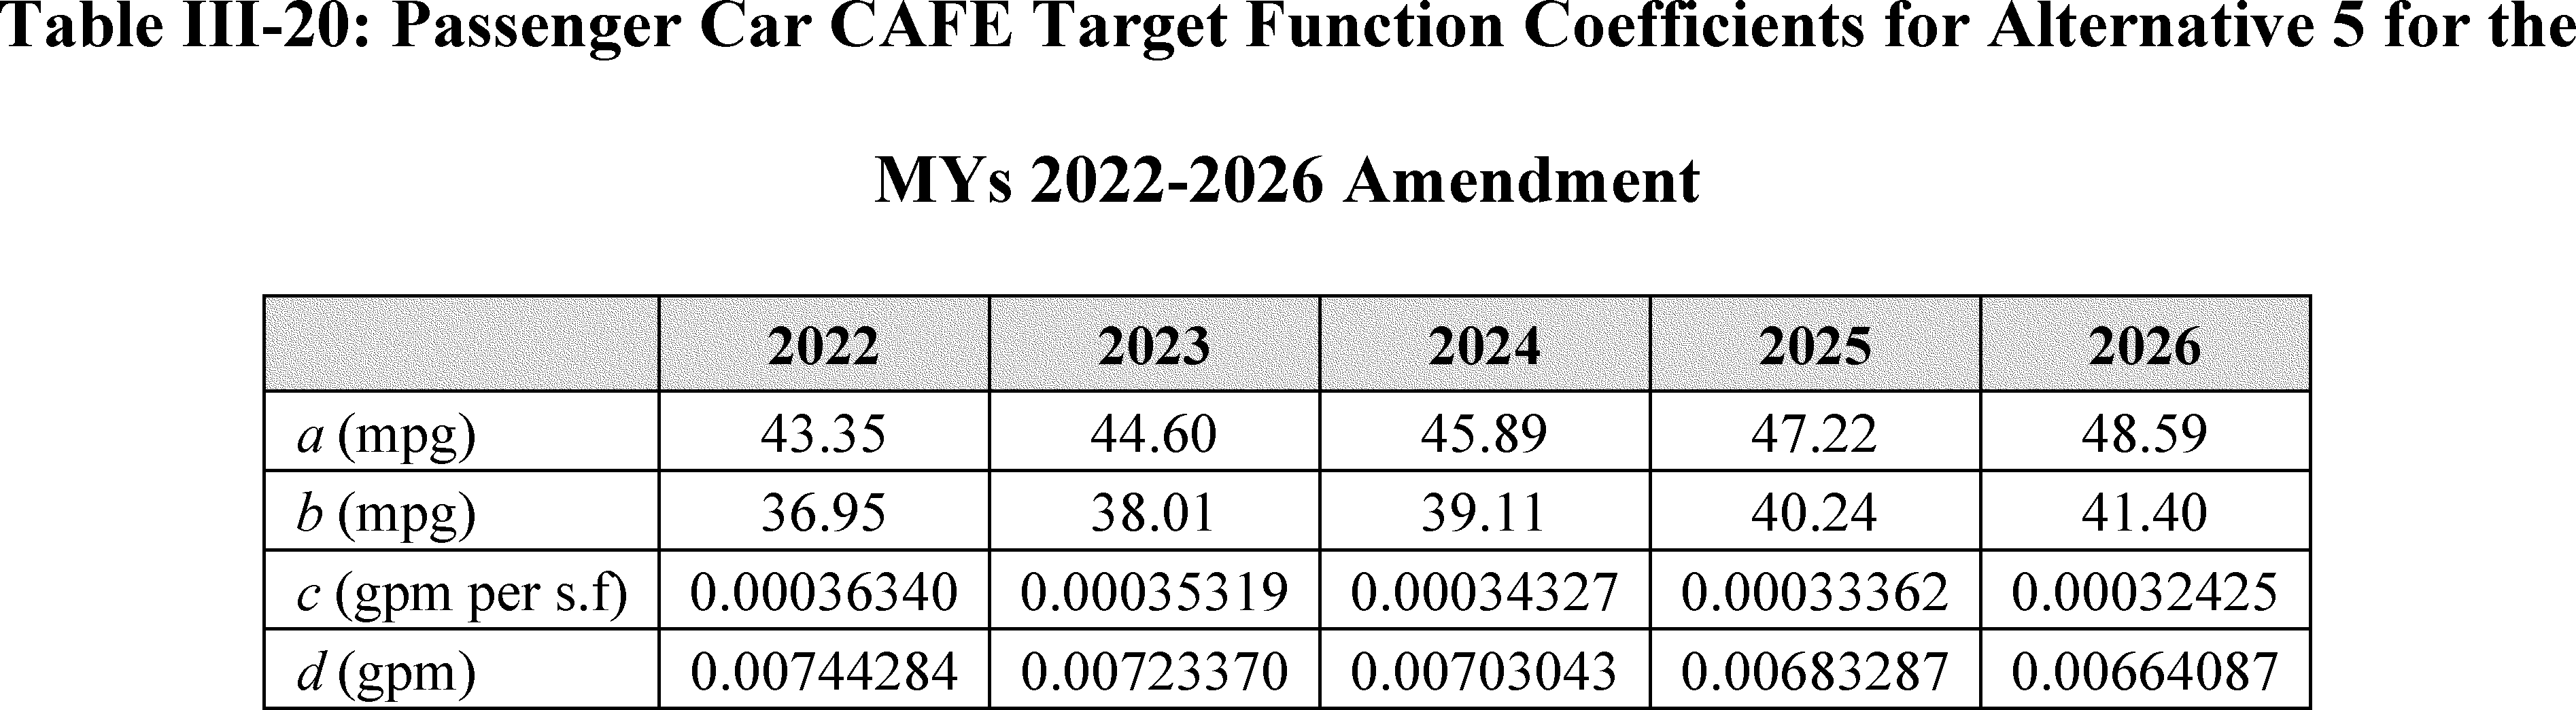
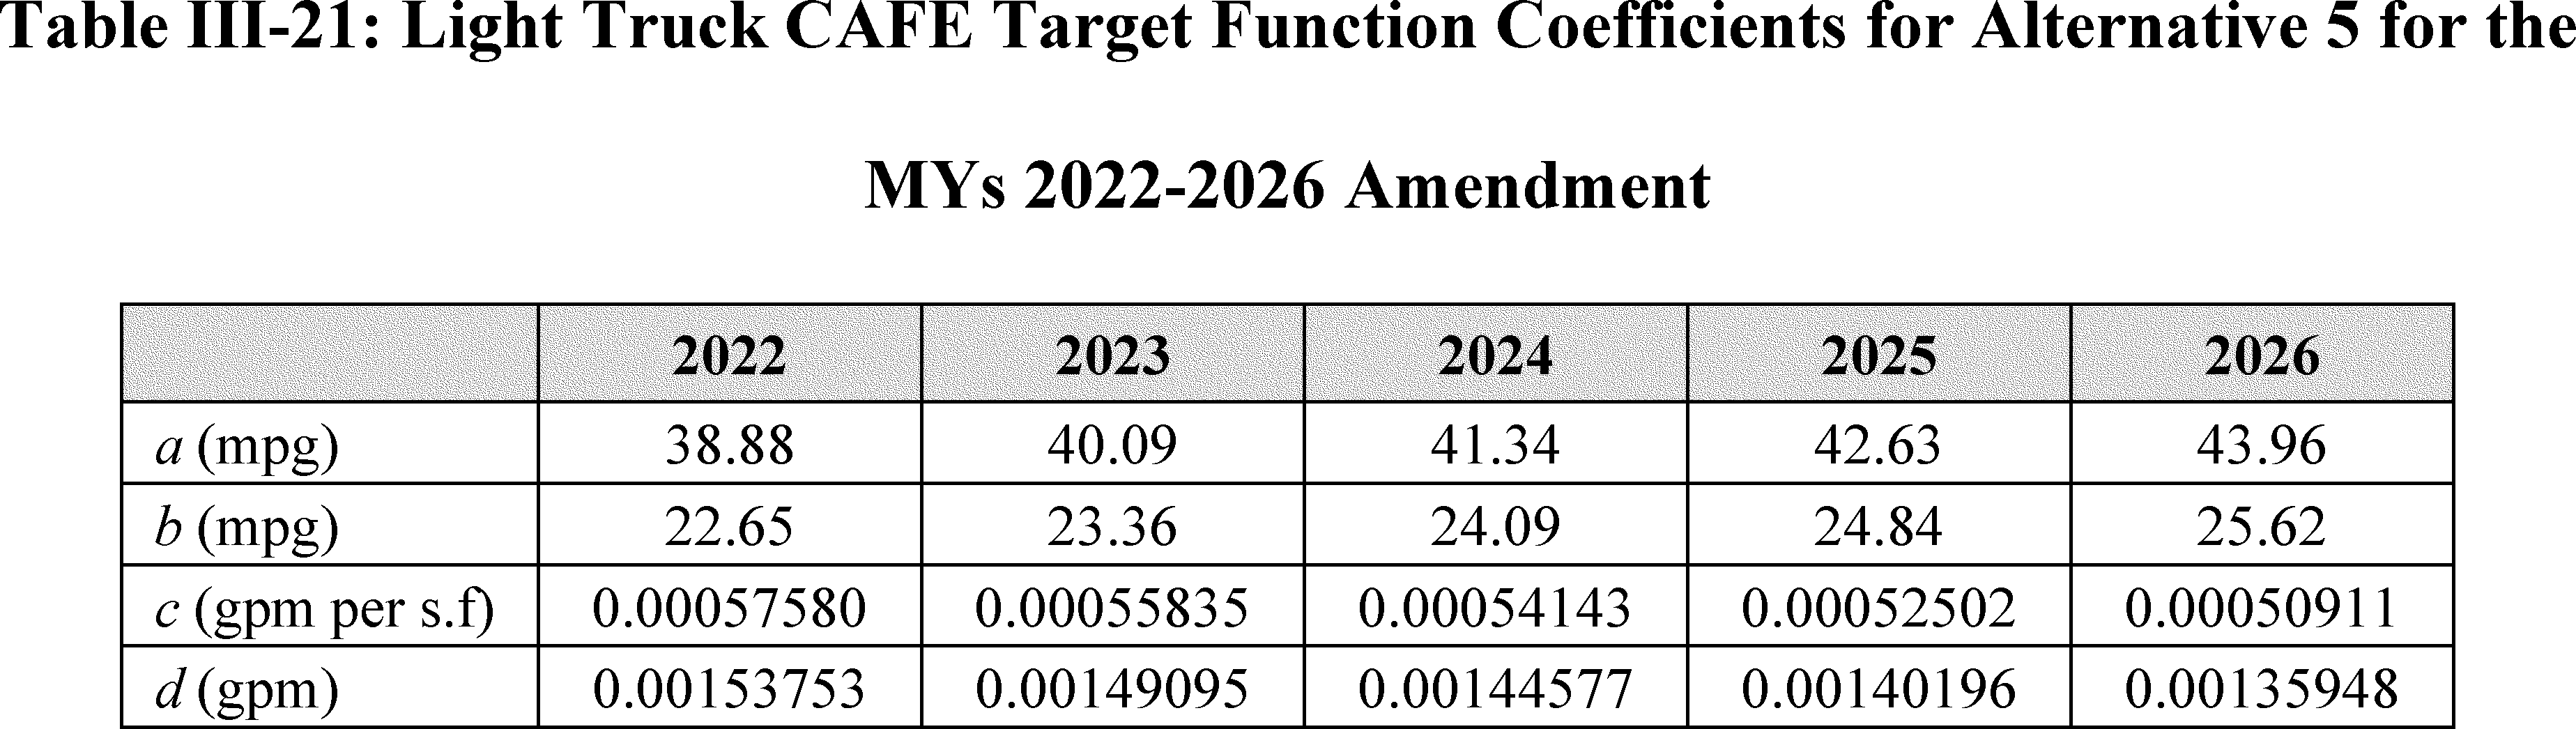
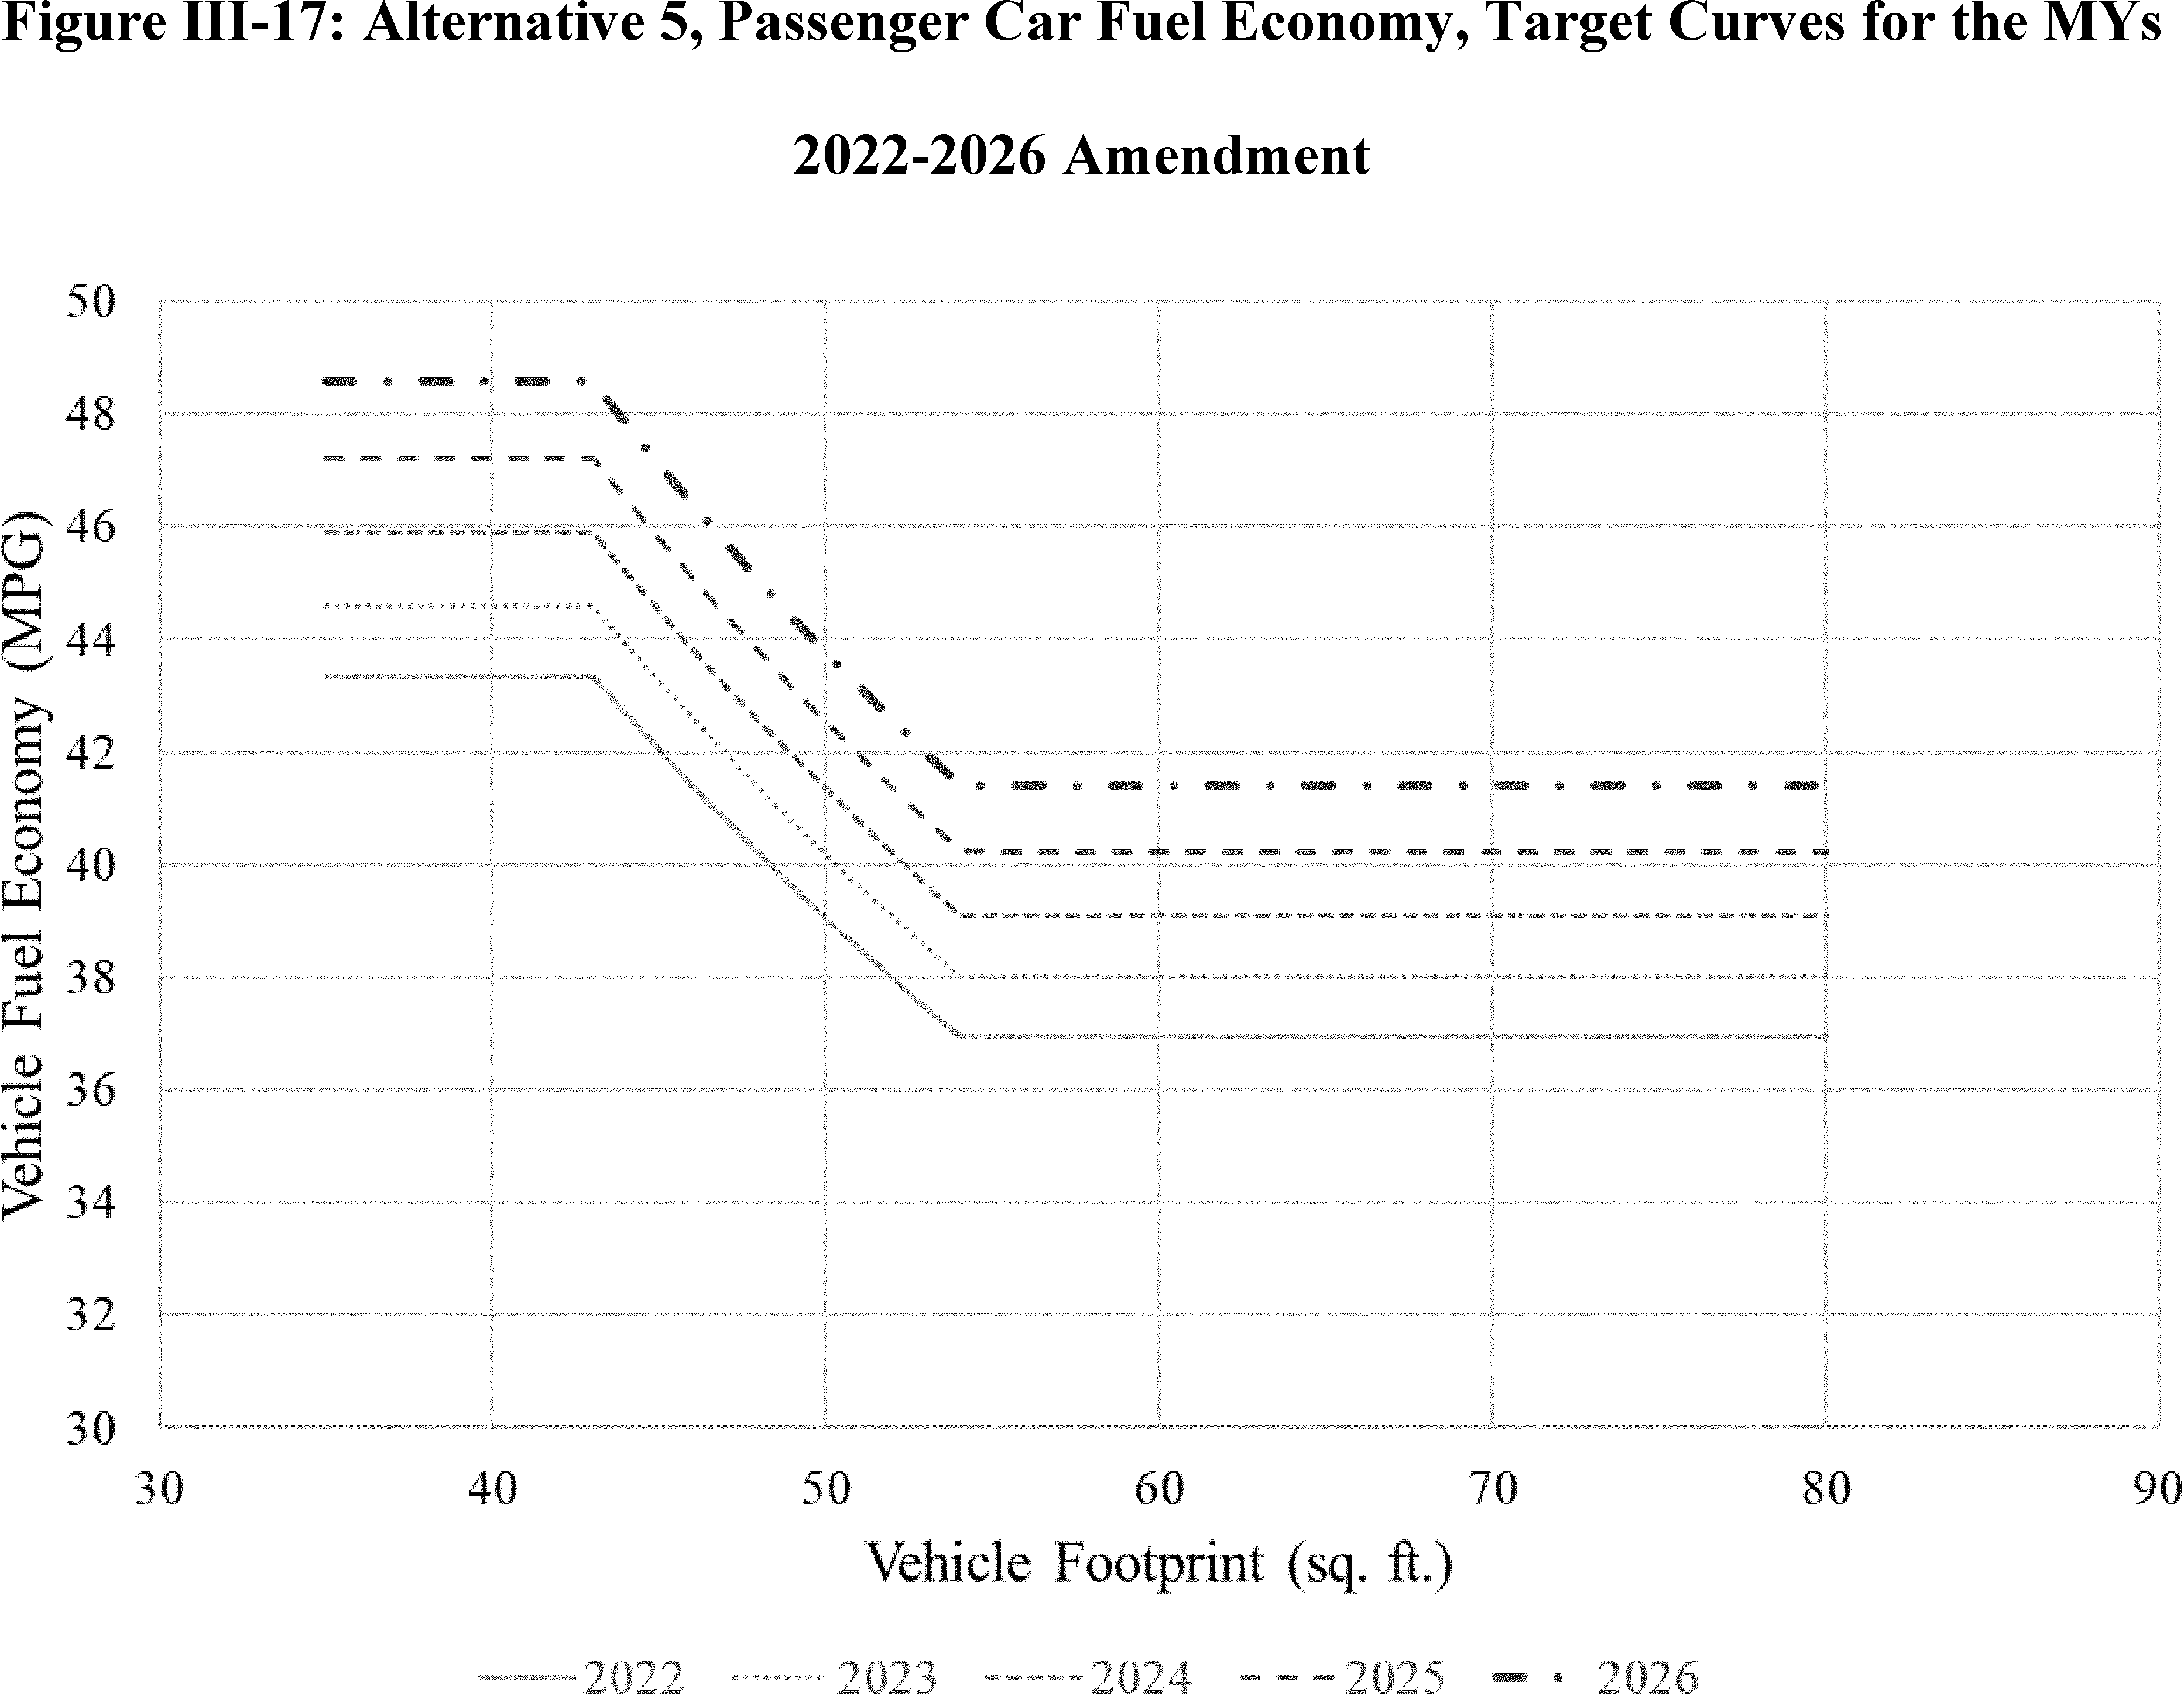
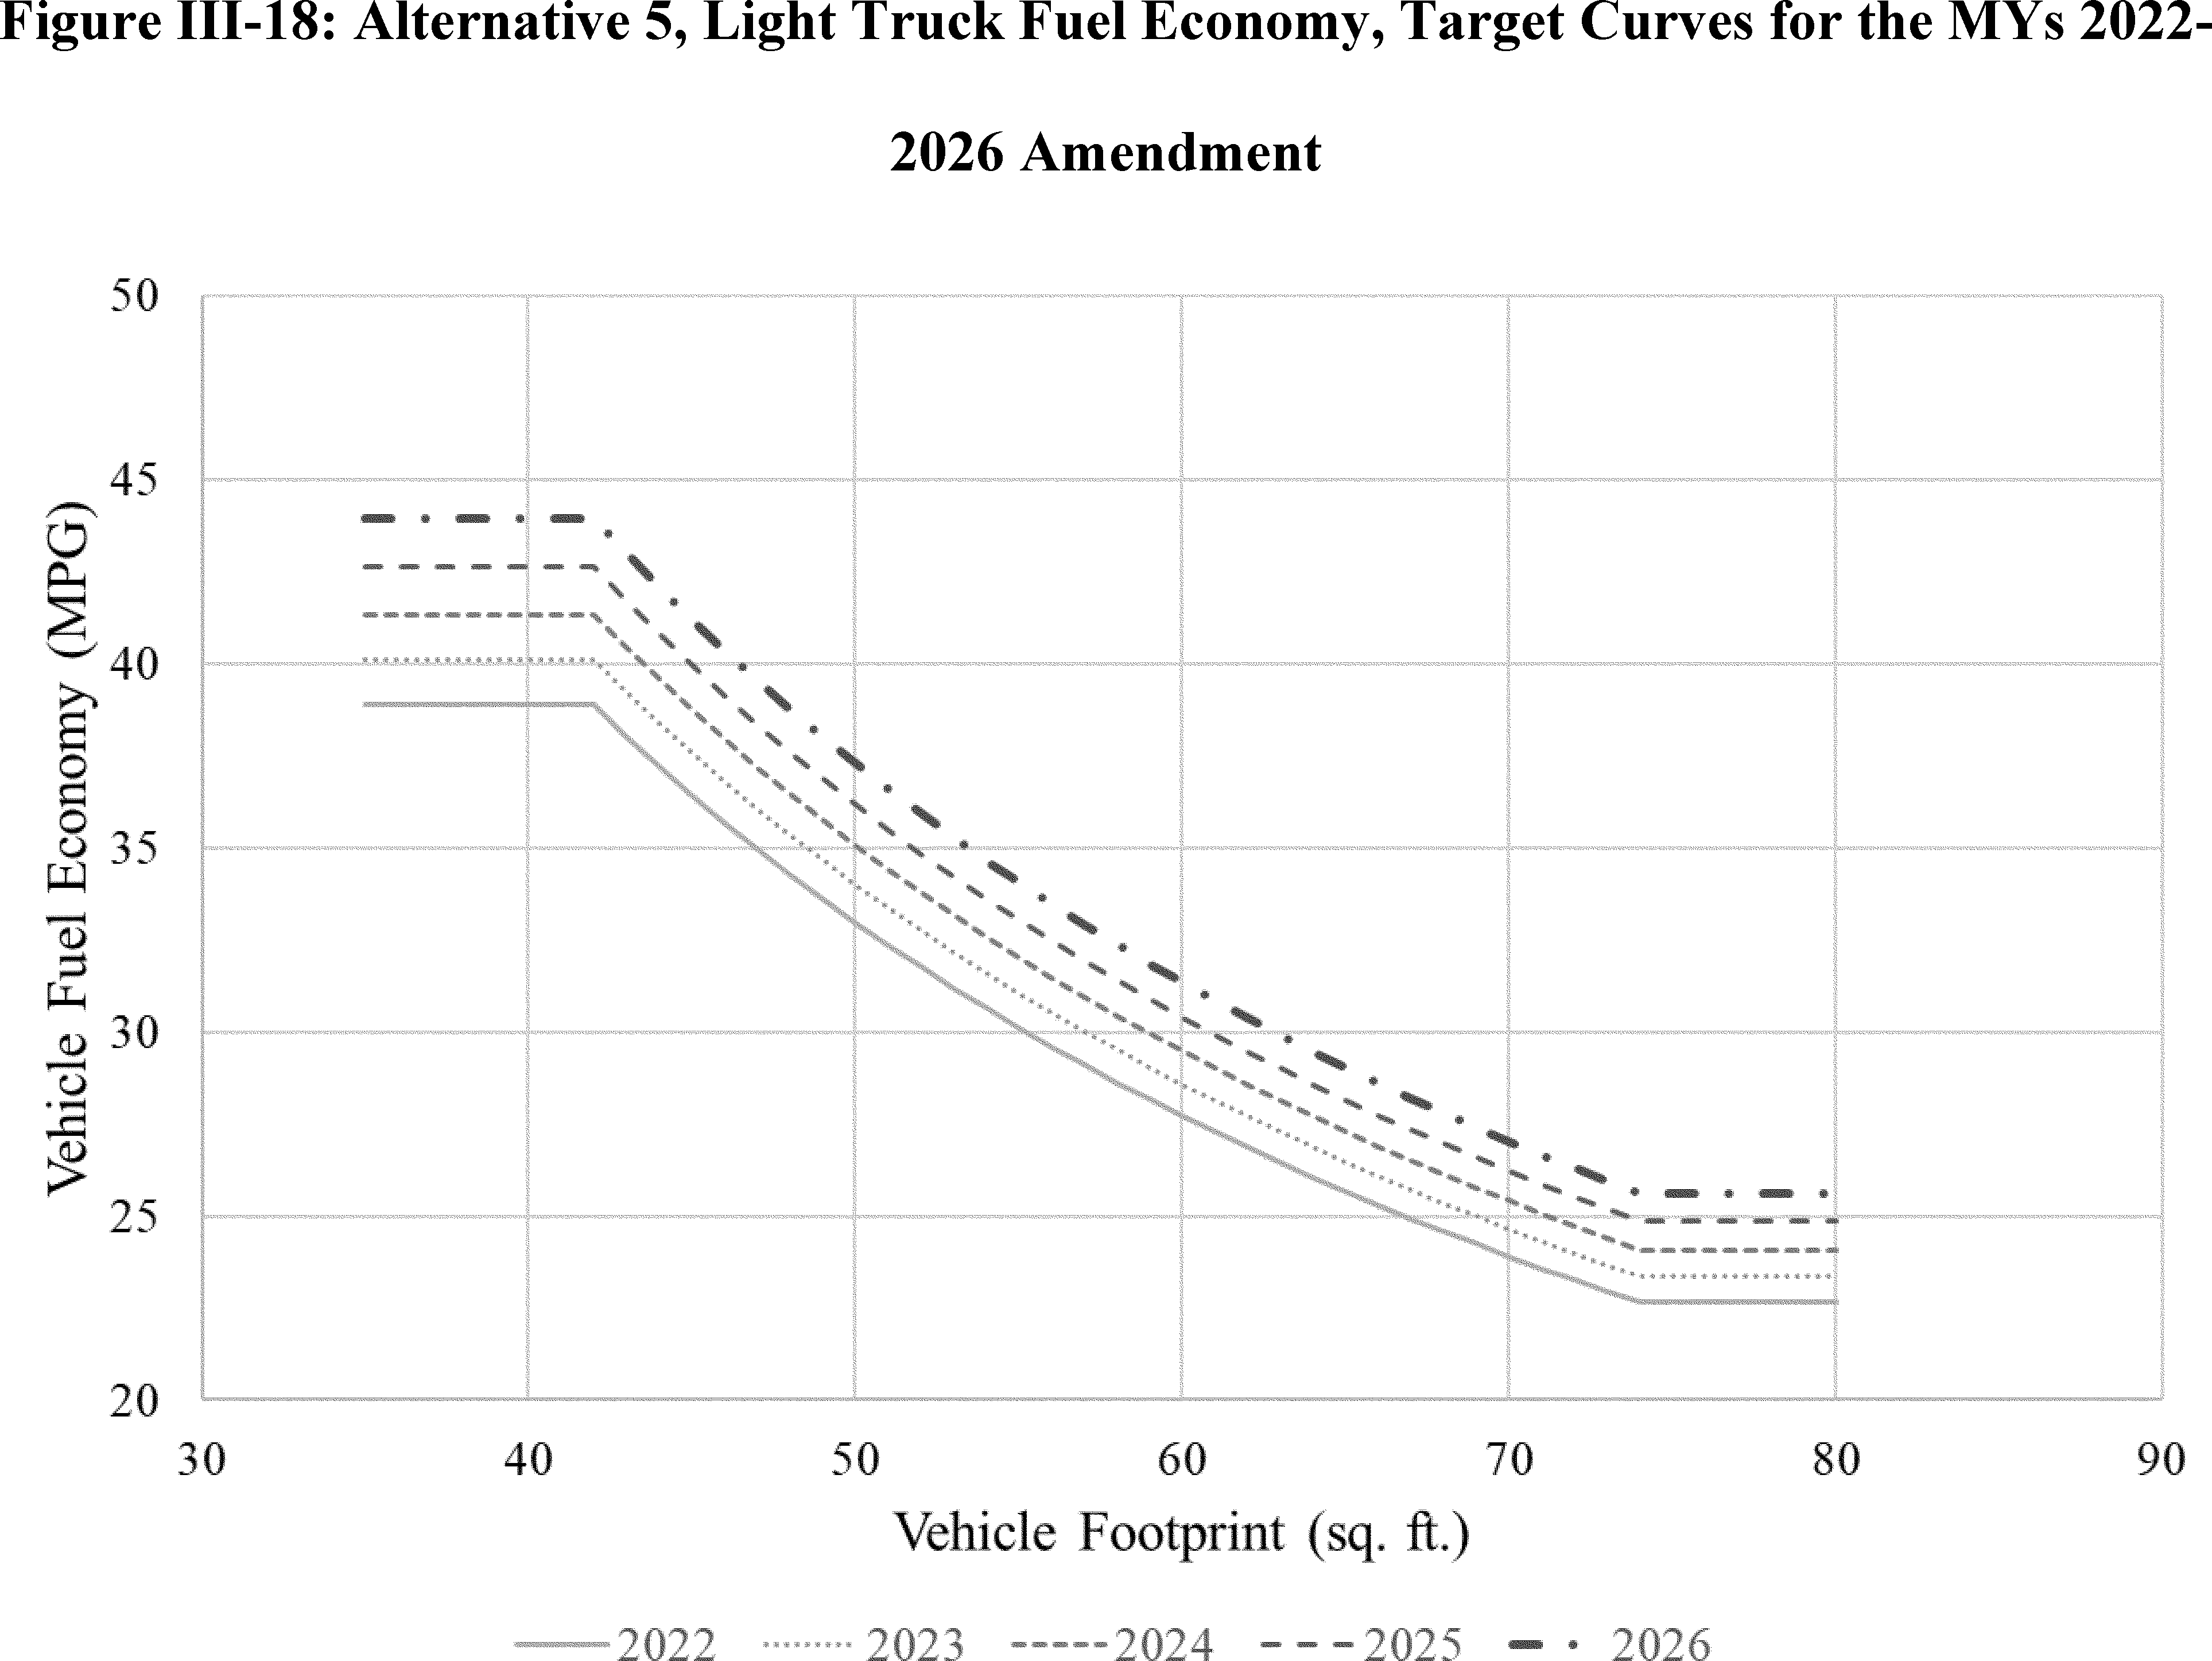

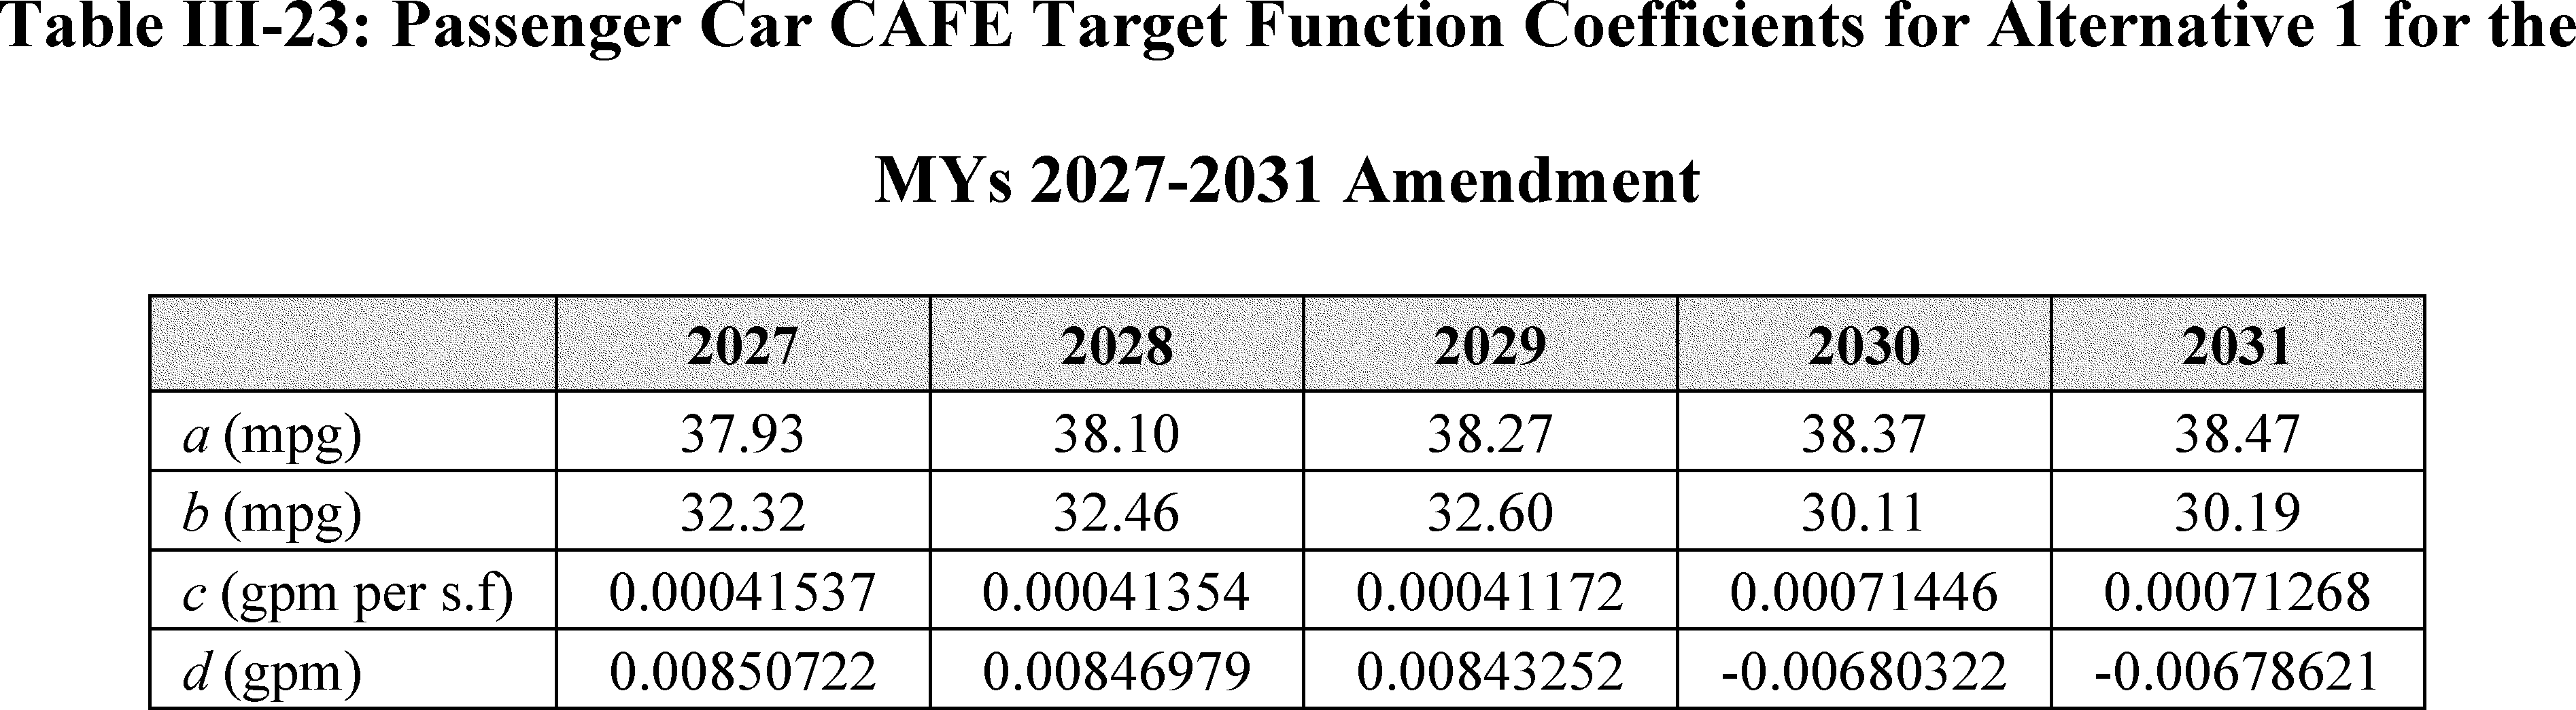
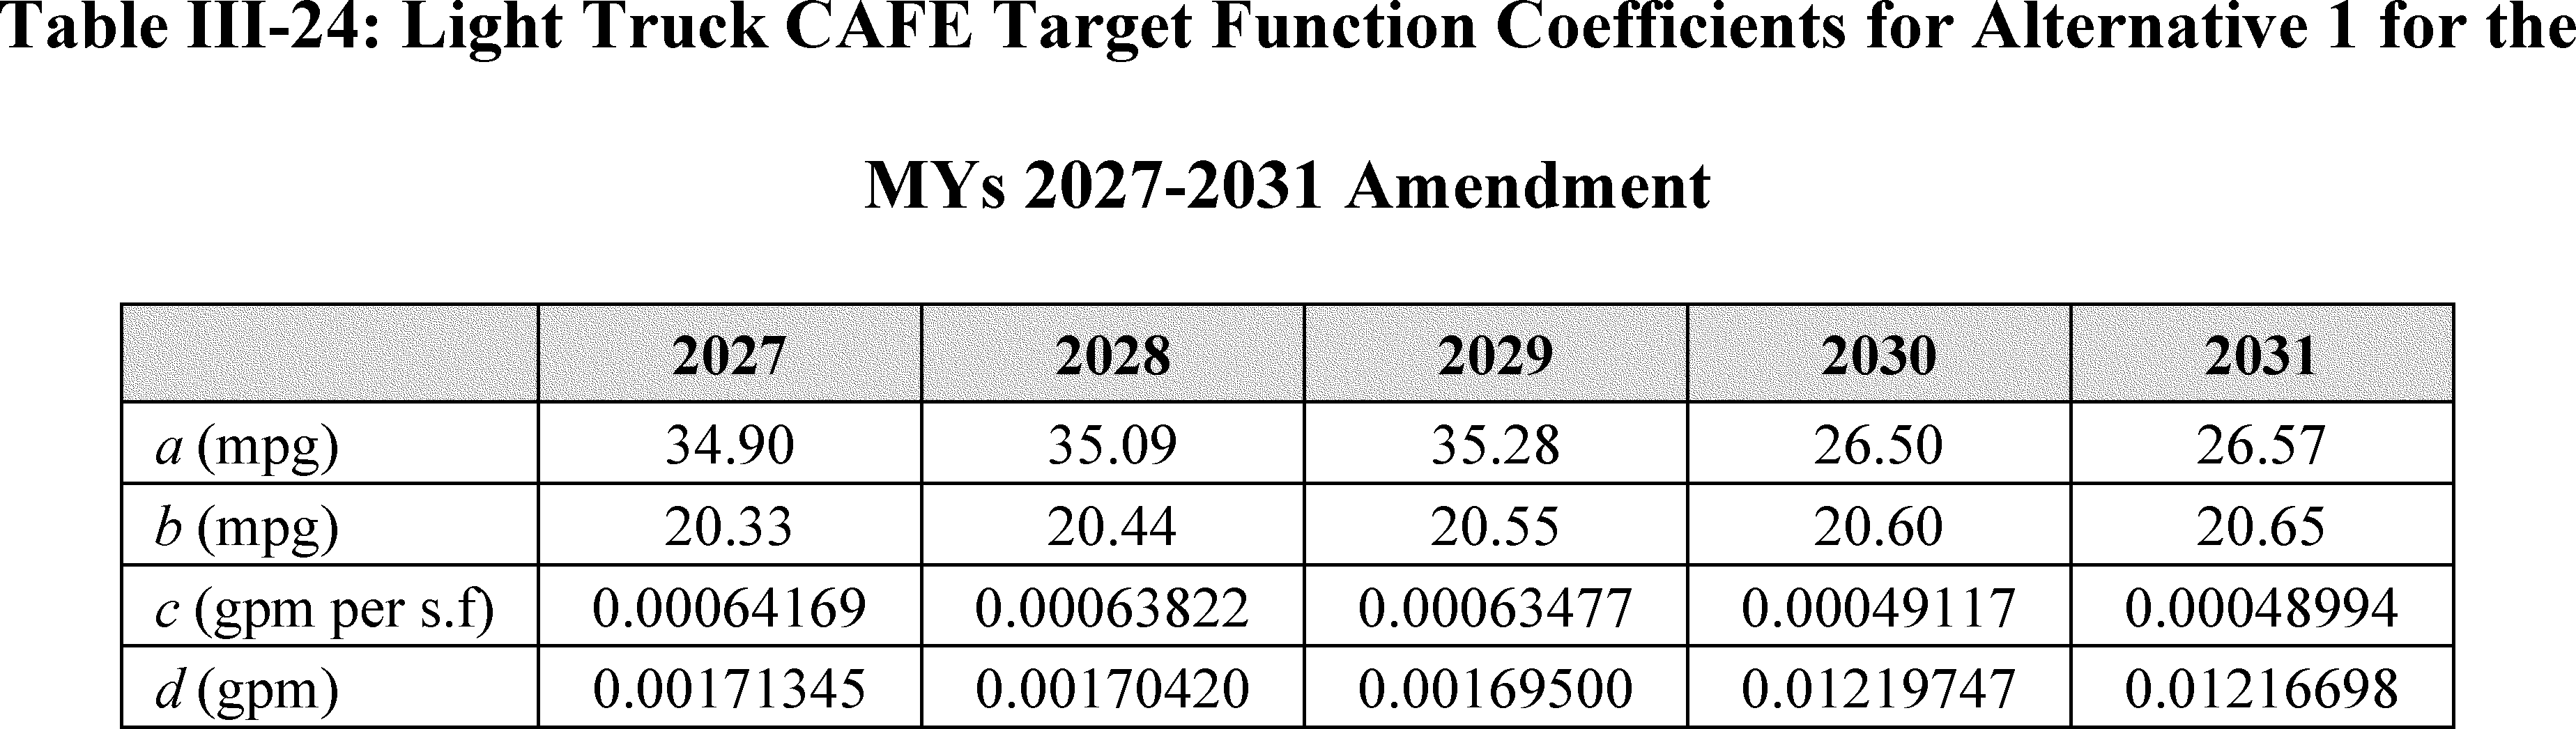
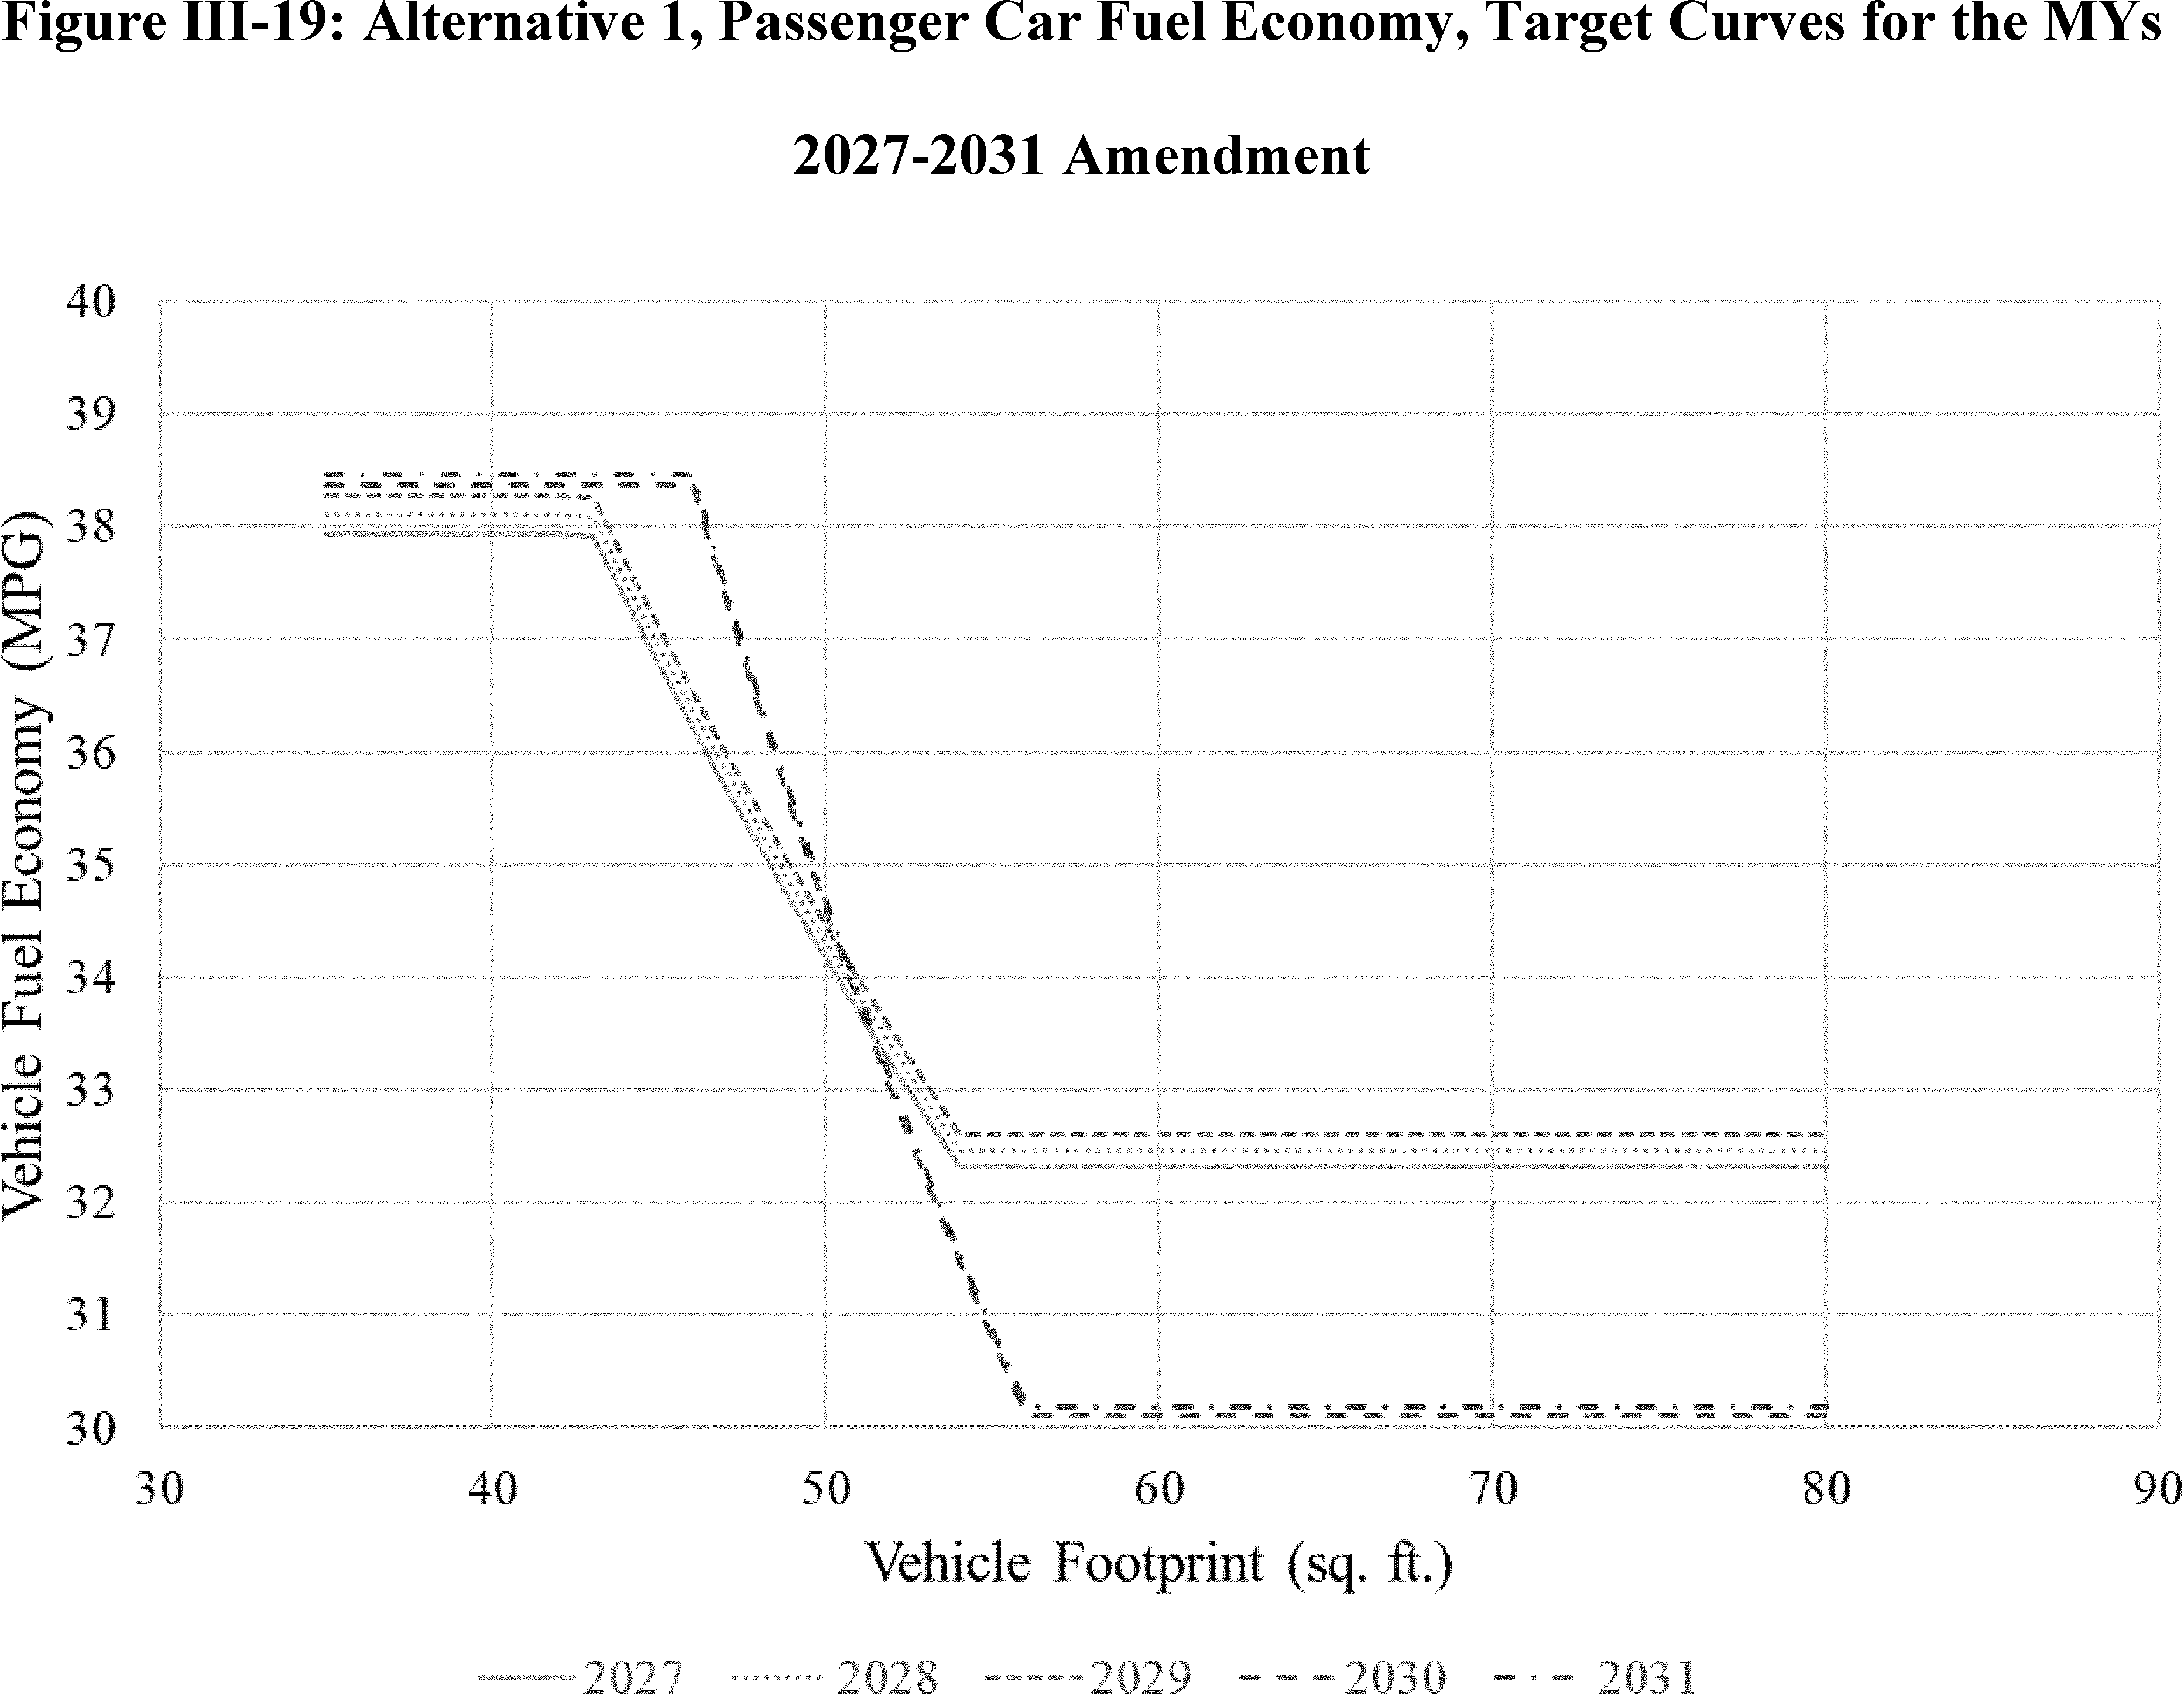
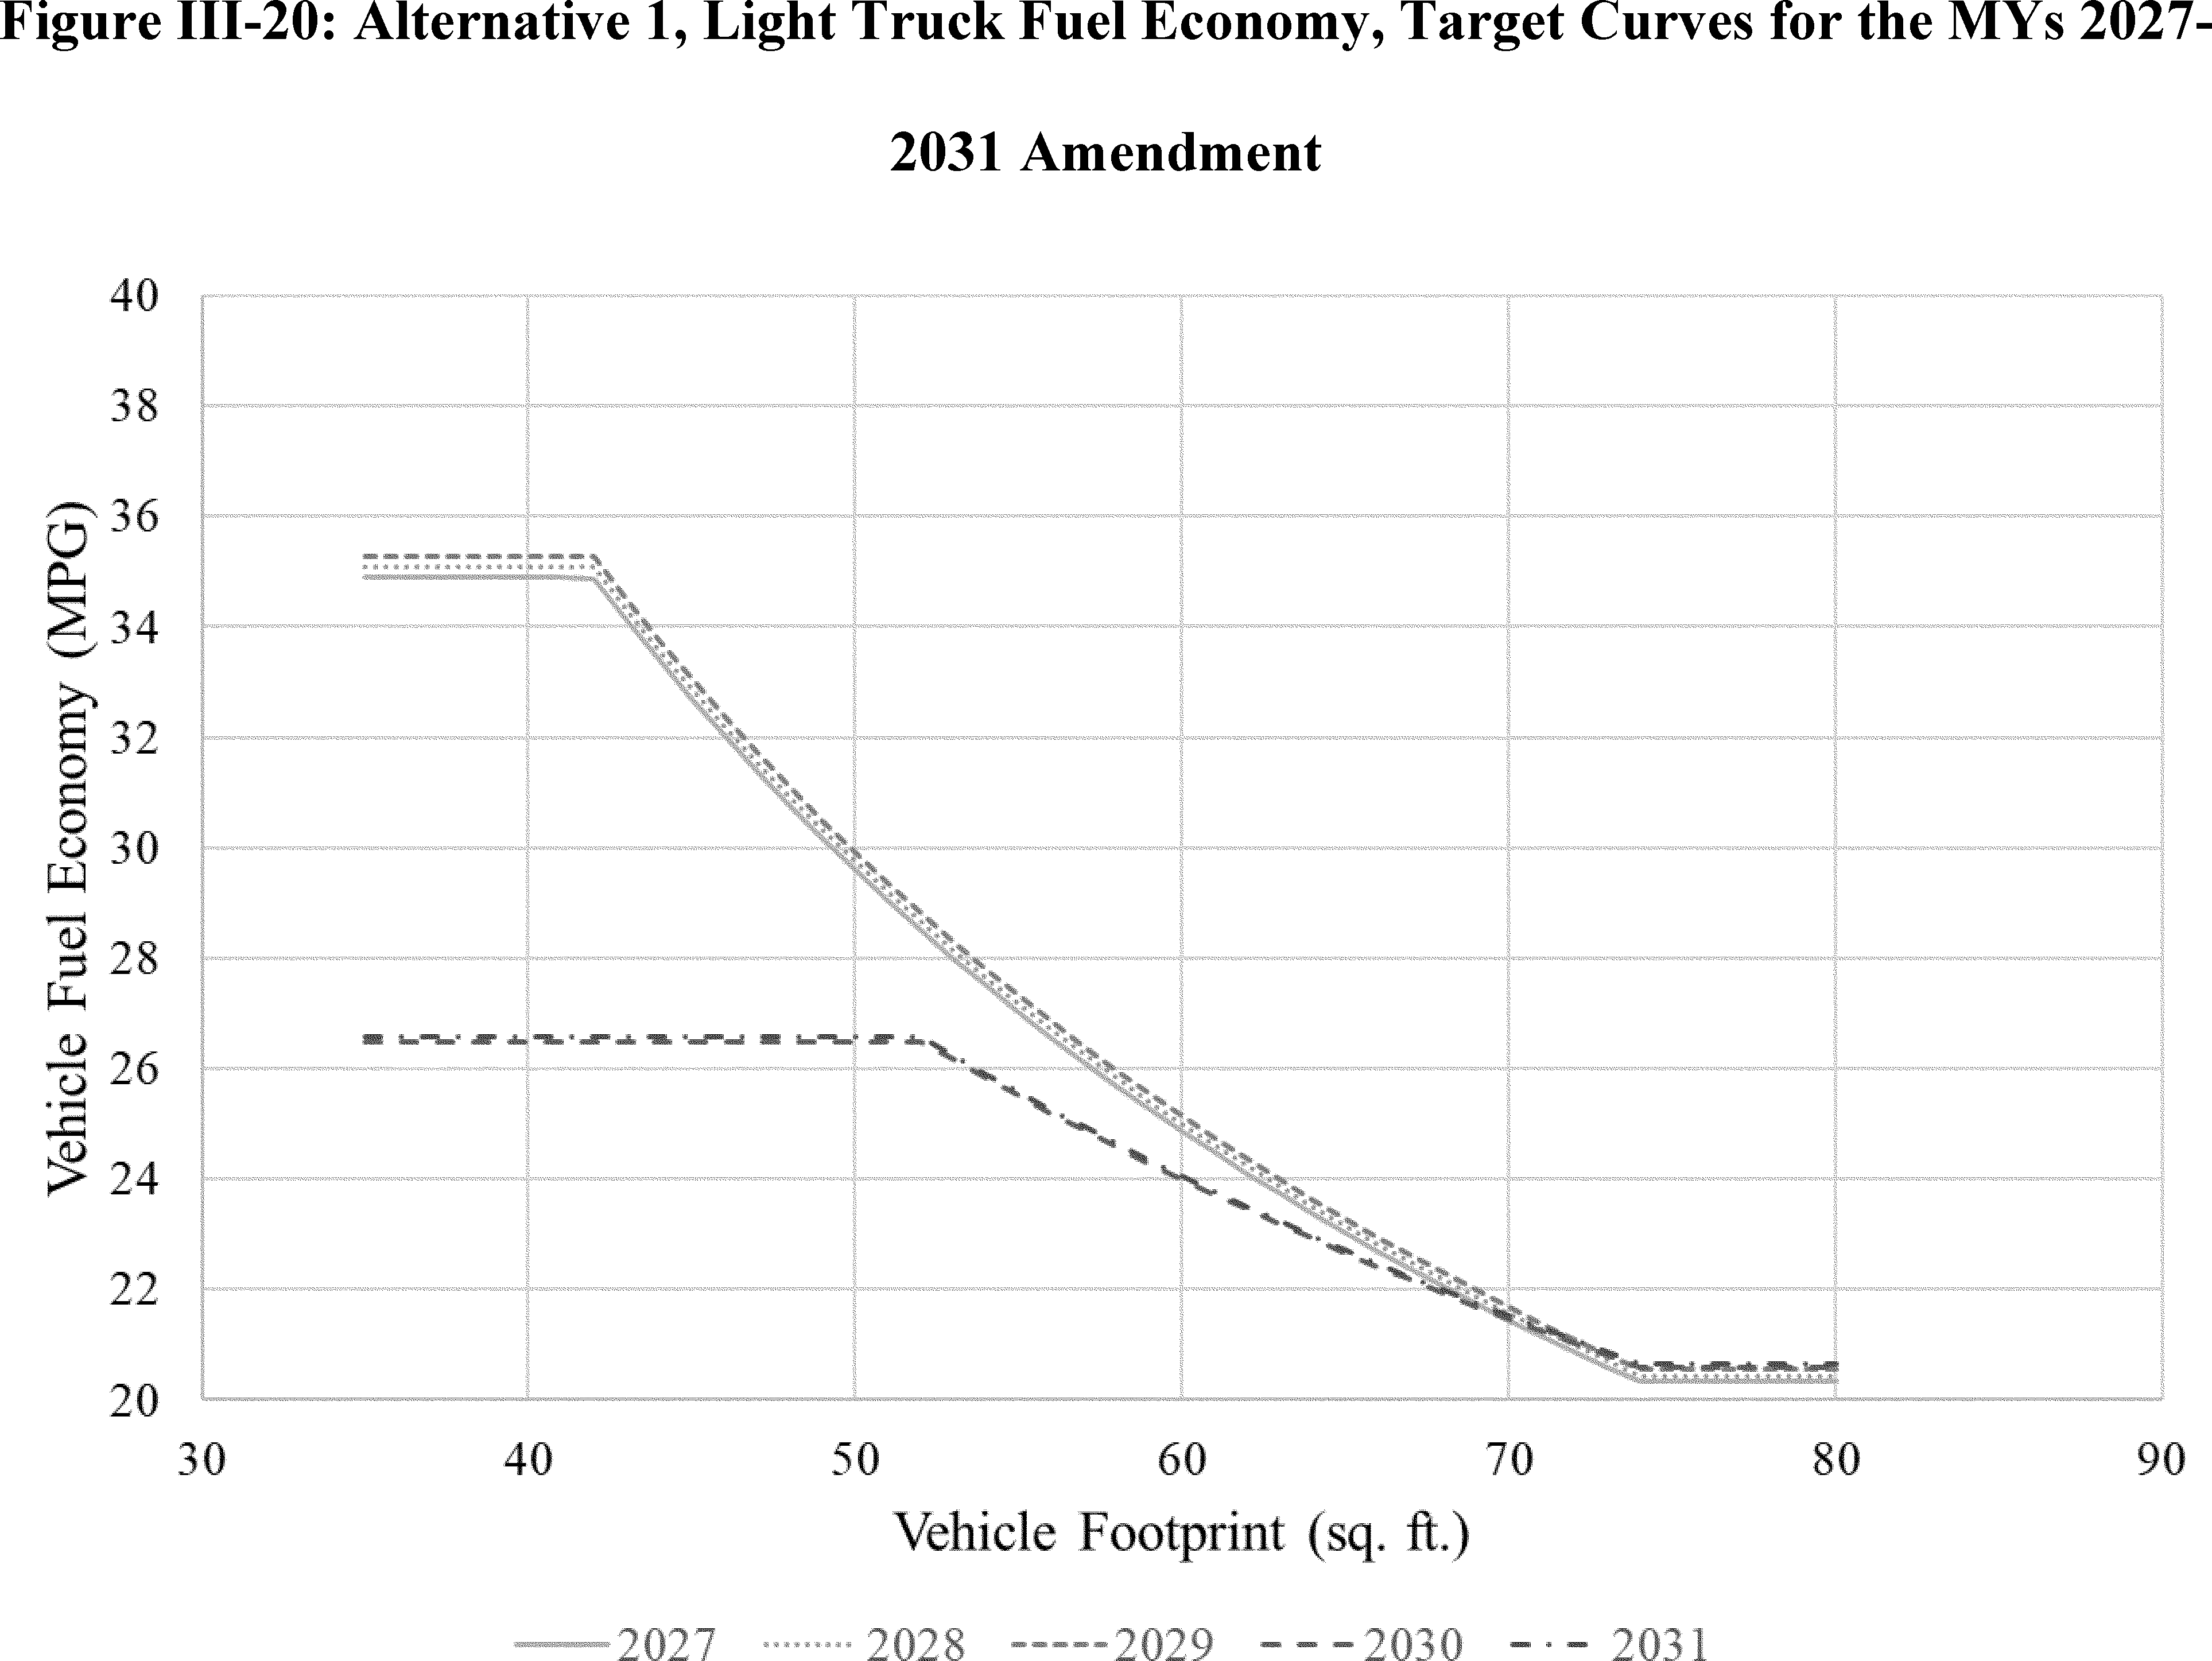

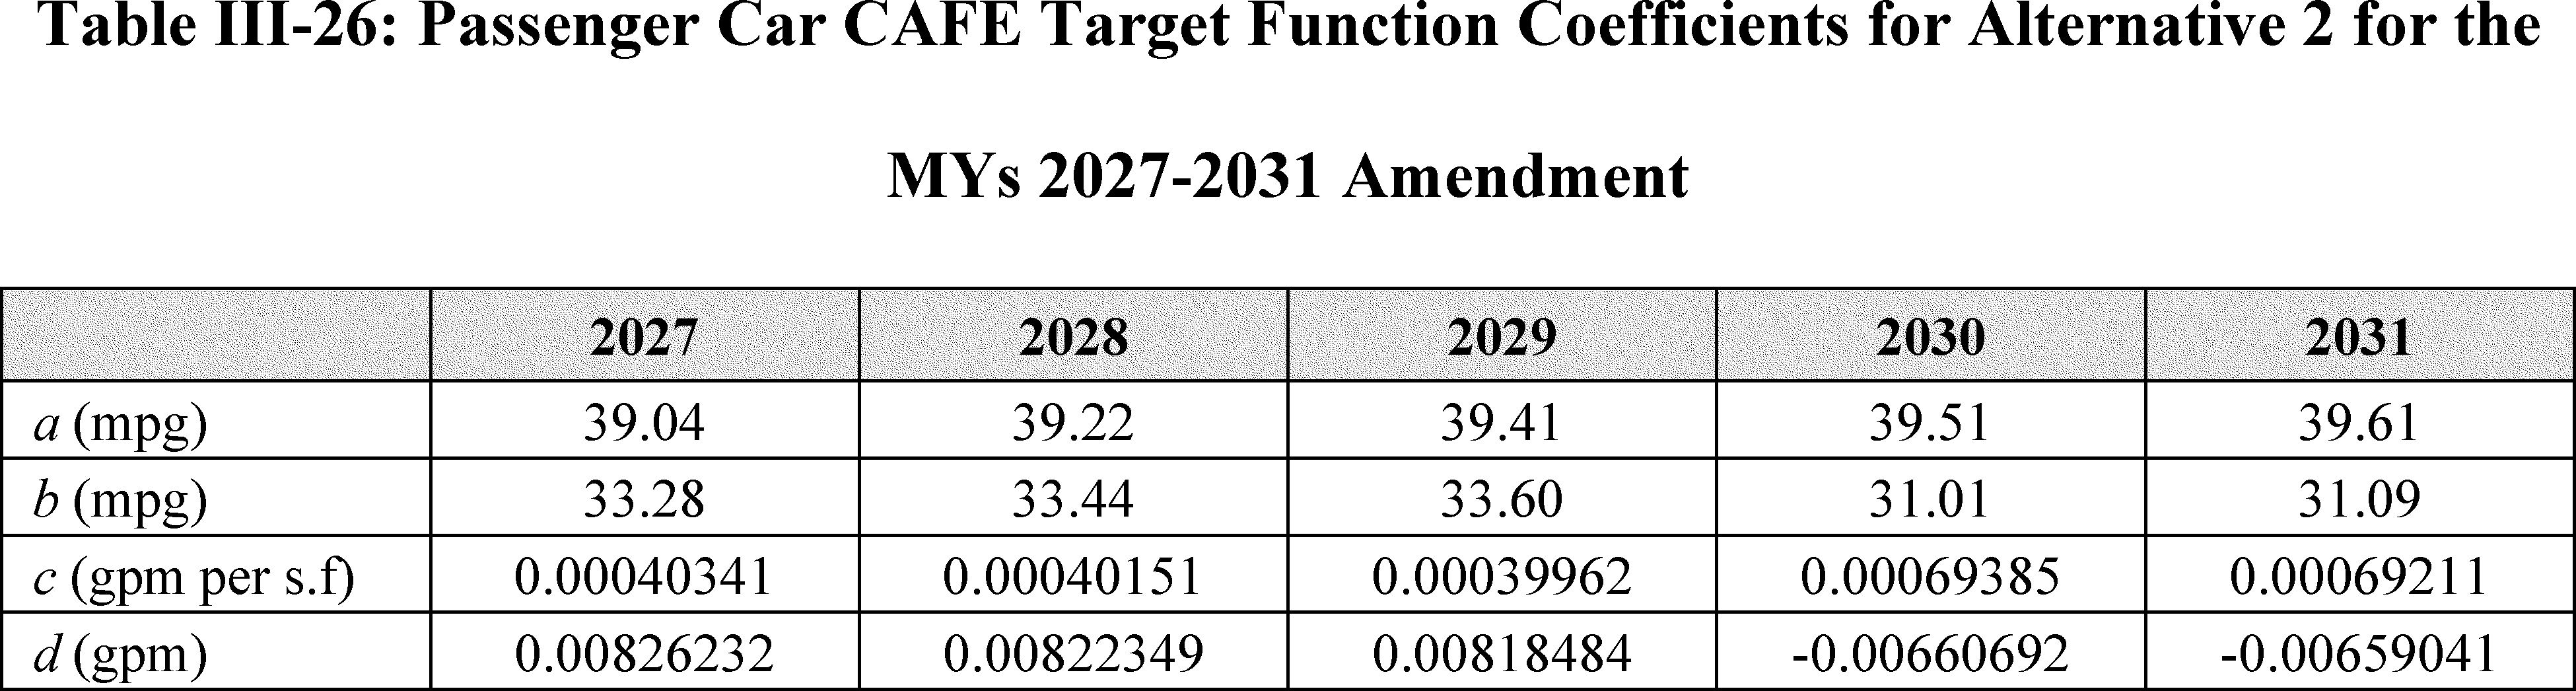
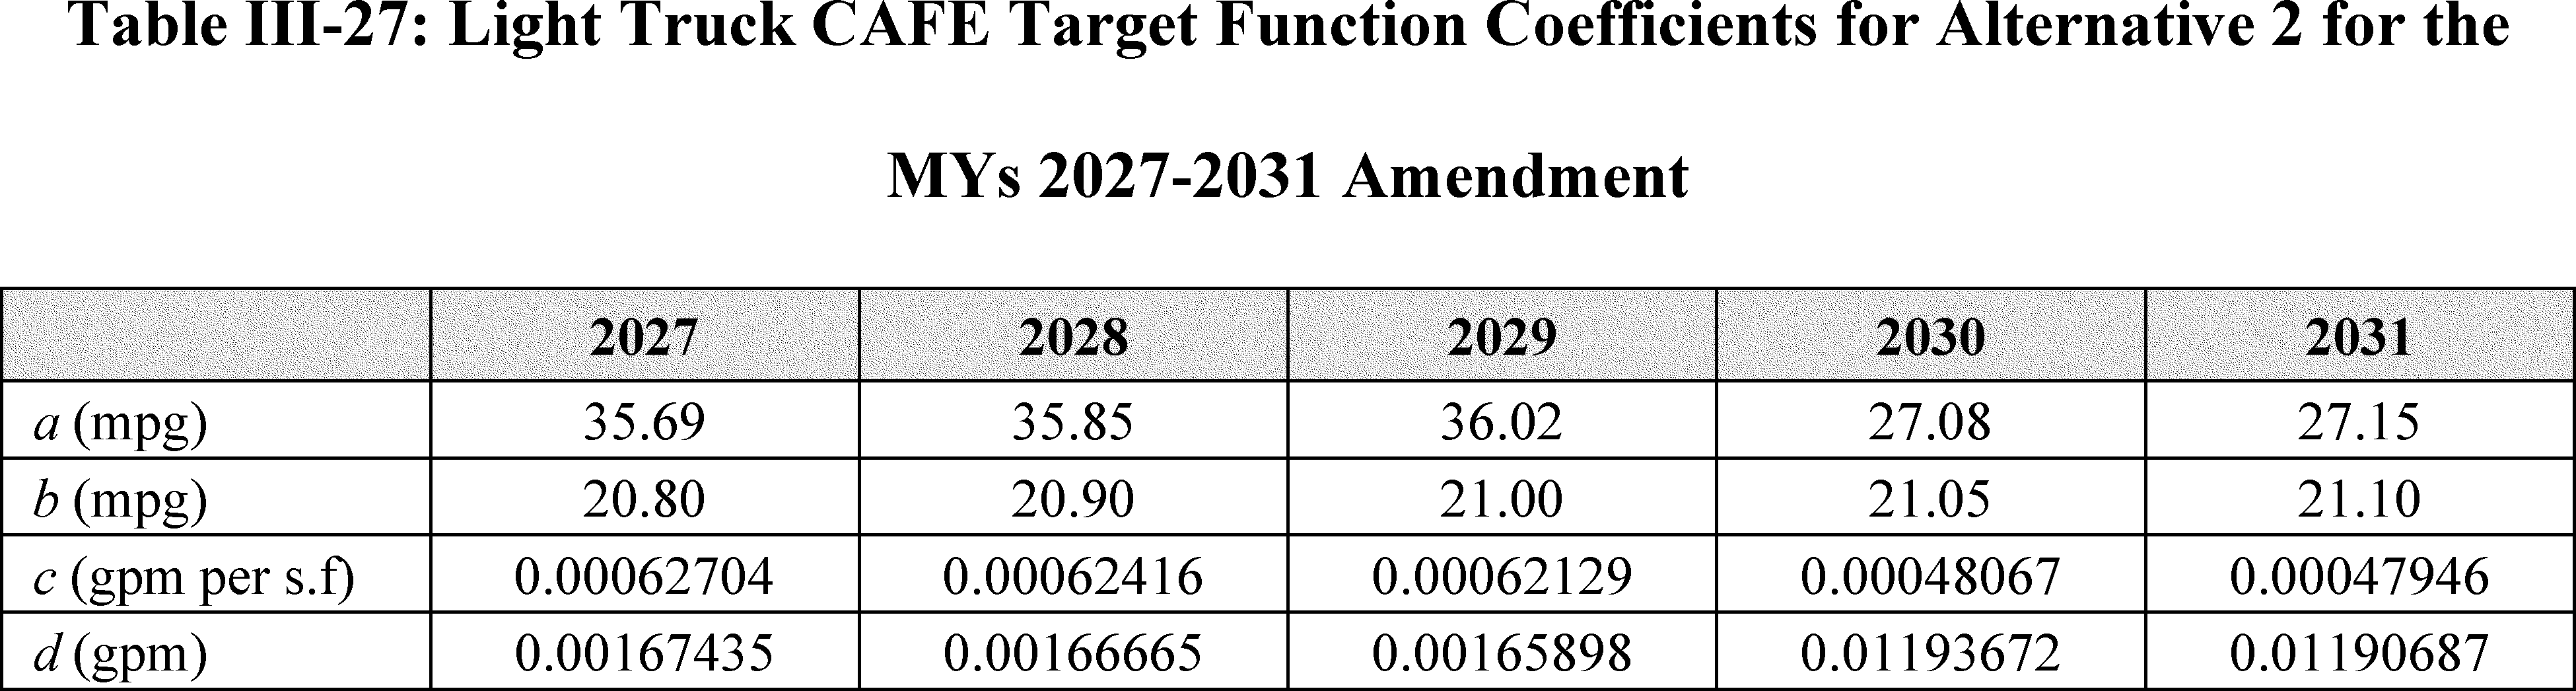
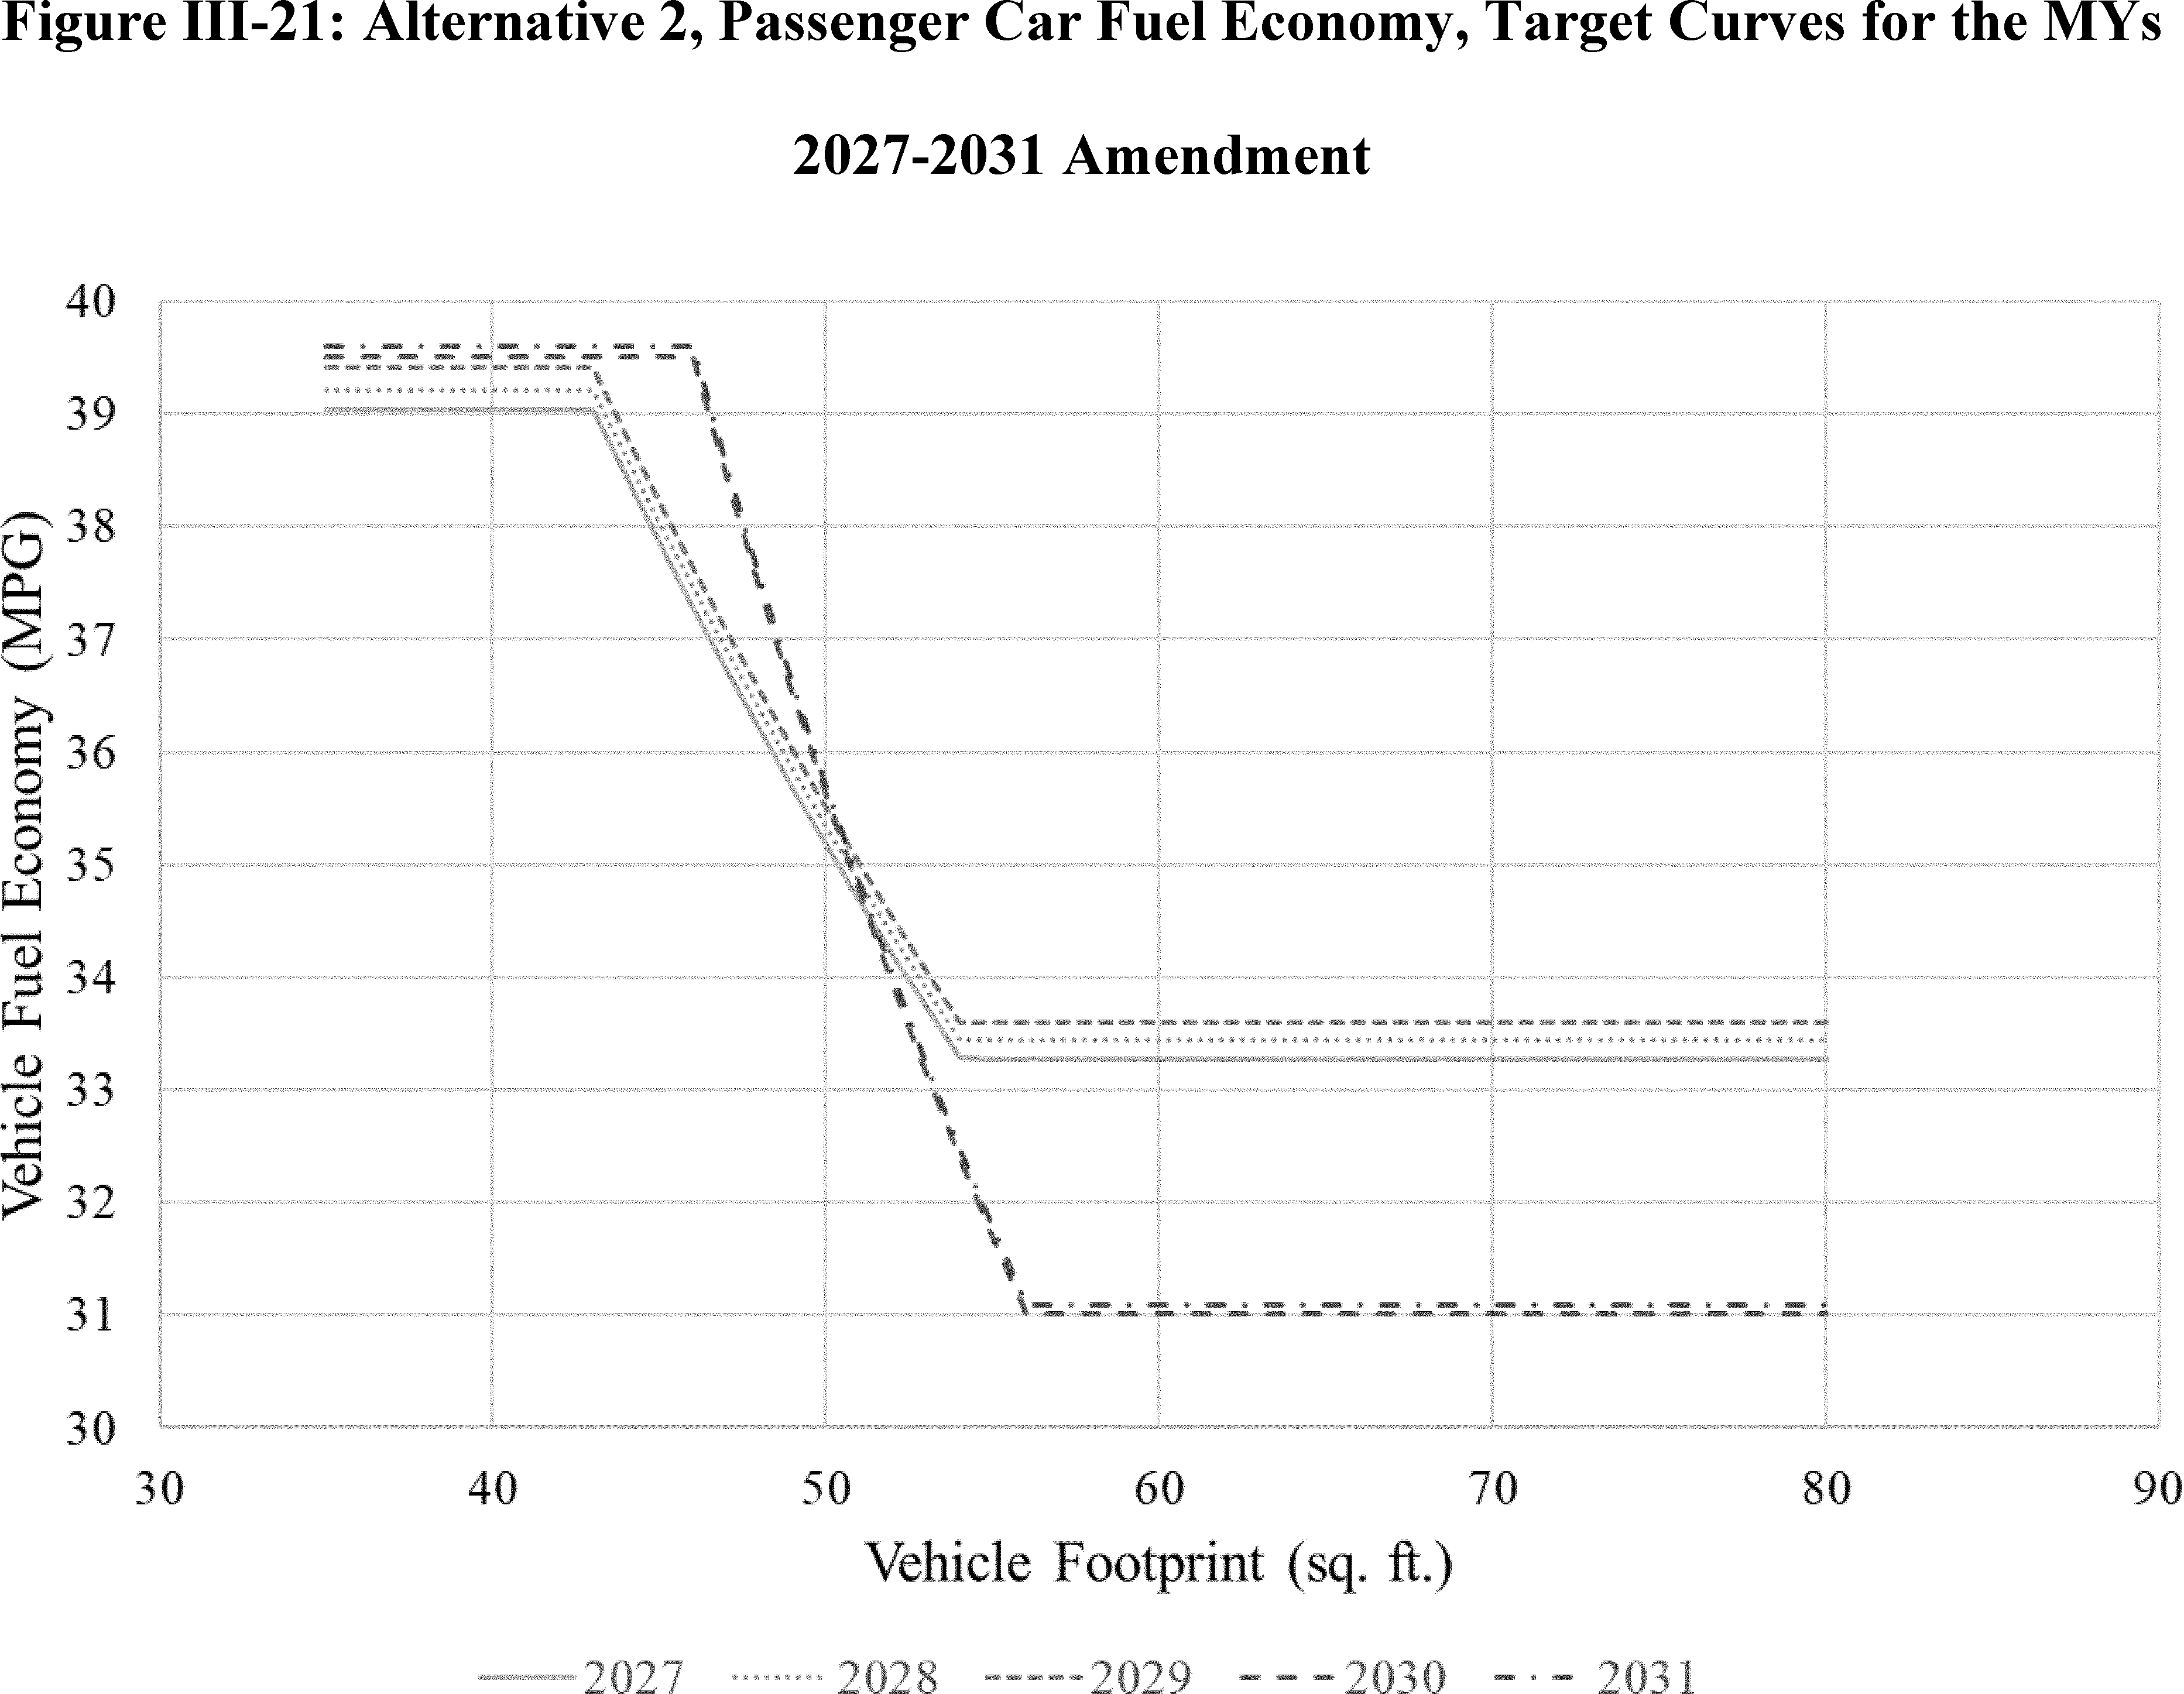
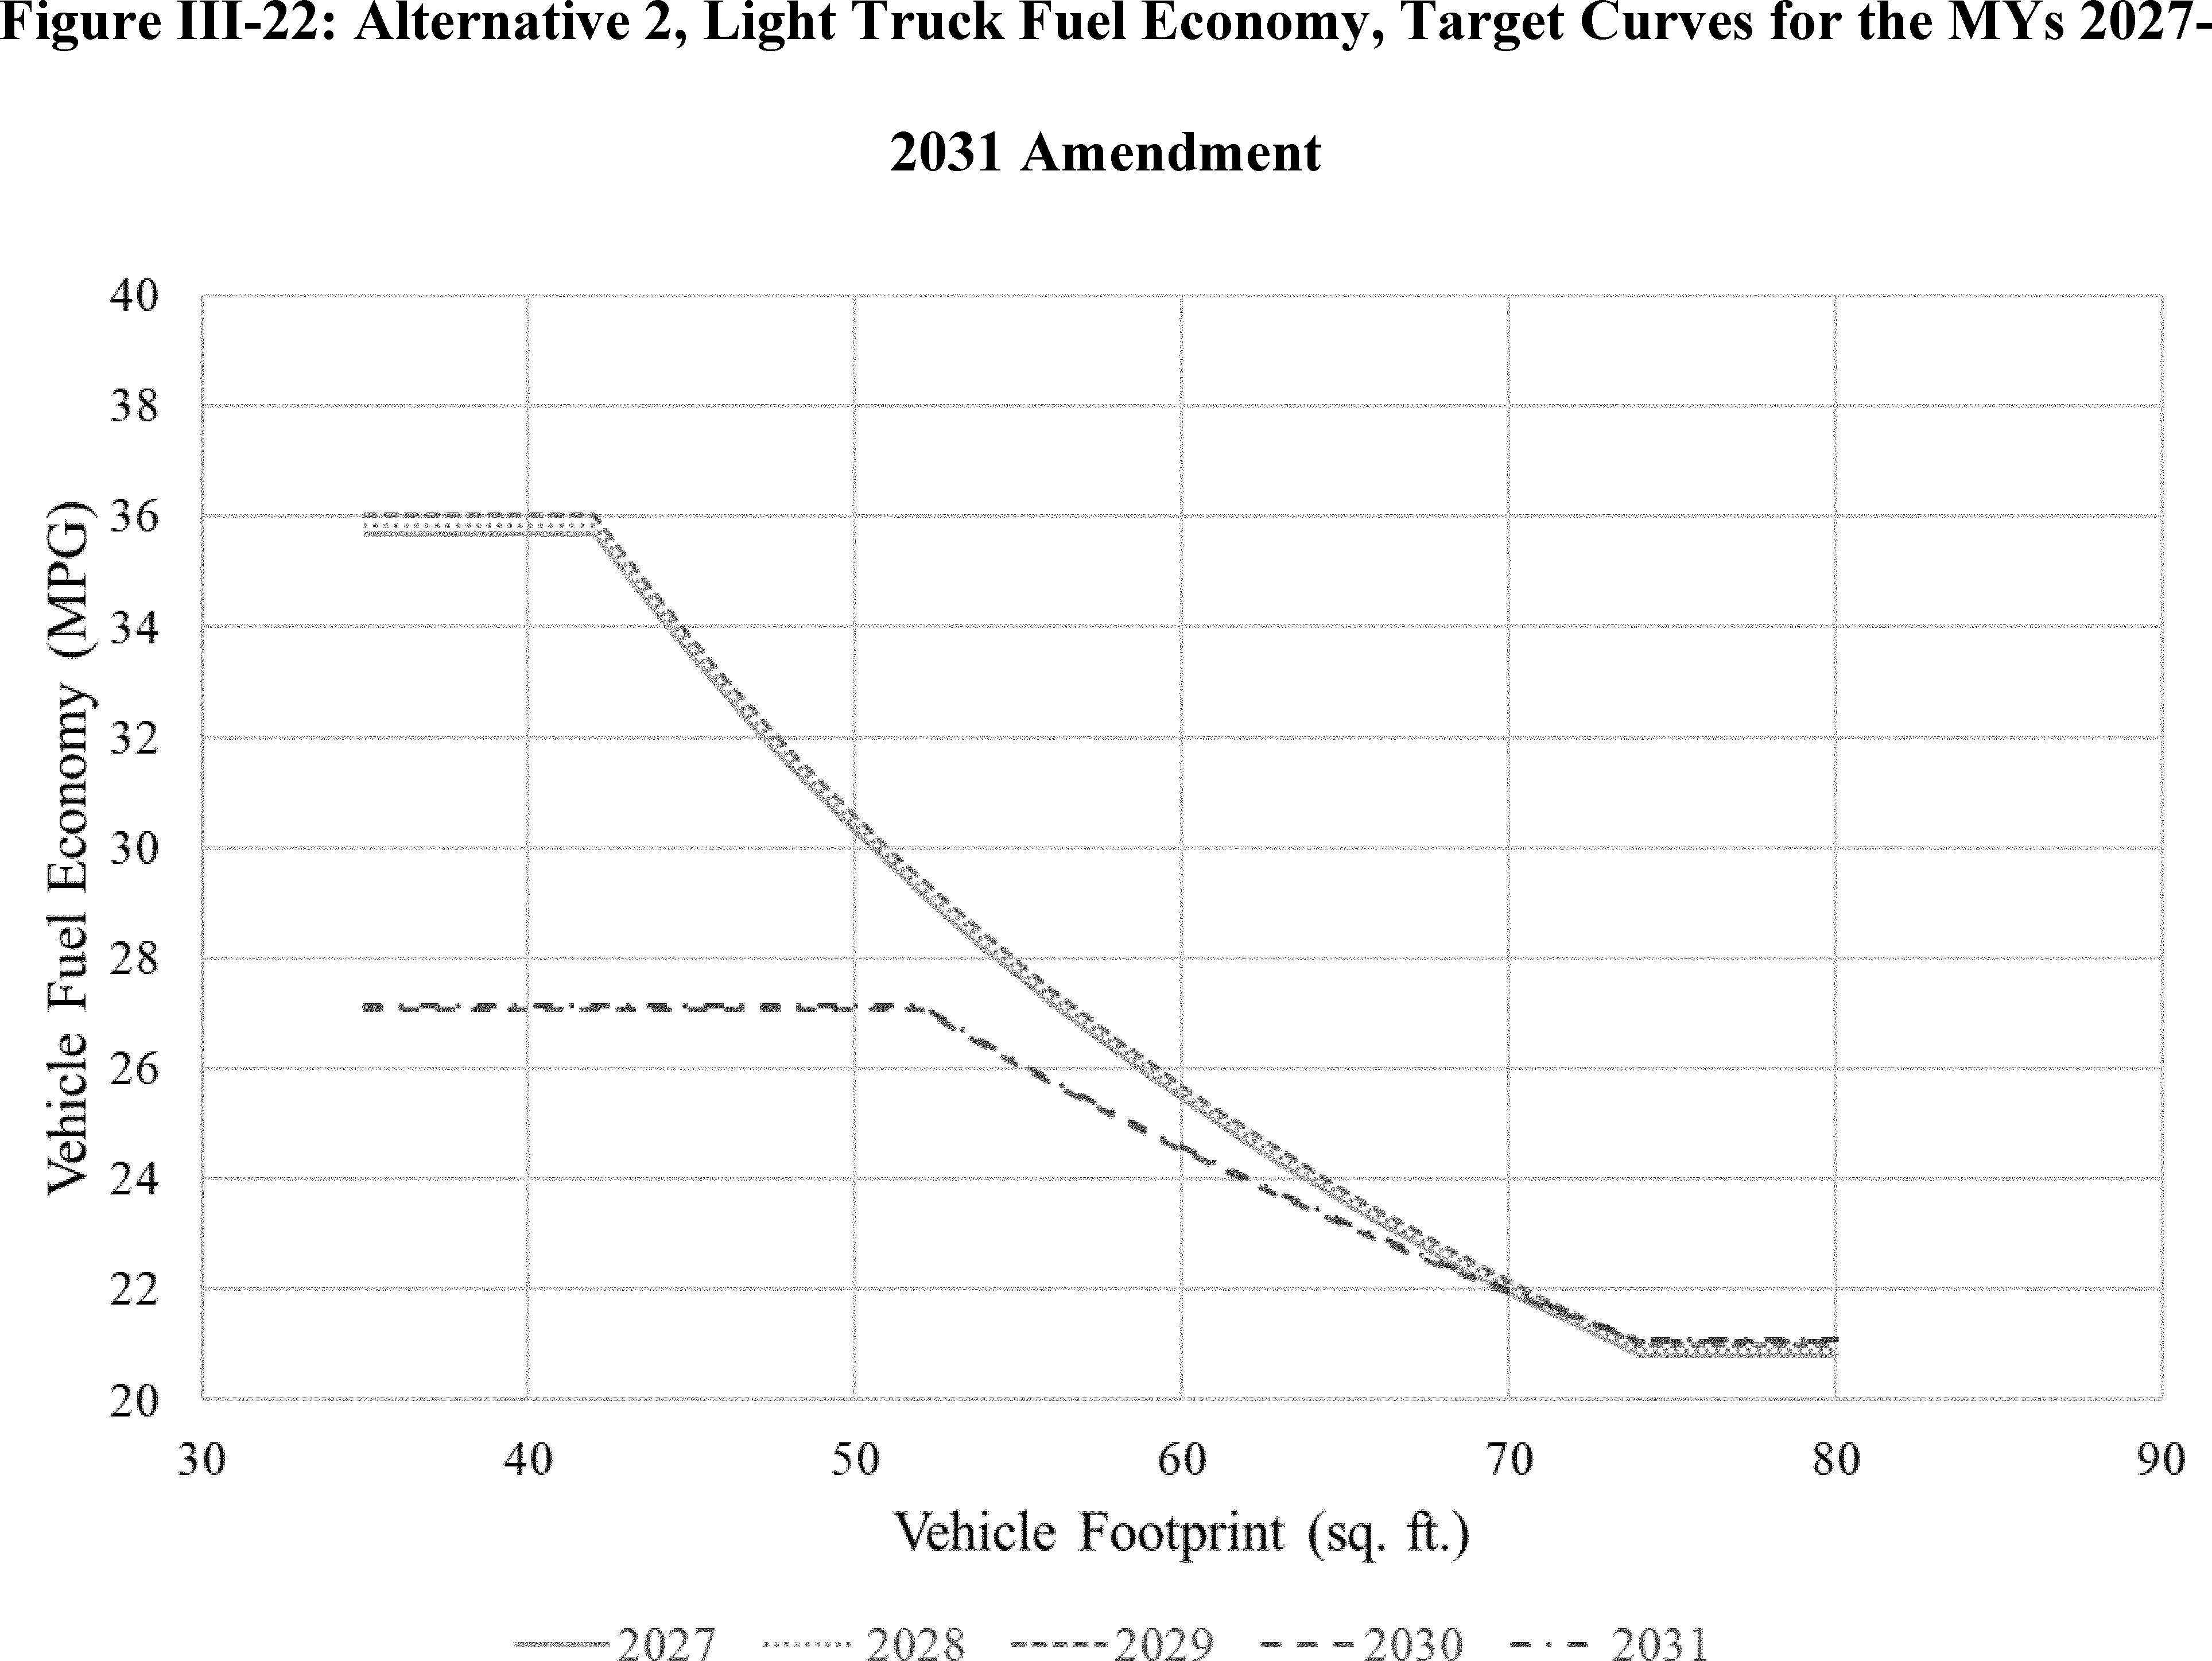

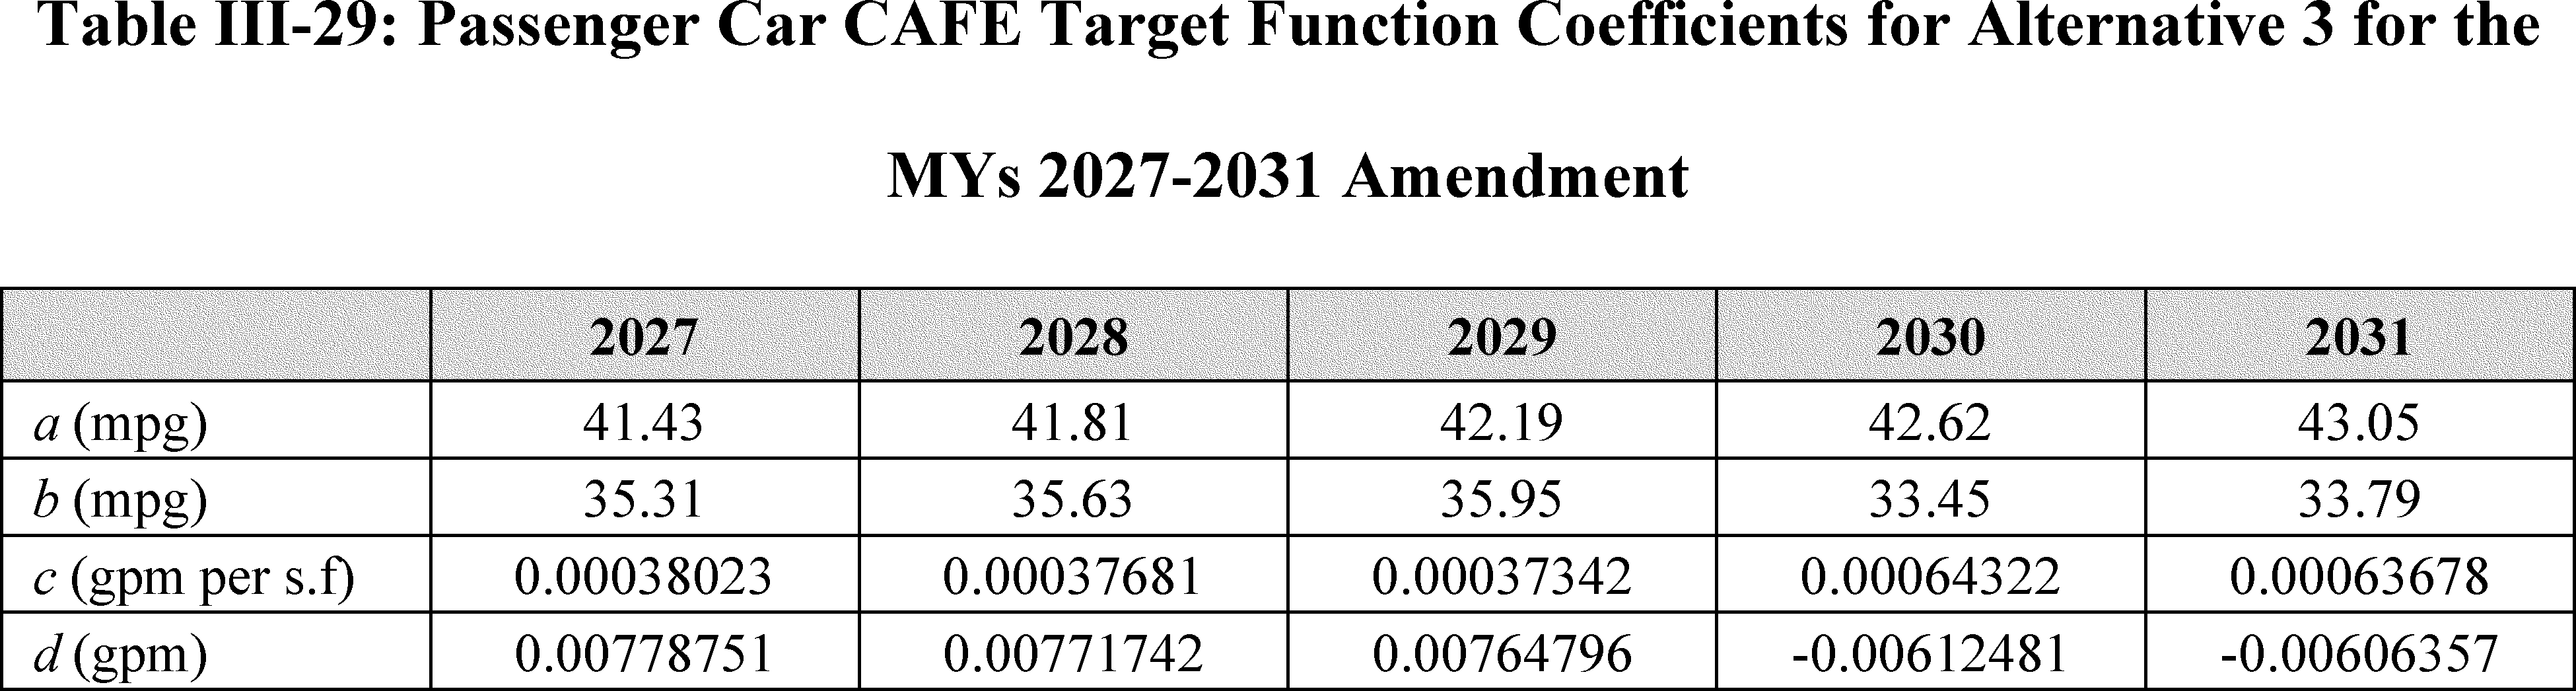
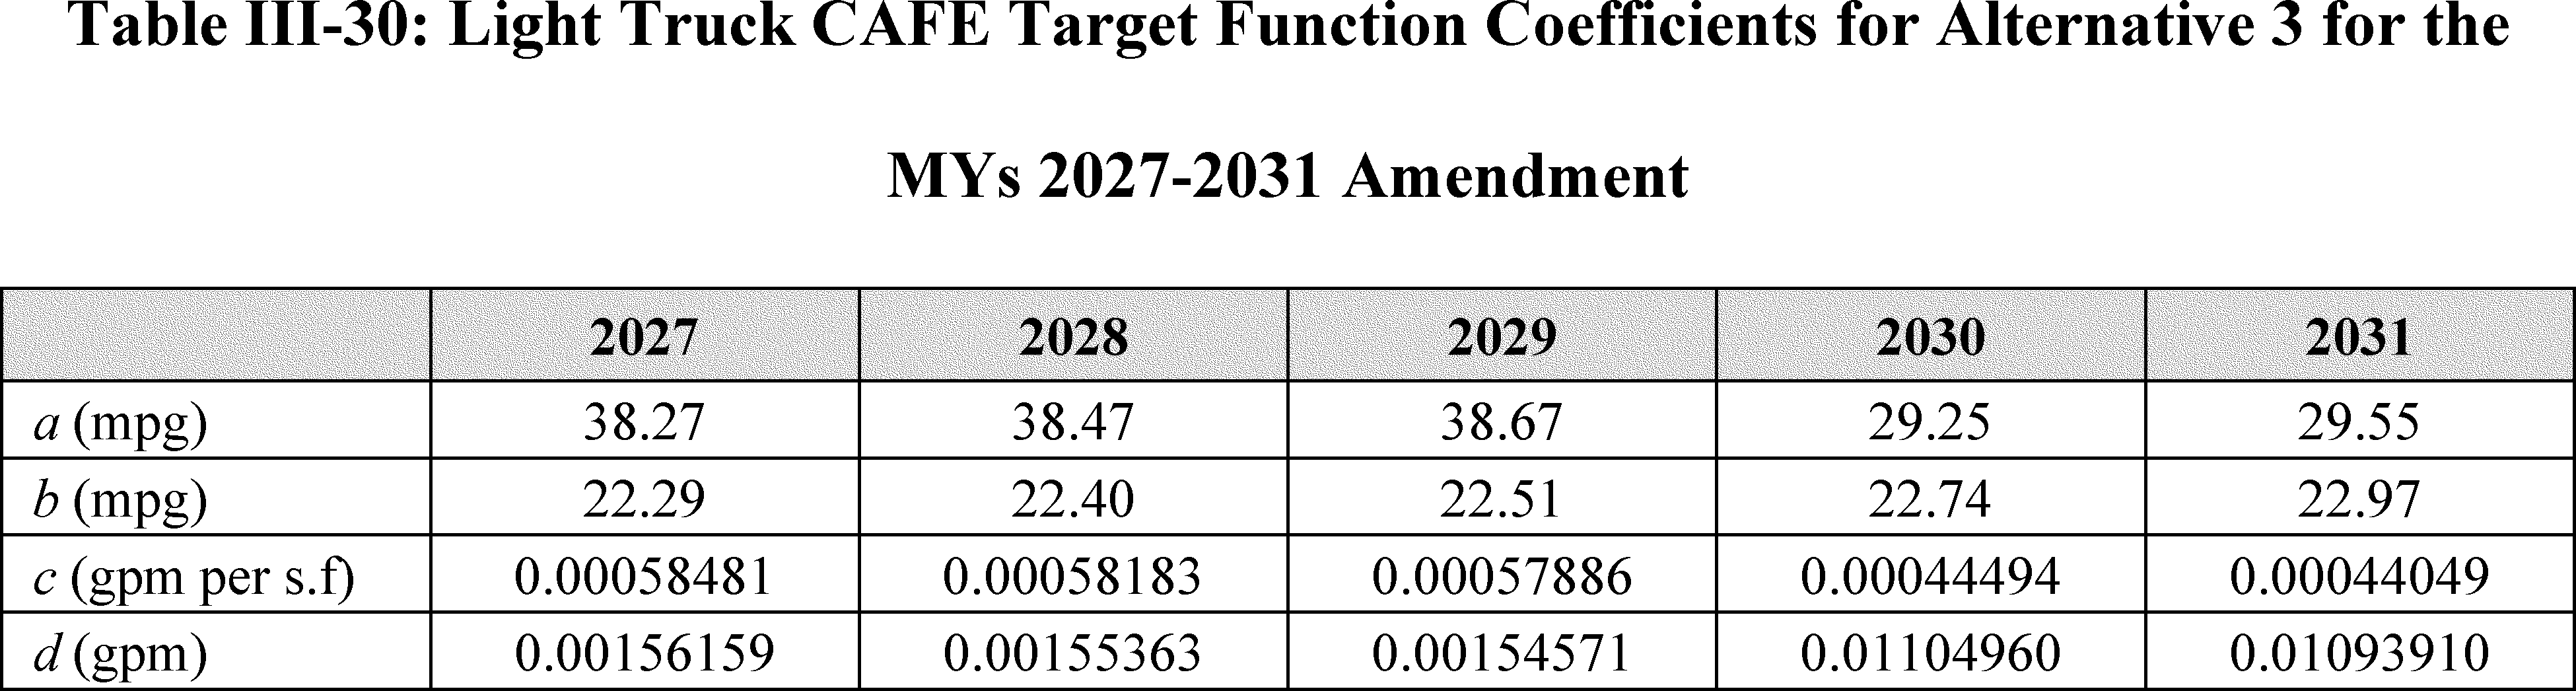
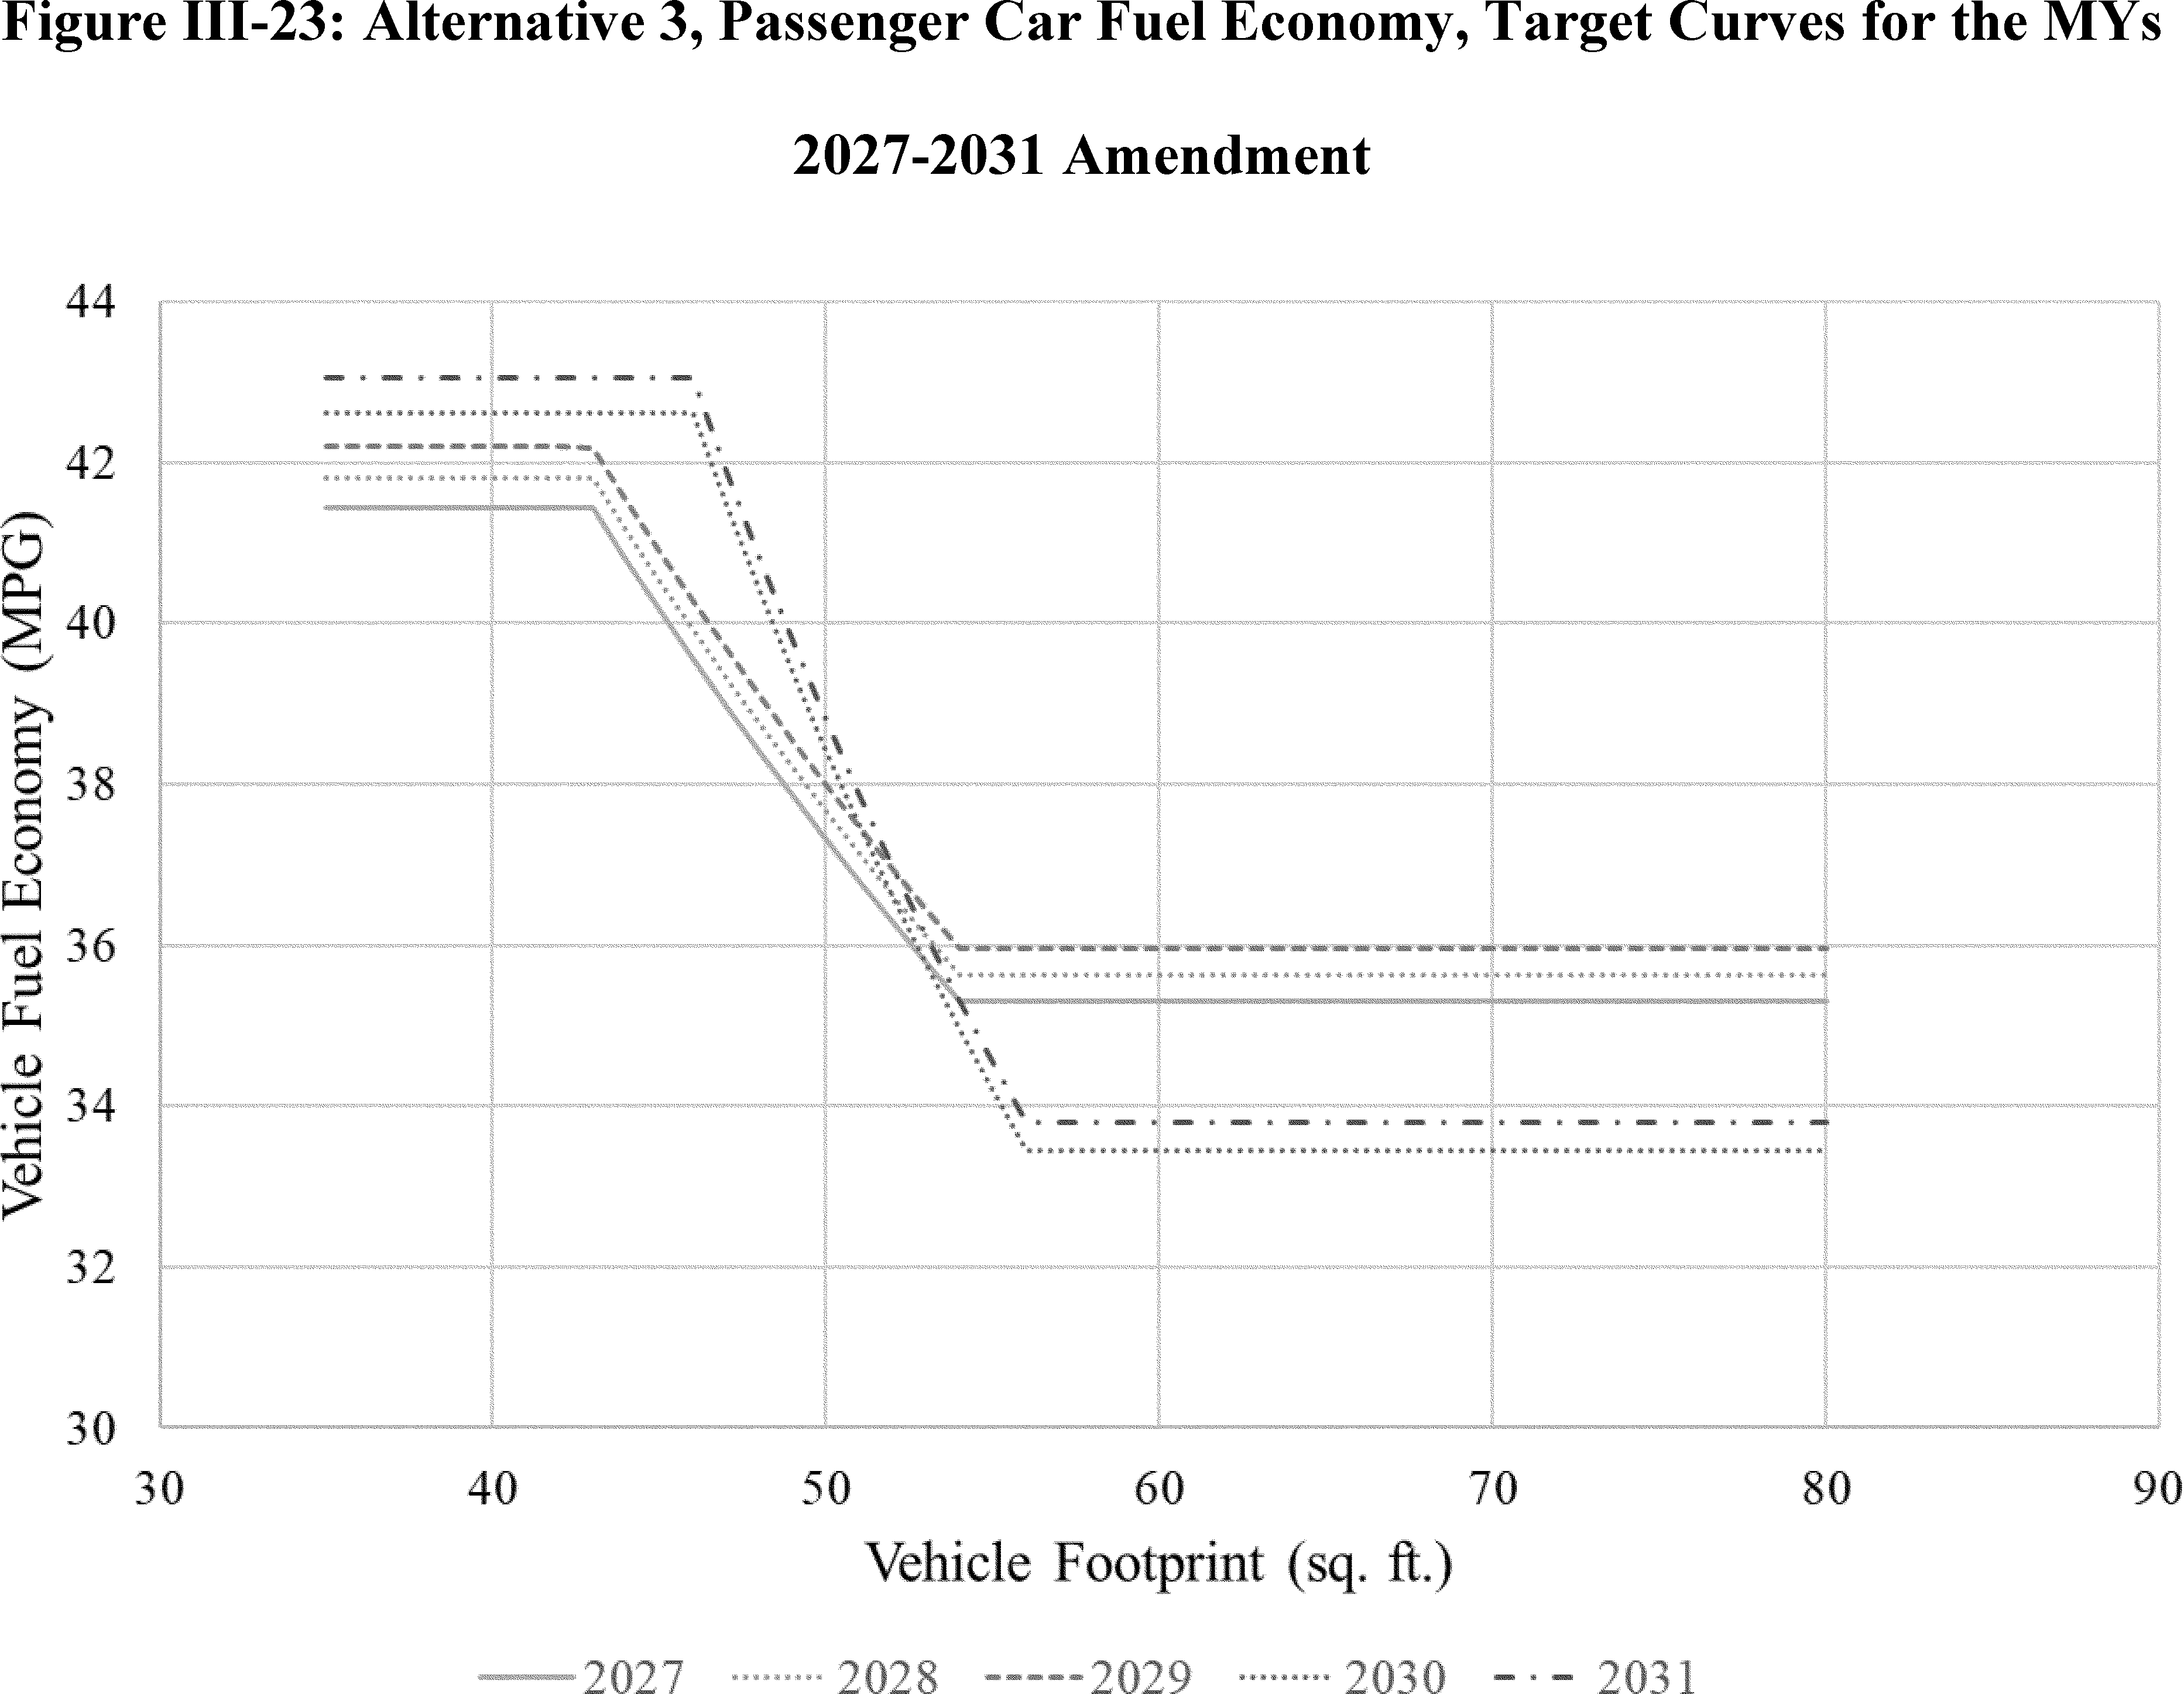
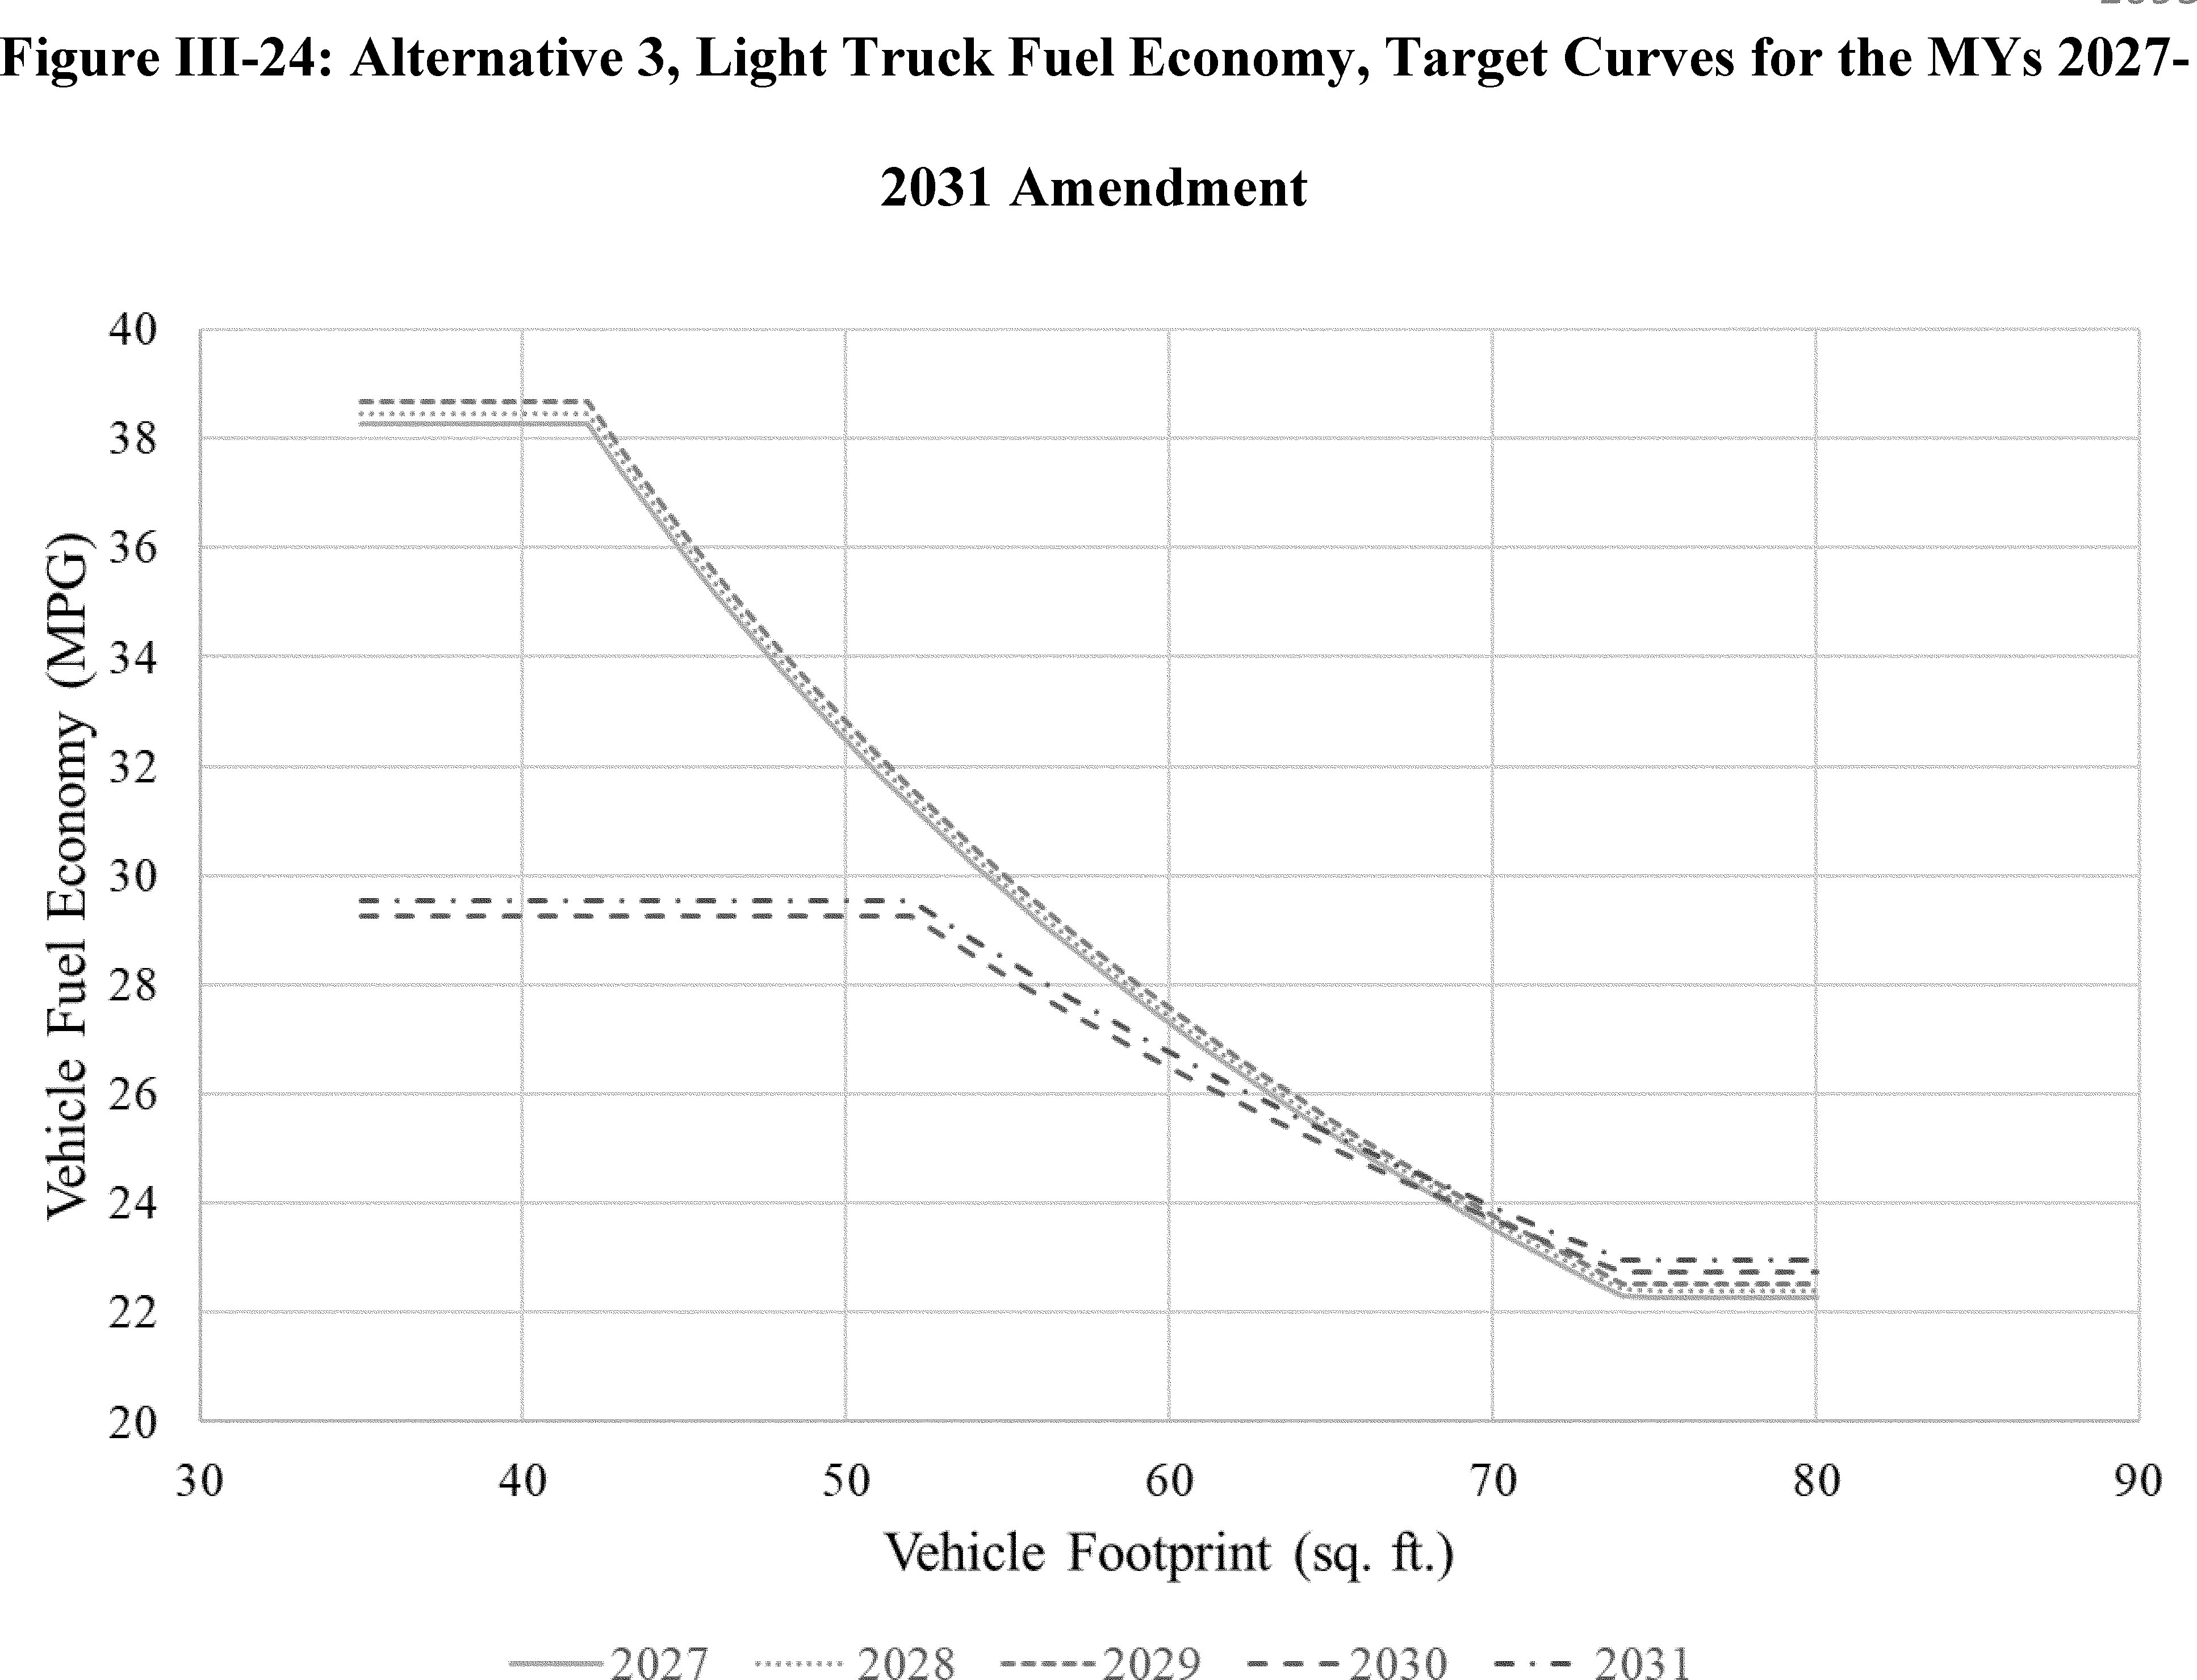

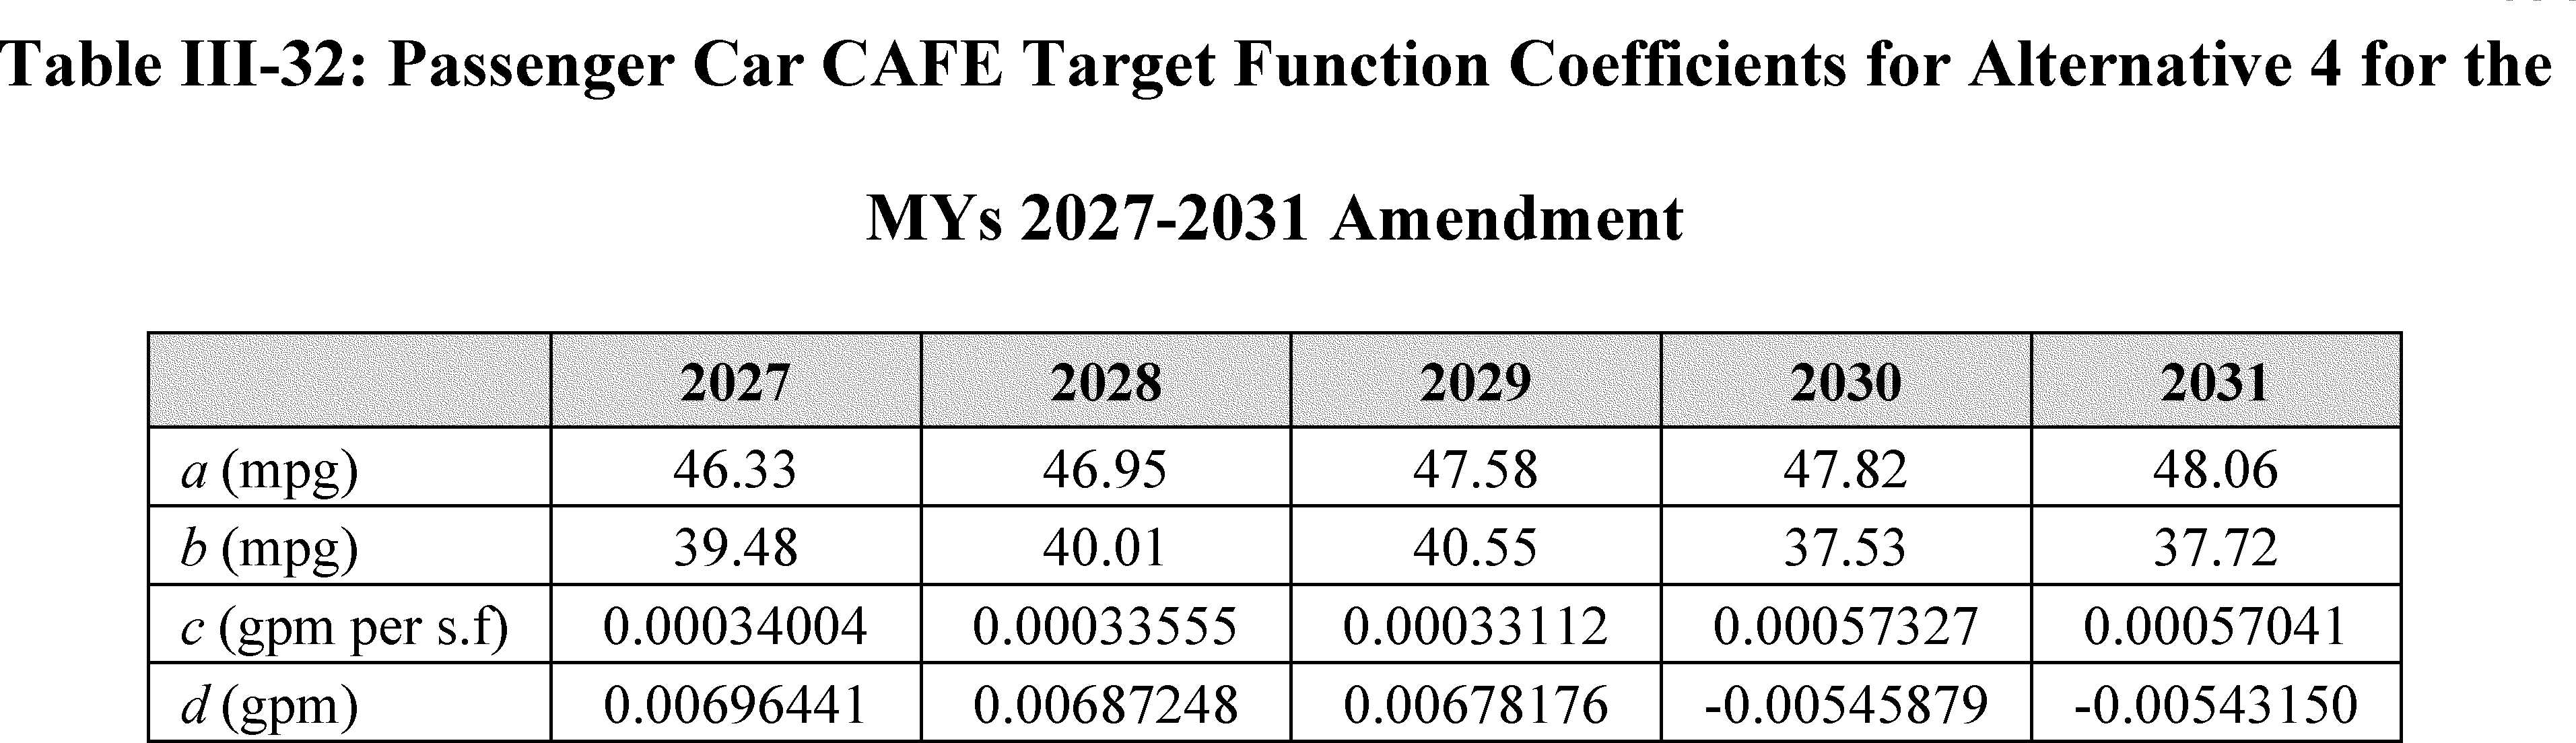
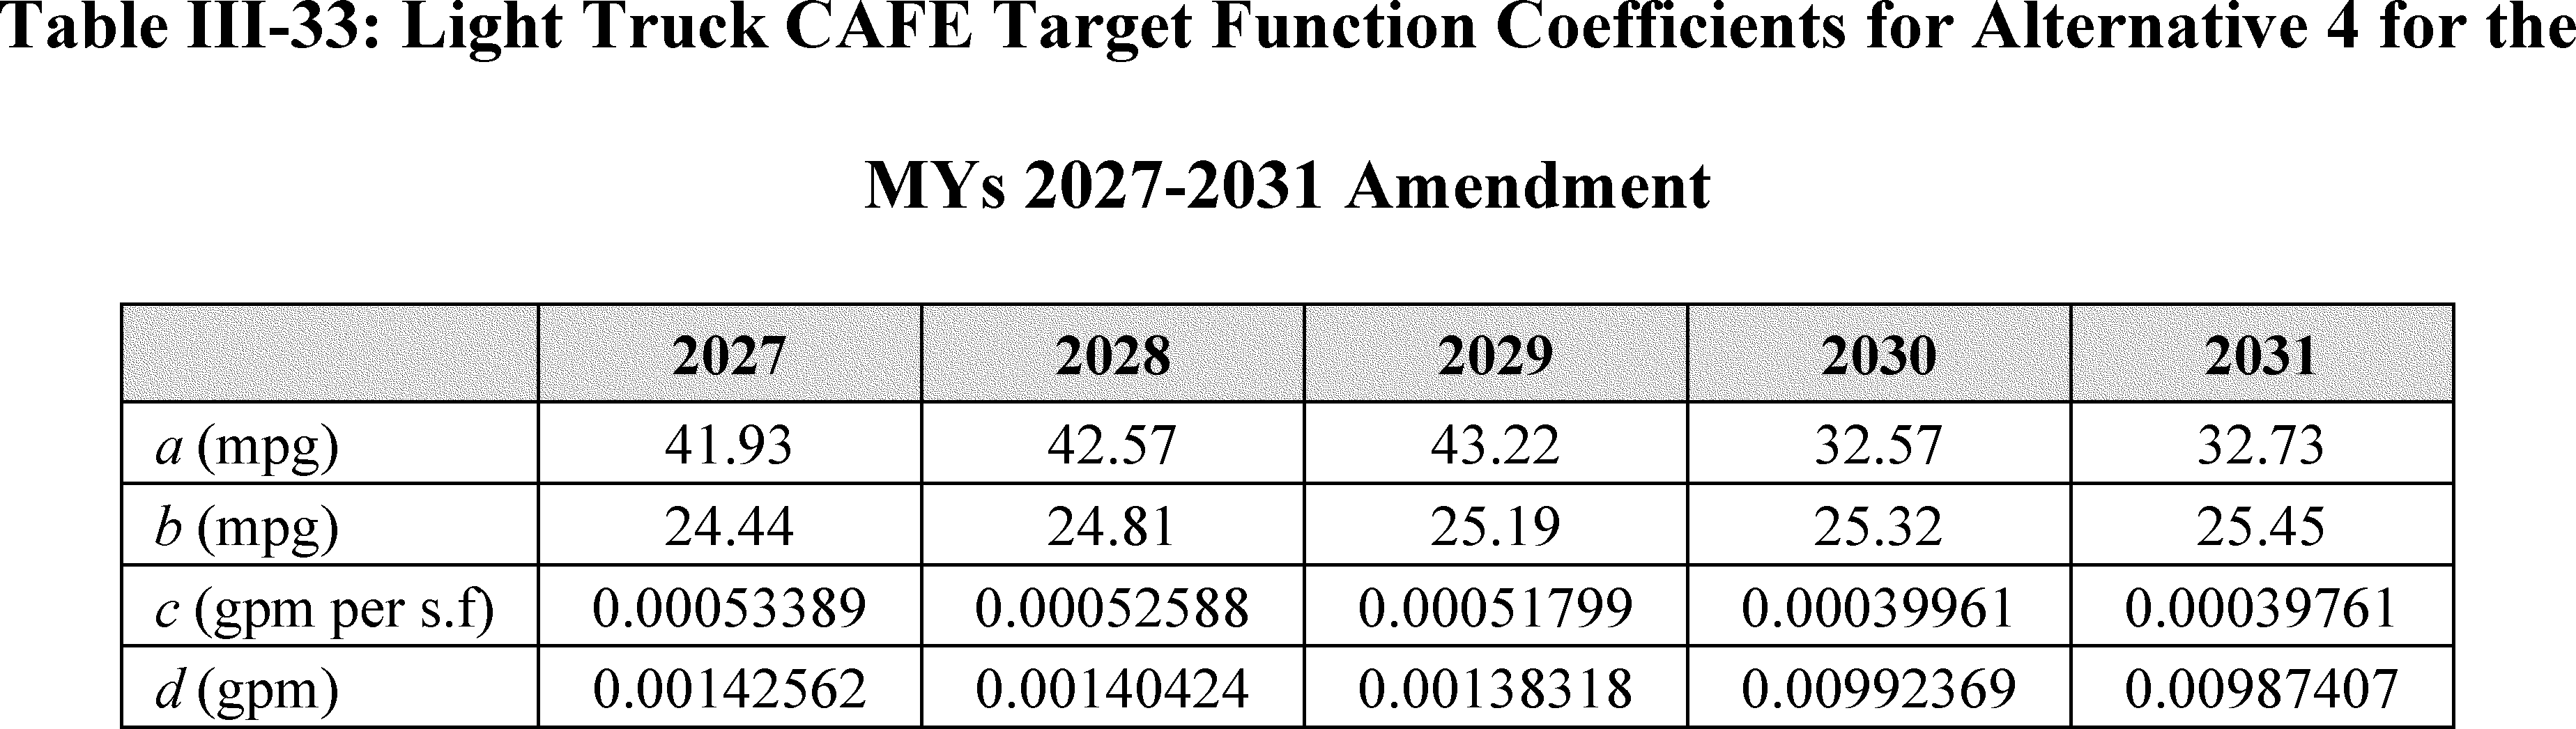
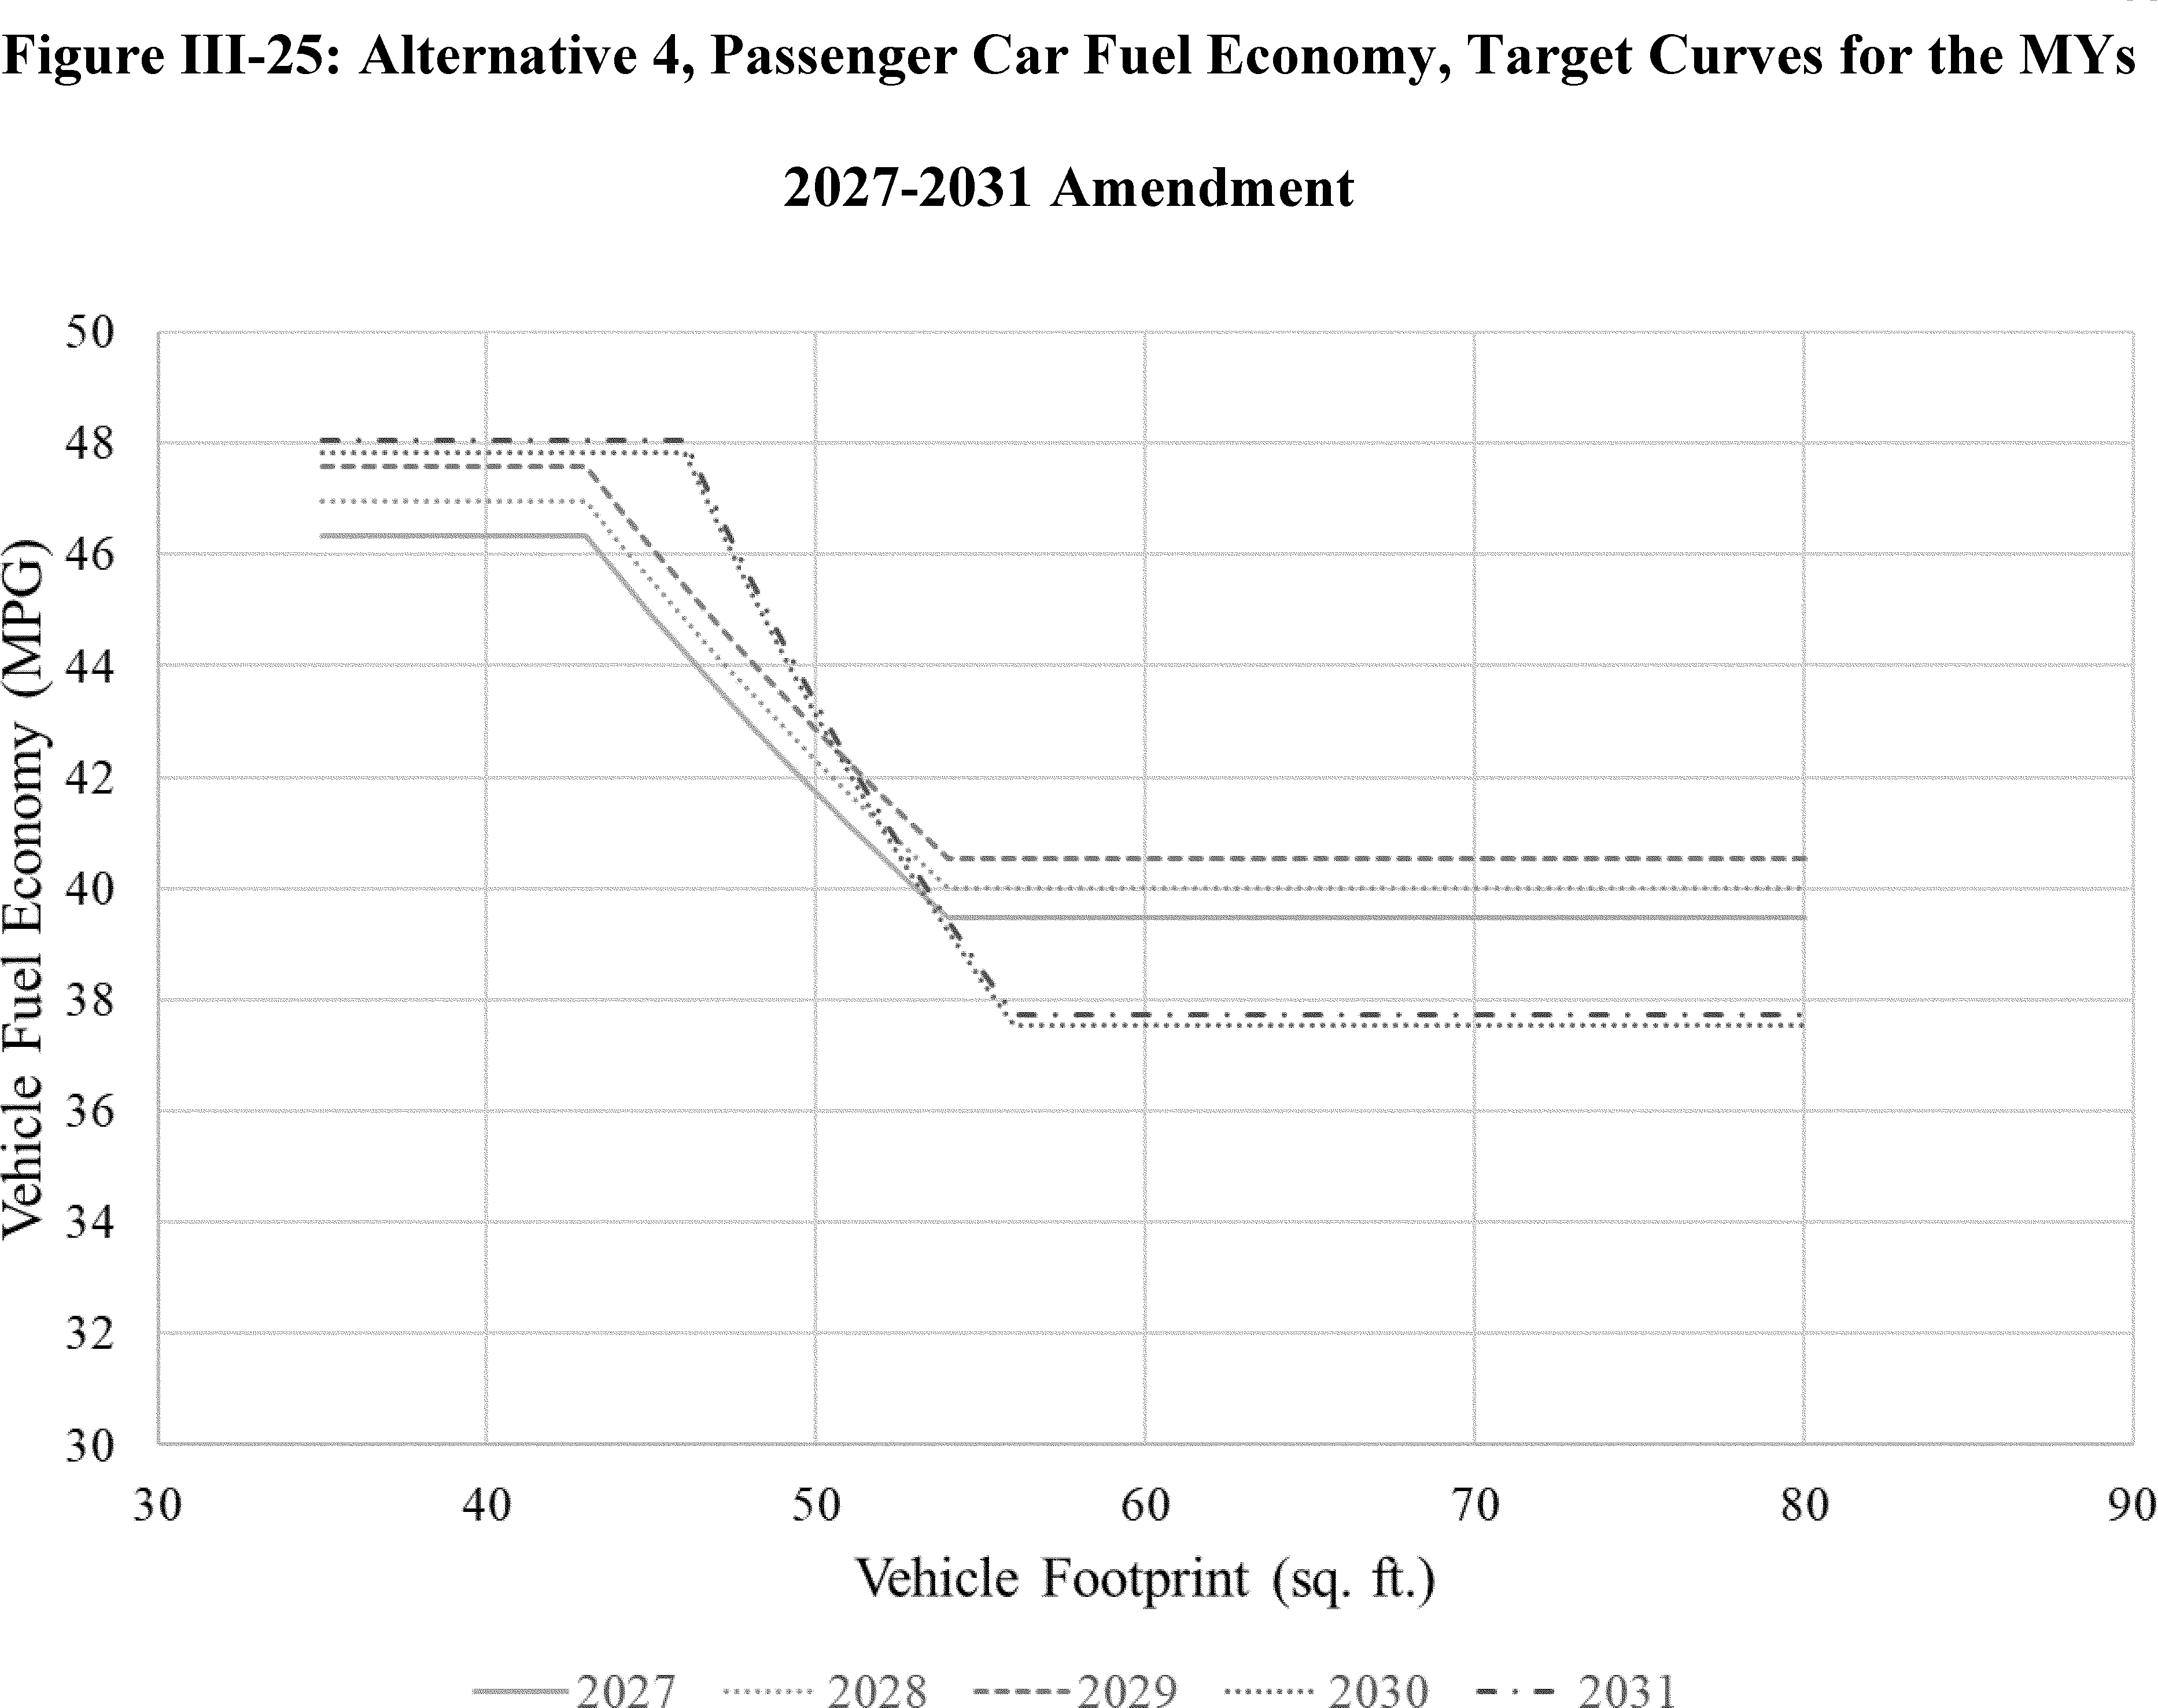
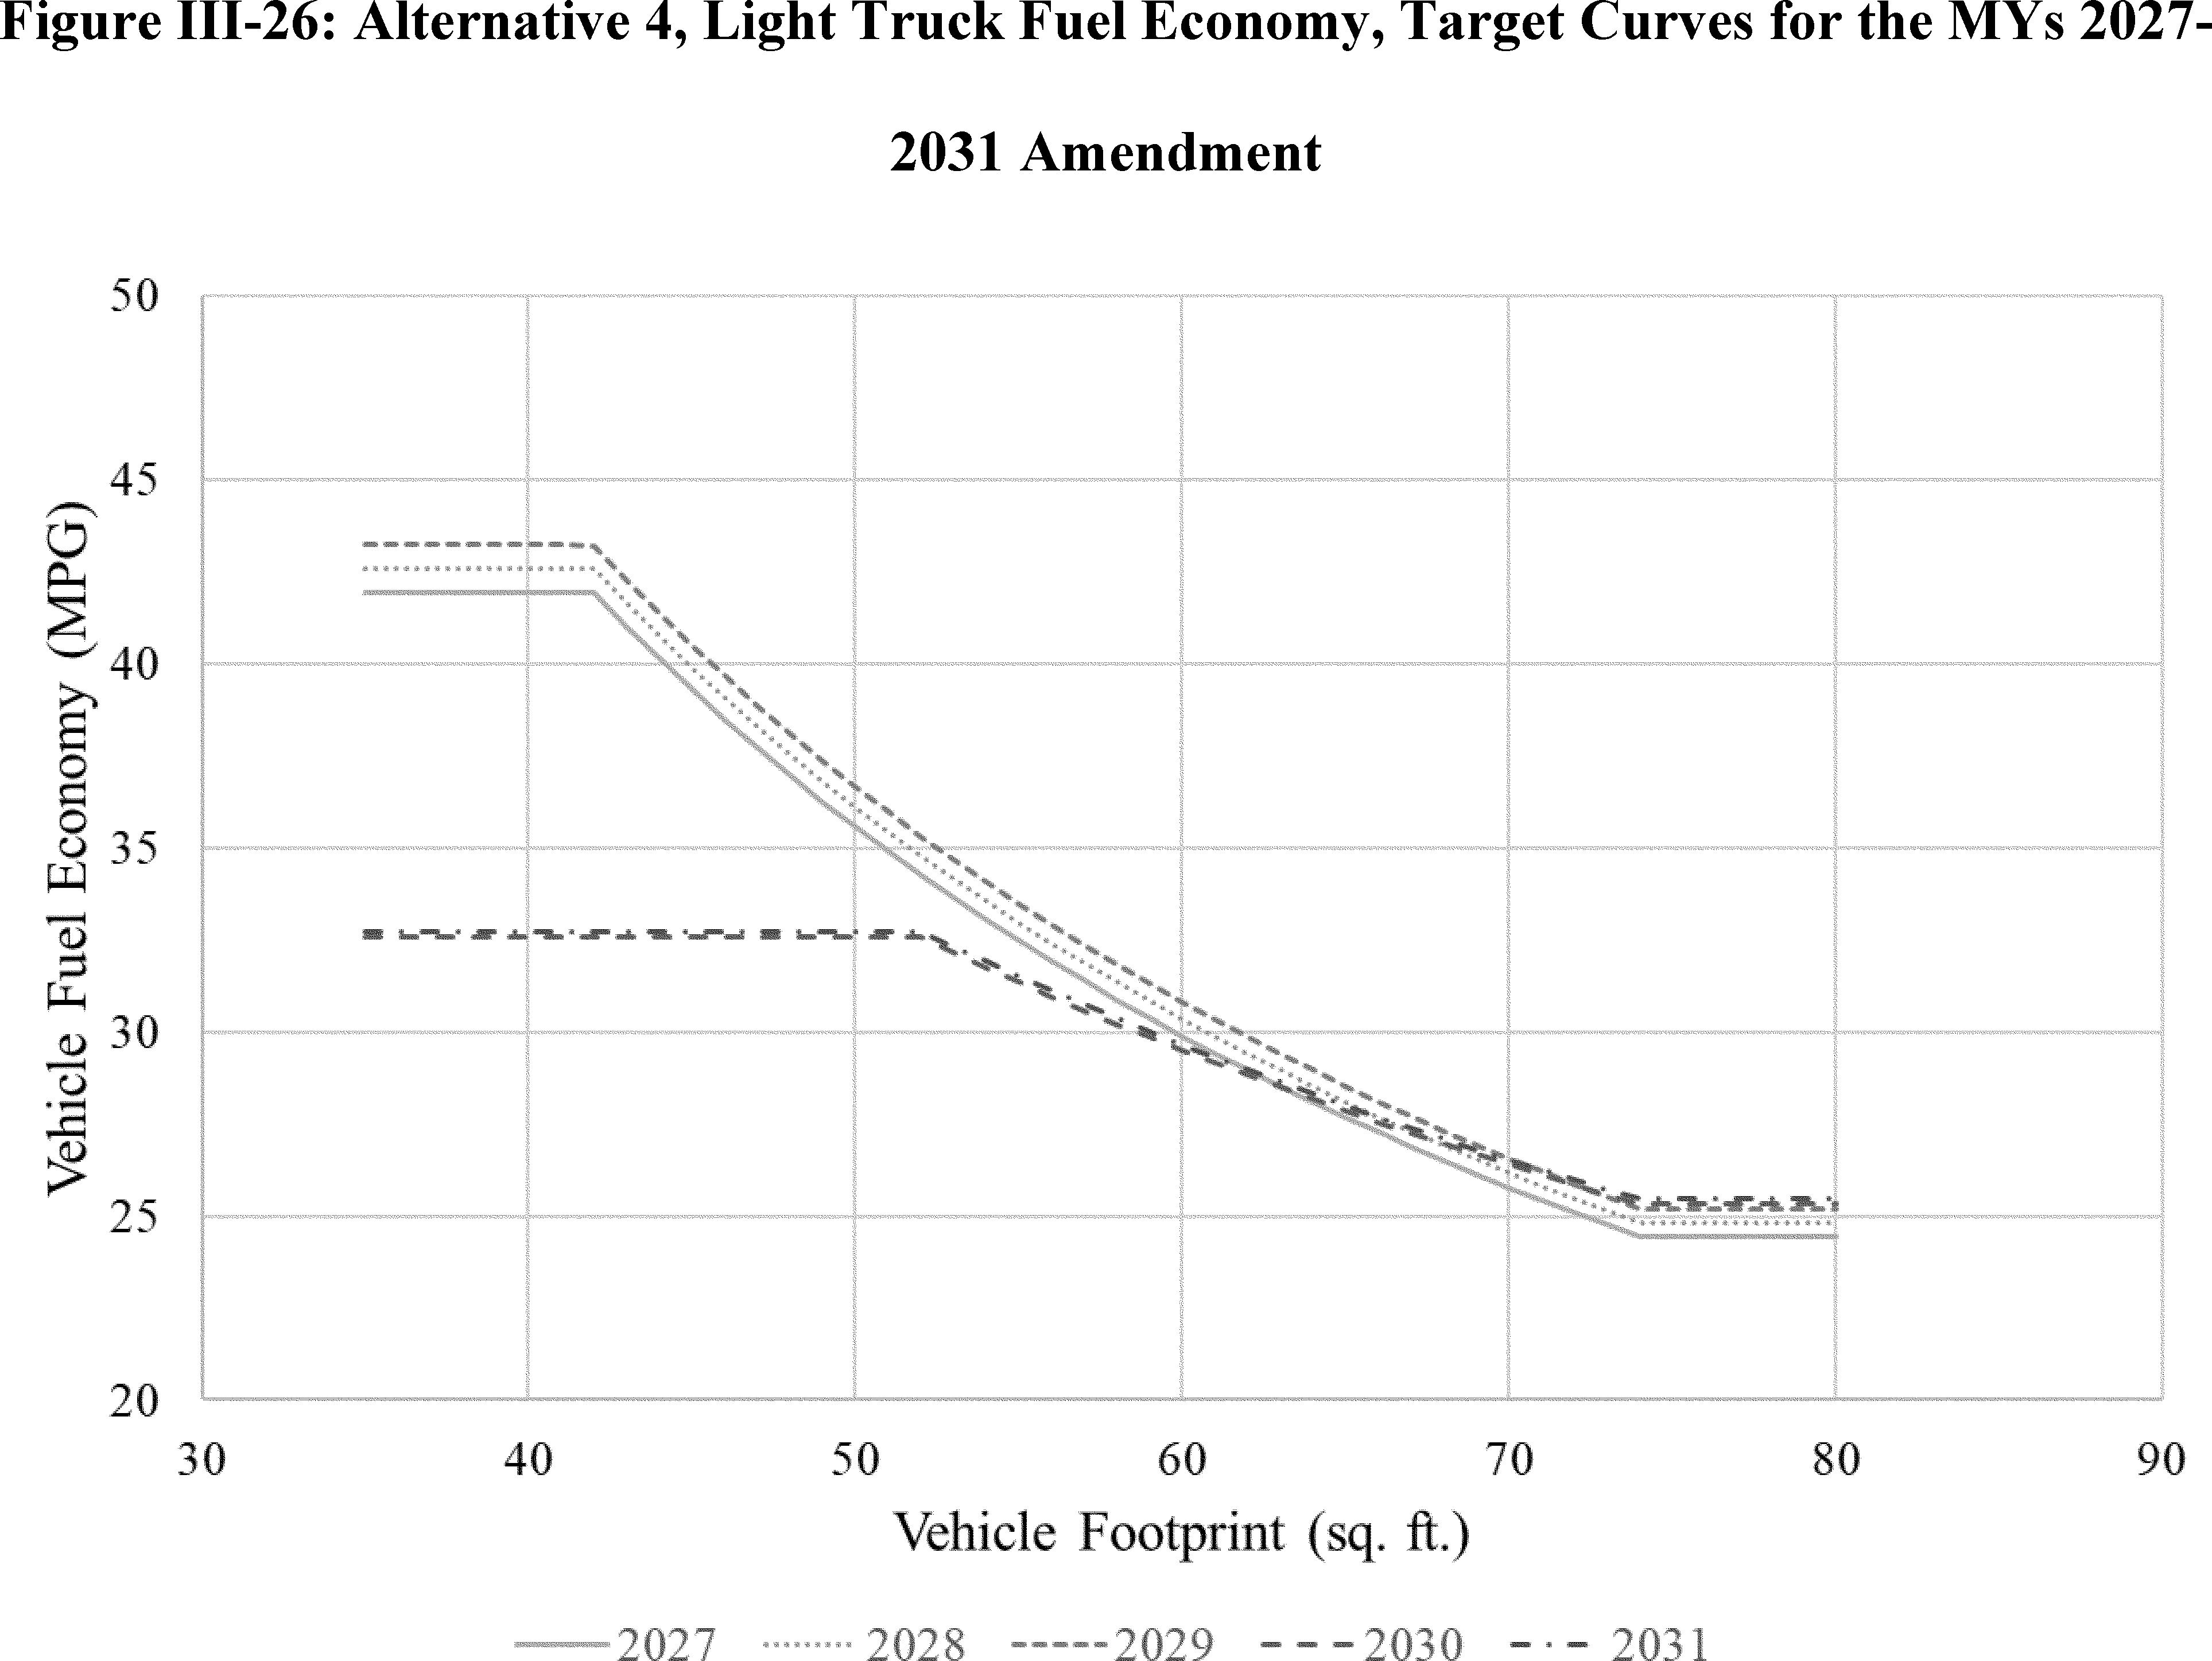

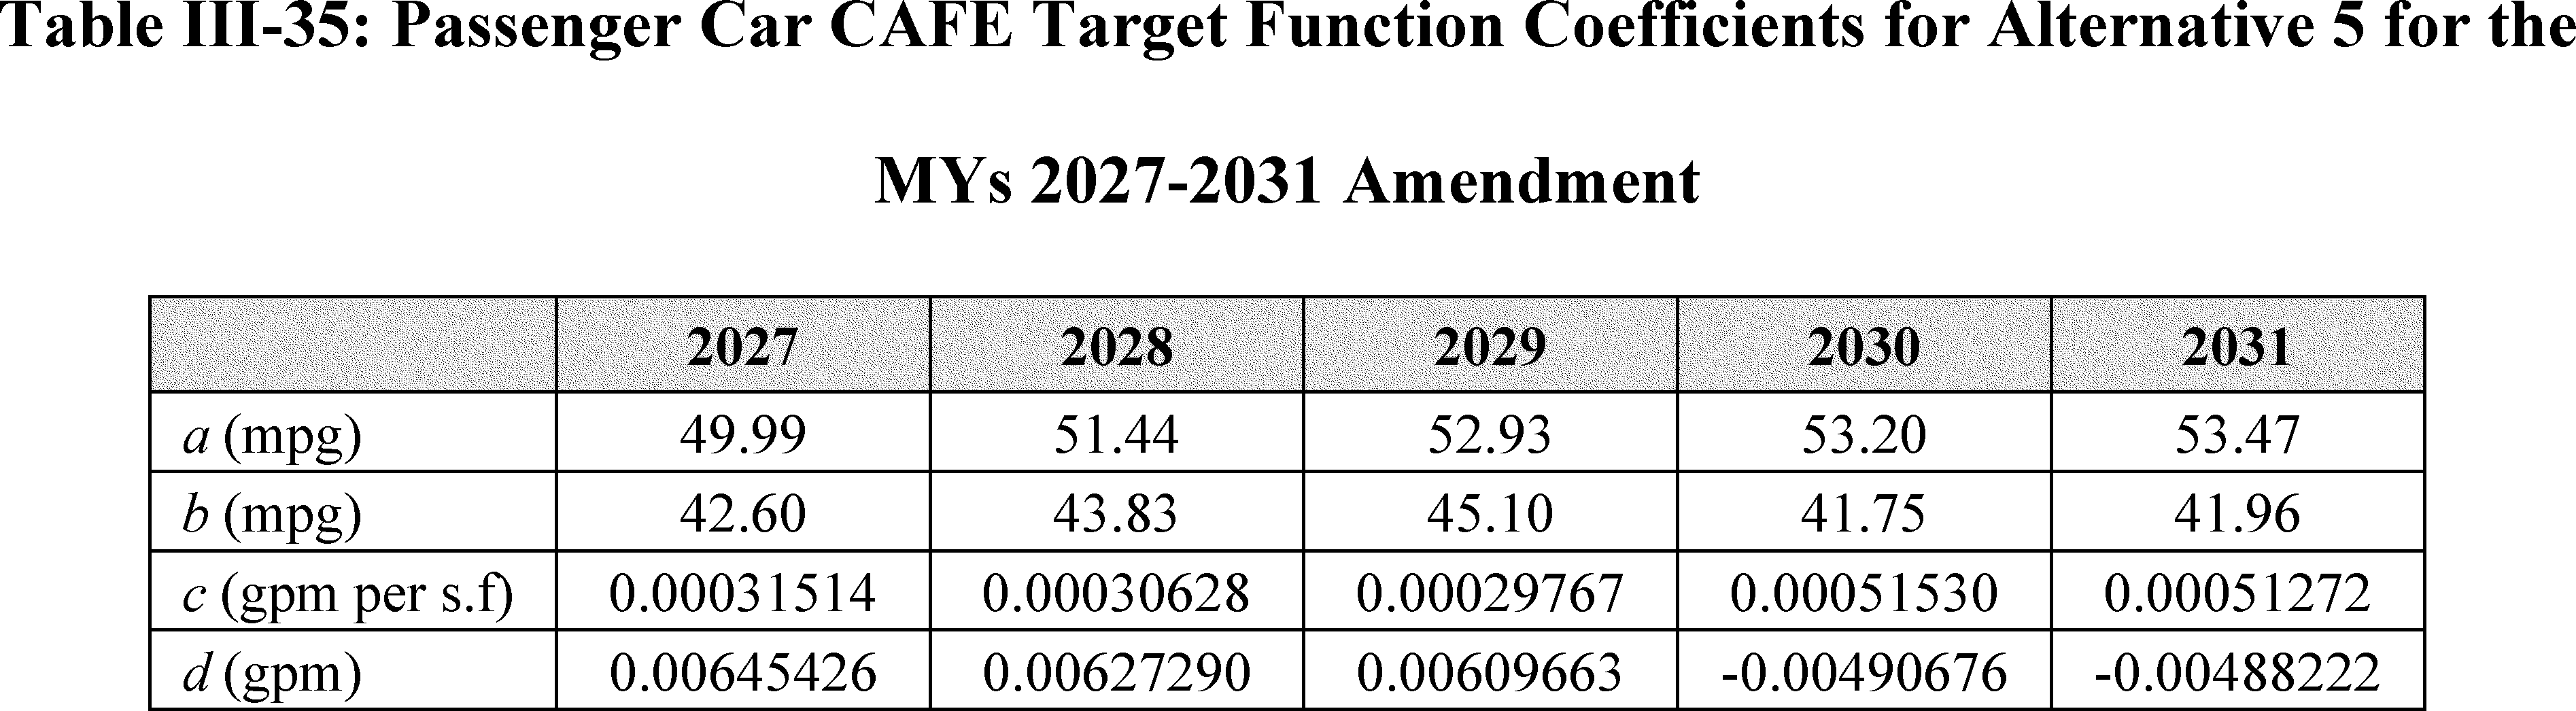
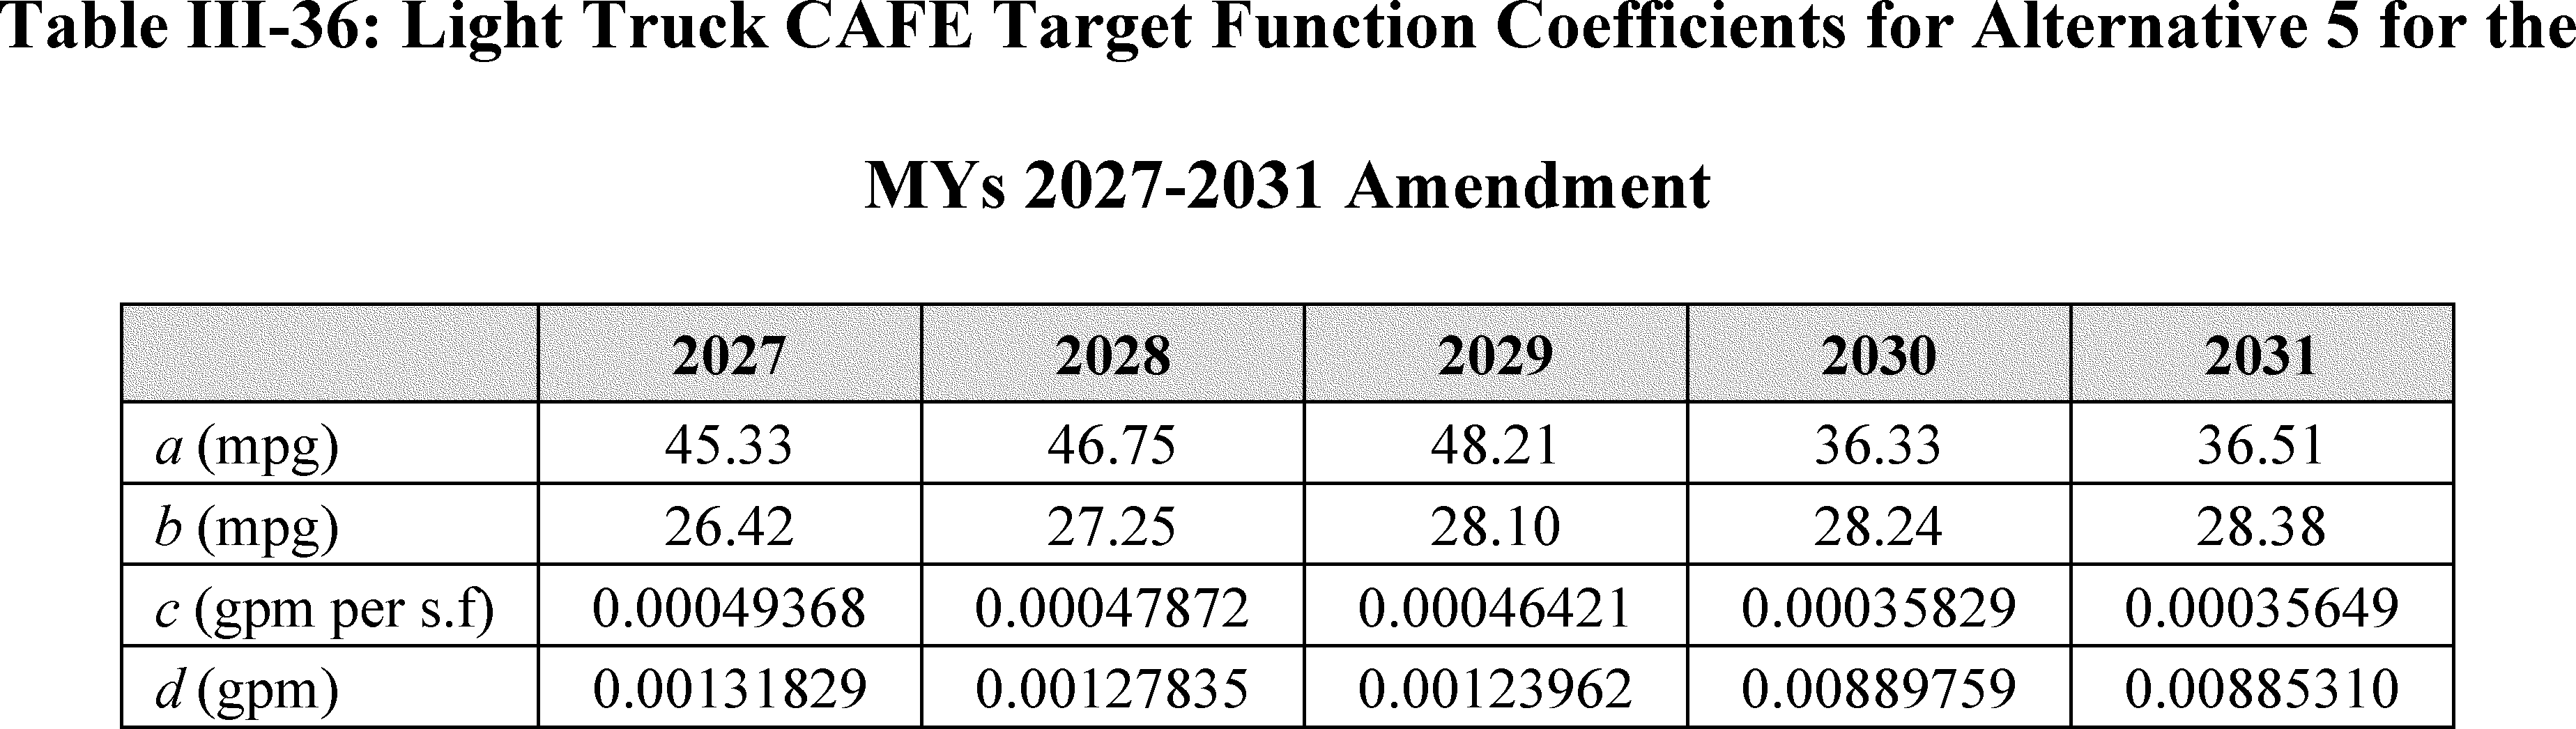
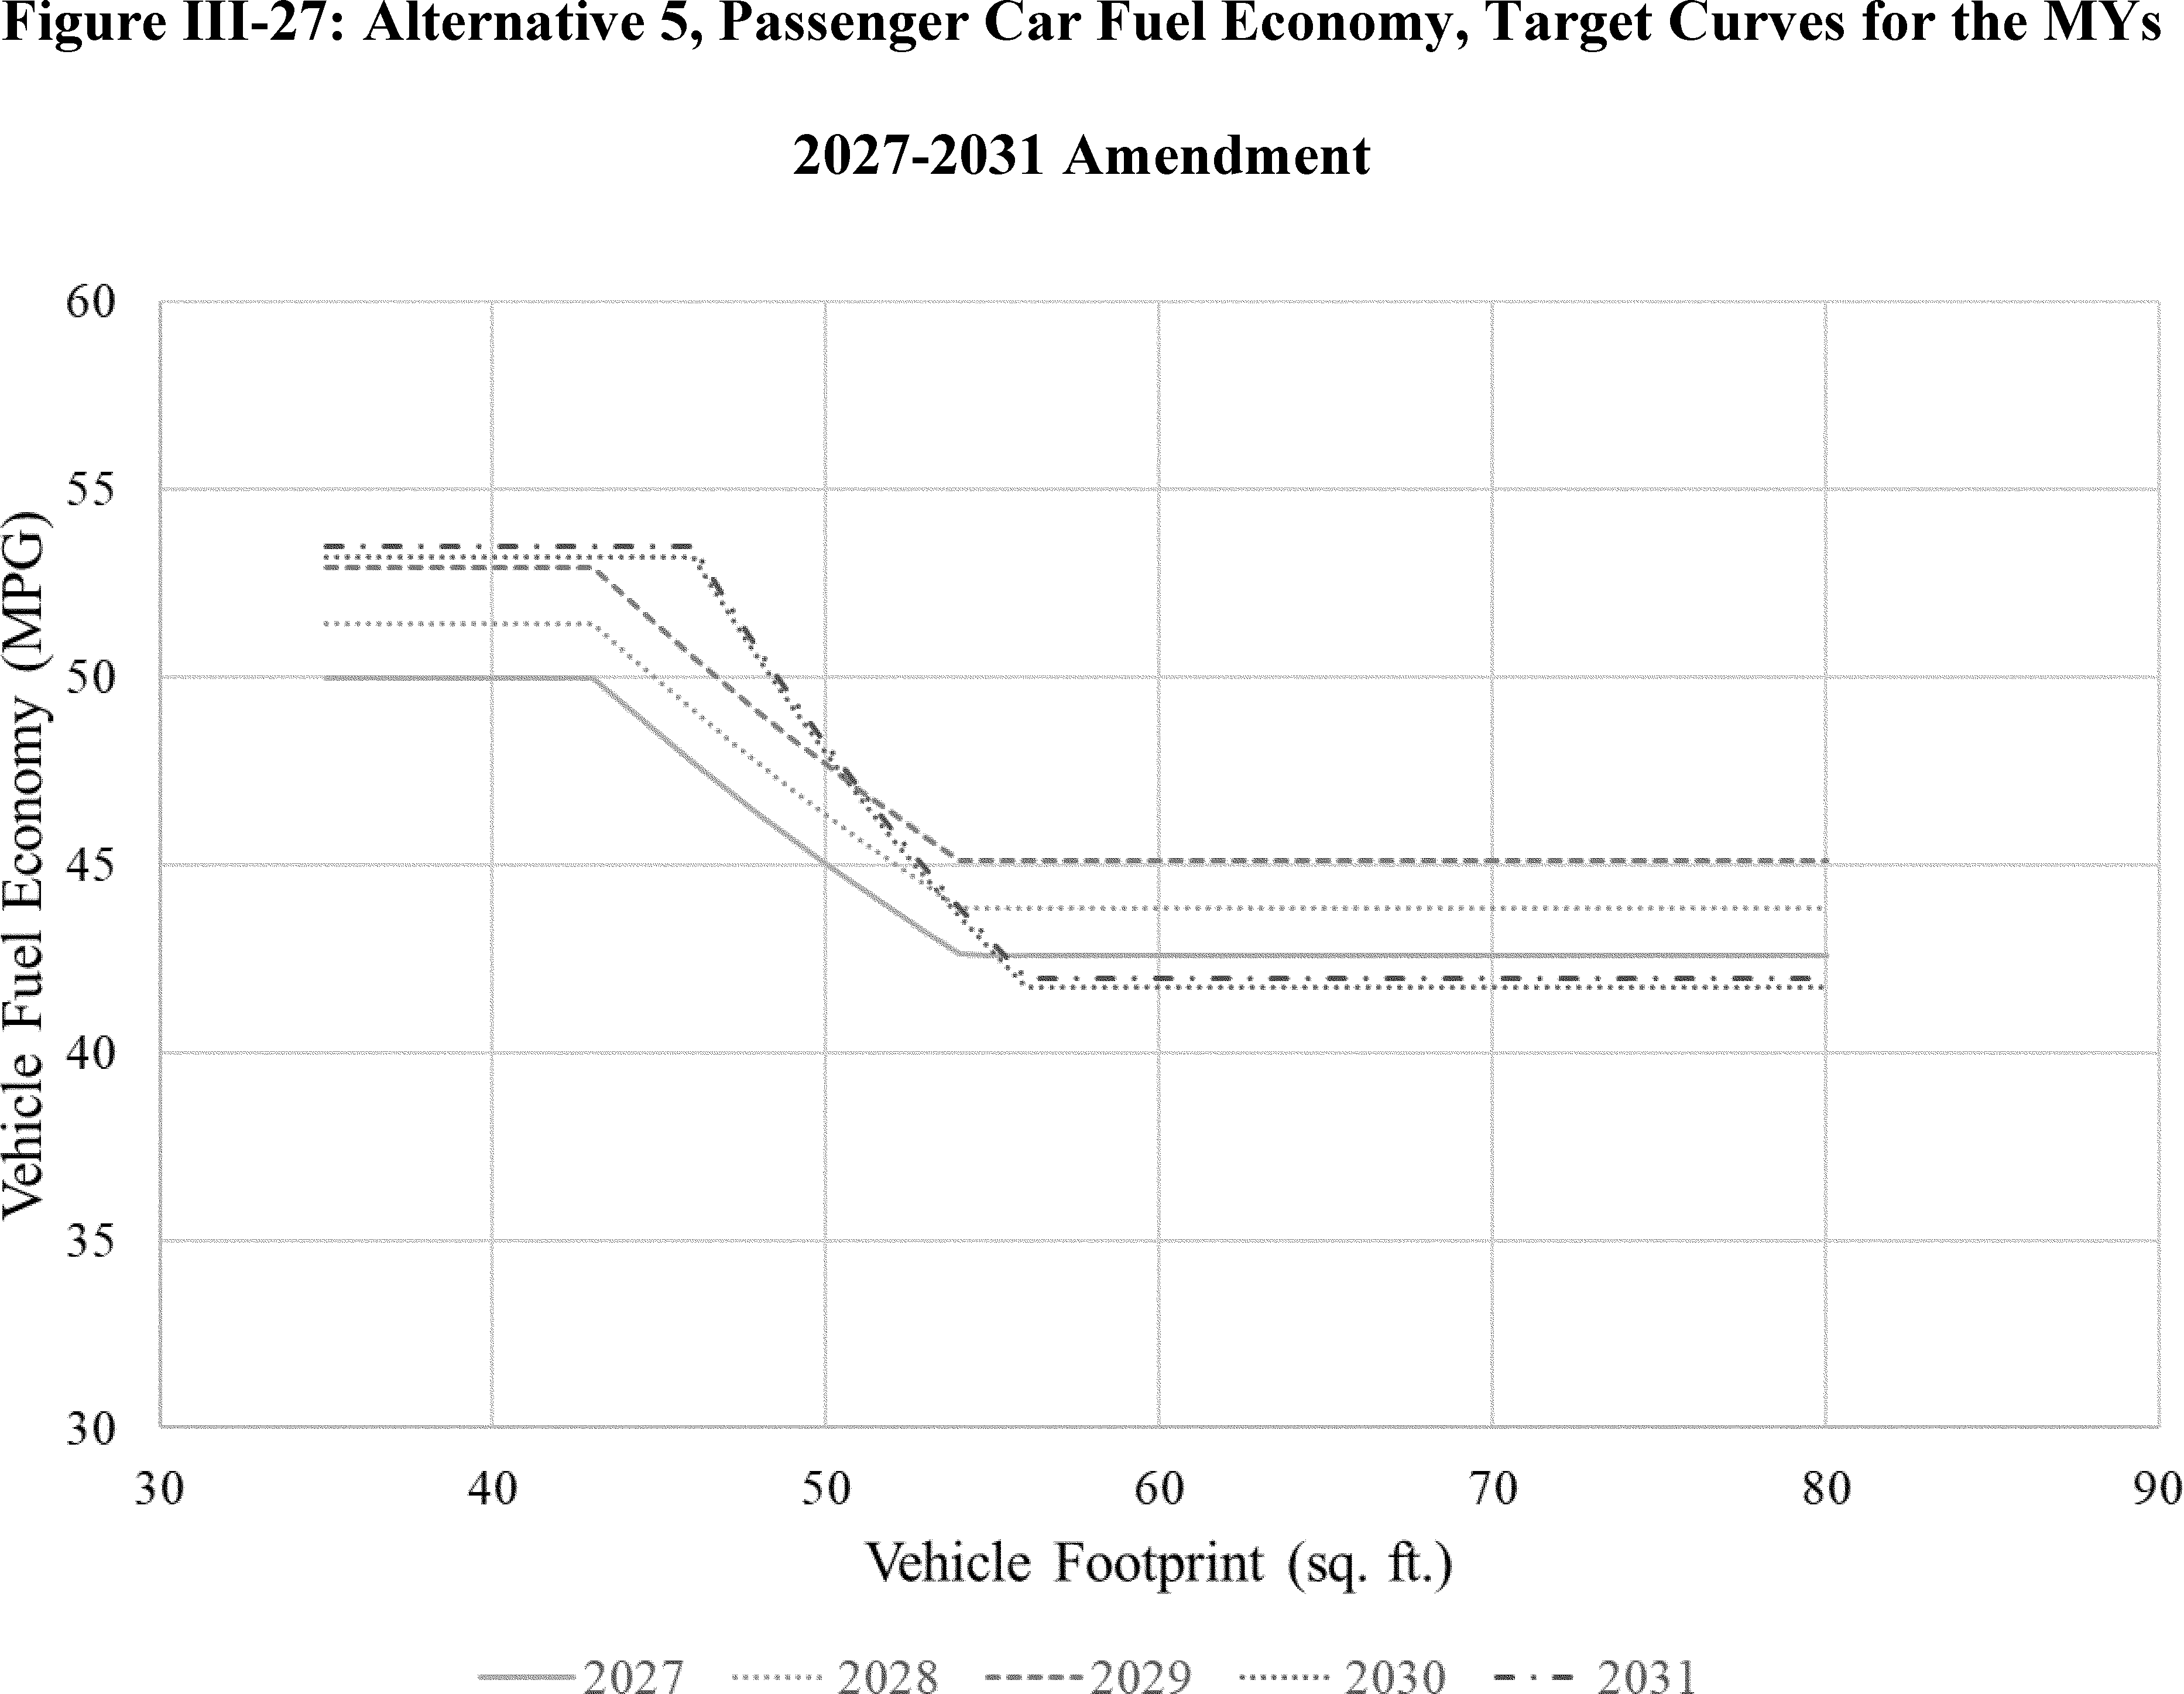
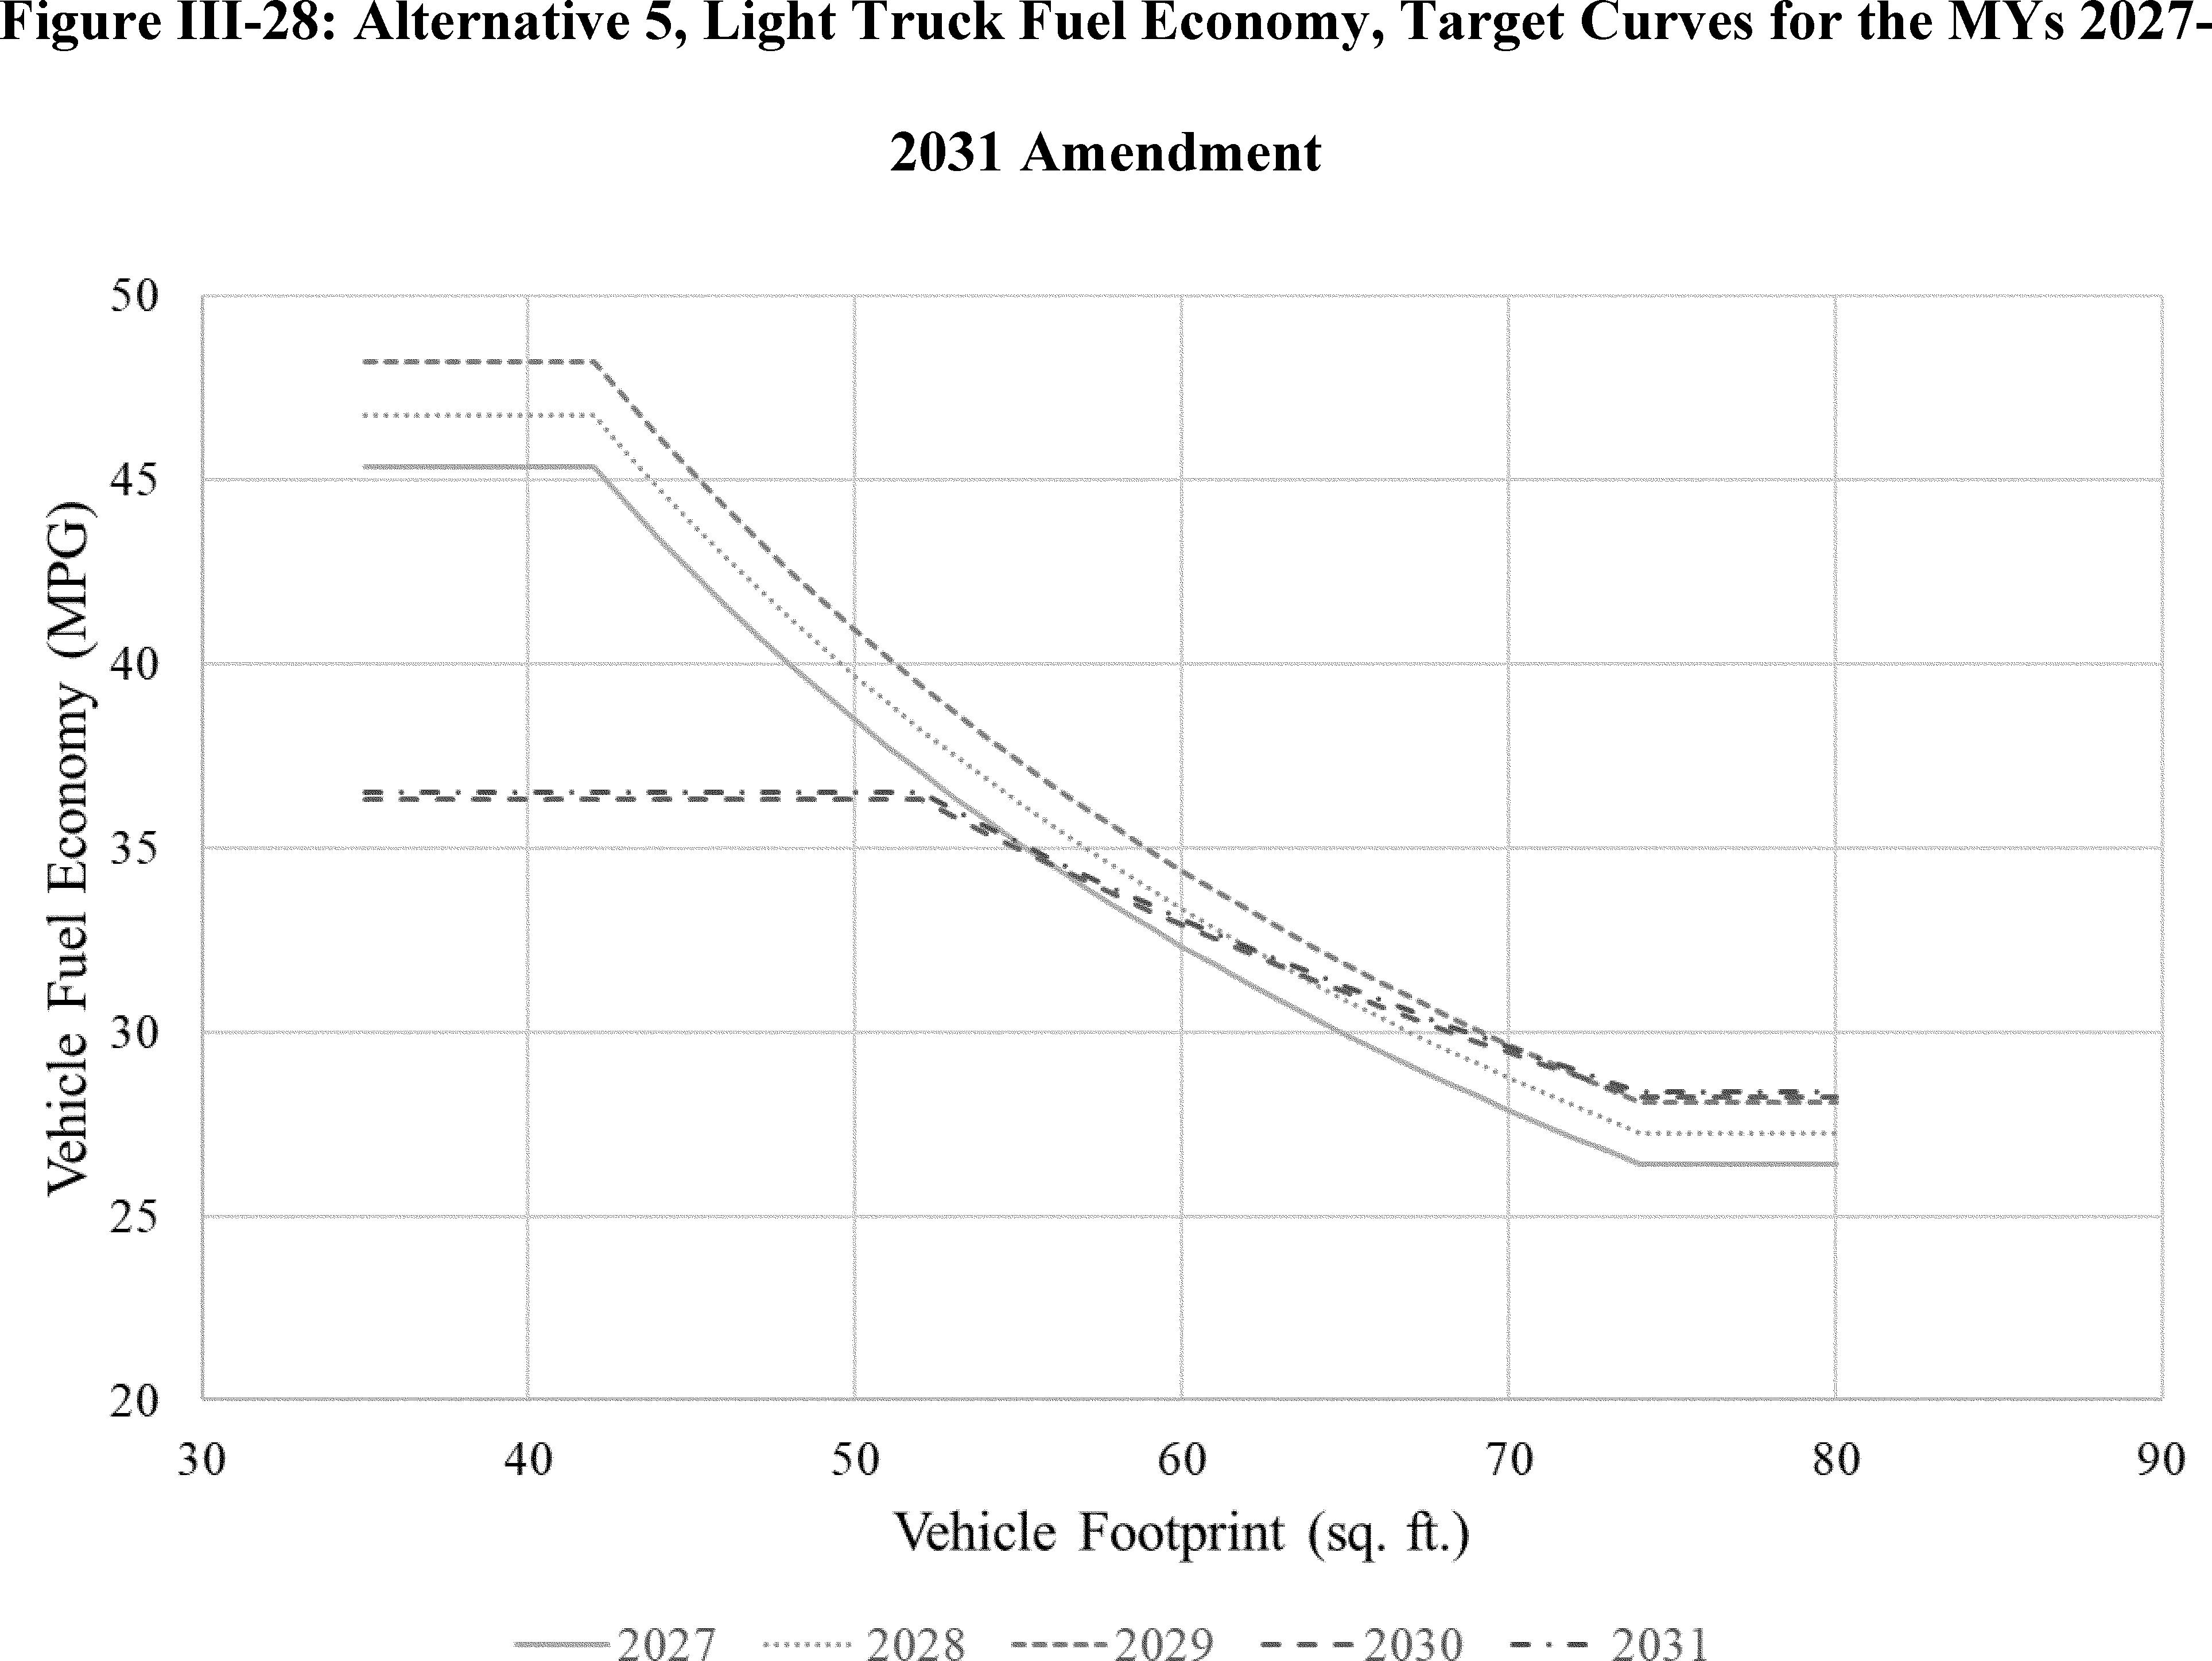

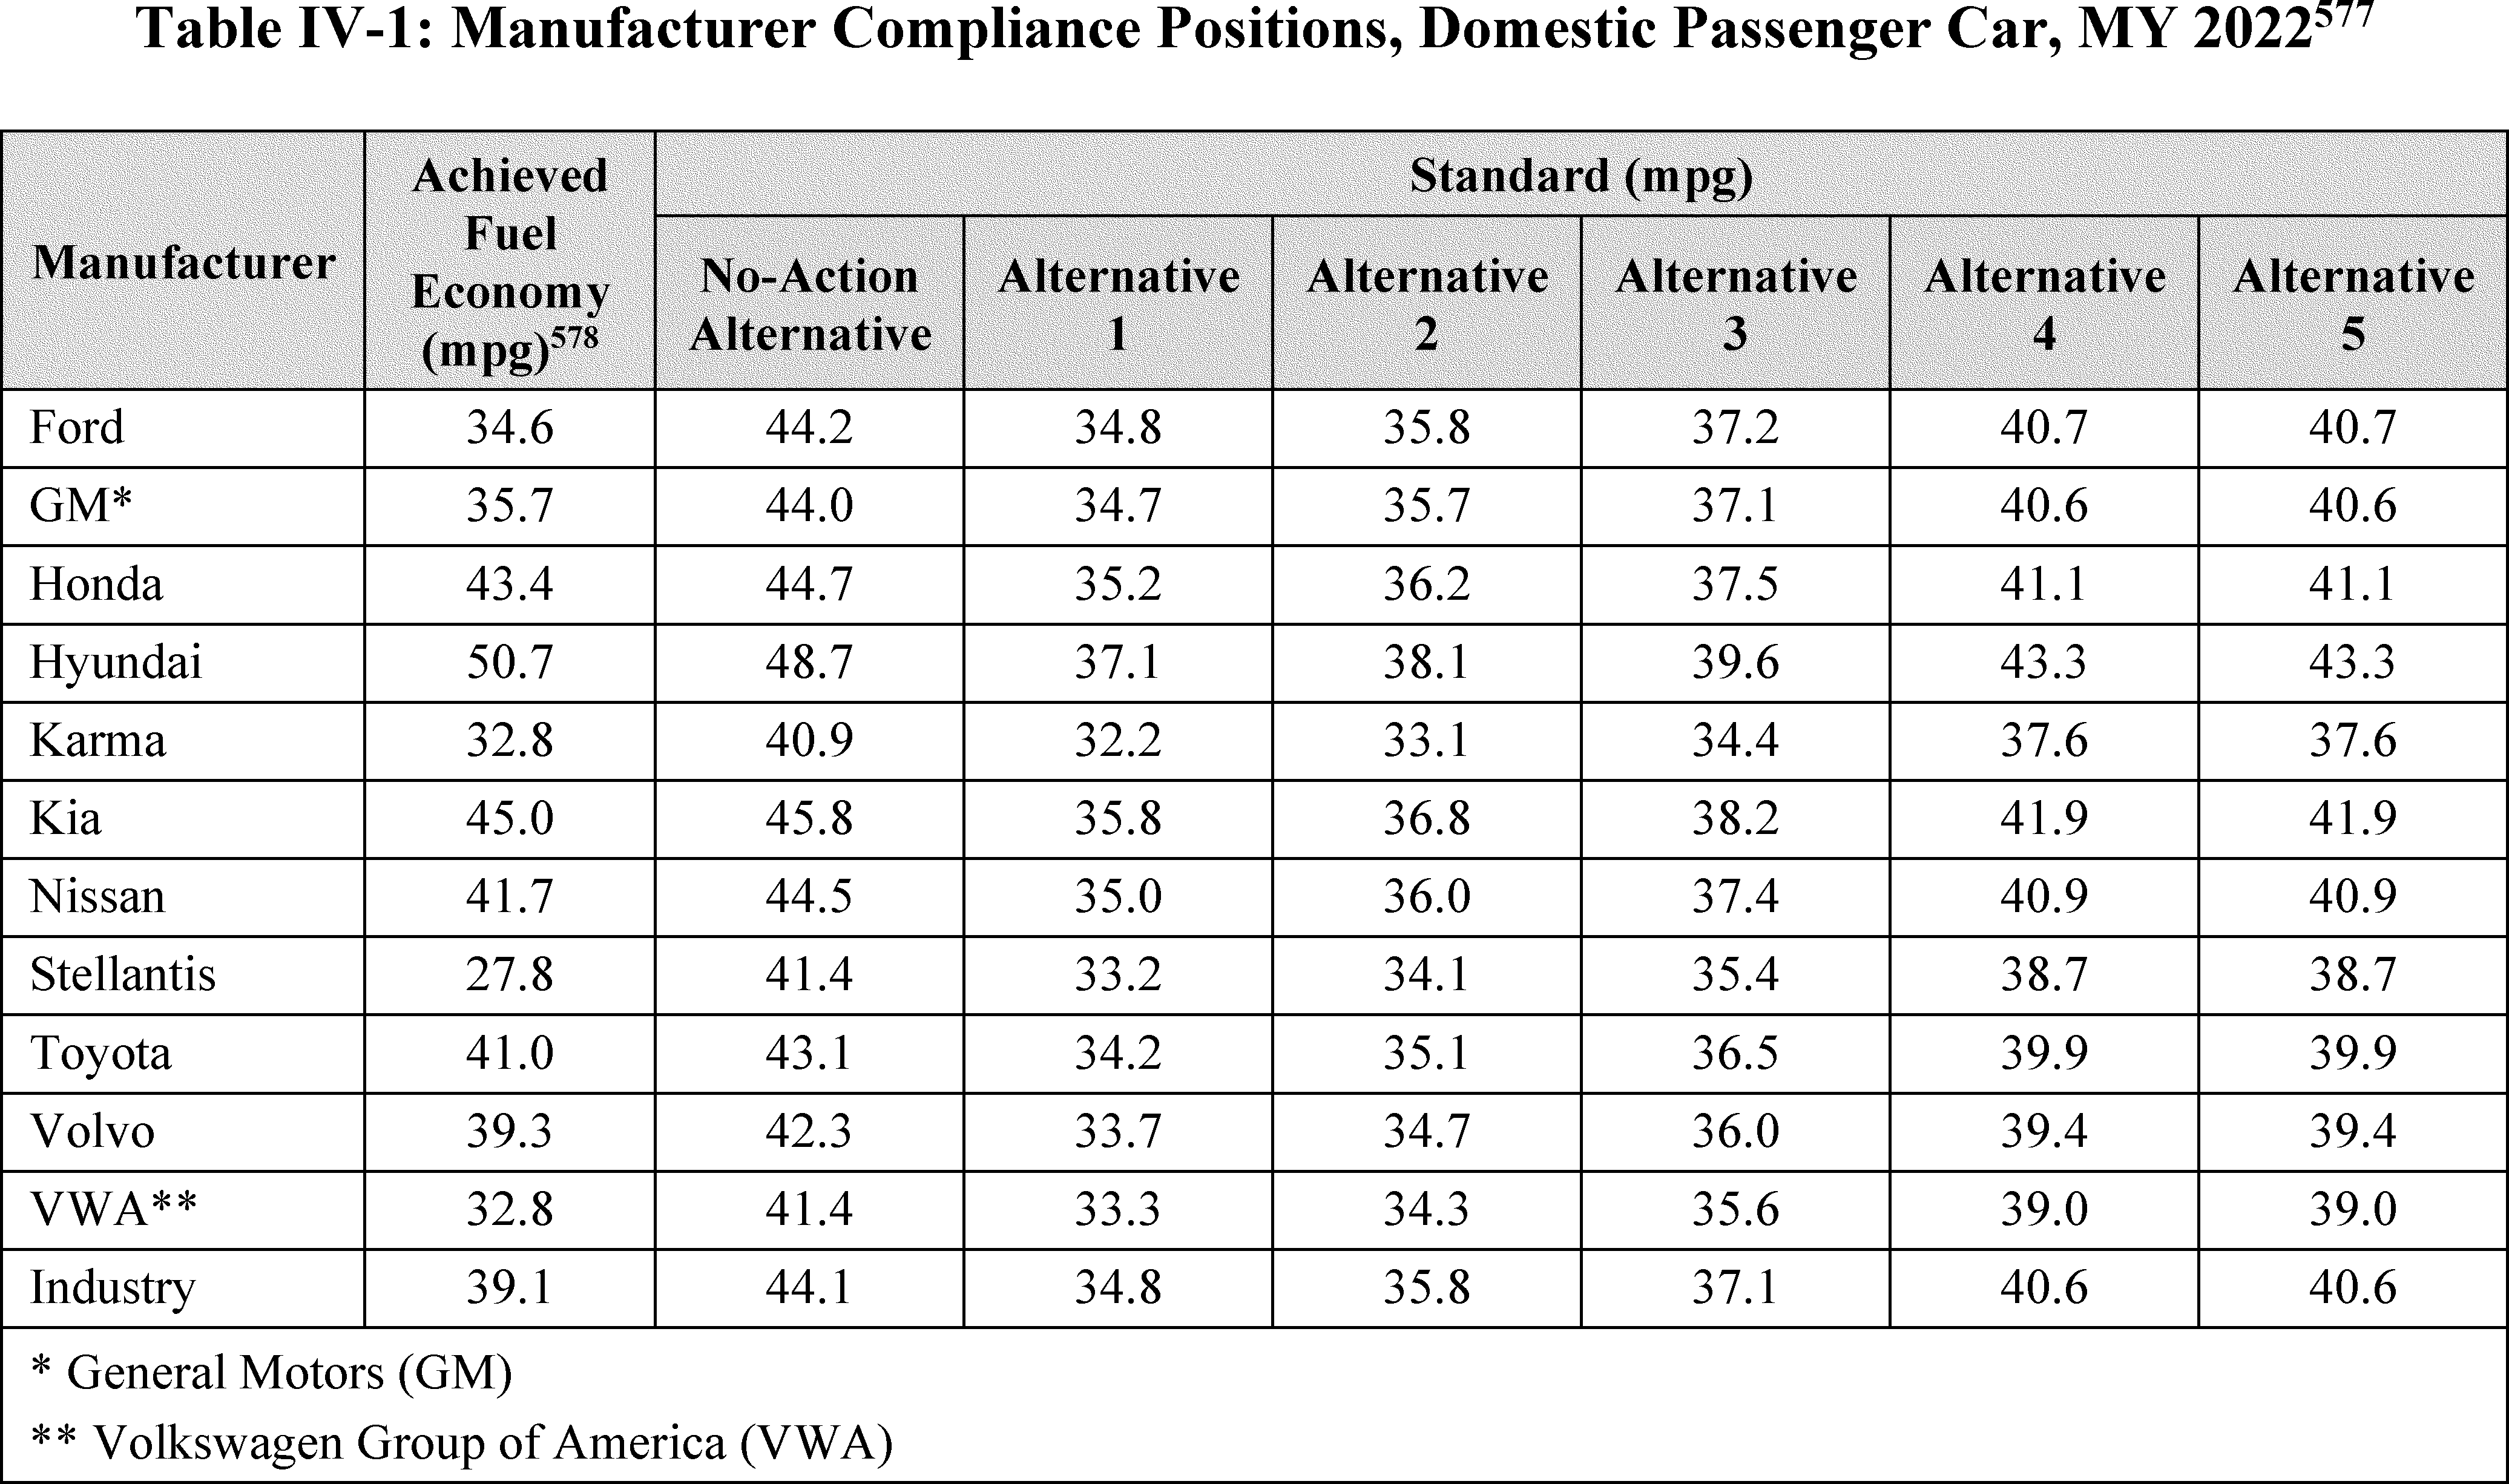
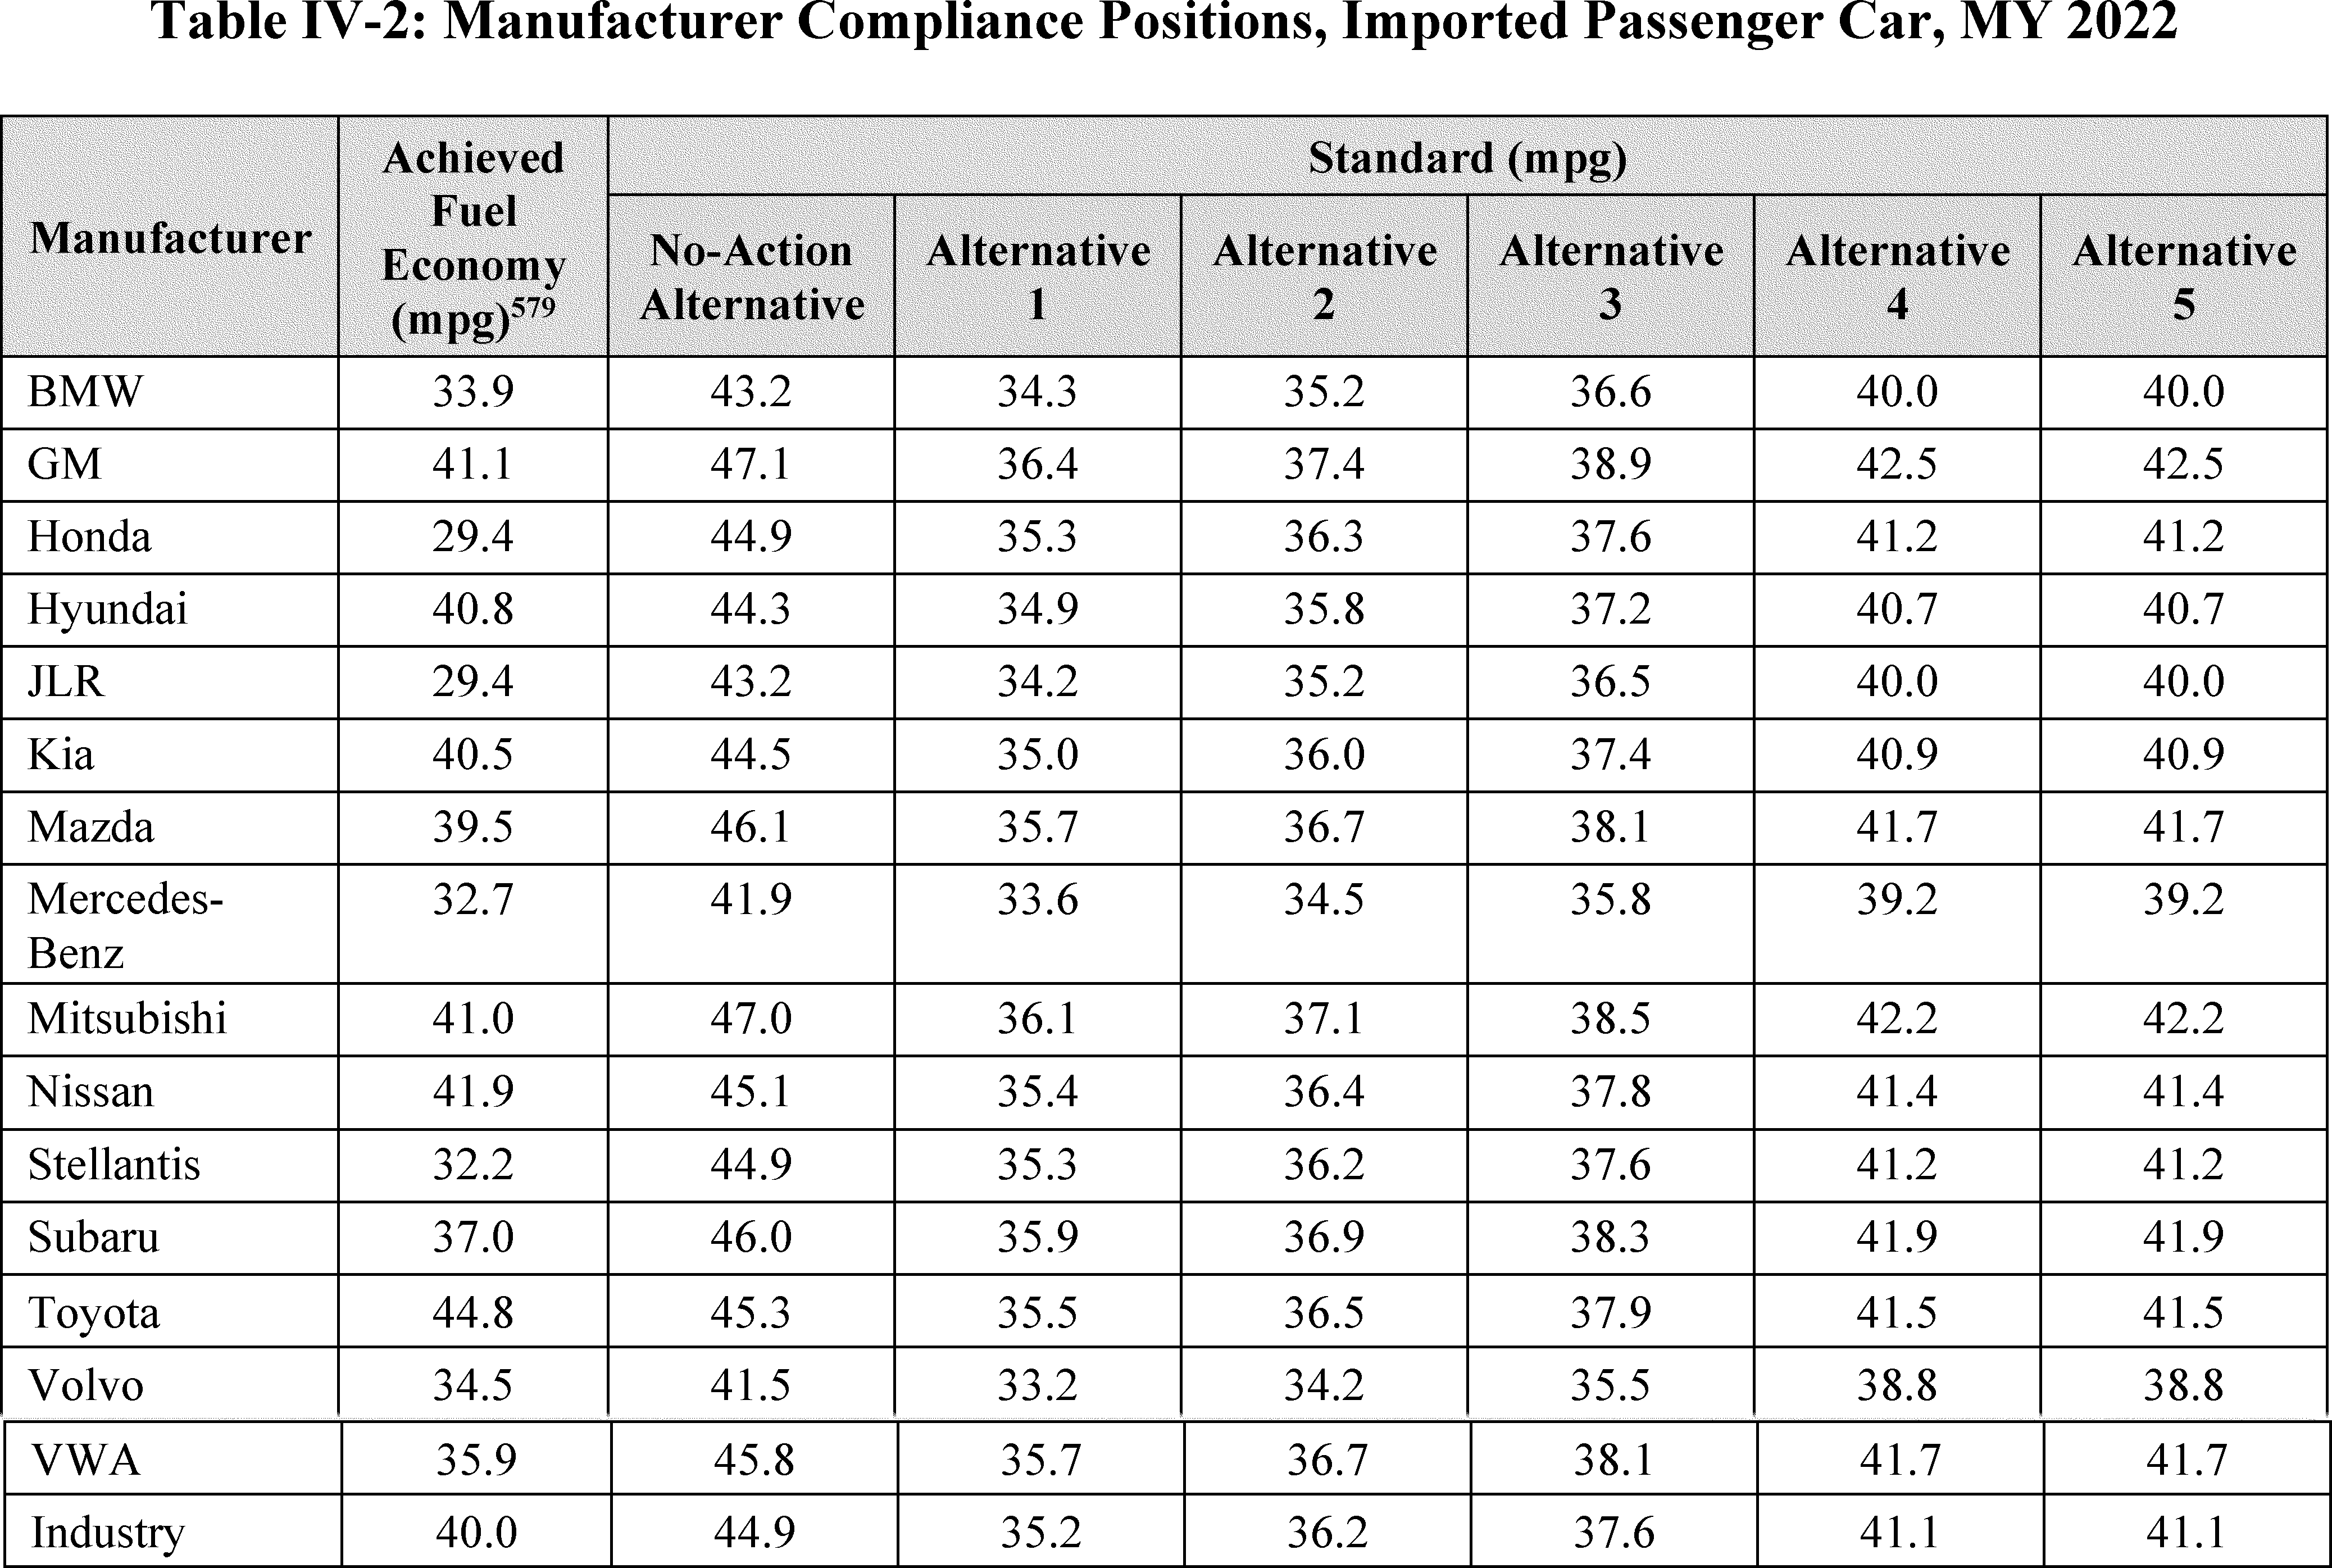
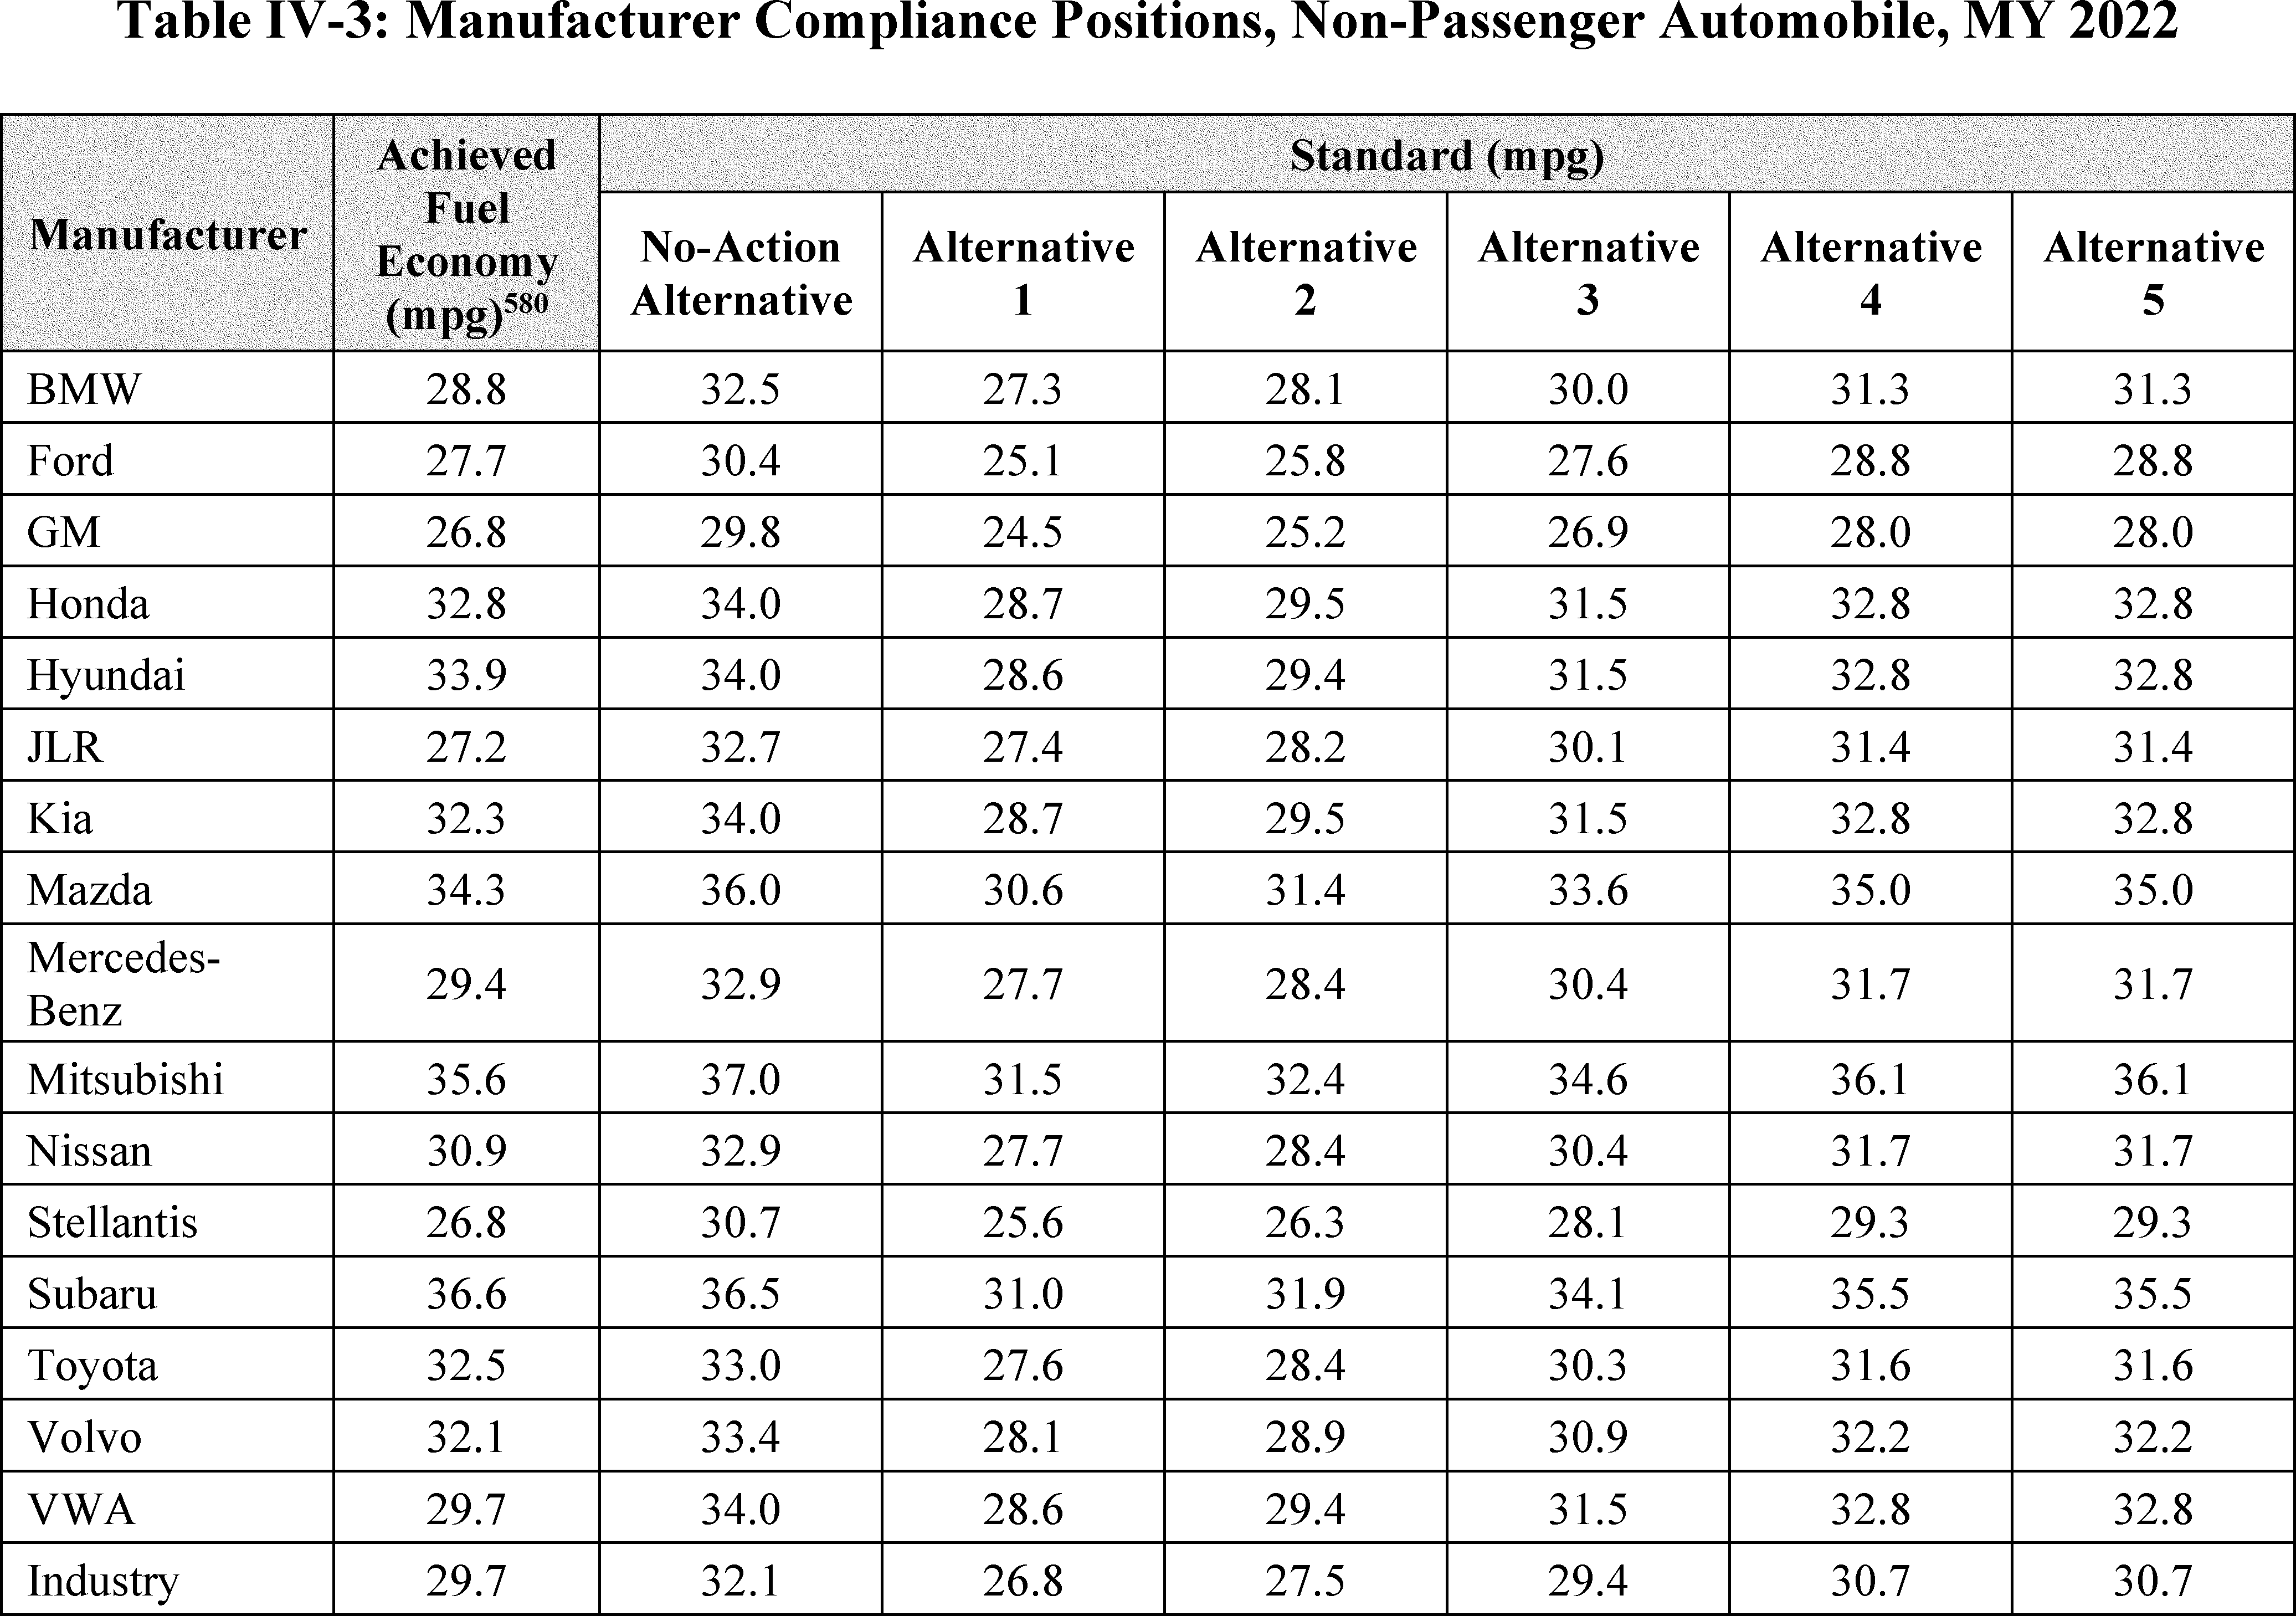
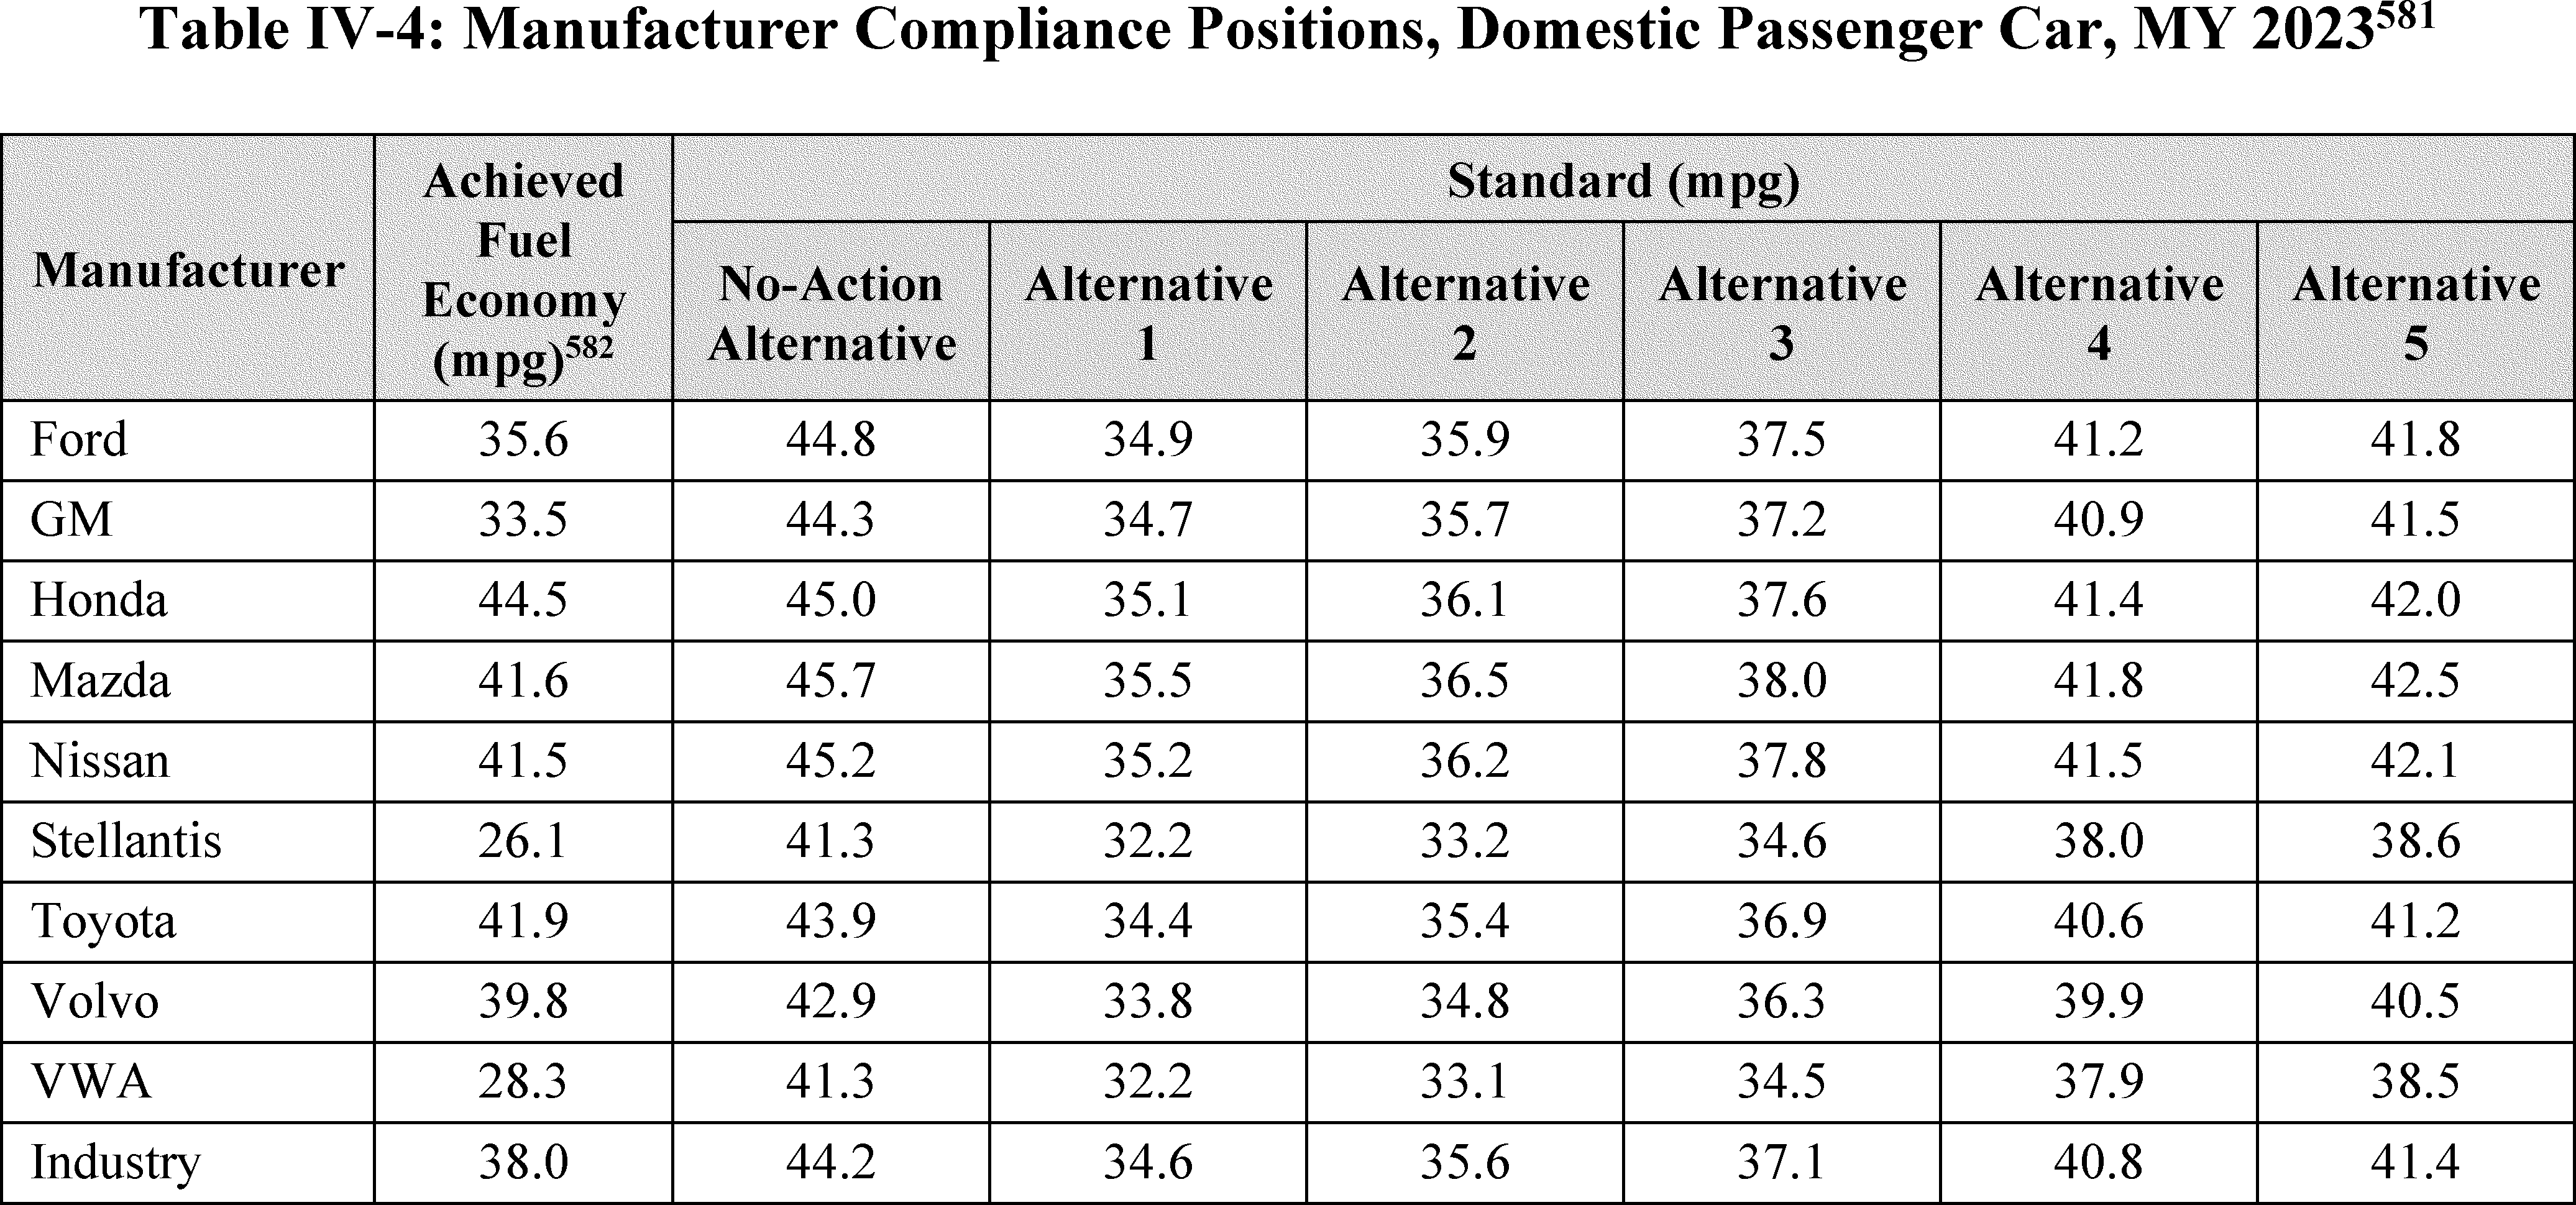
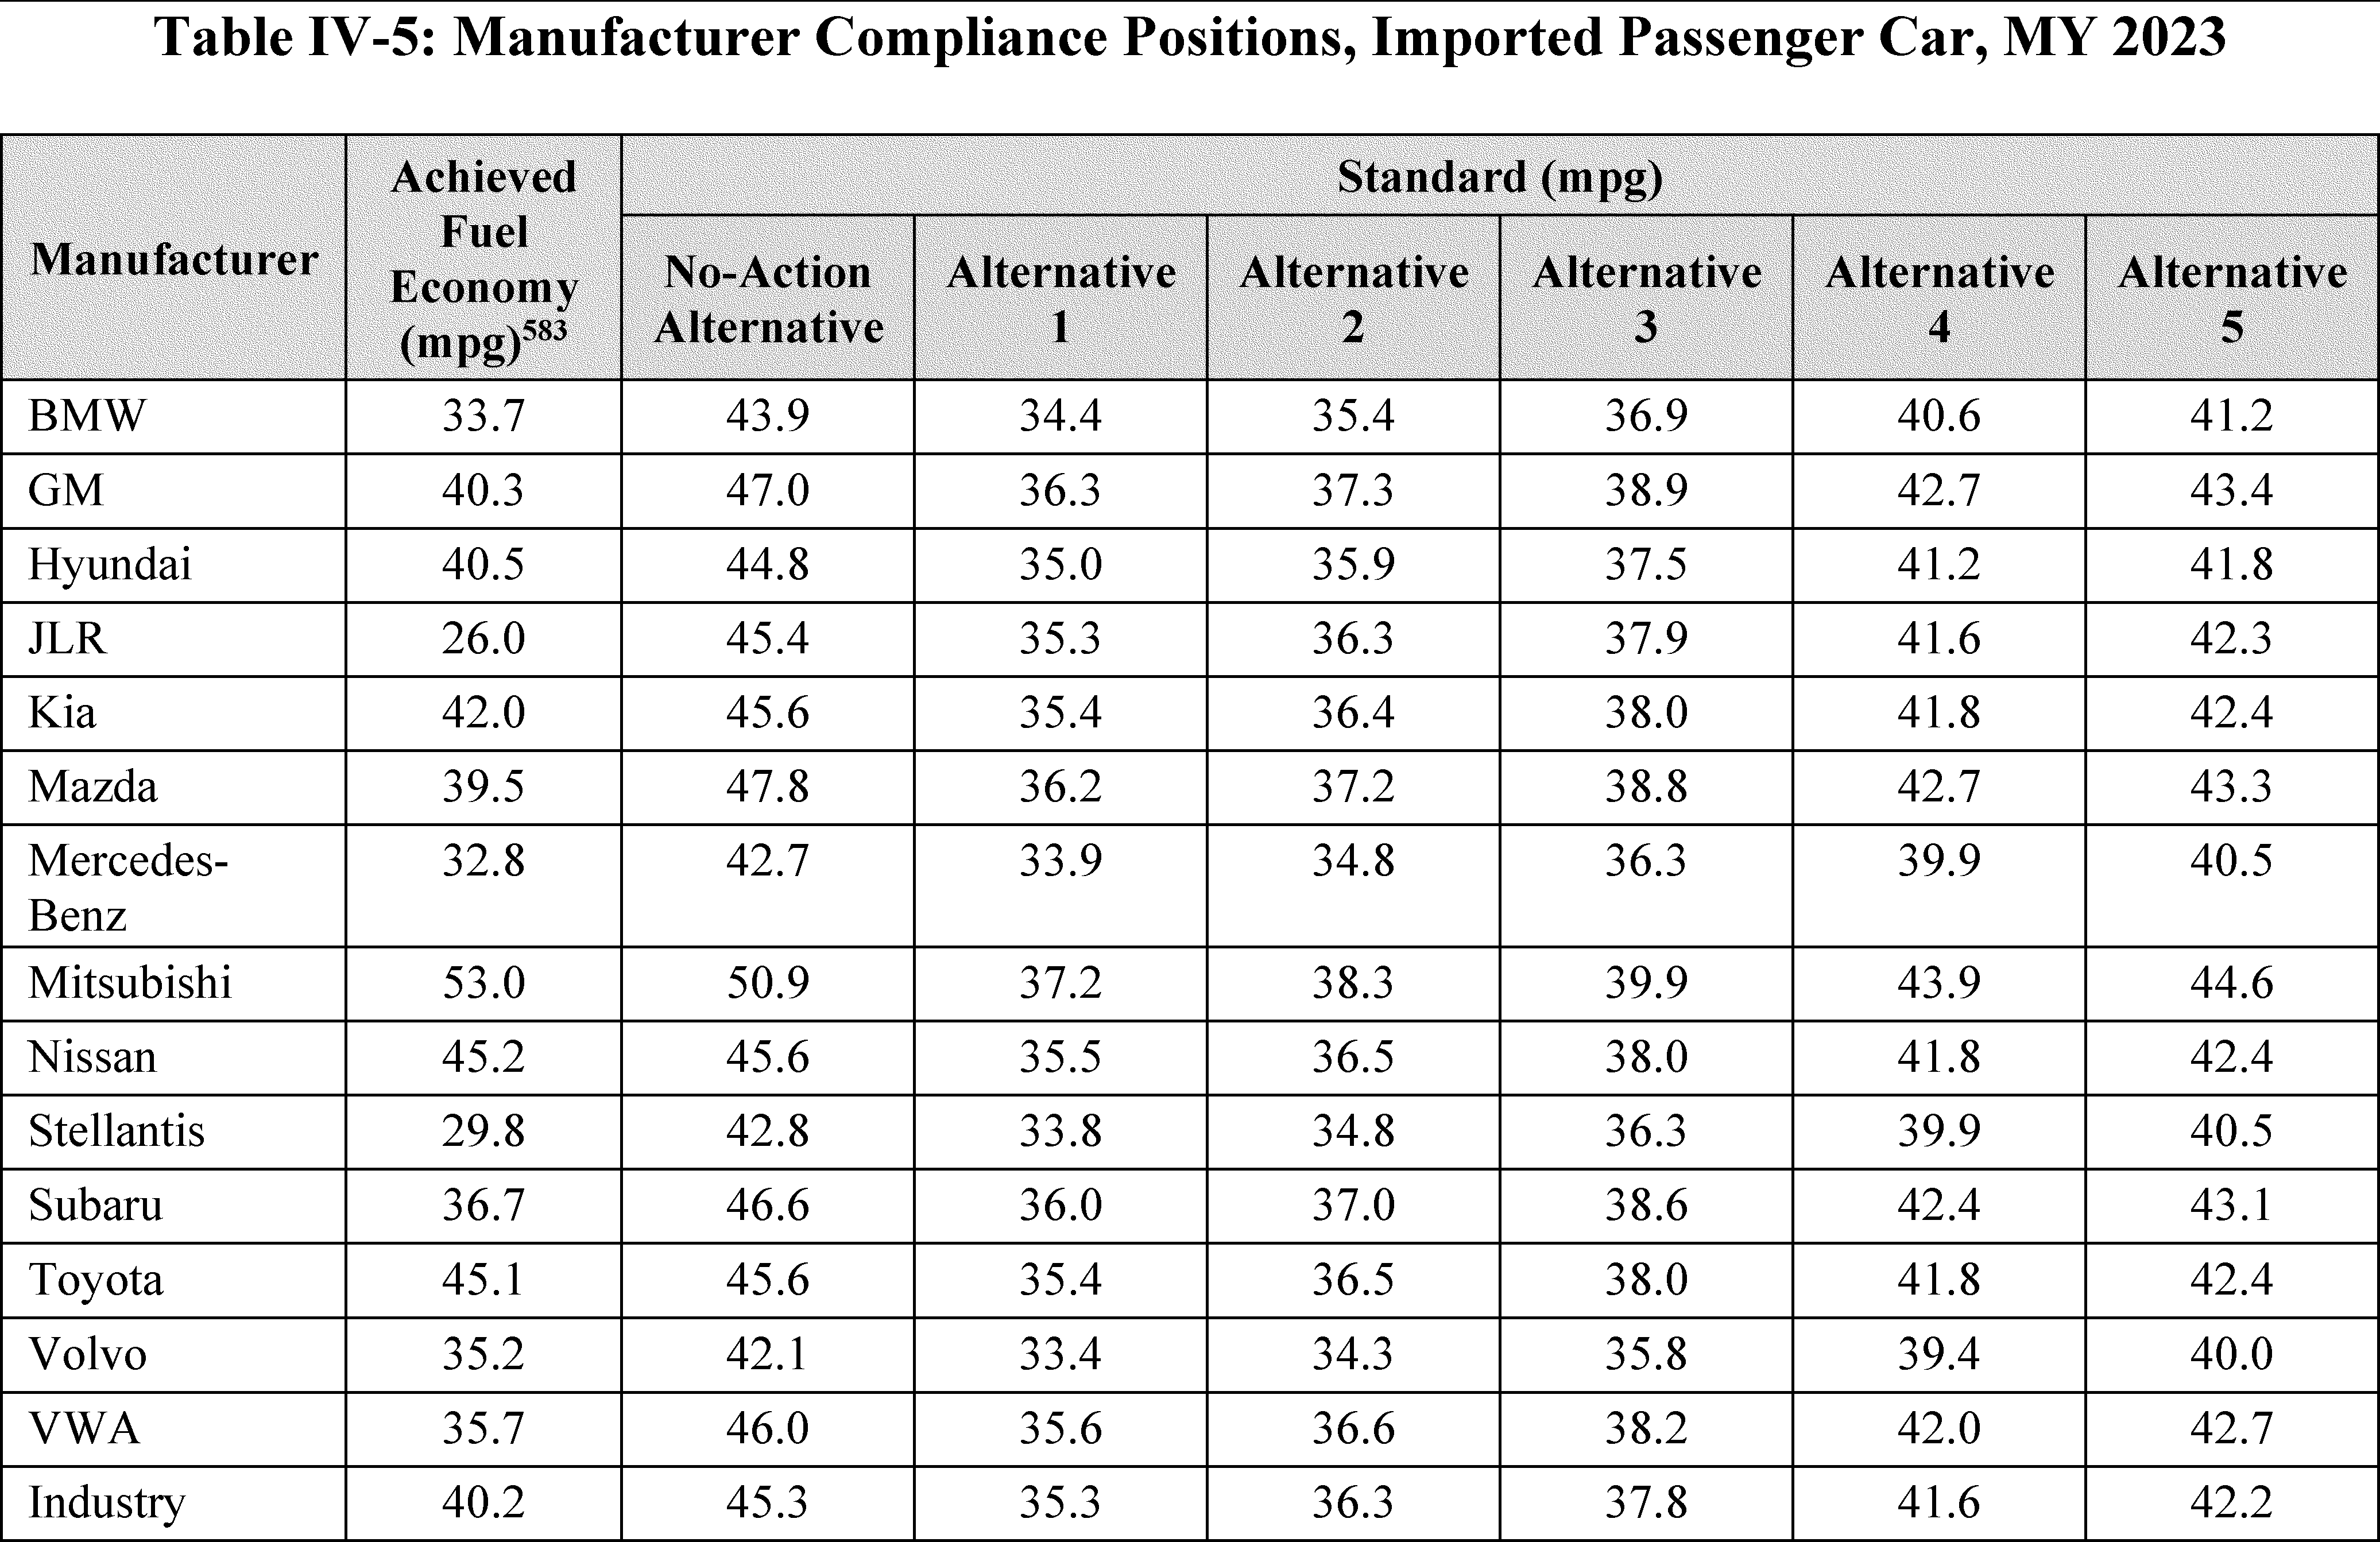
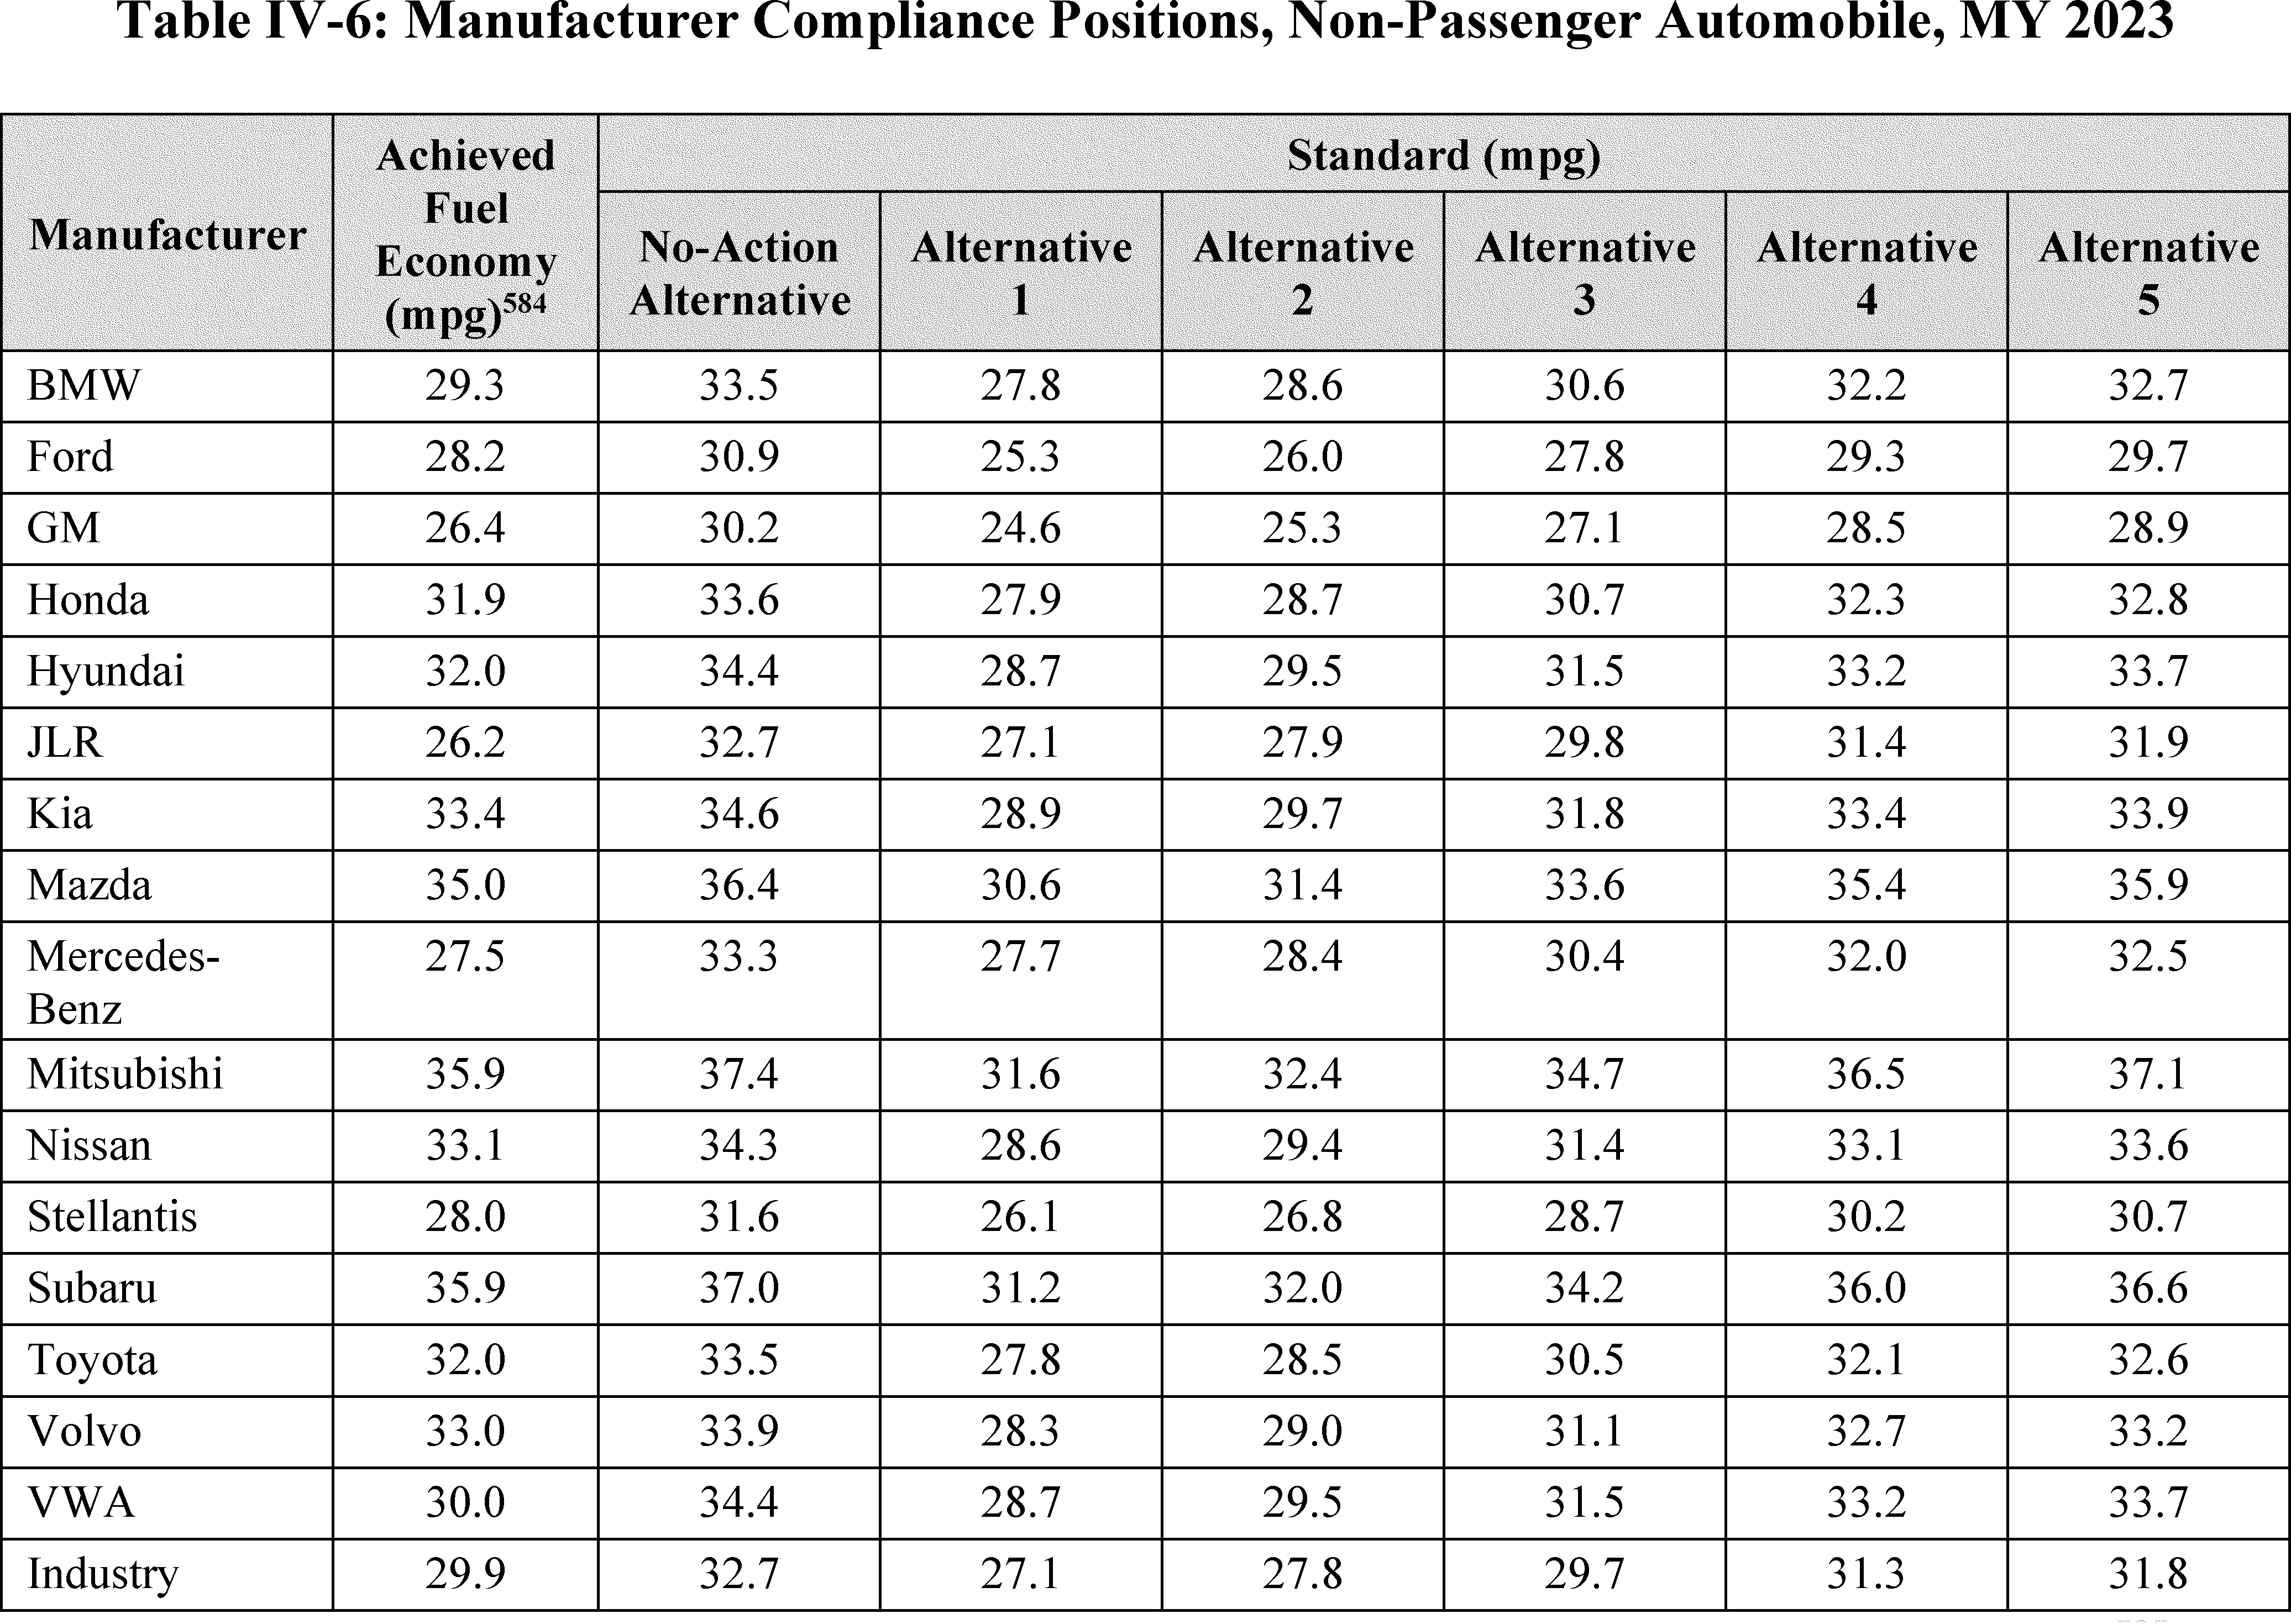
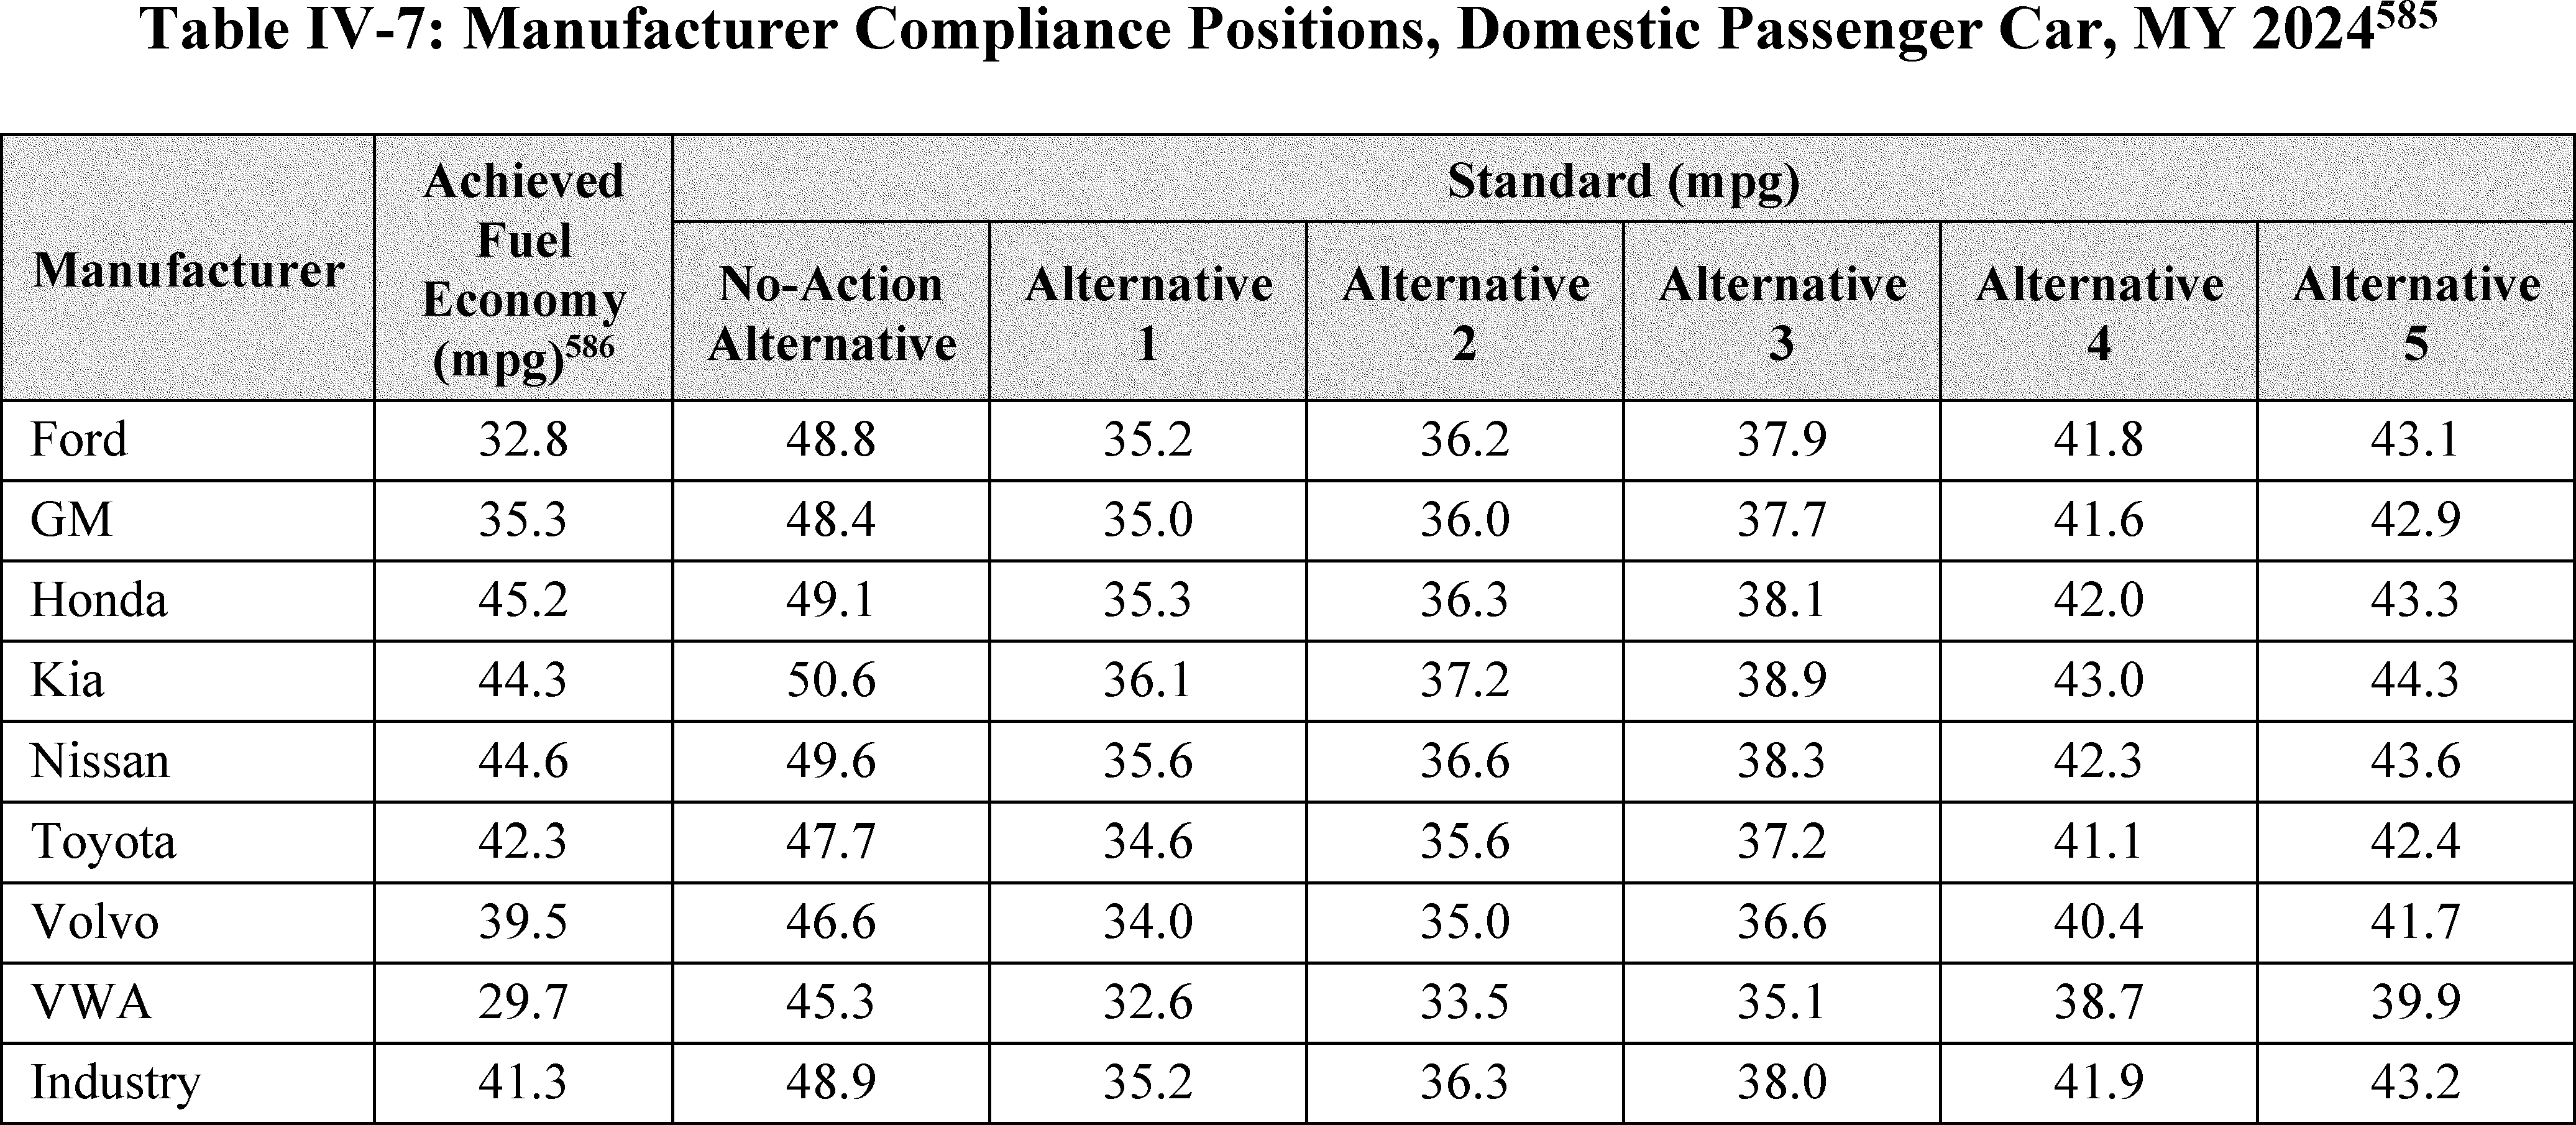
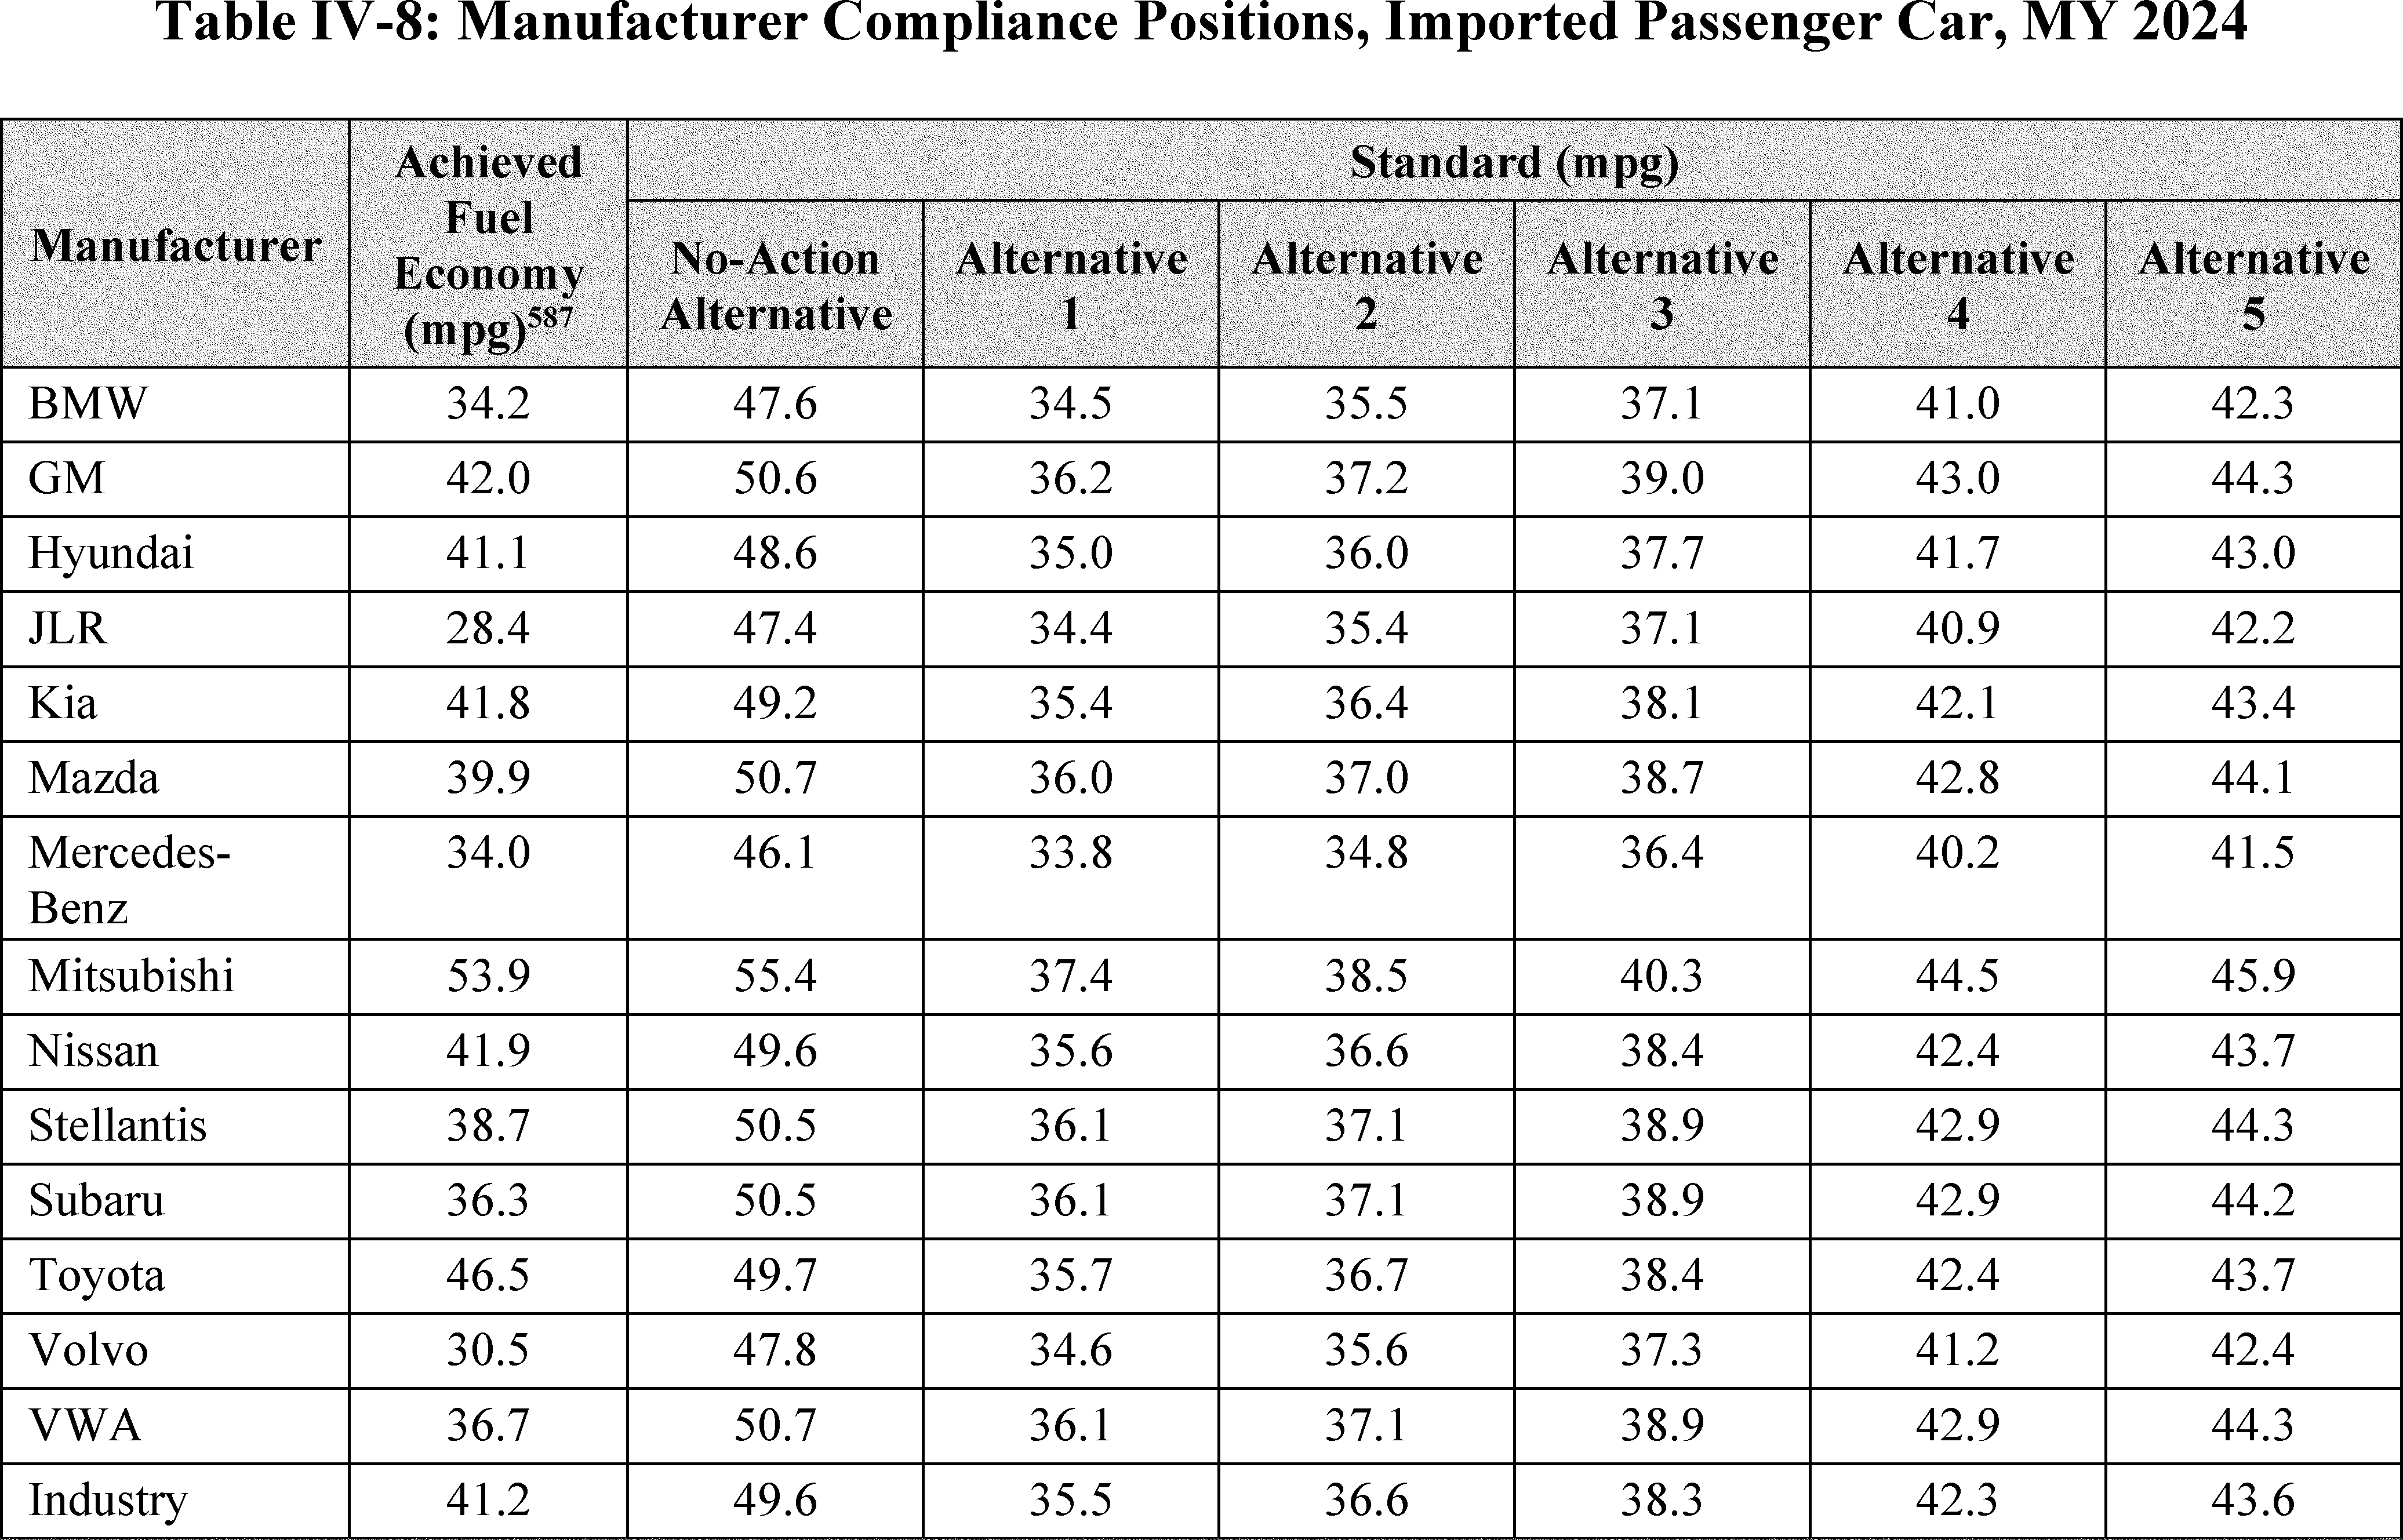
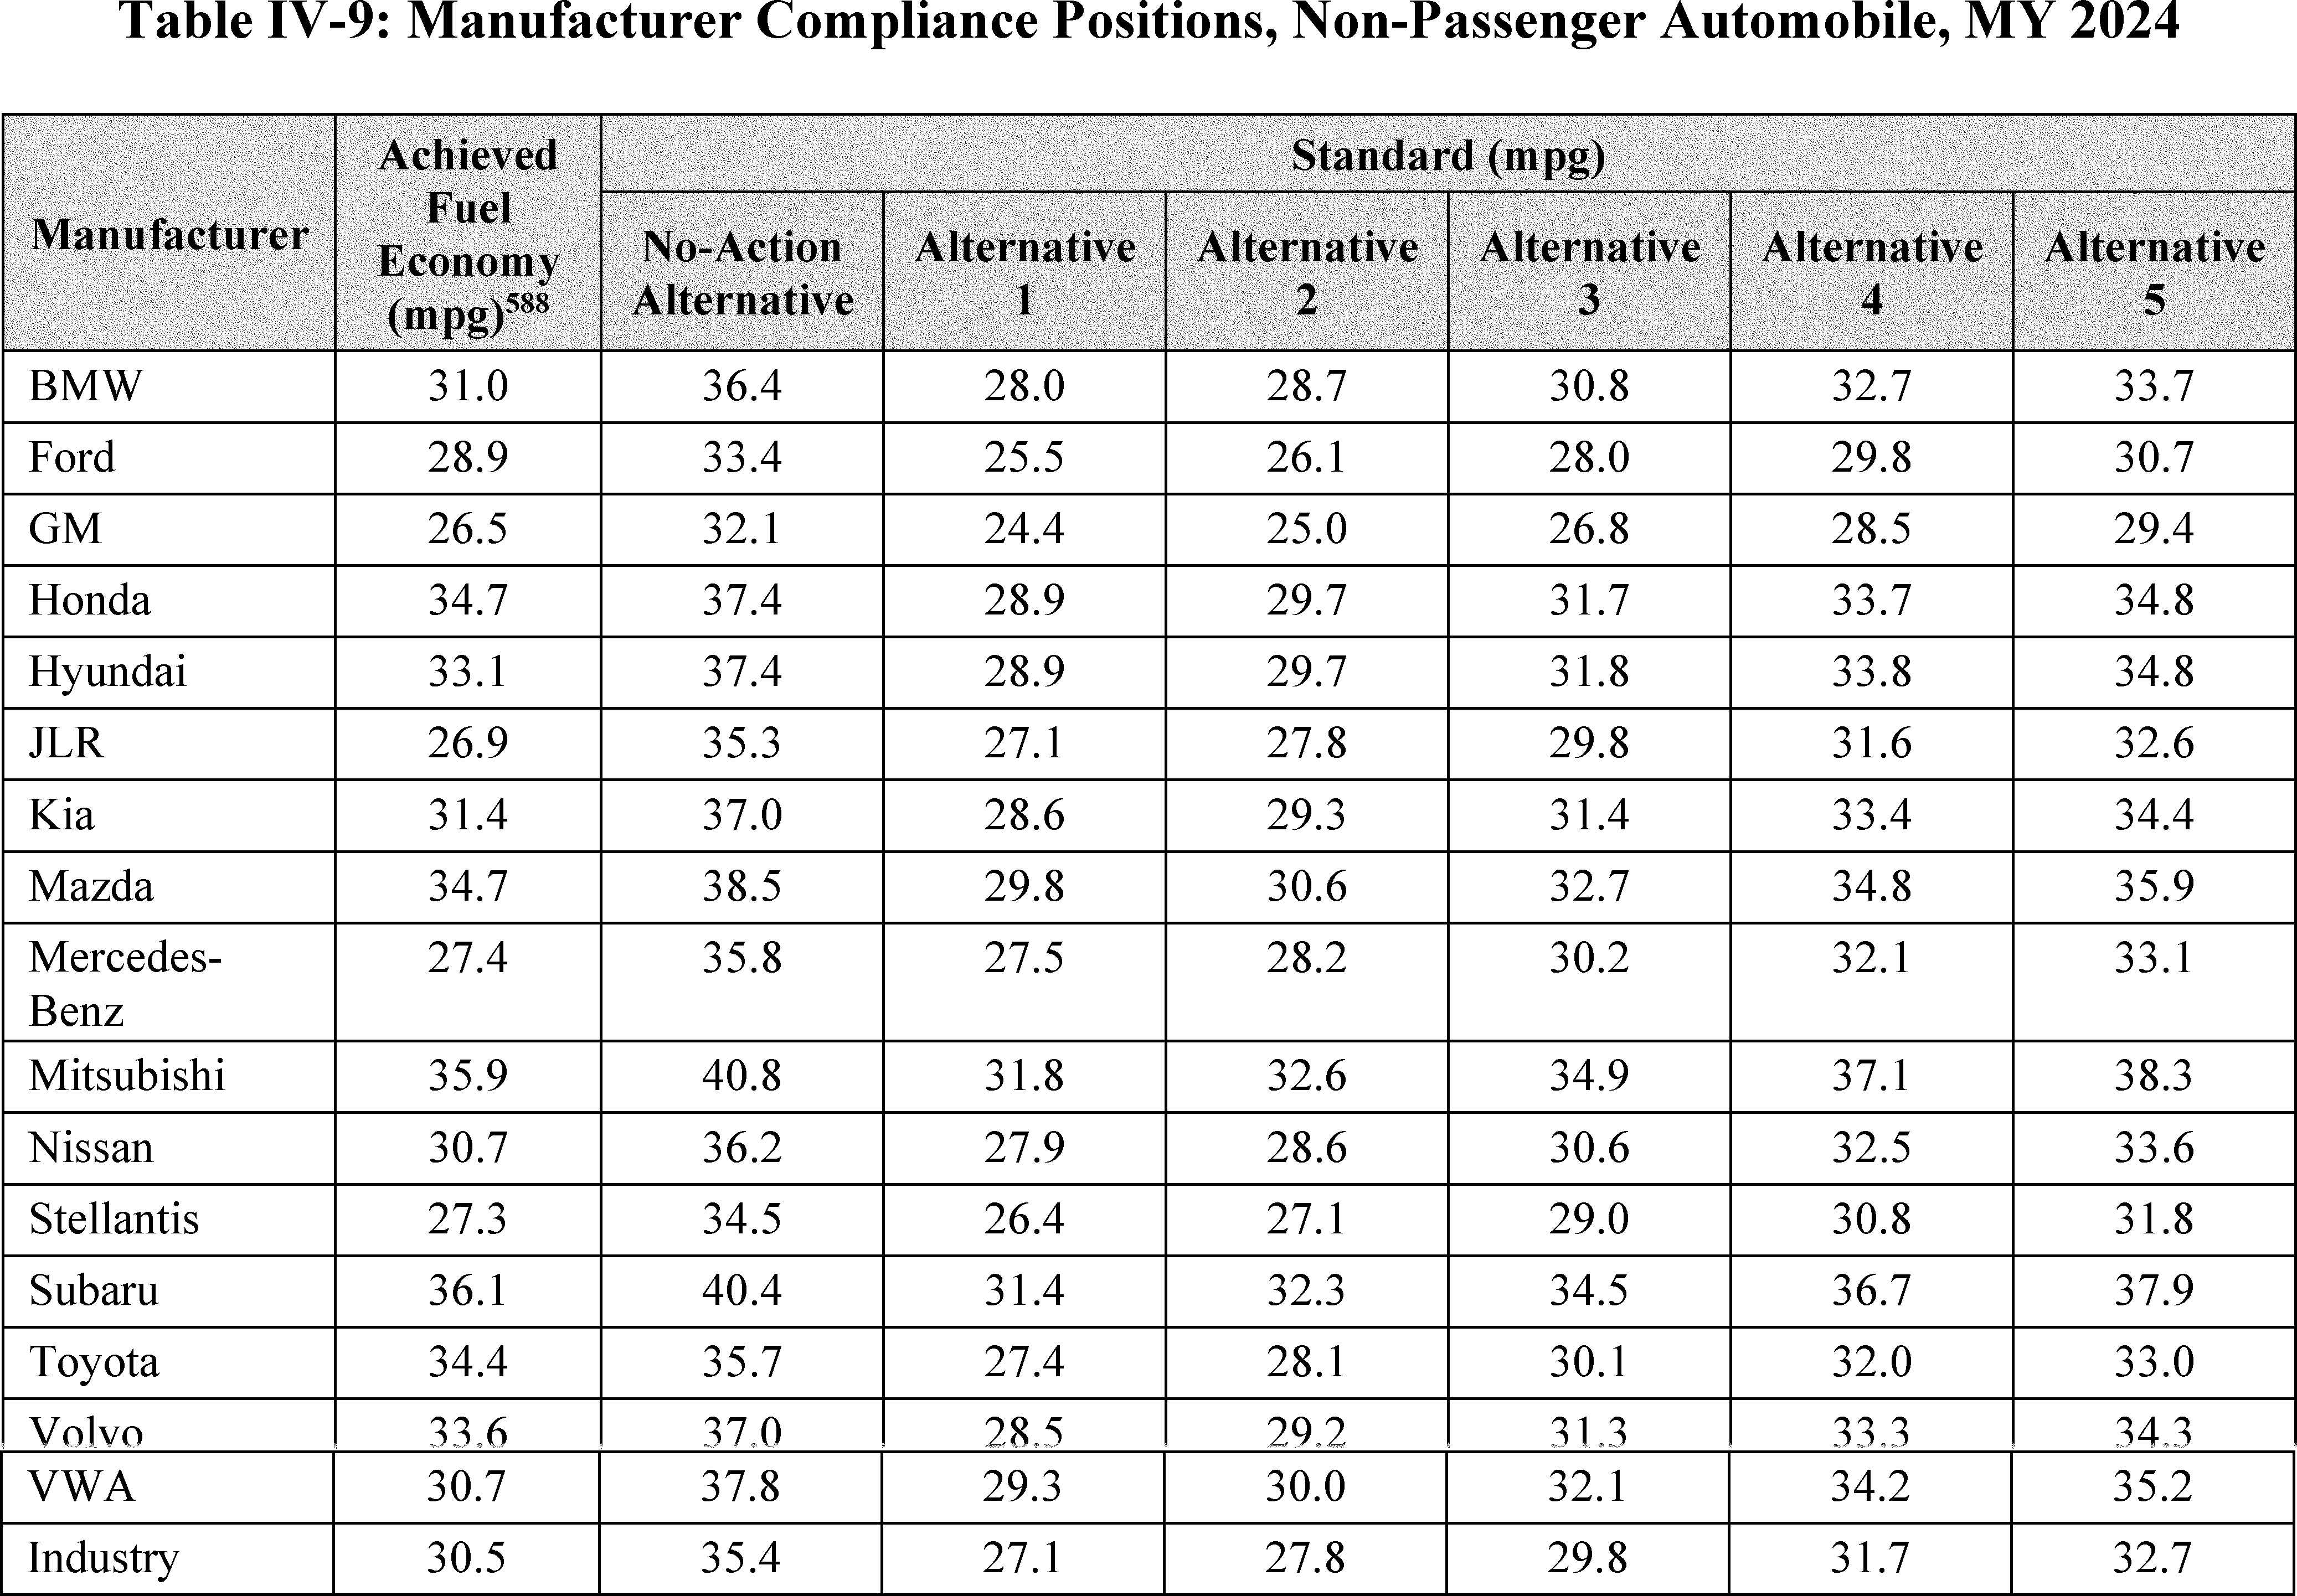
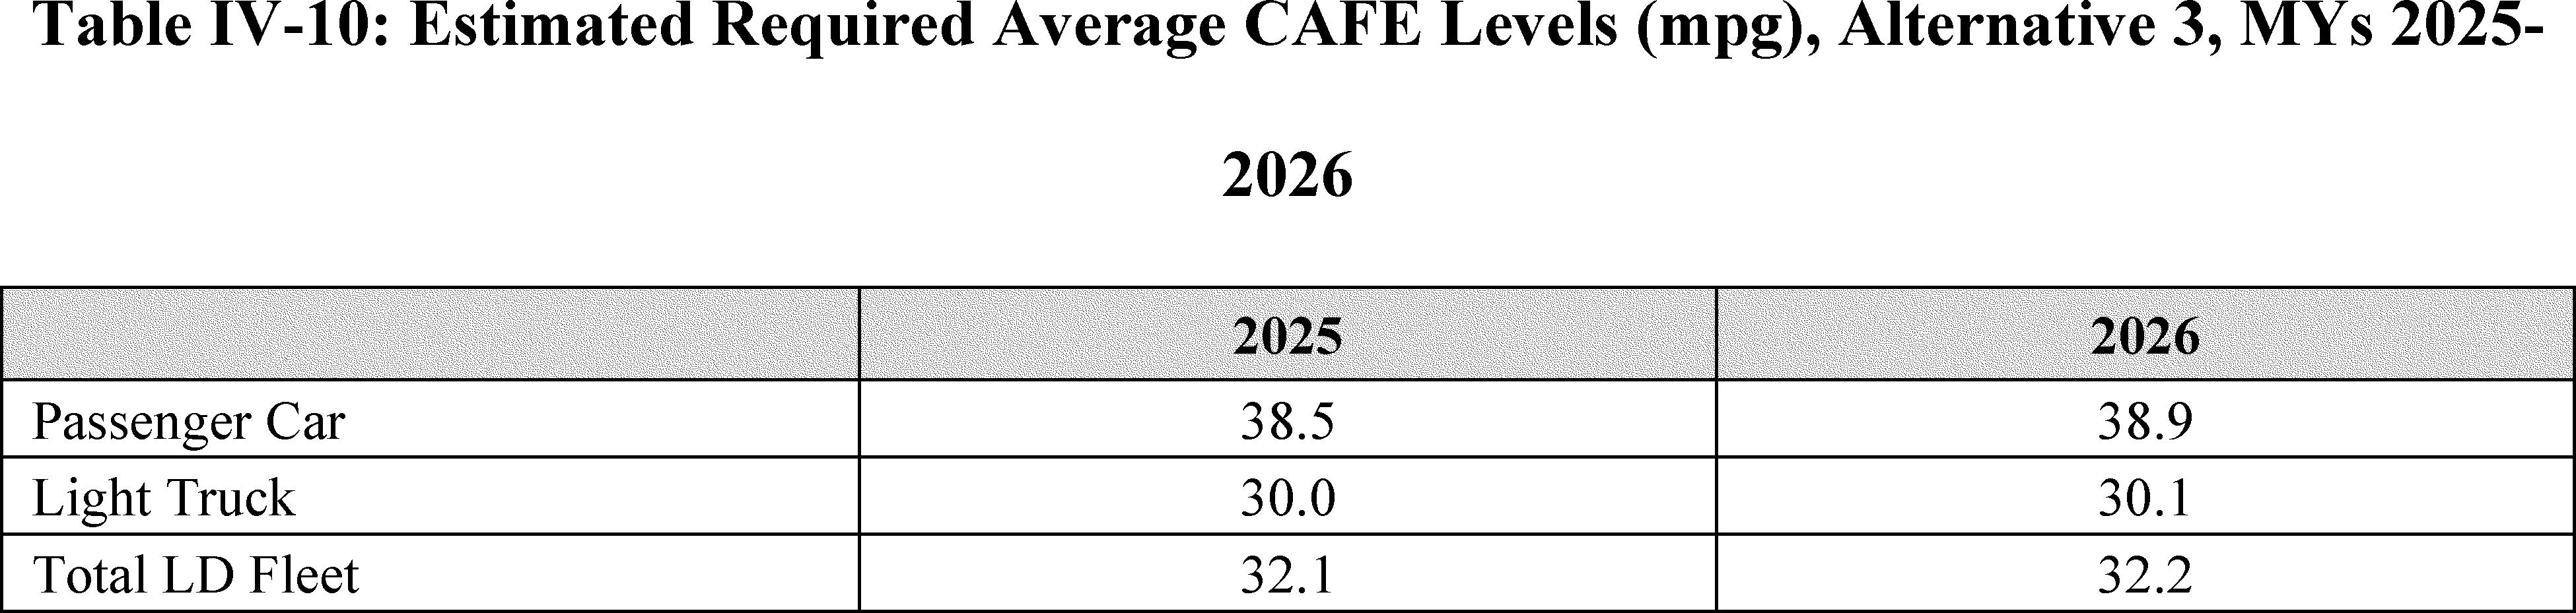
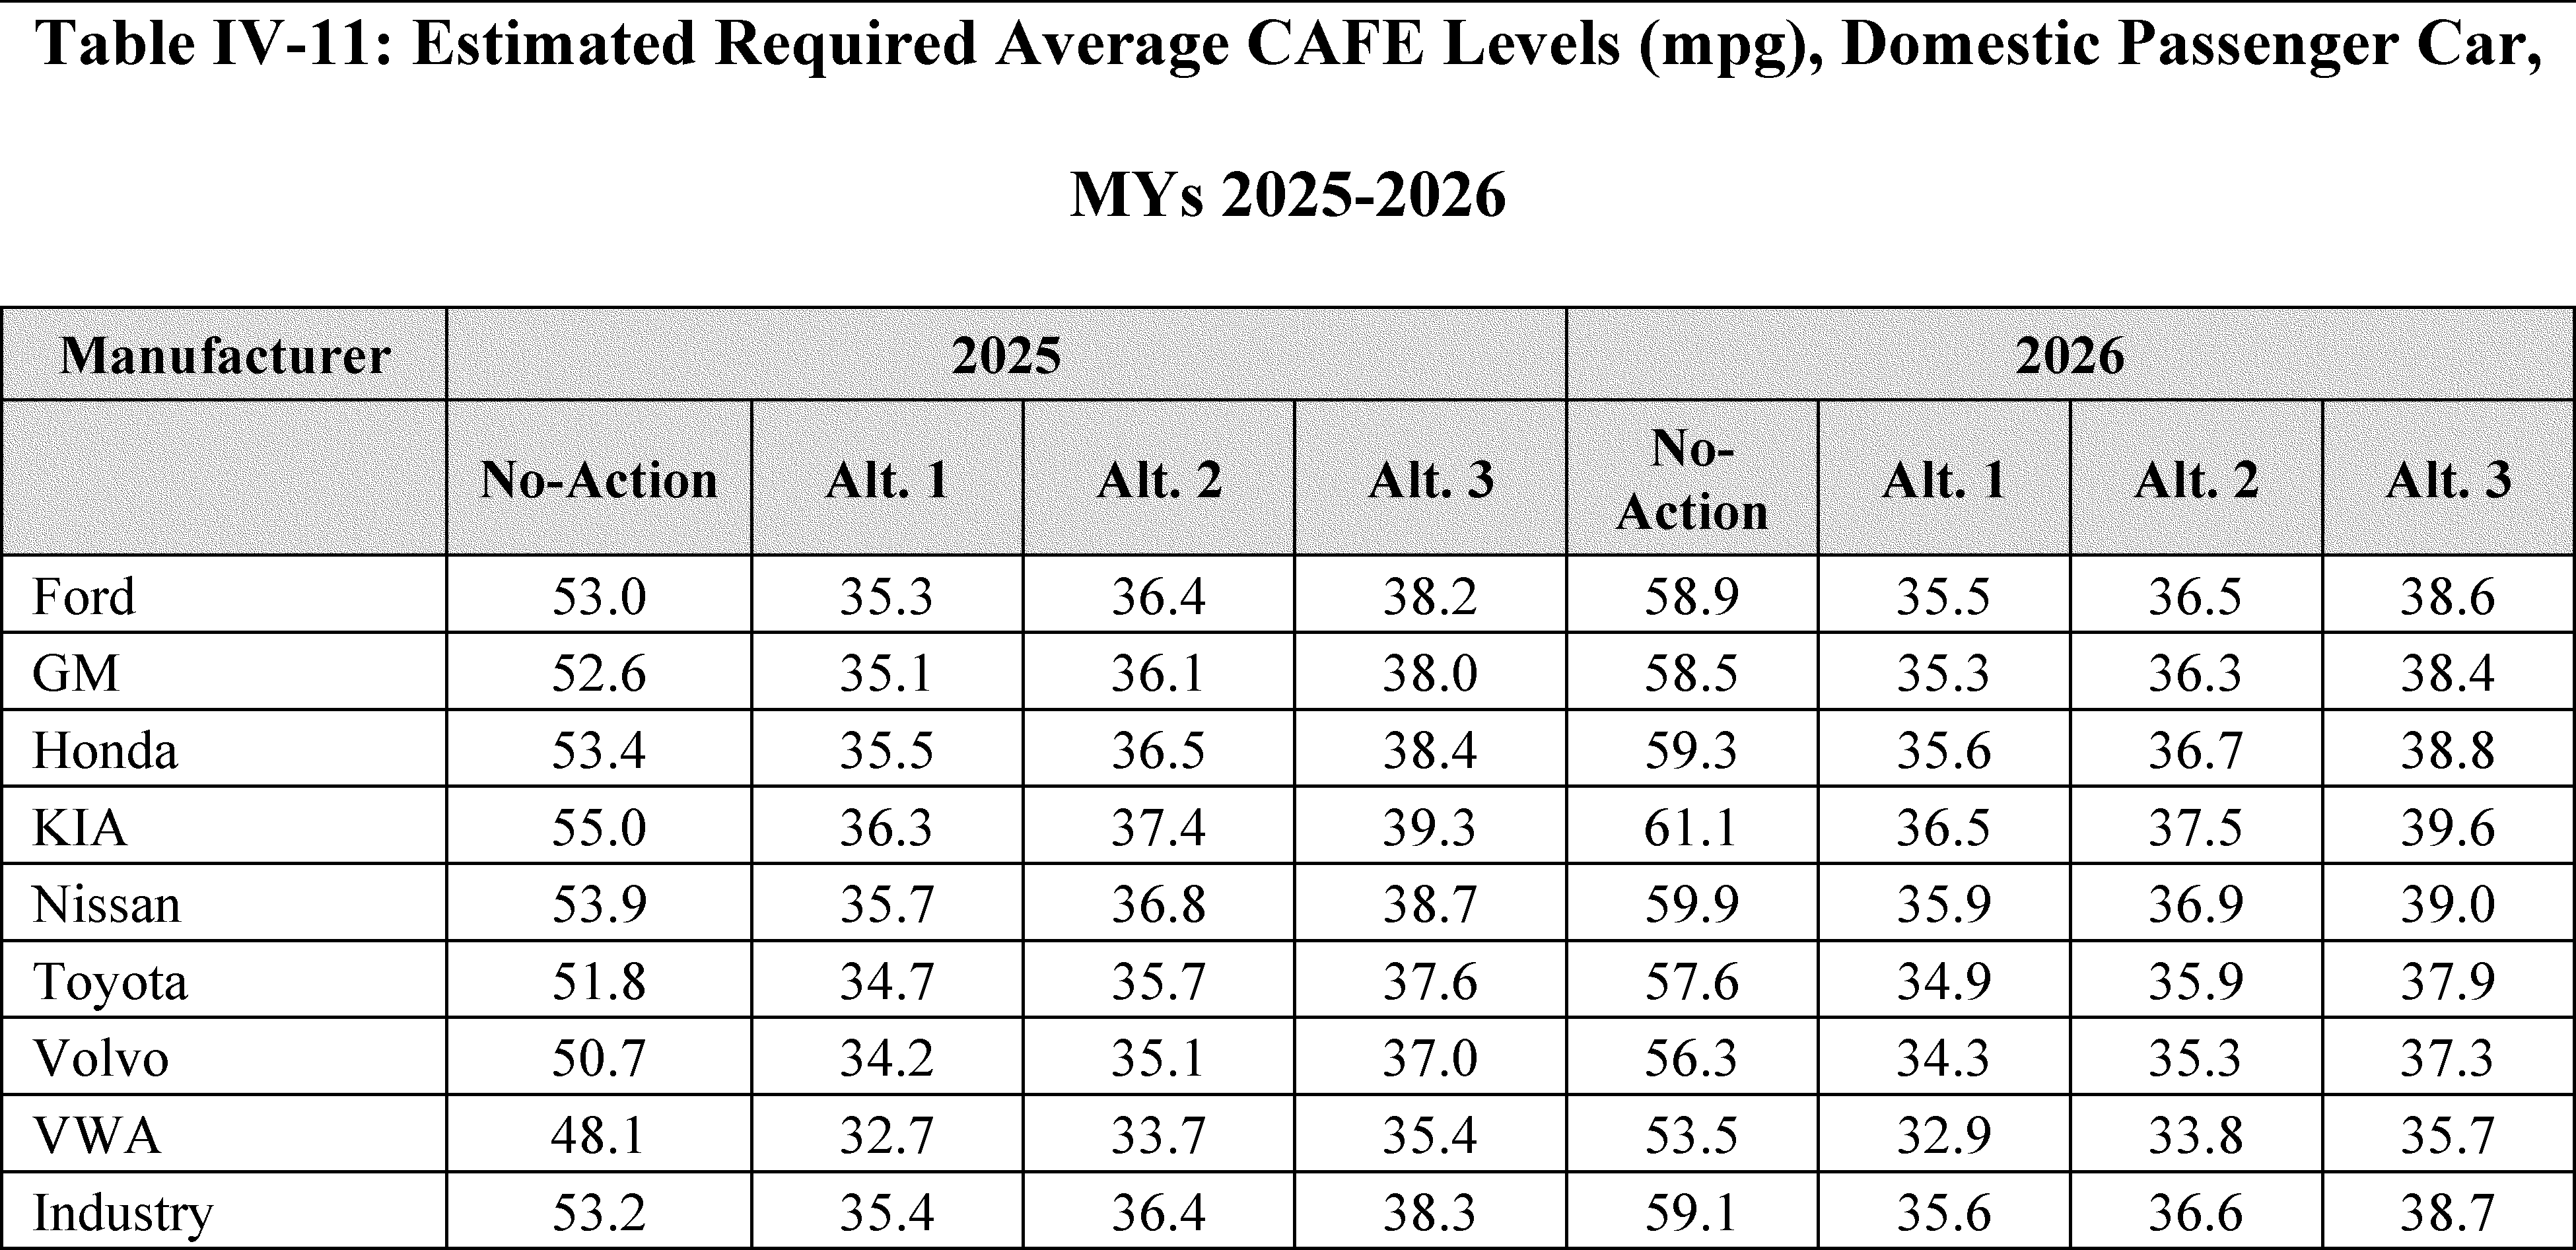
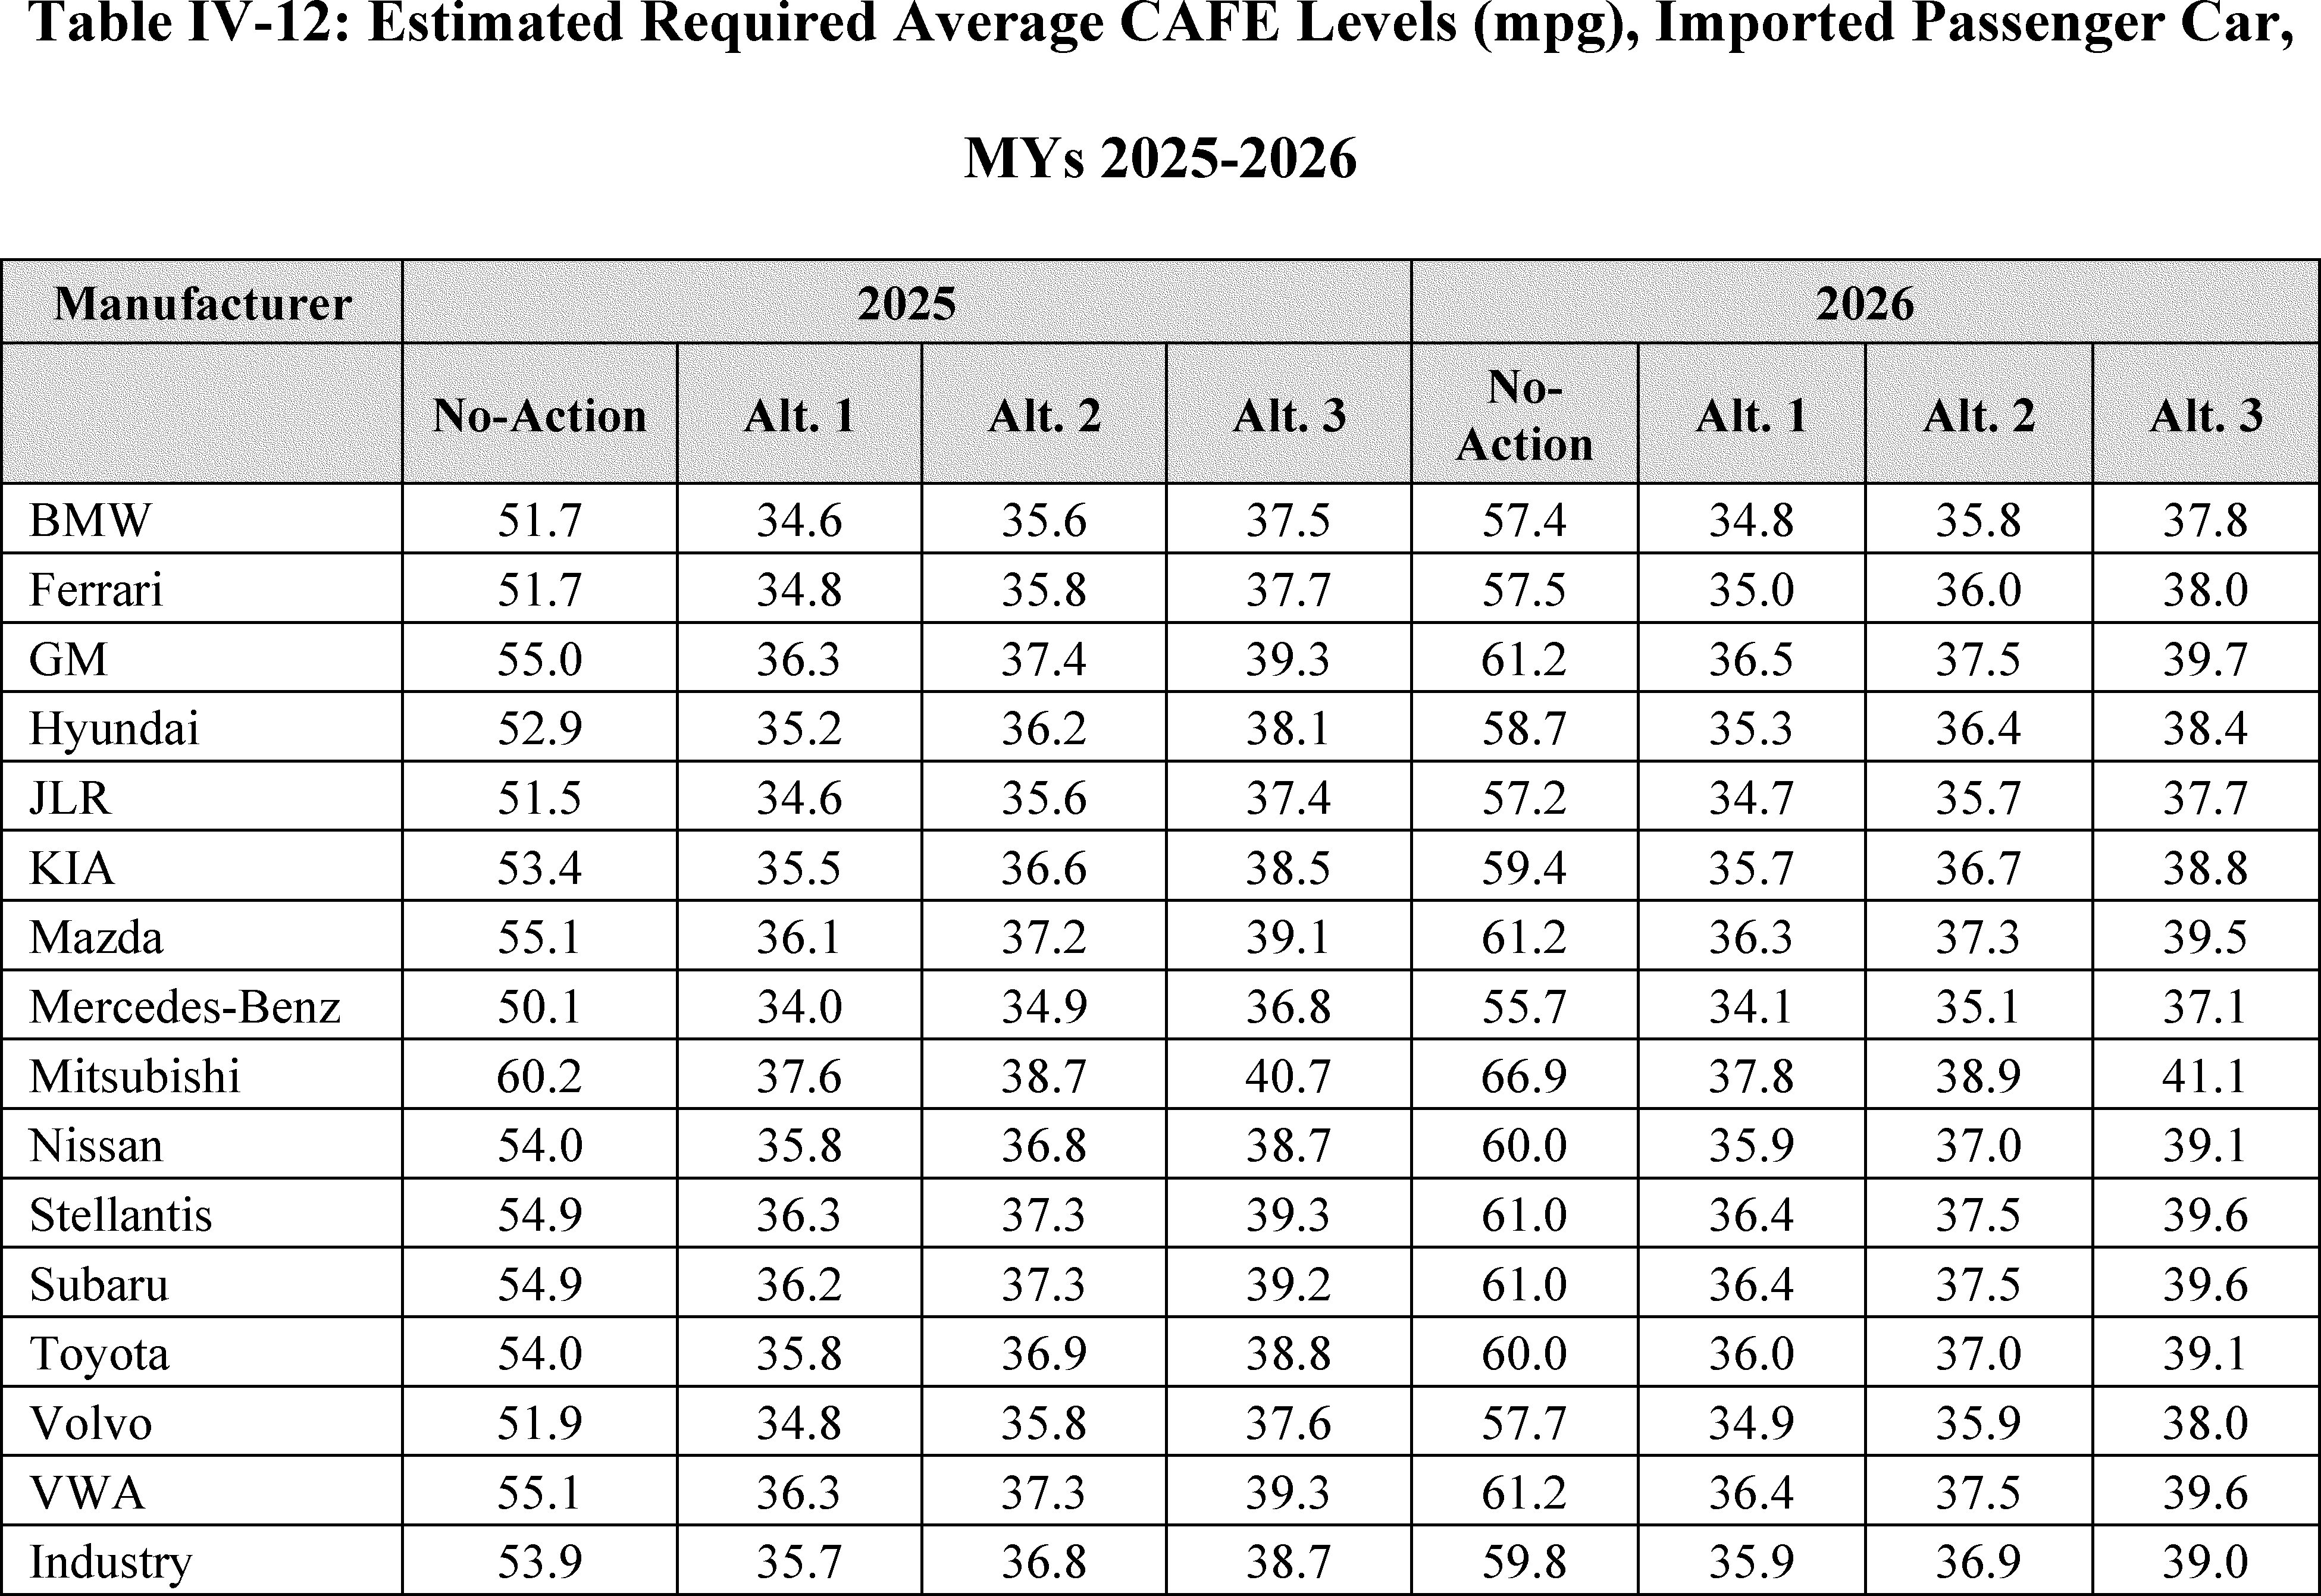
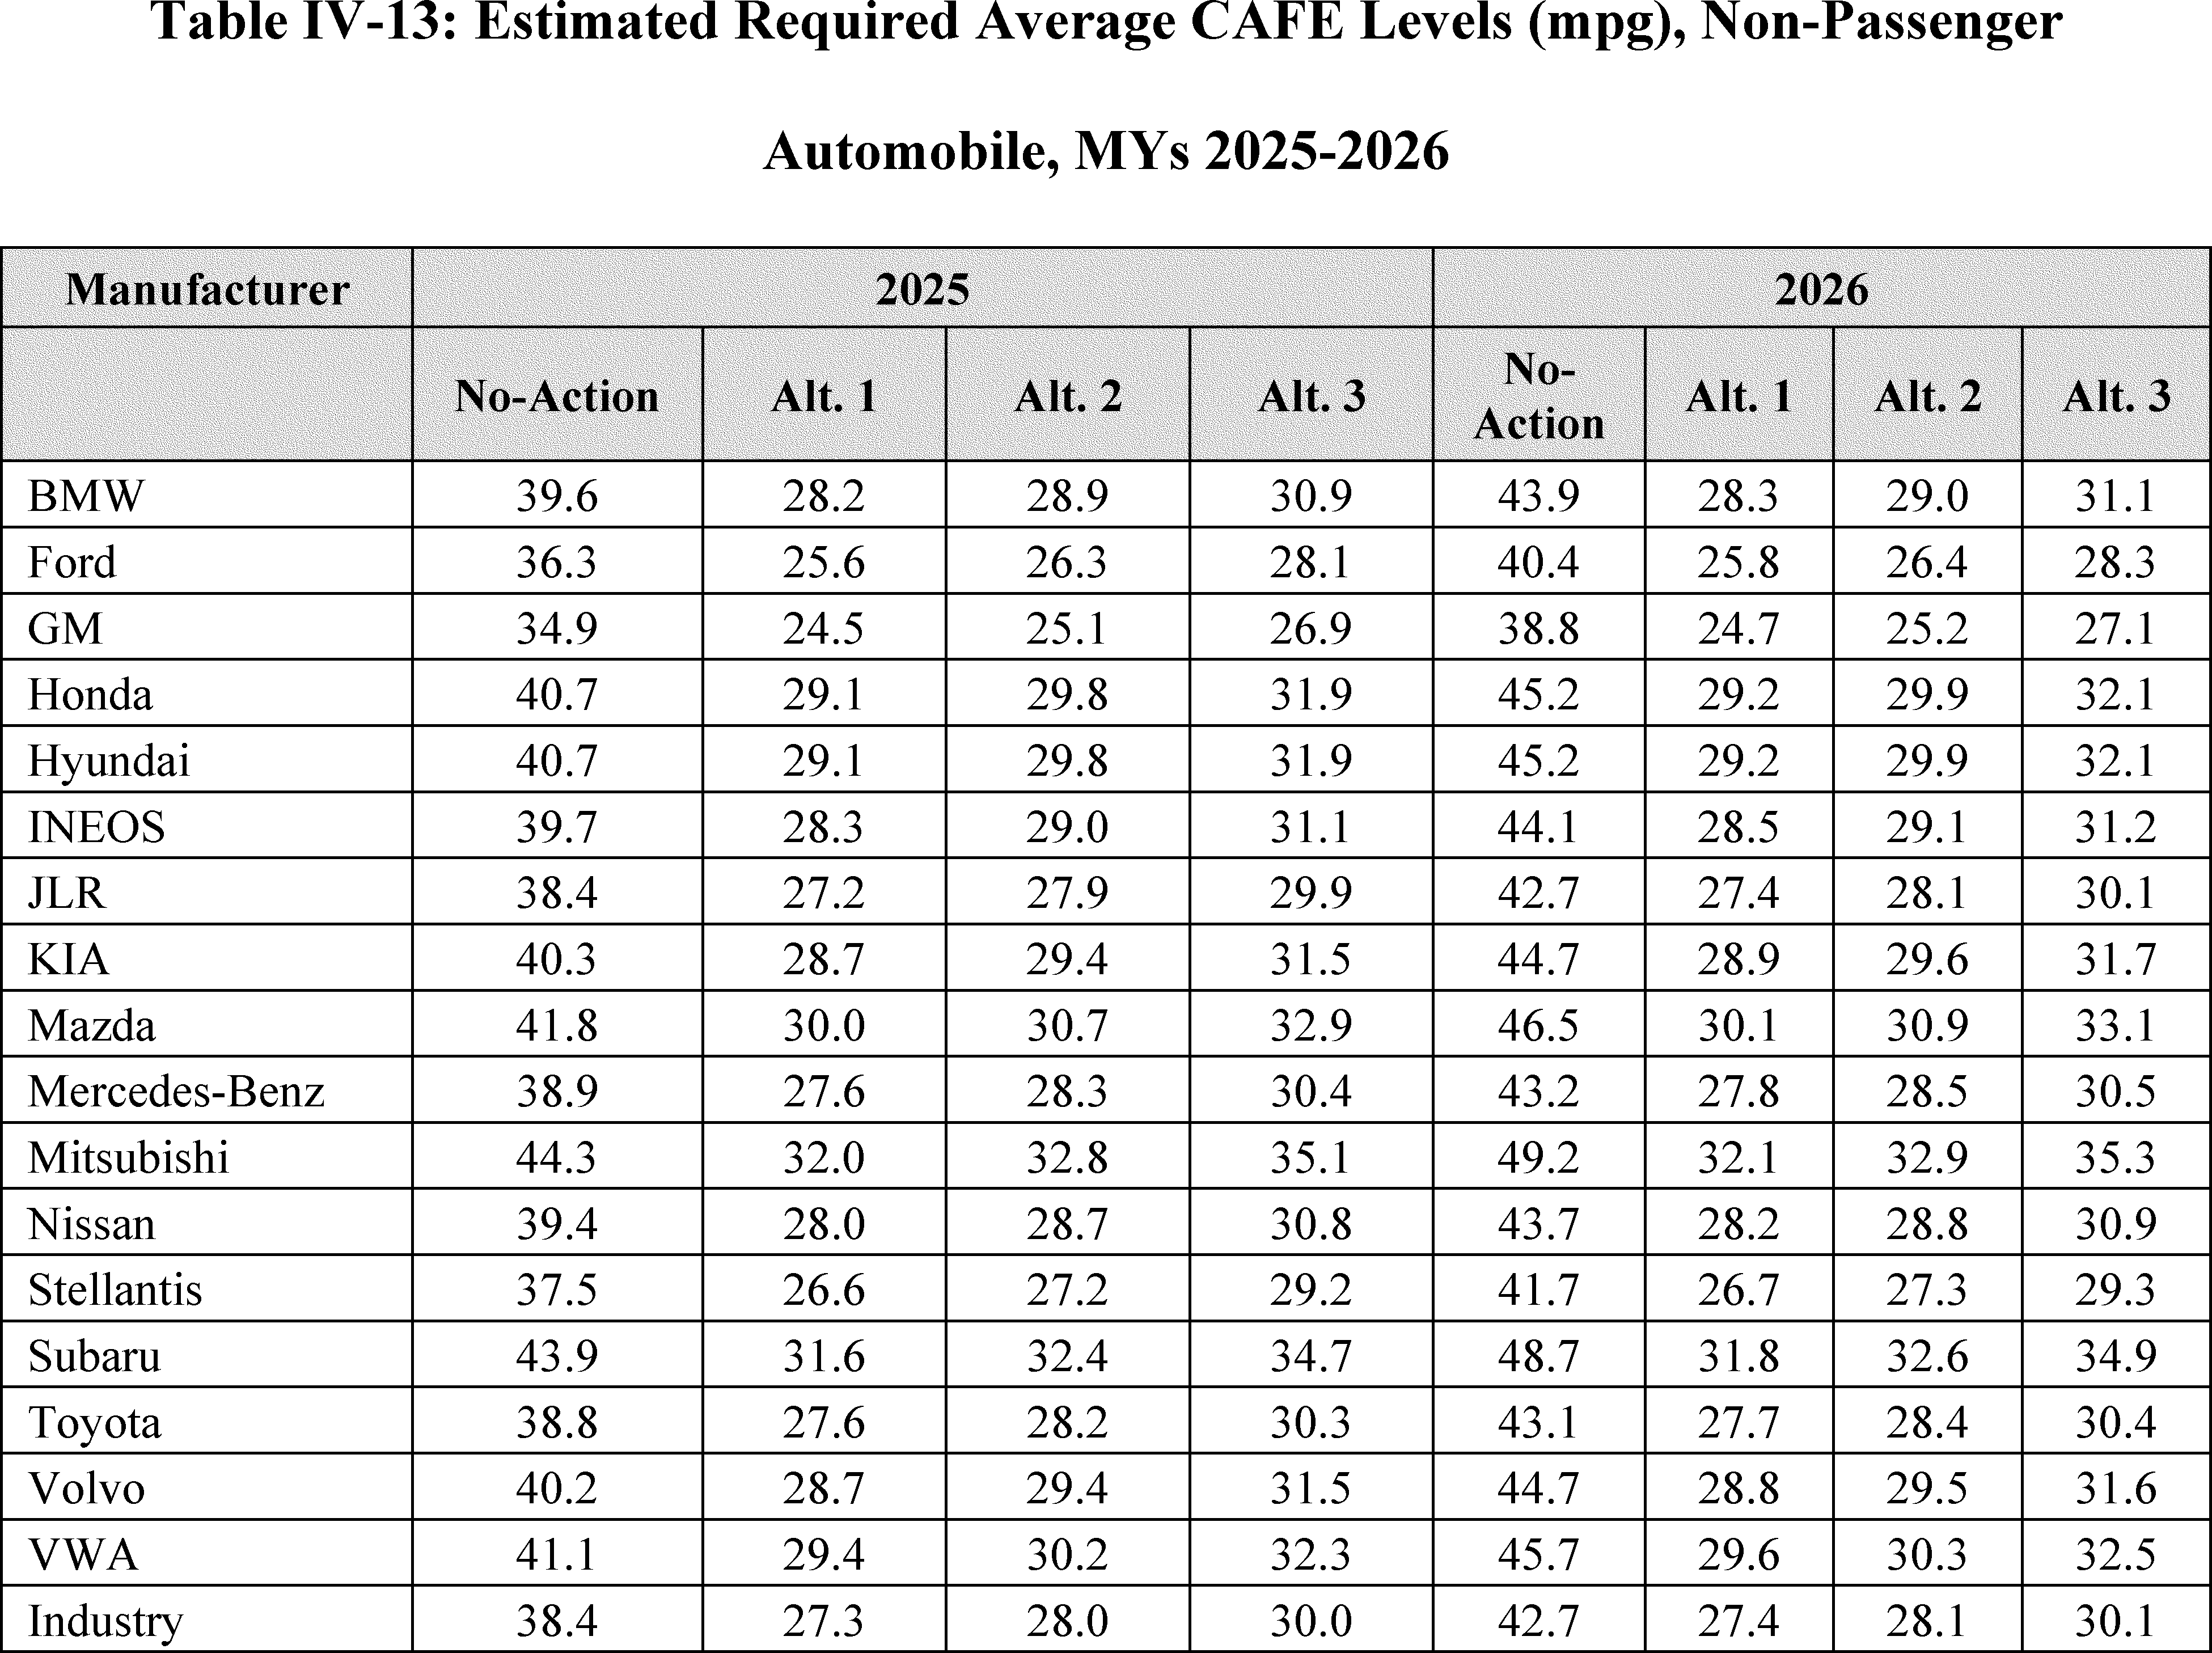
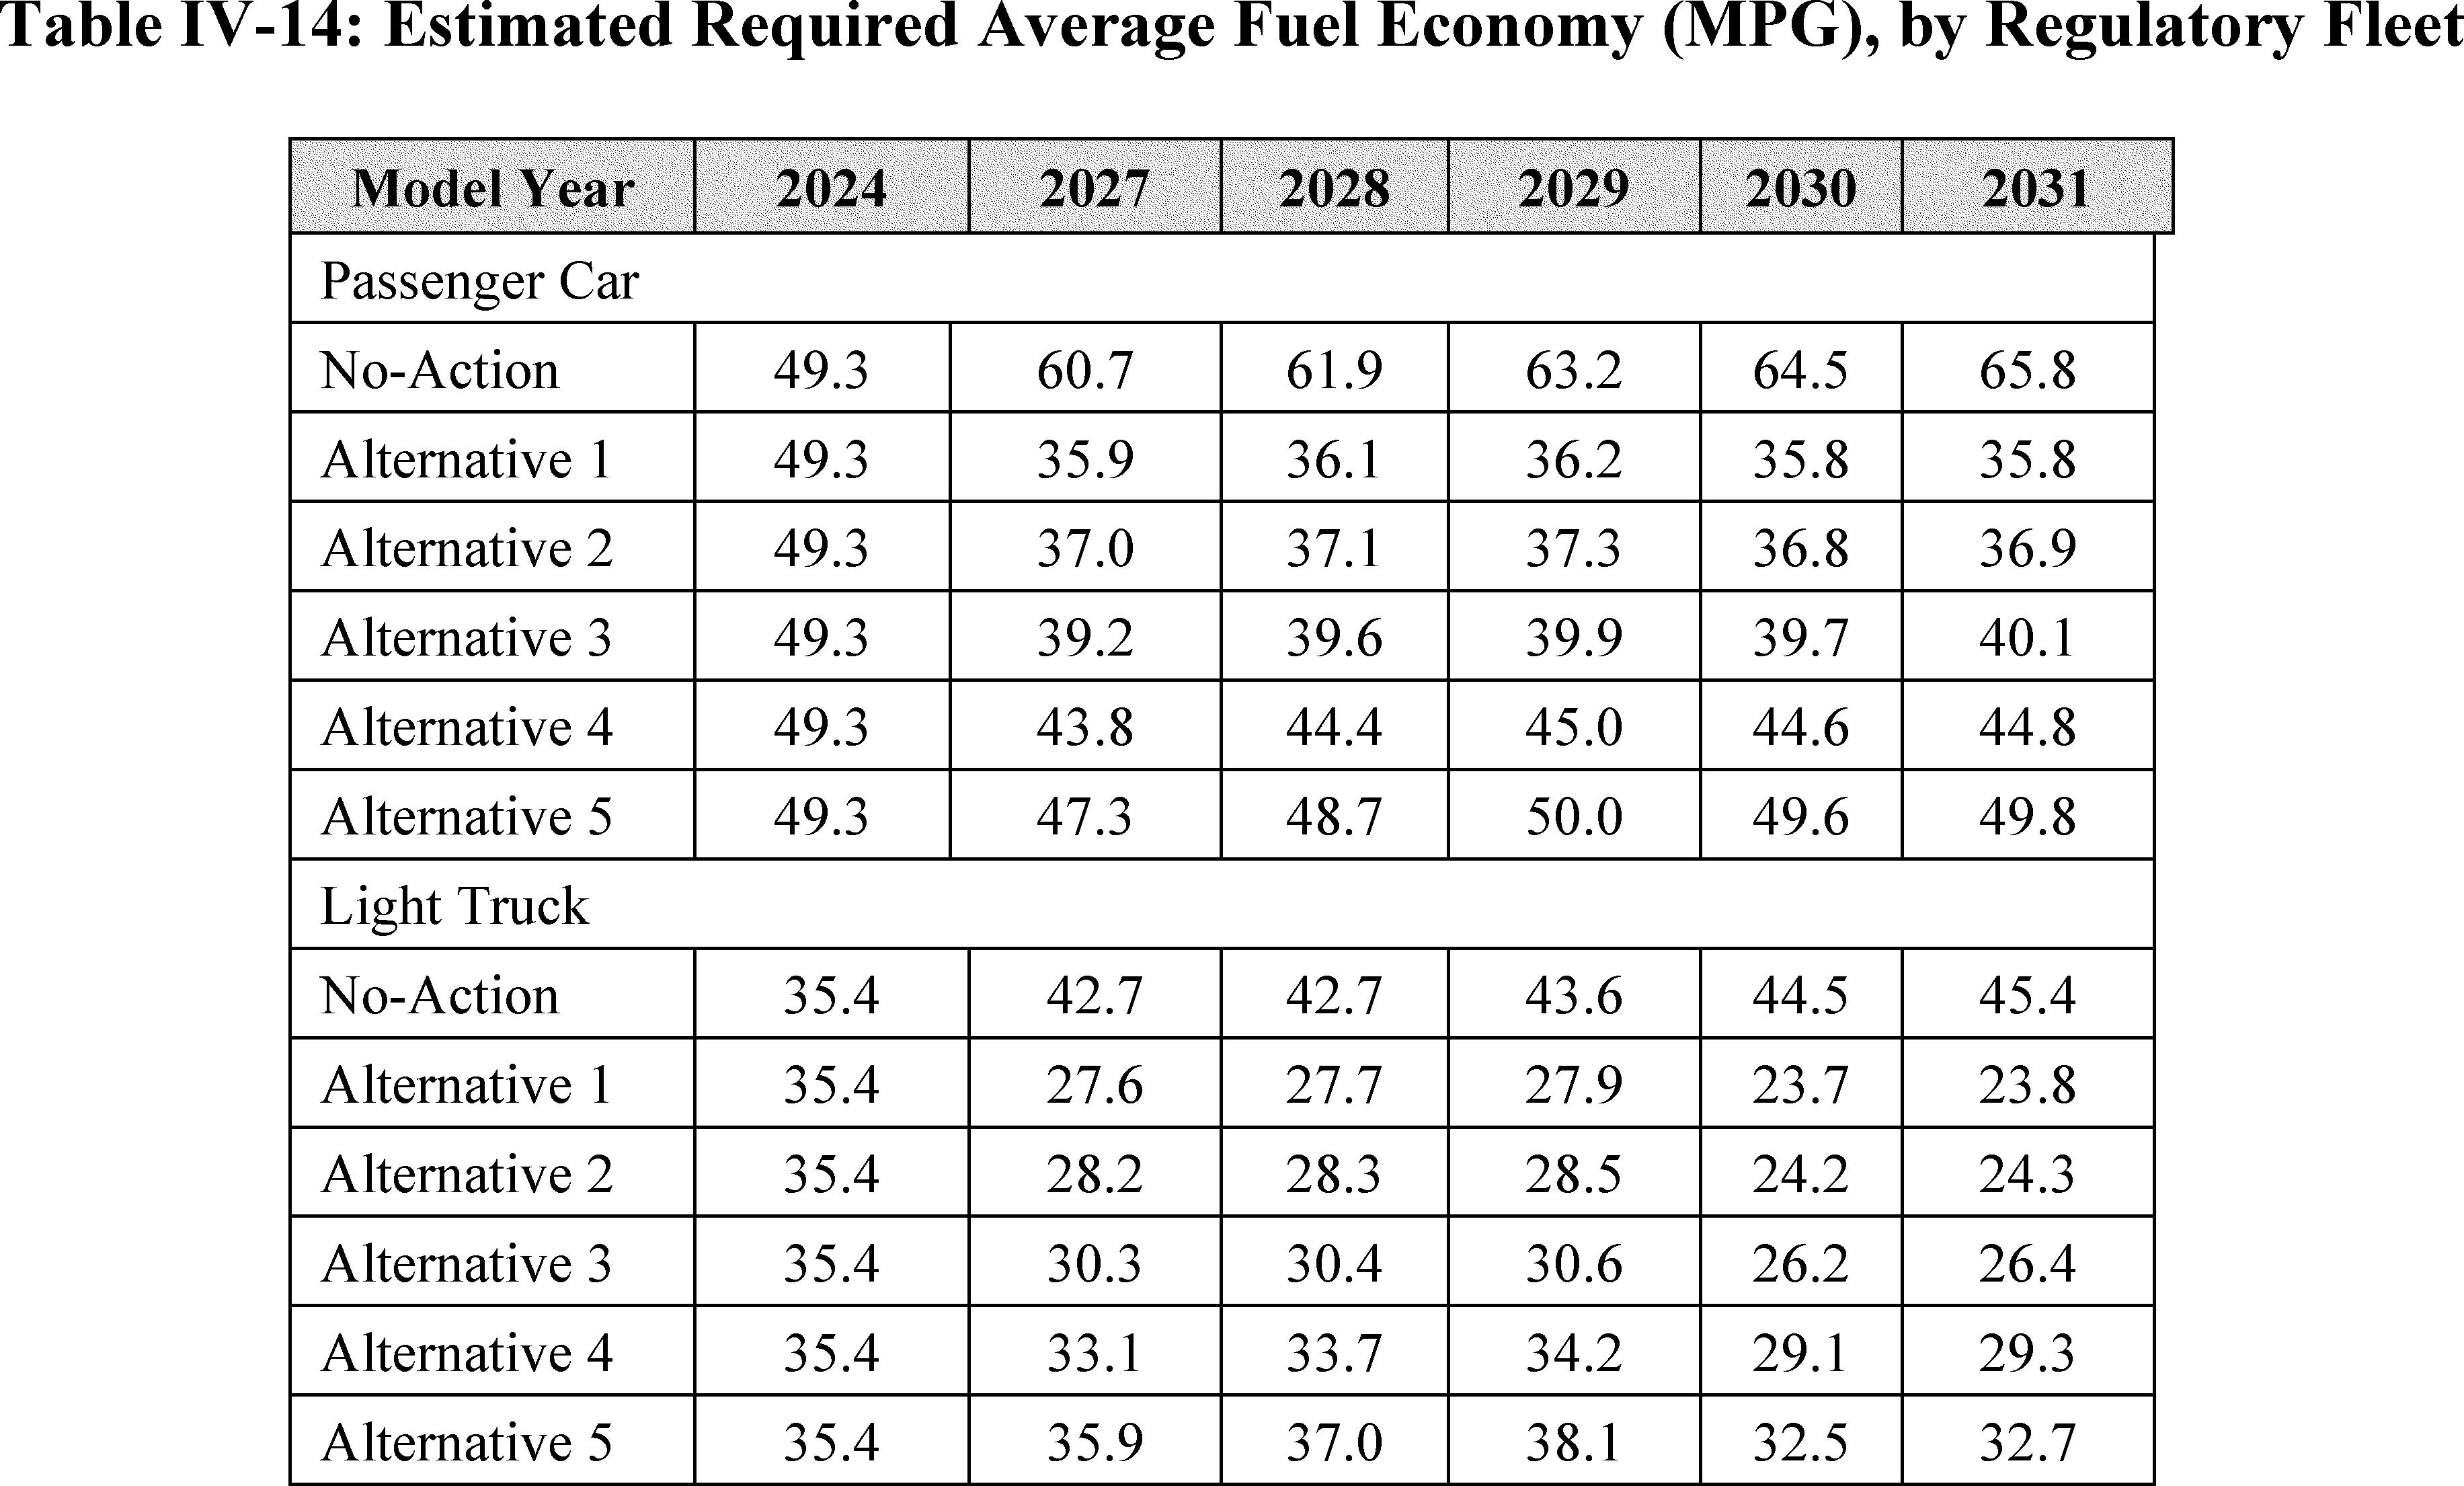
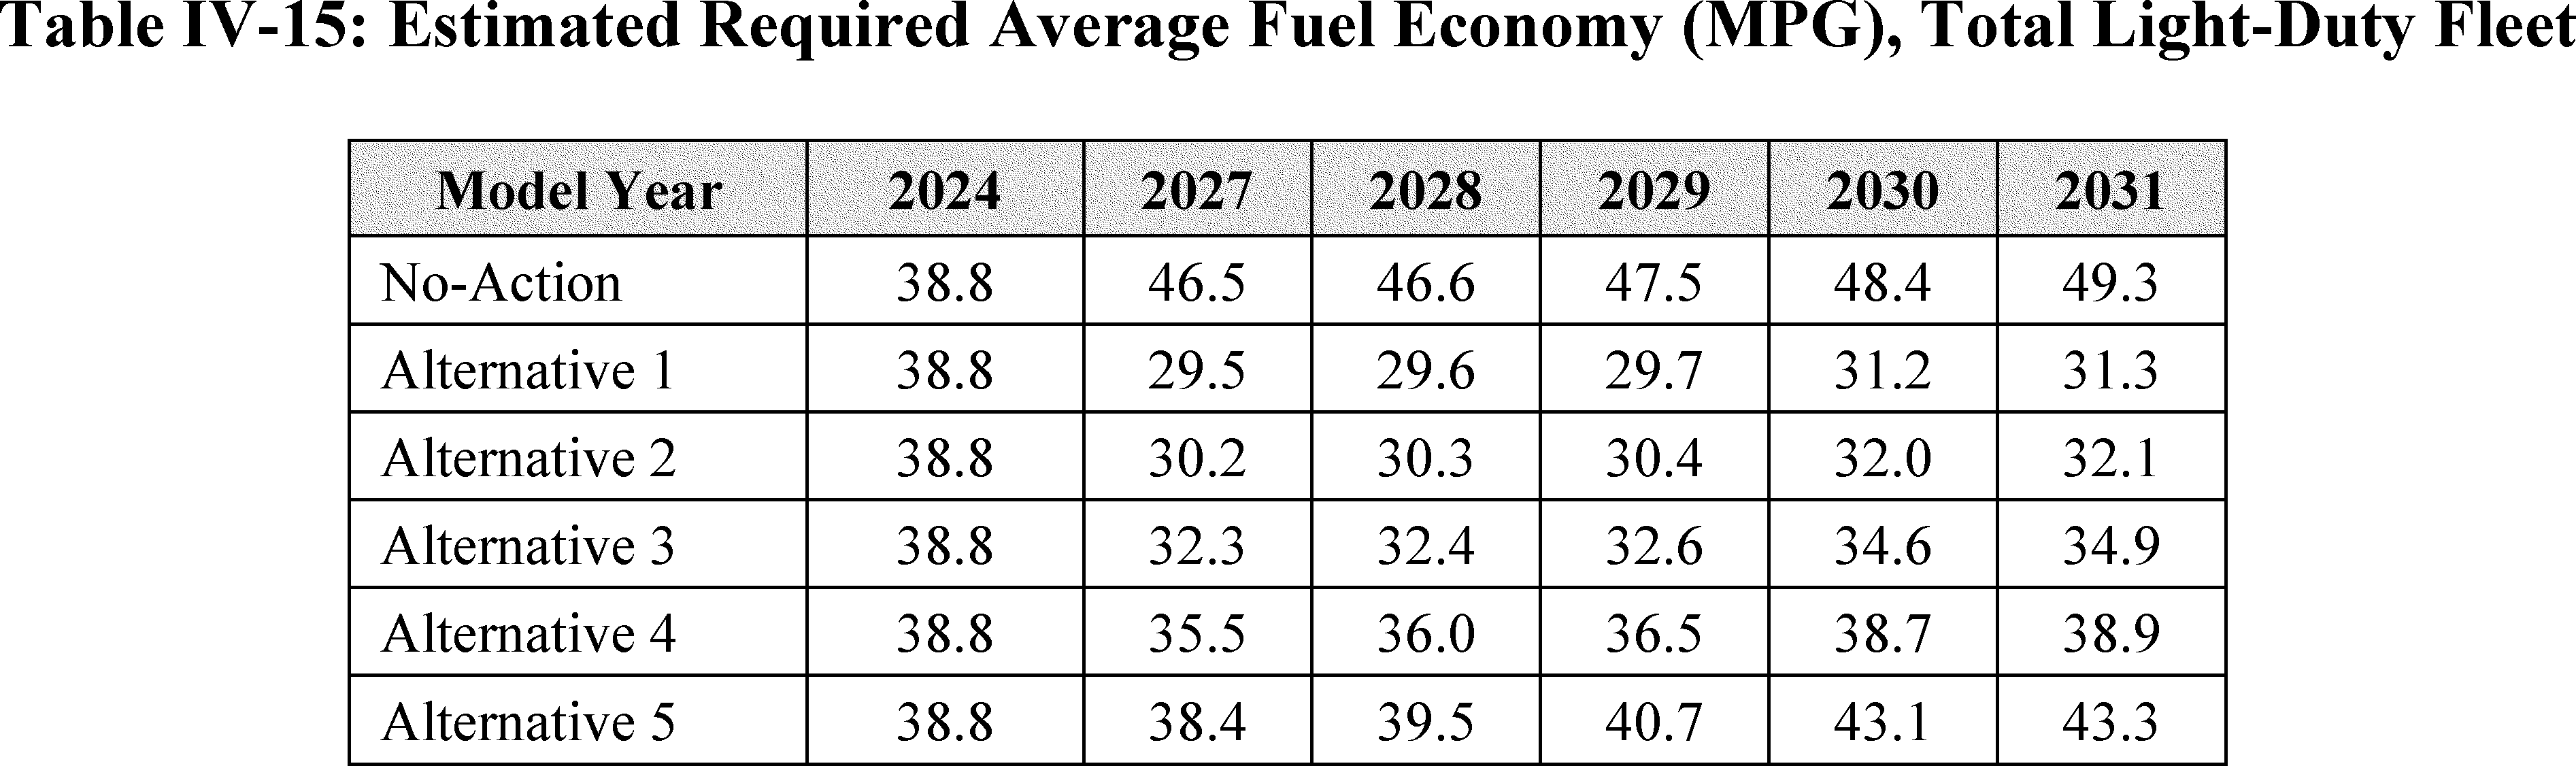
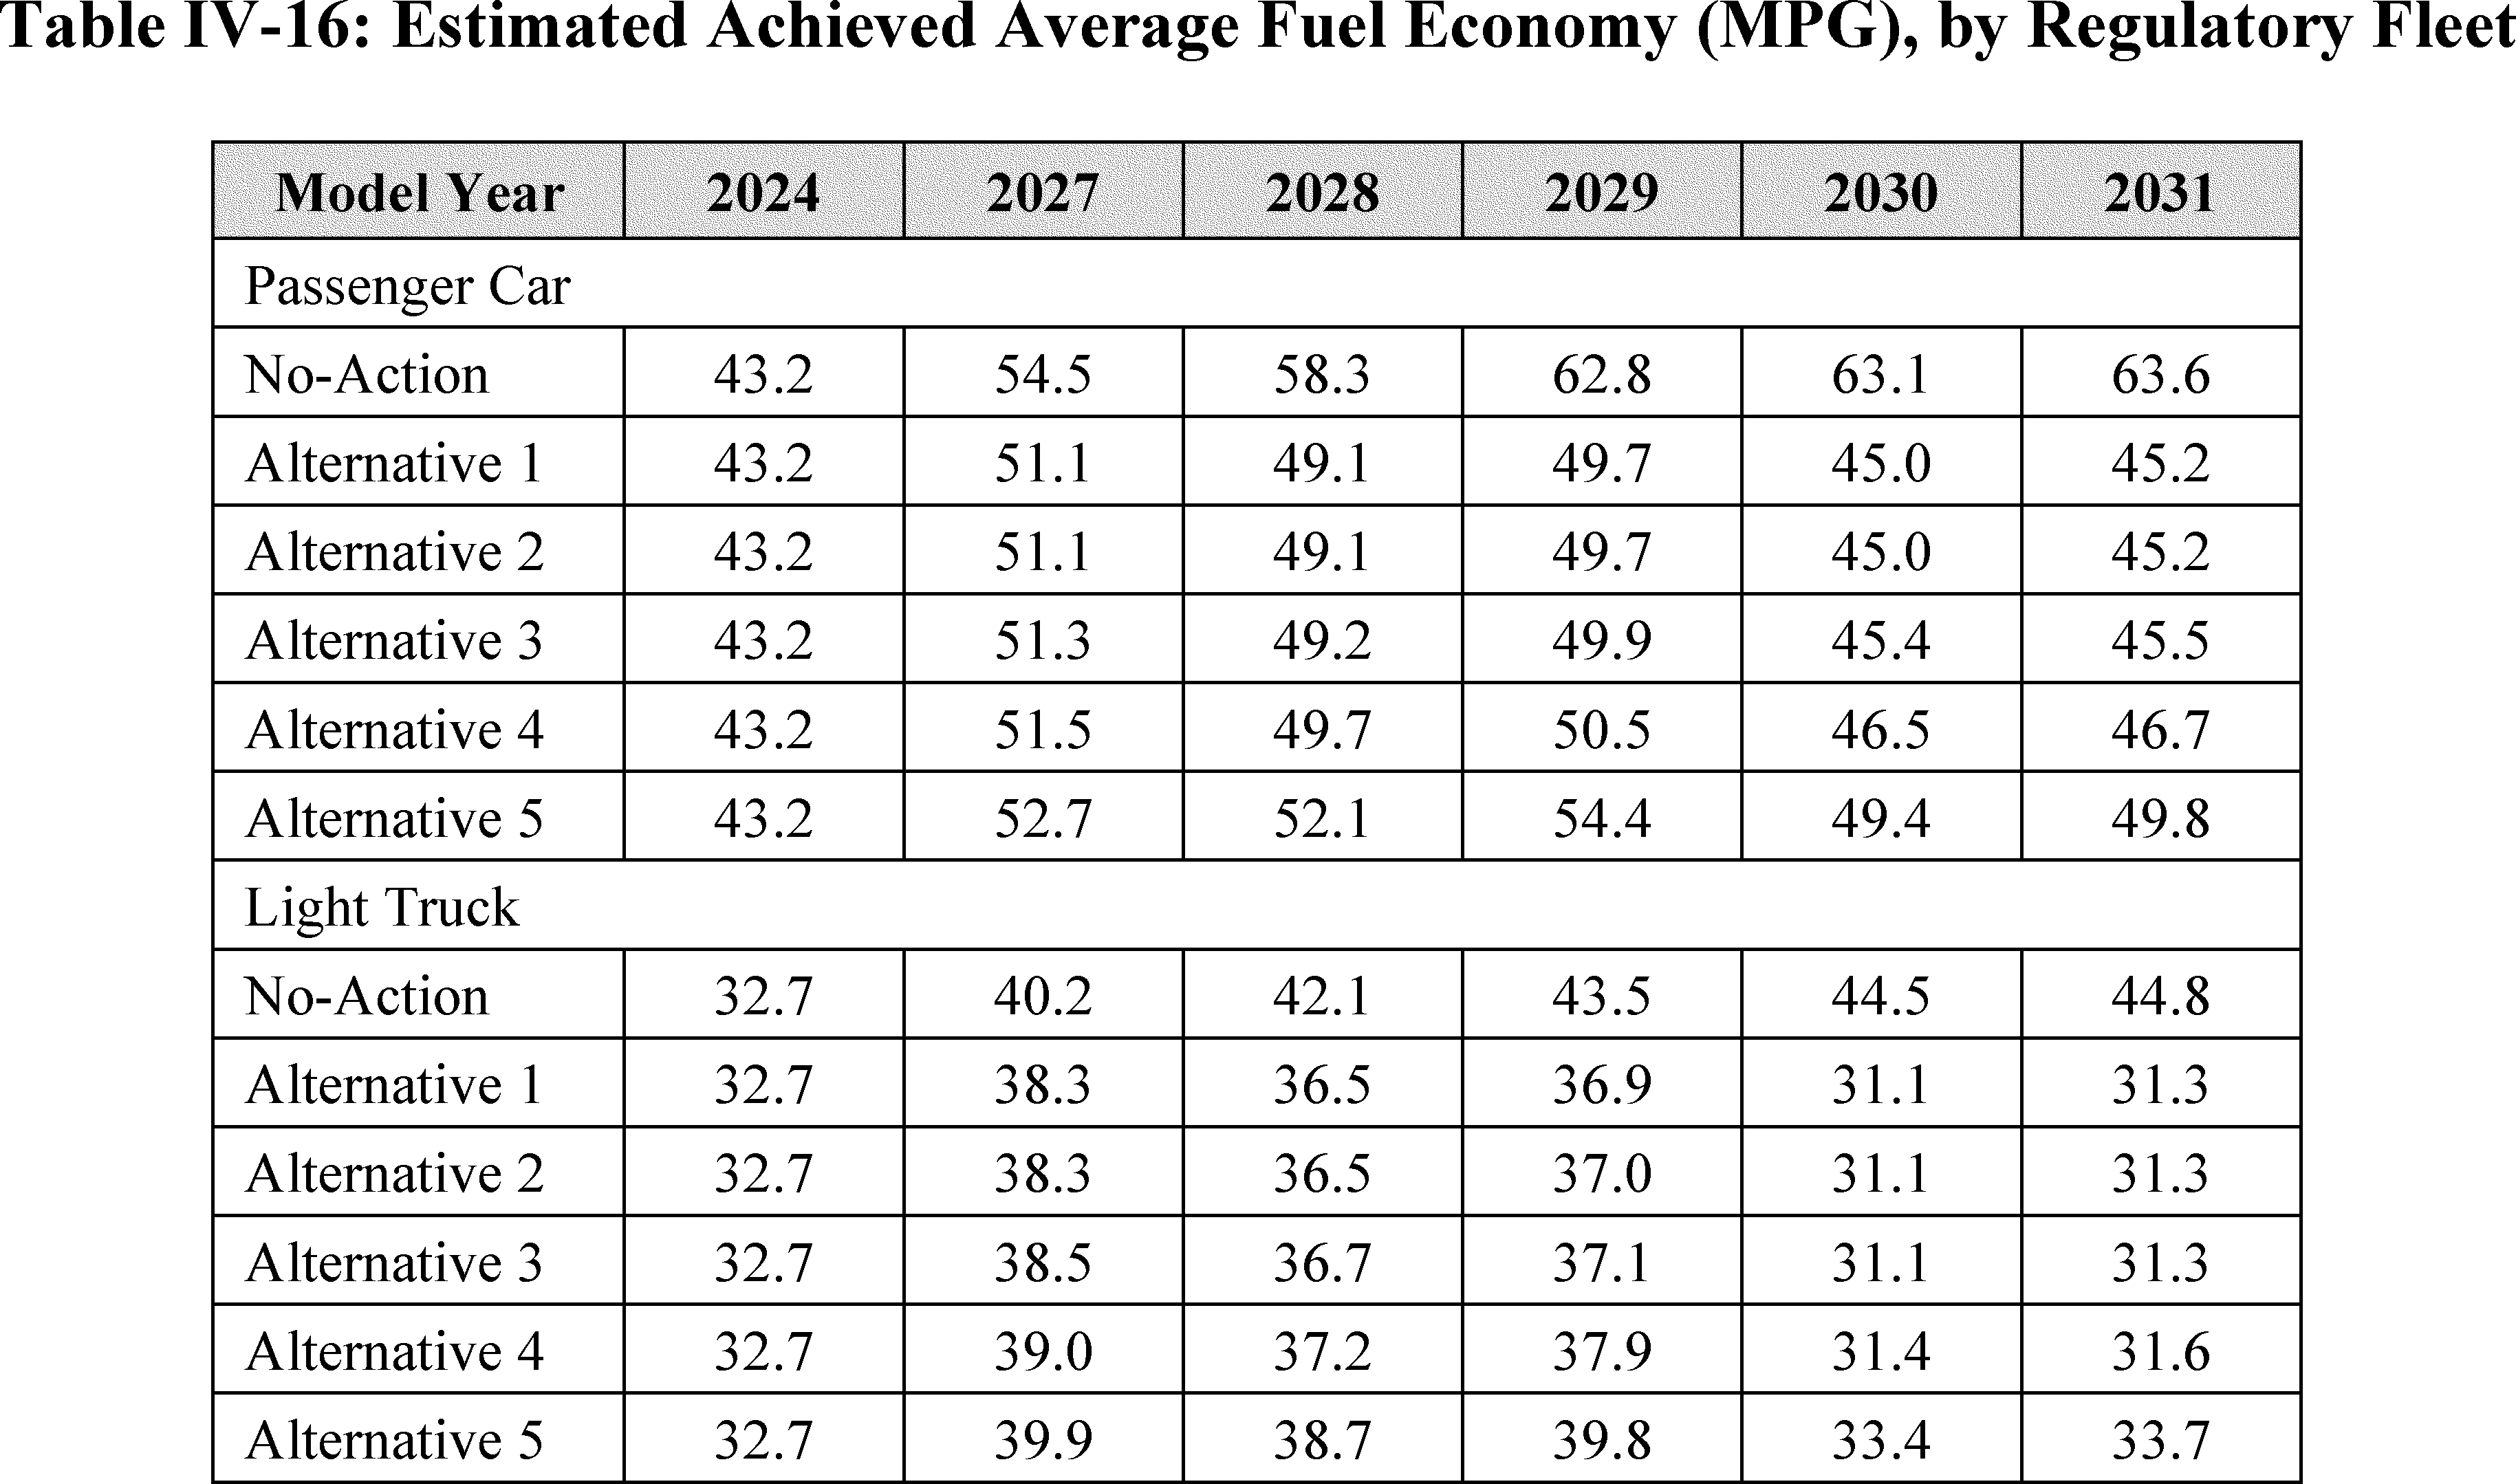
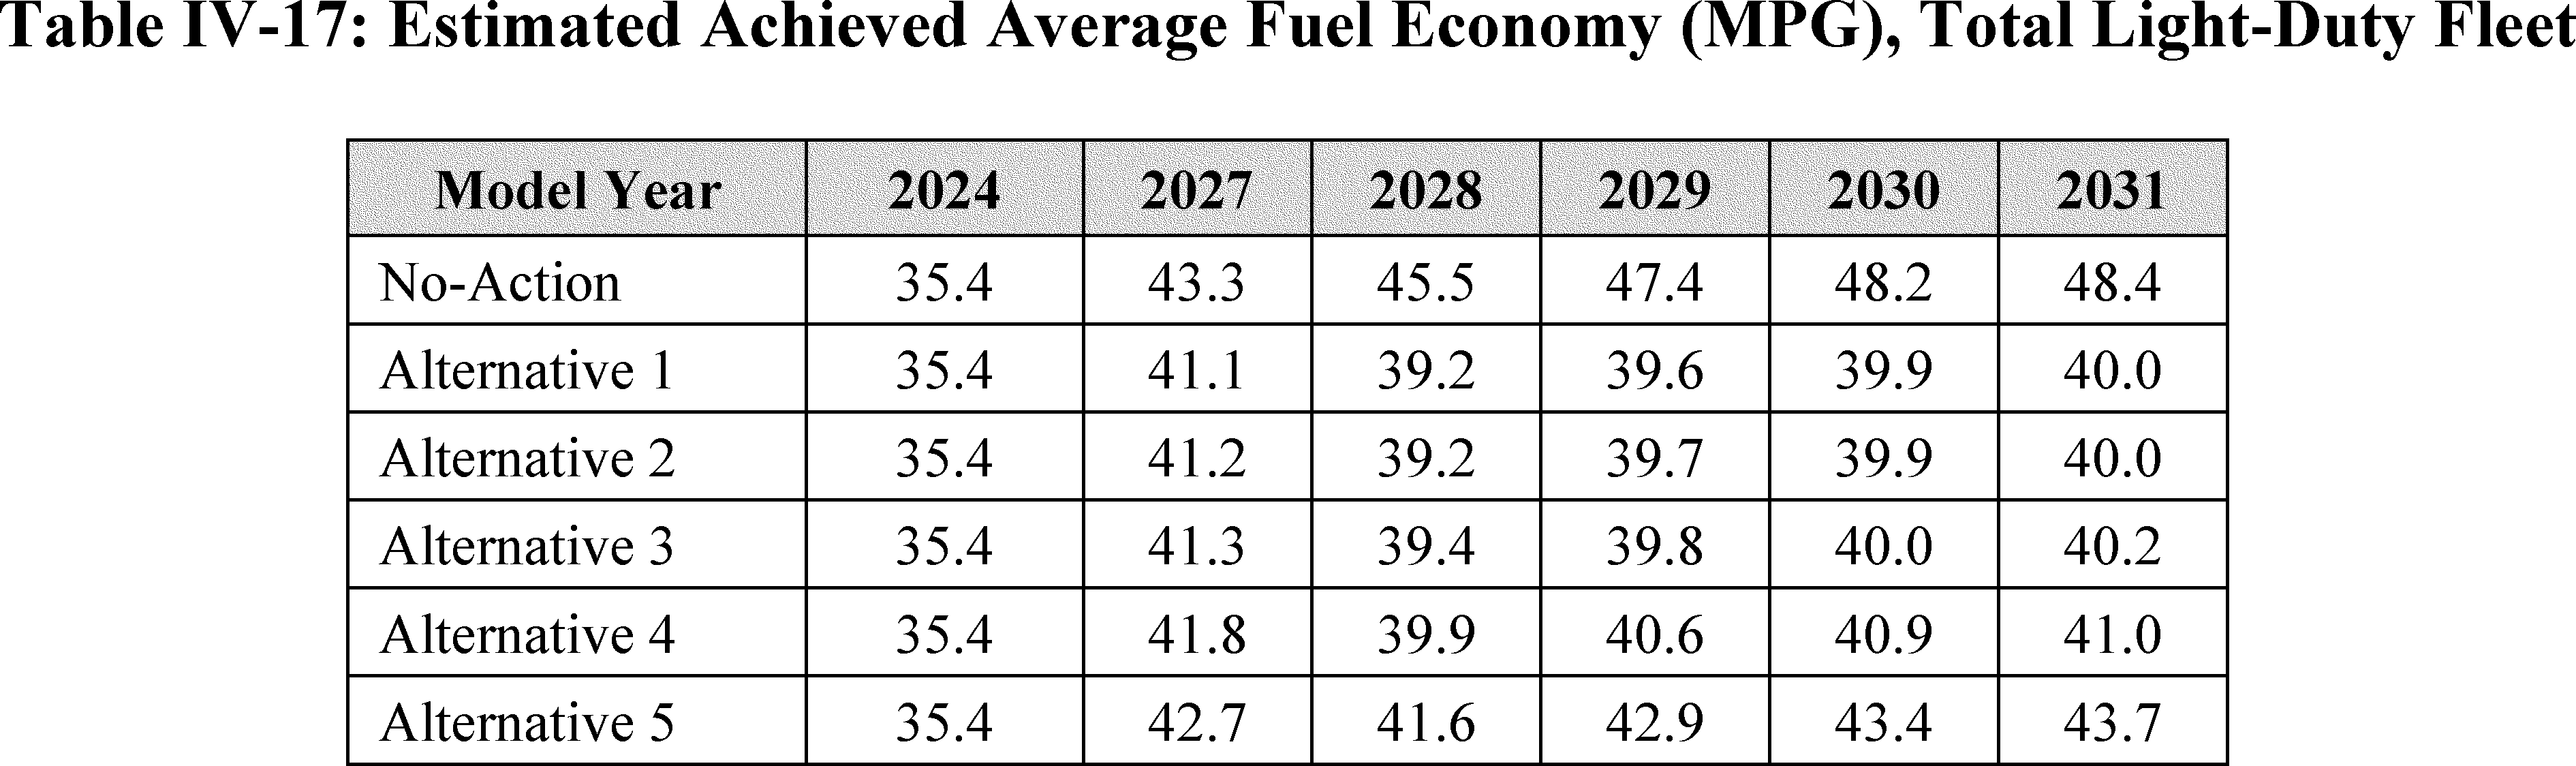
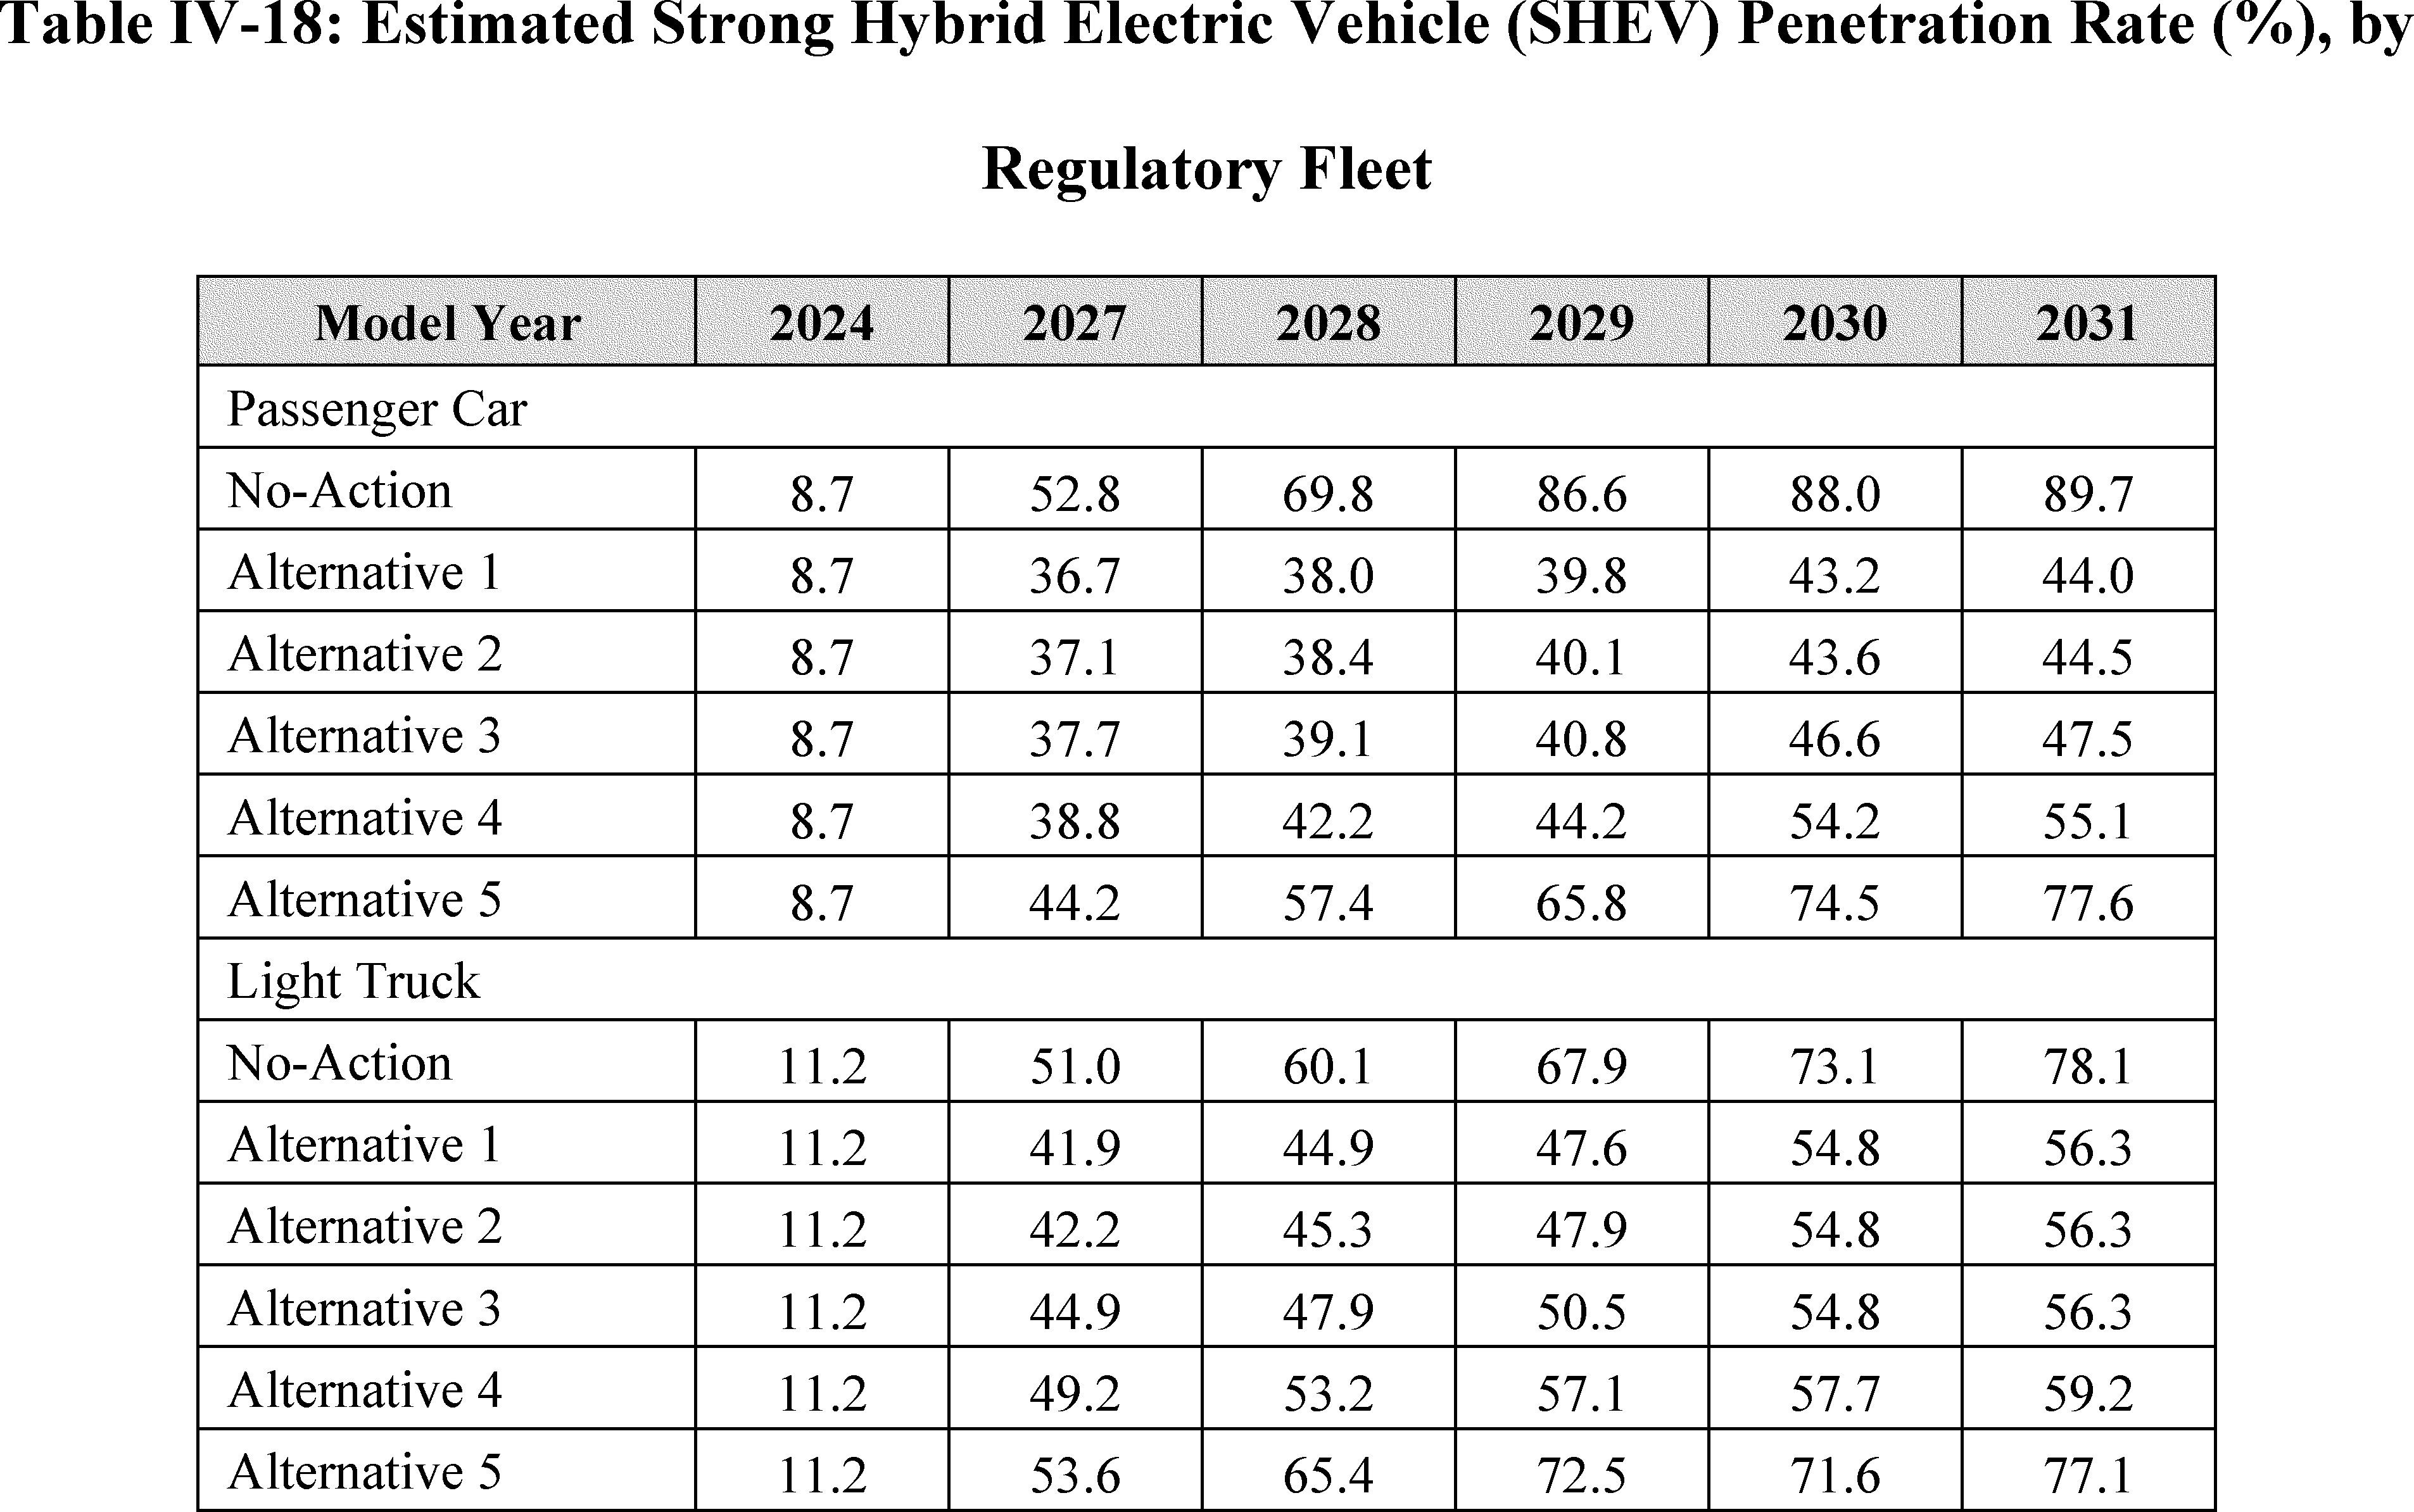
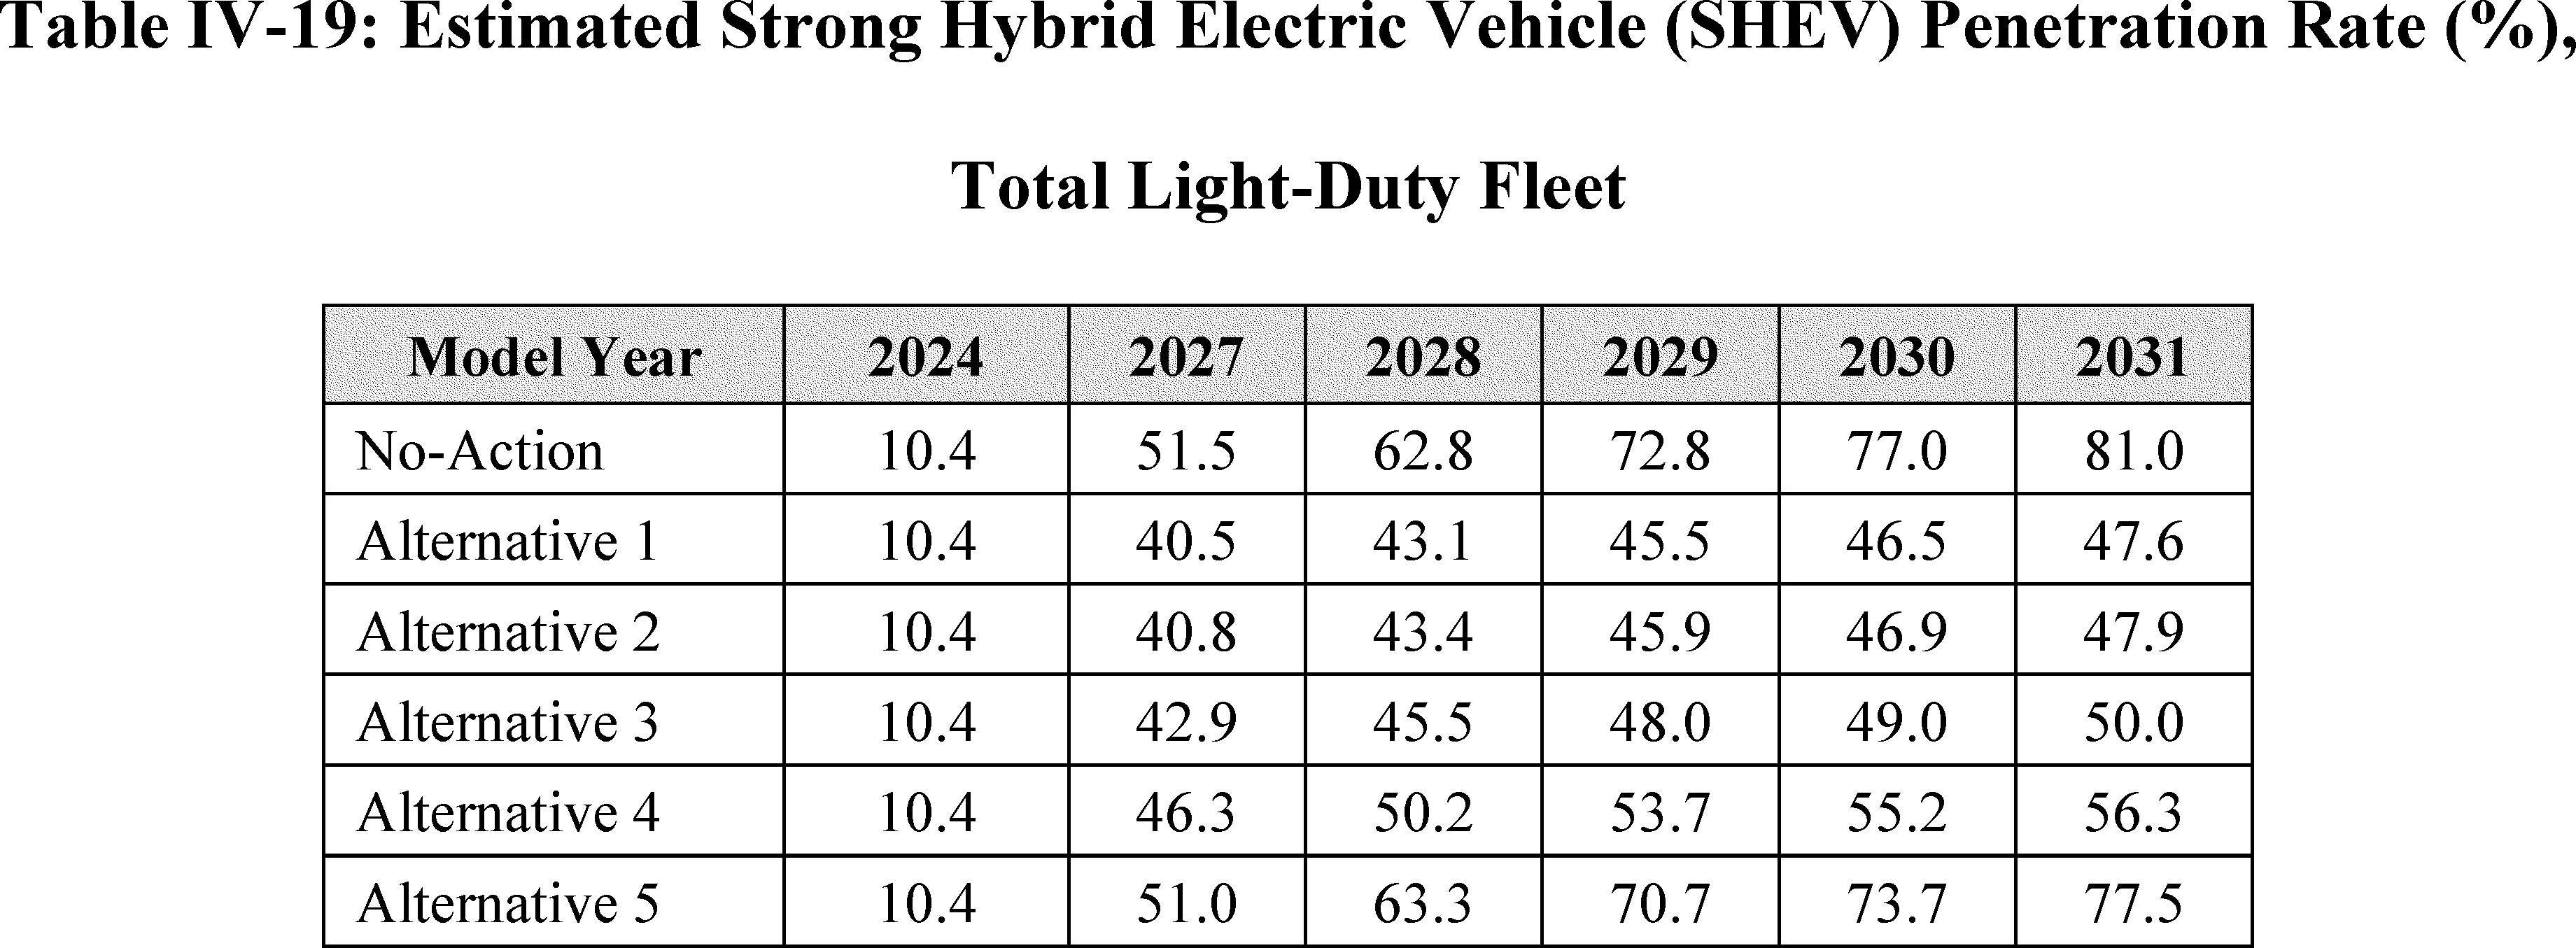
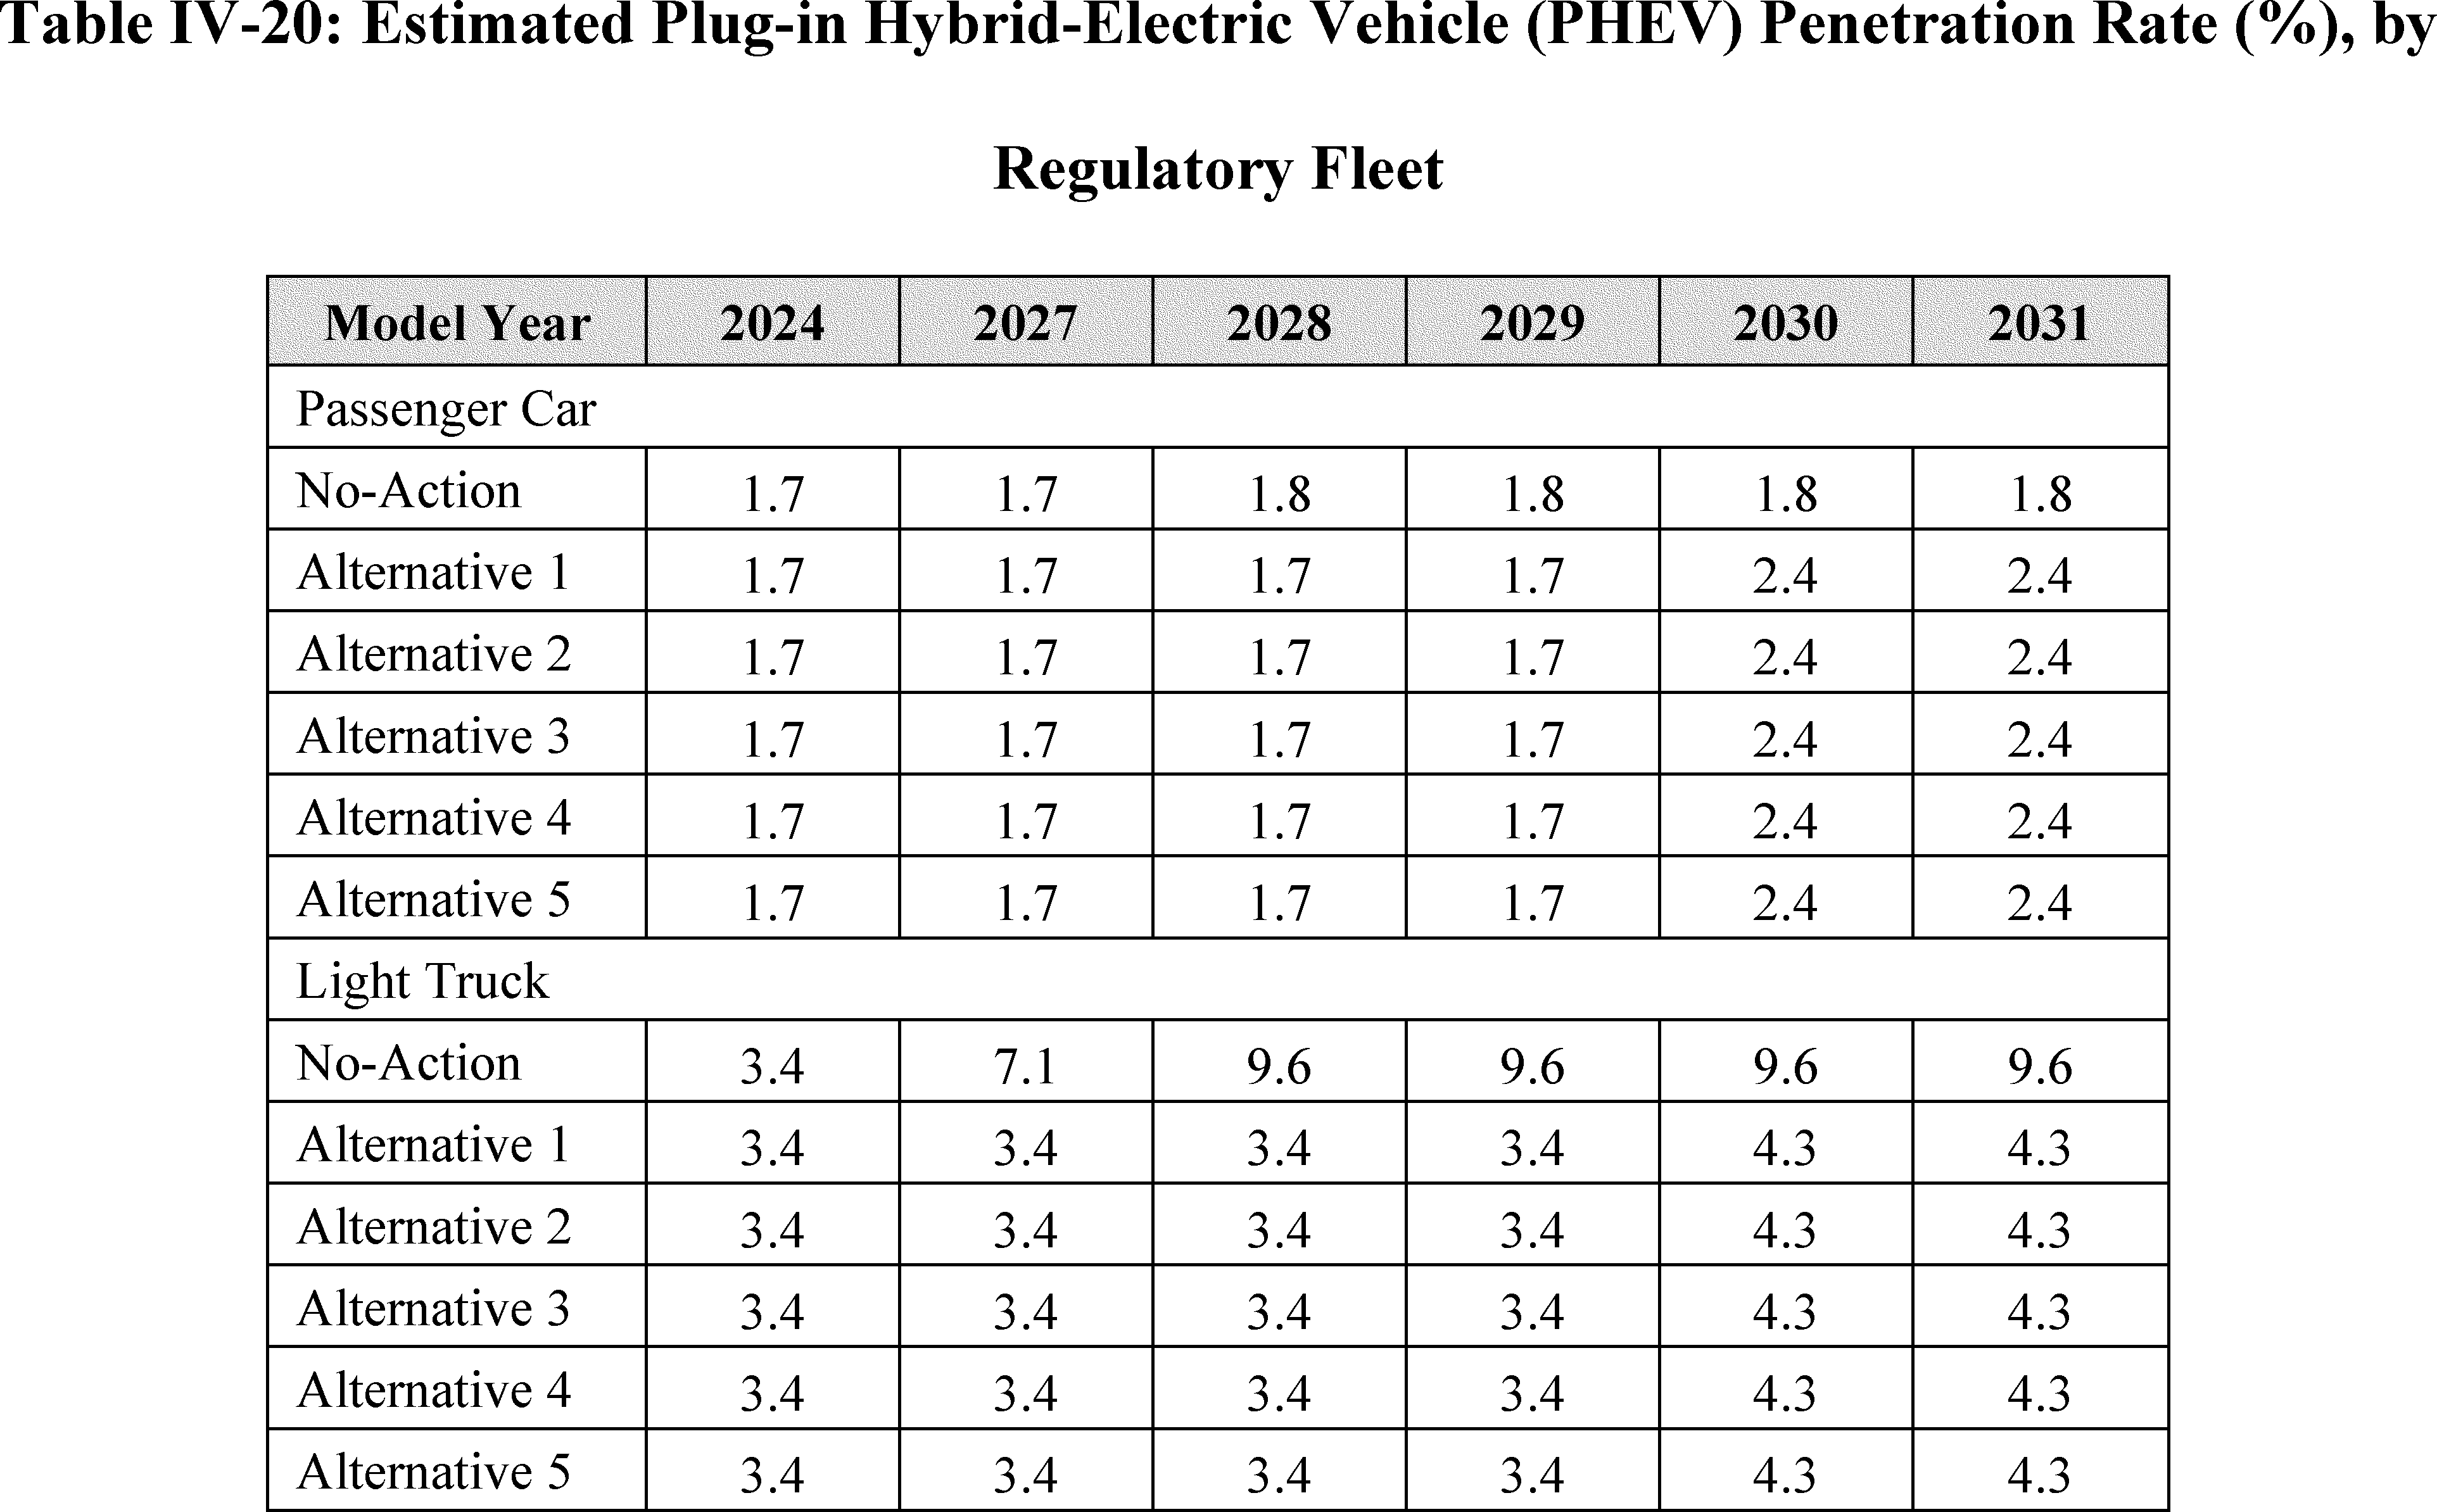
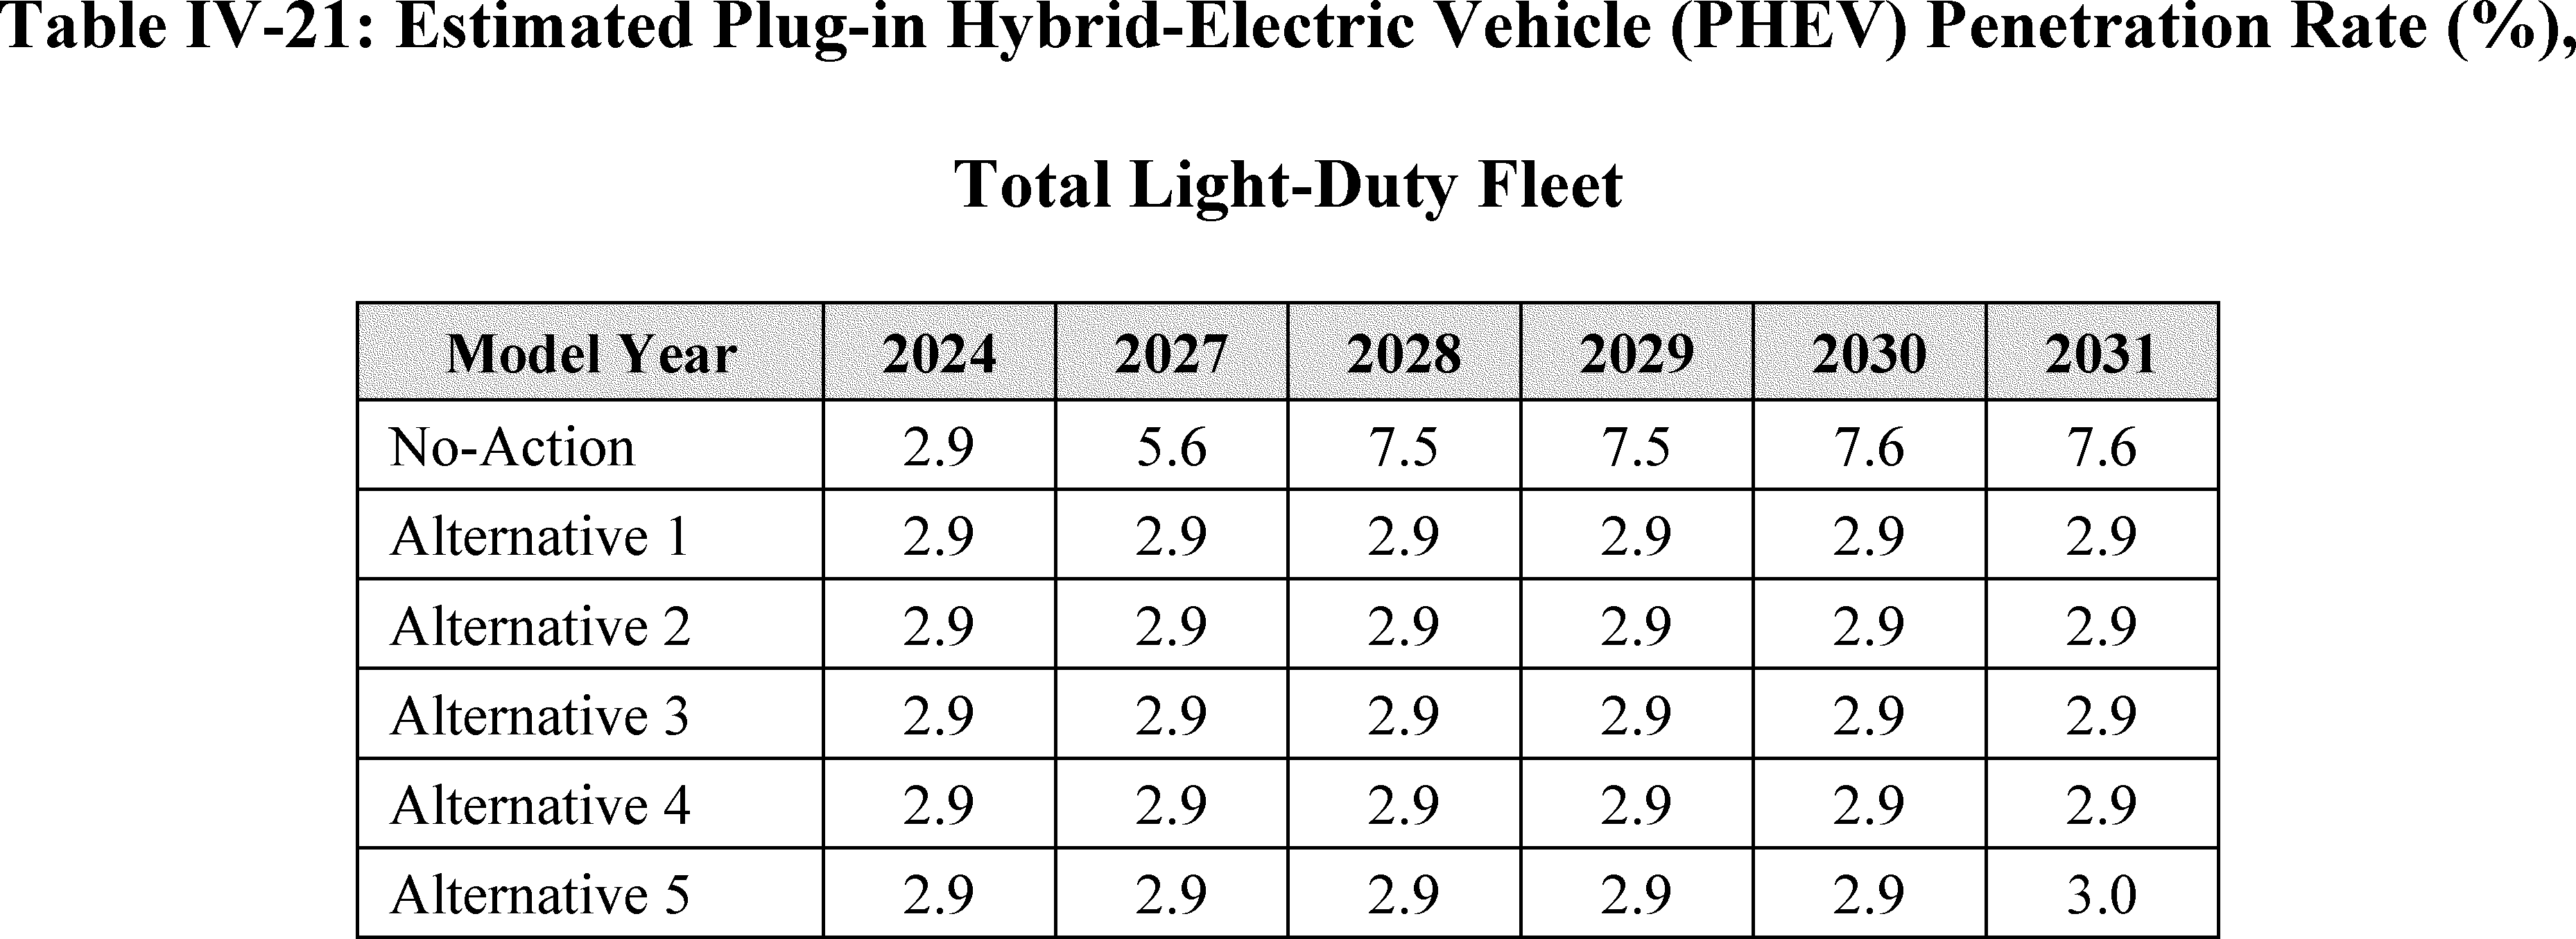
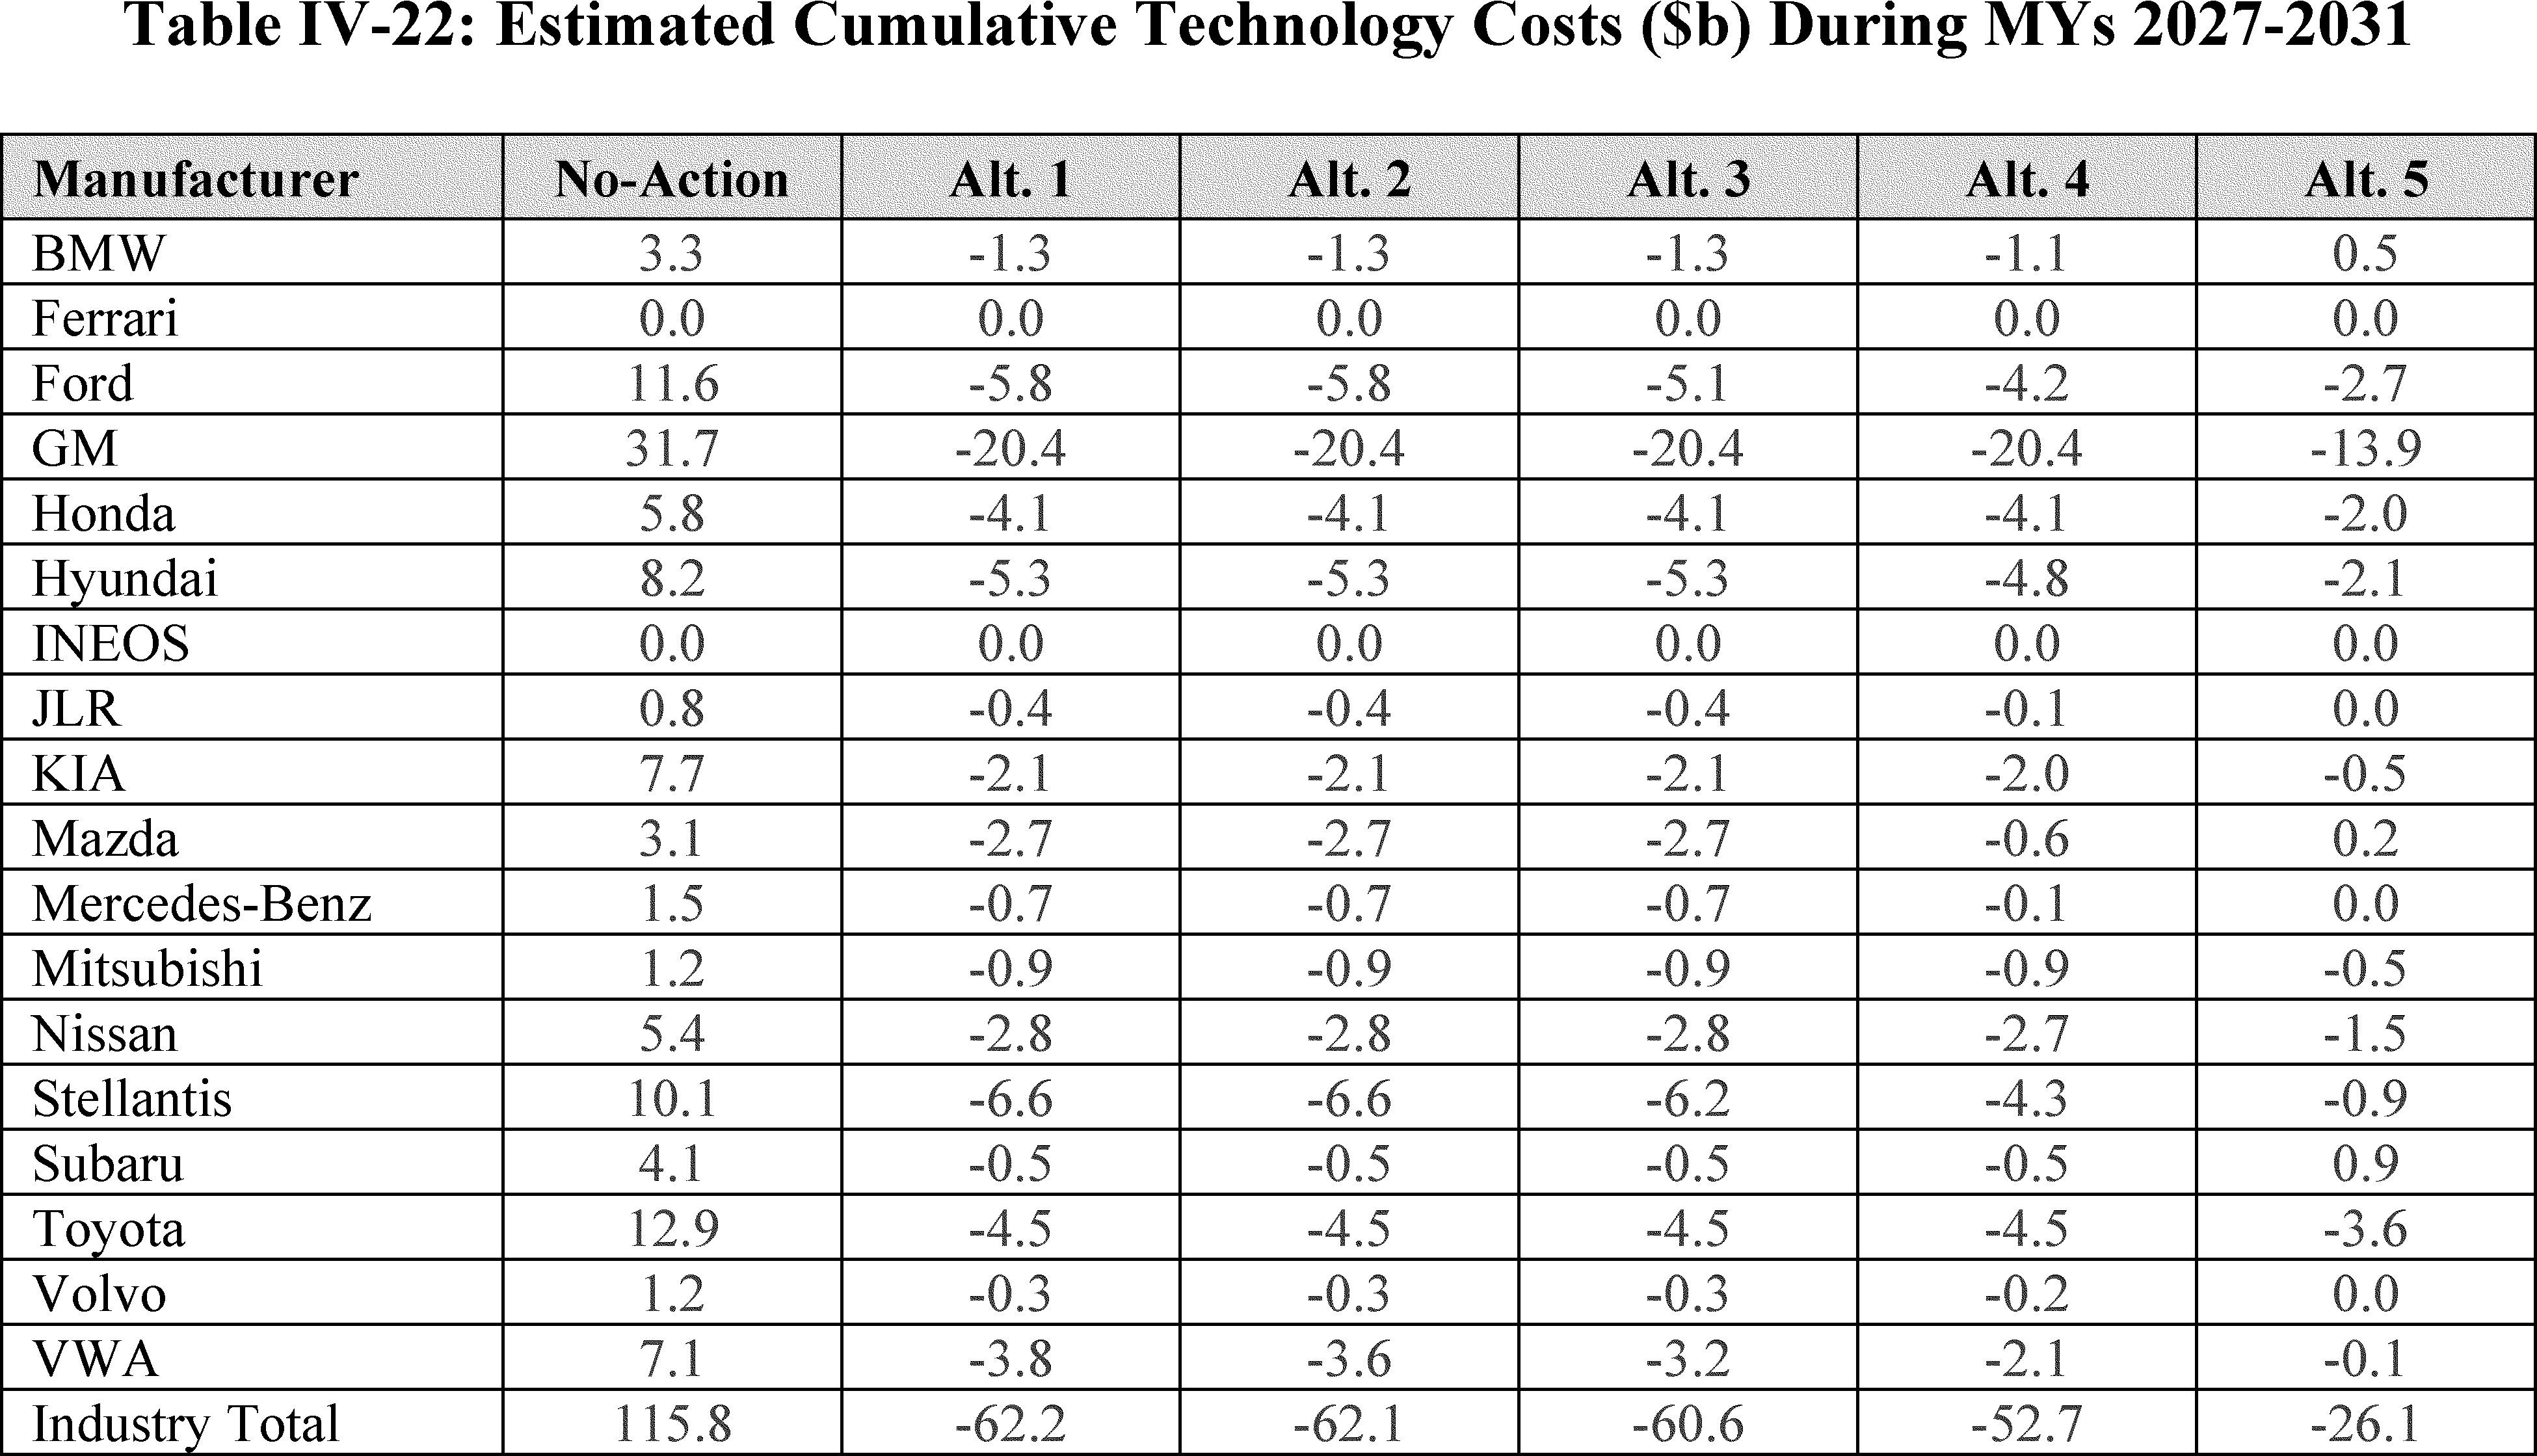
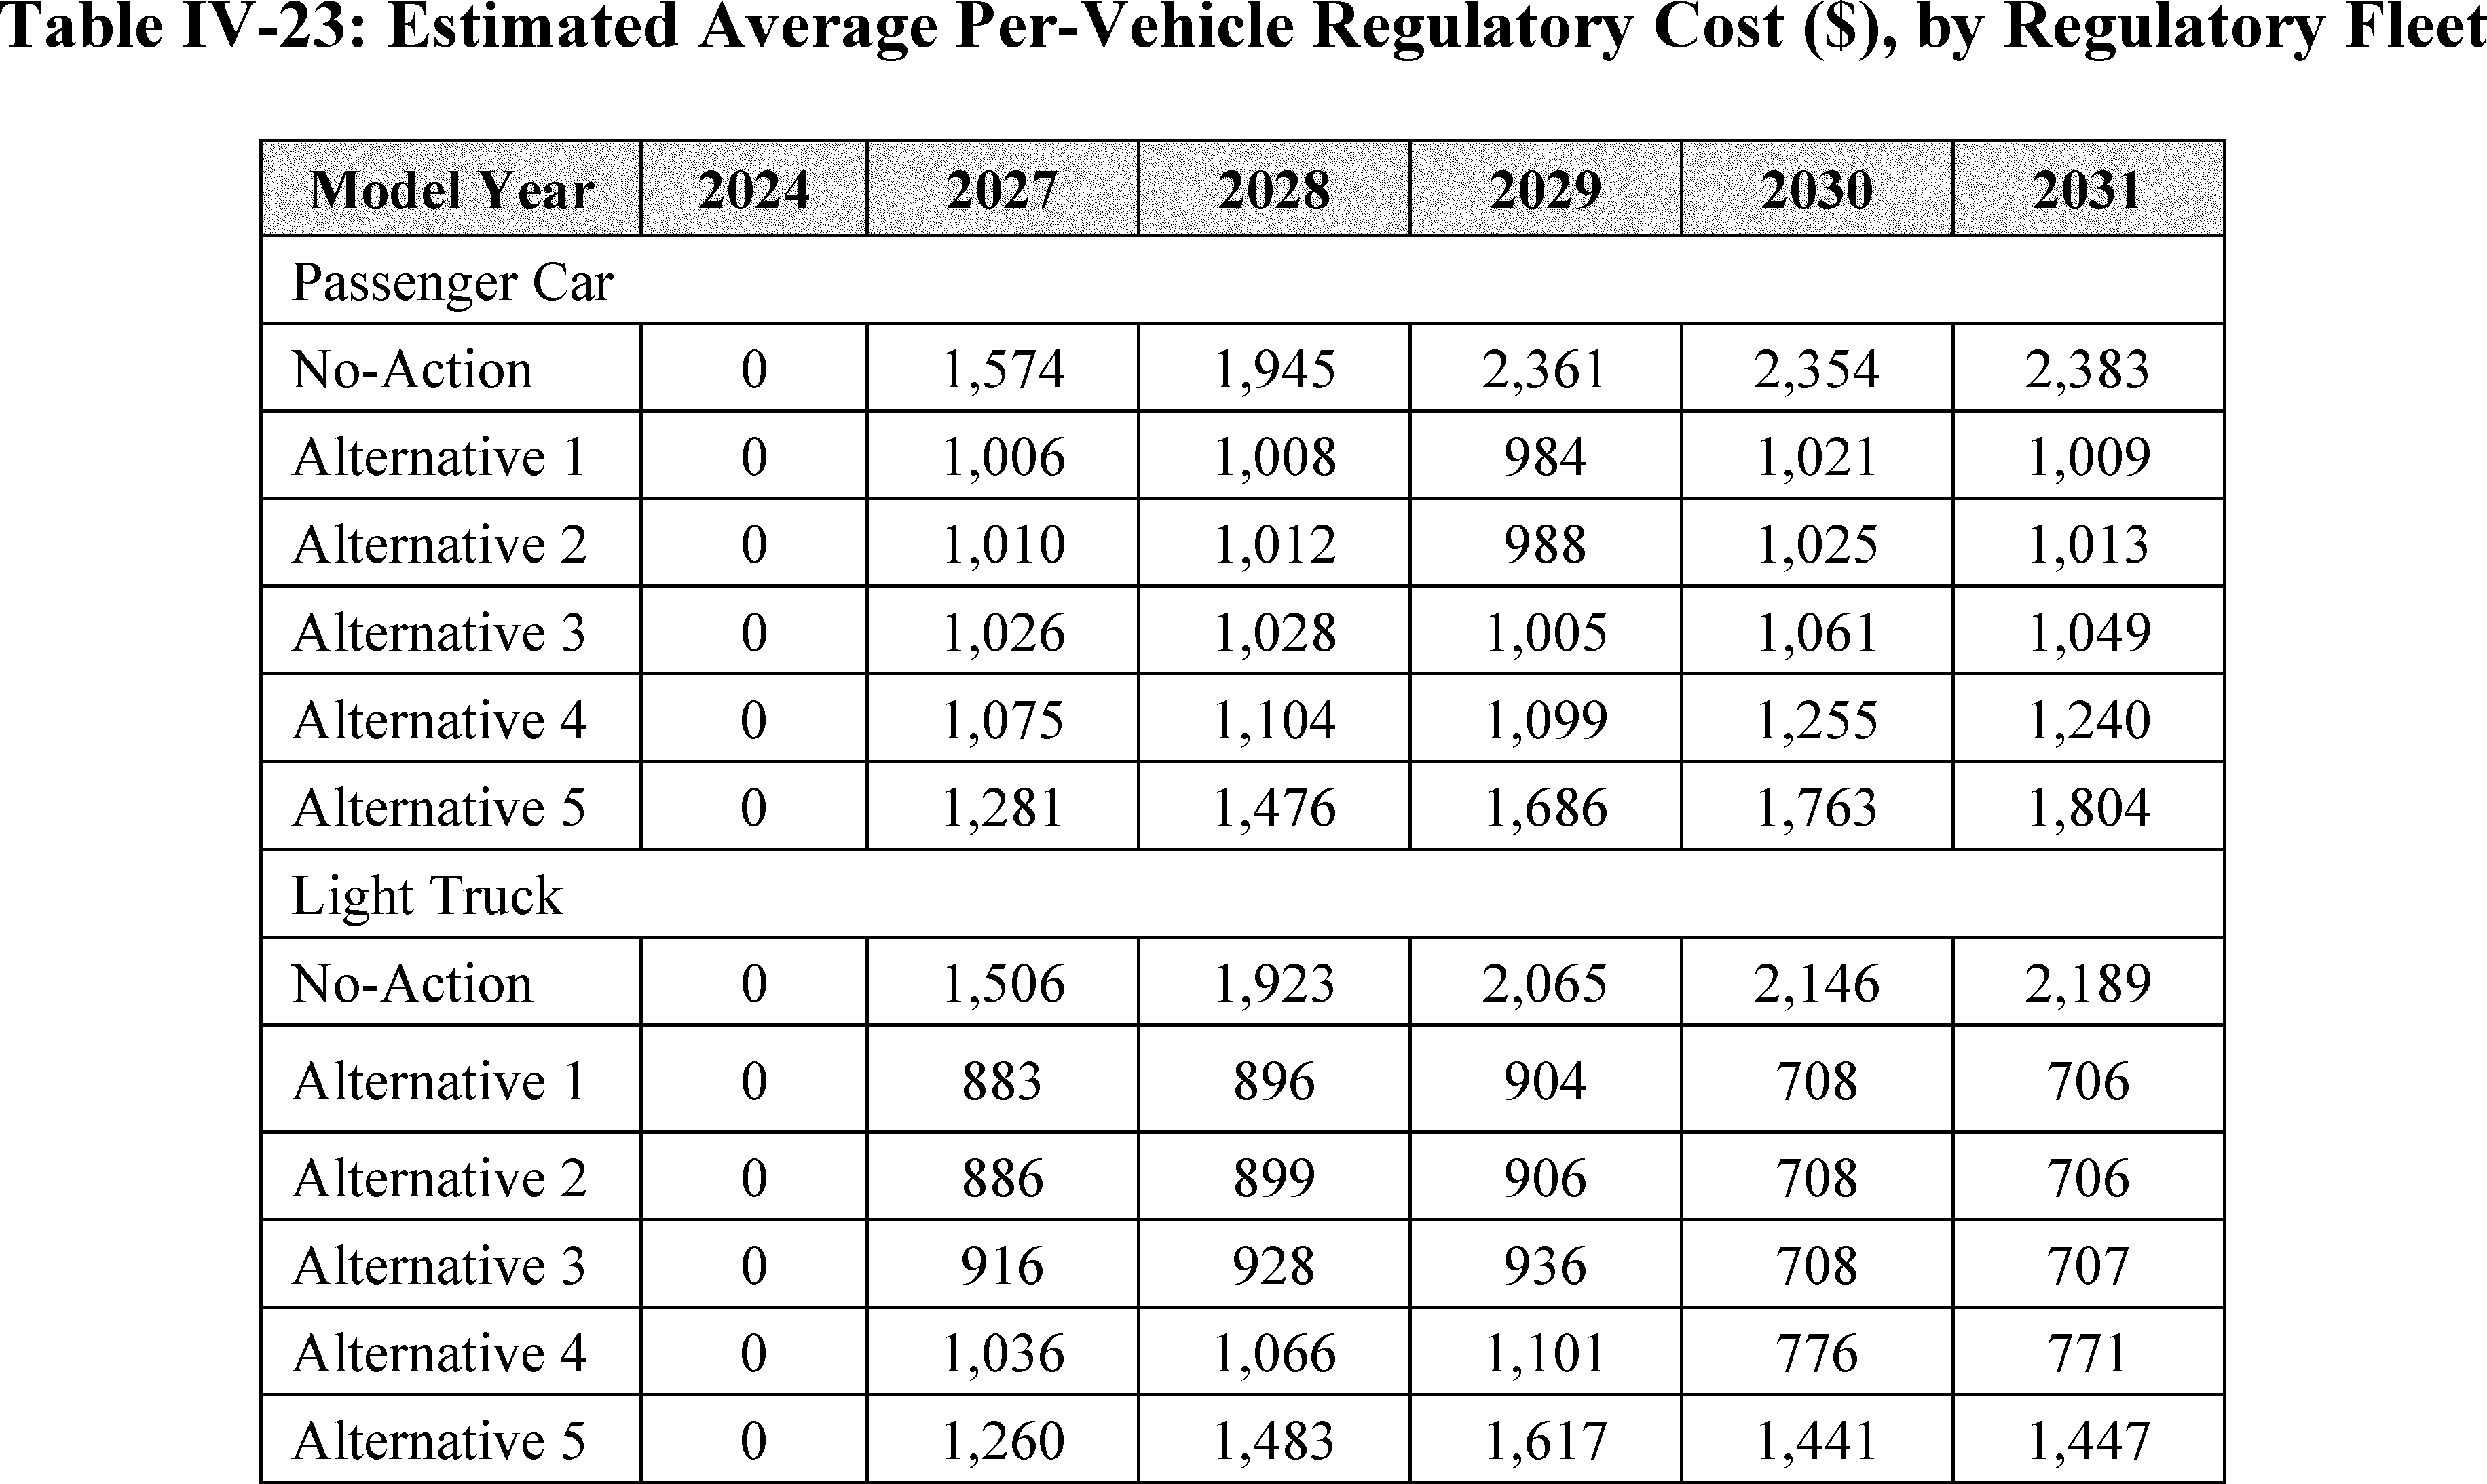
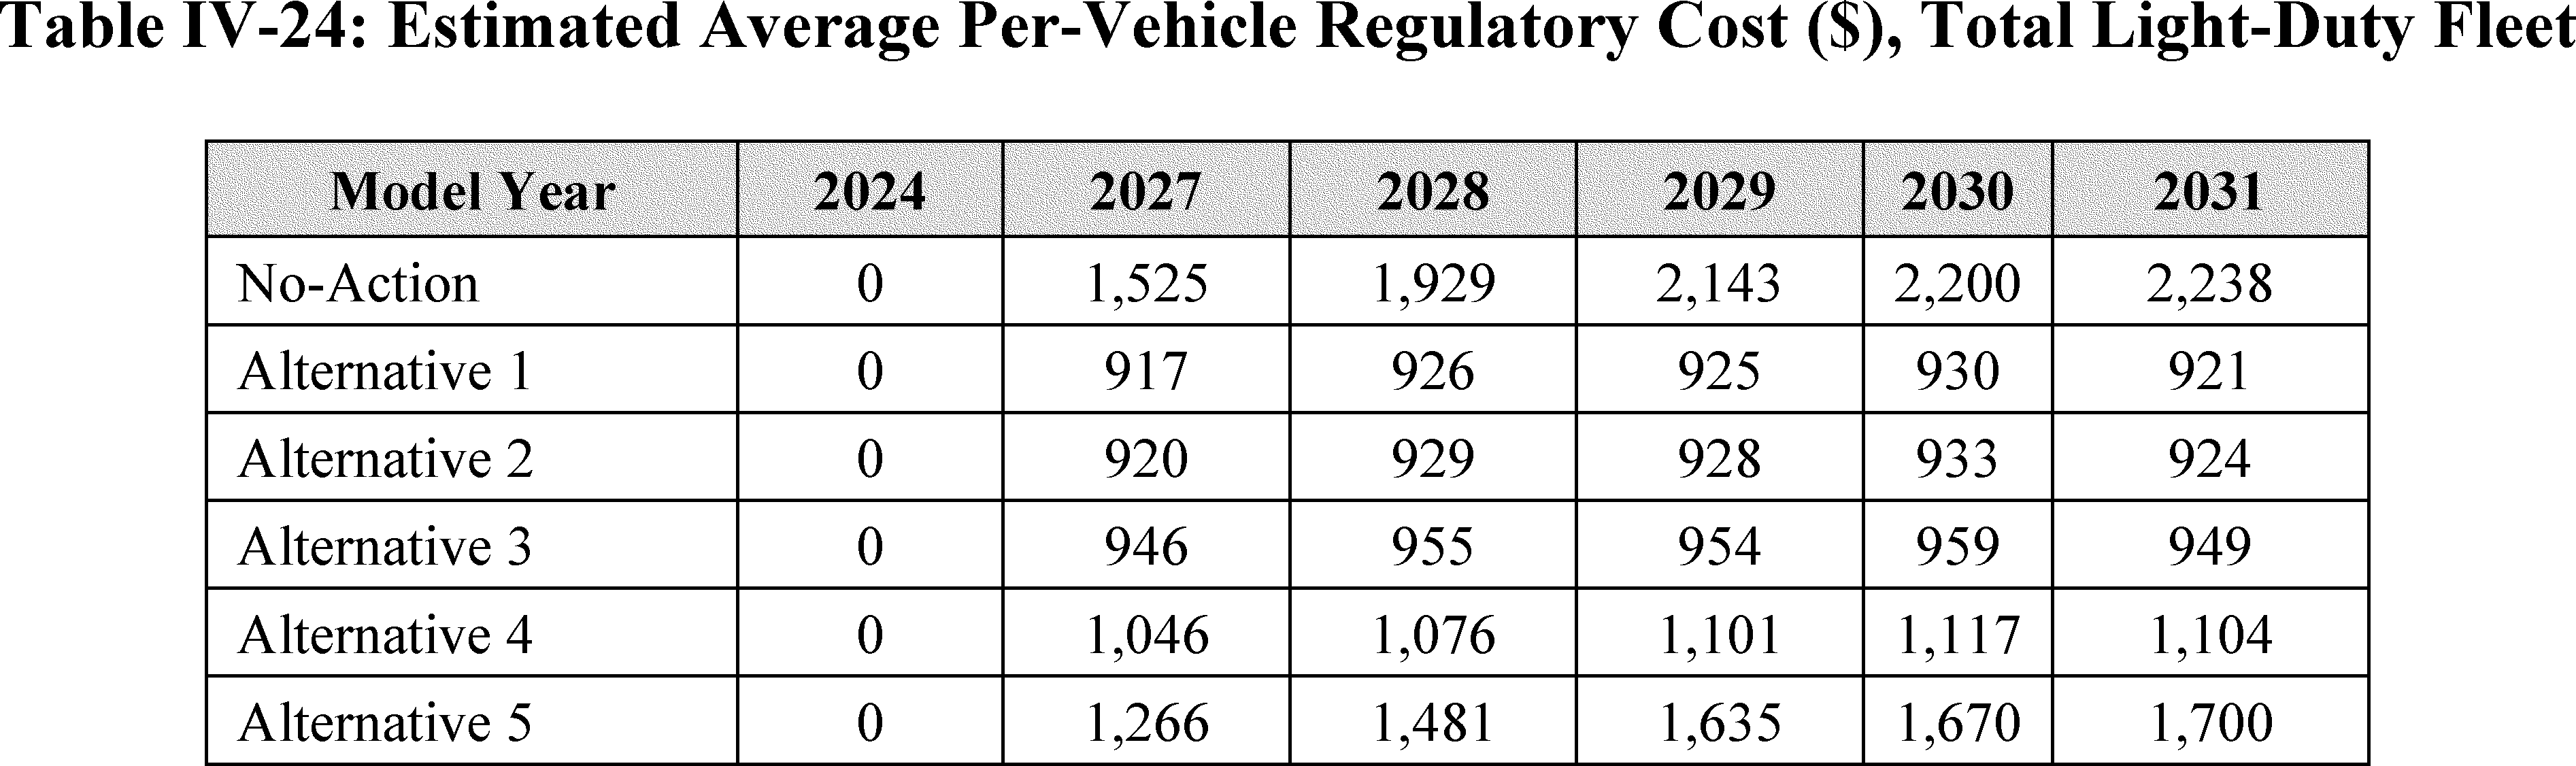
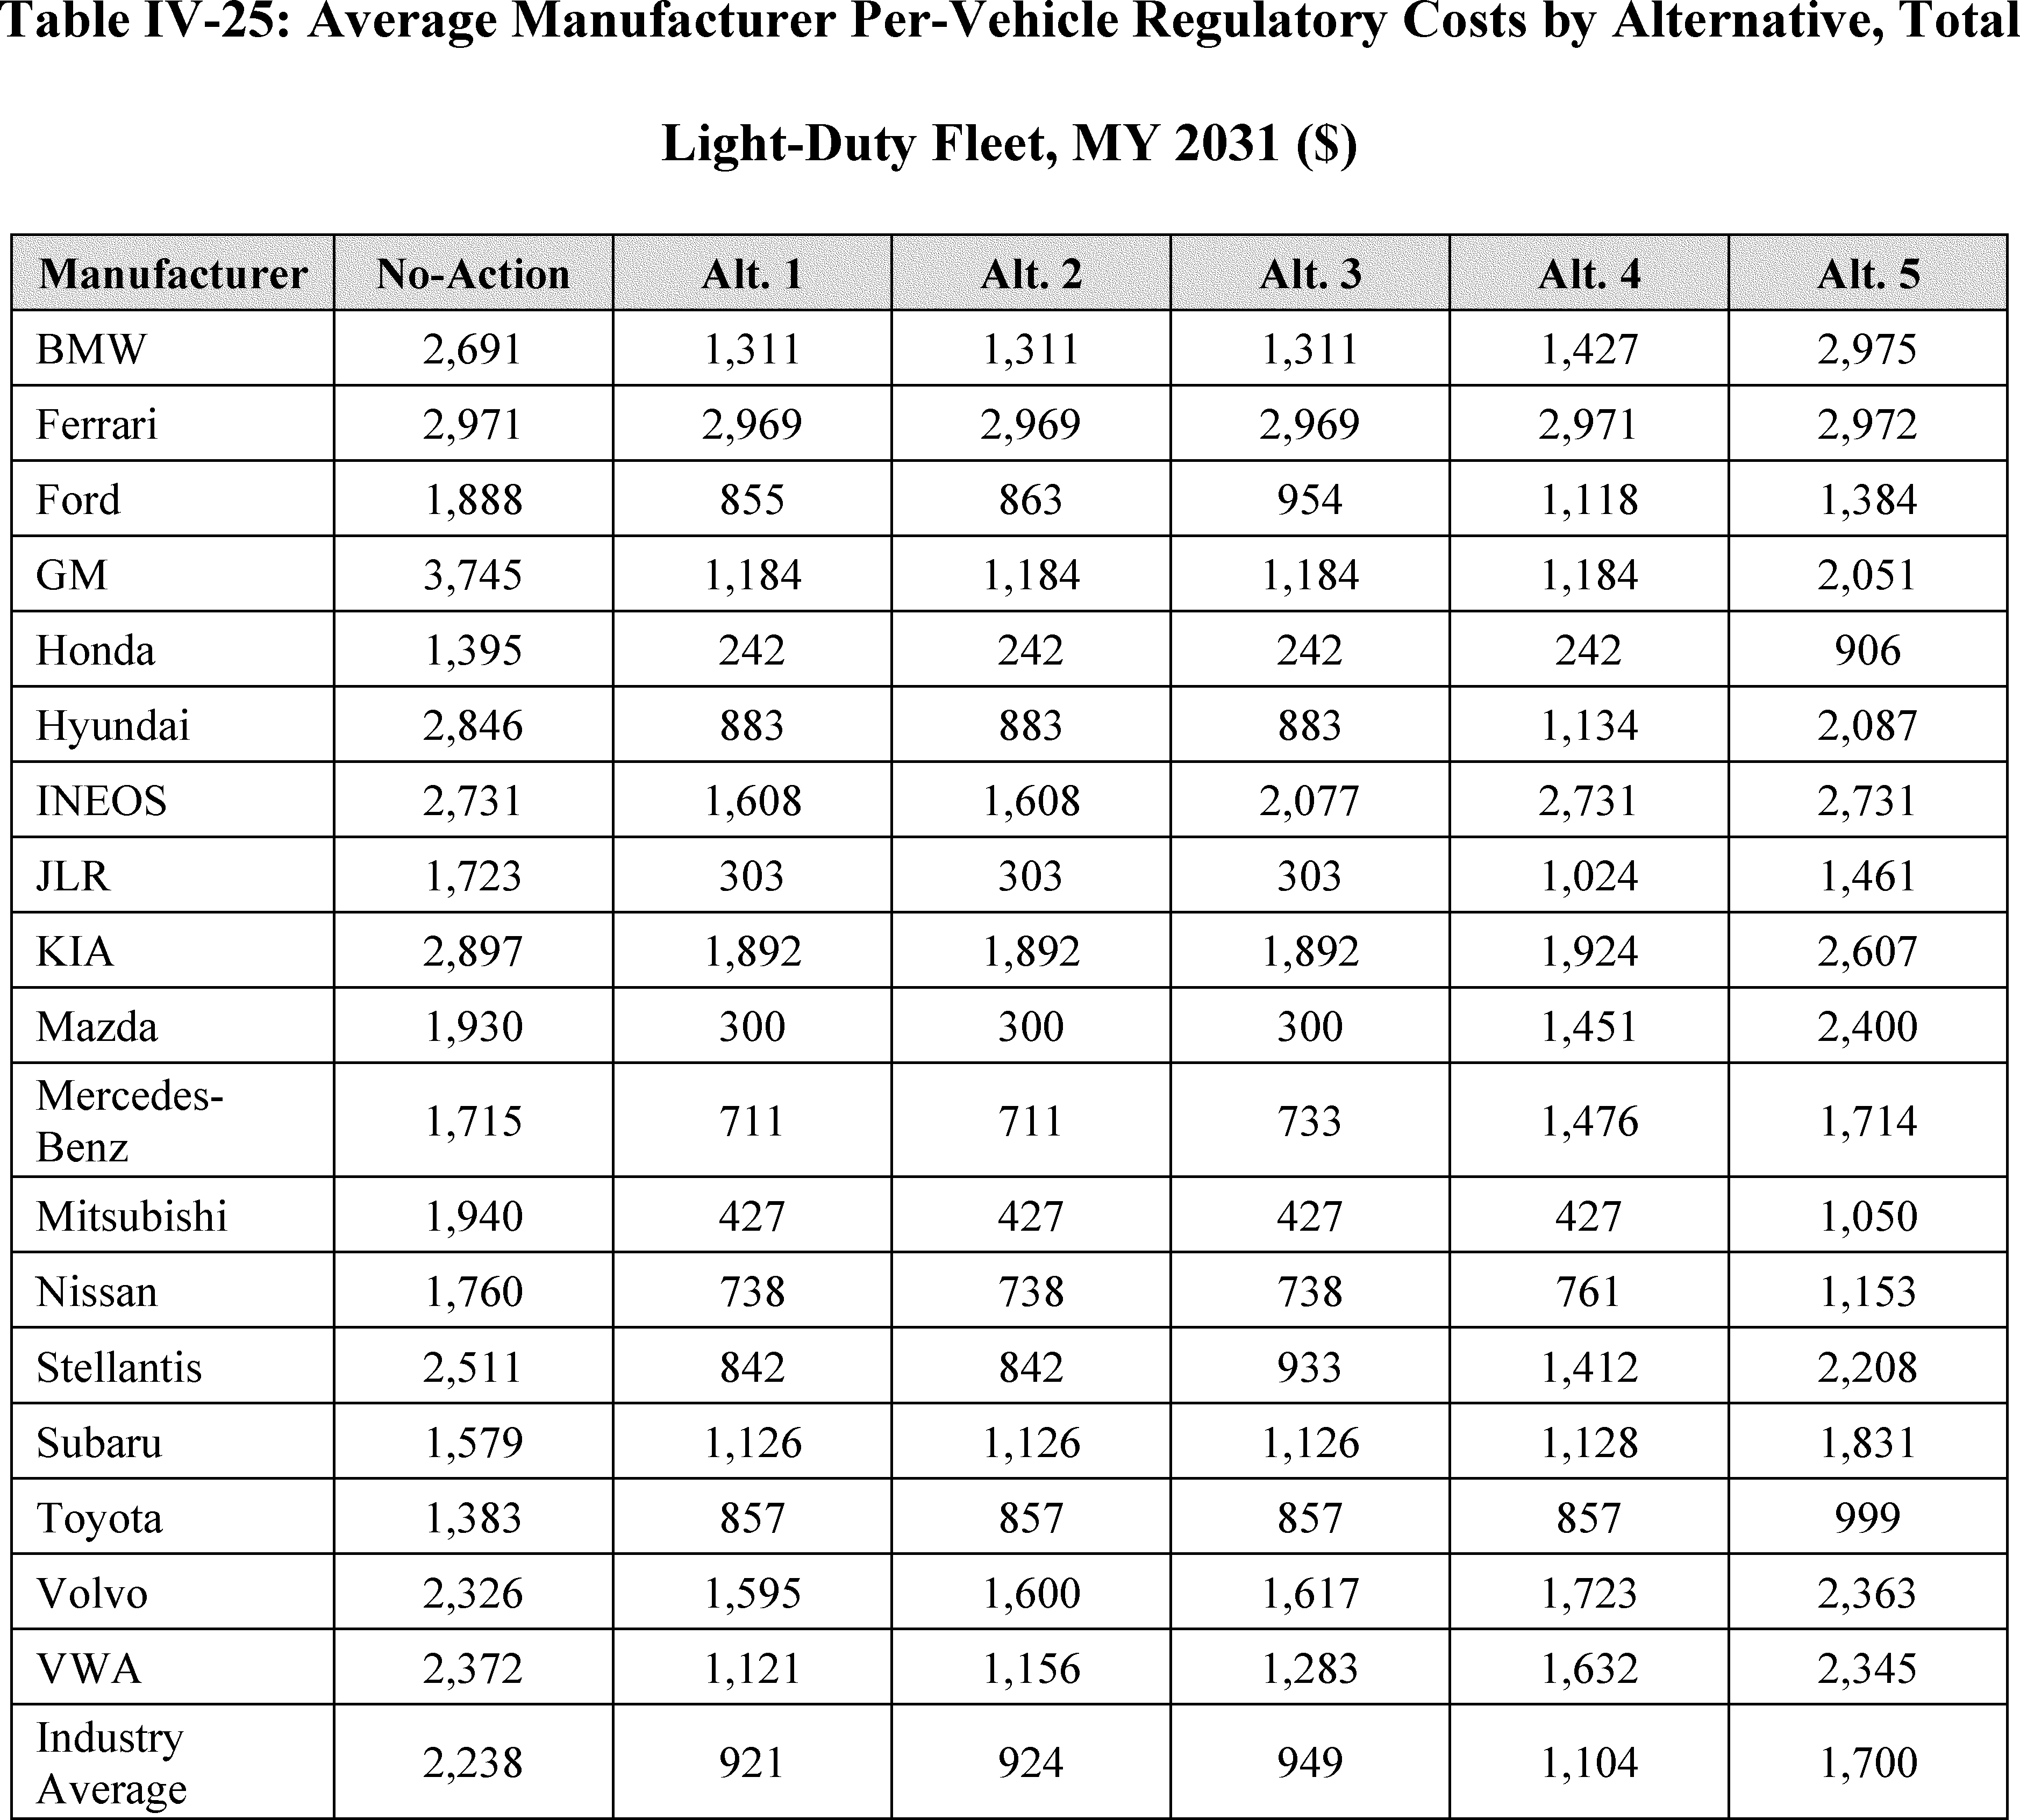
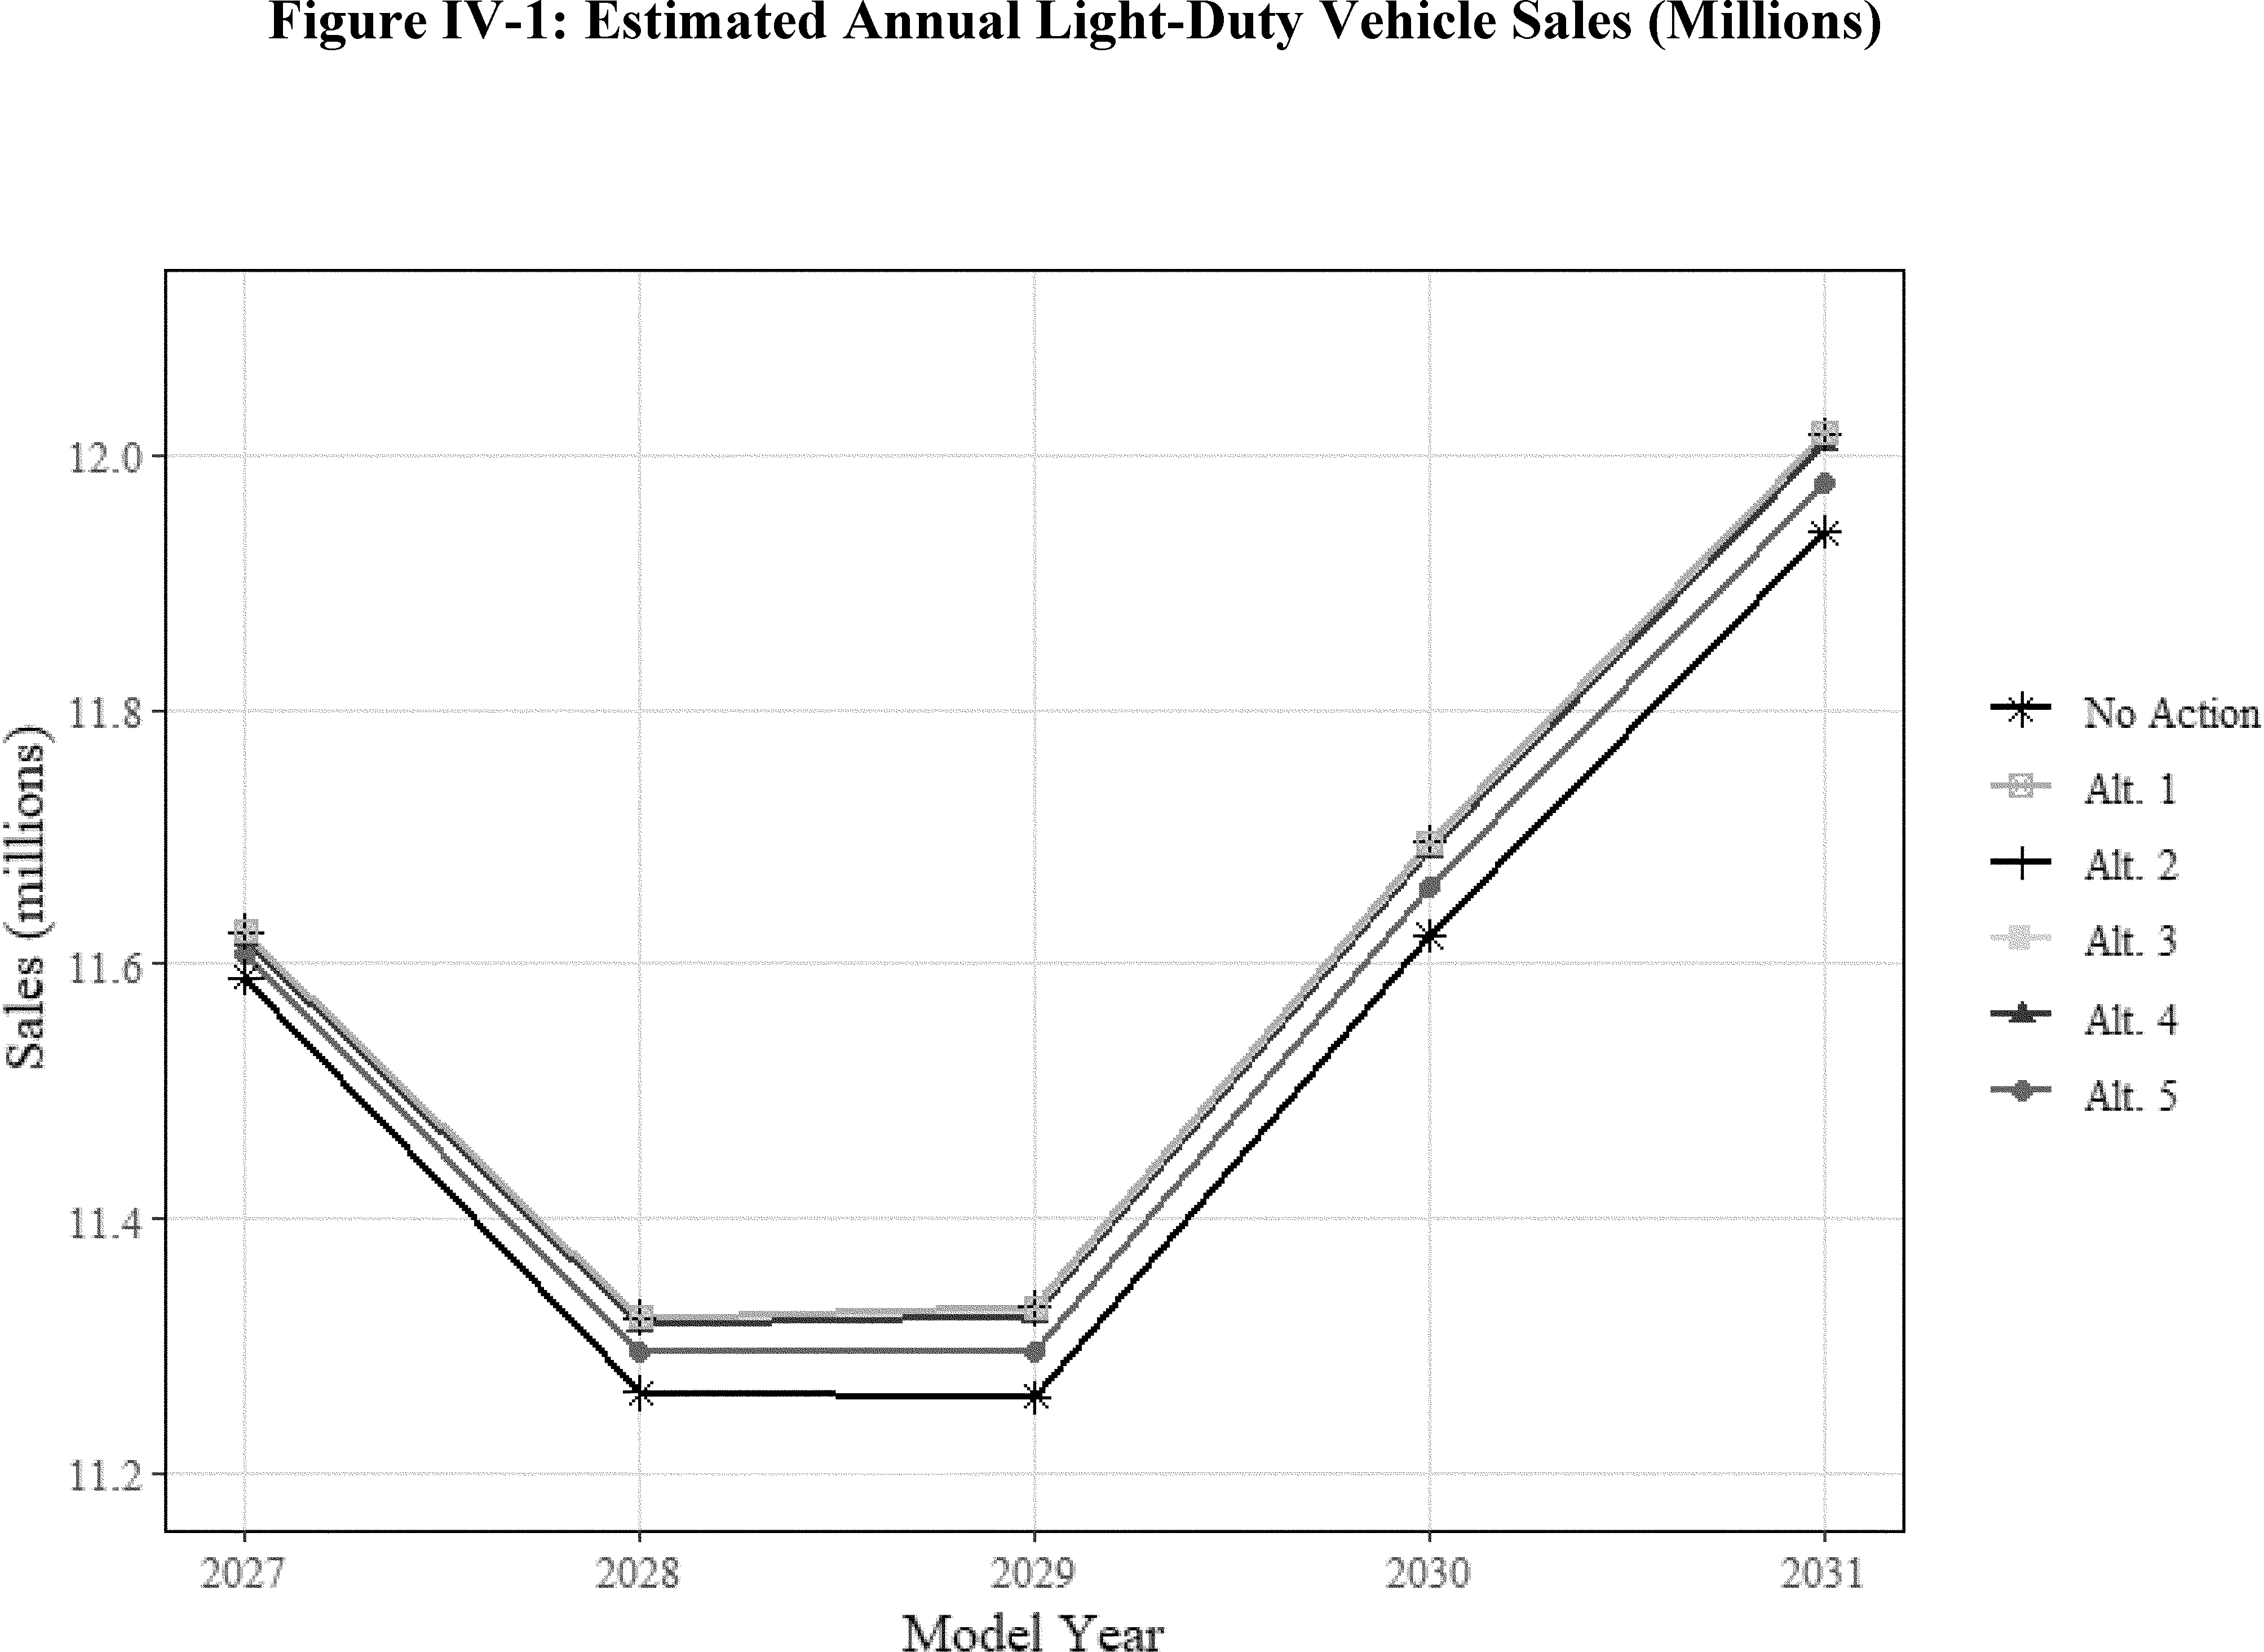
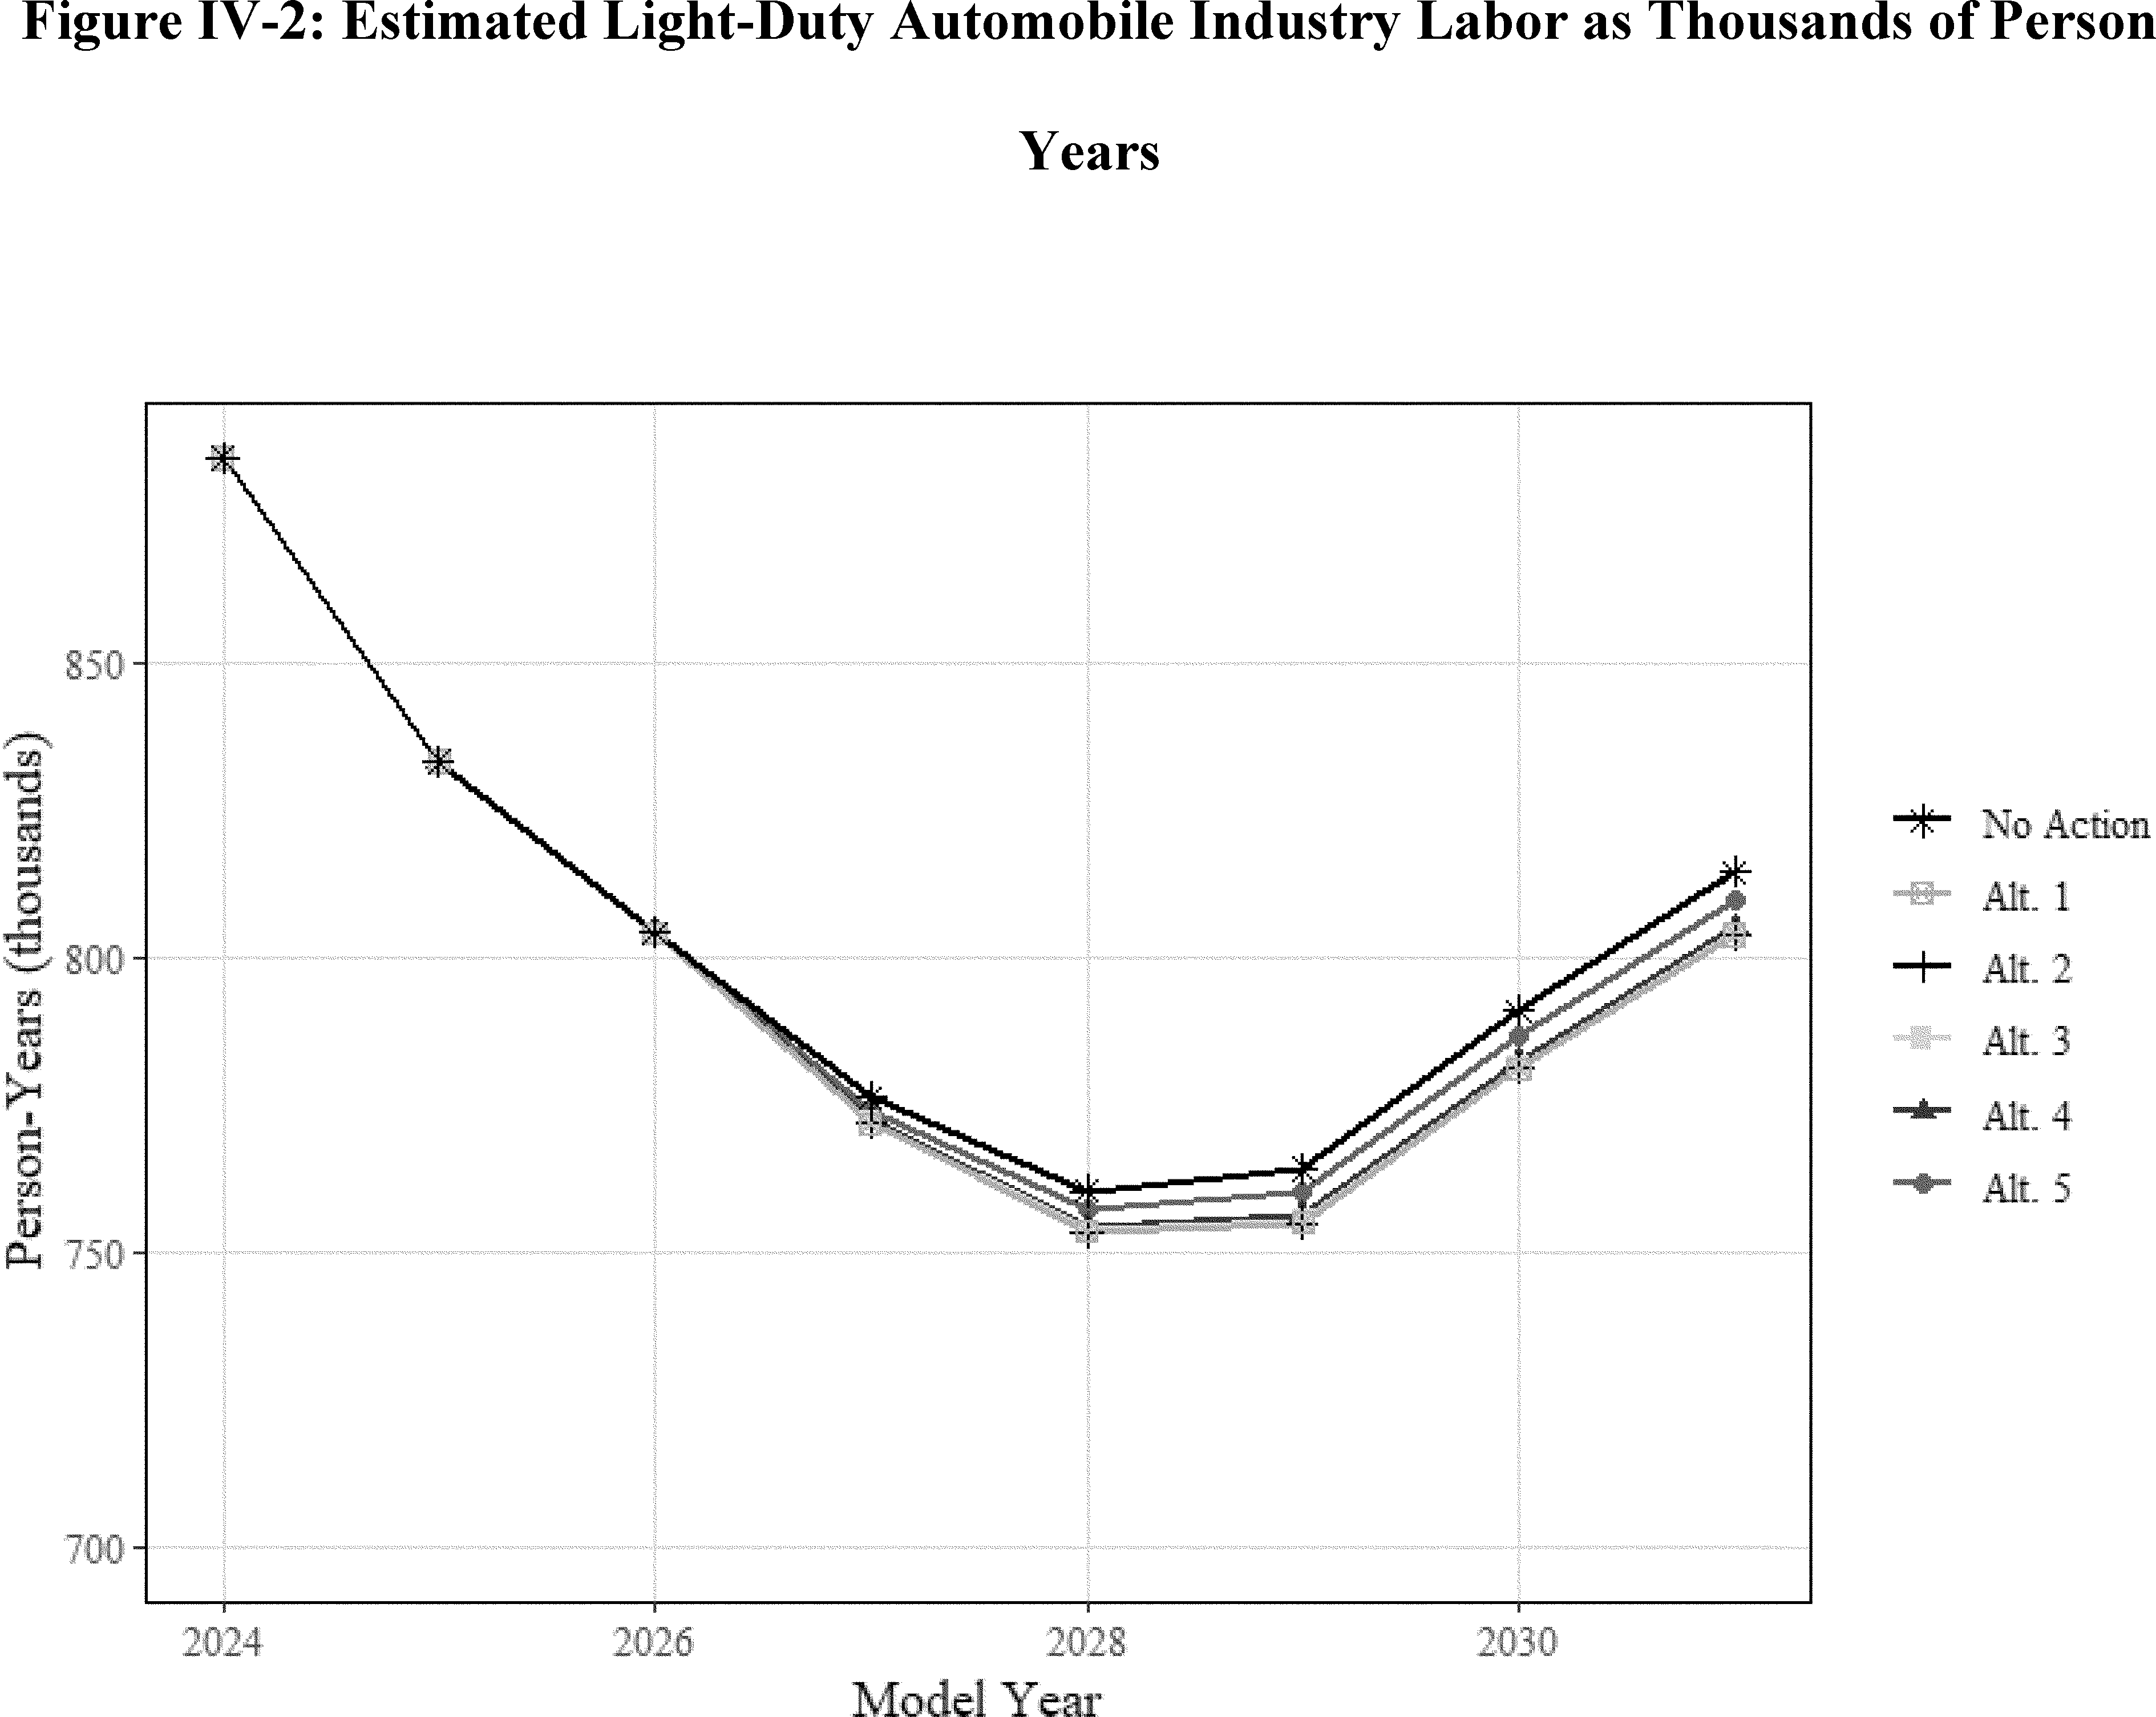
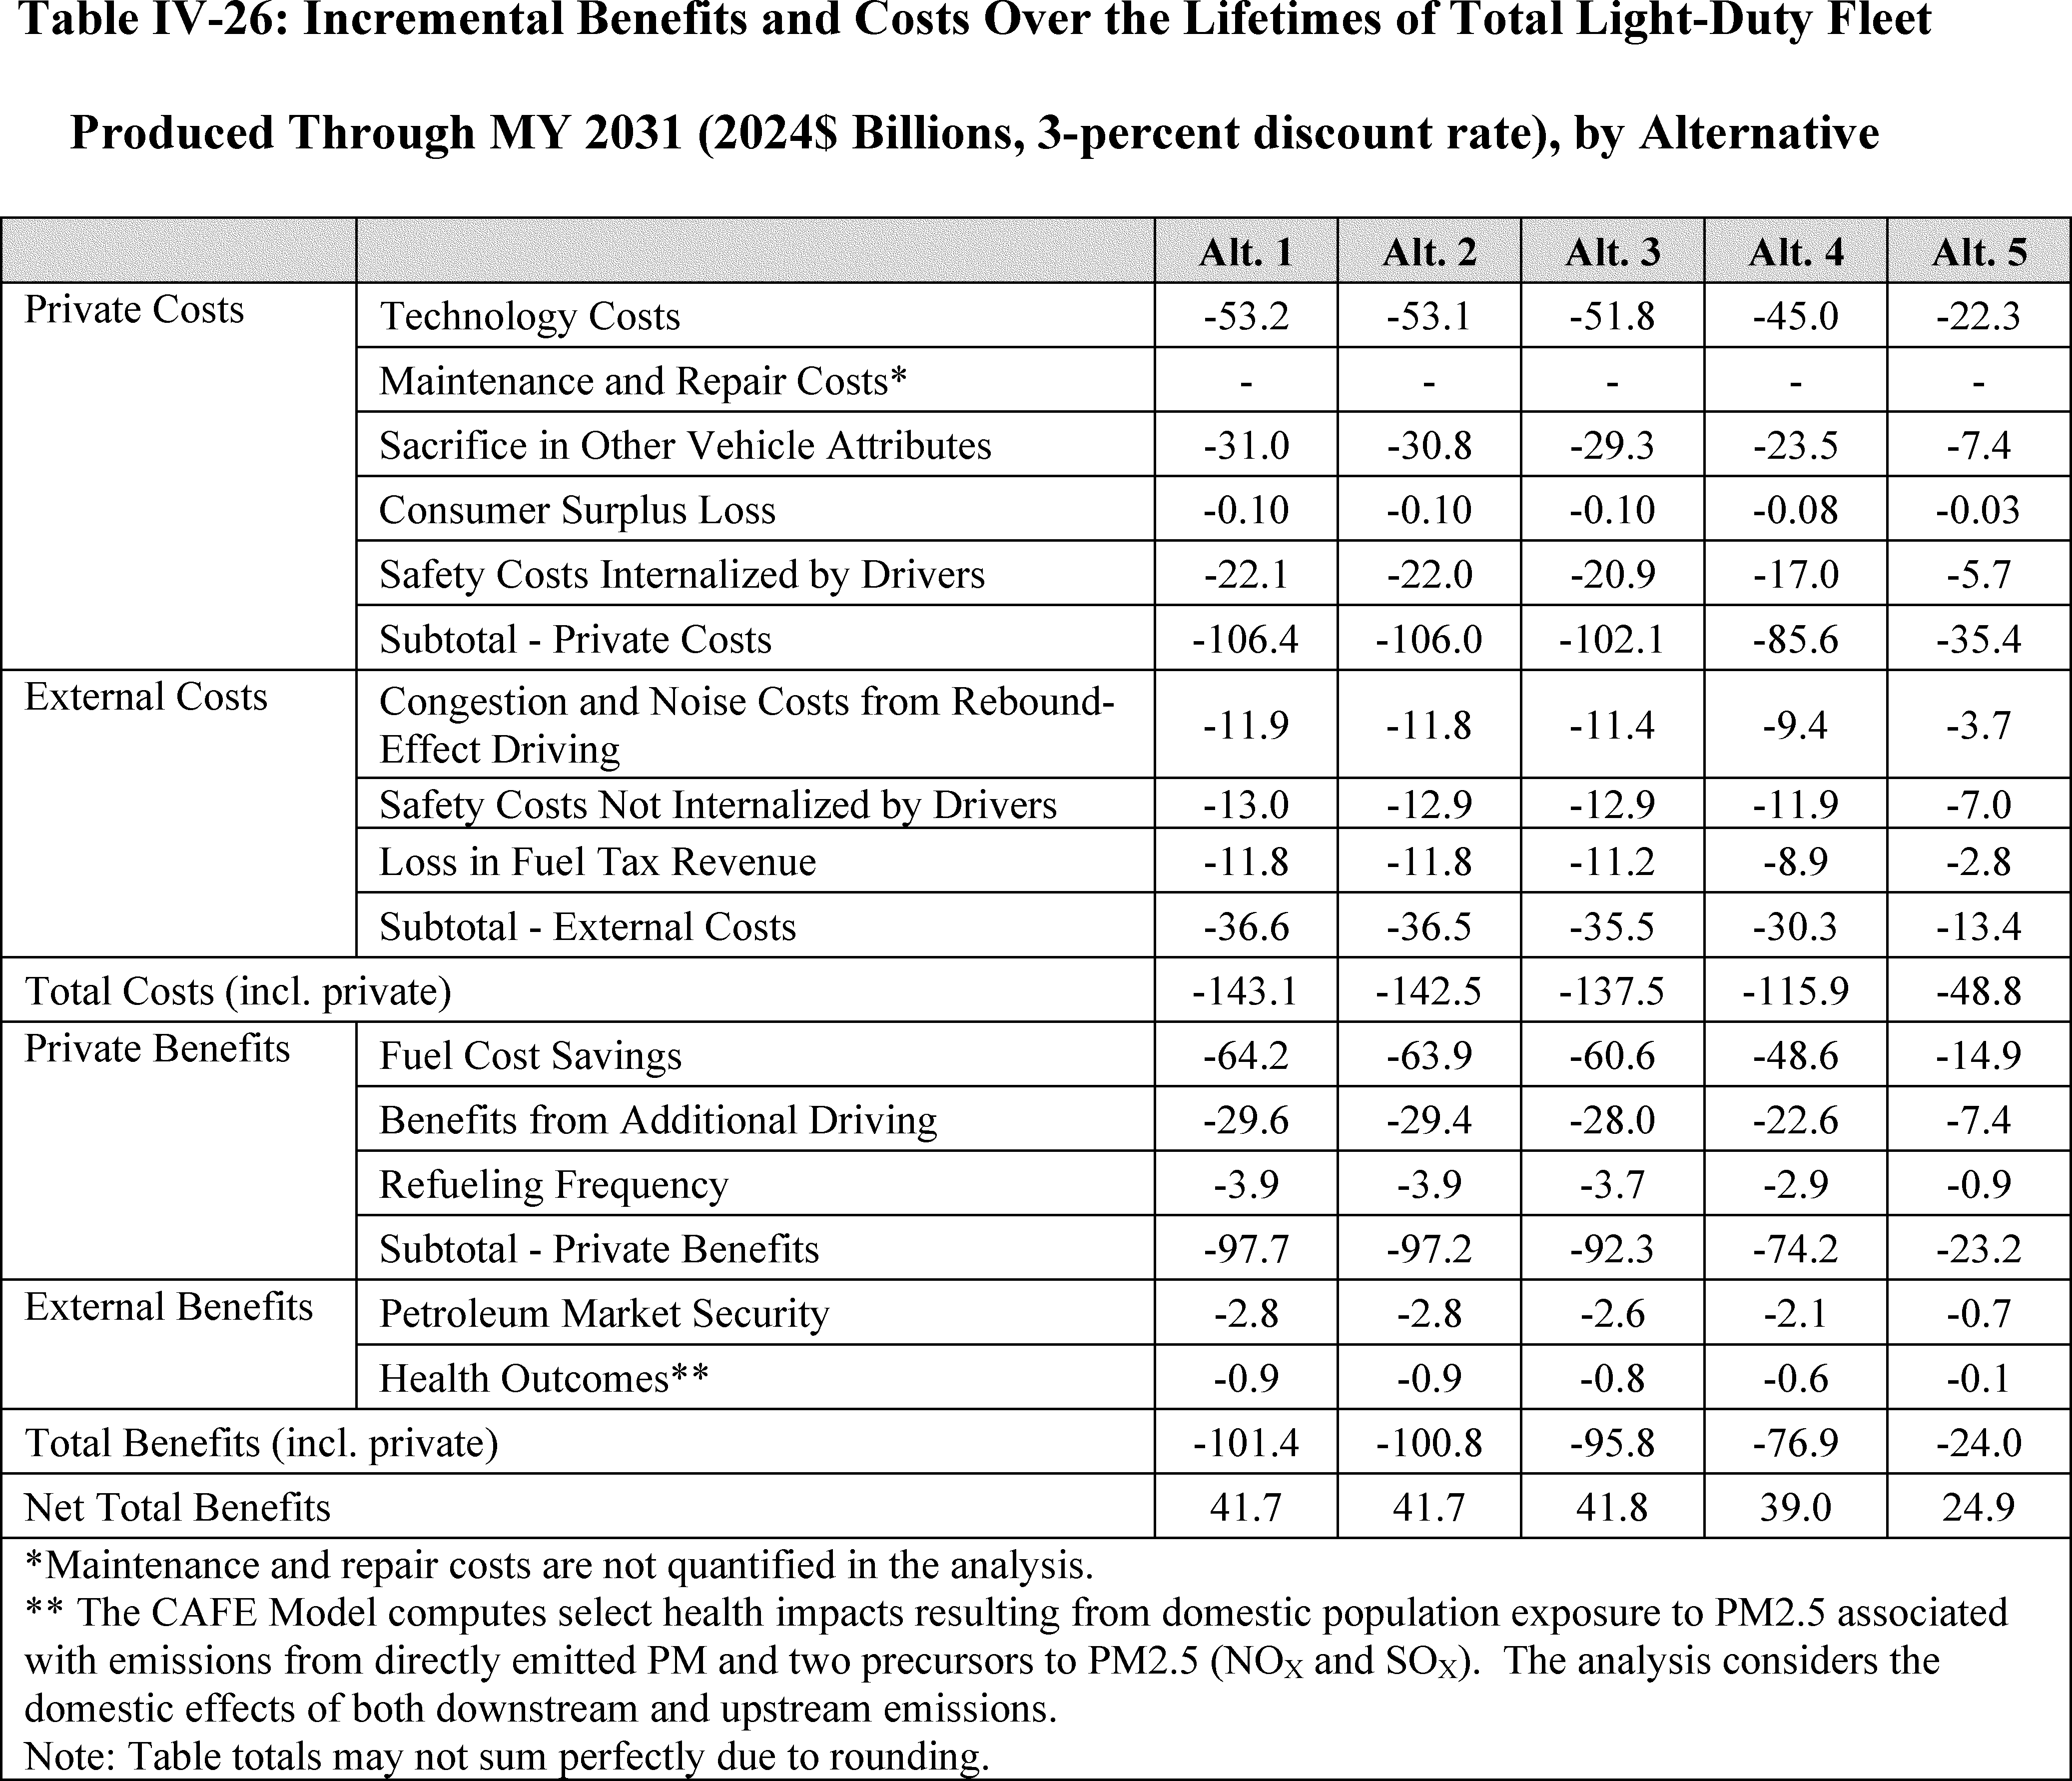
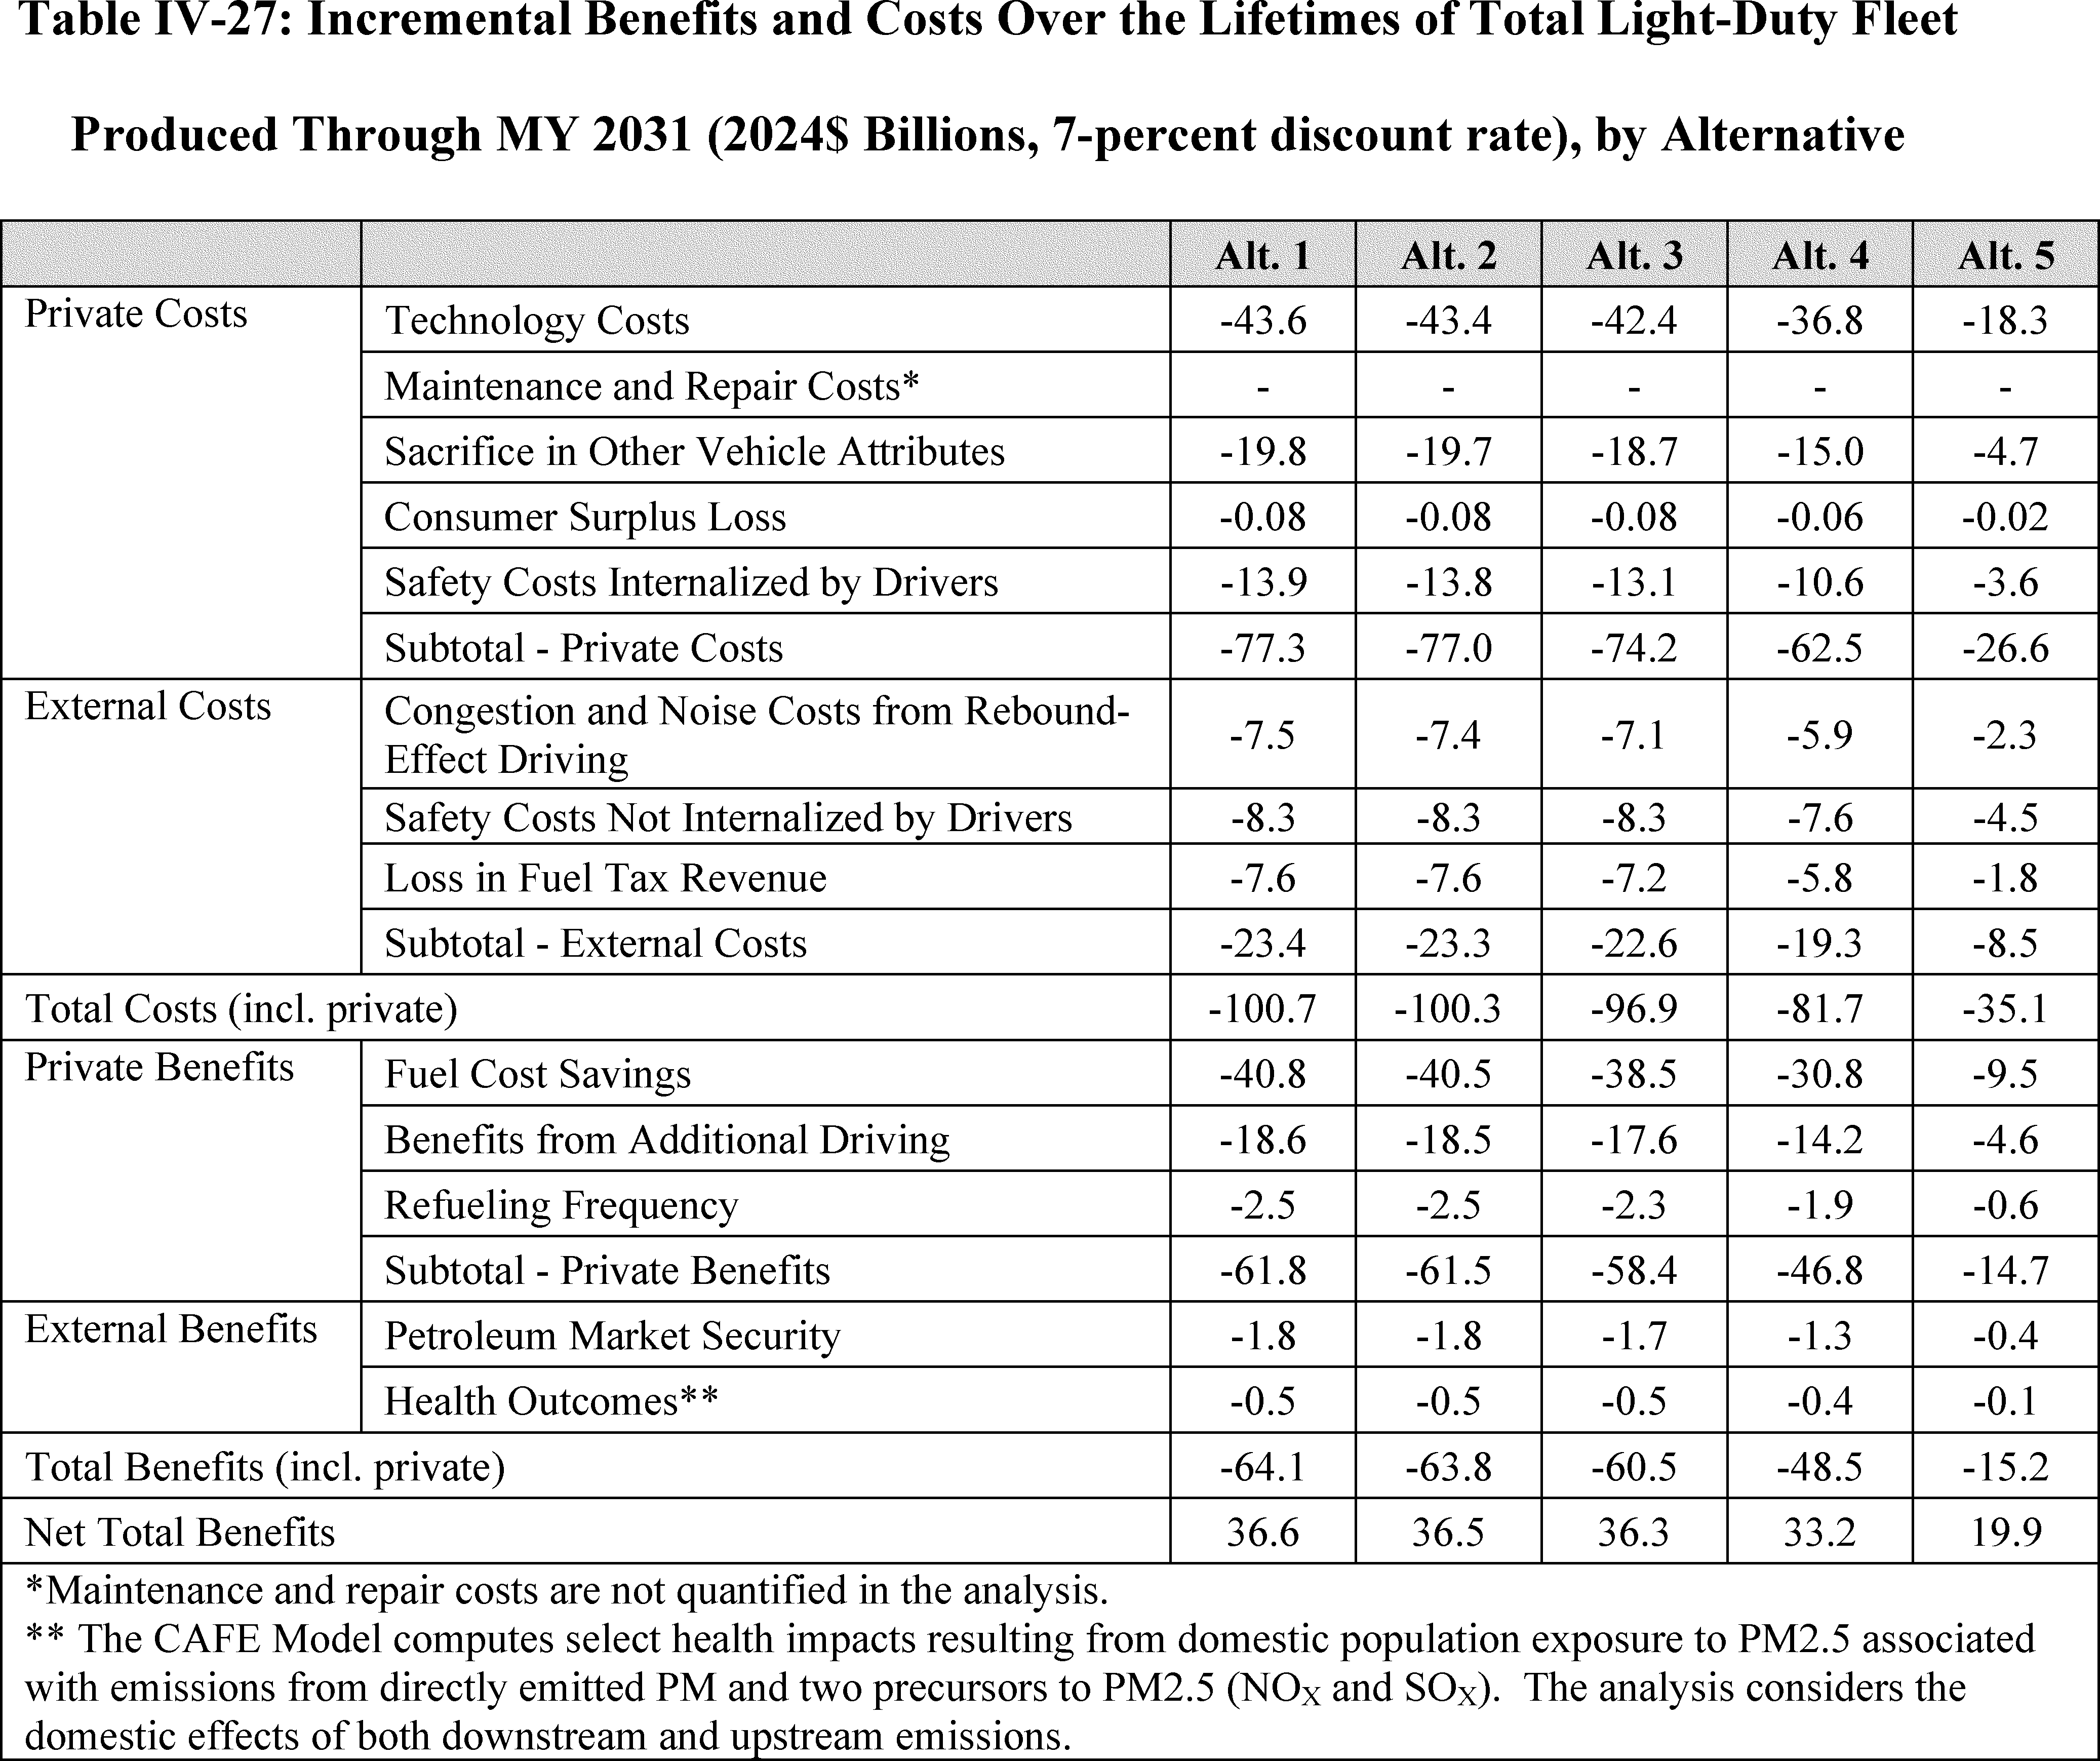
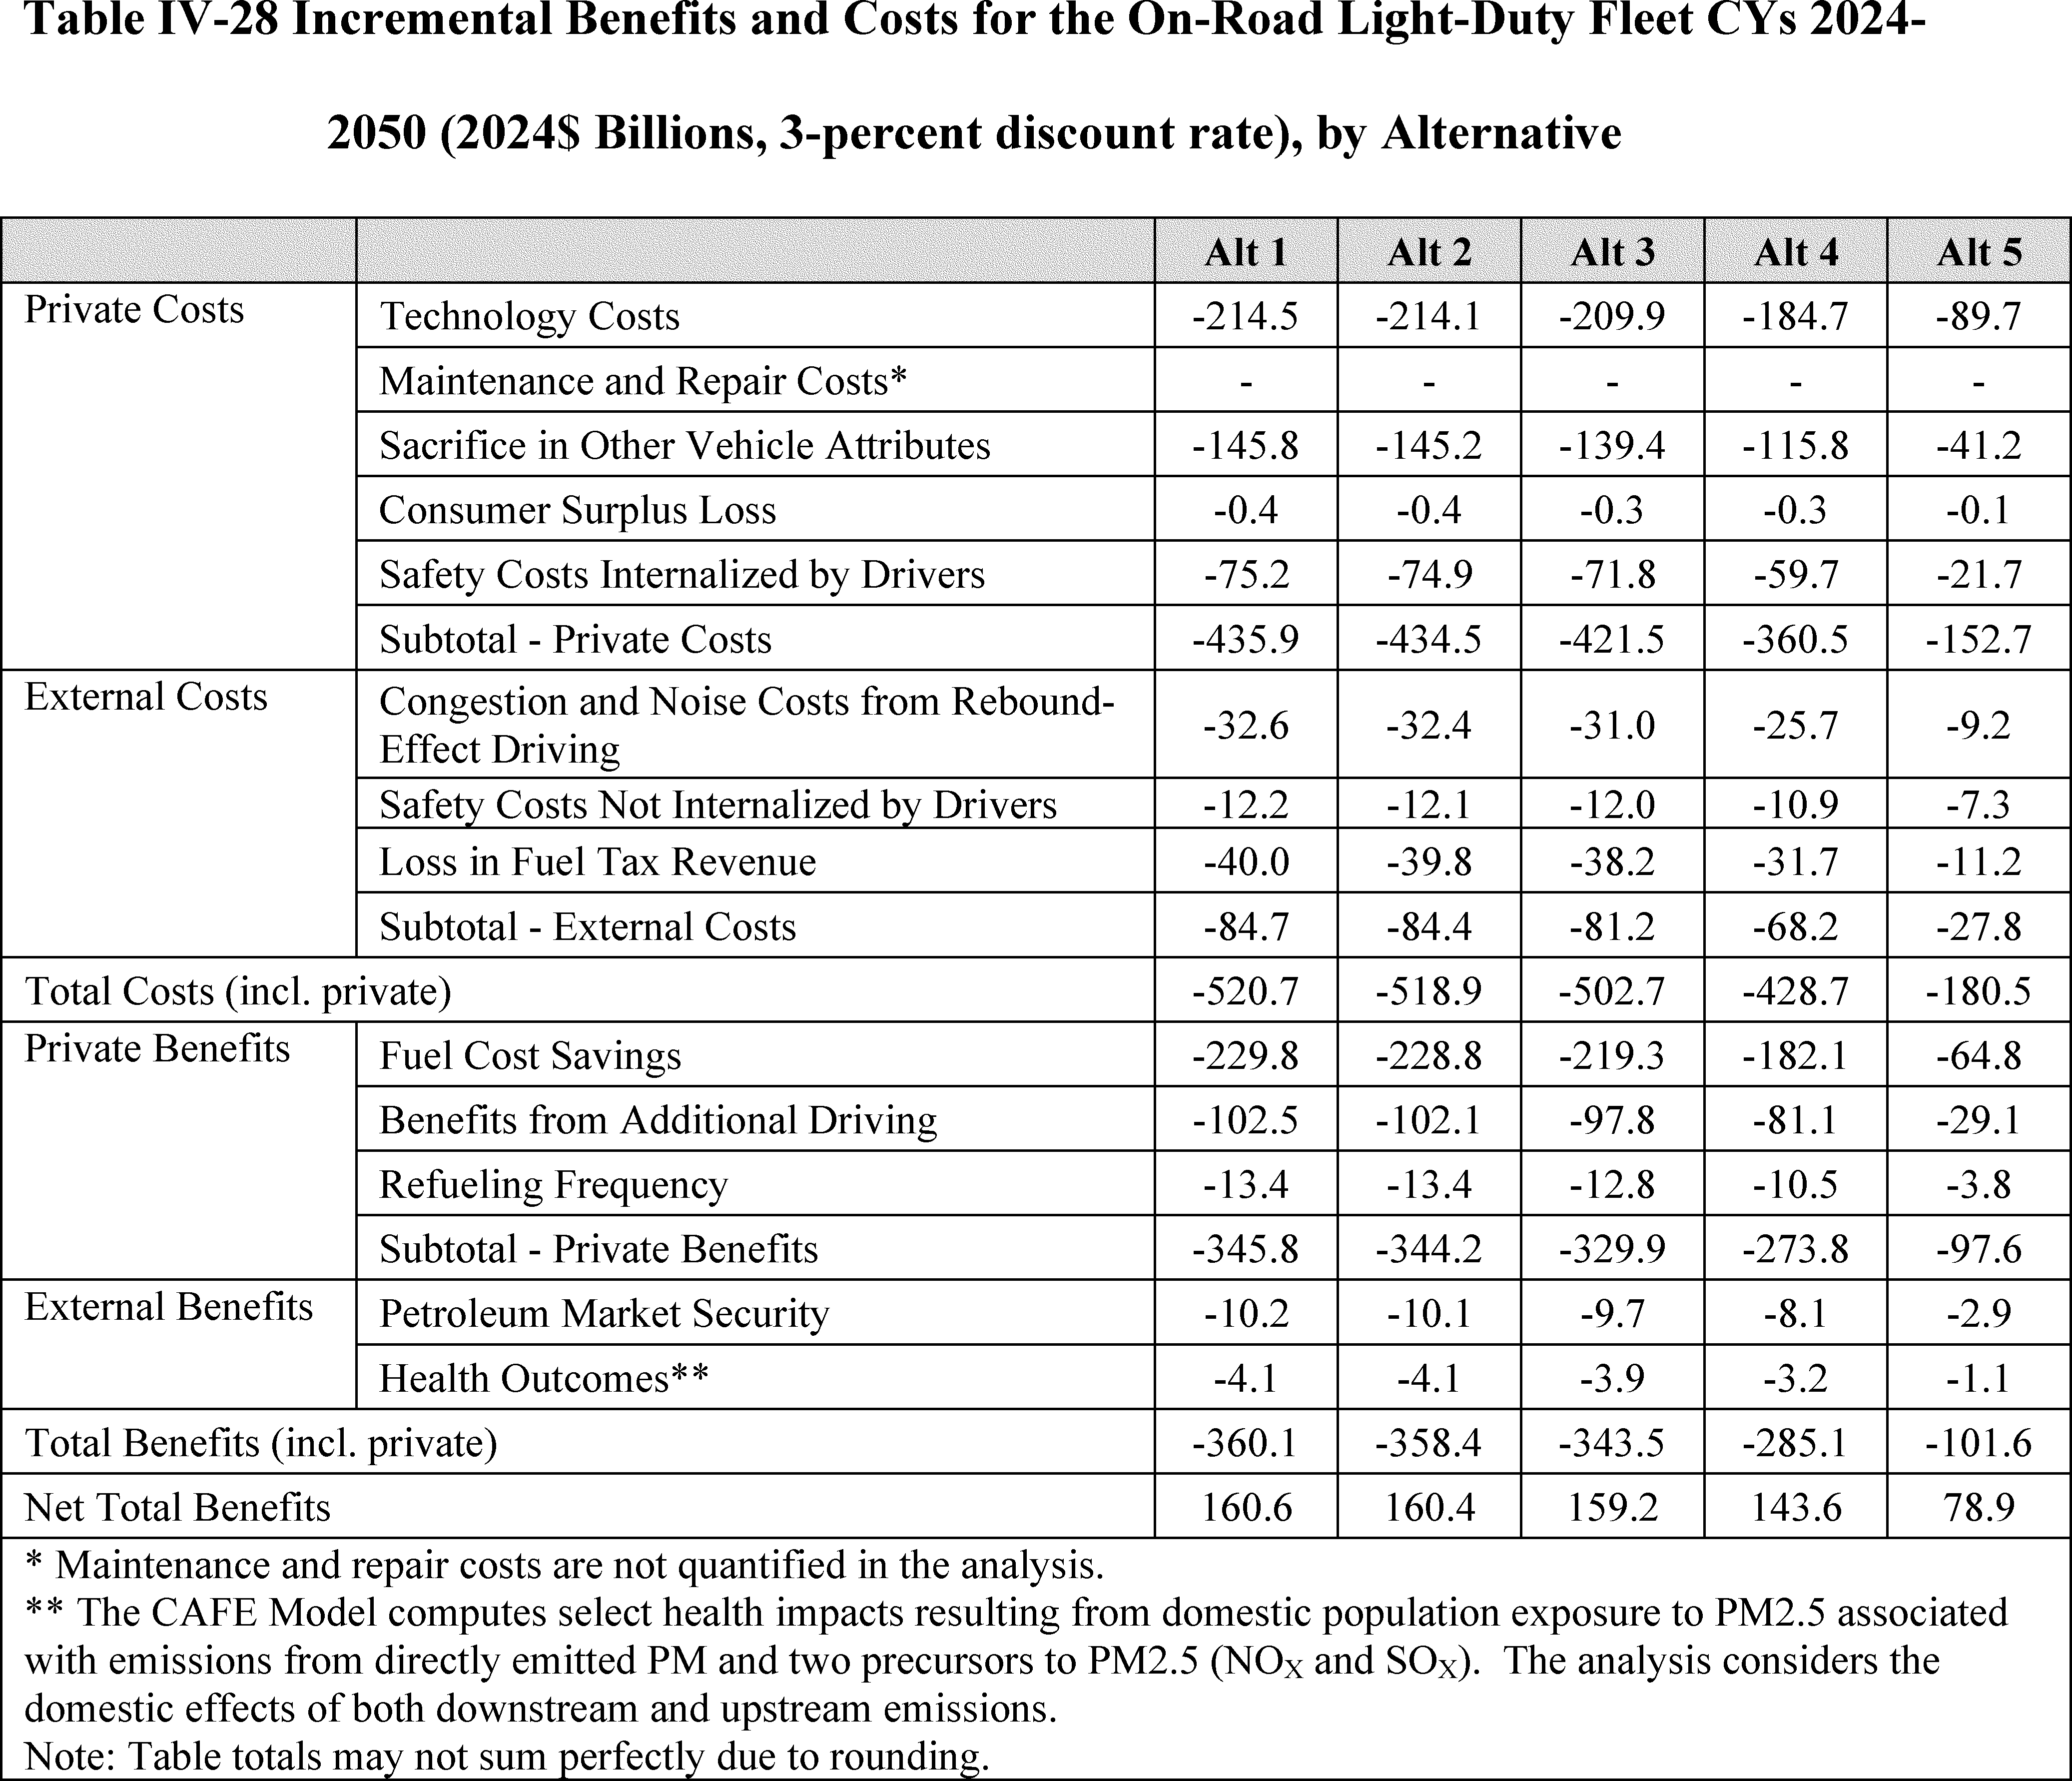
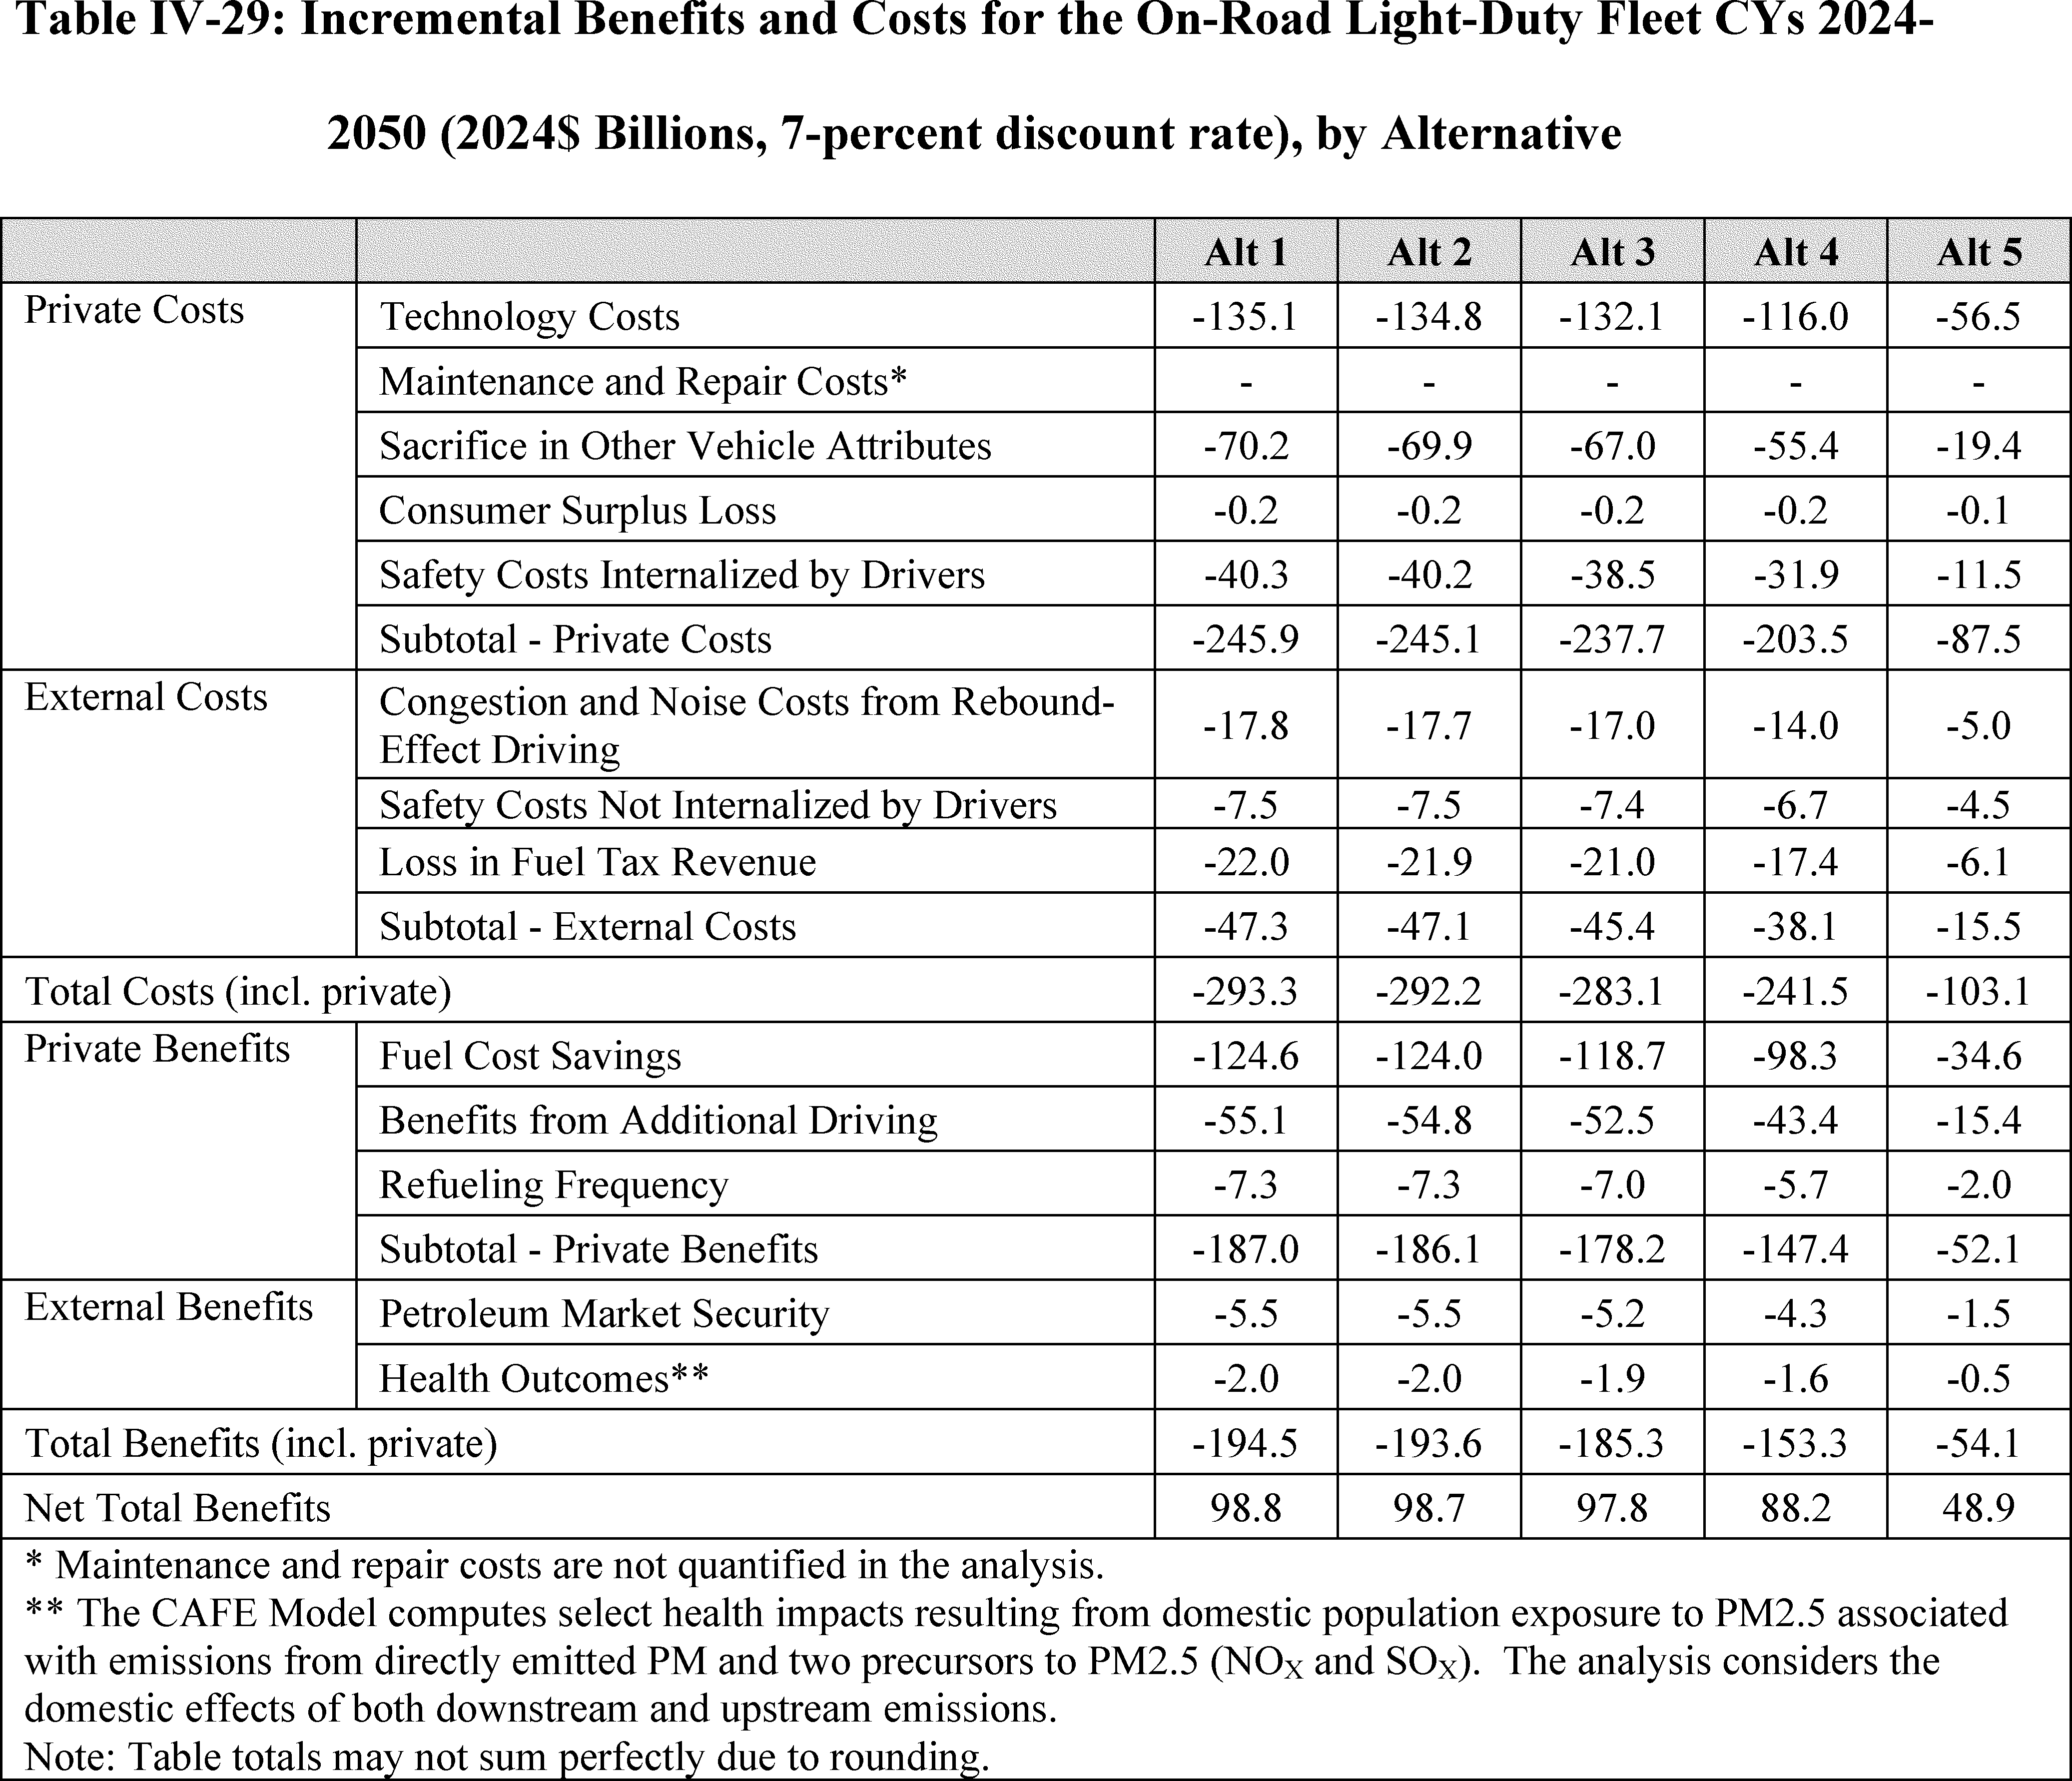
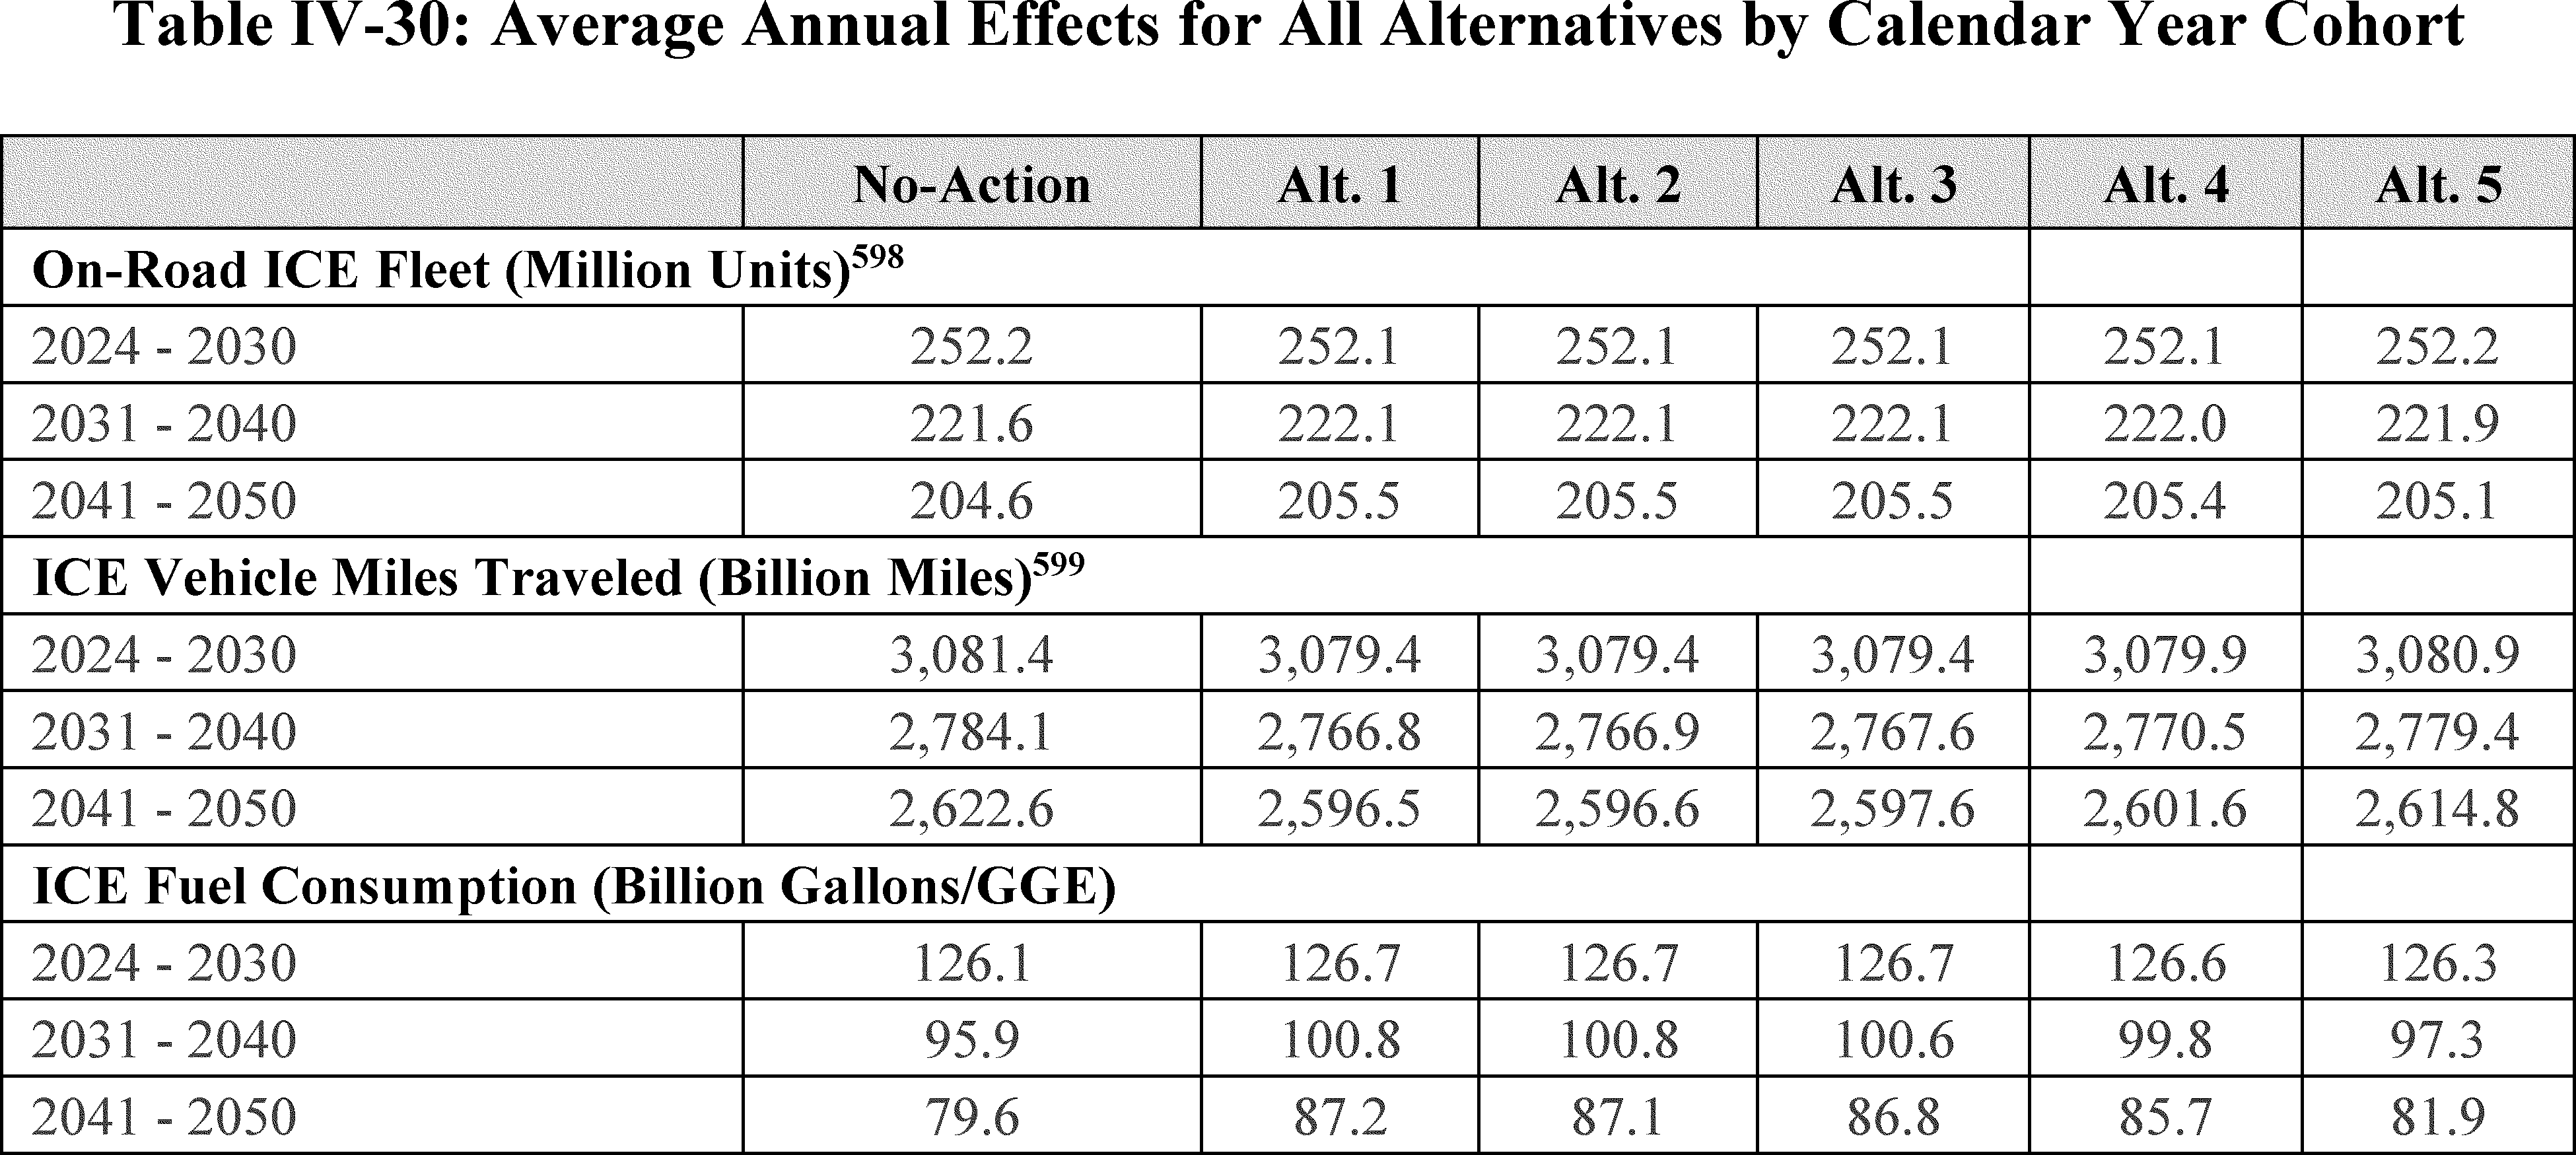
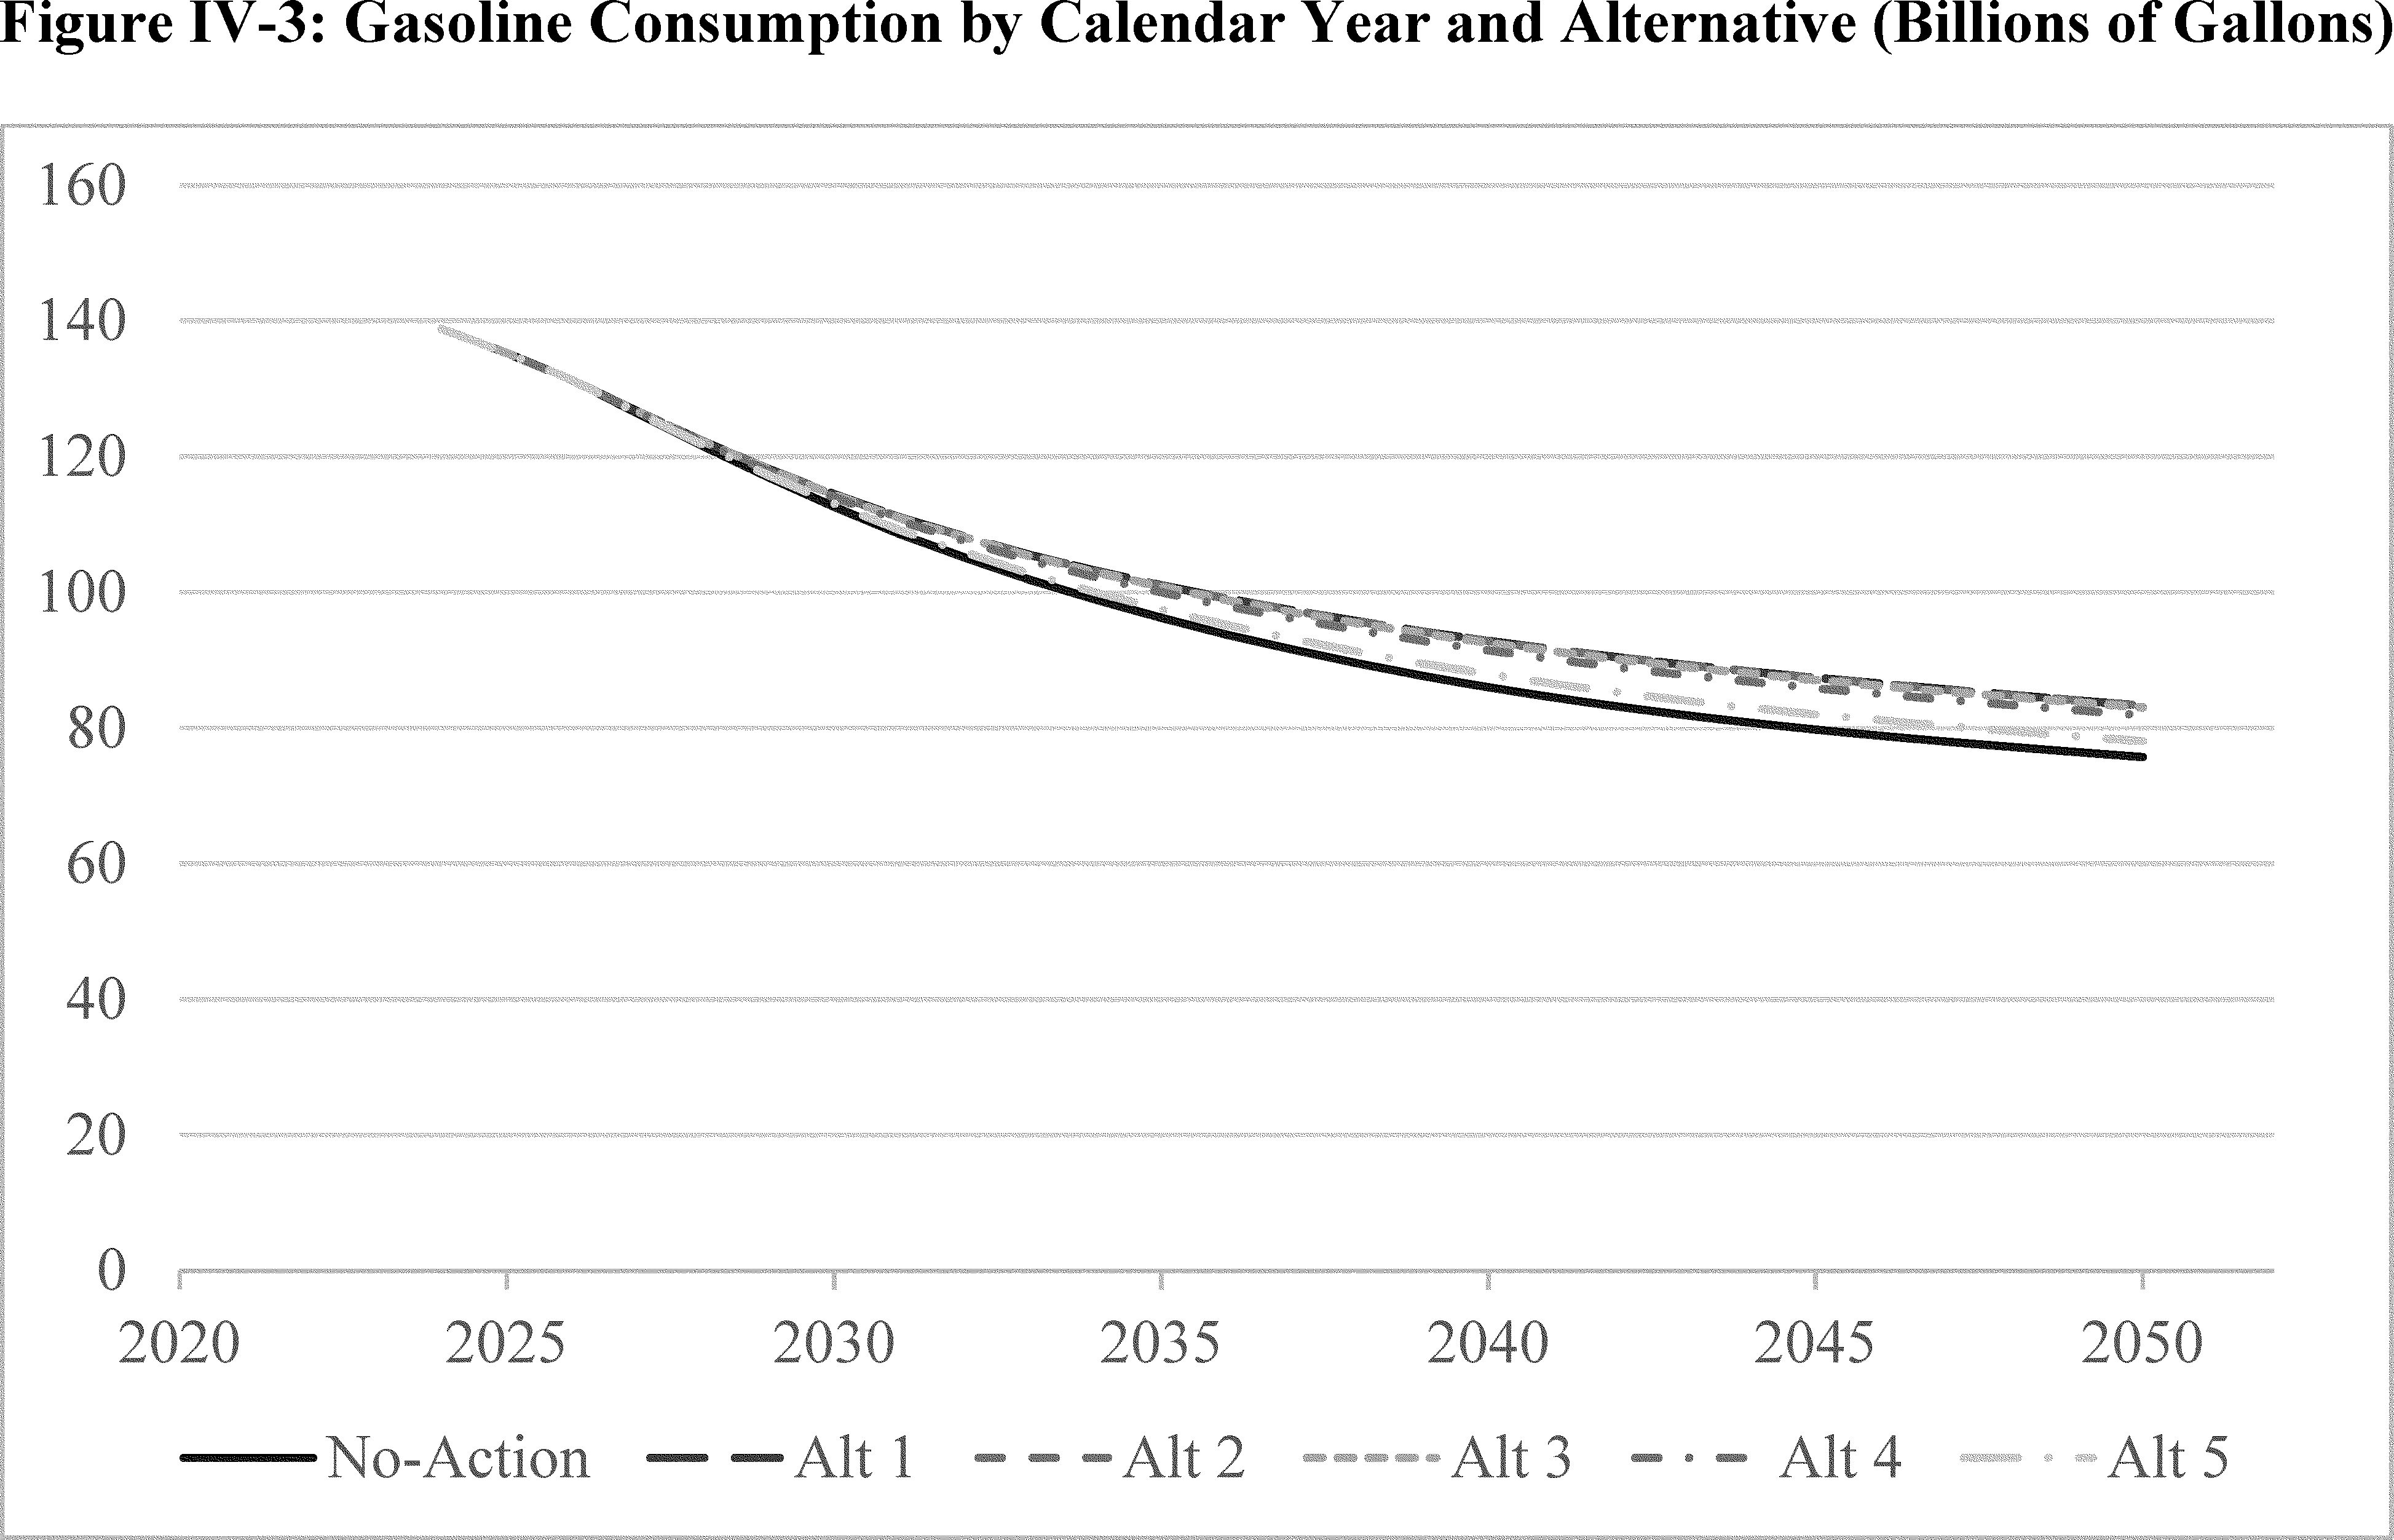
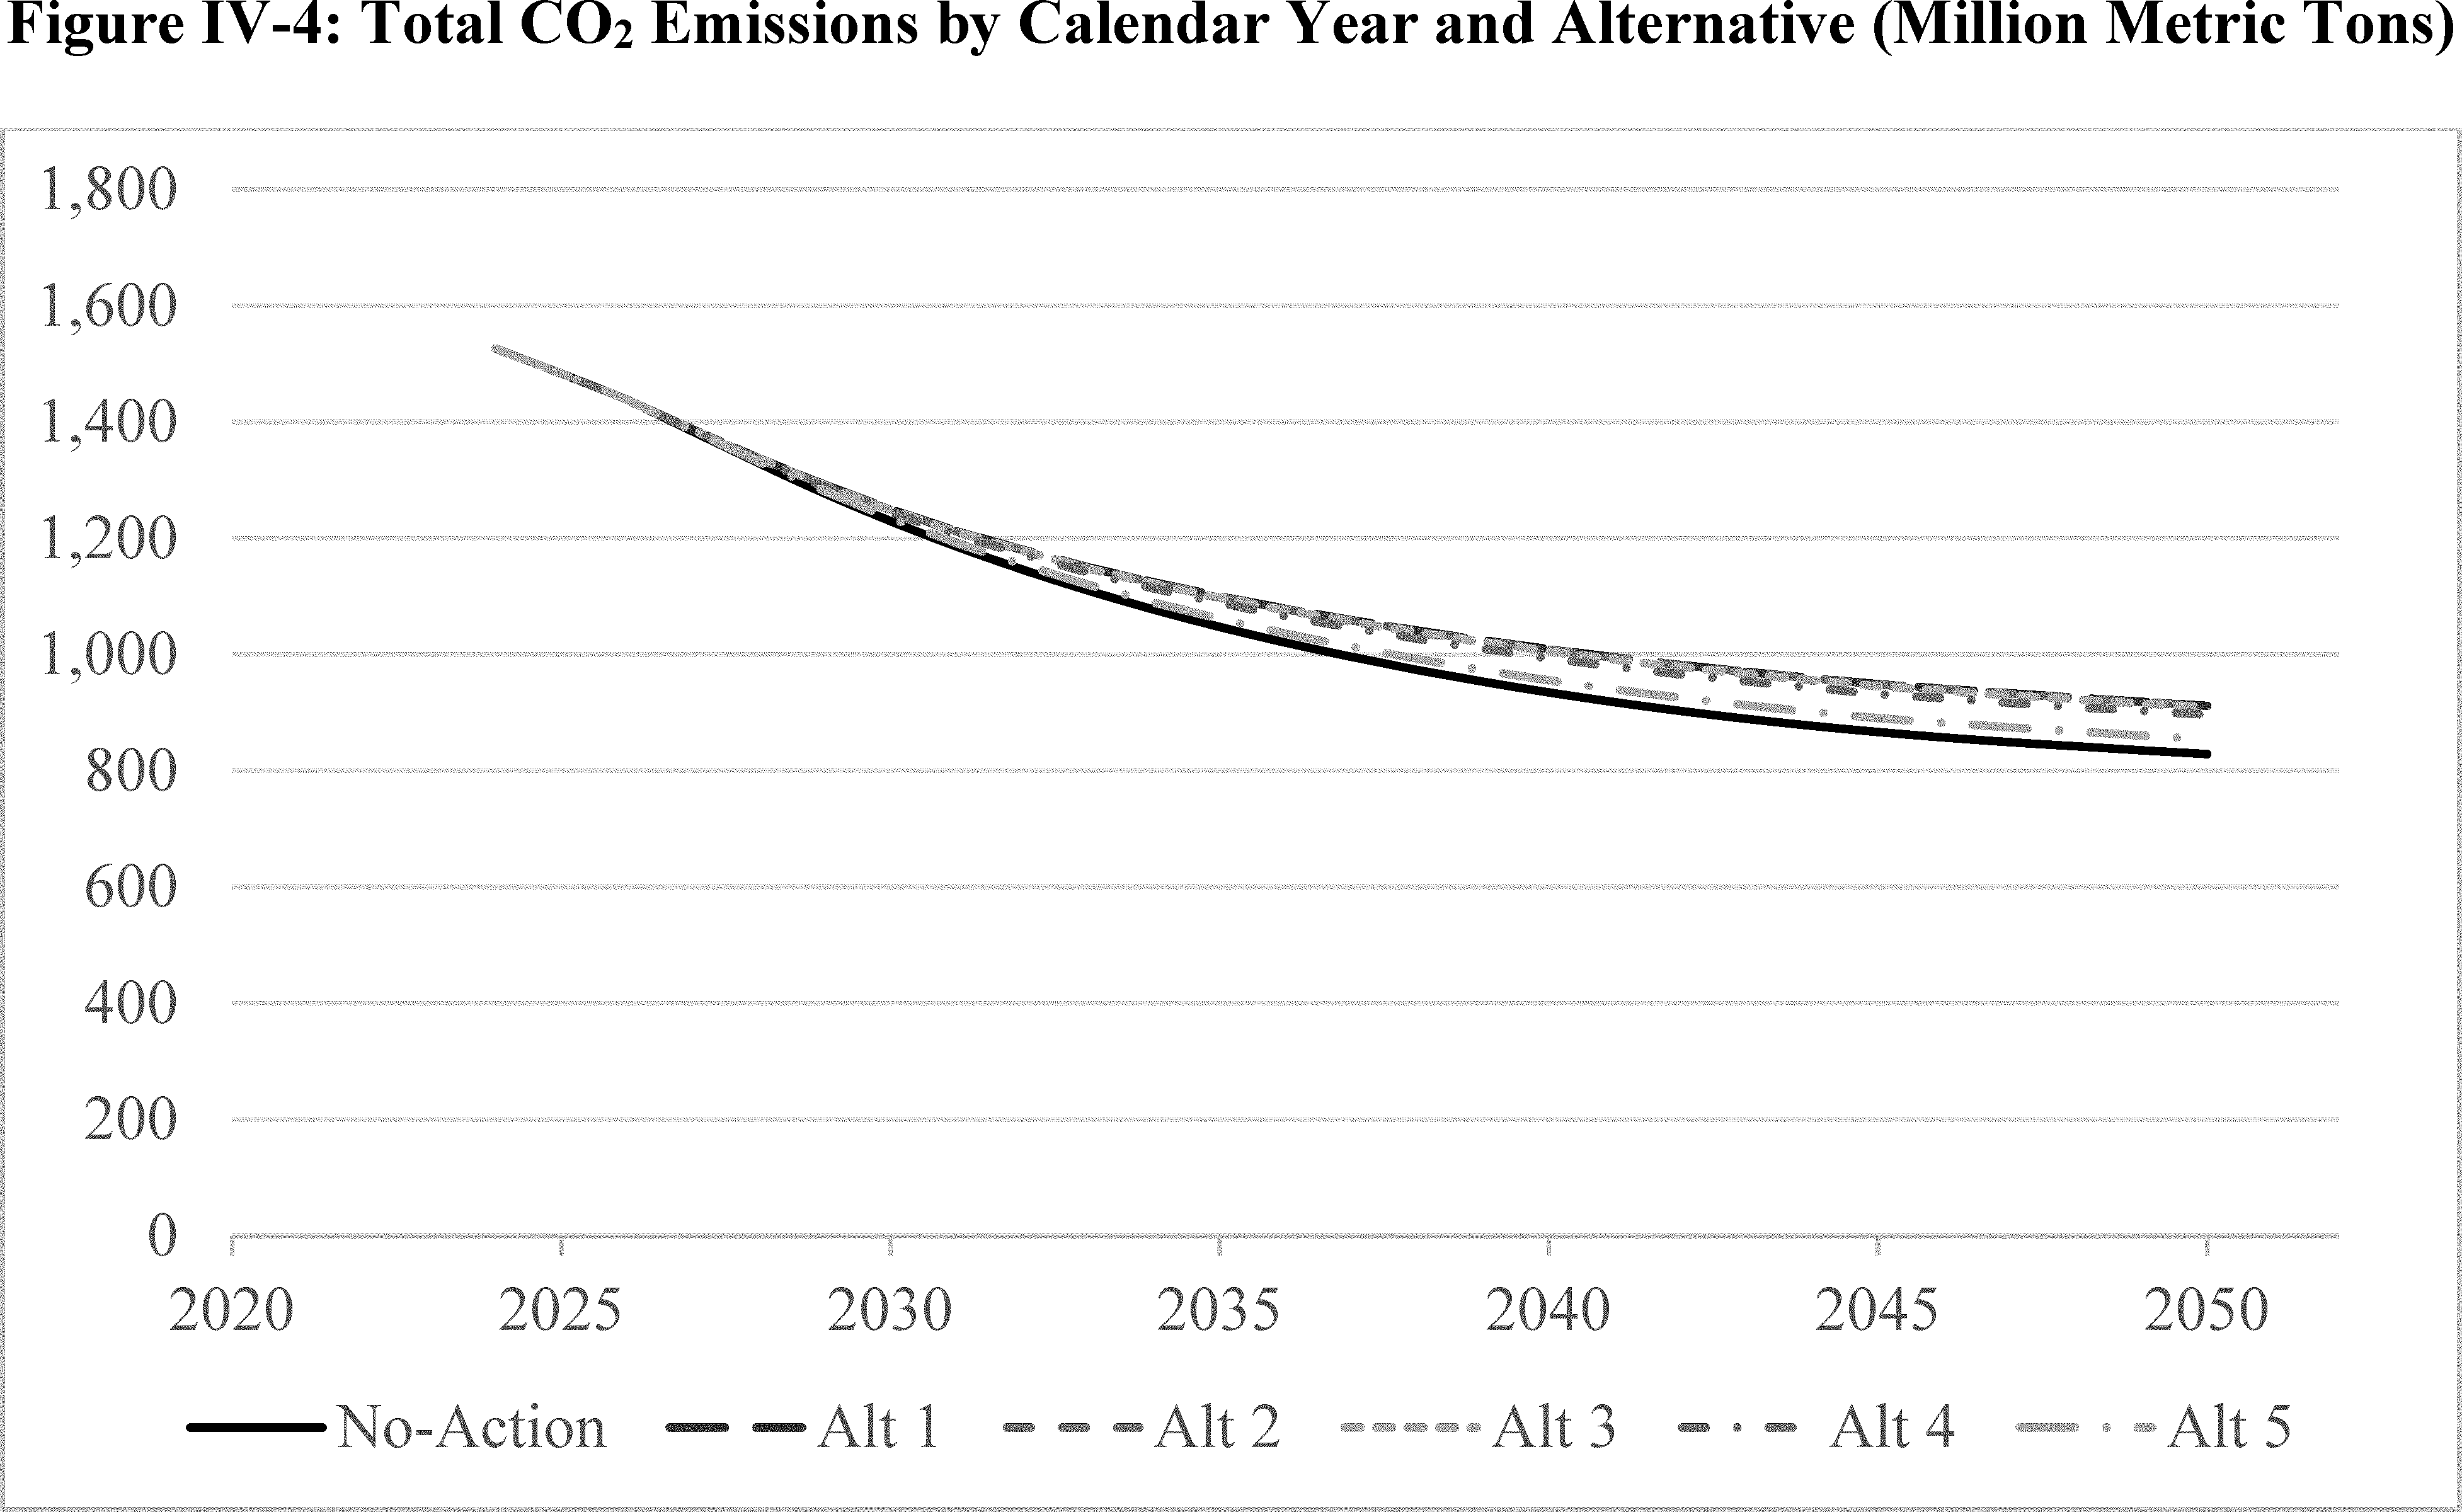
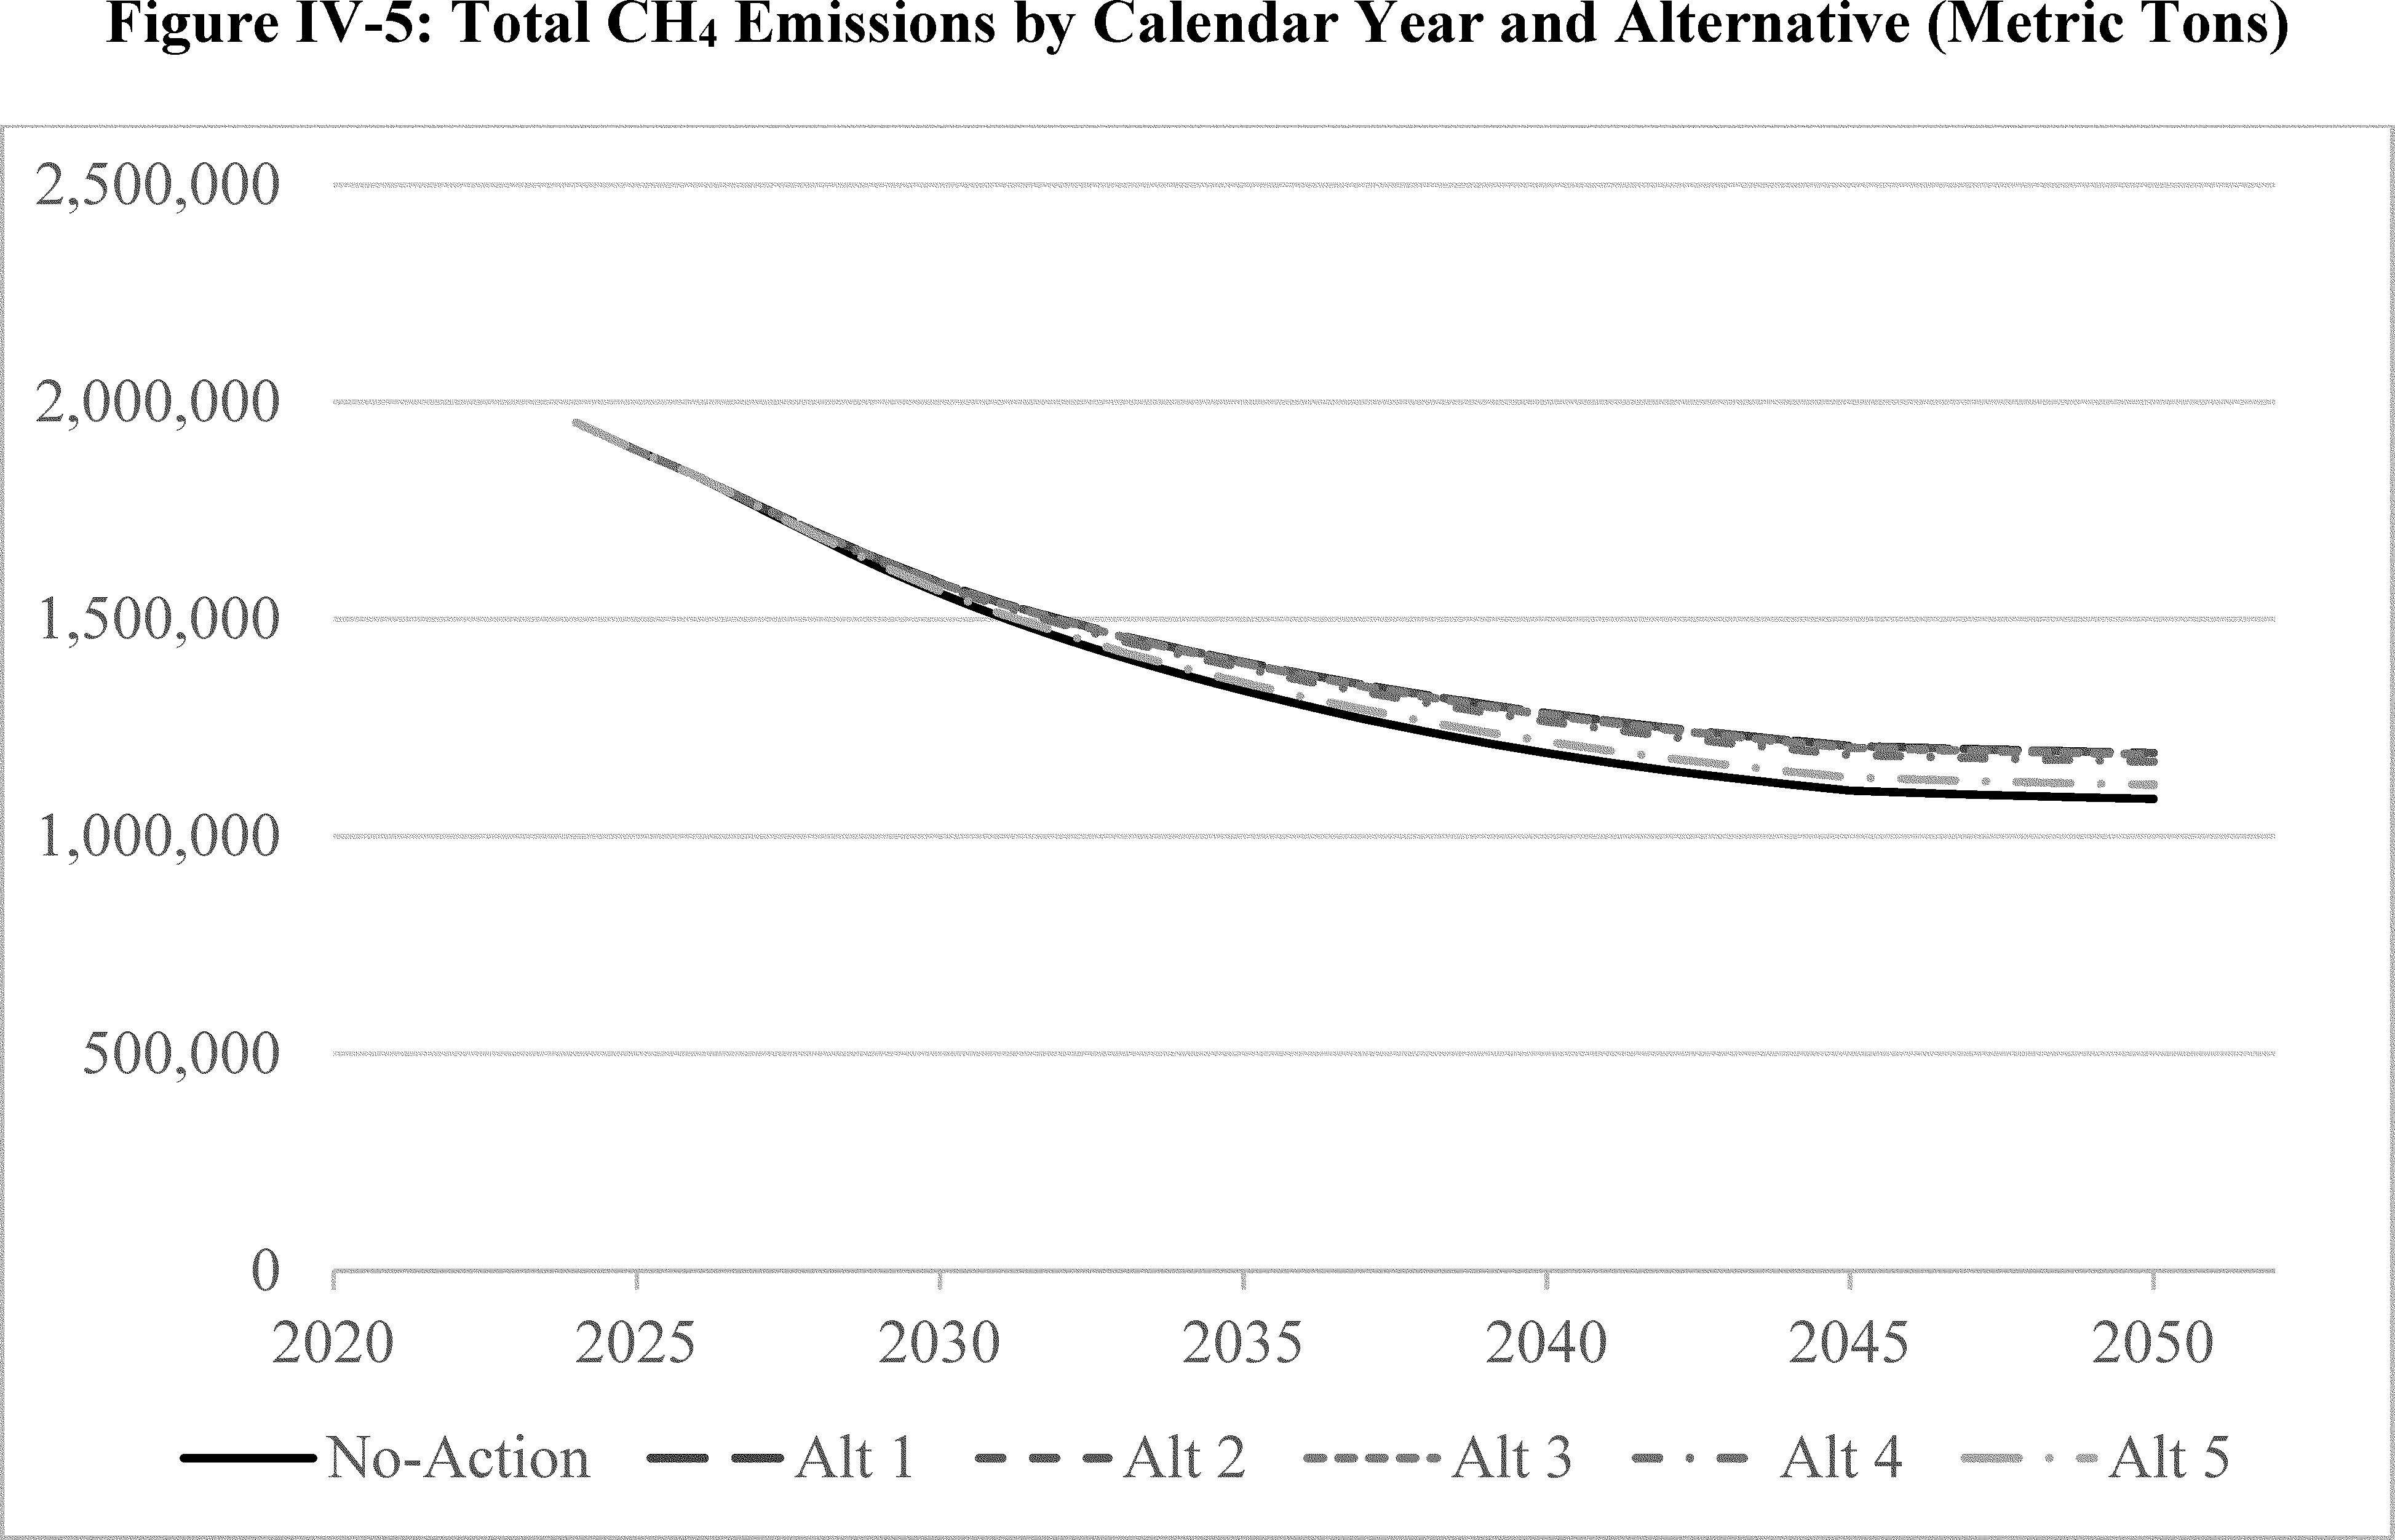
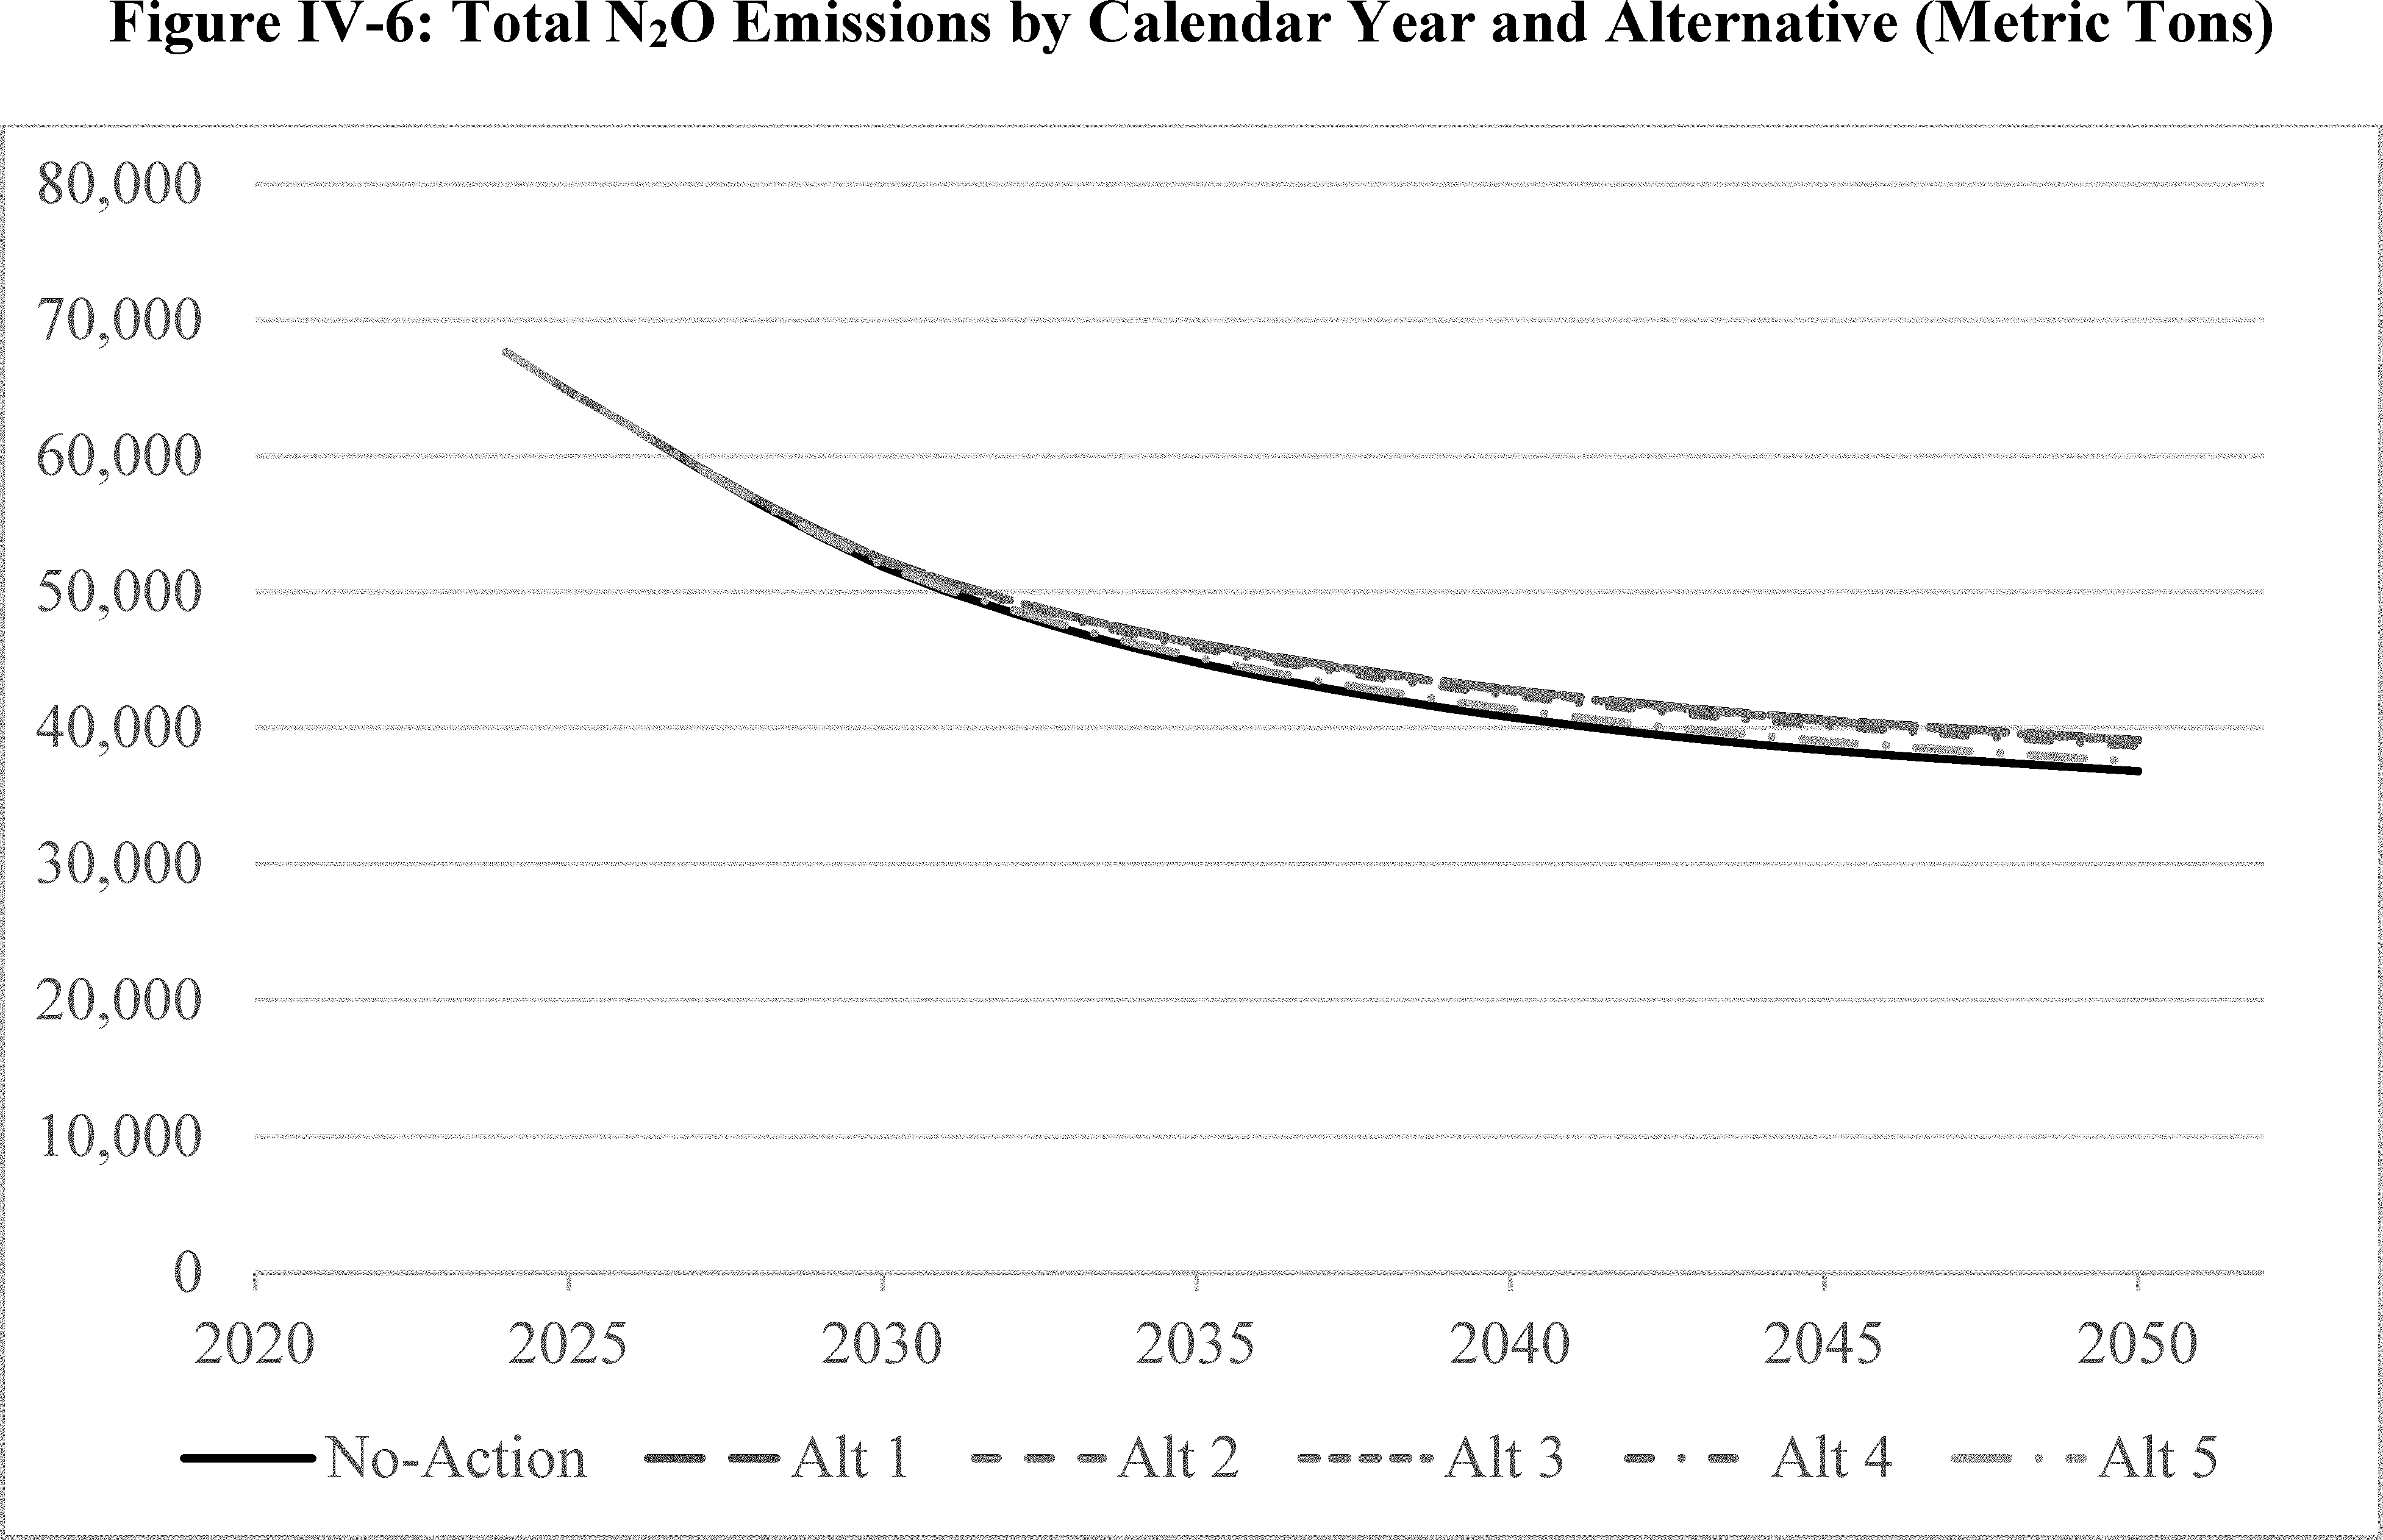
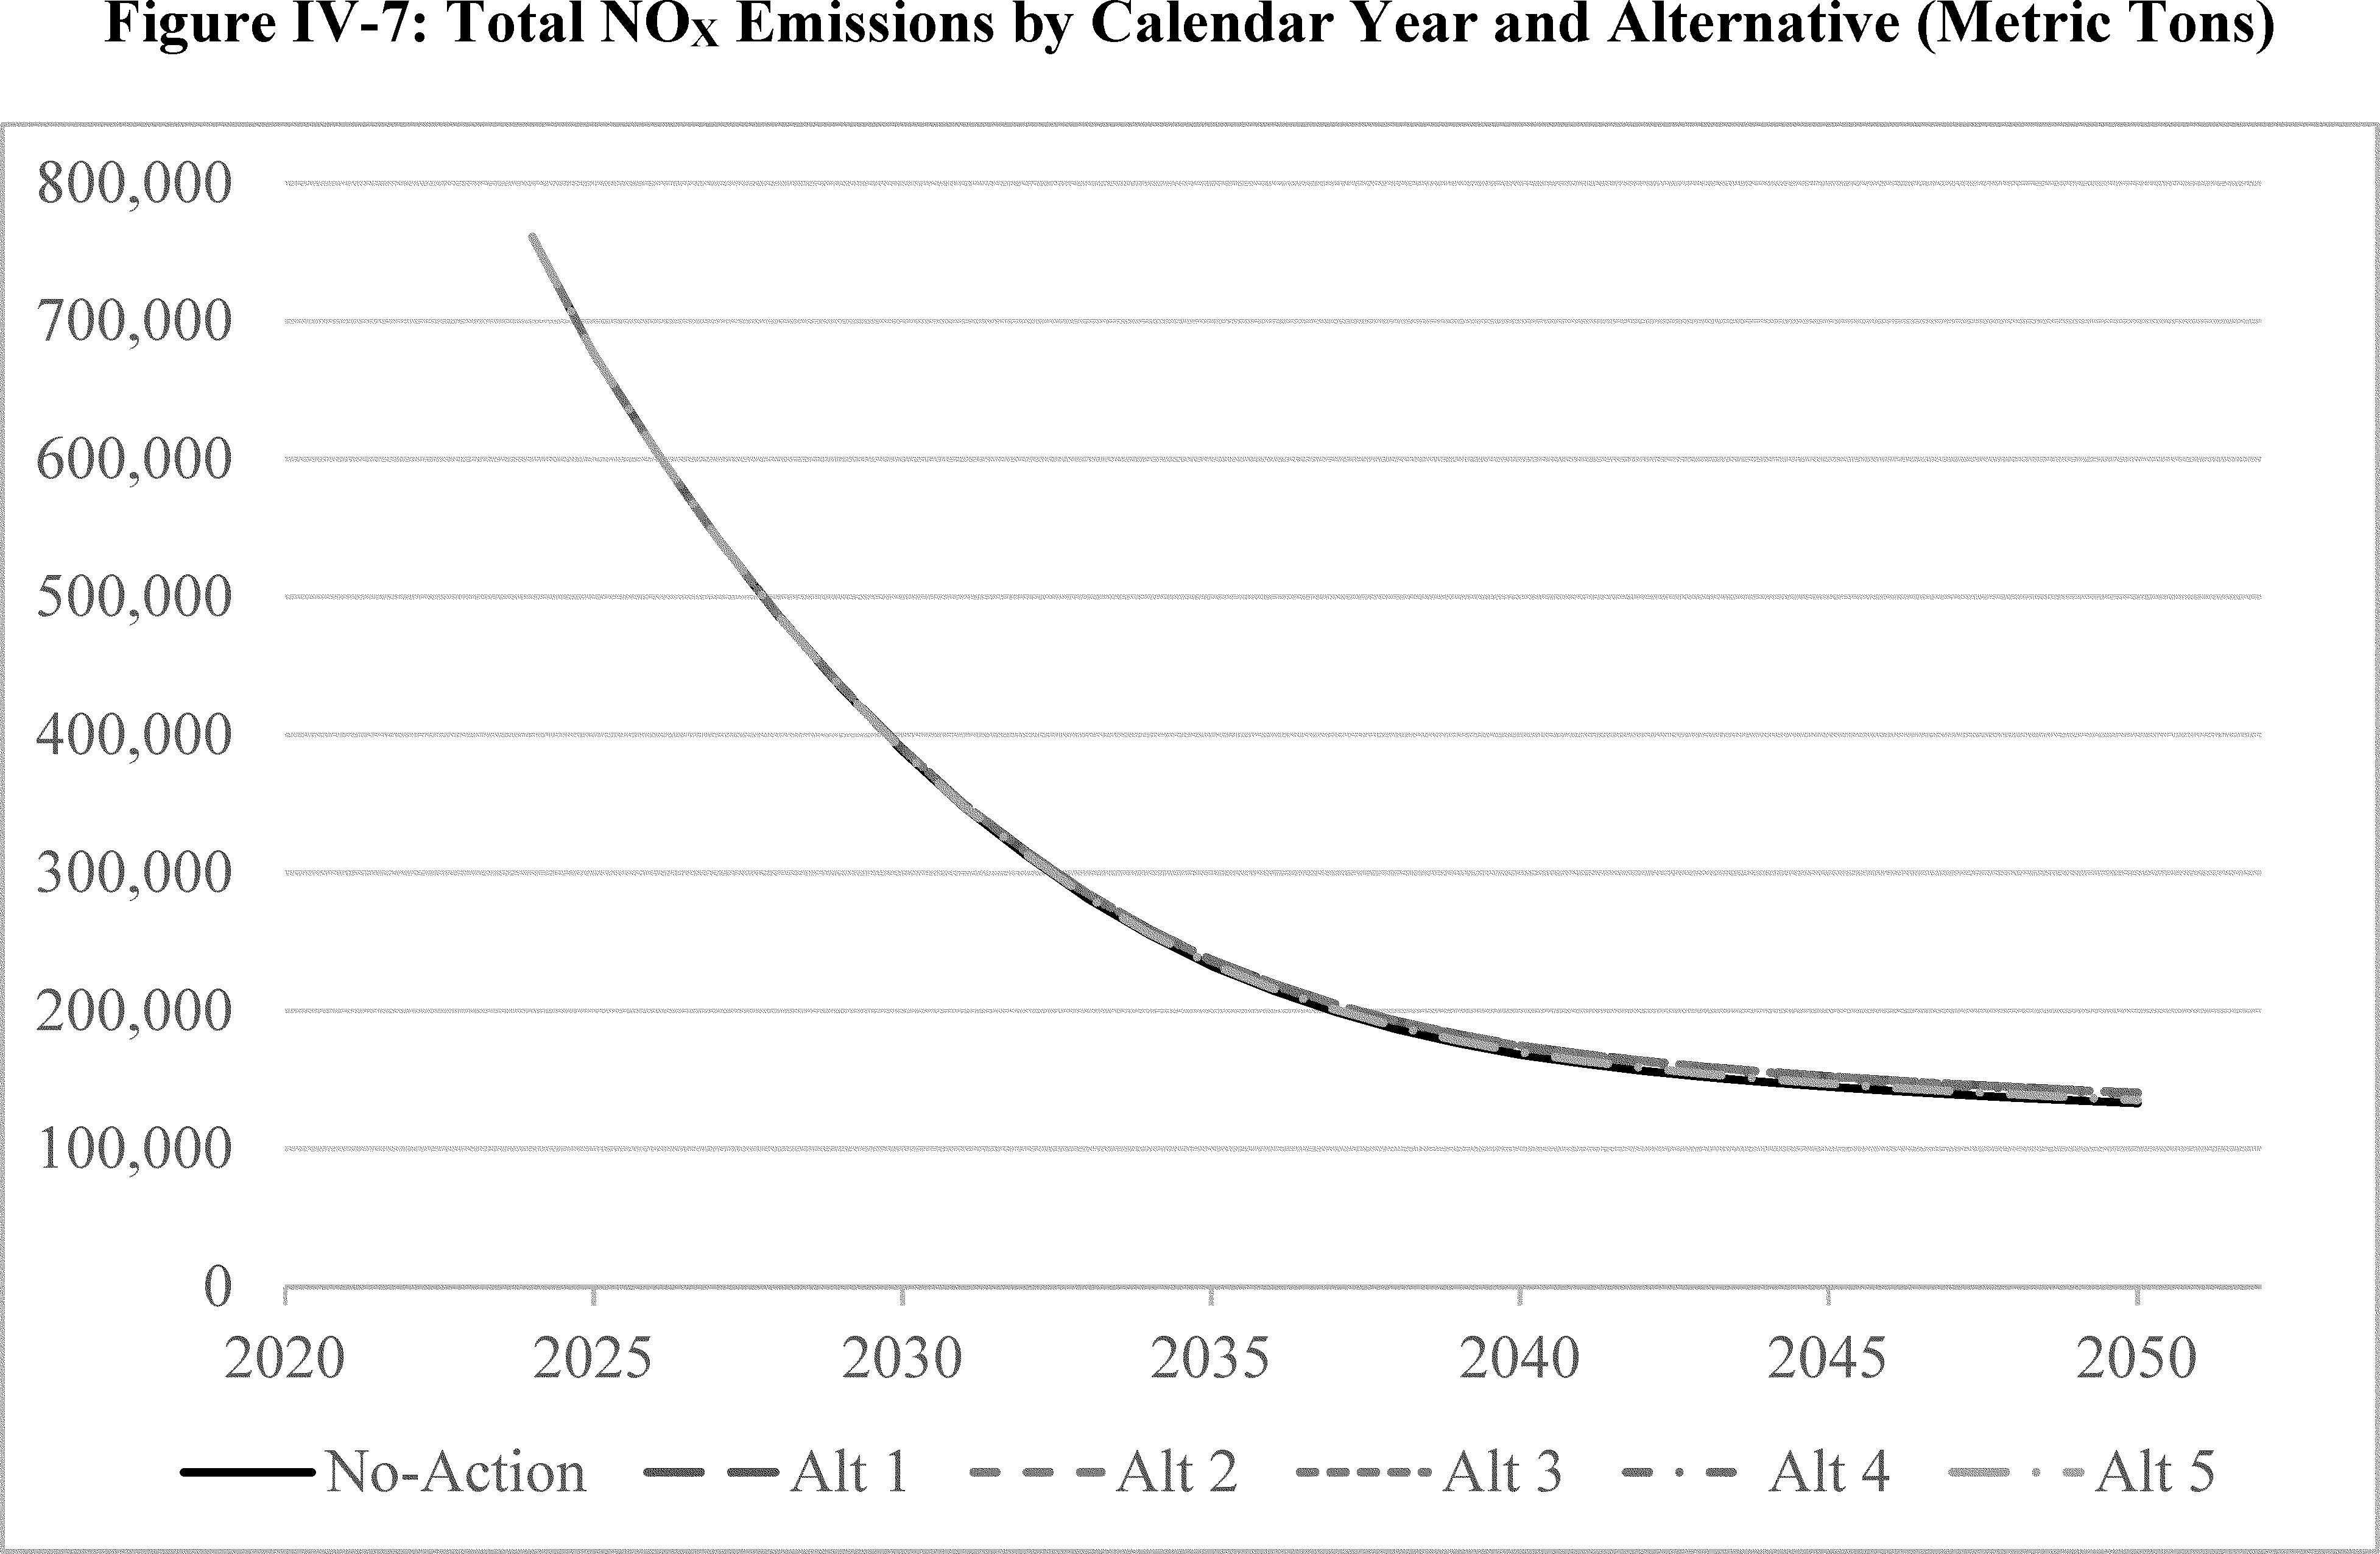
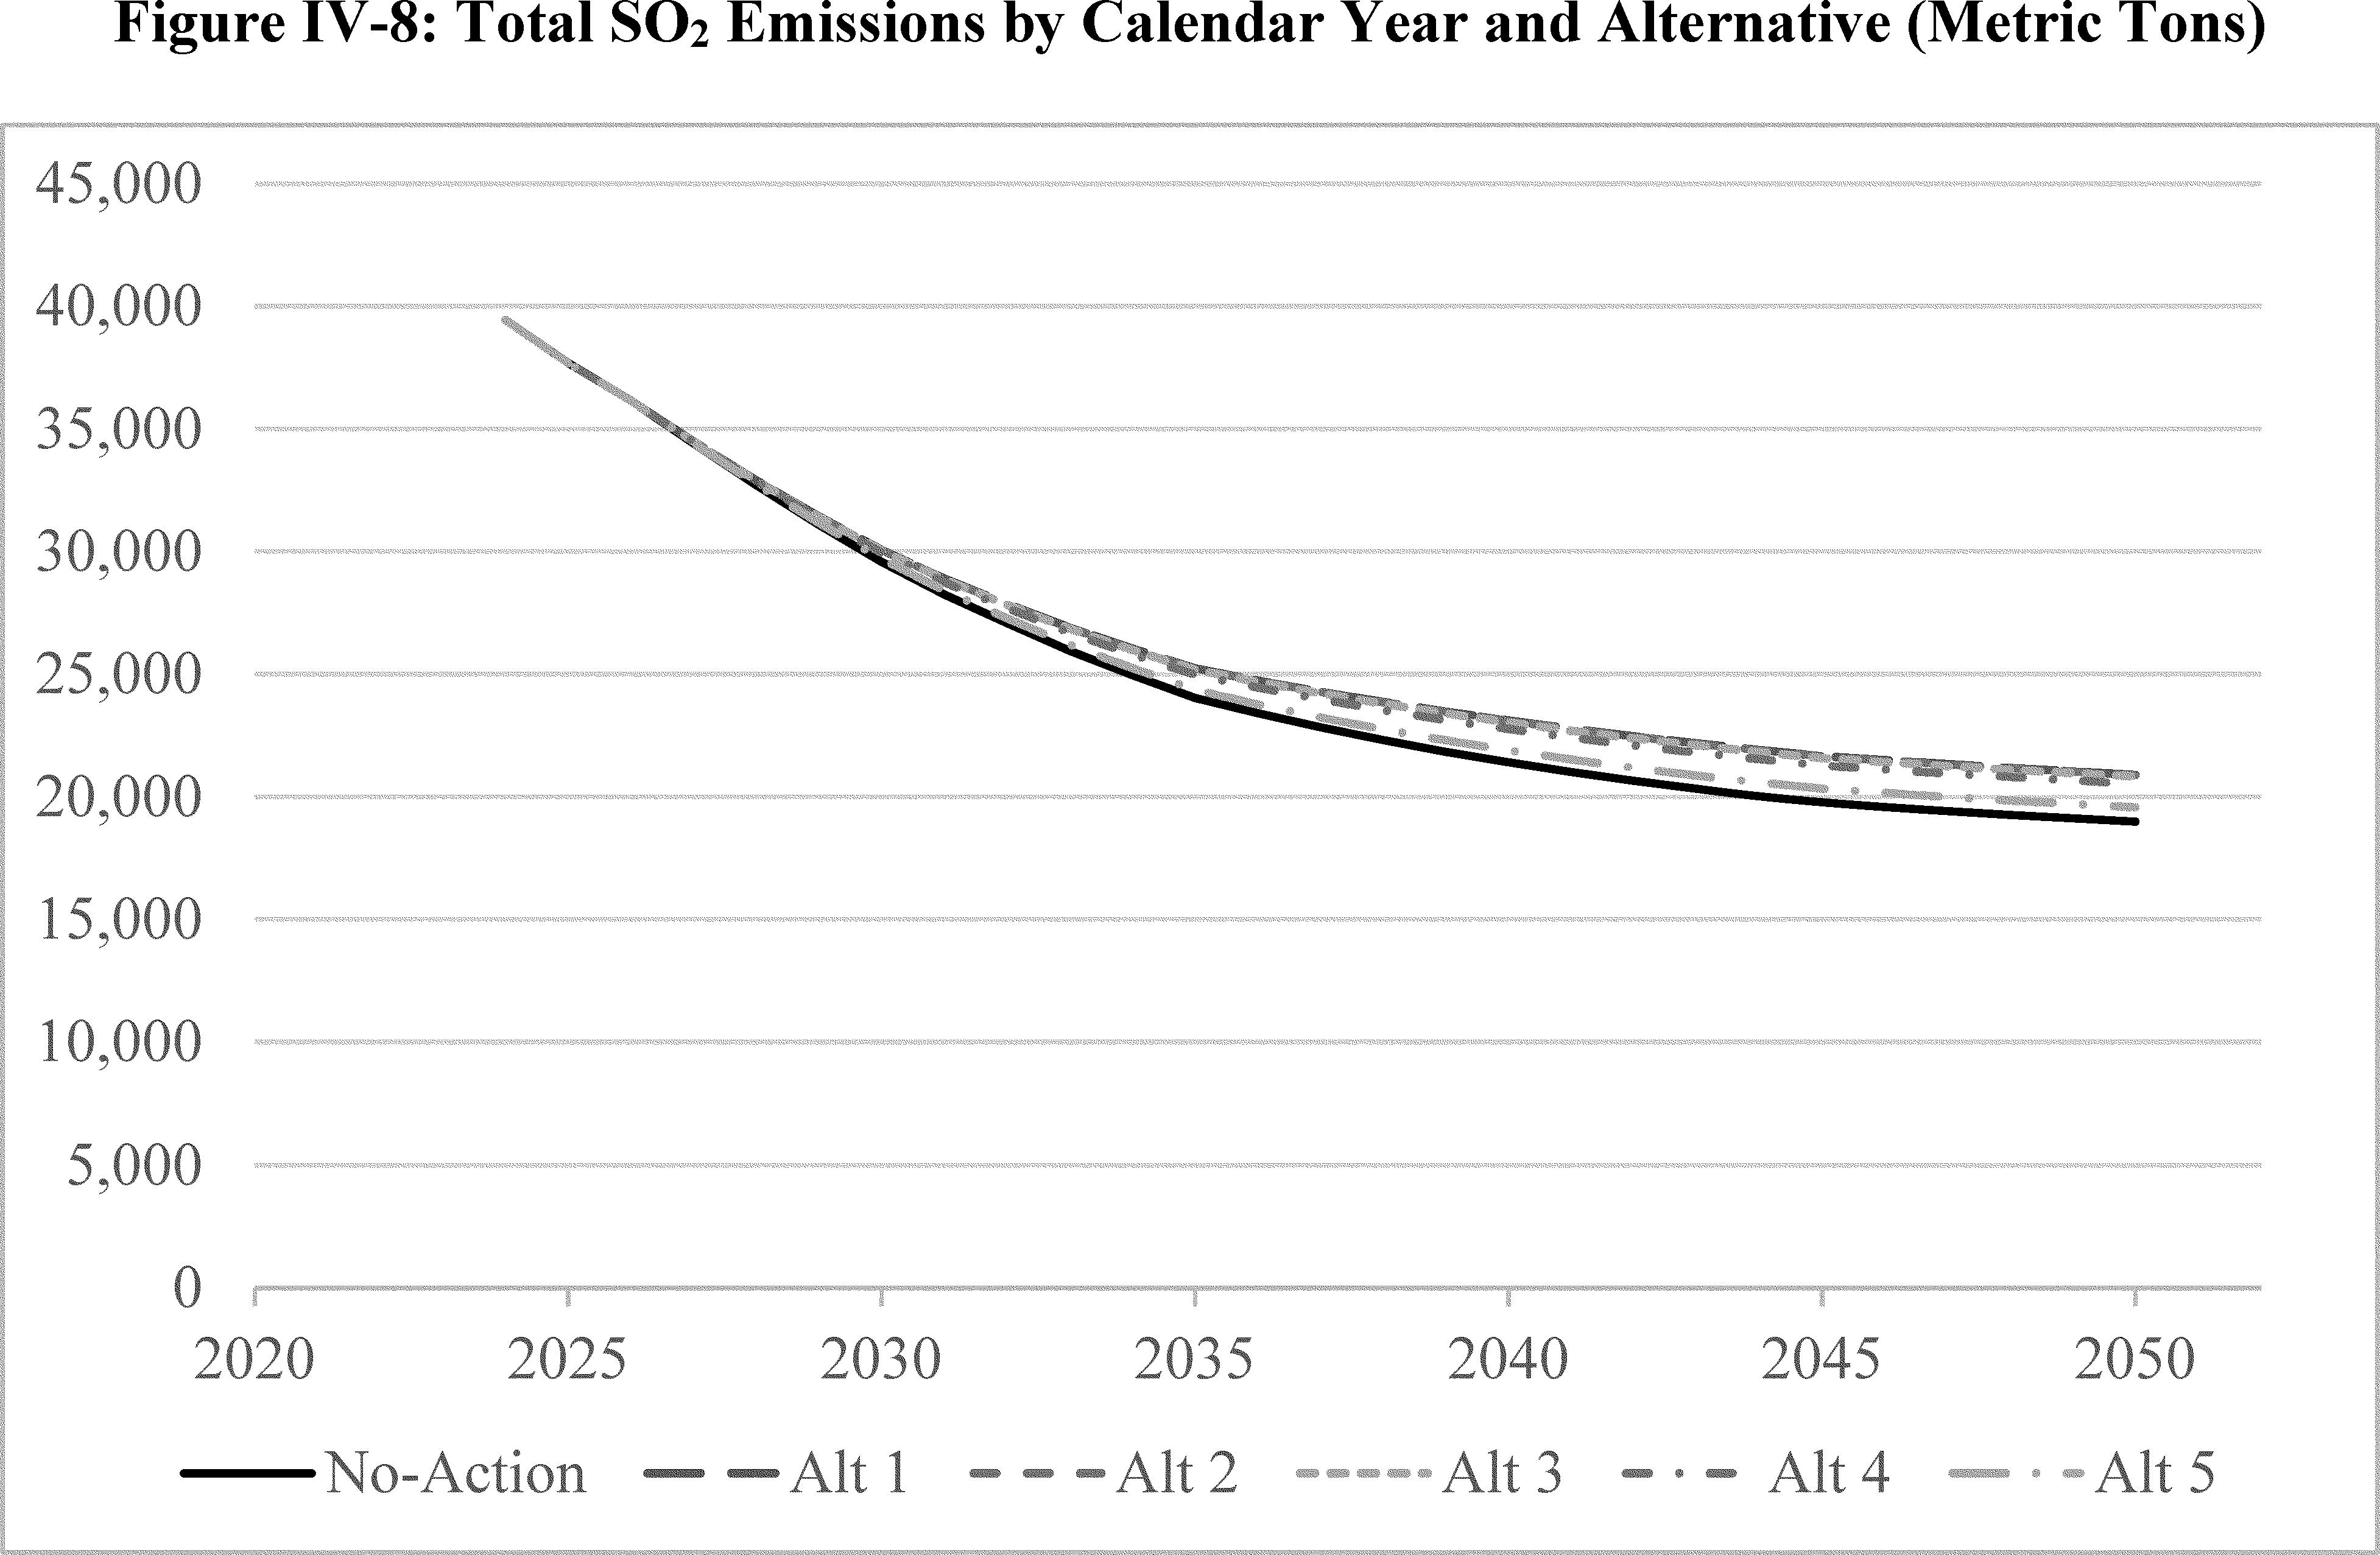
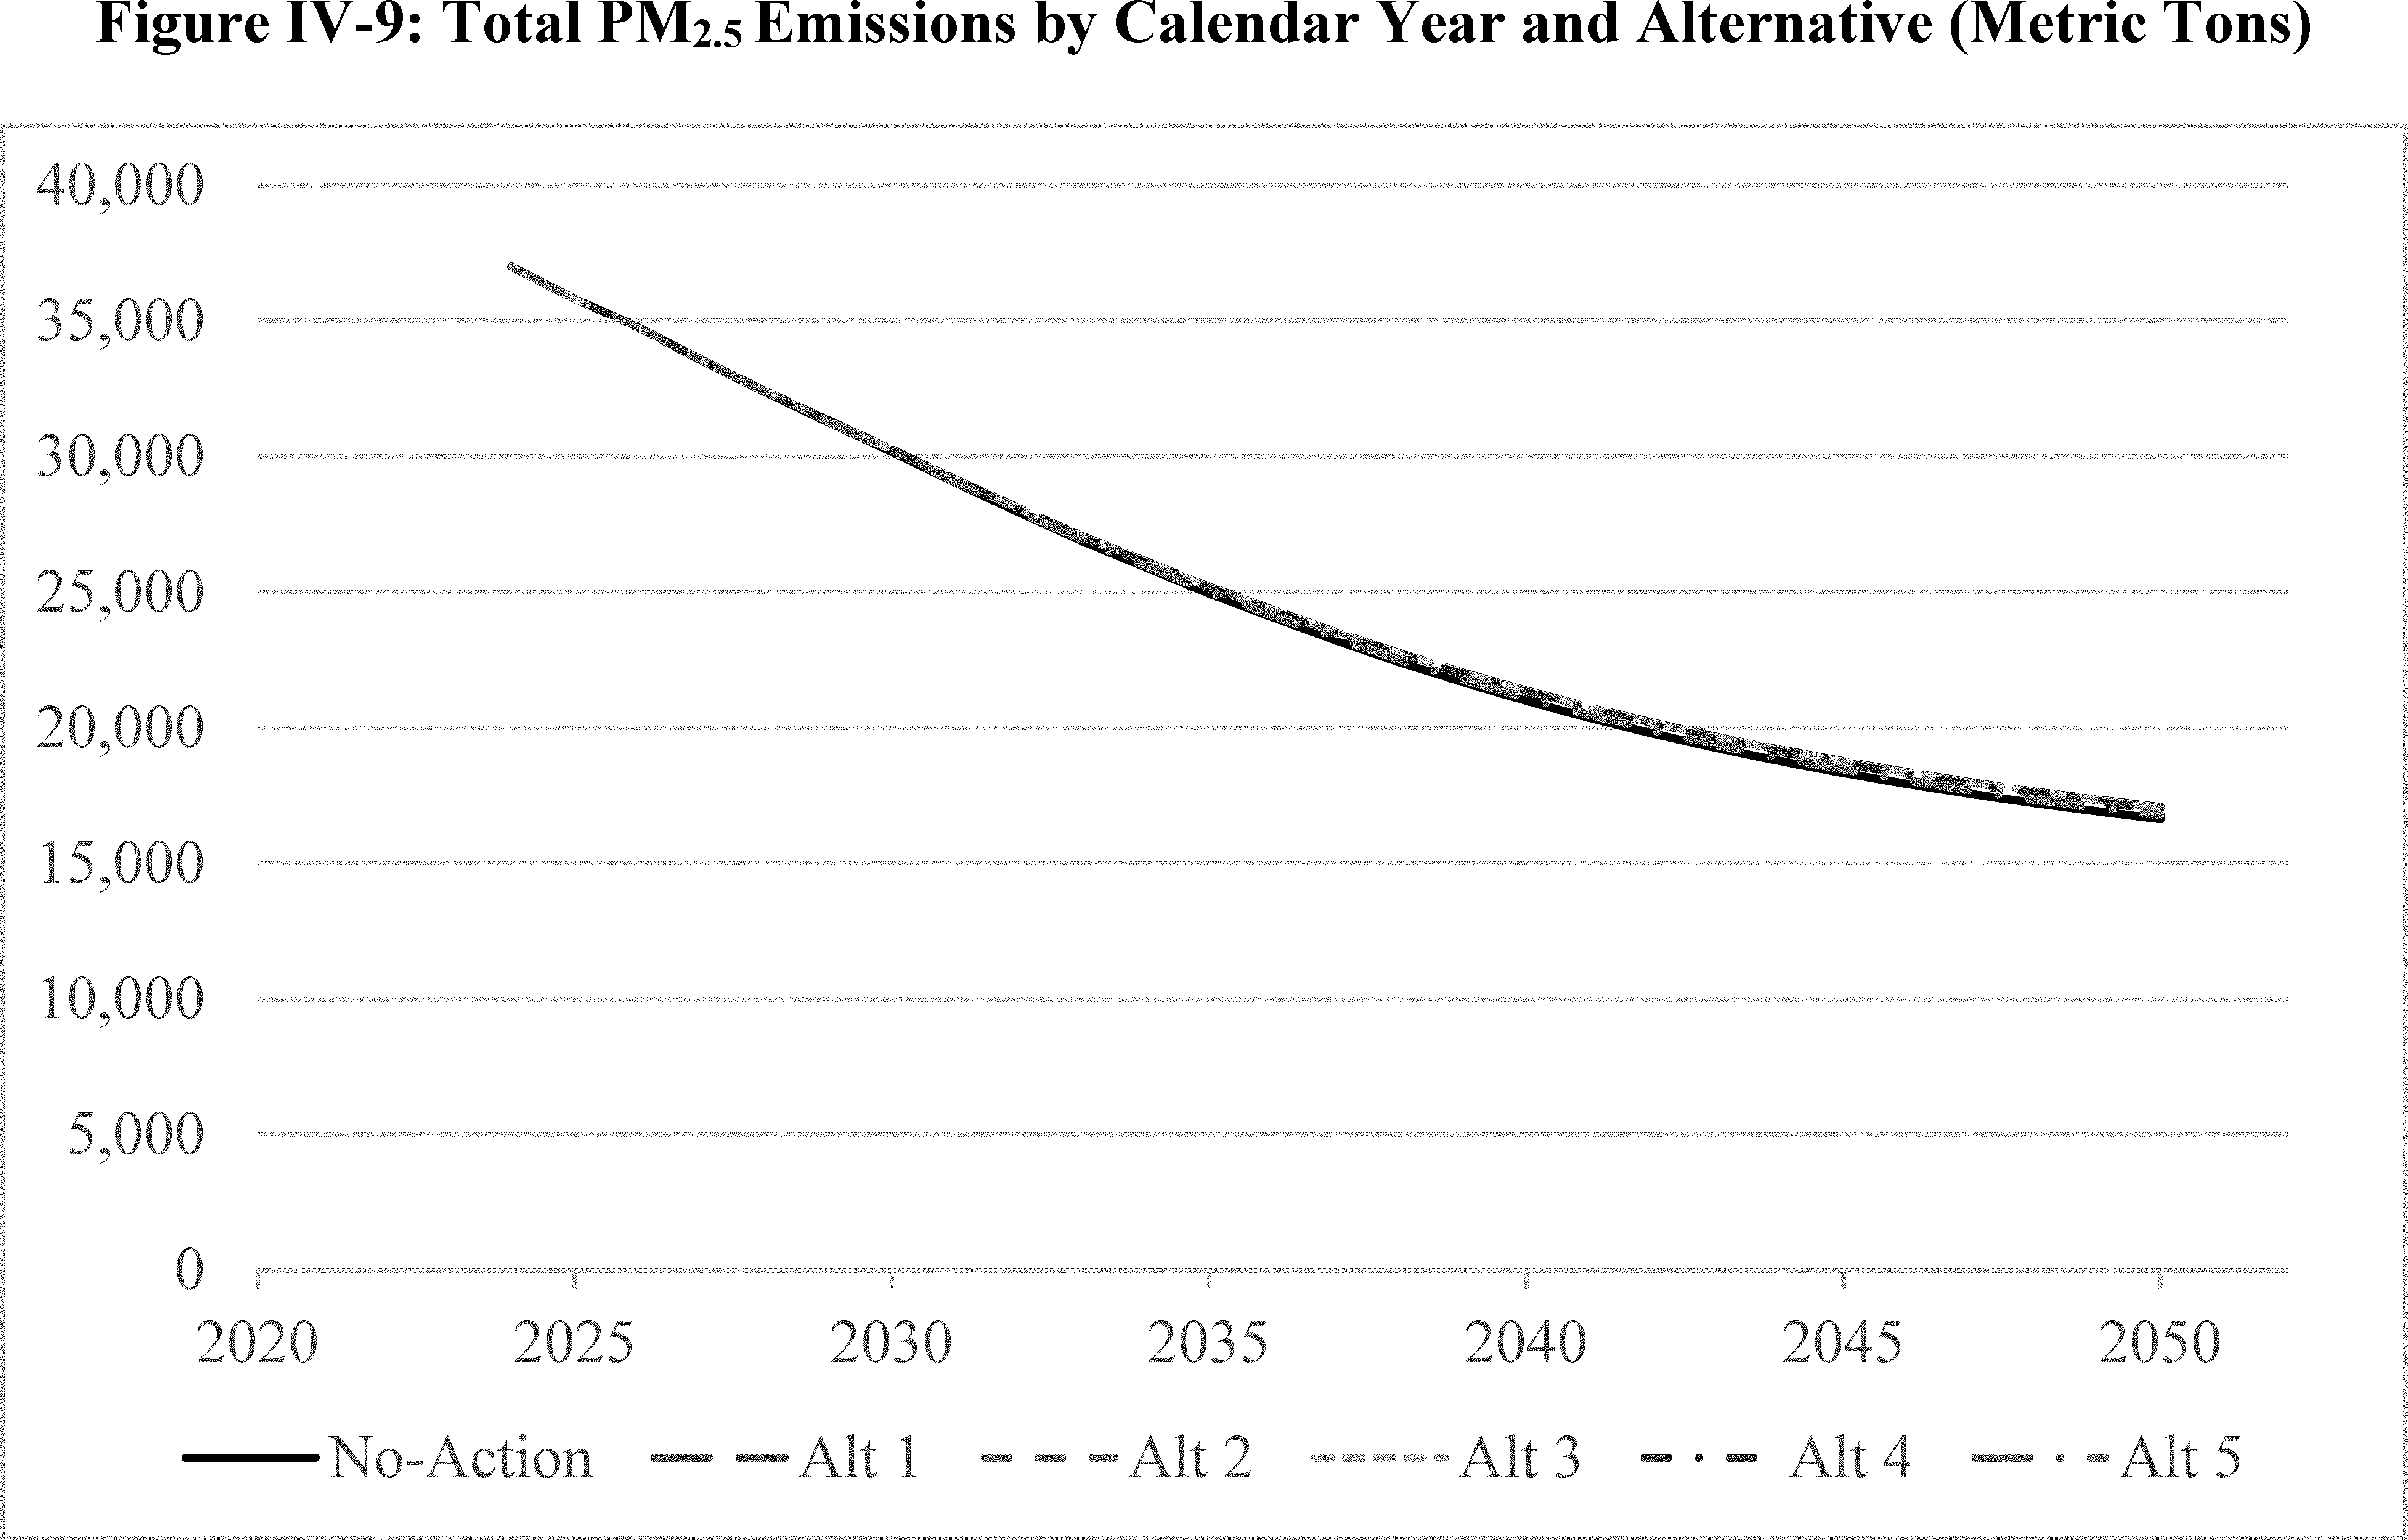
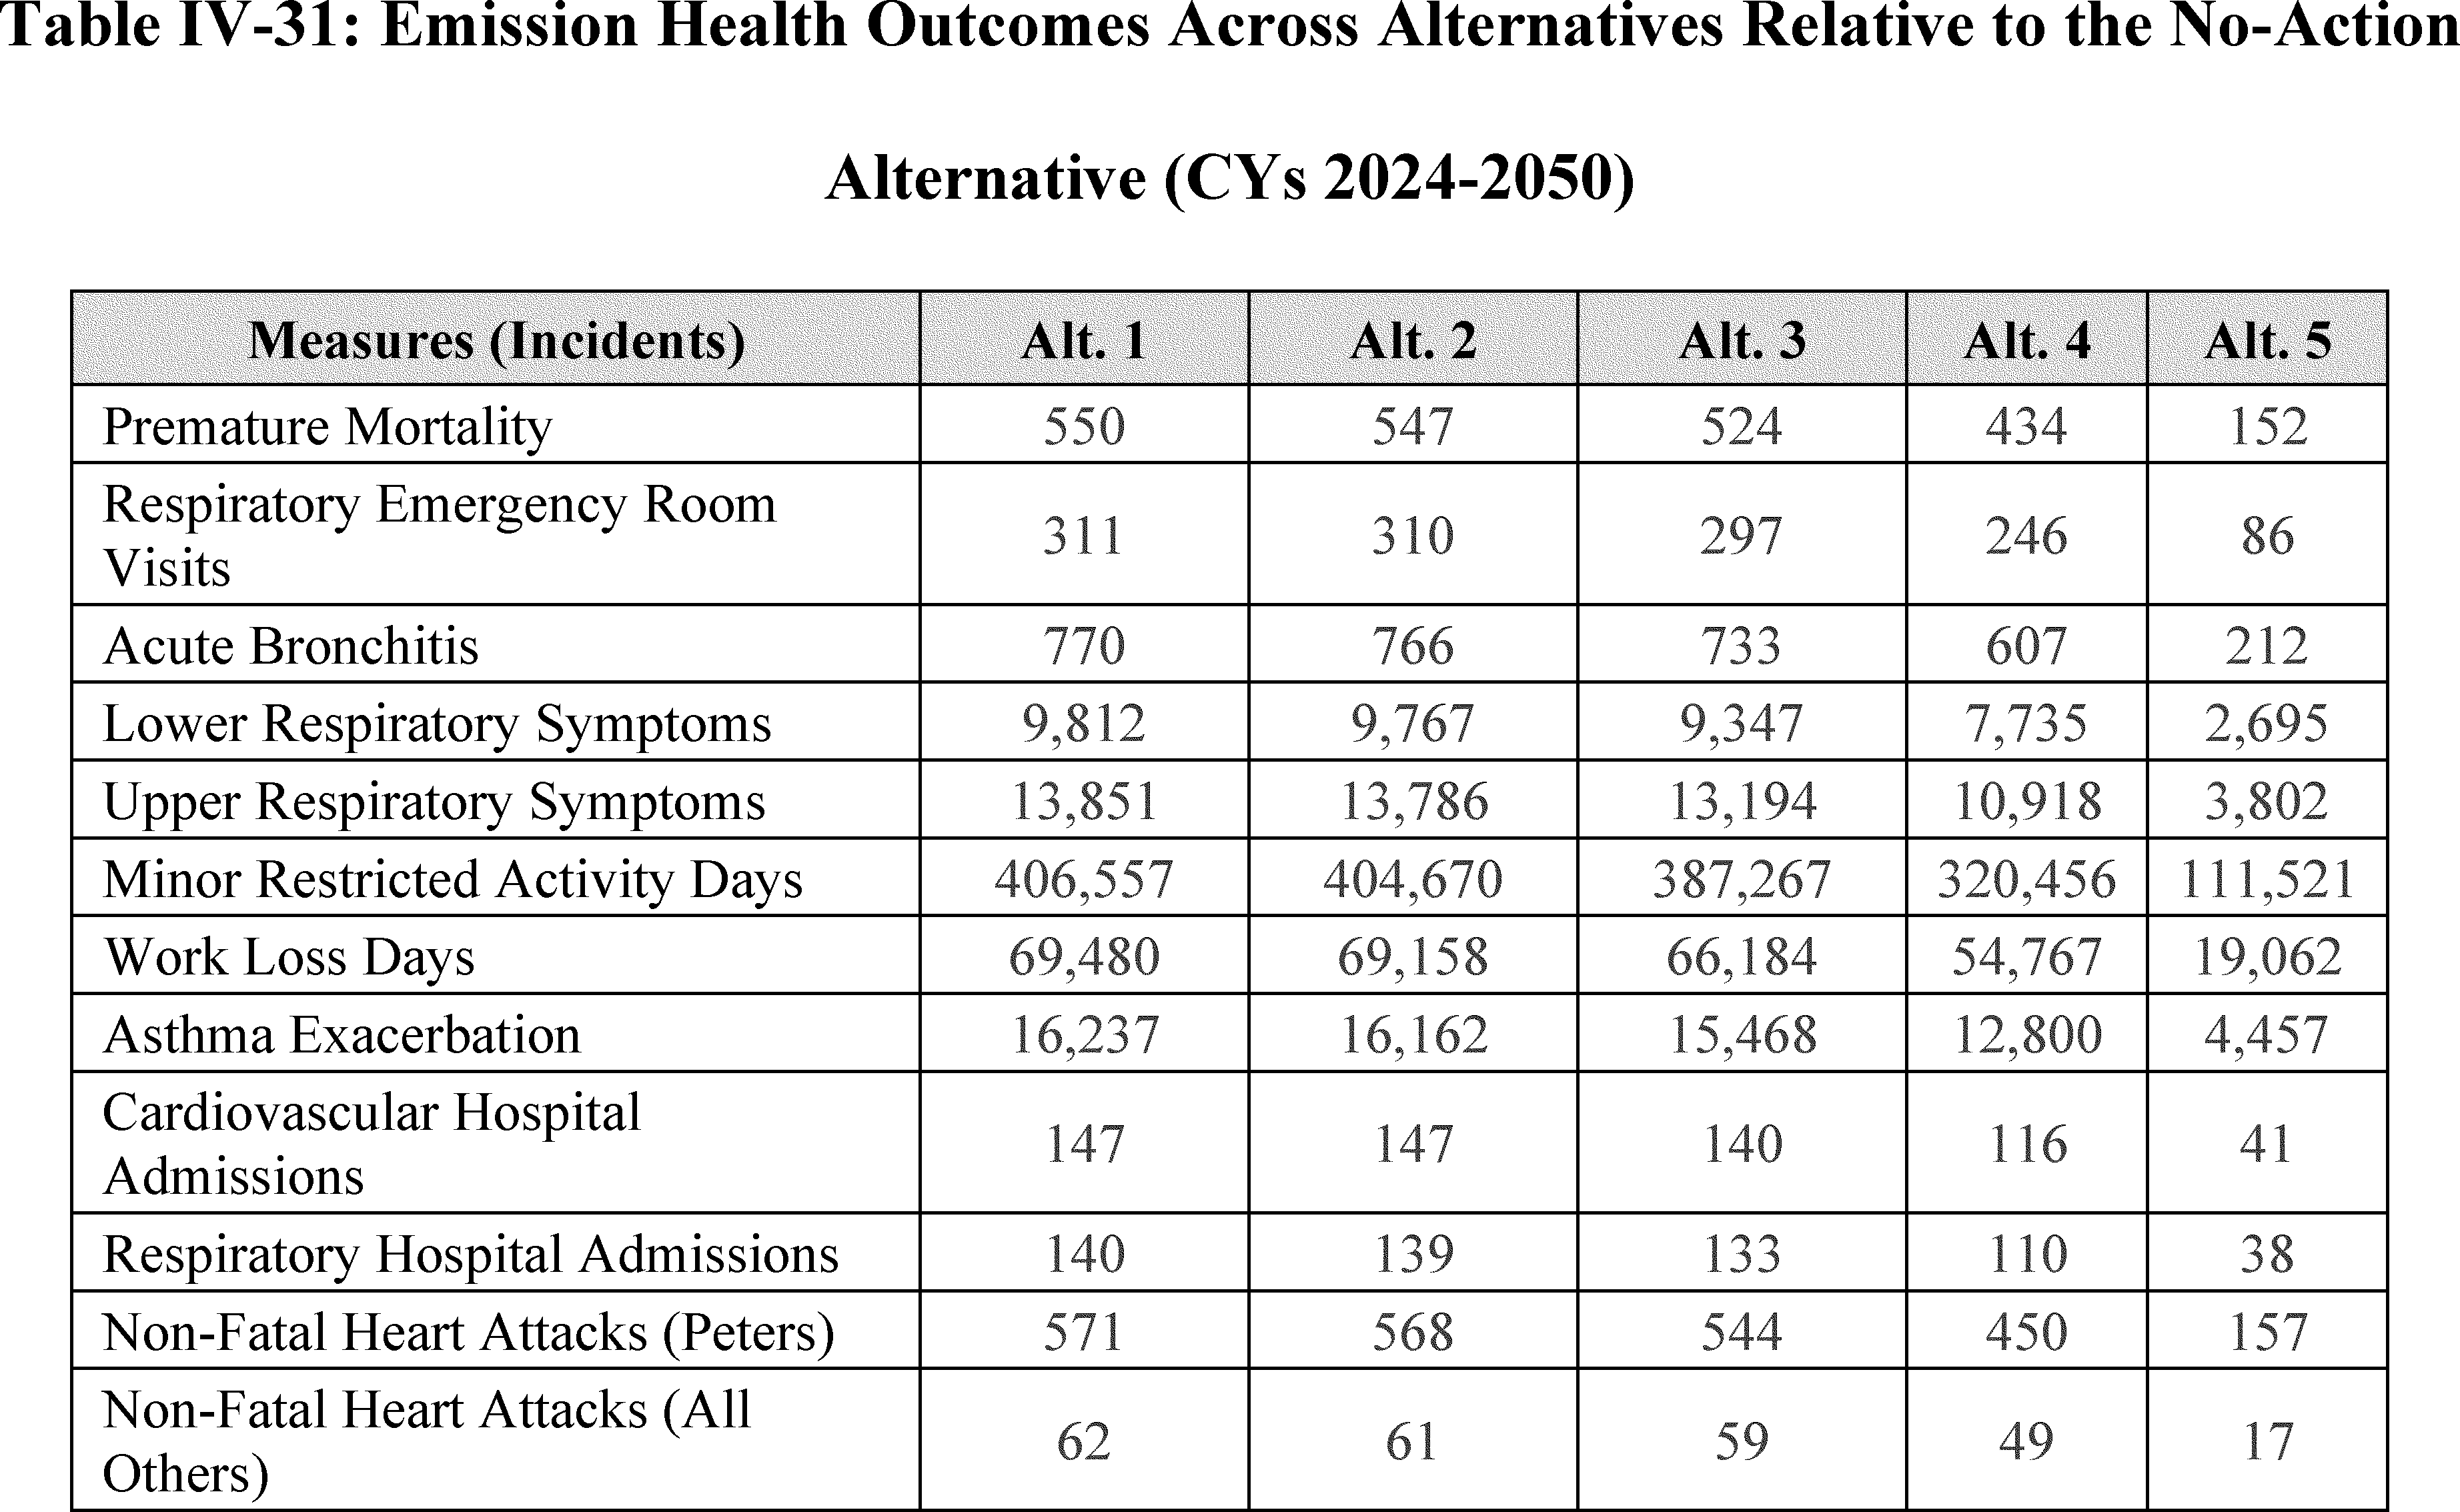
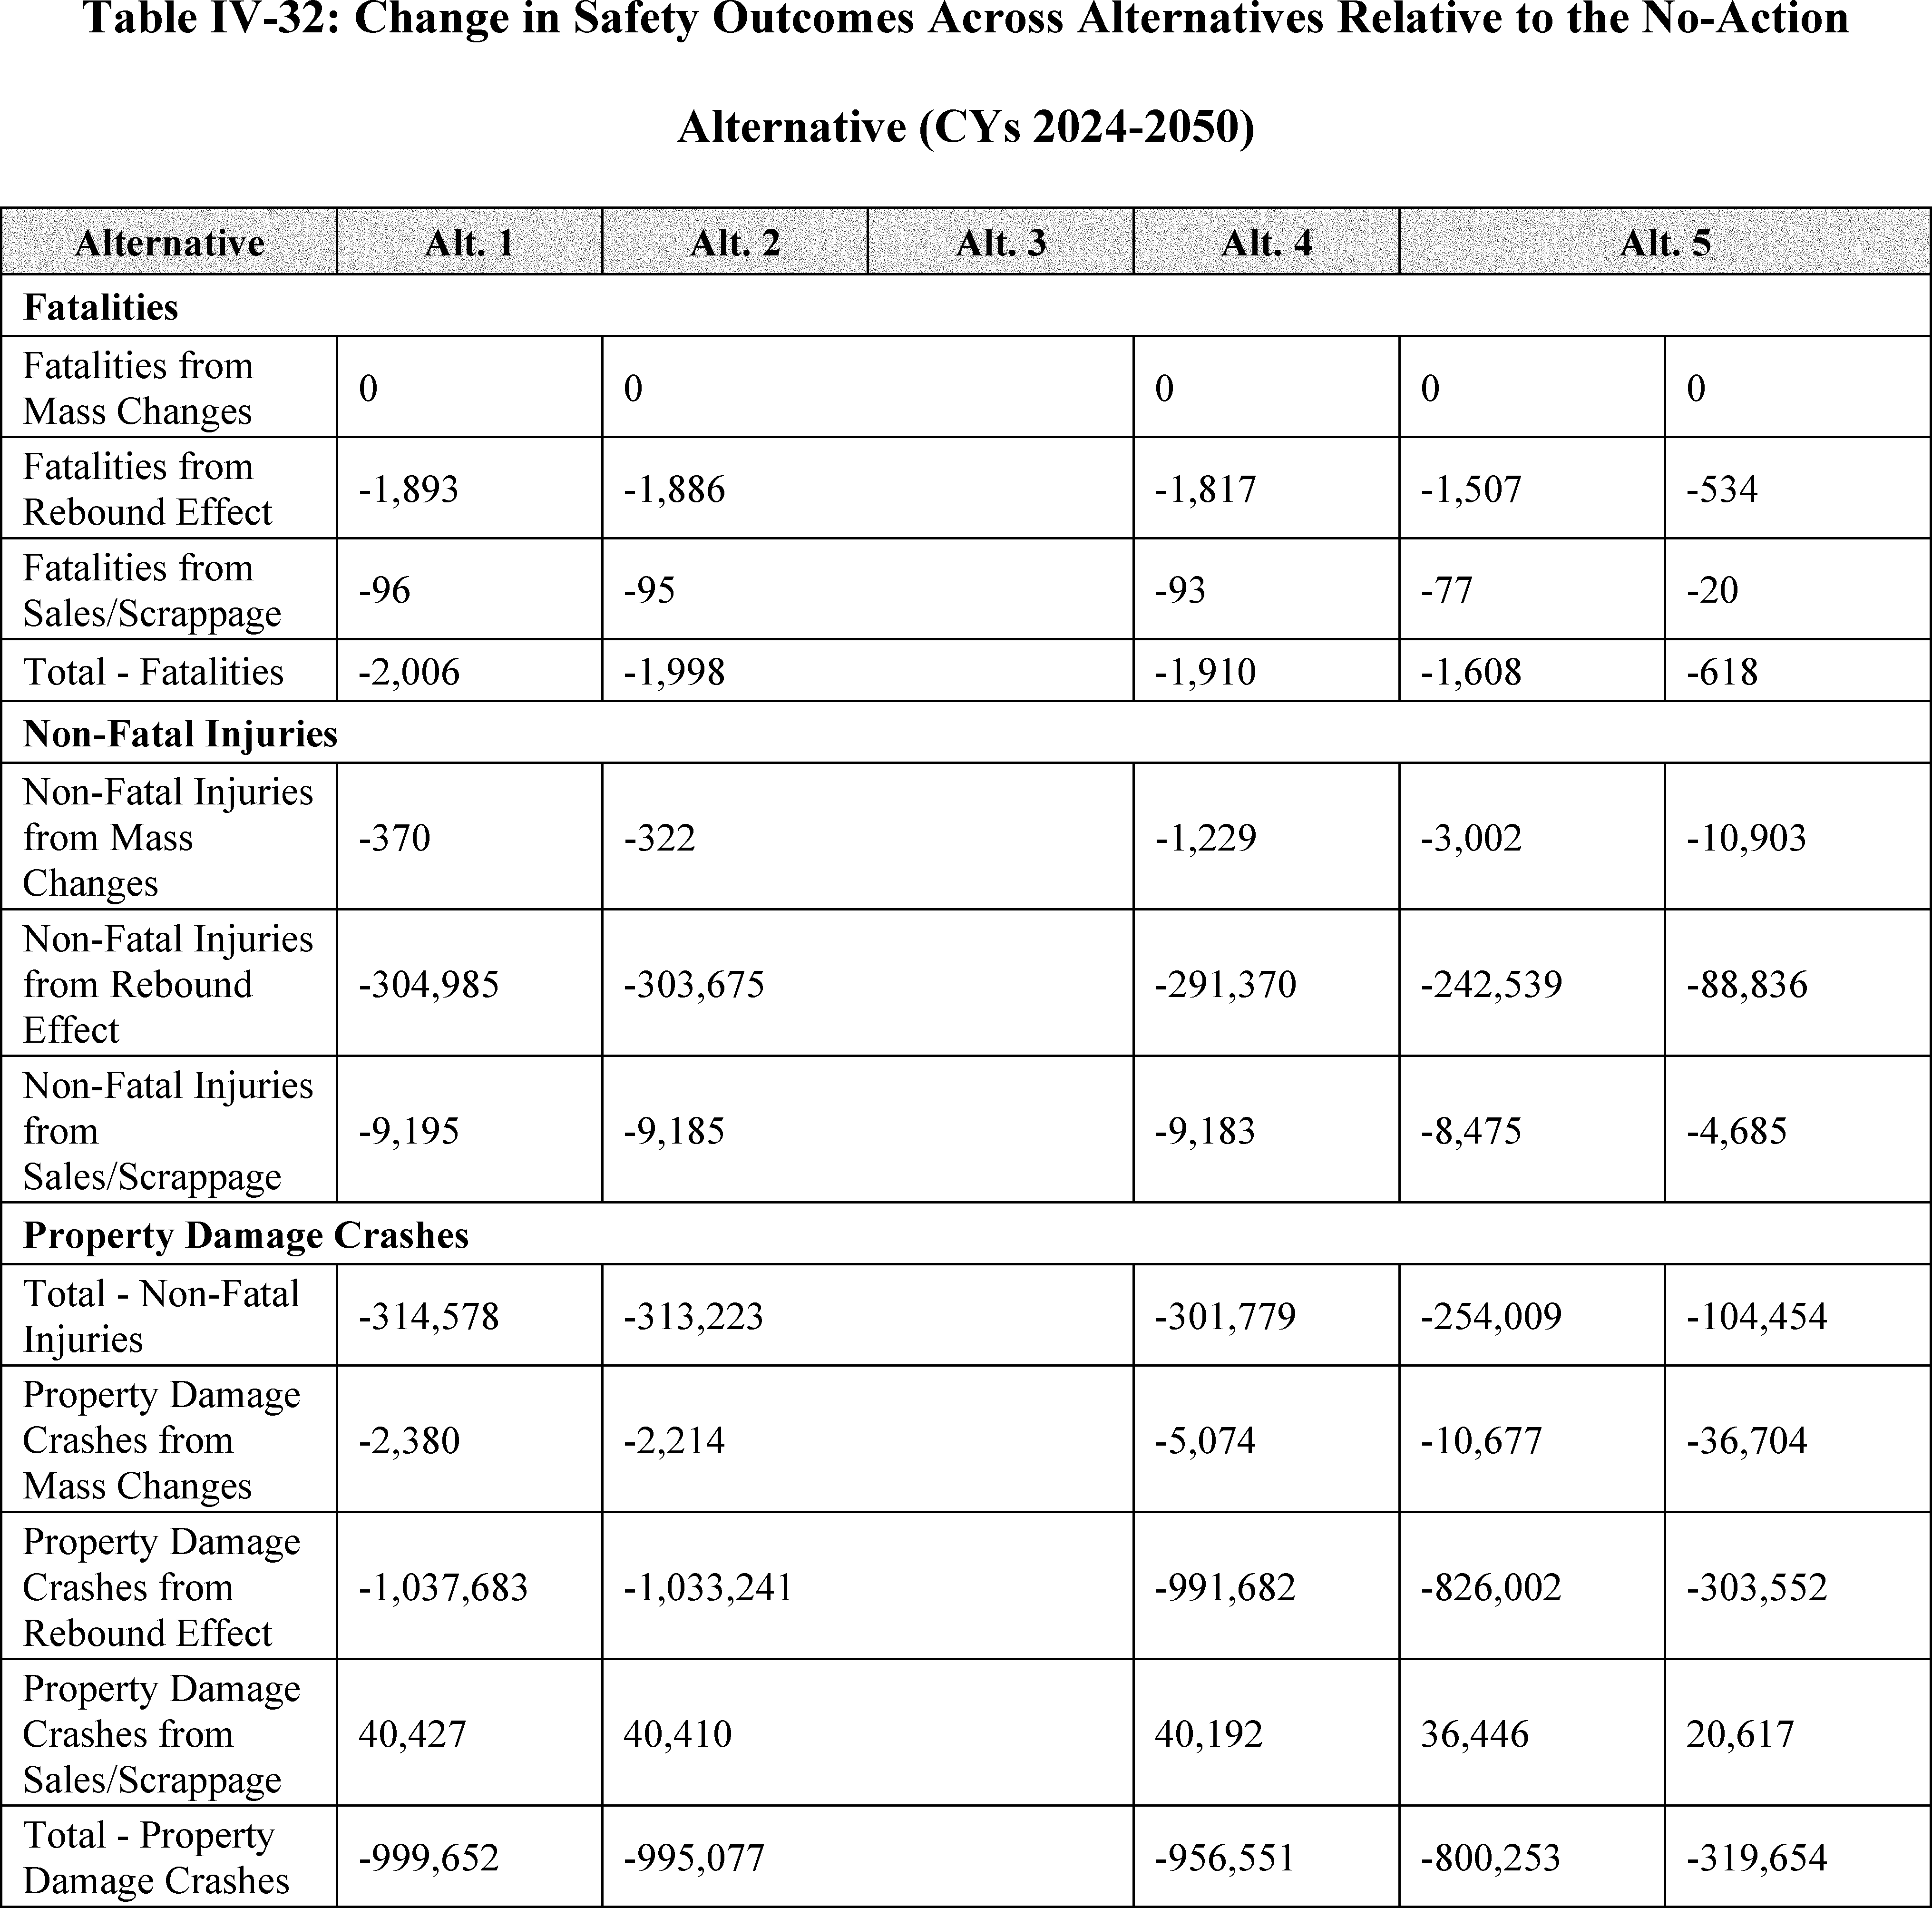
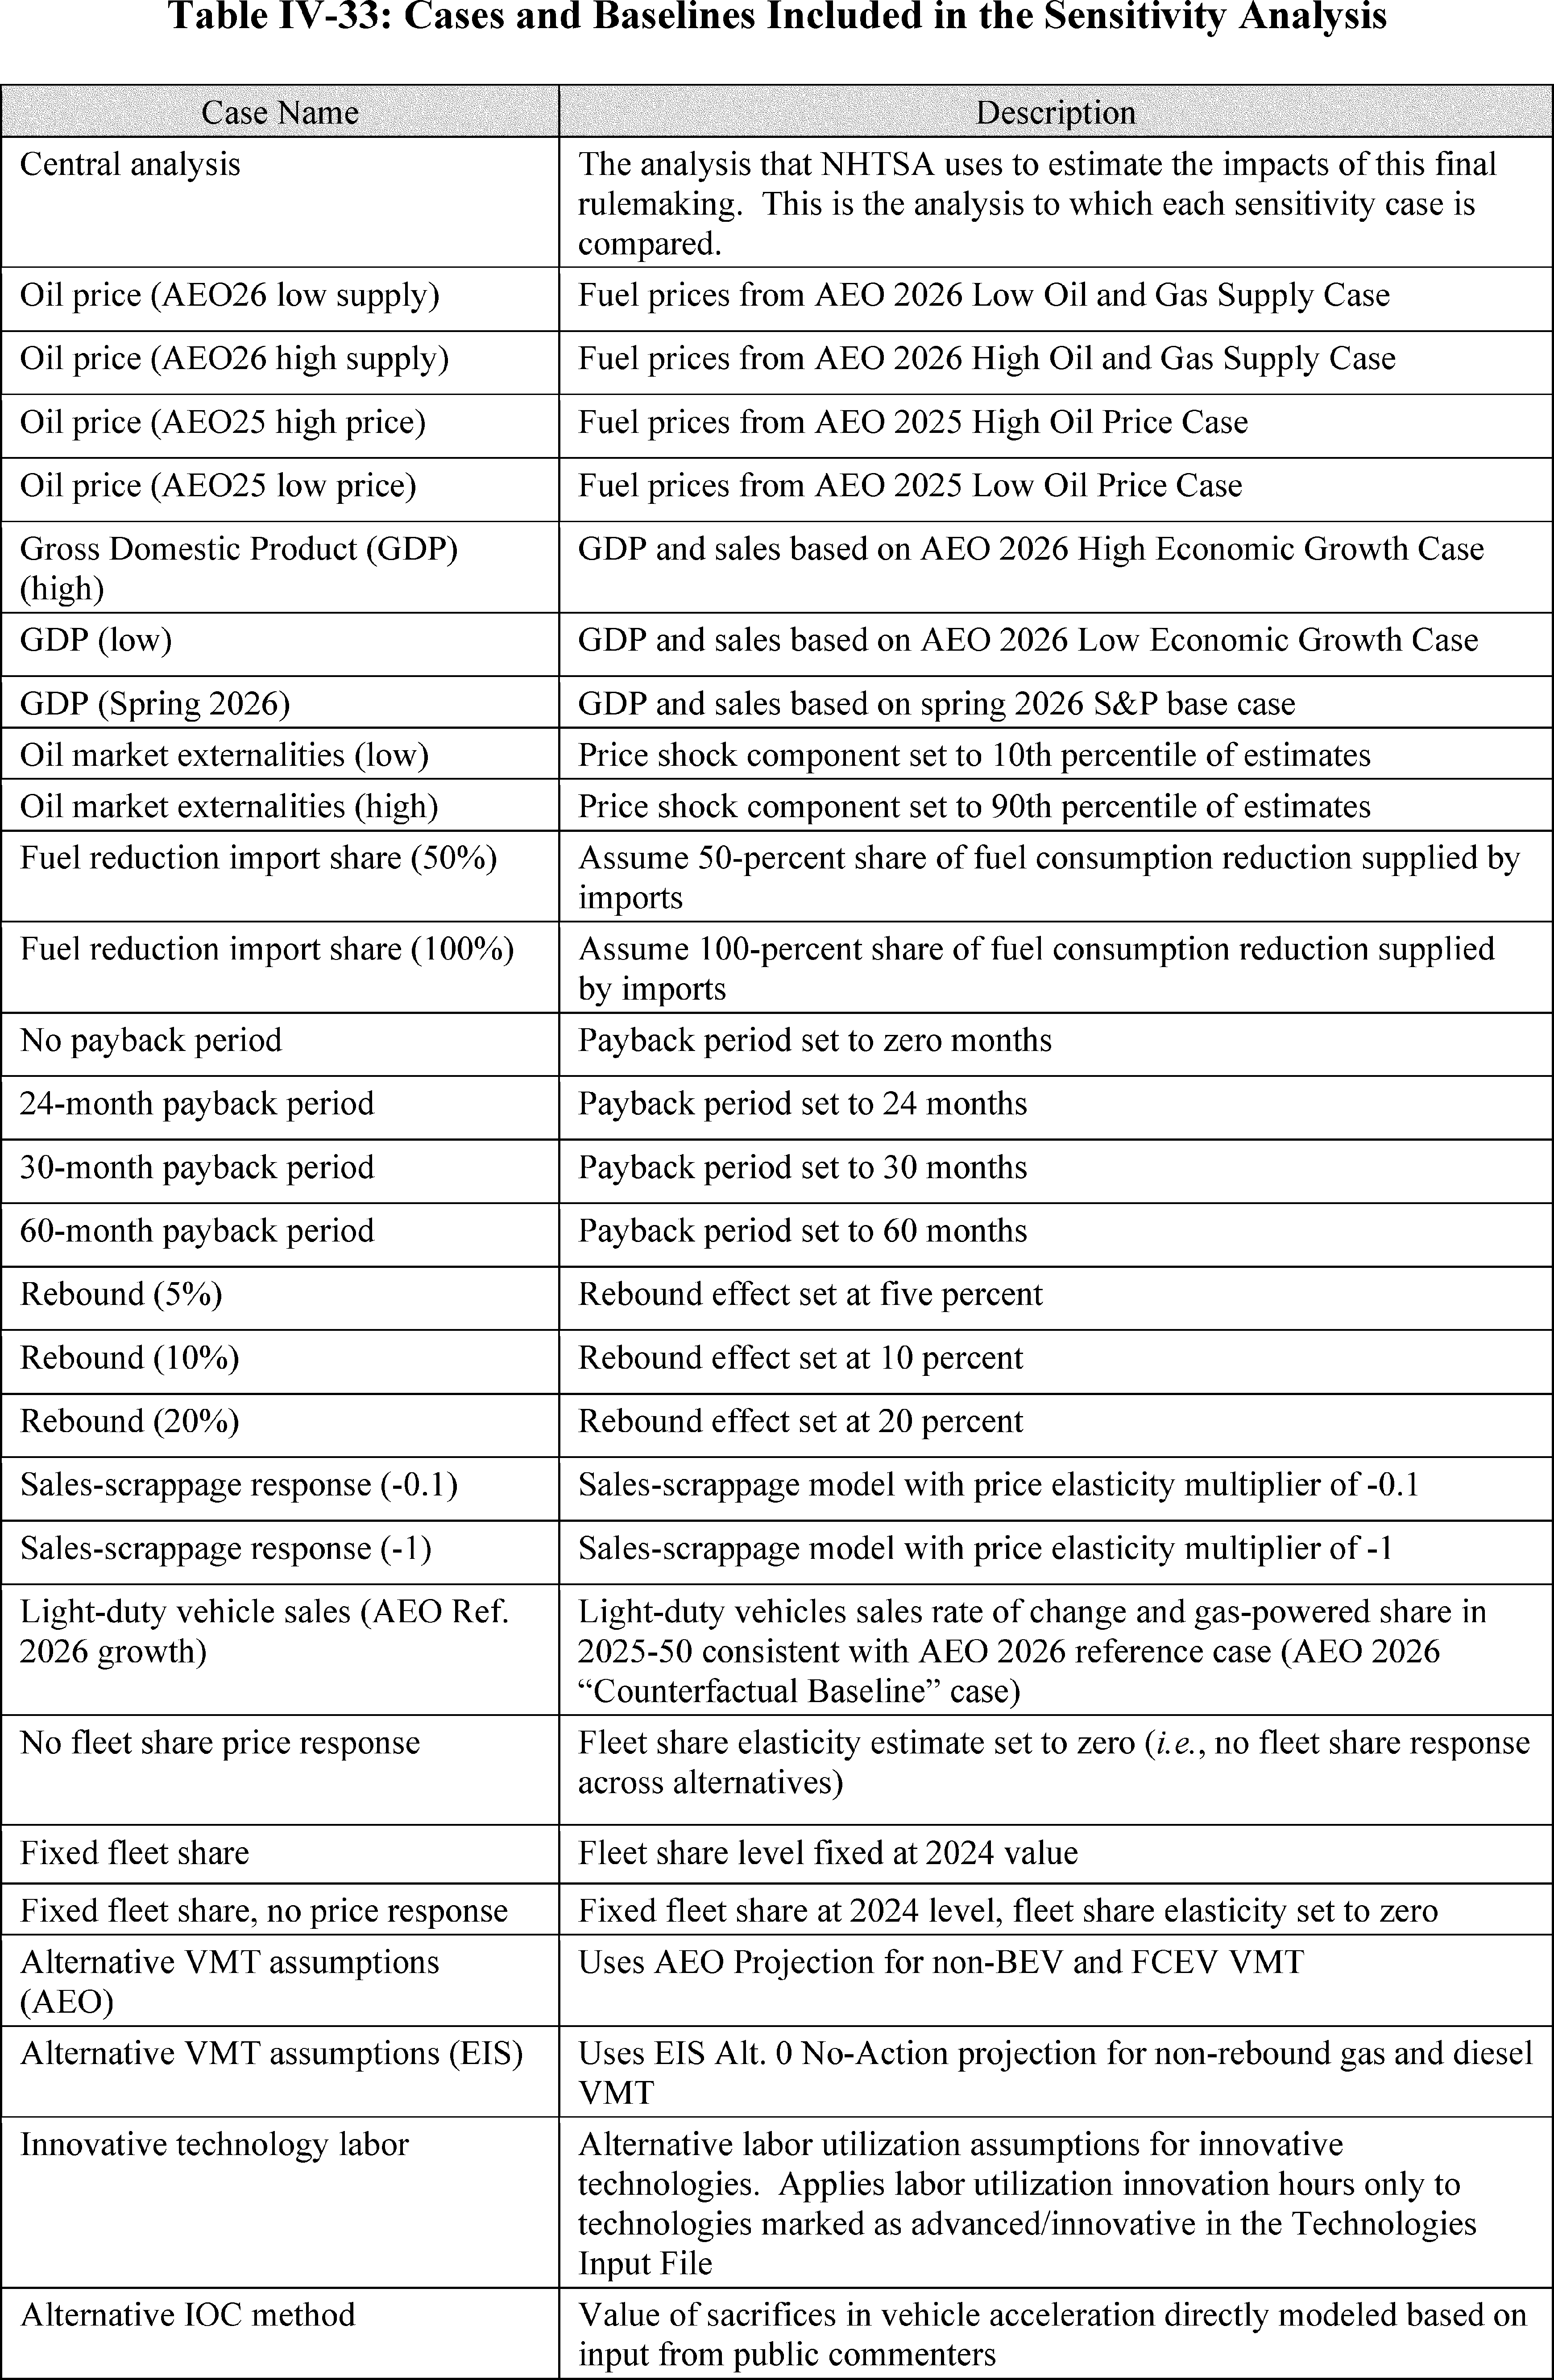
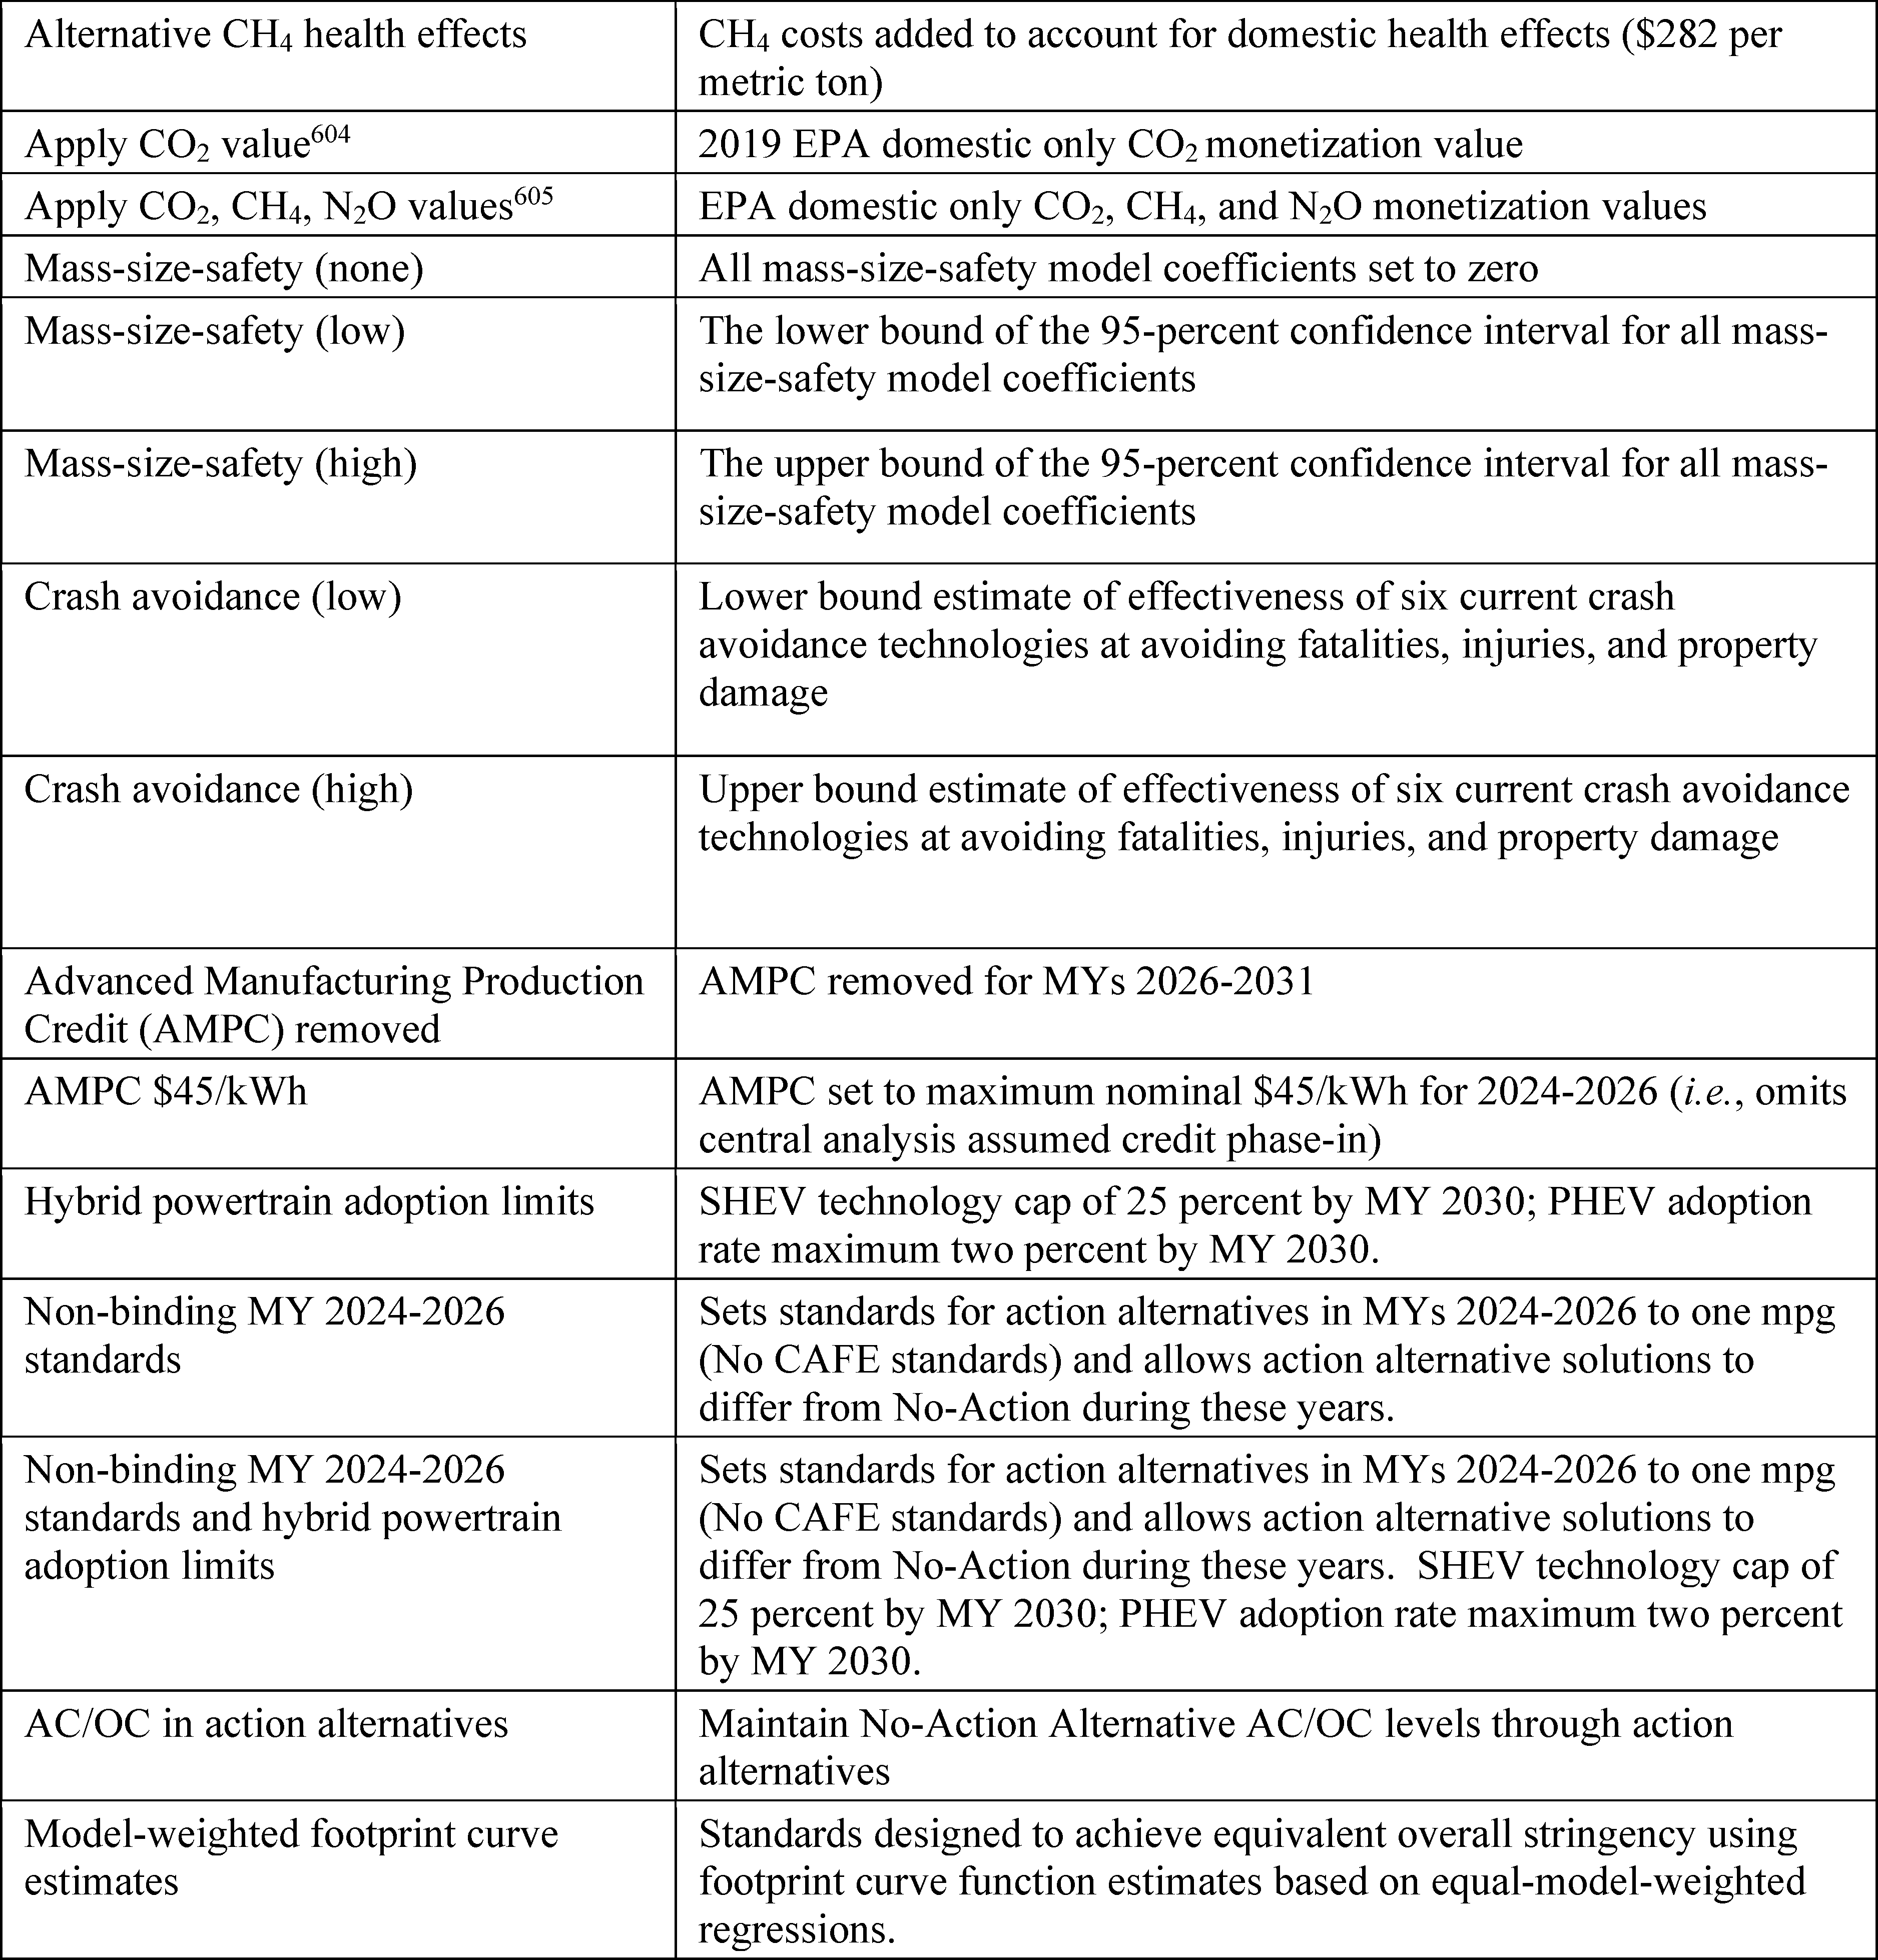
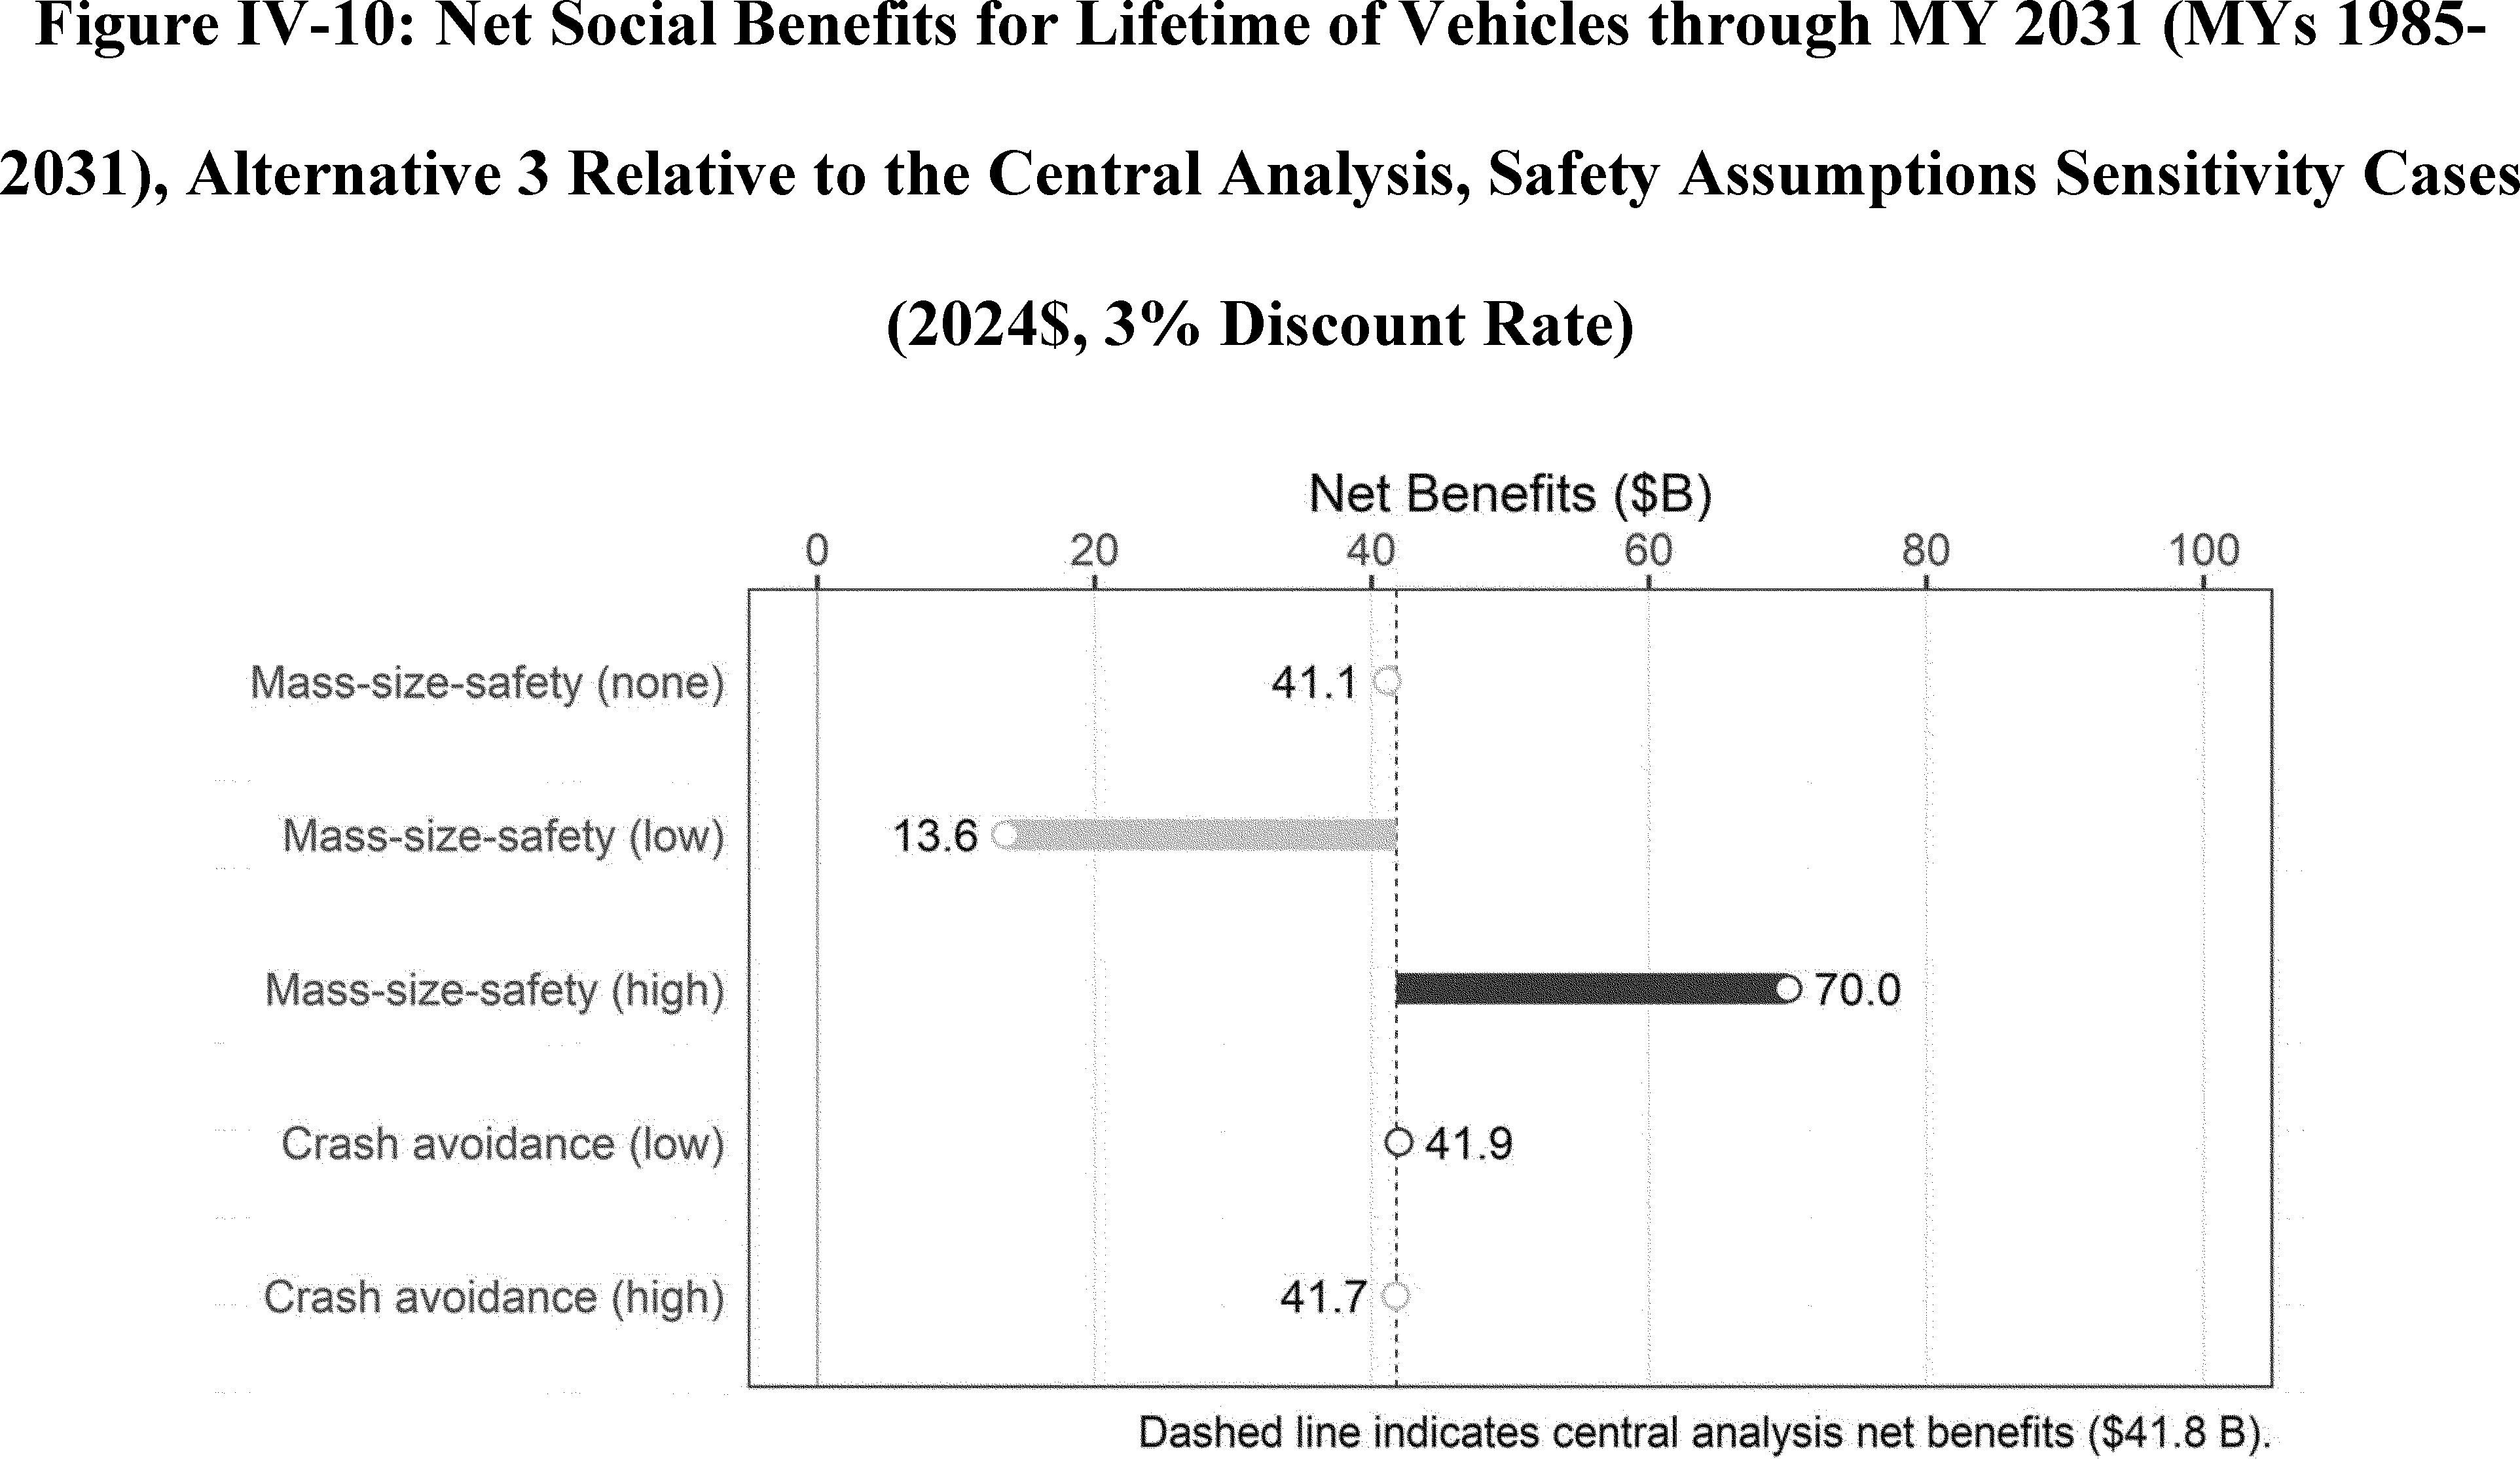
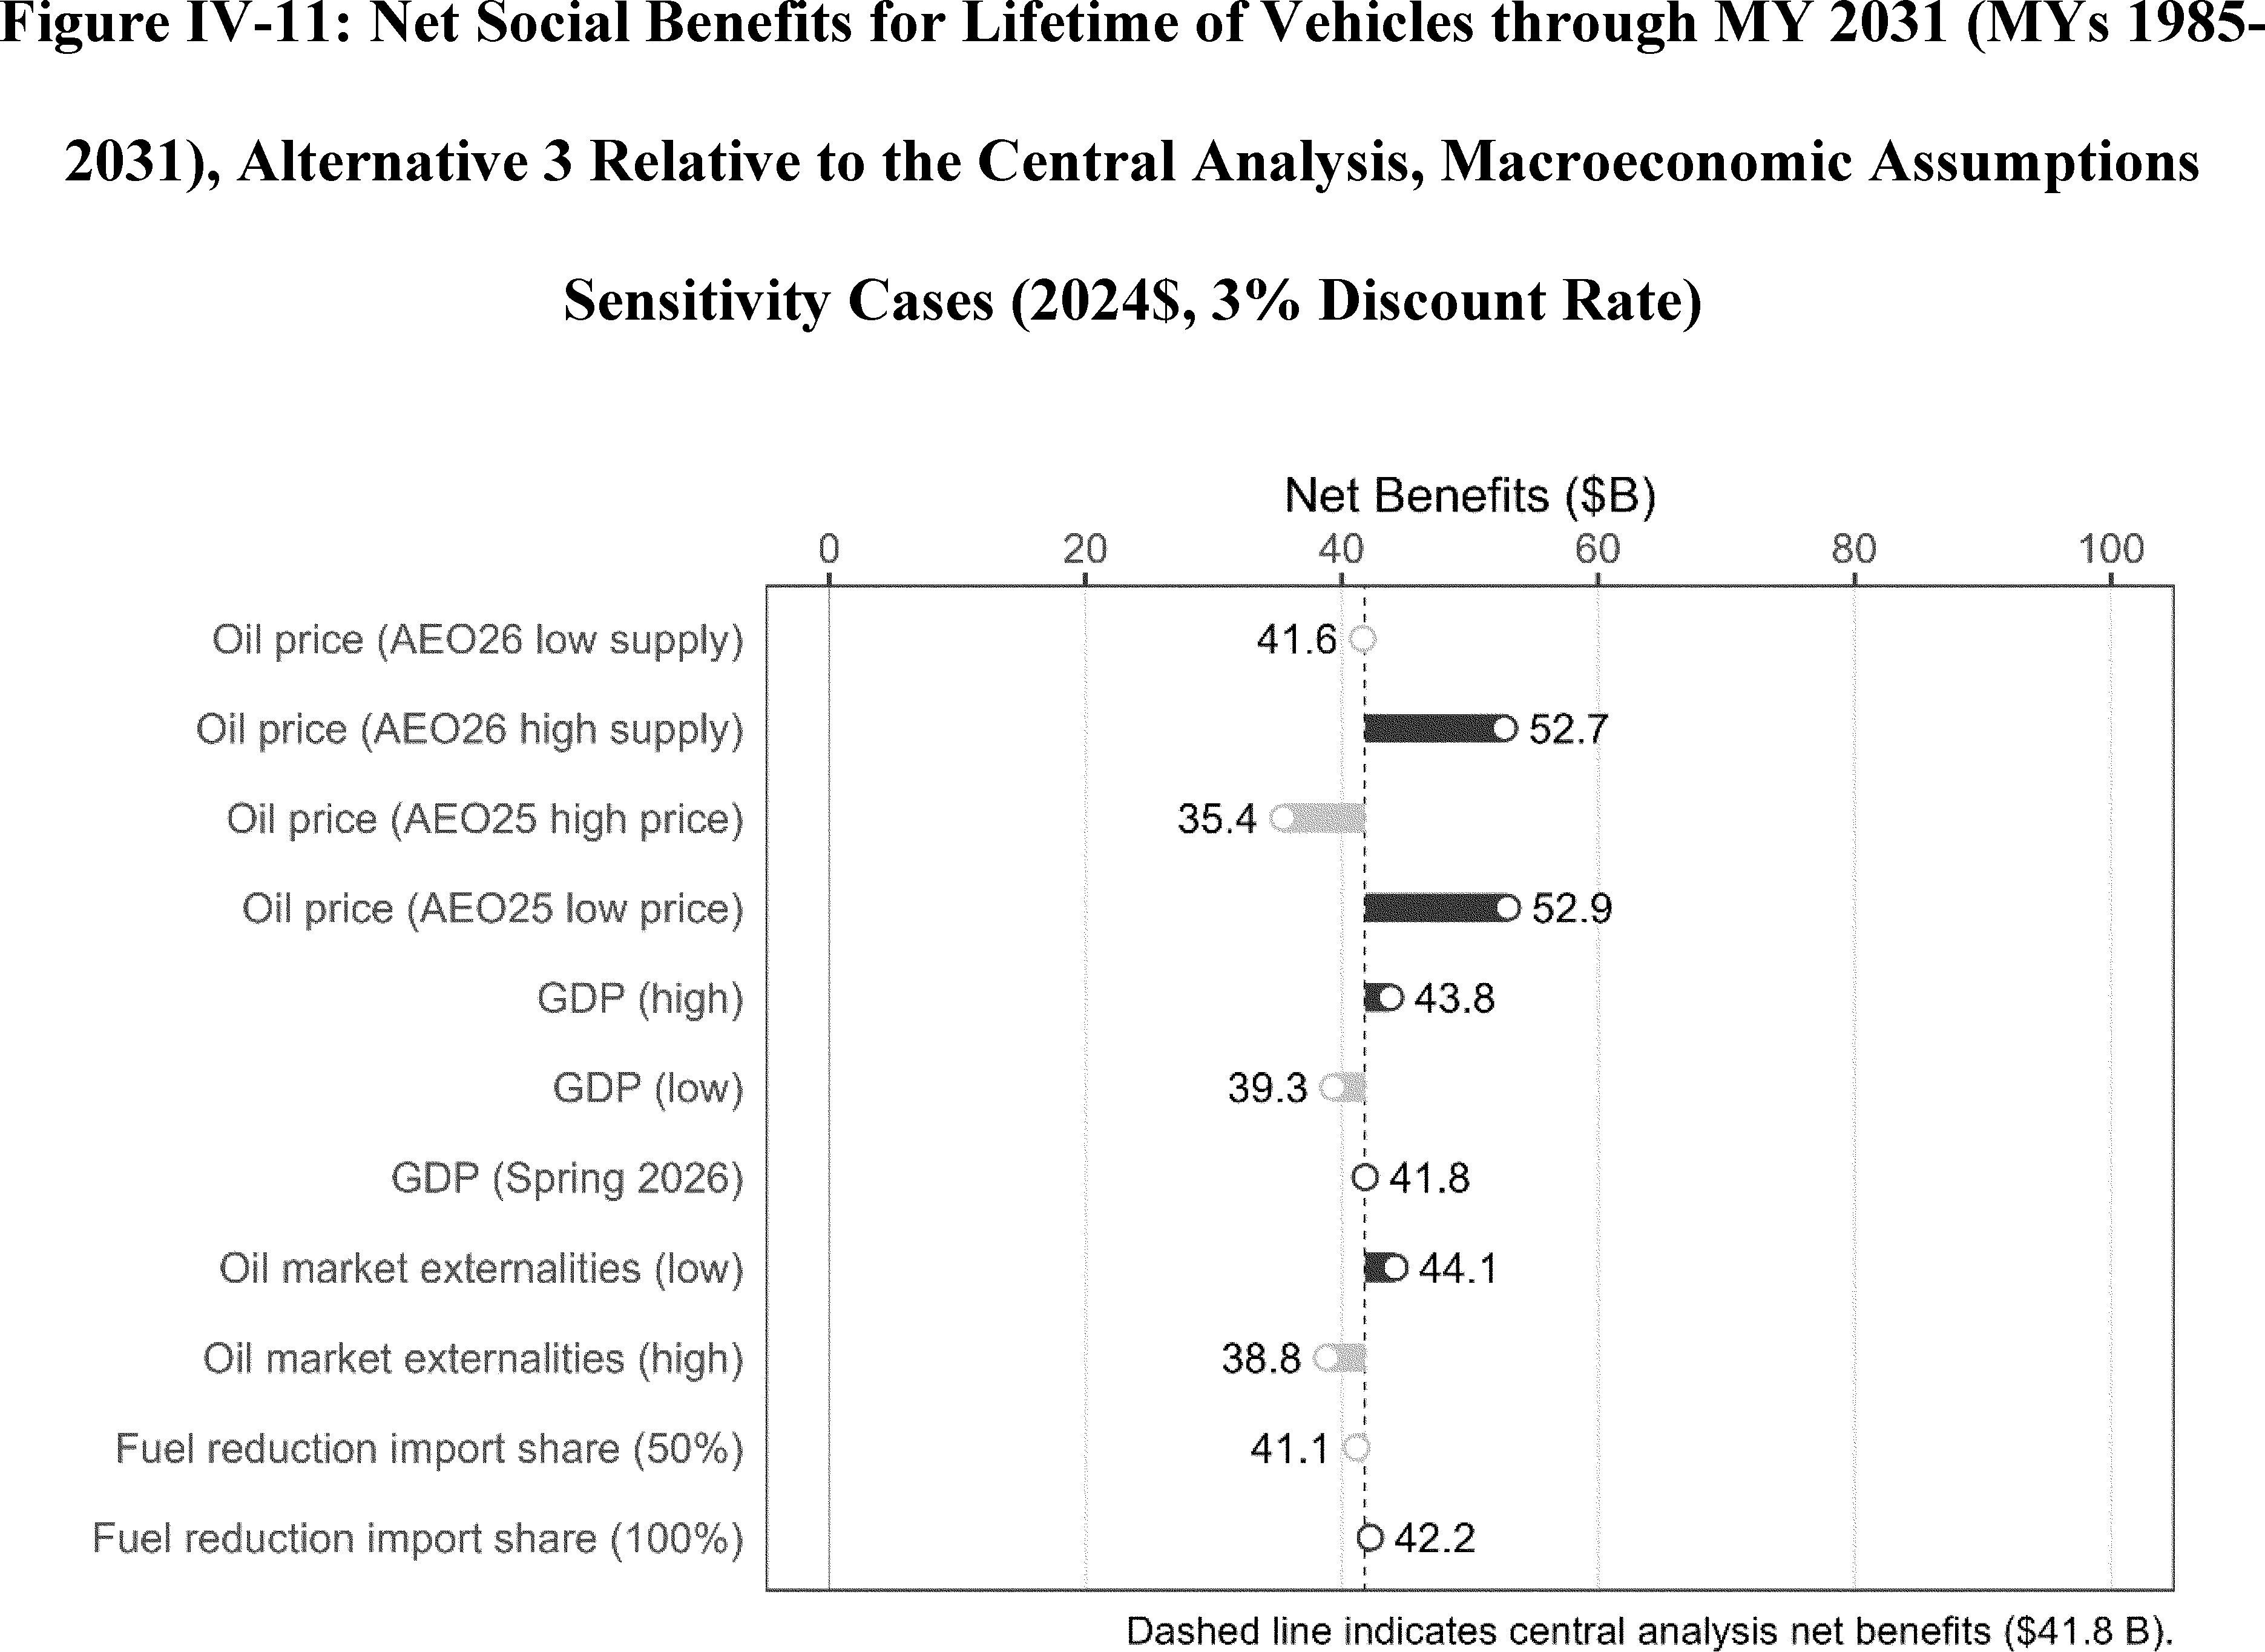
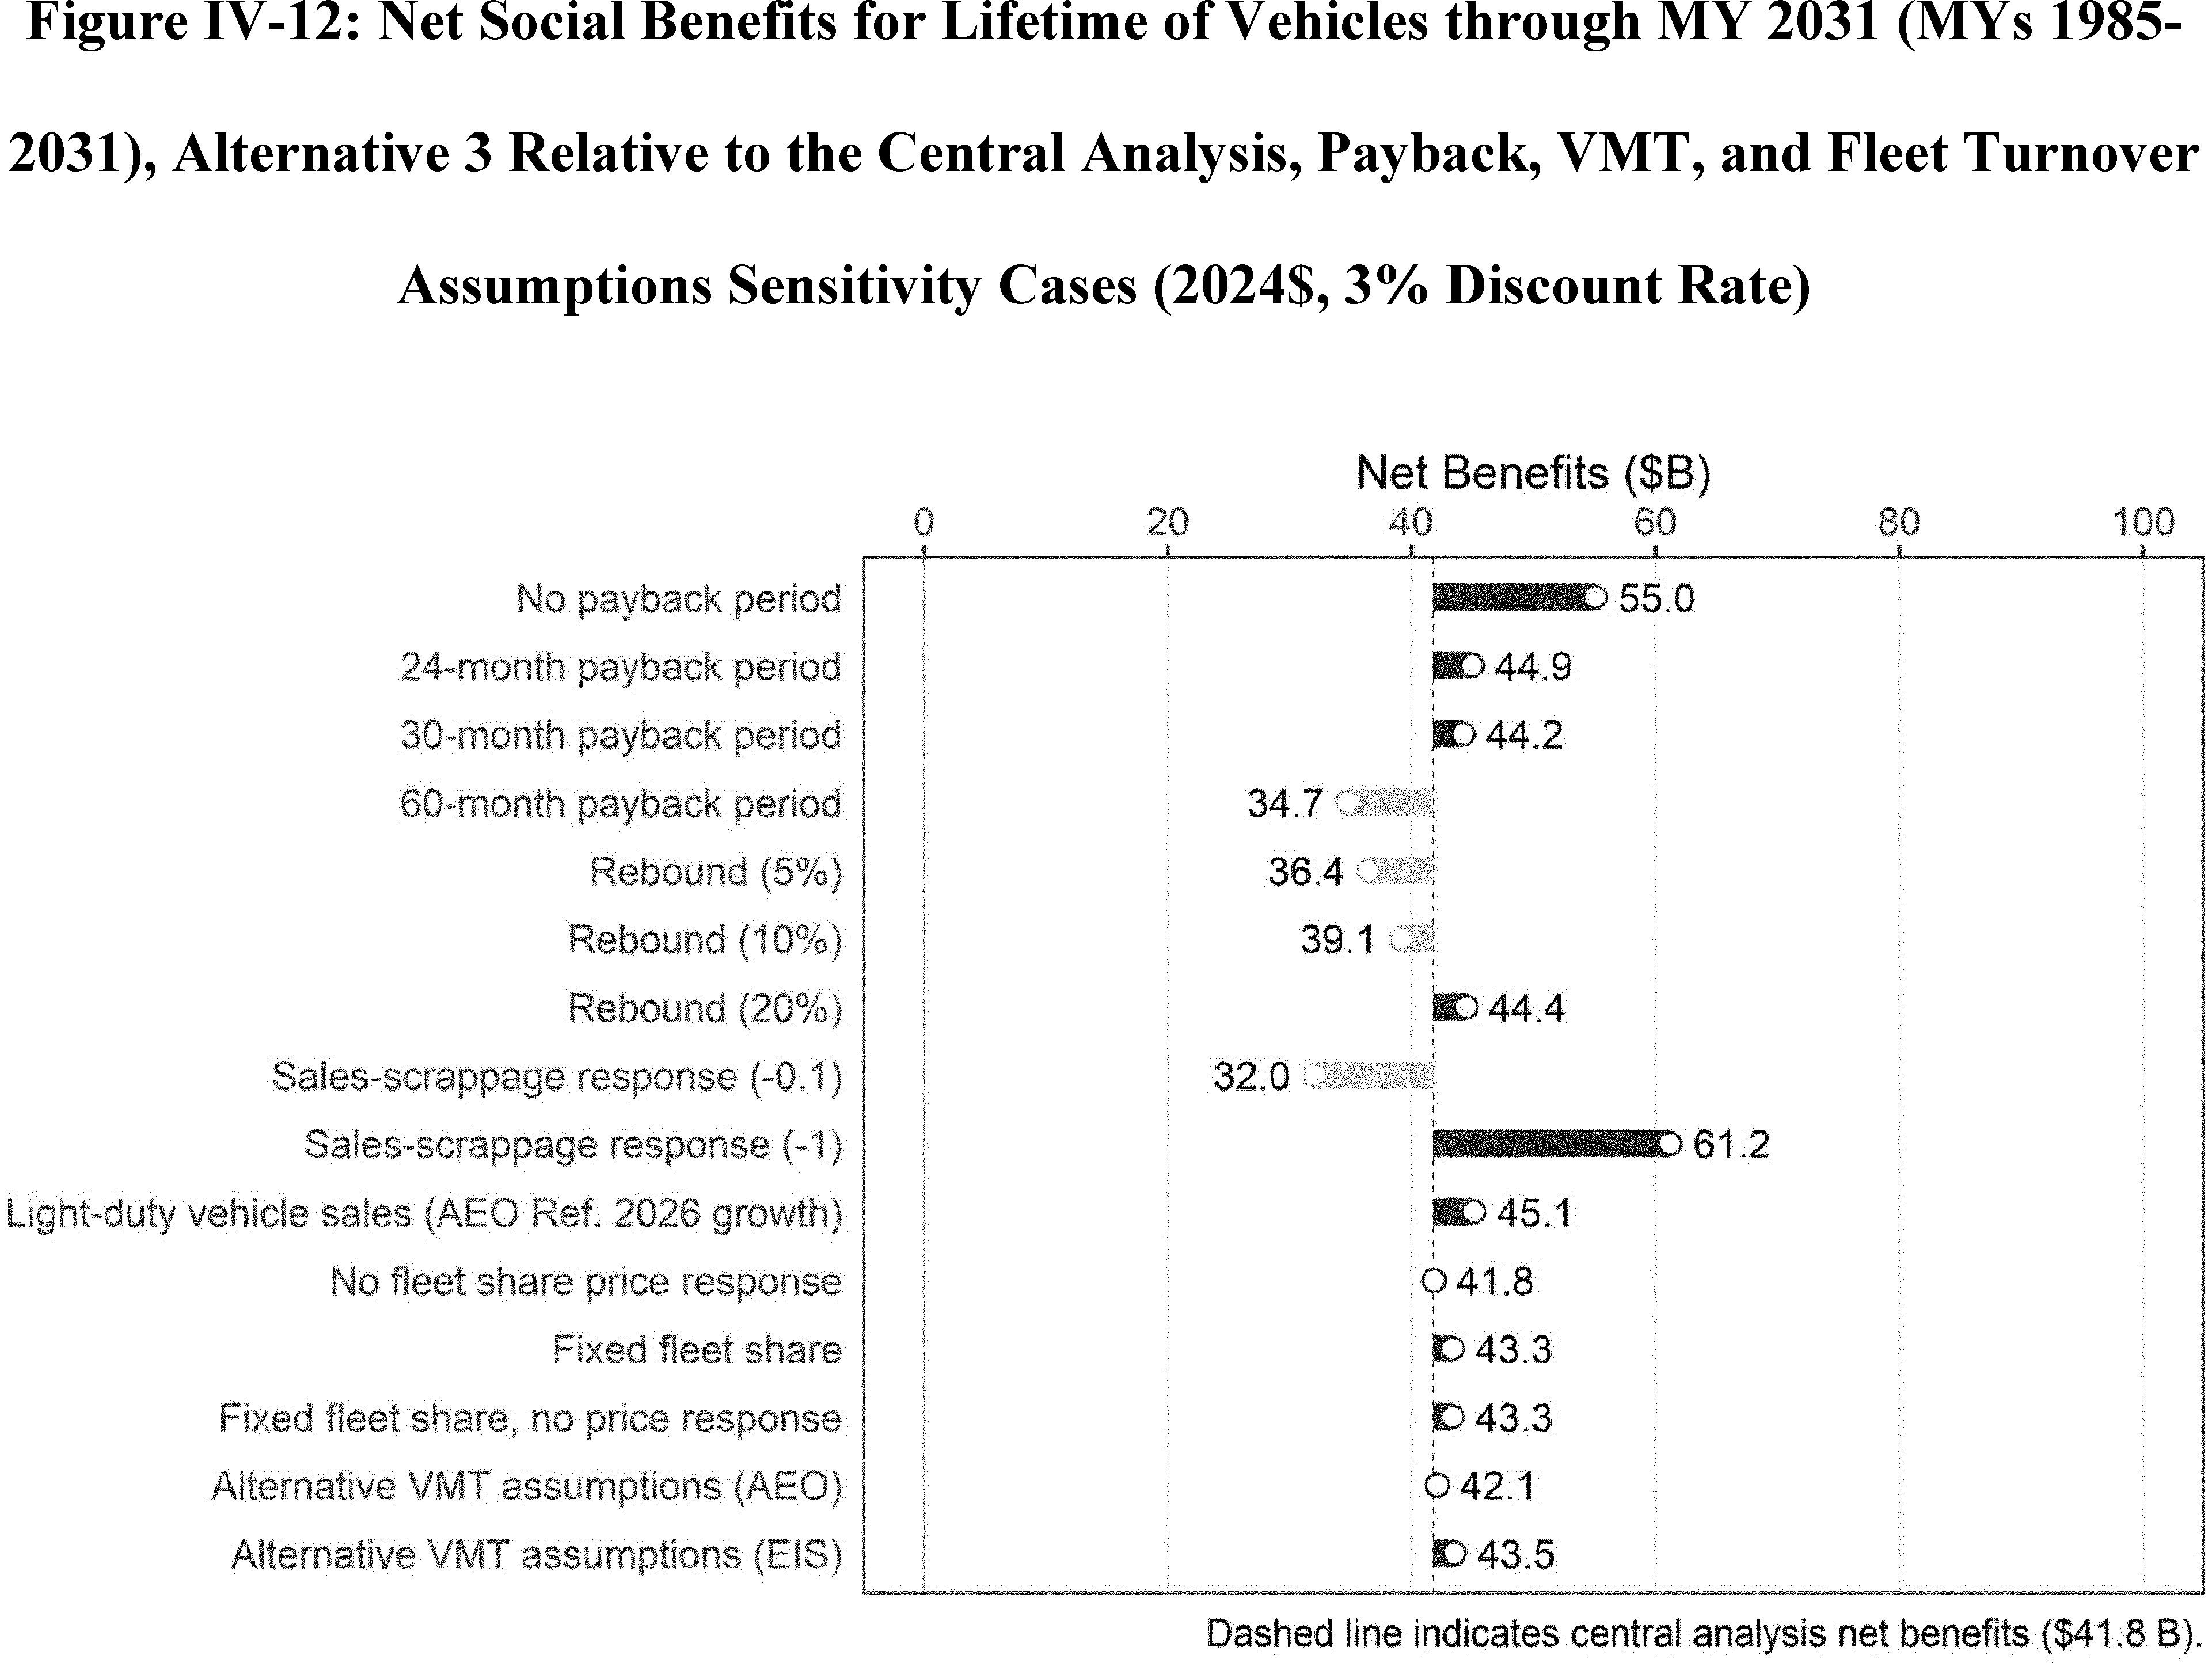
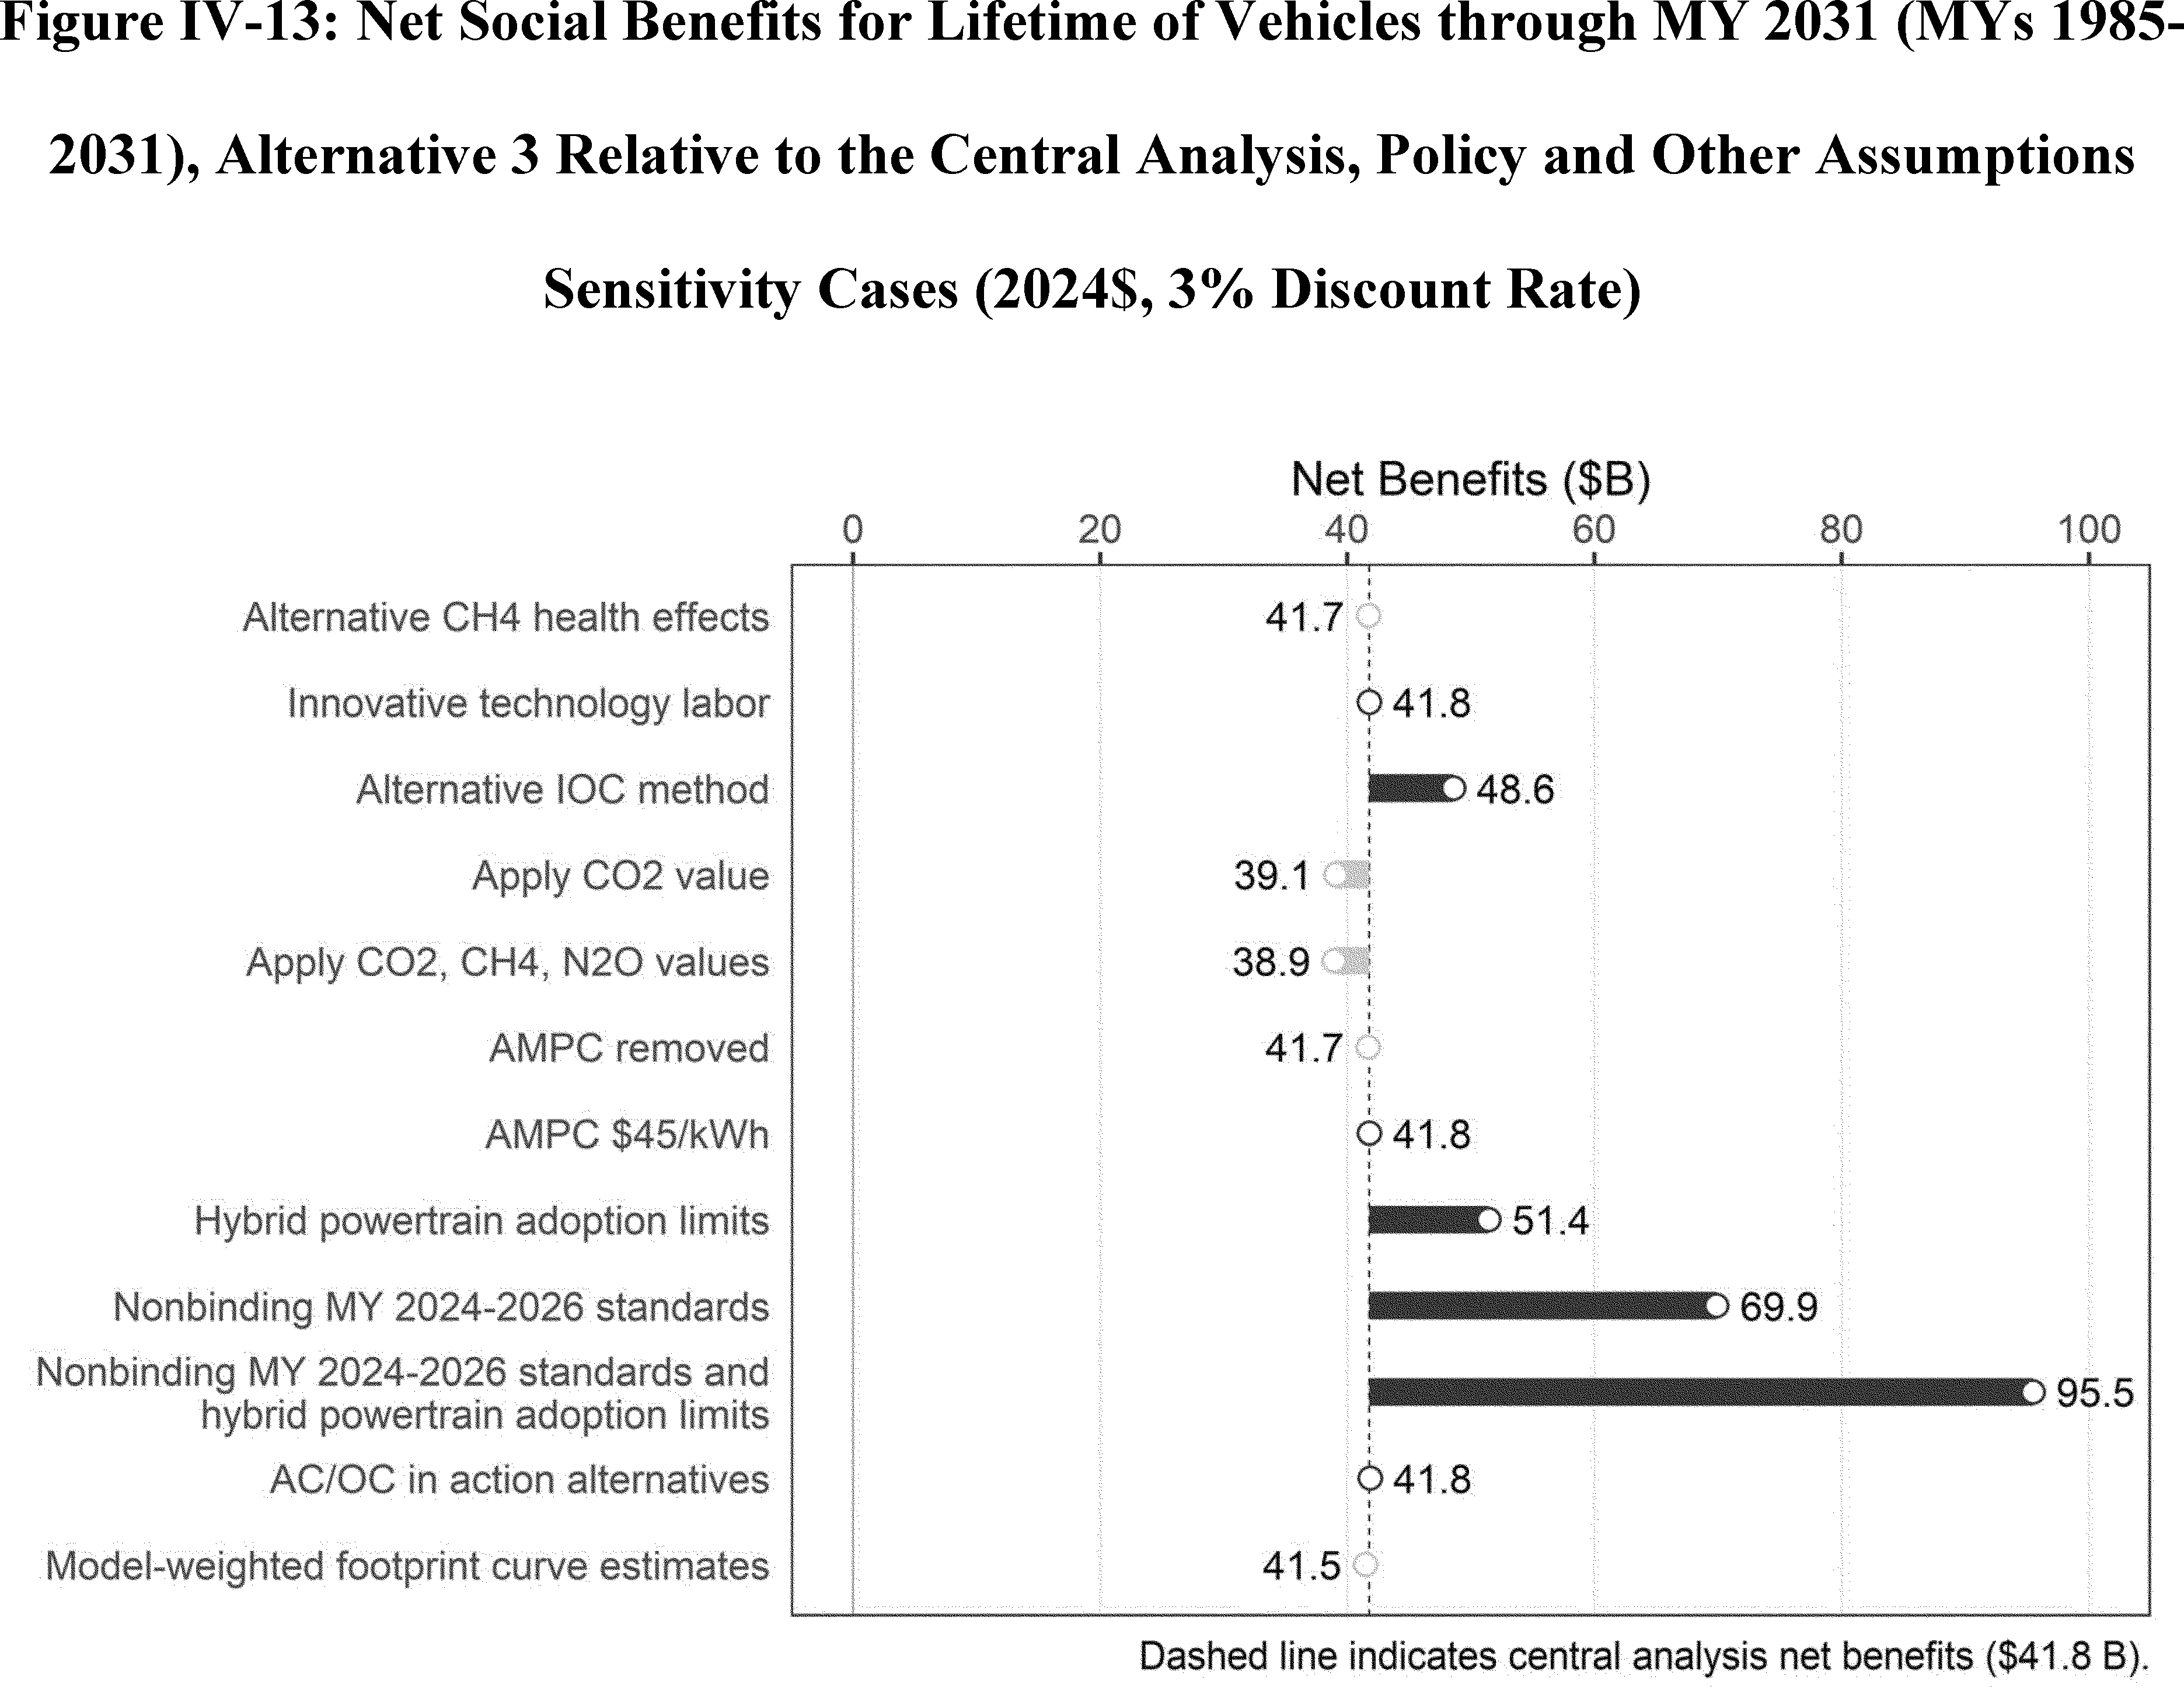
 49 CFR part 578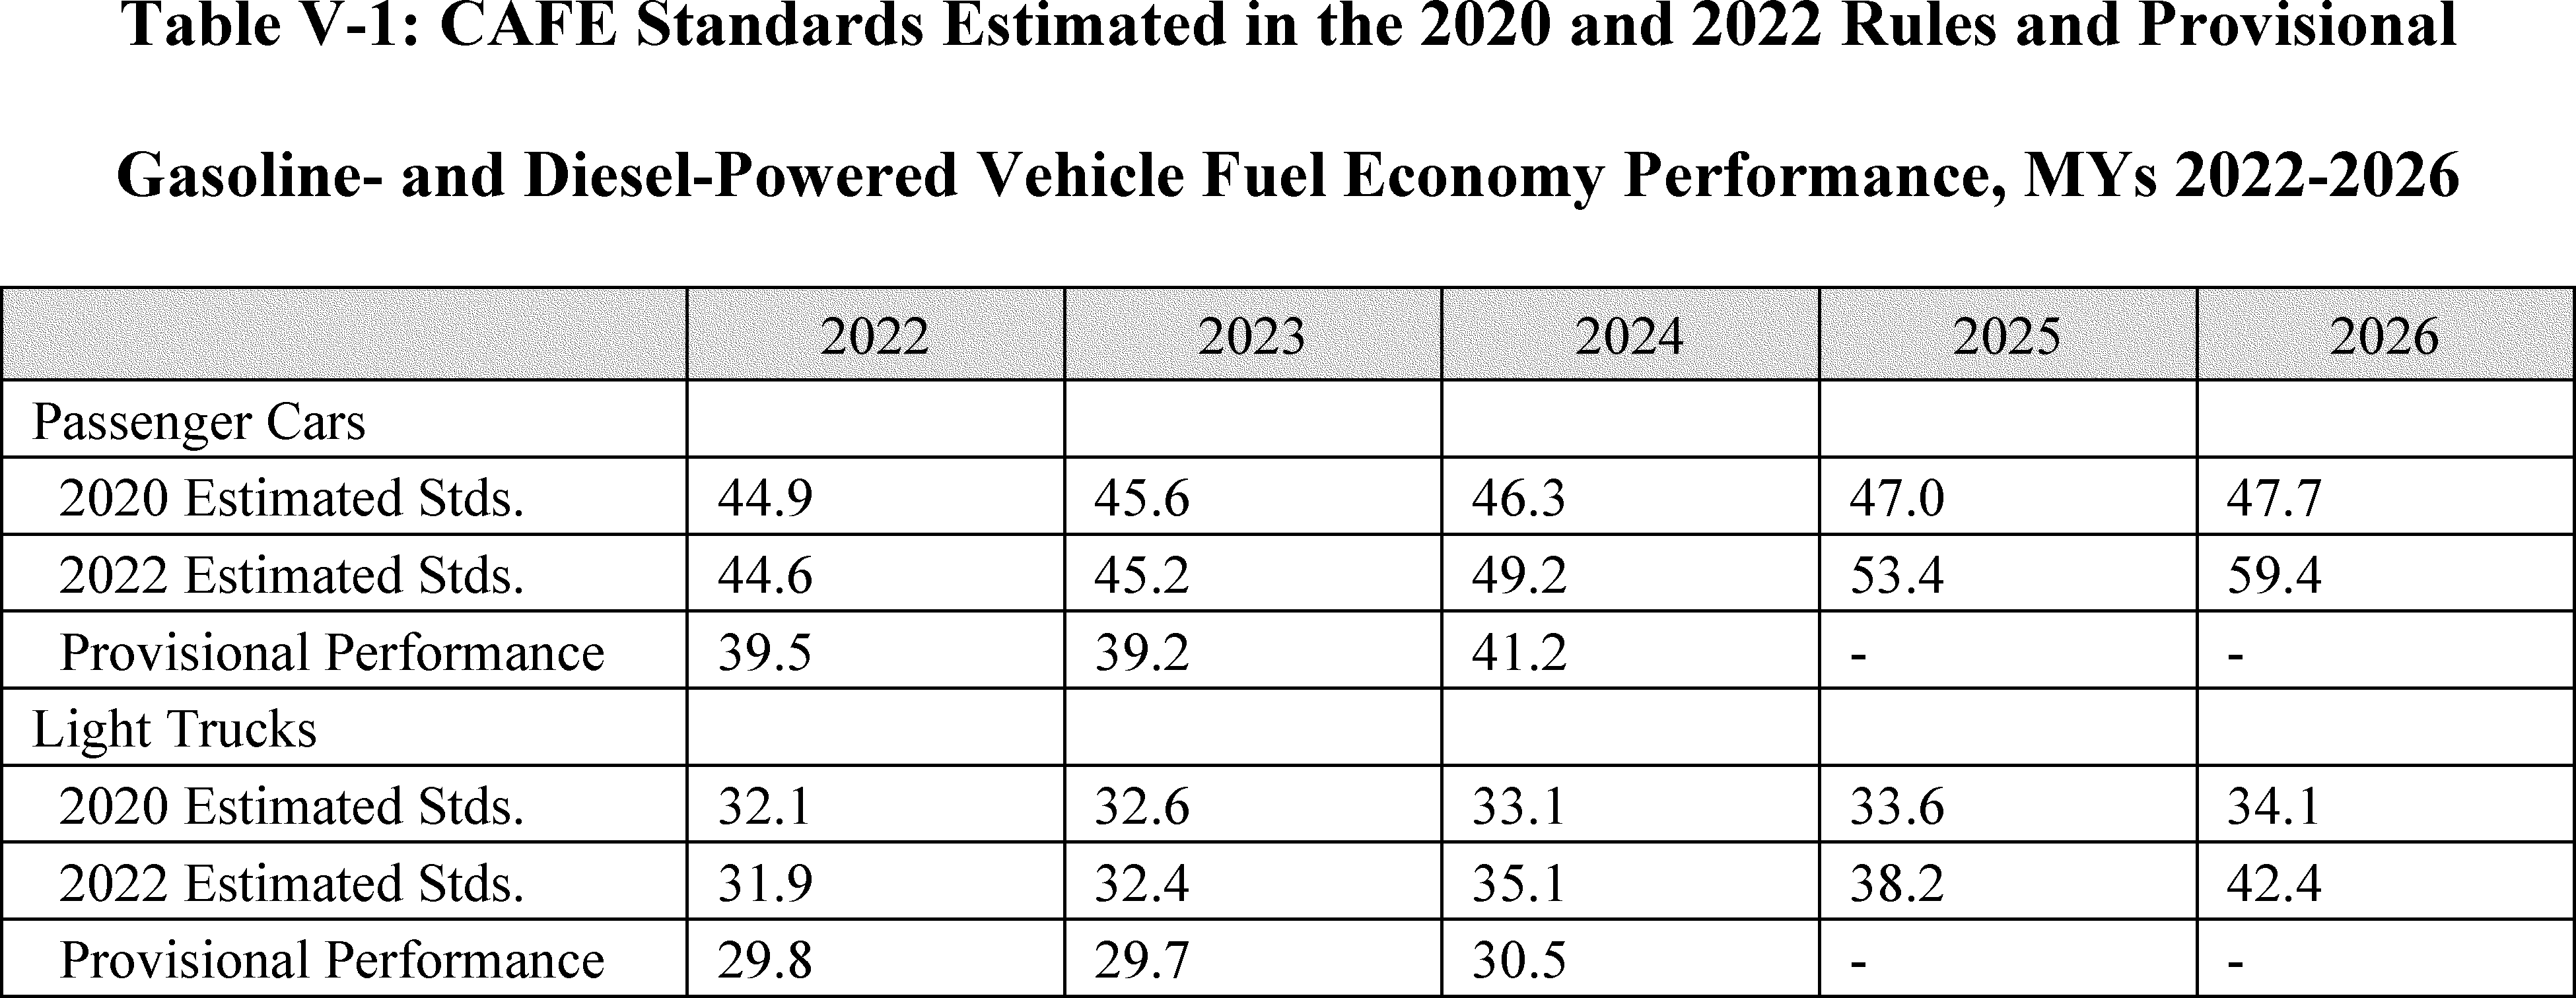
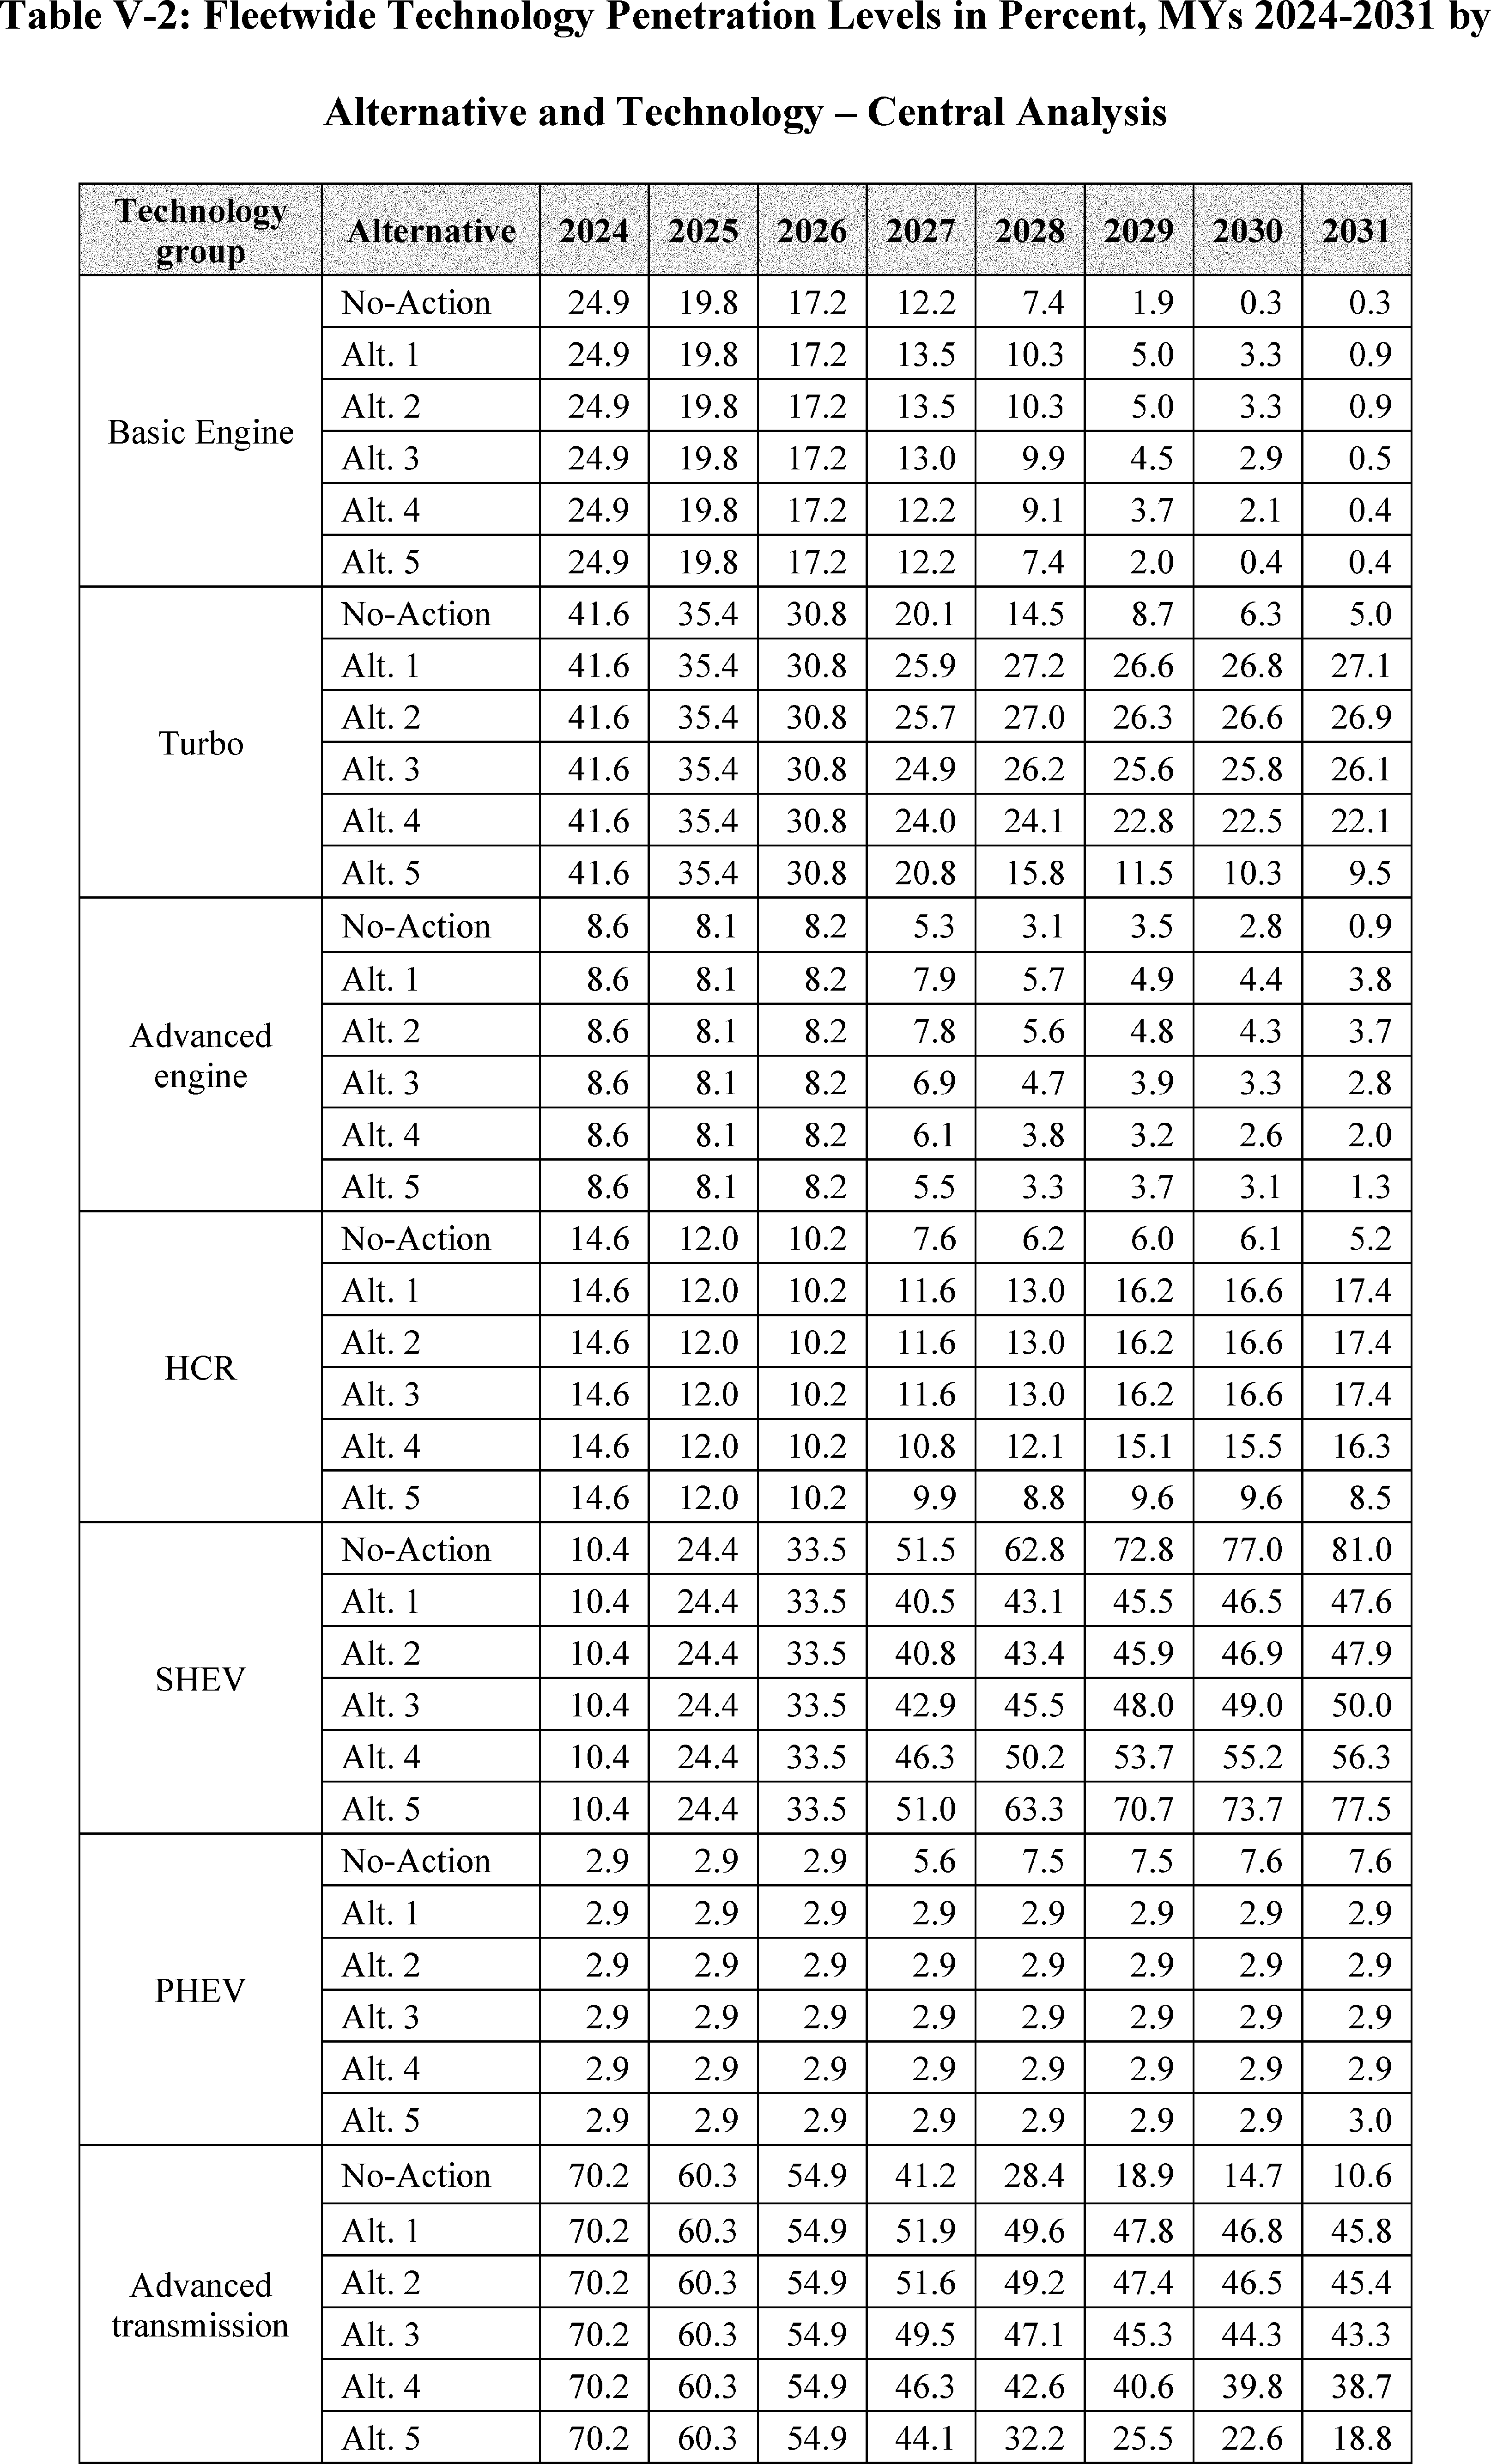
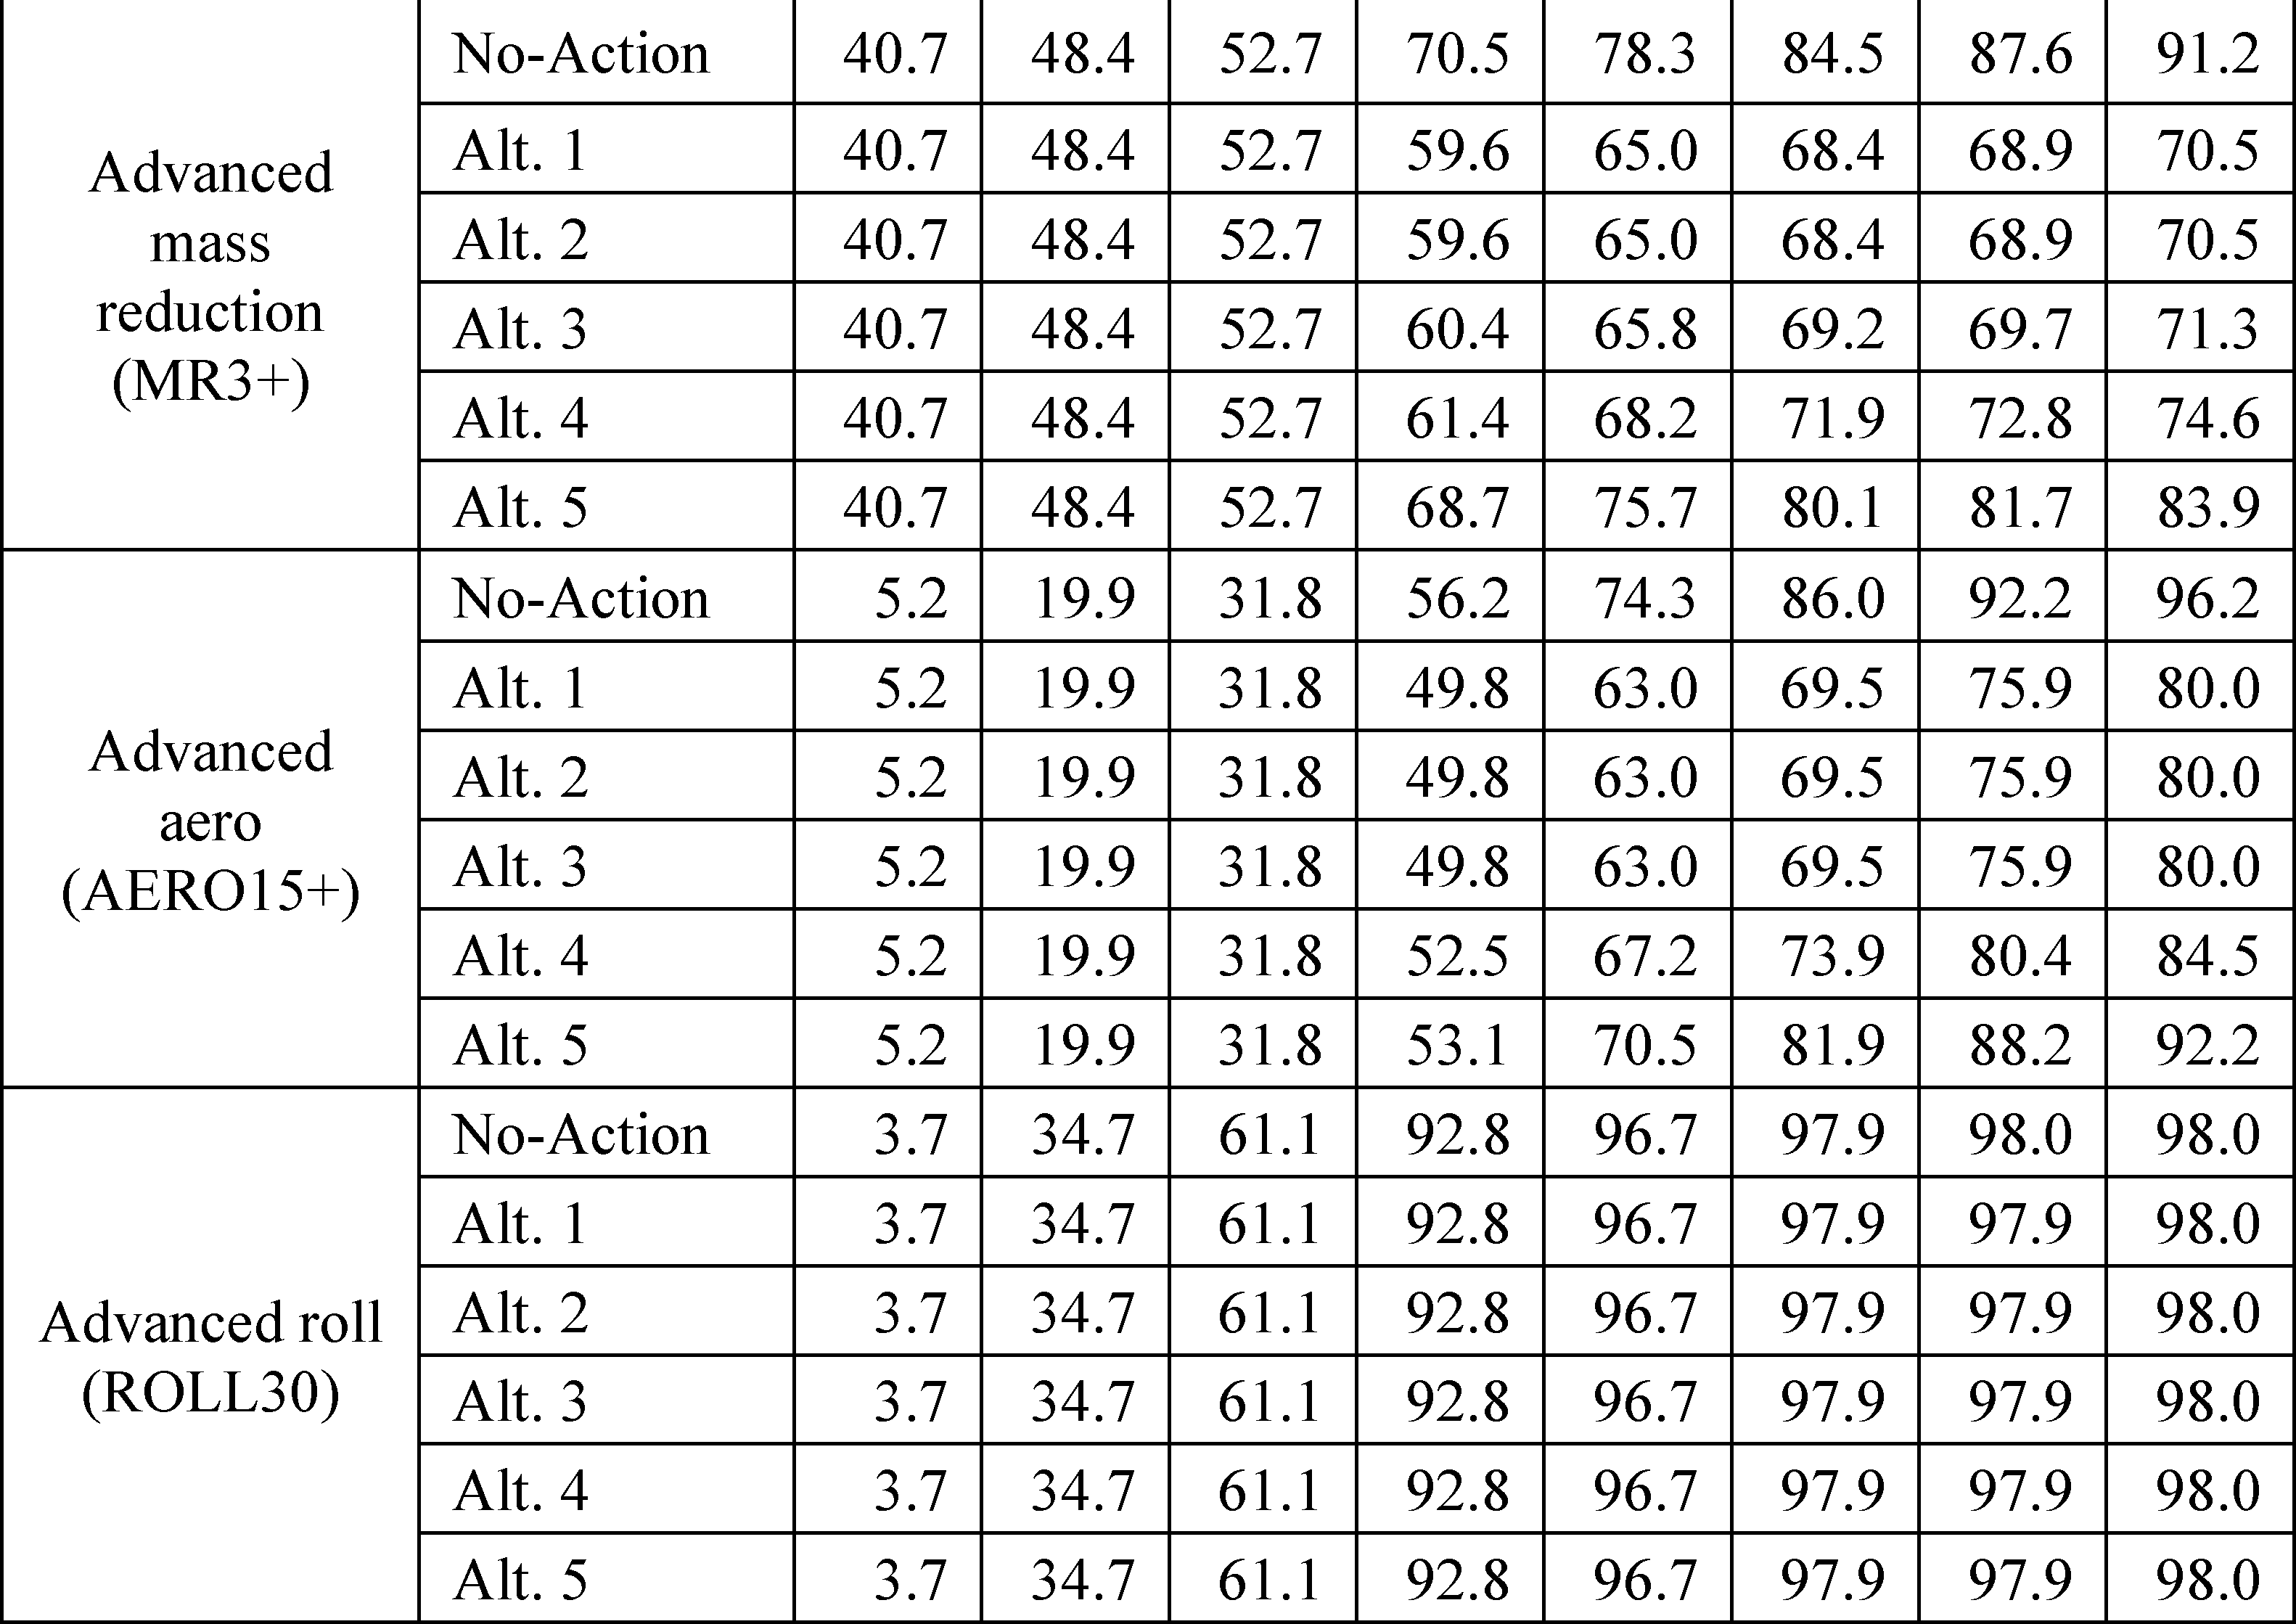
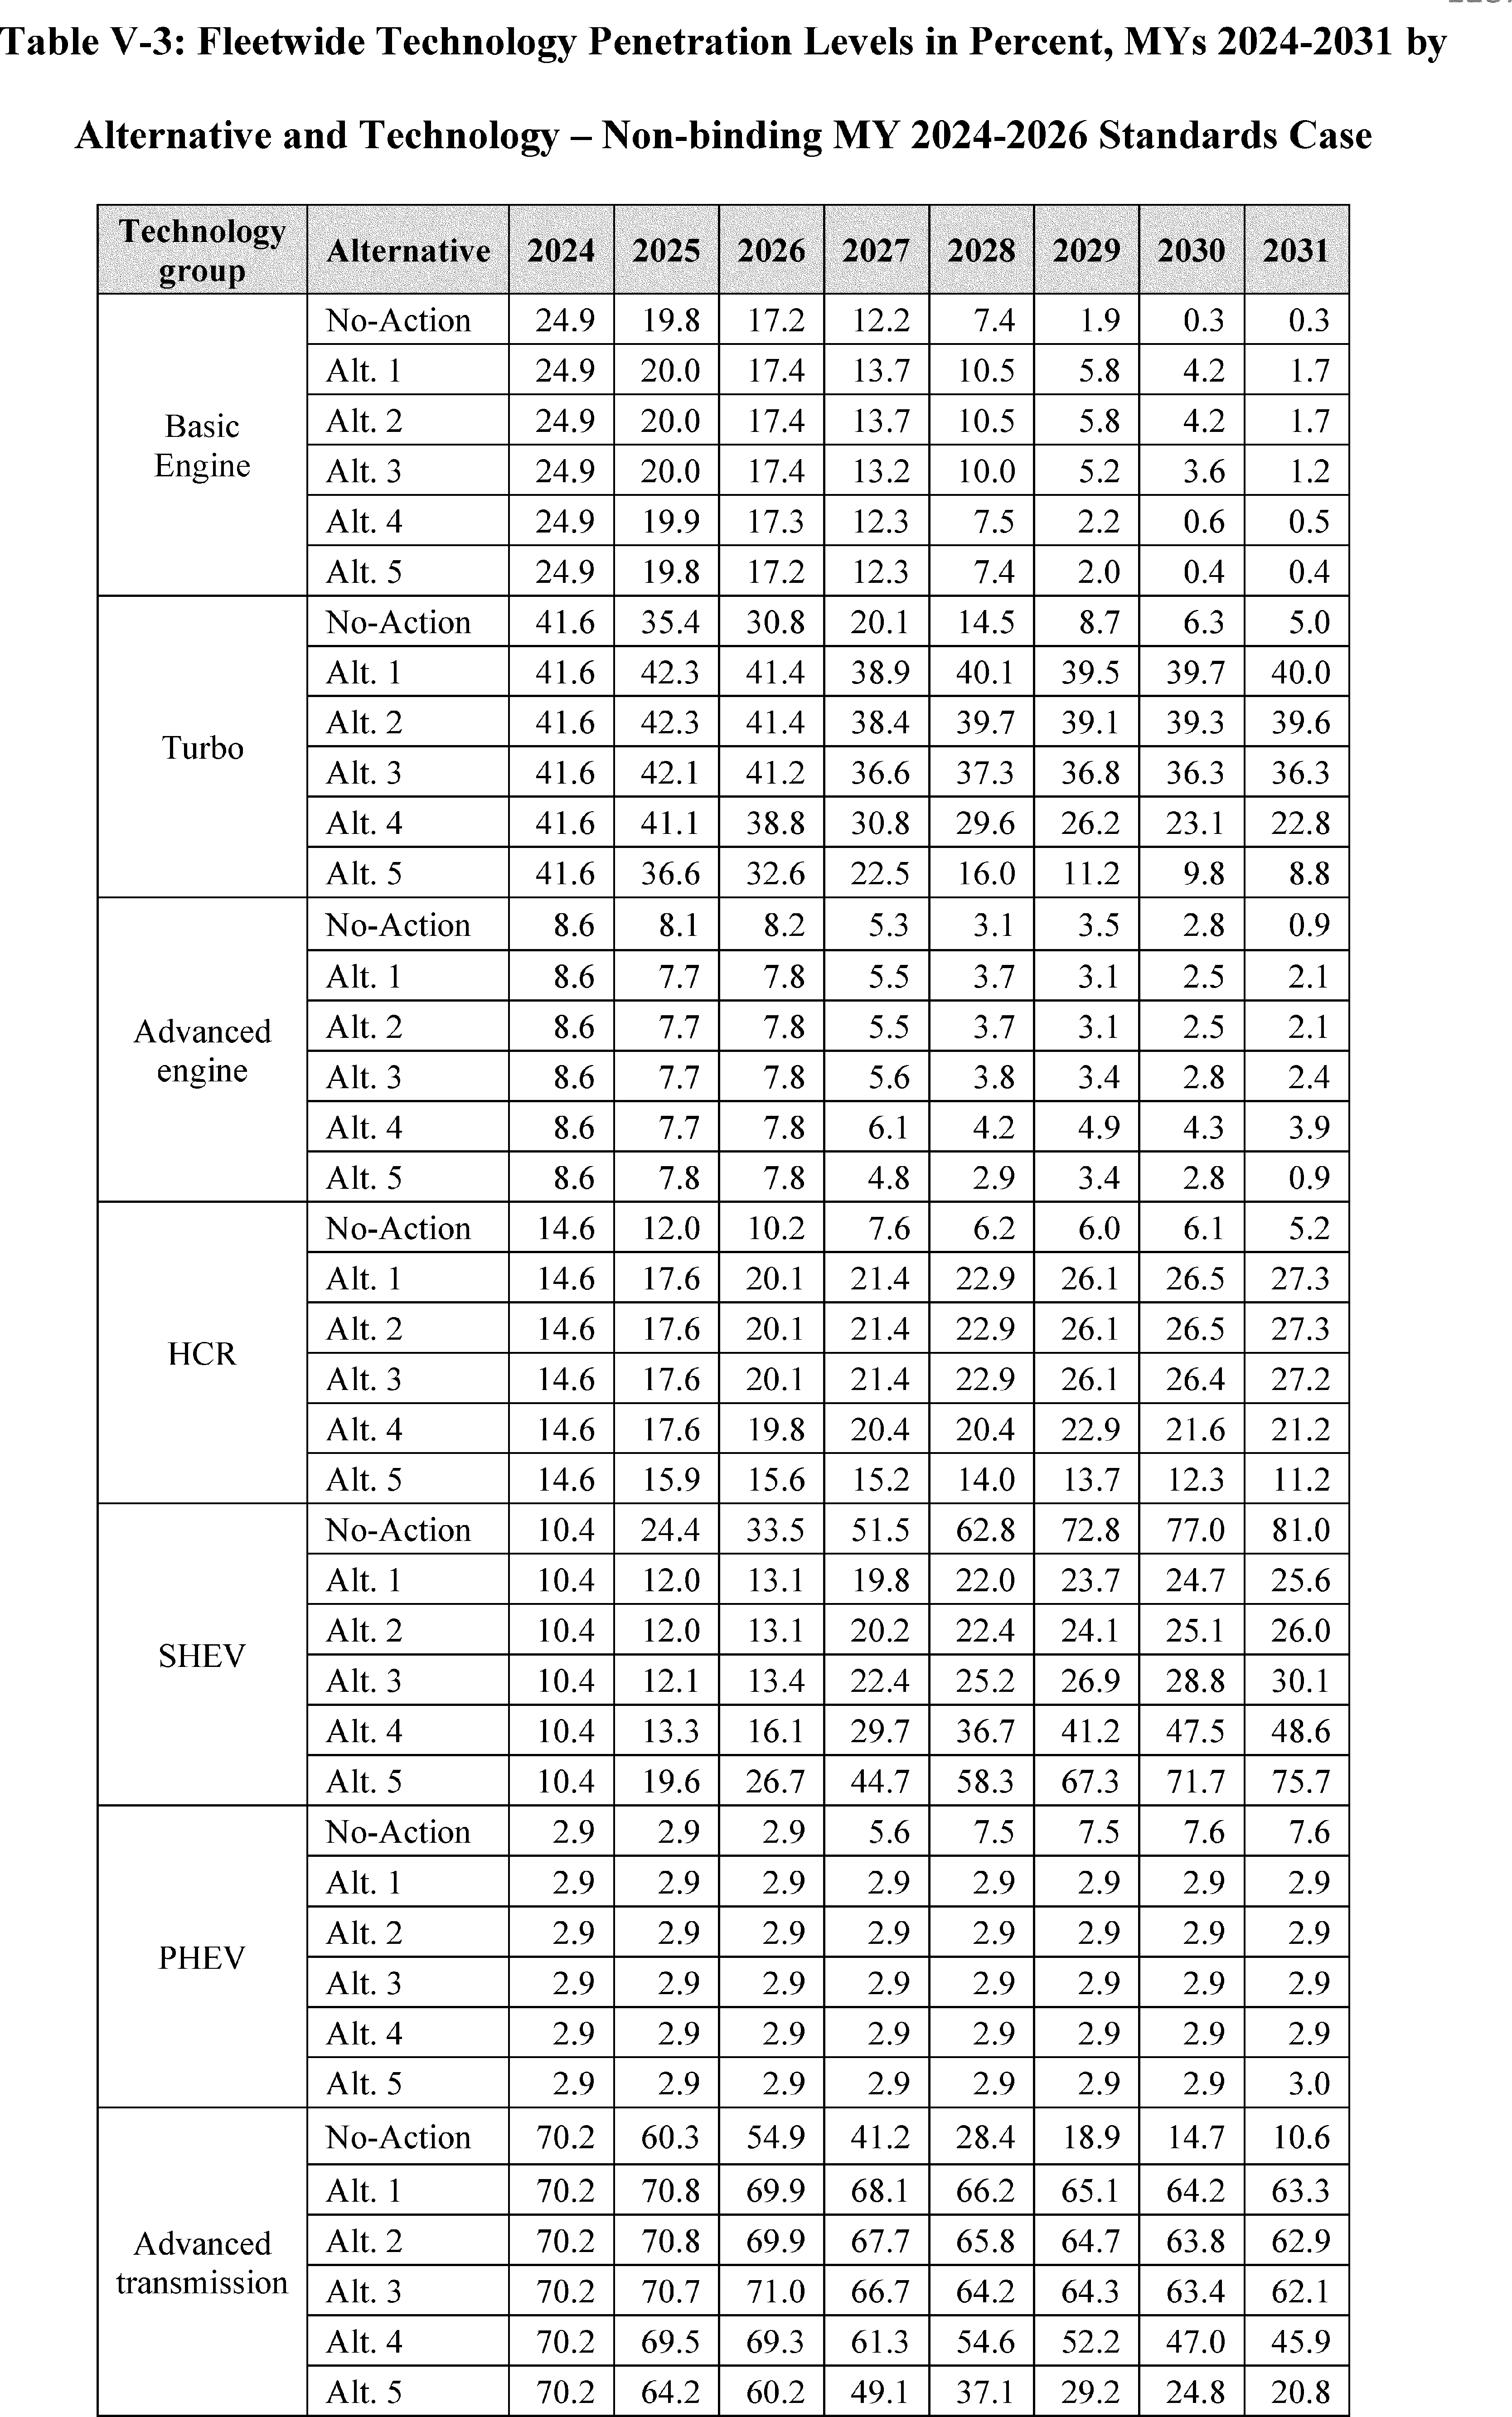
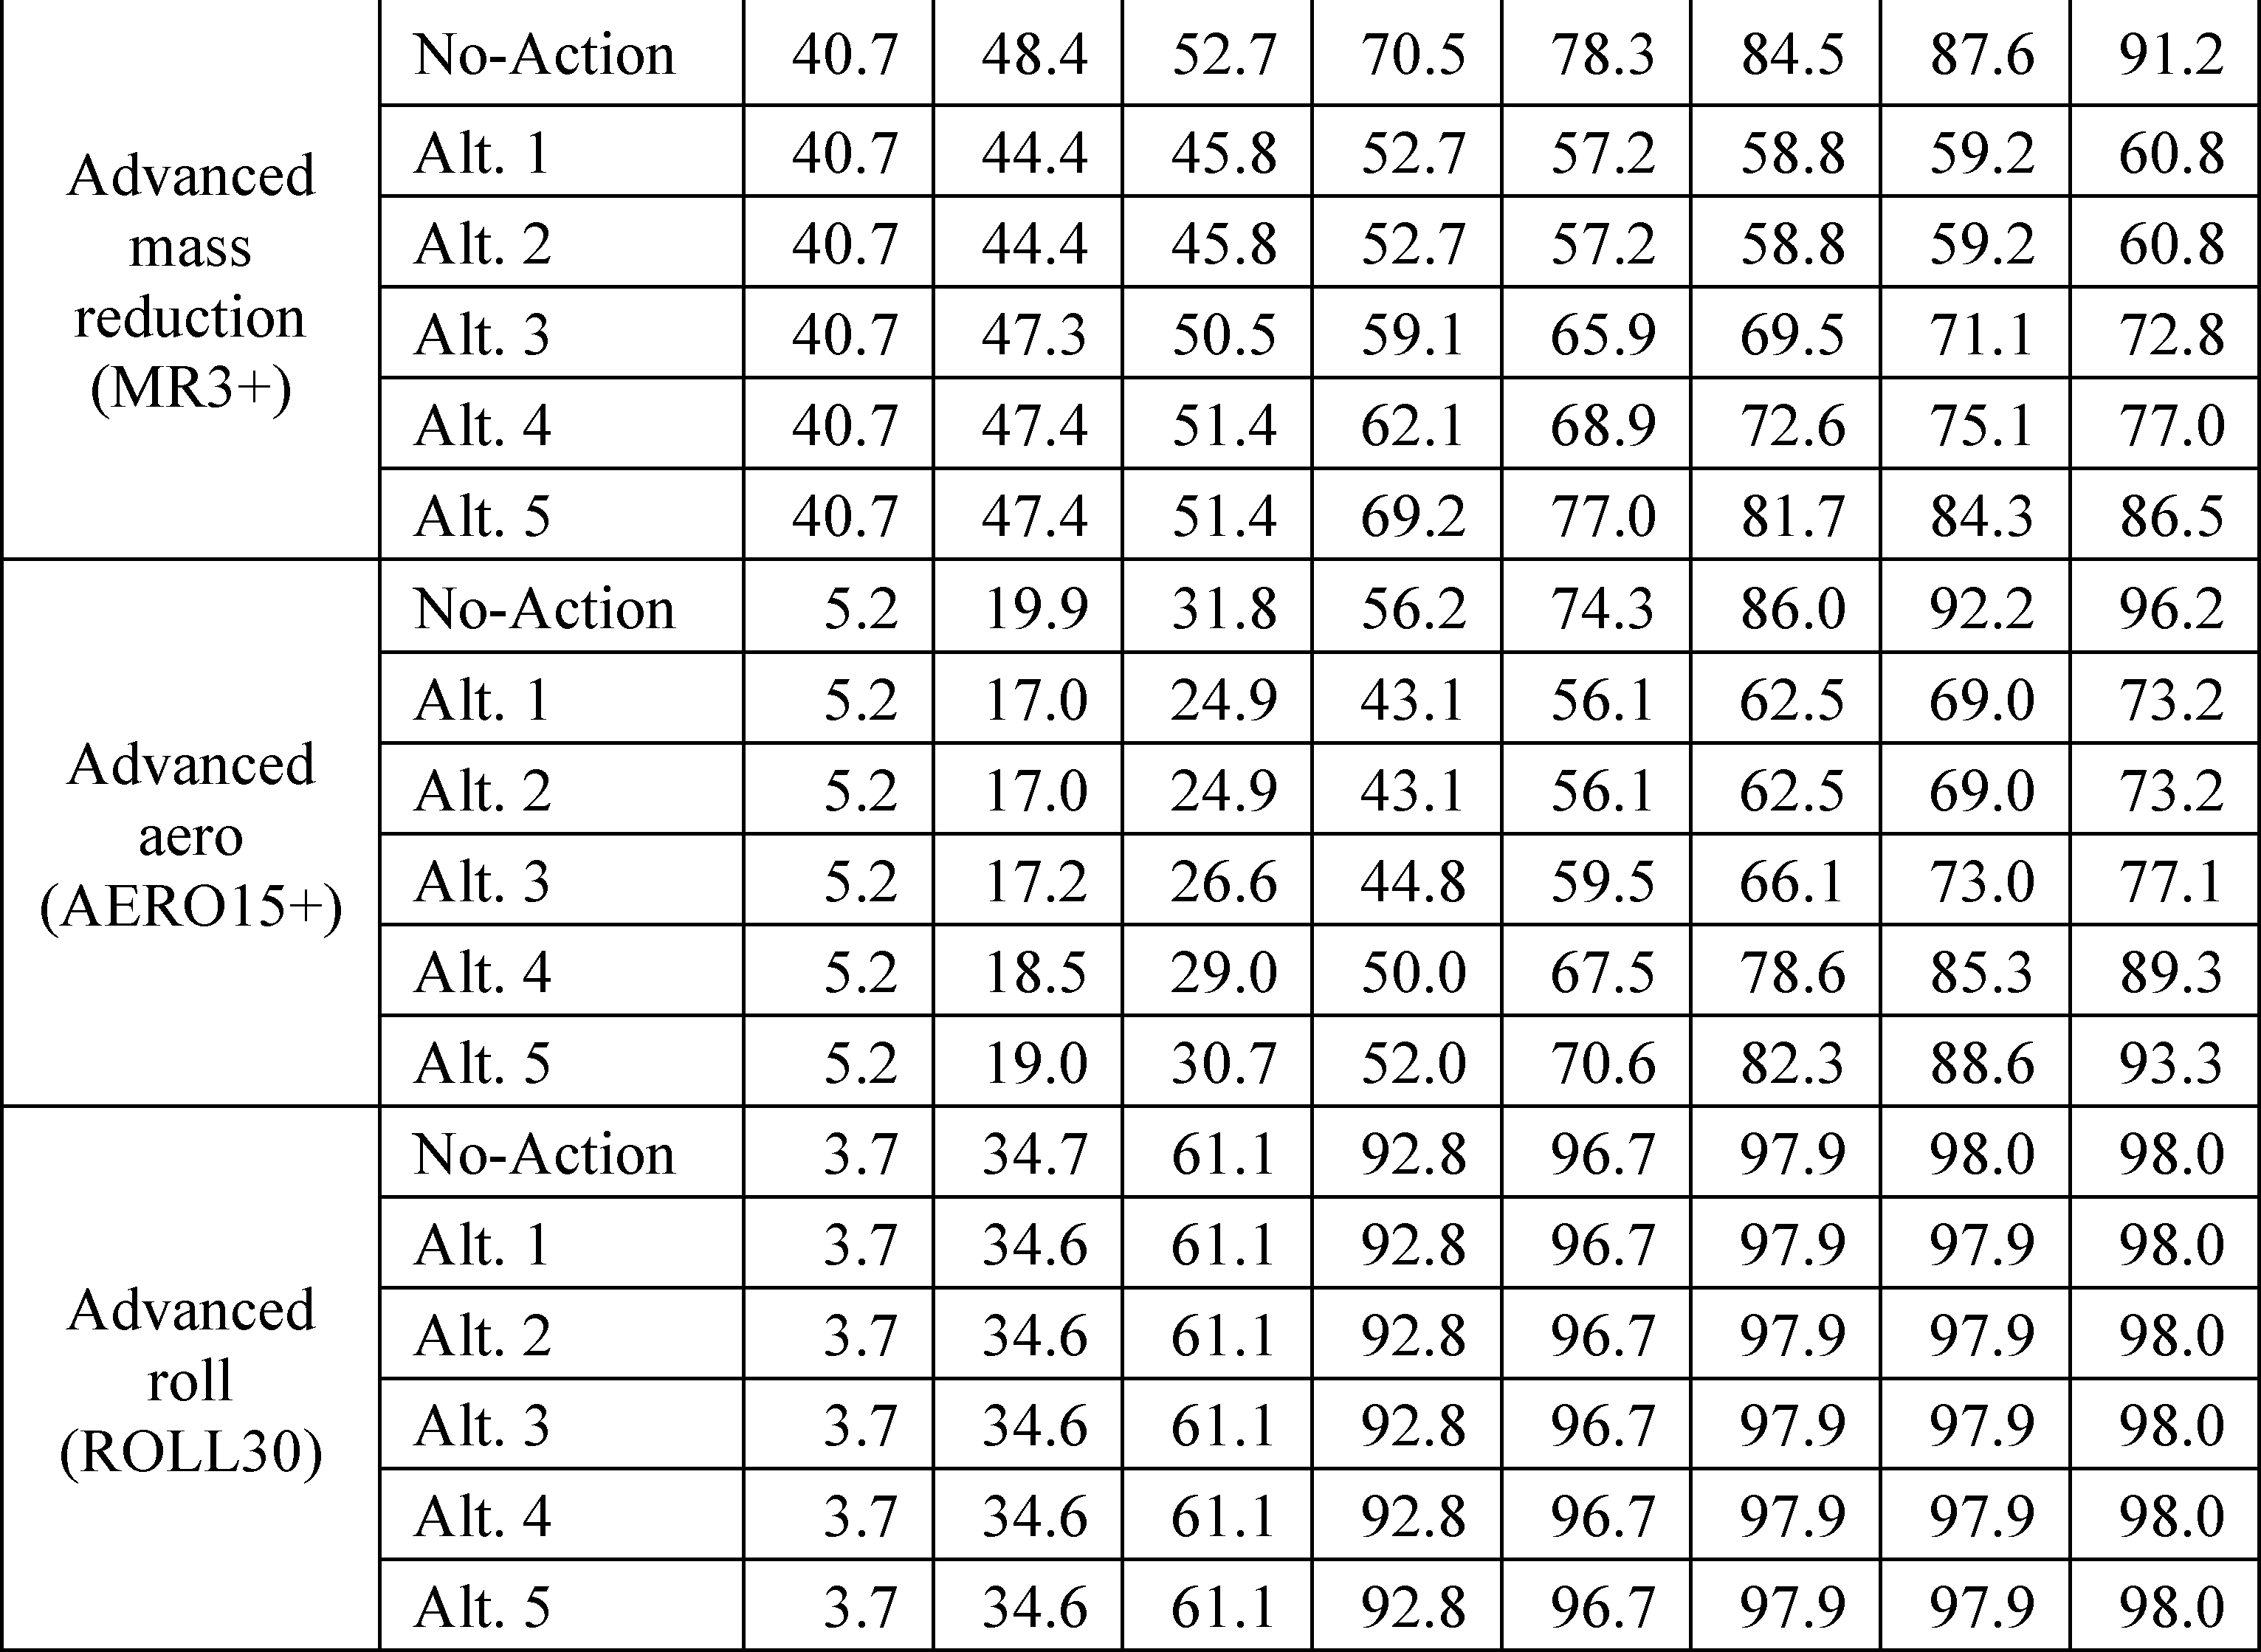
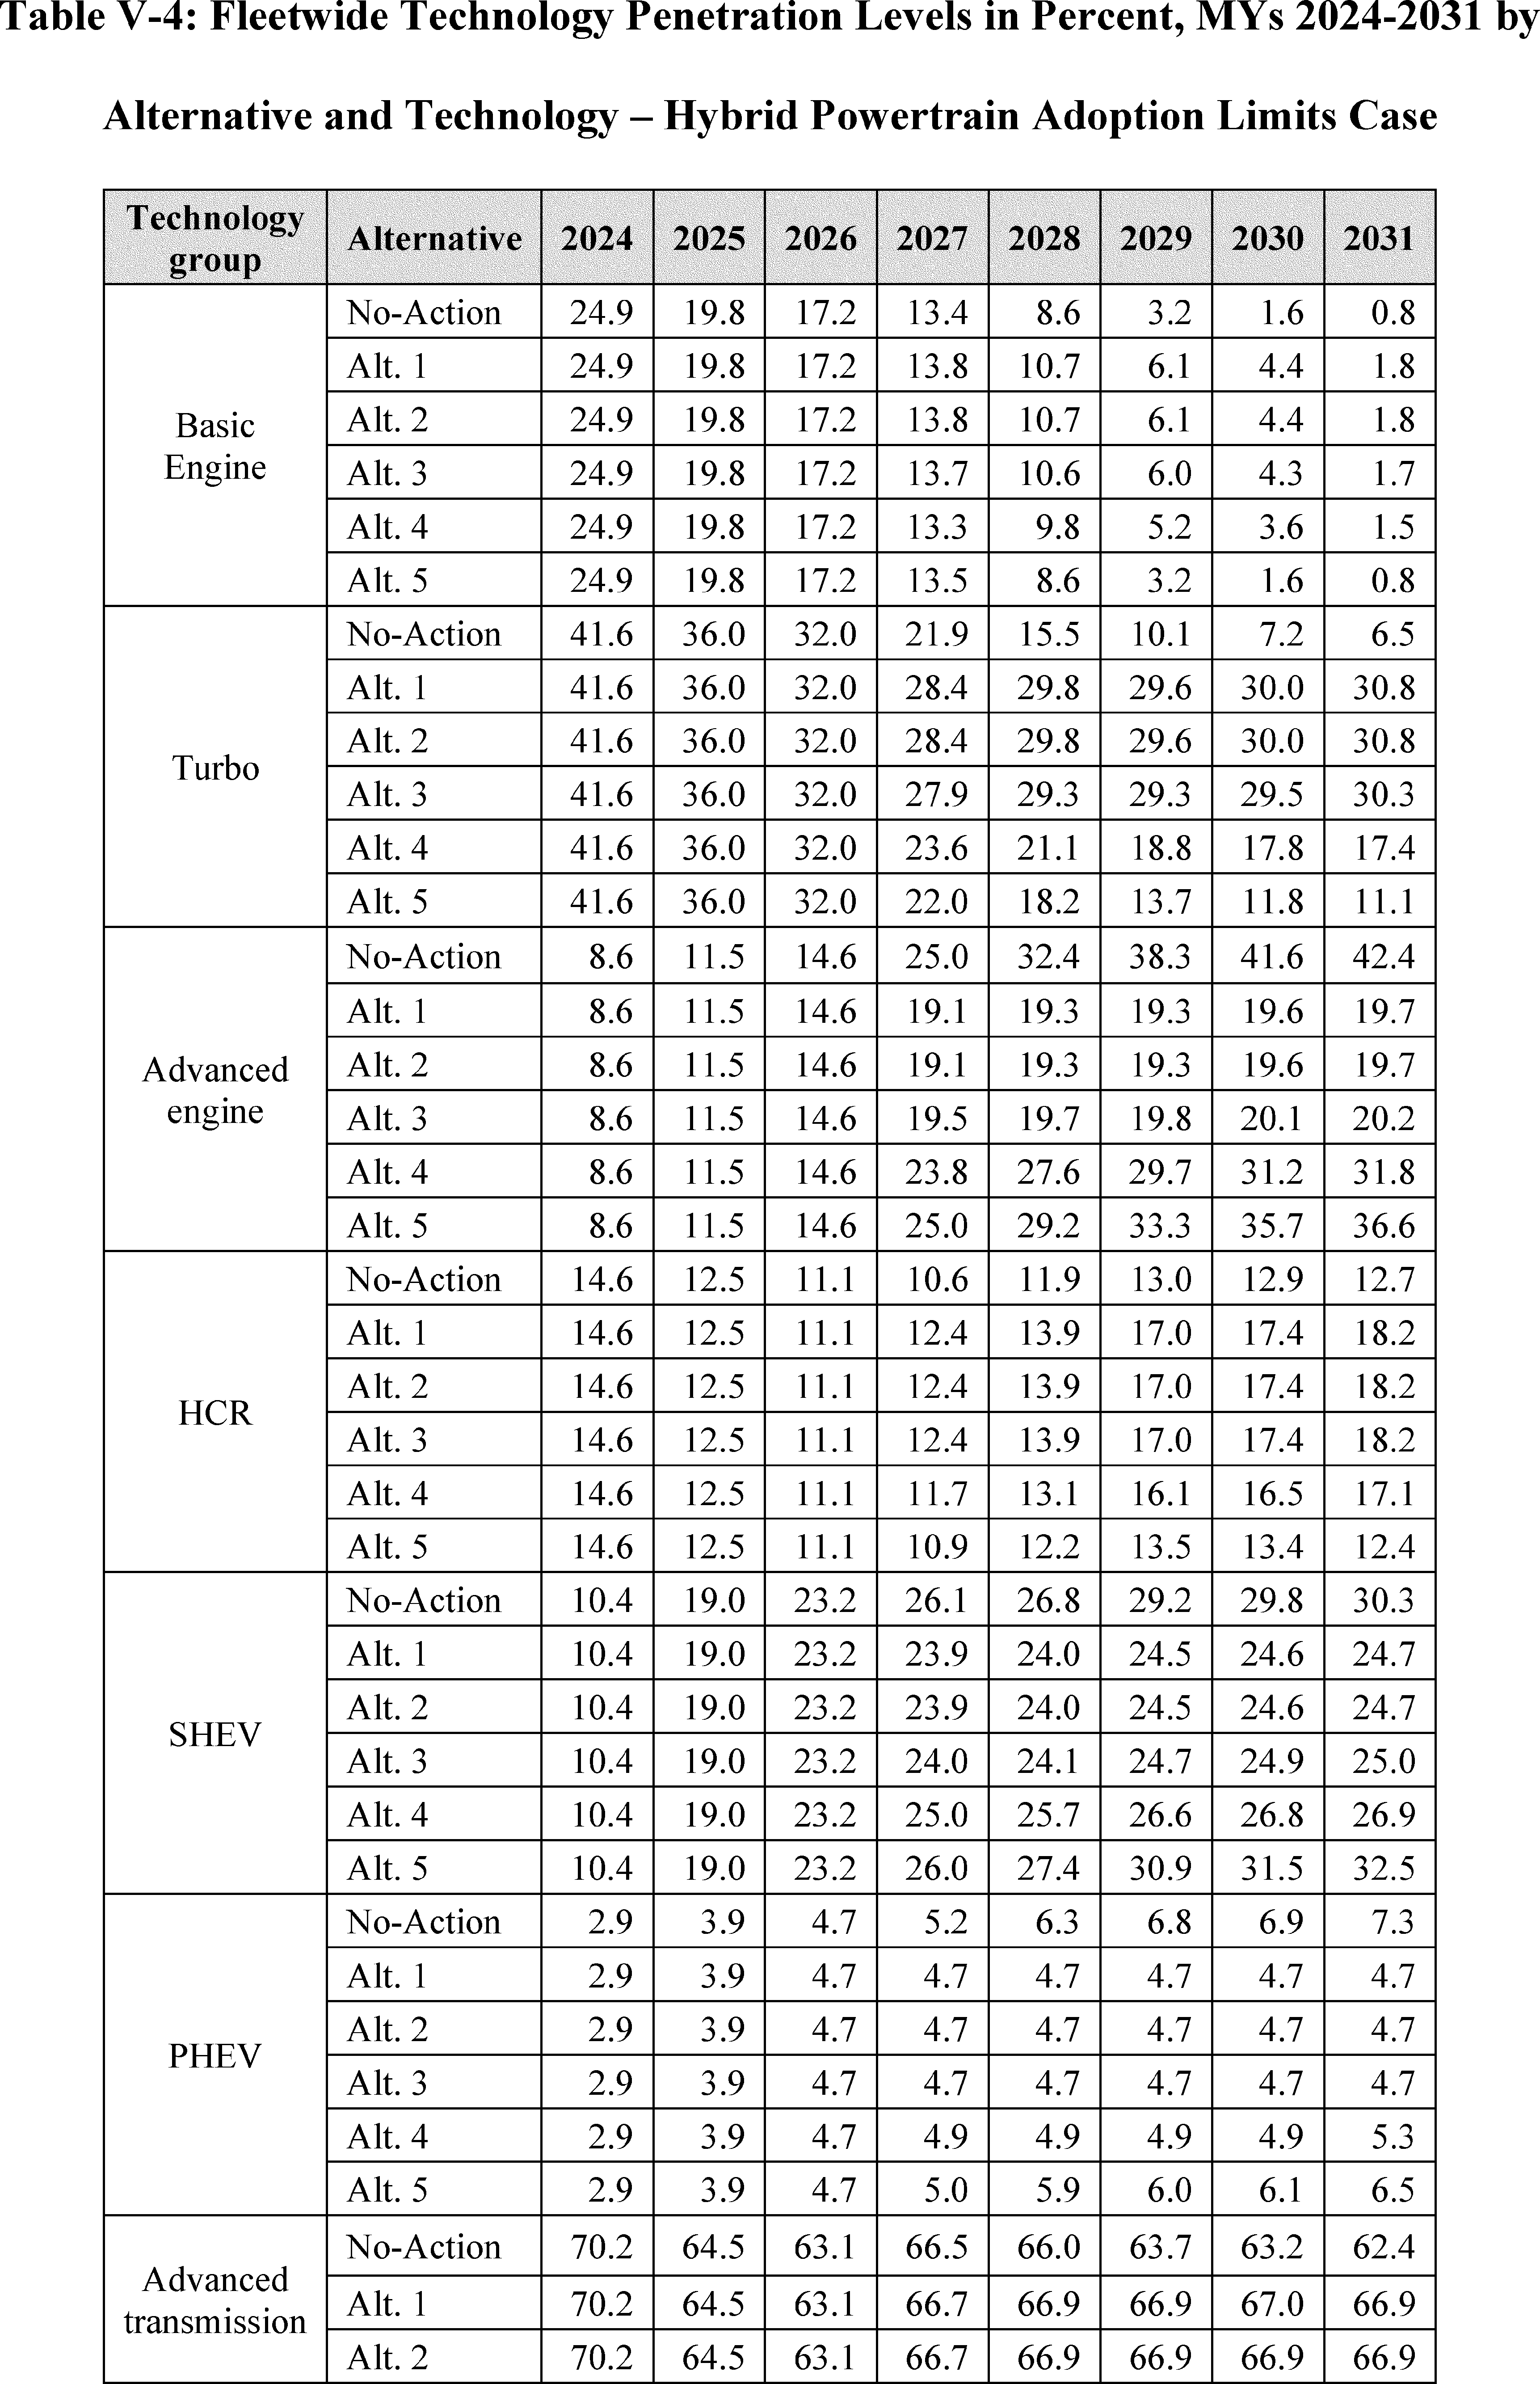
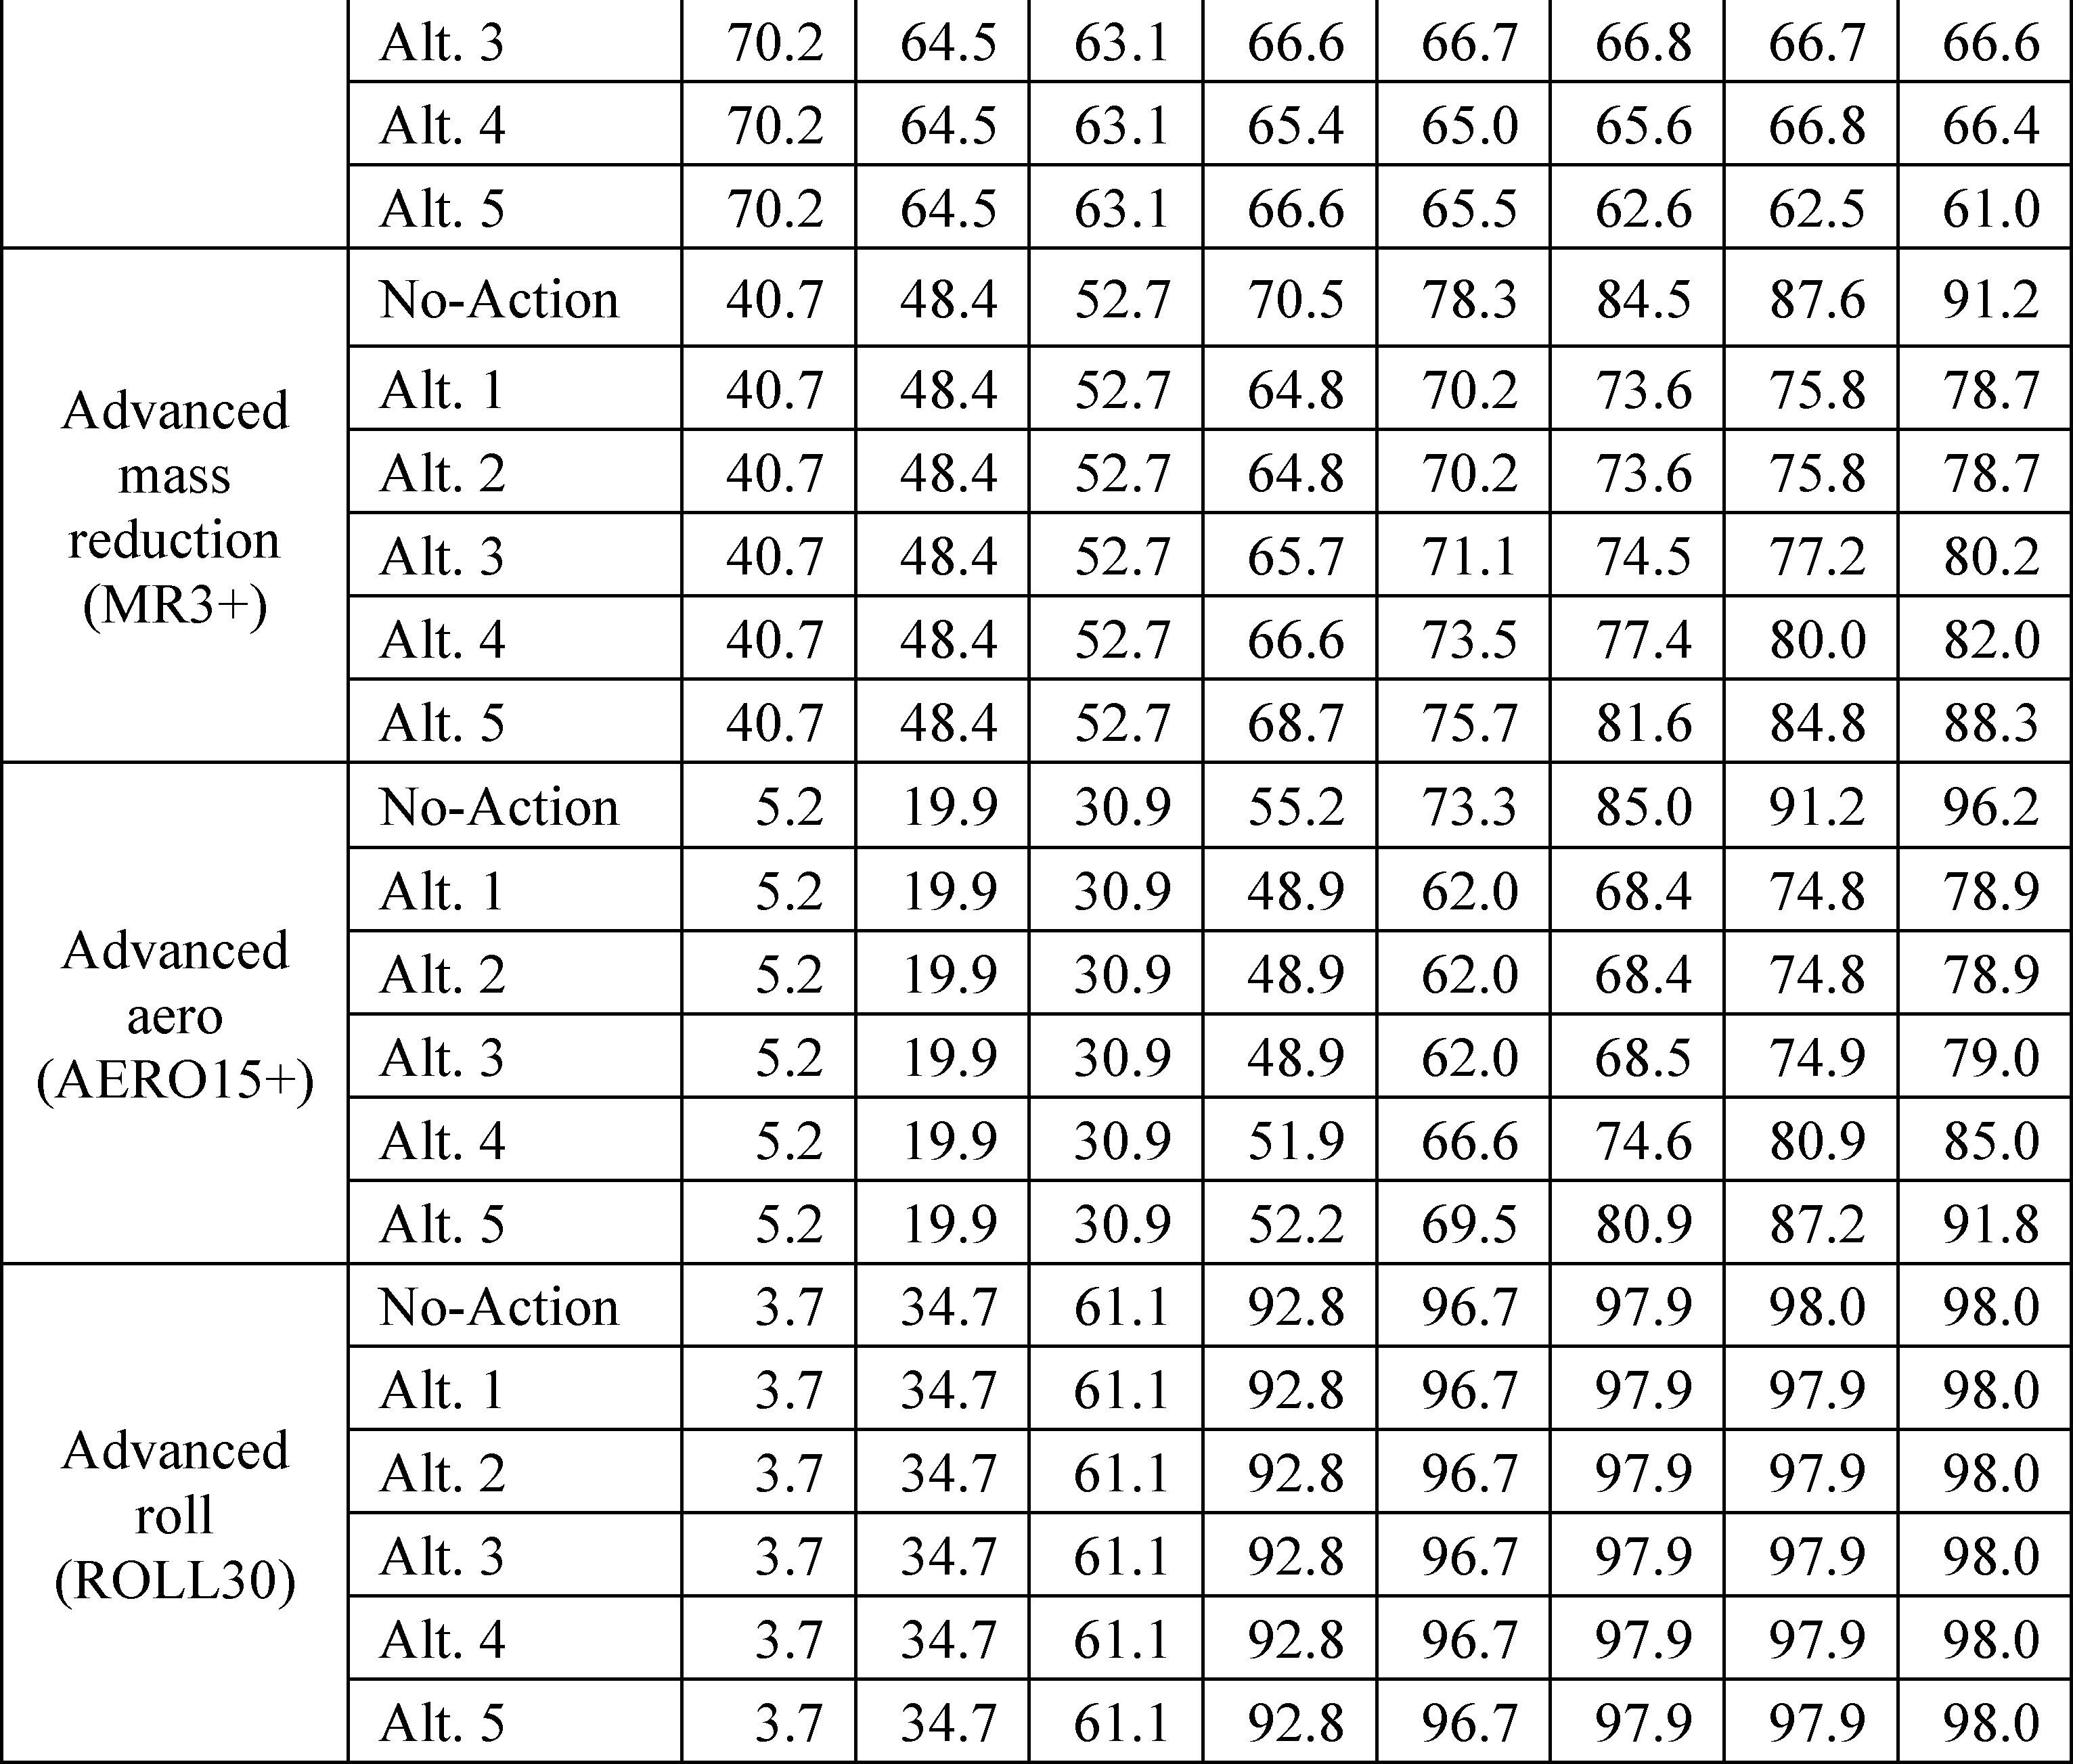
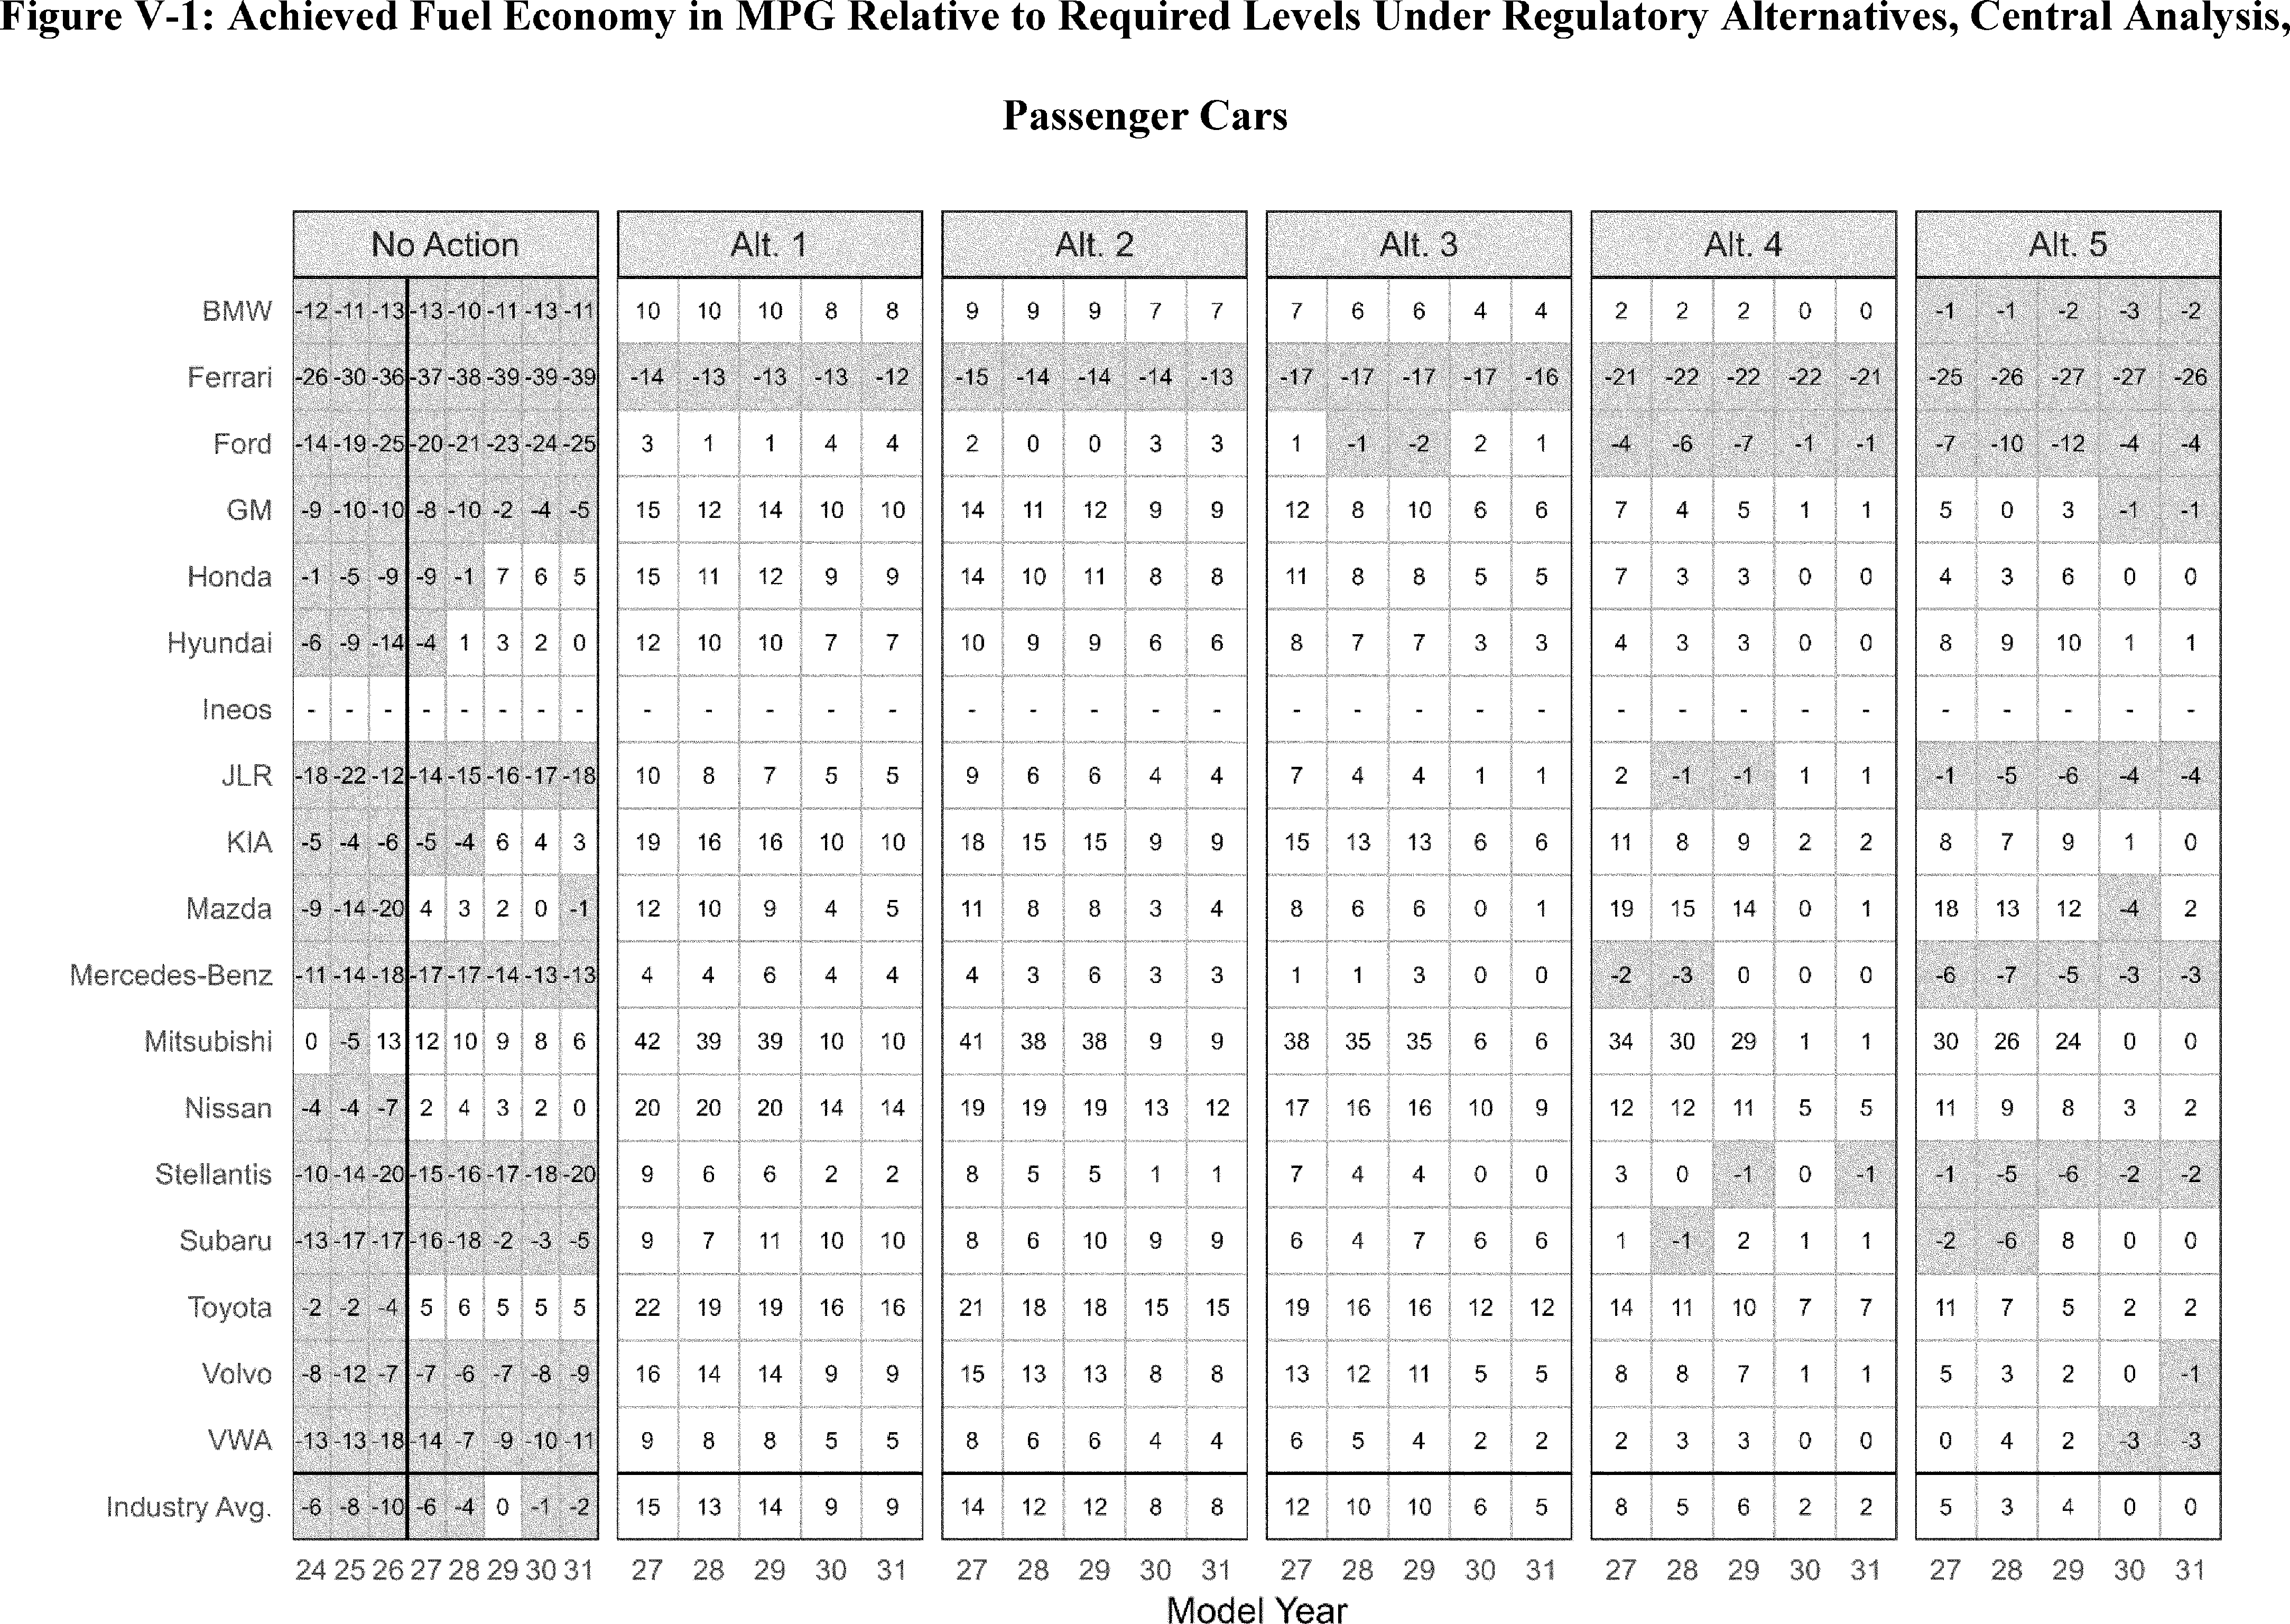
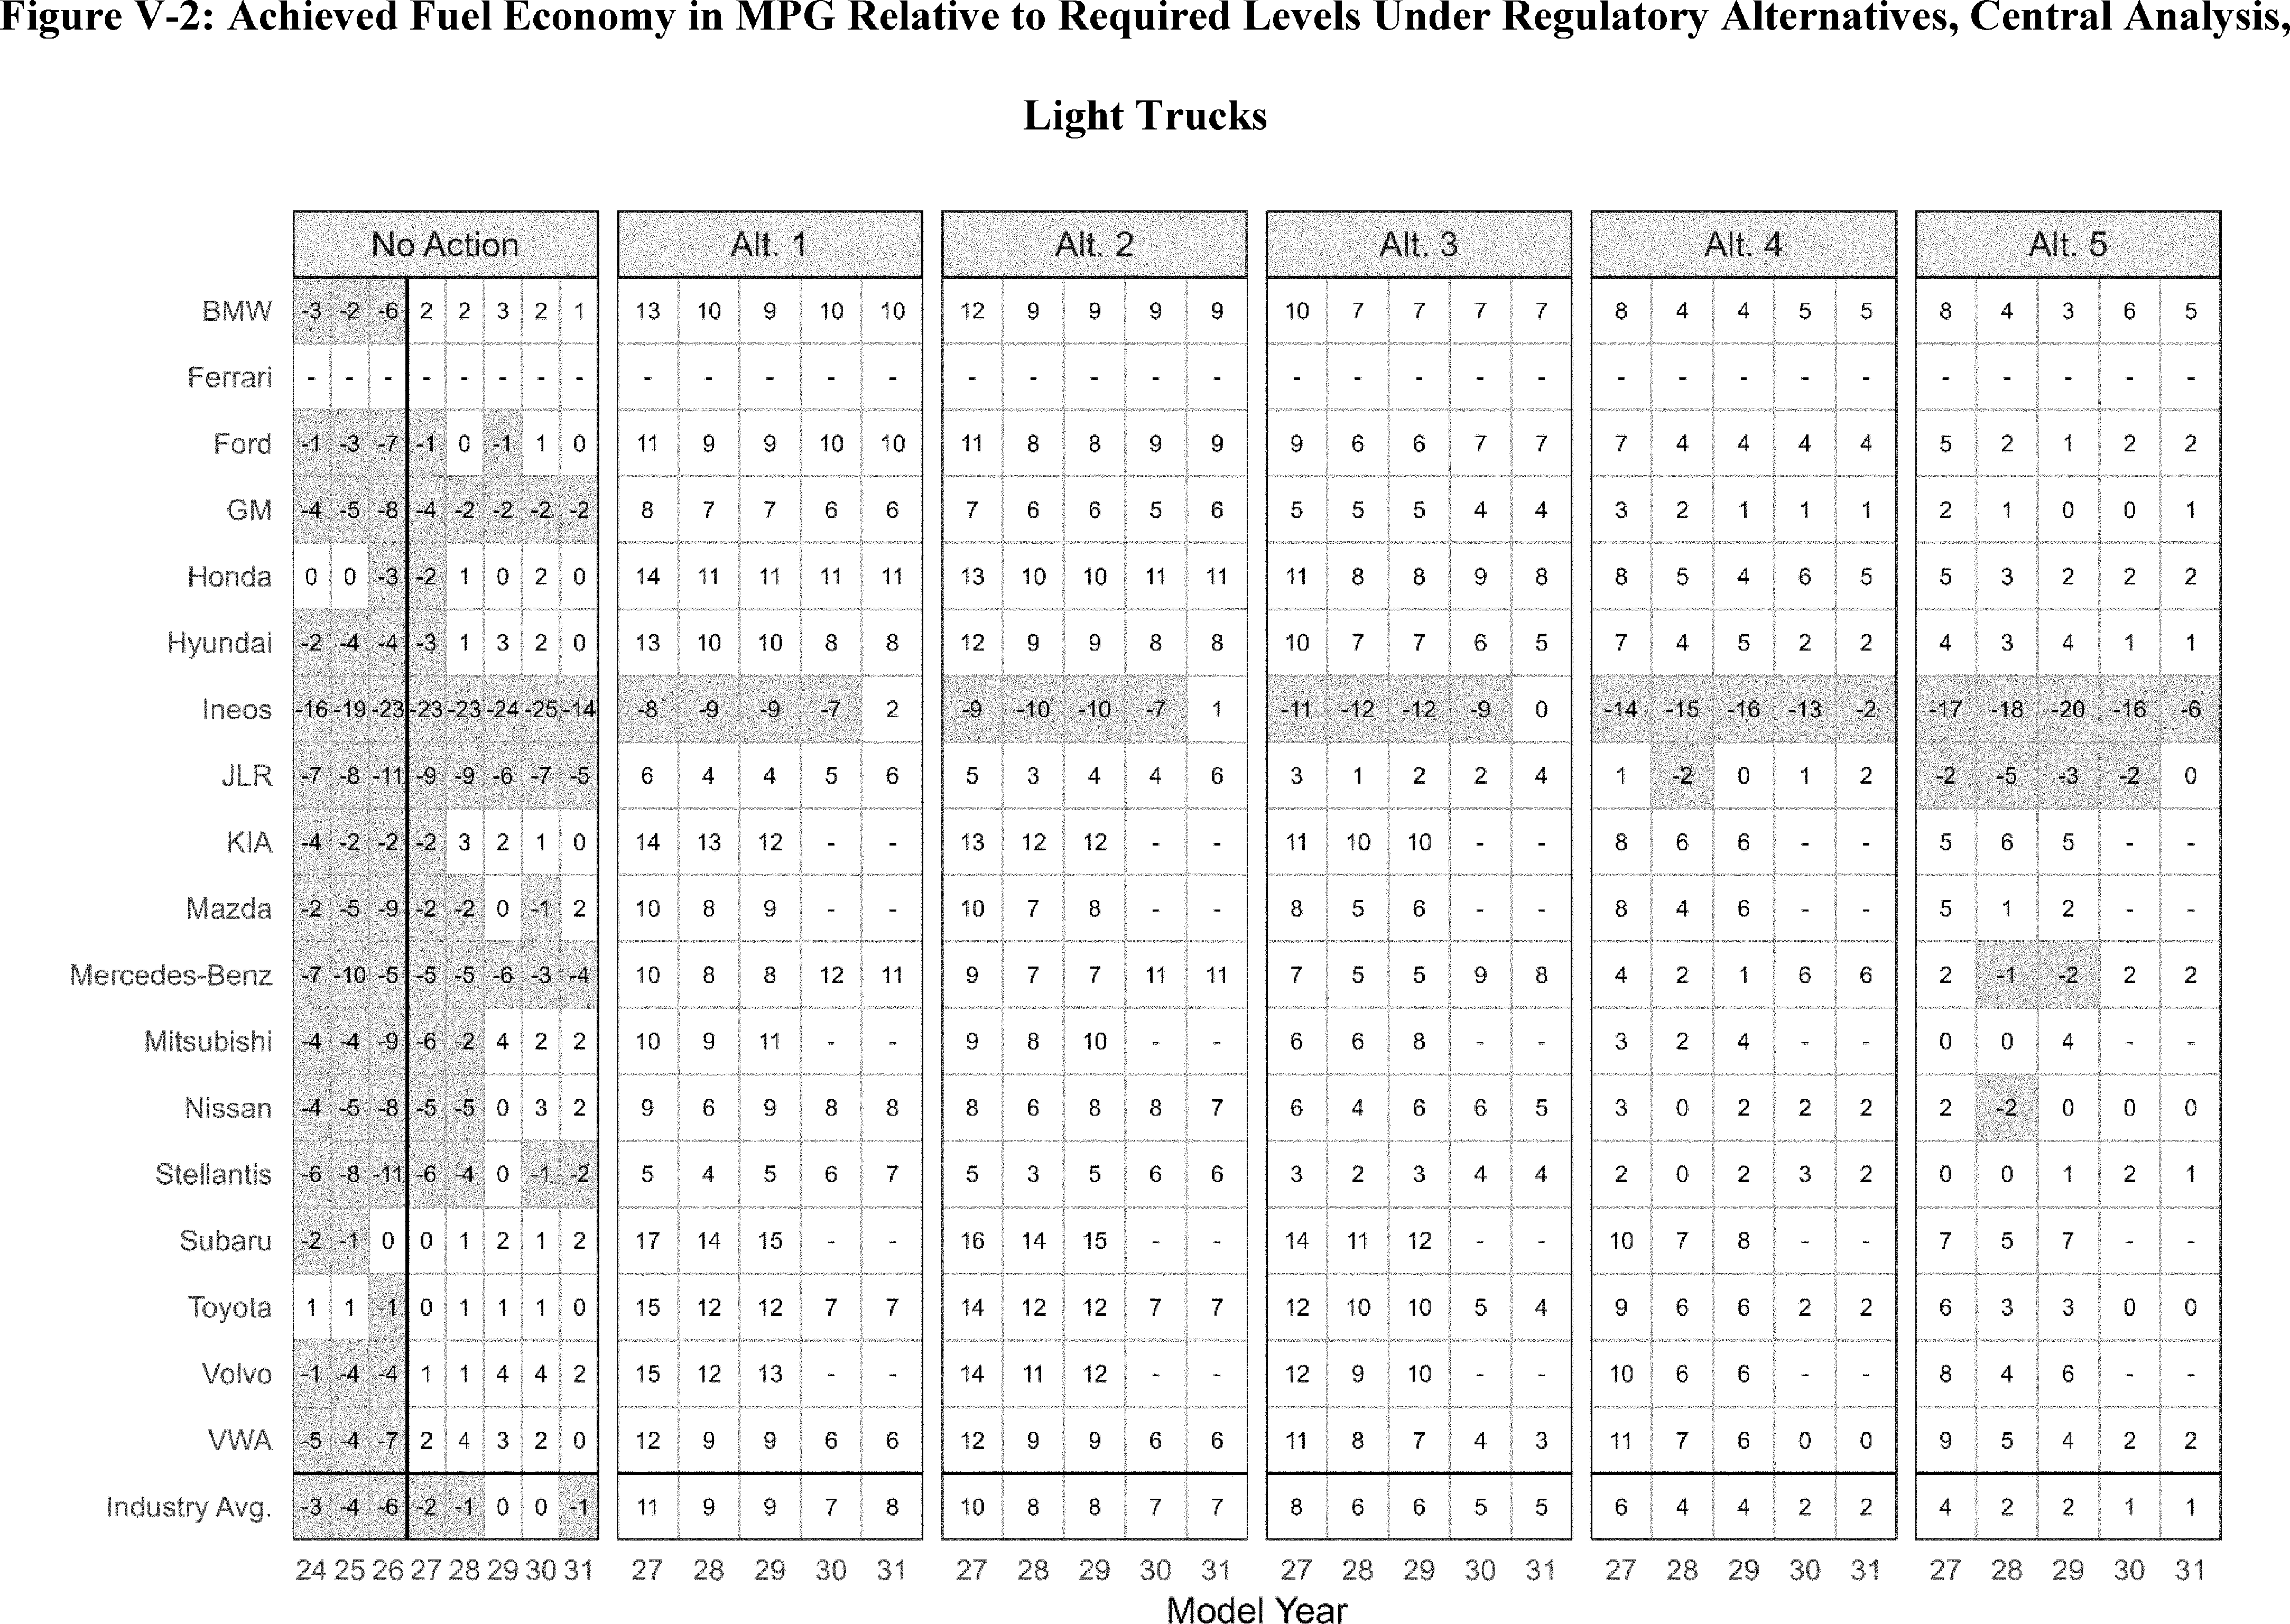
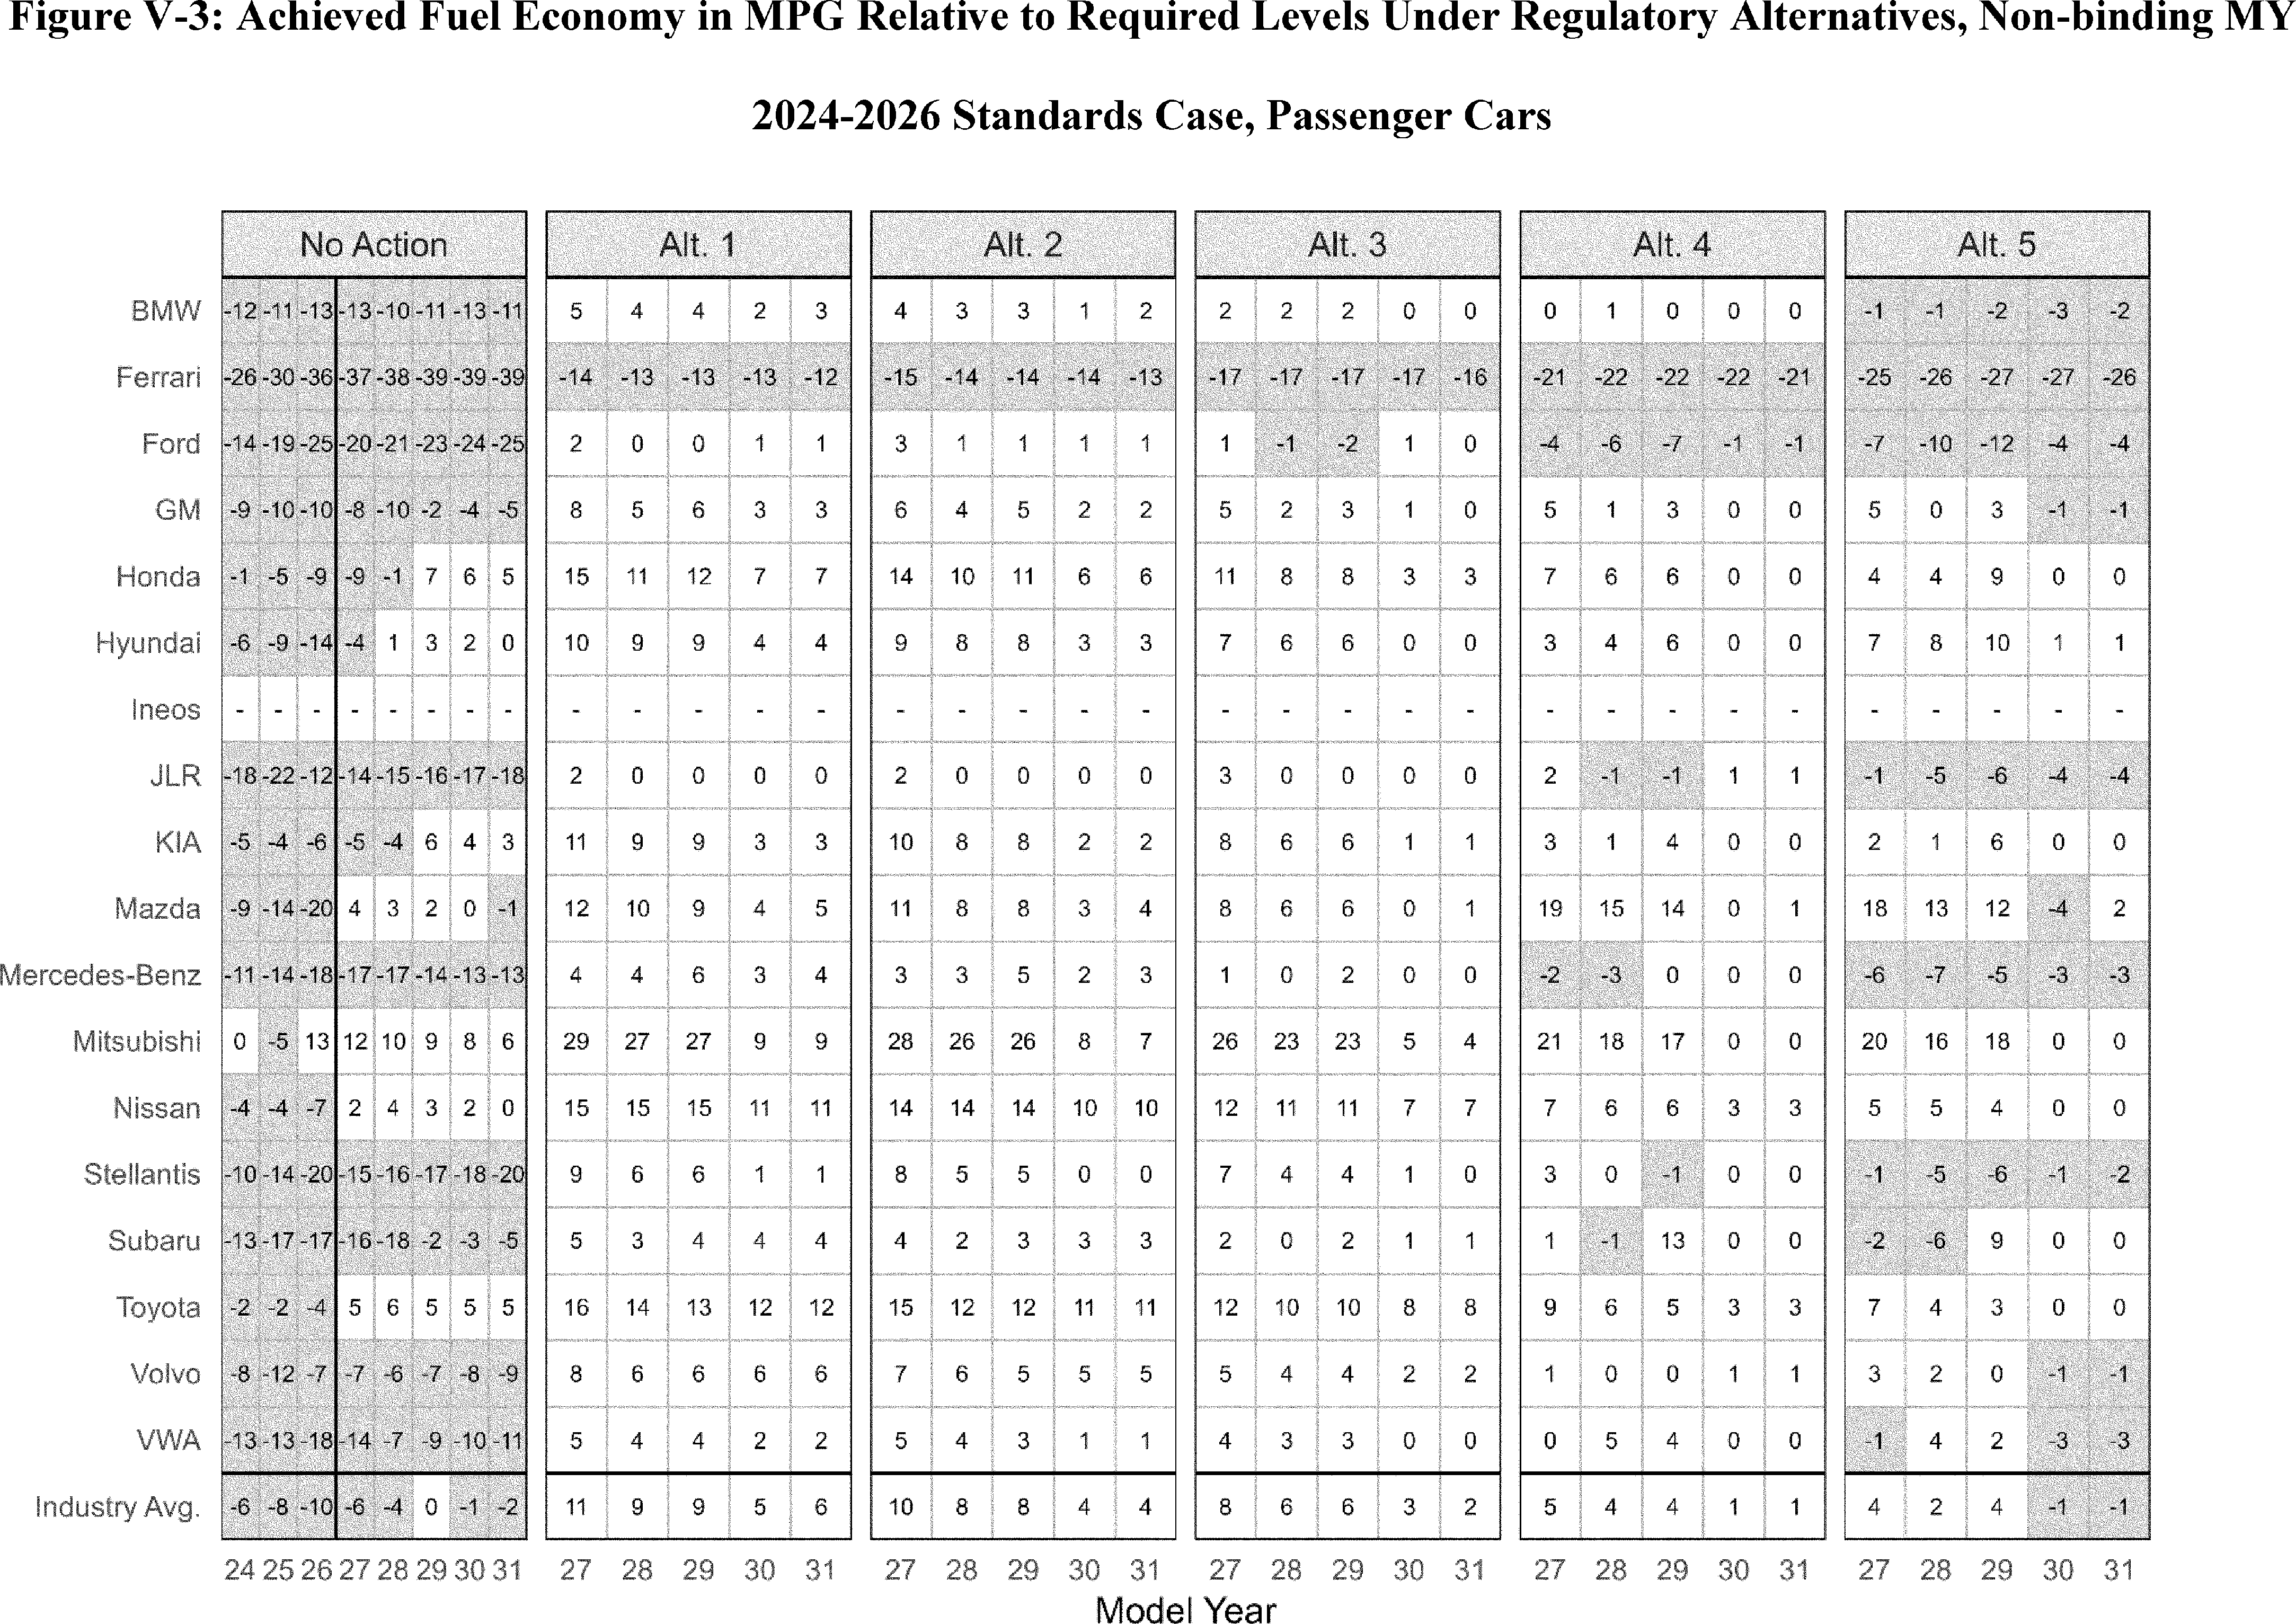
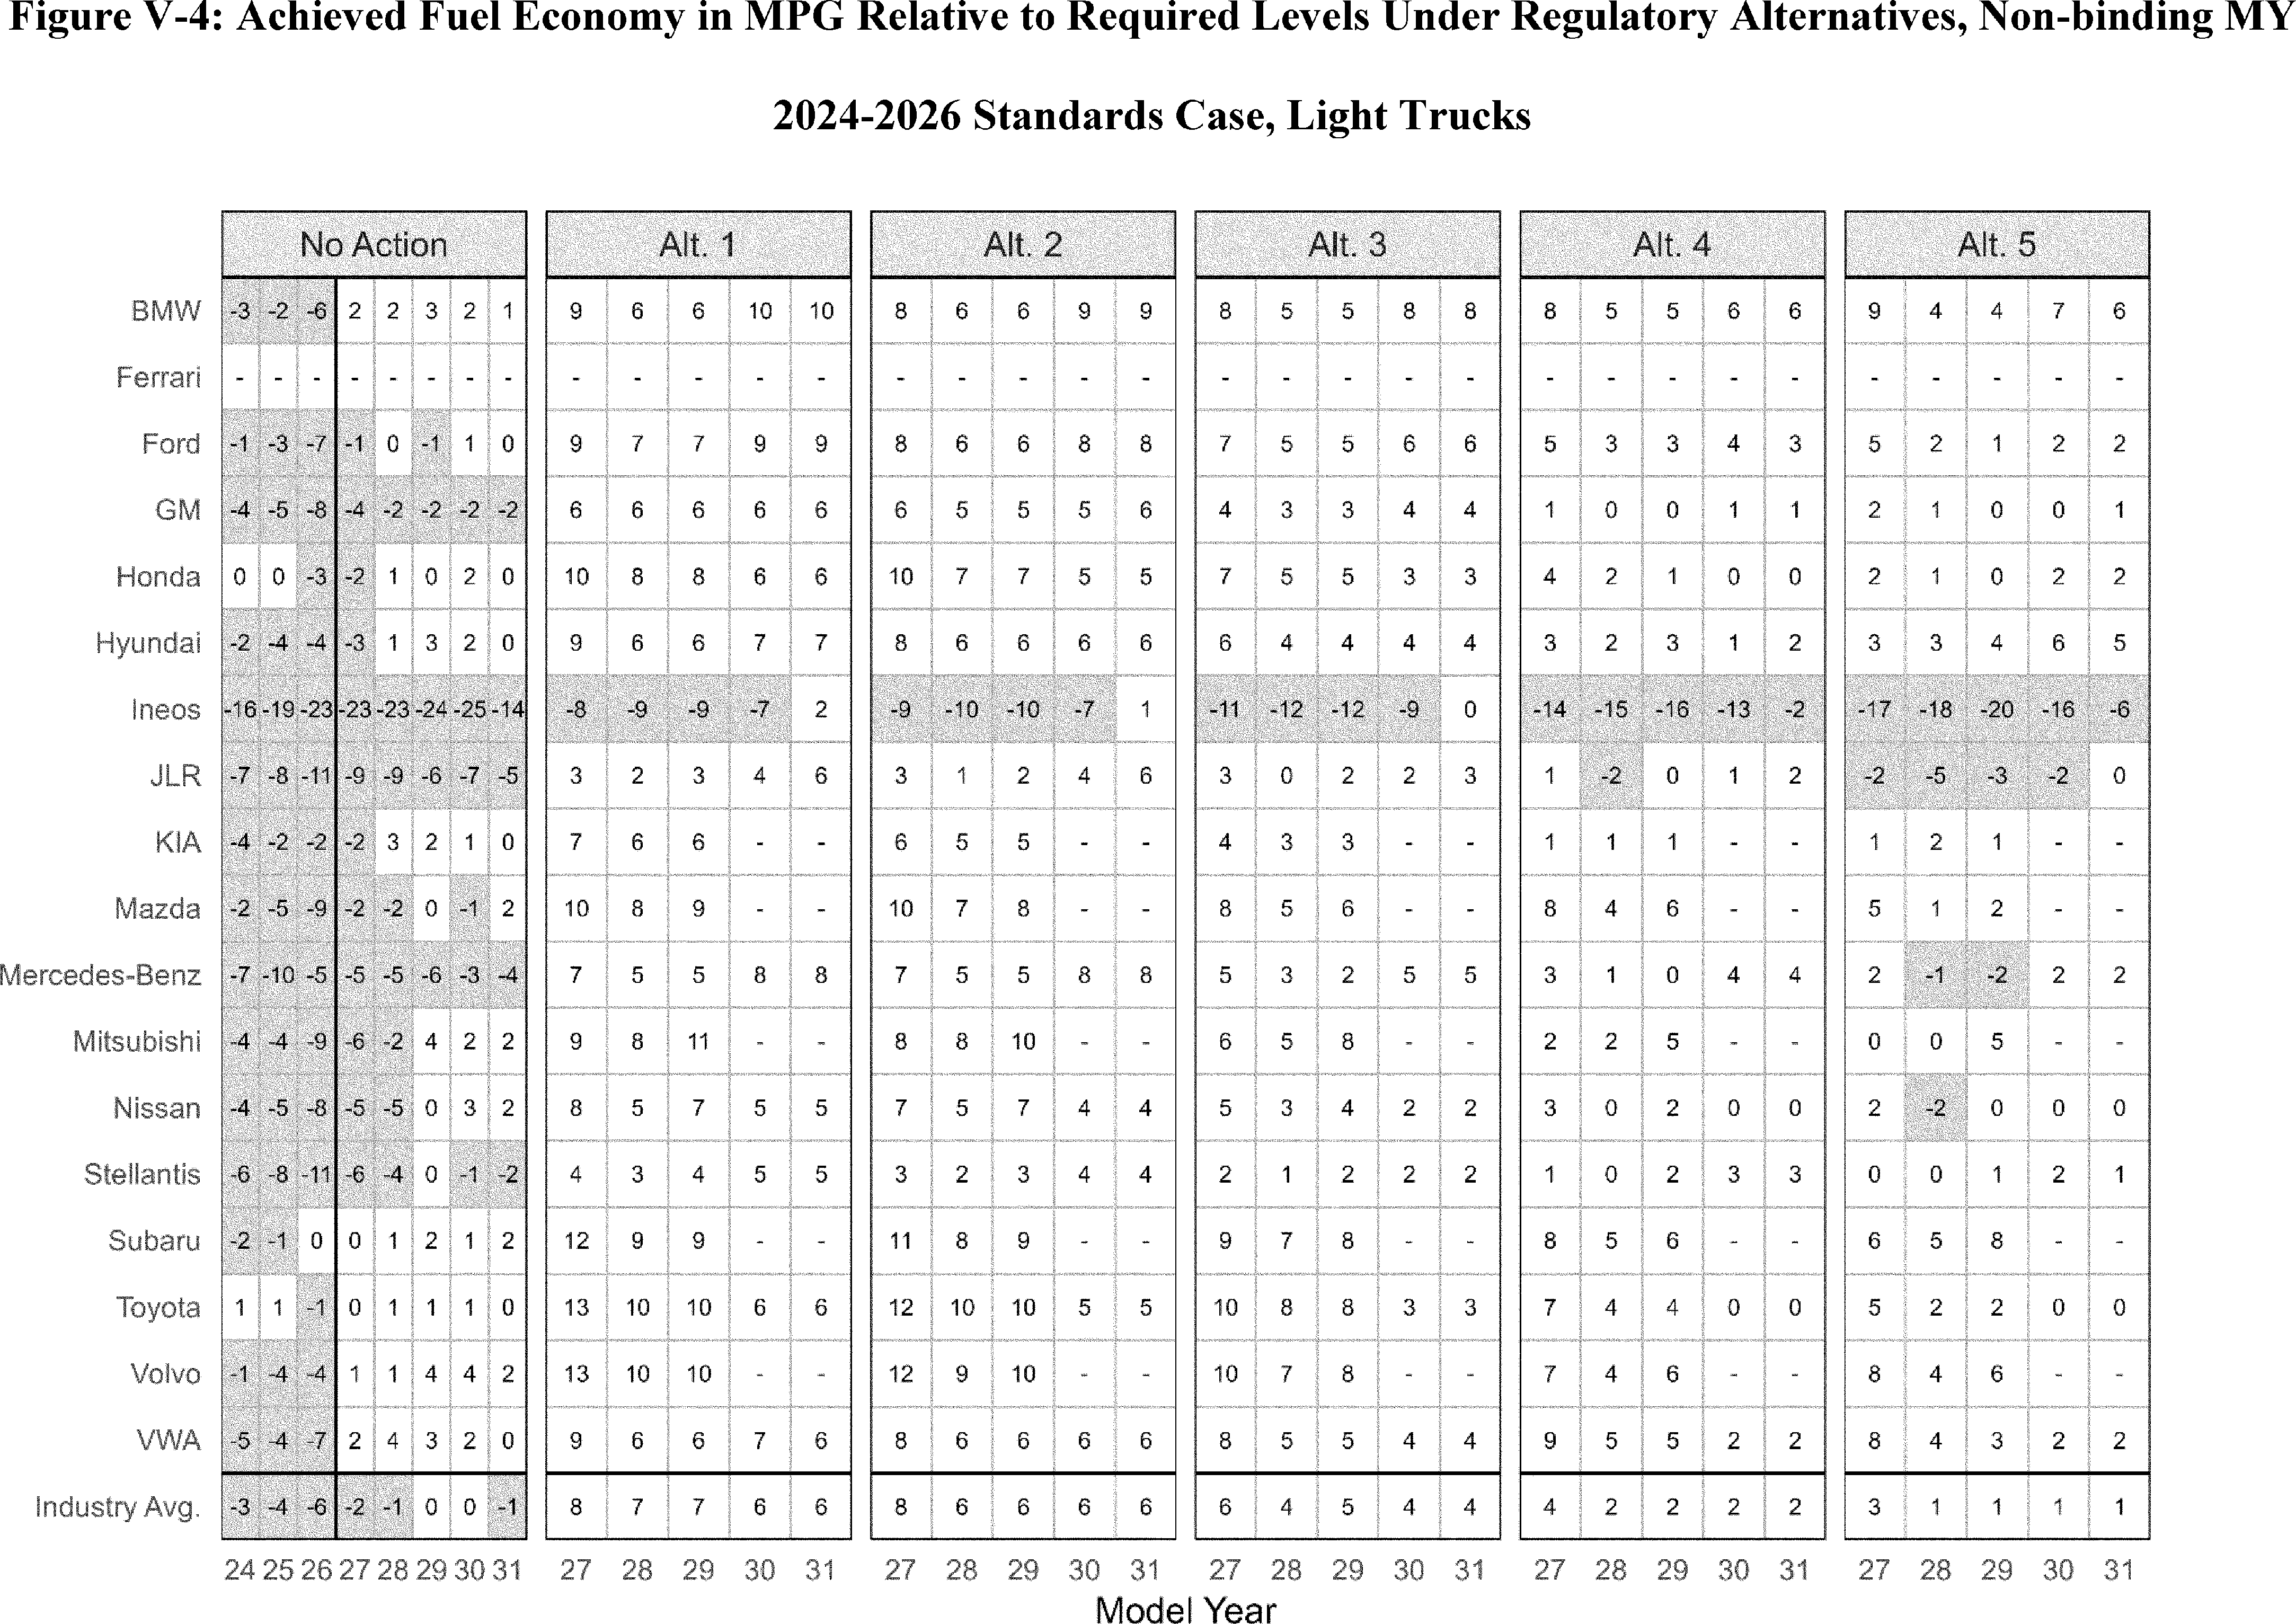
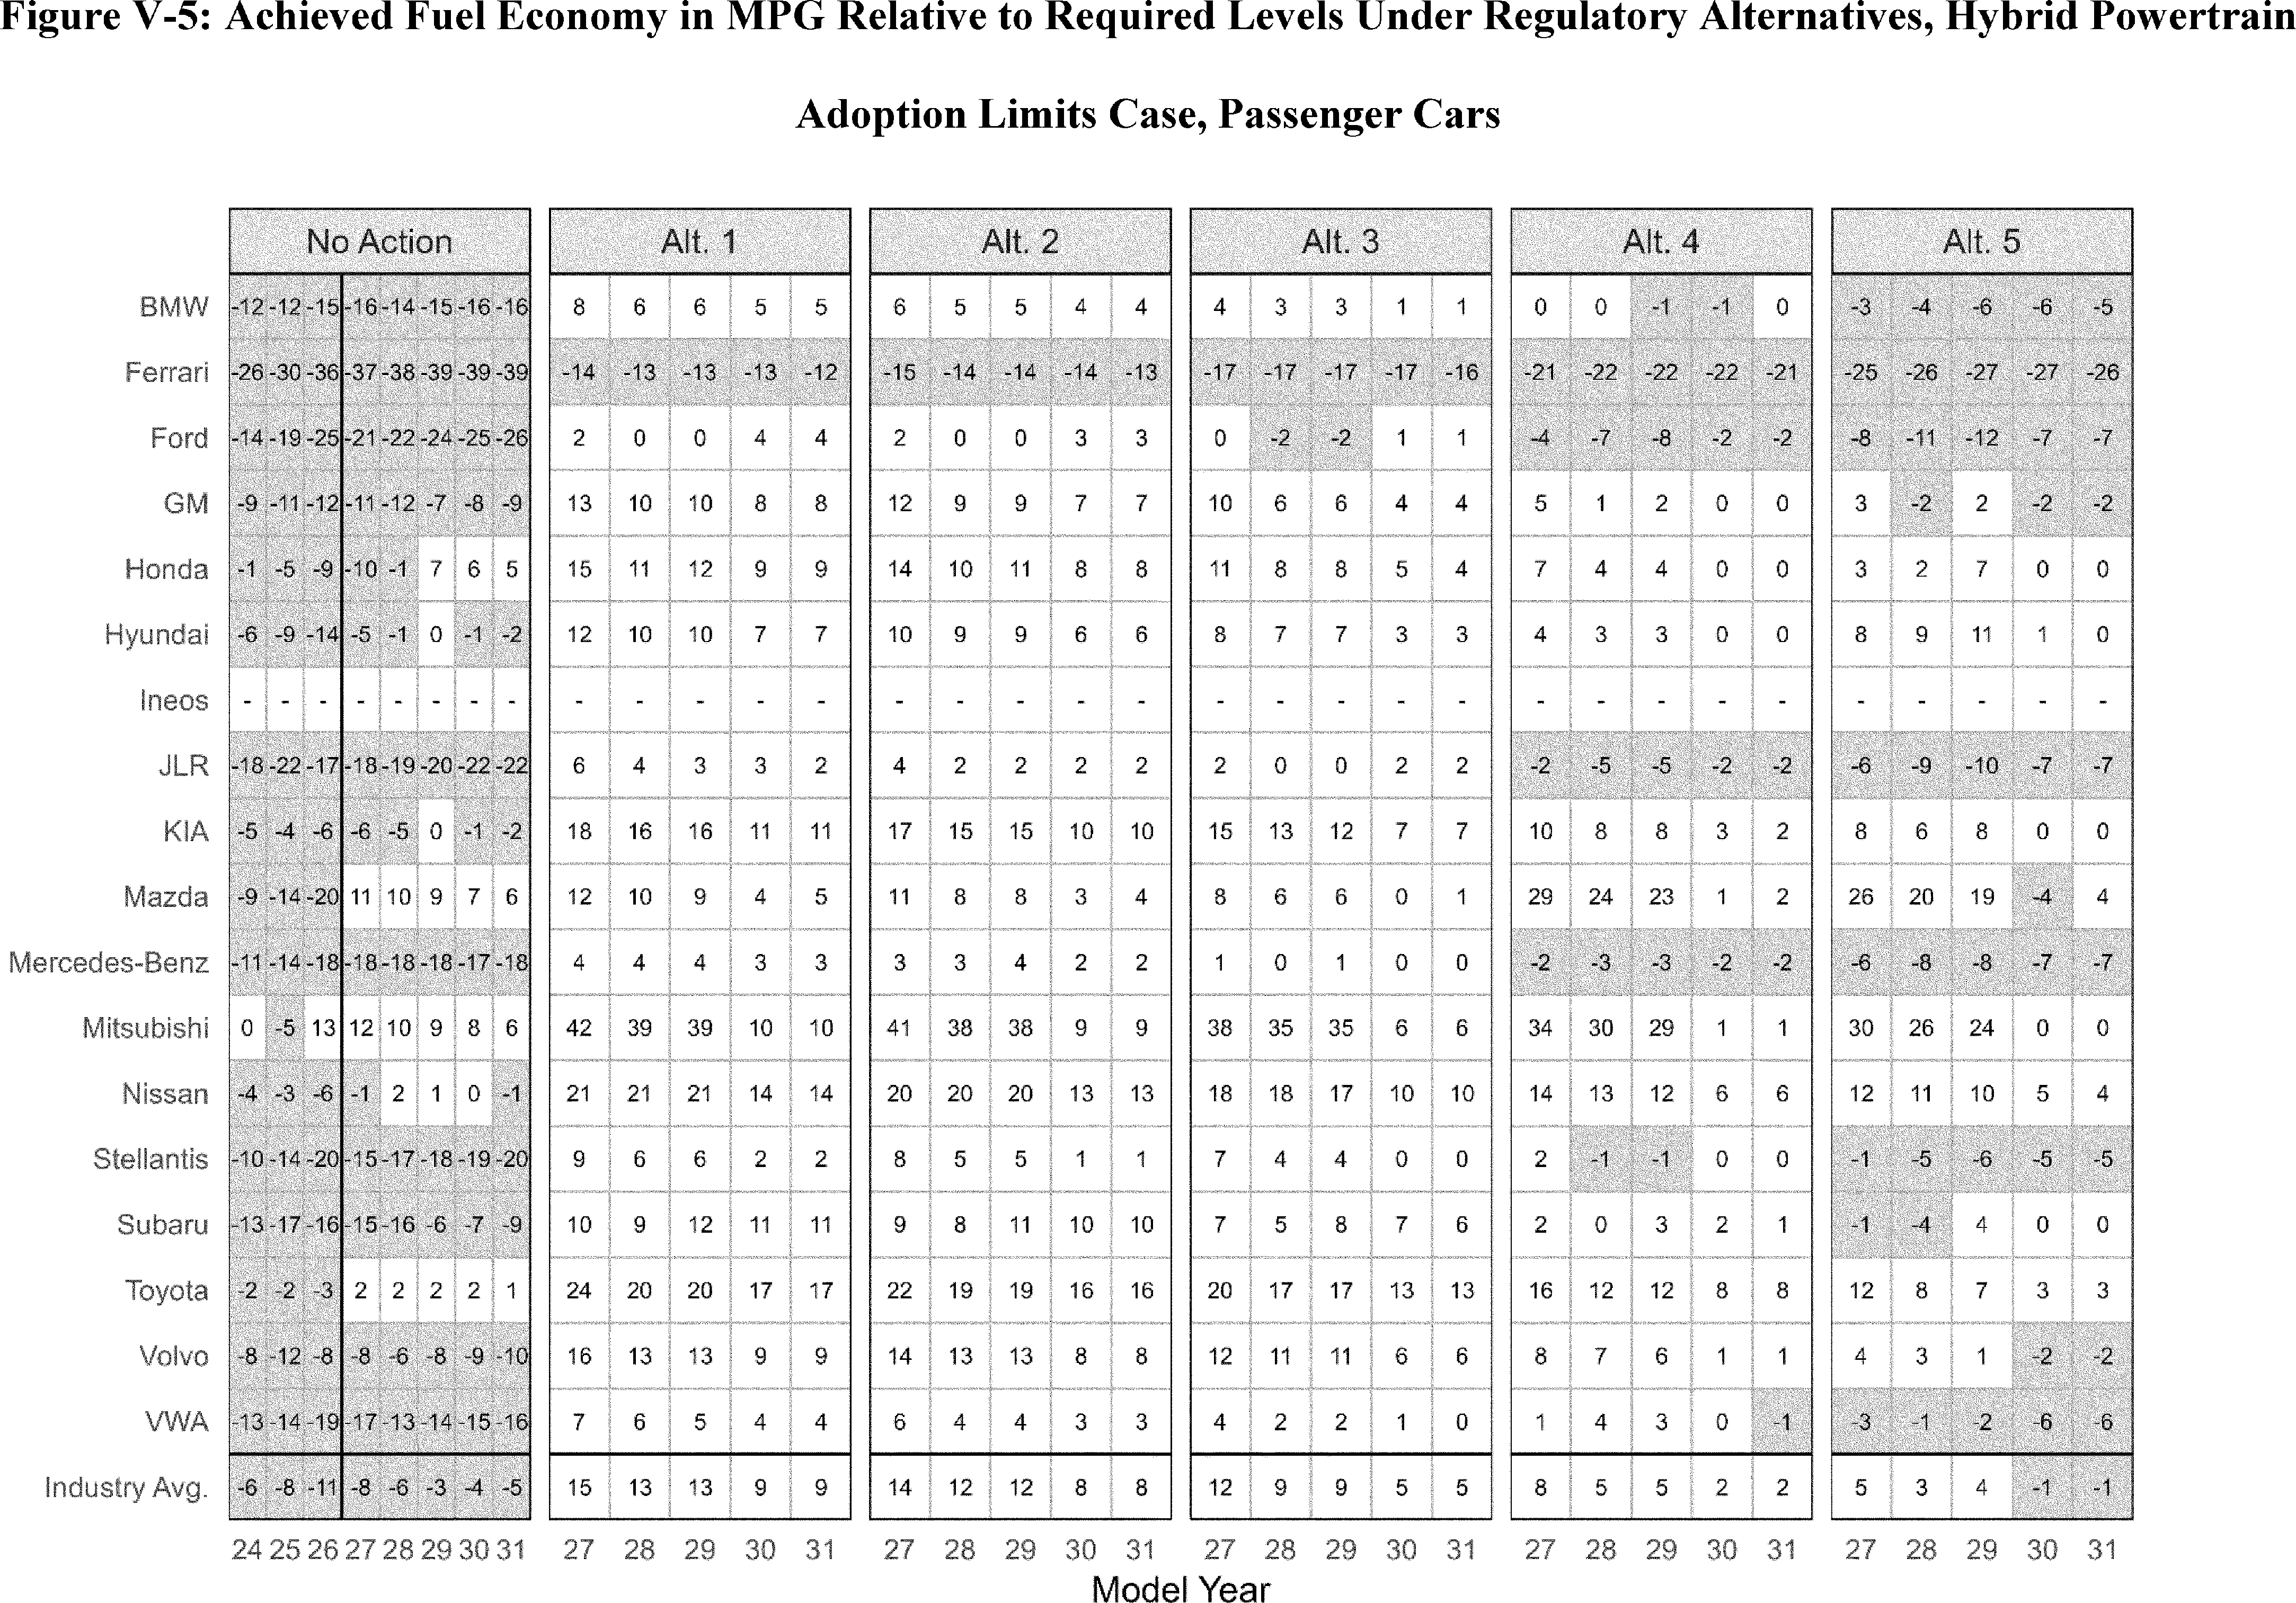
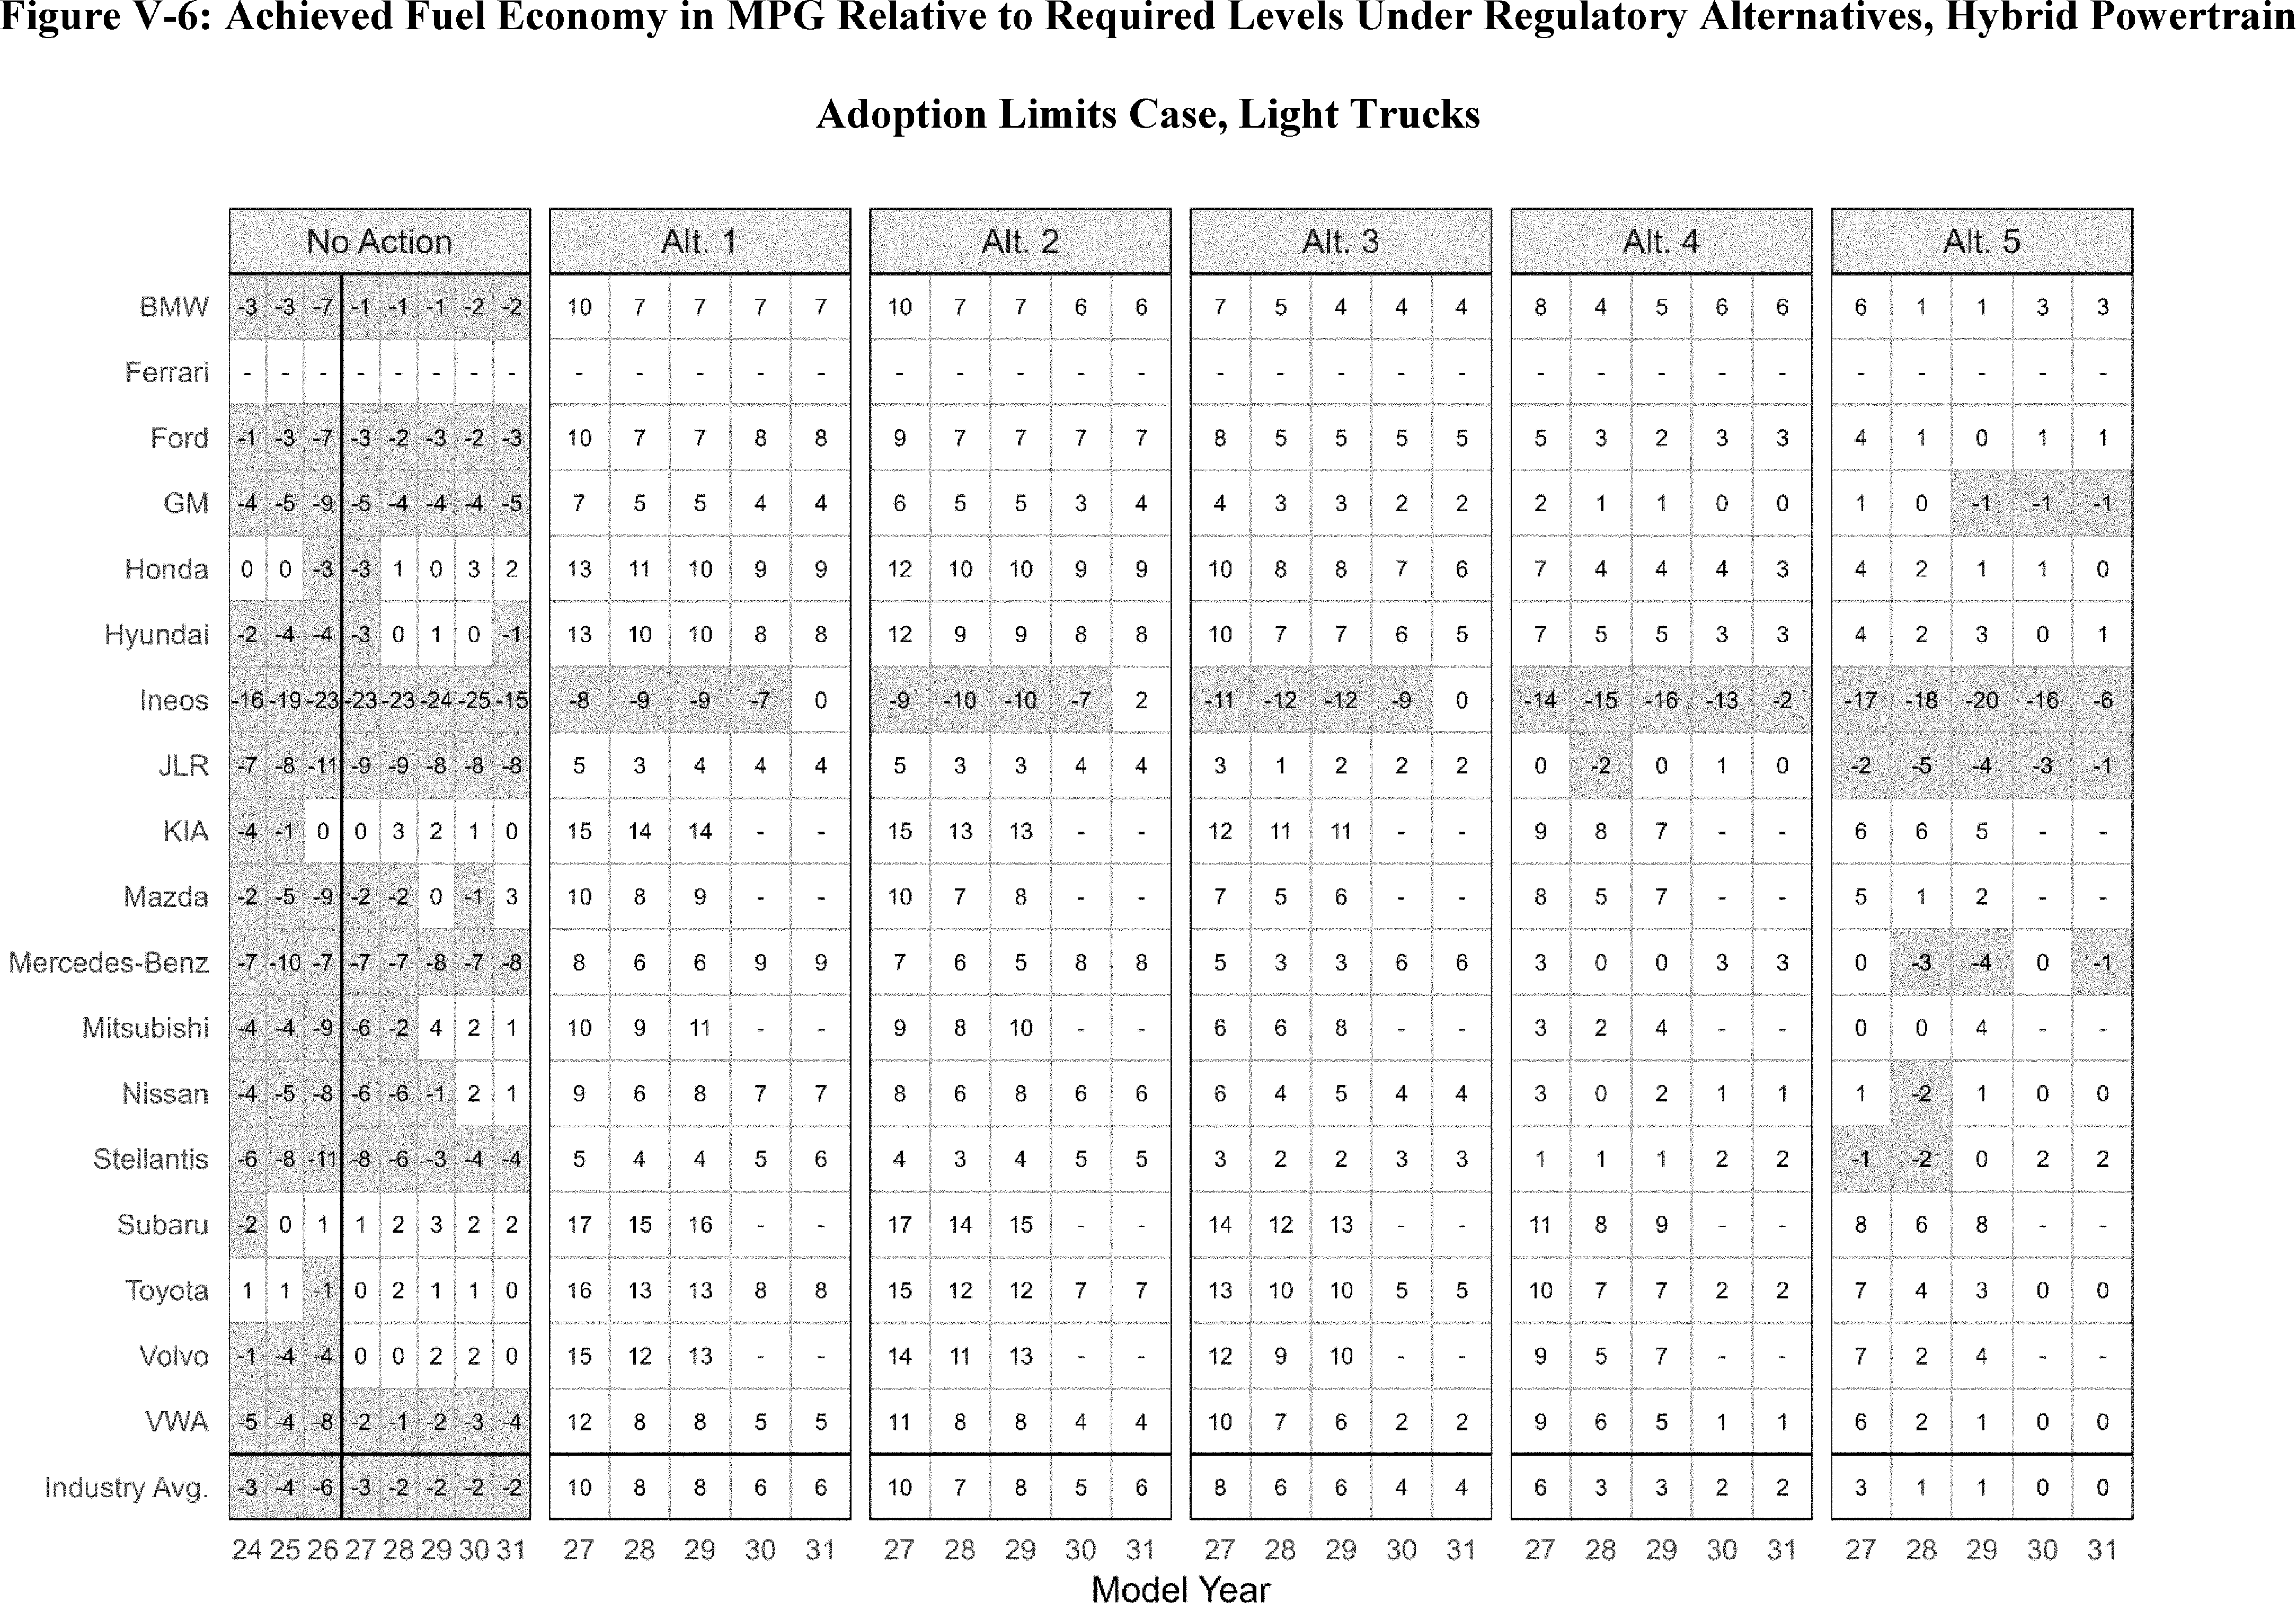
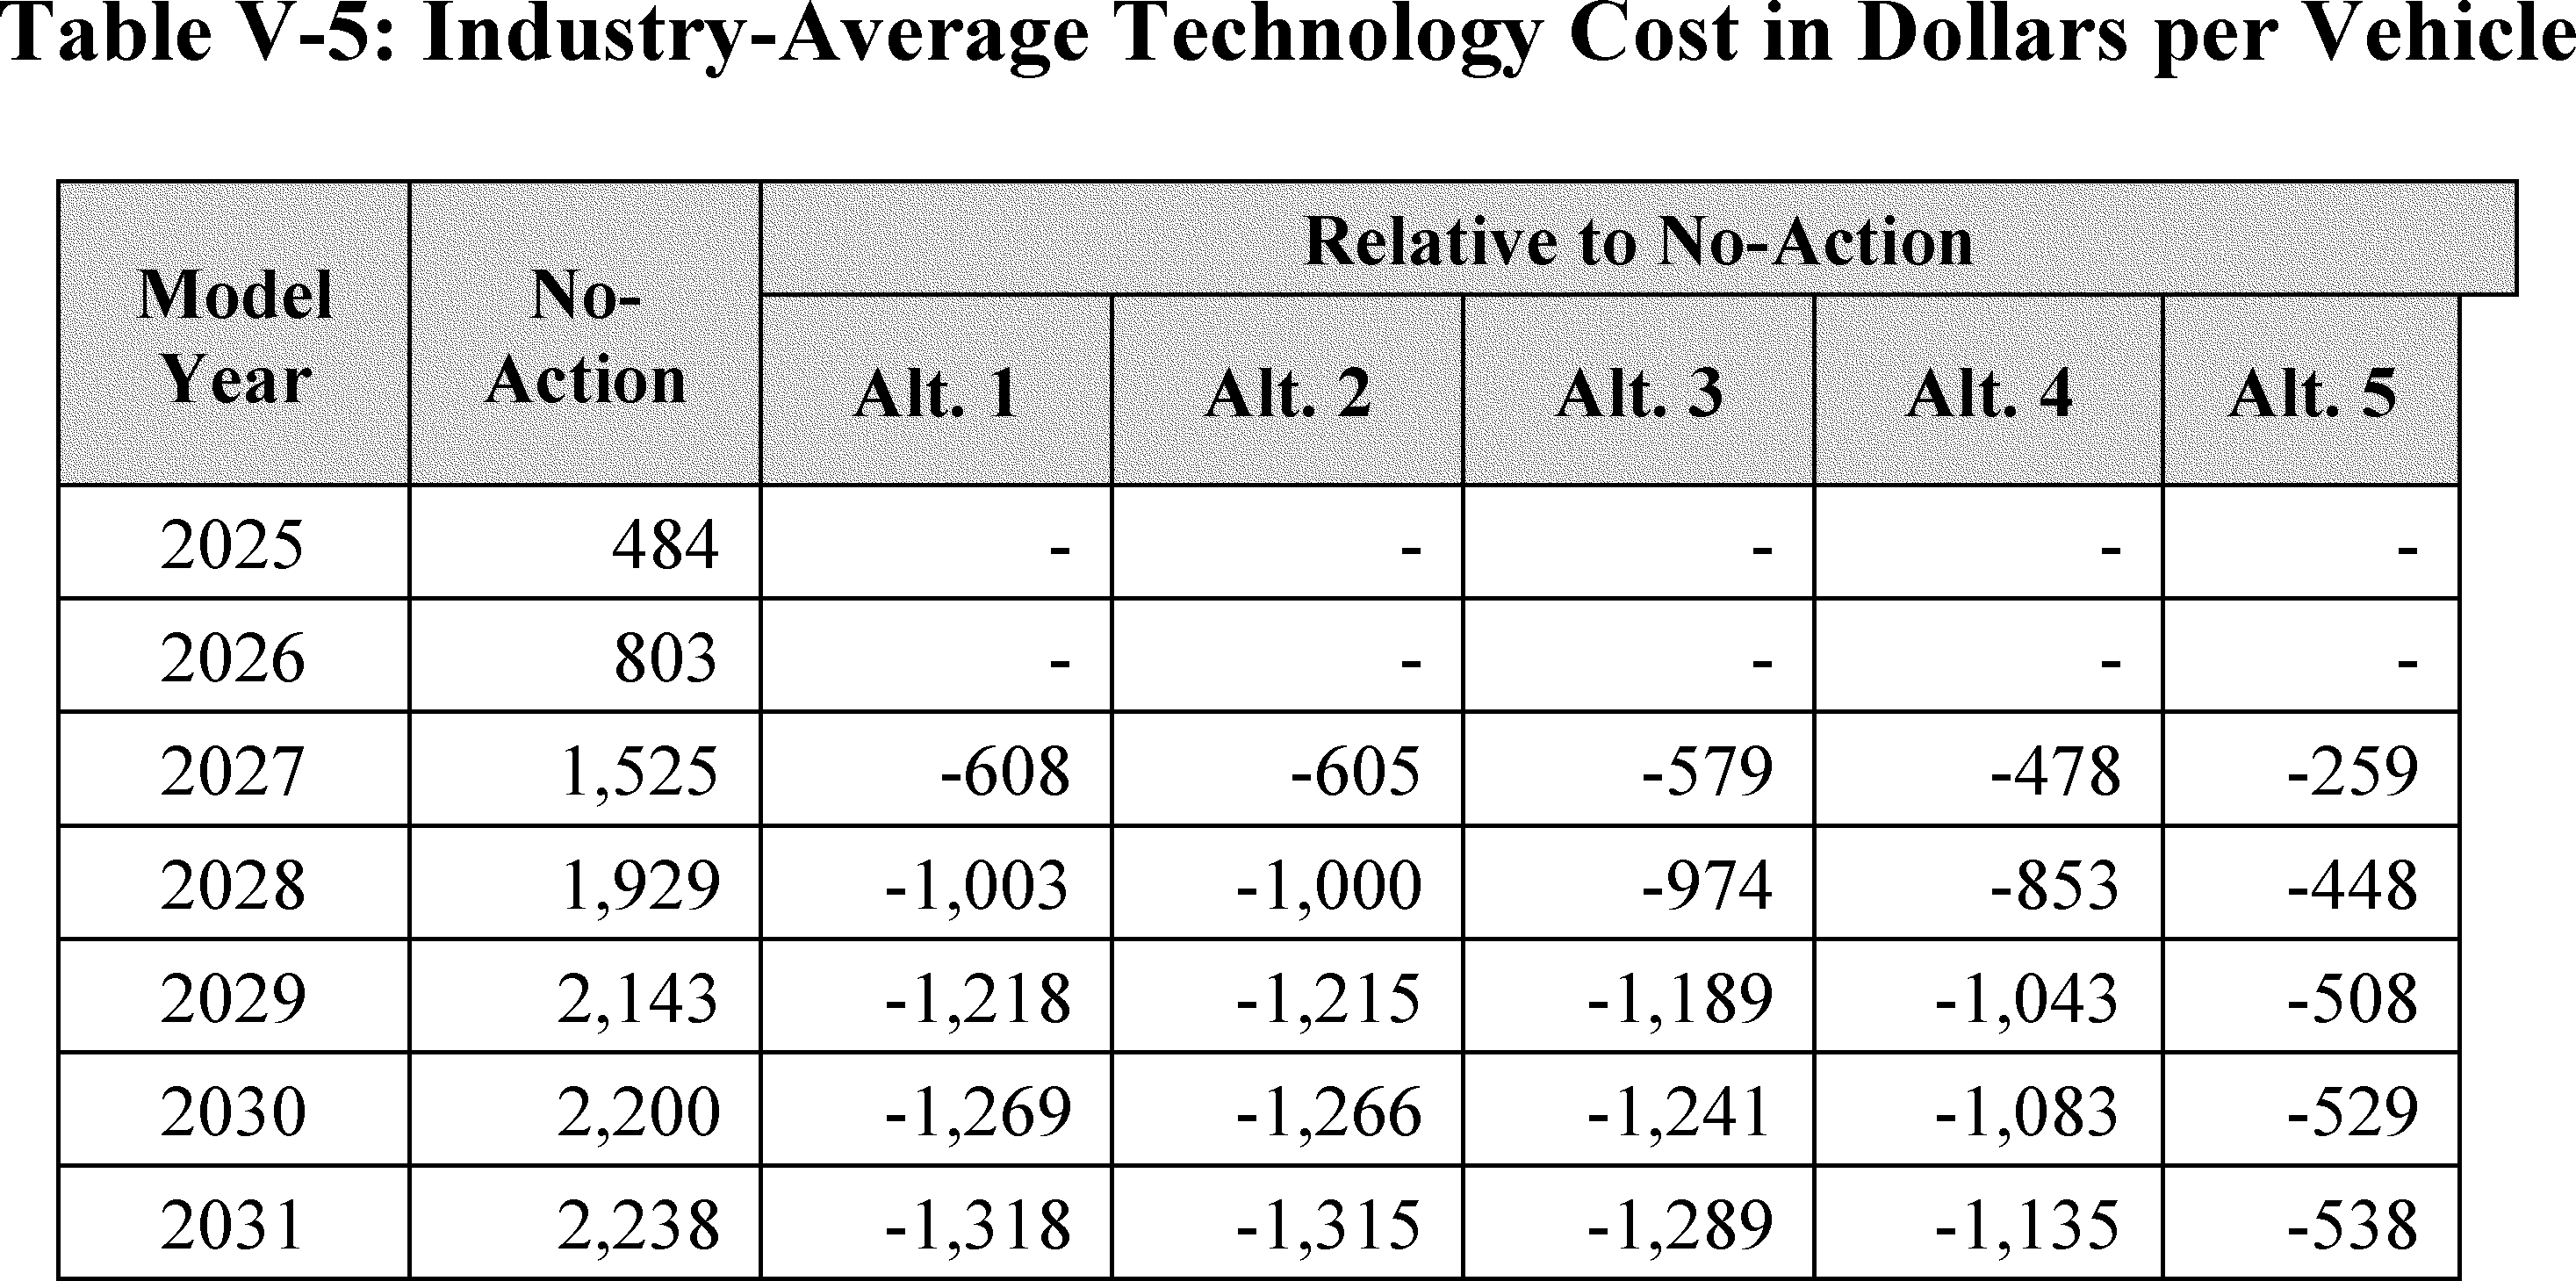
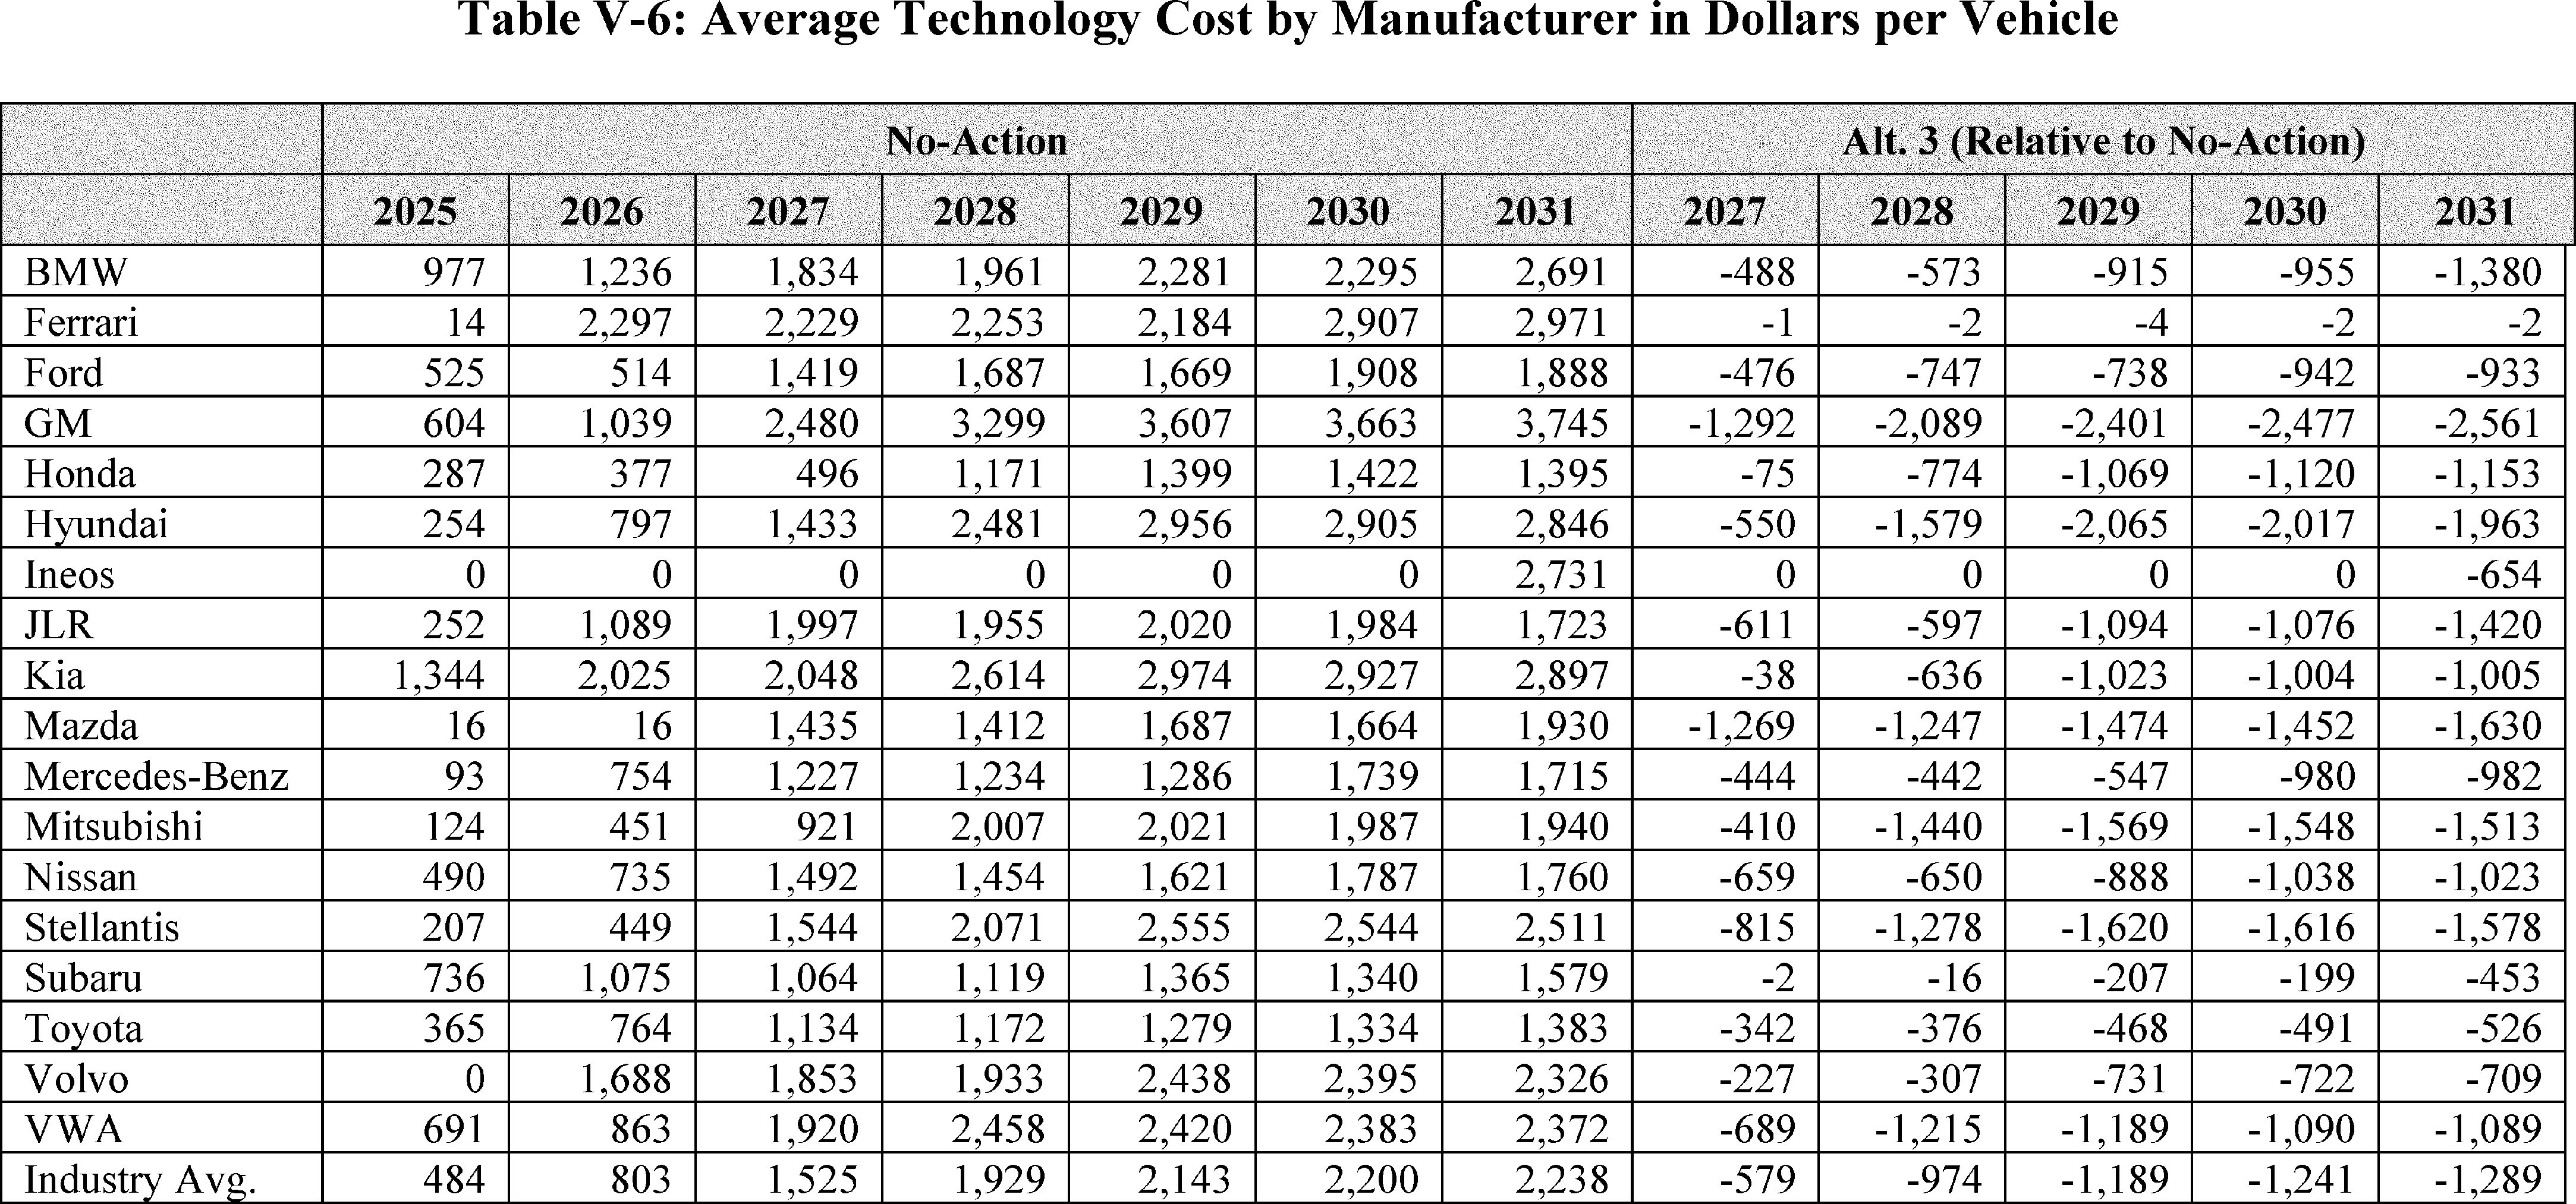
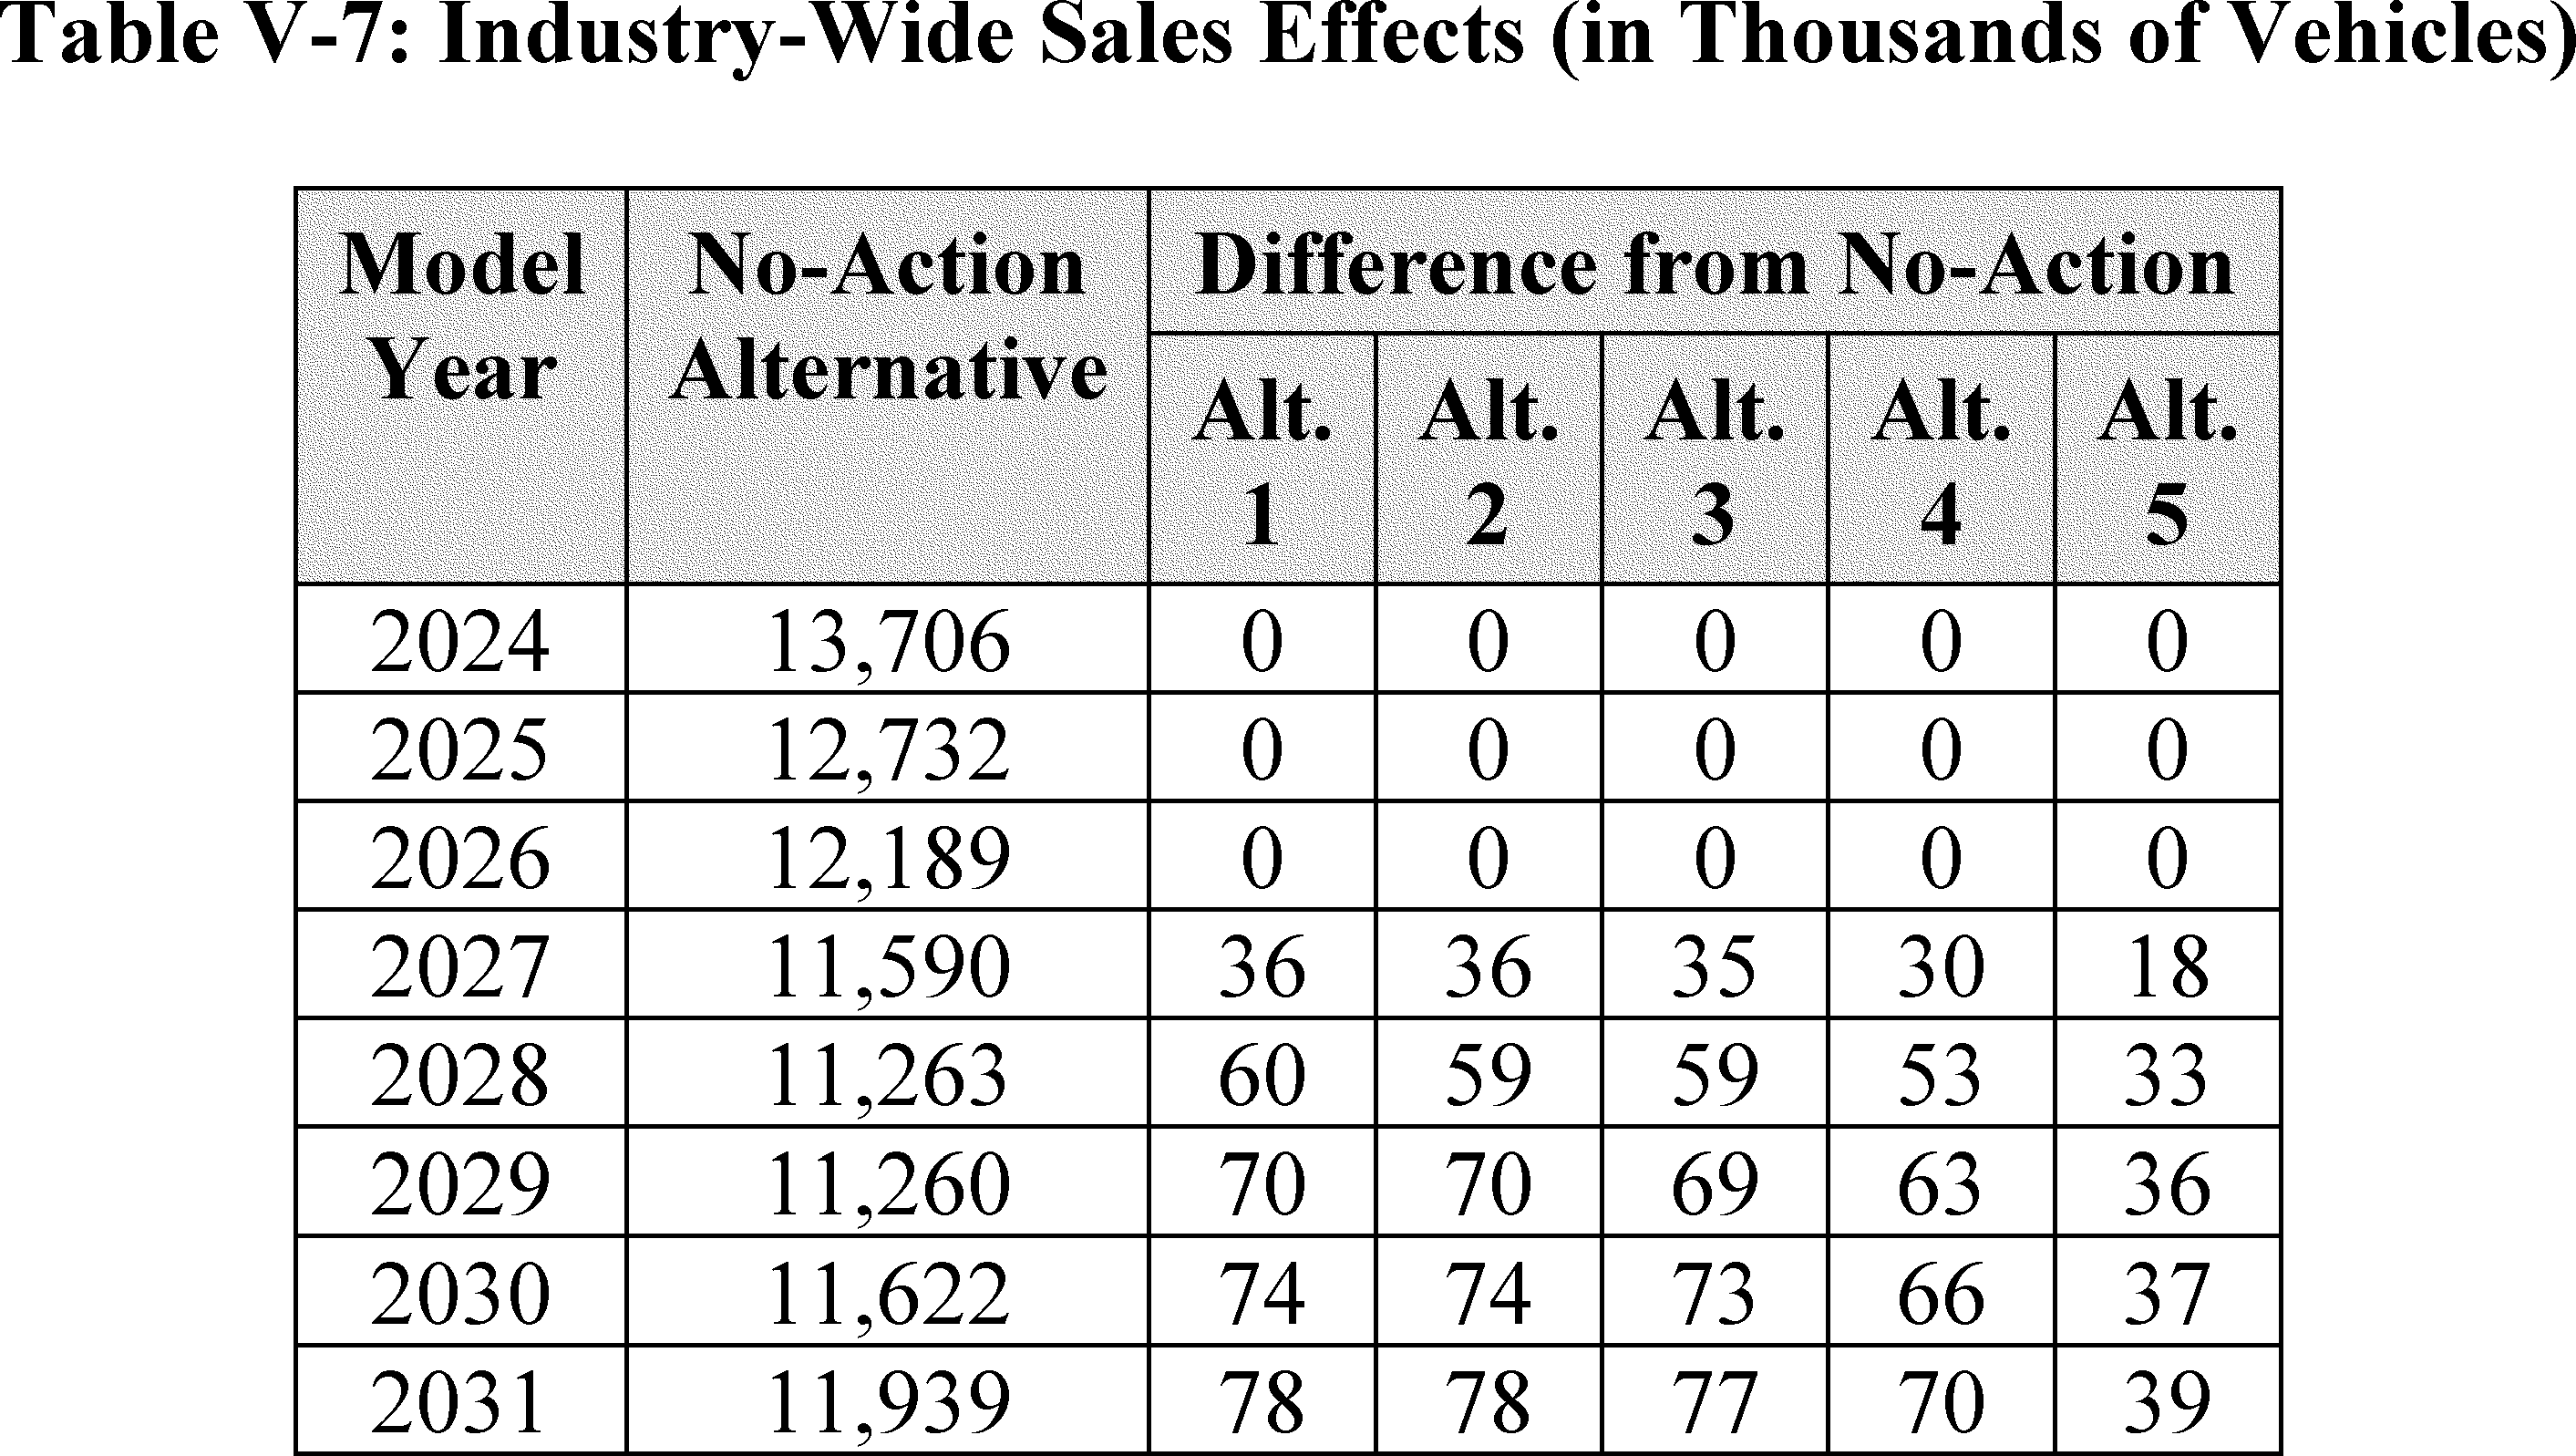
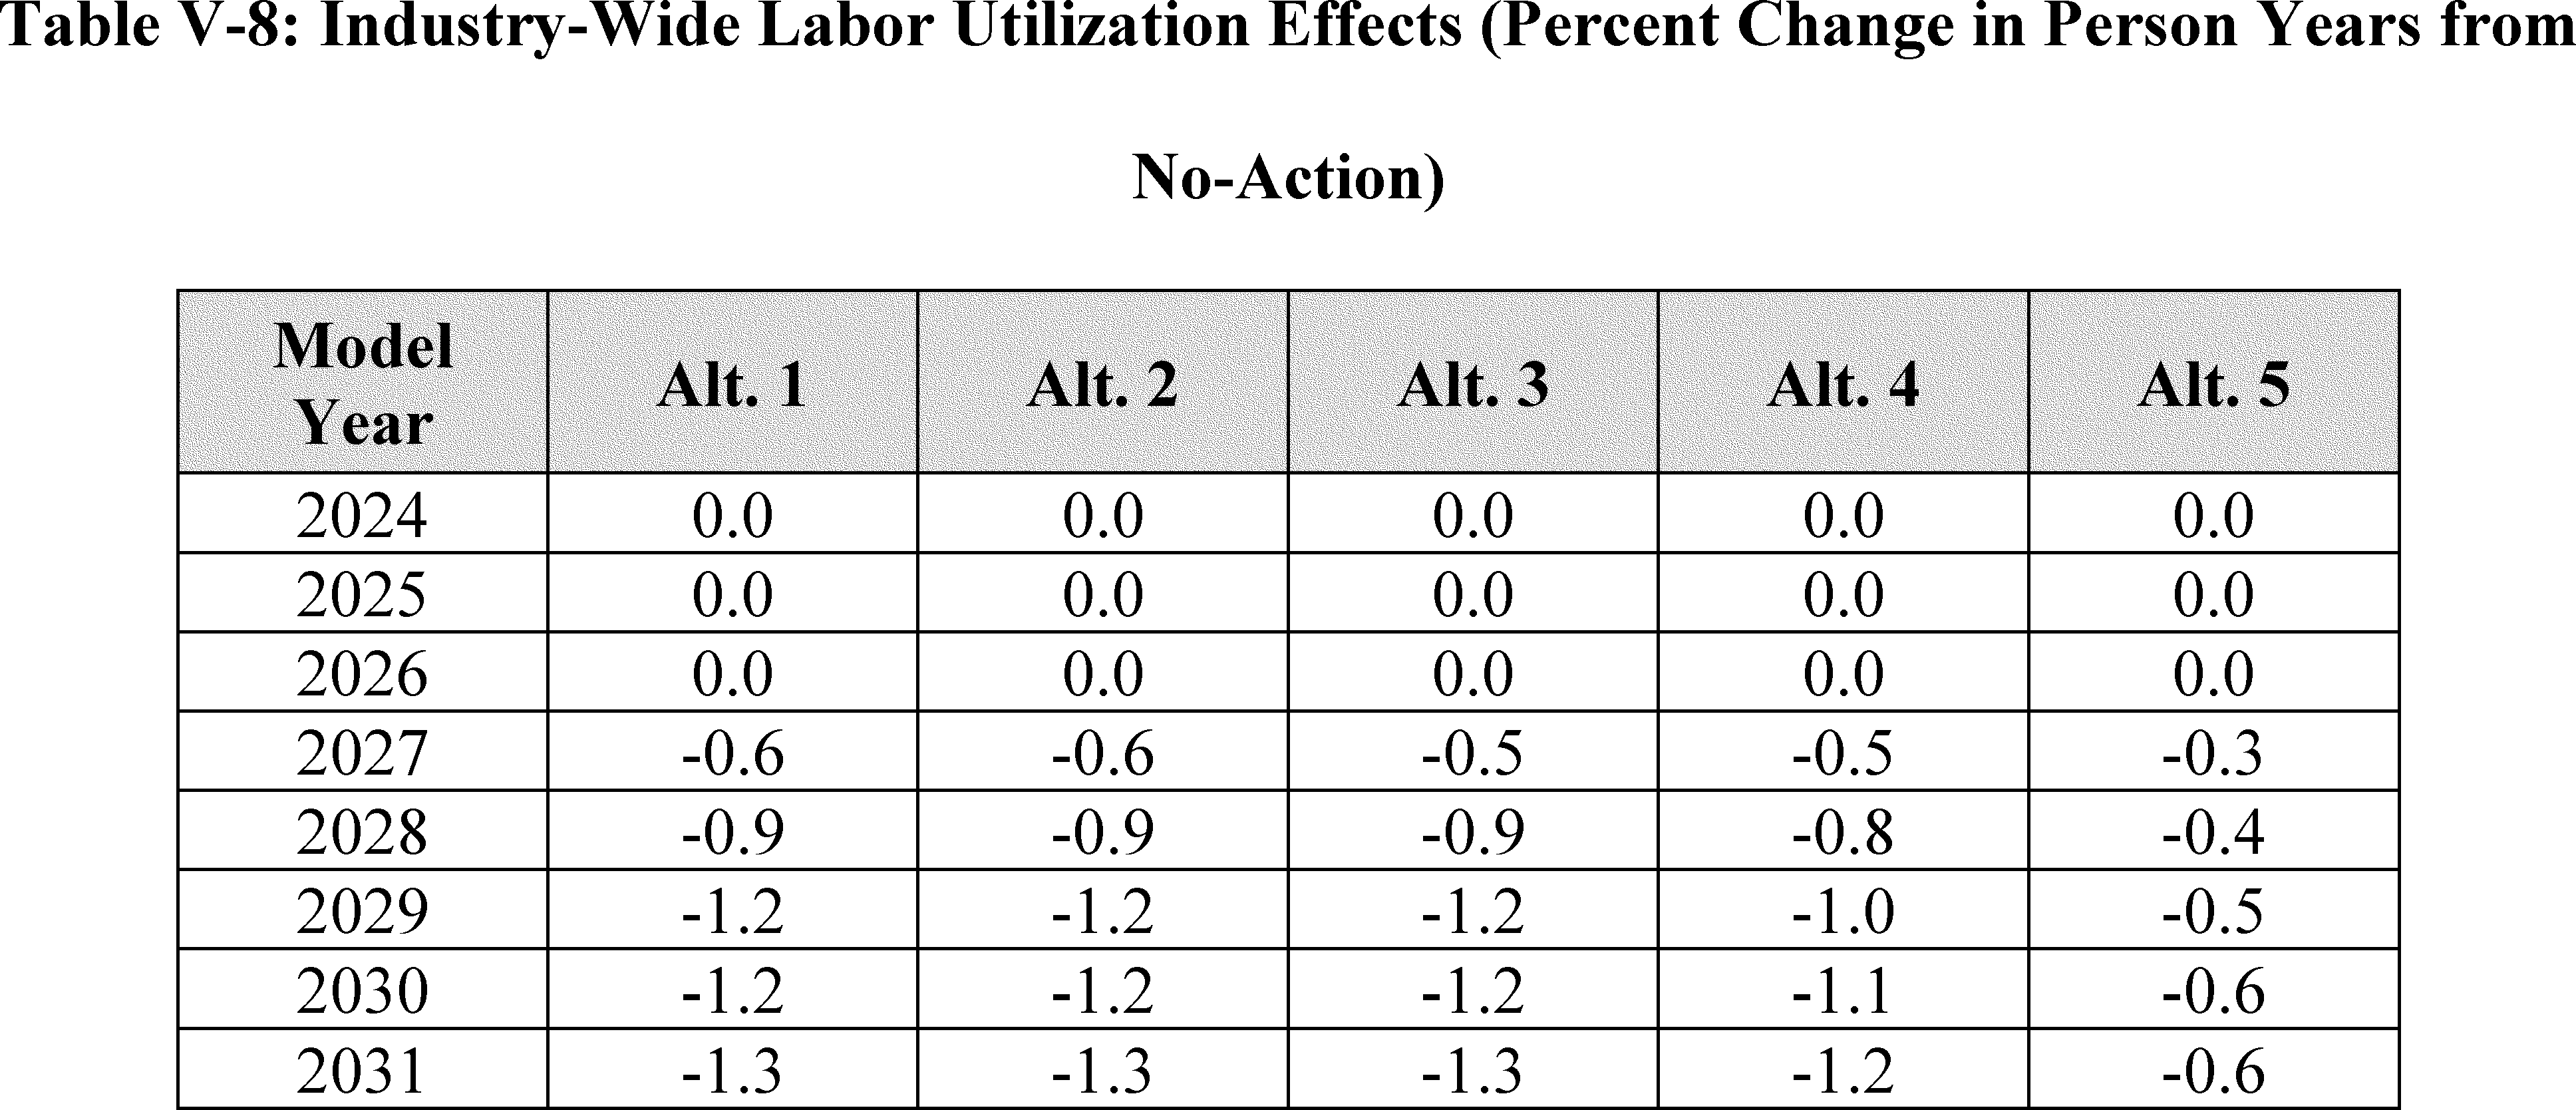
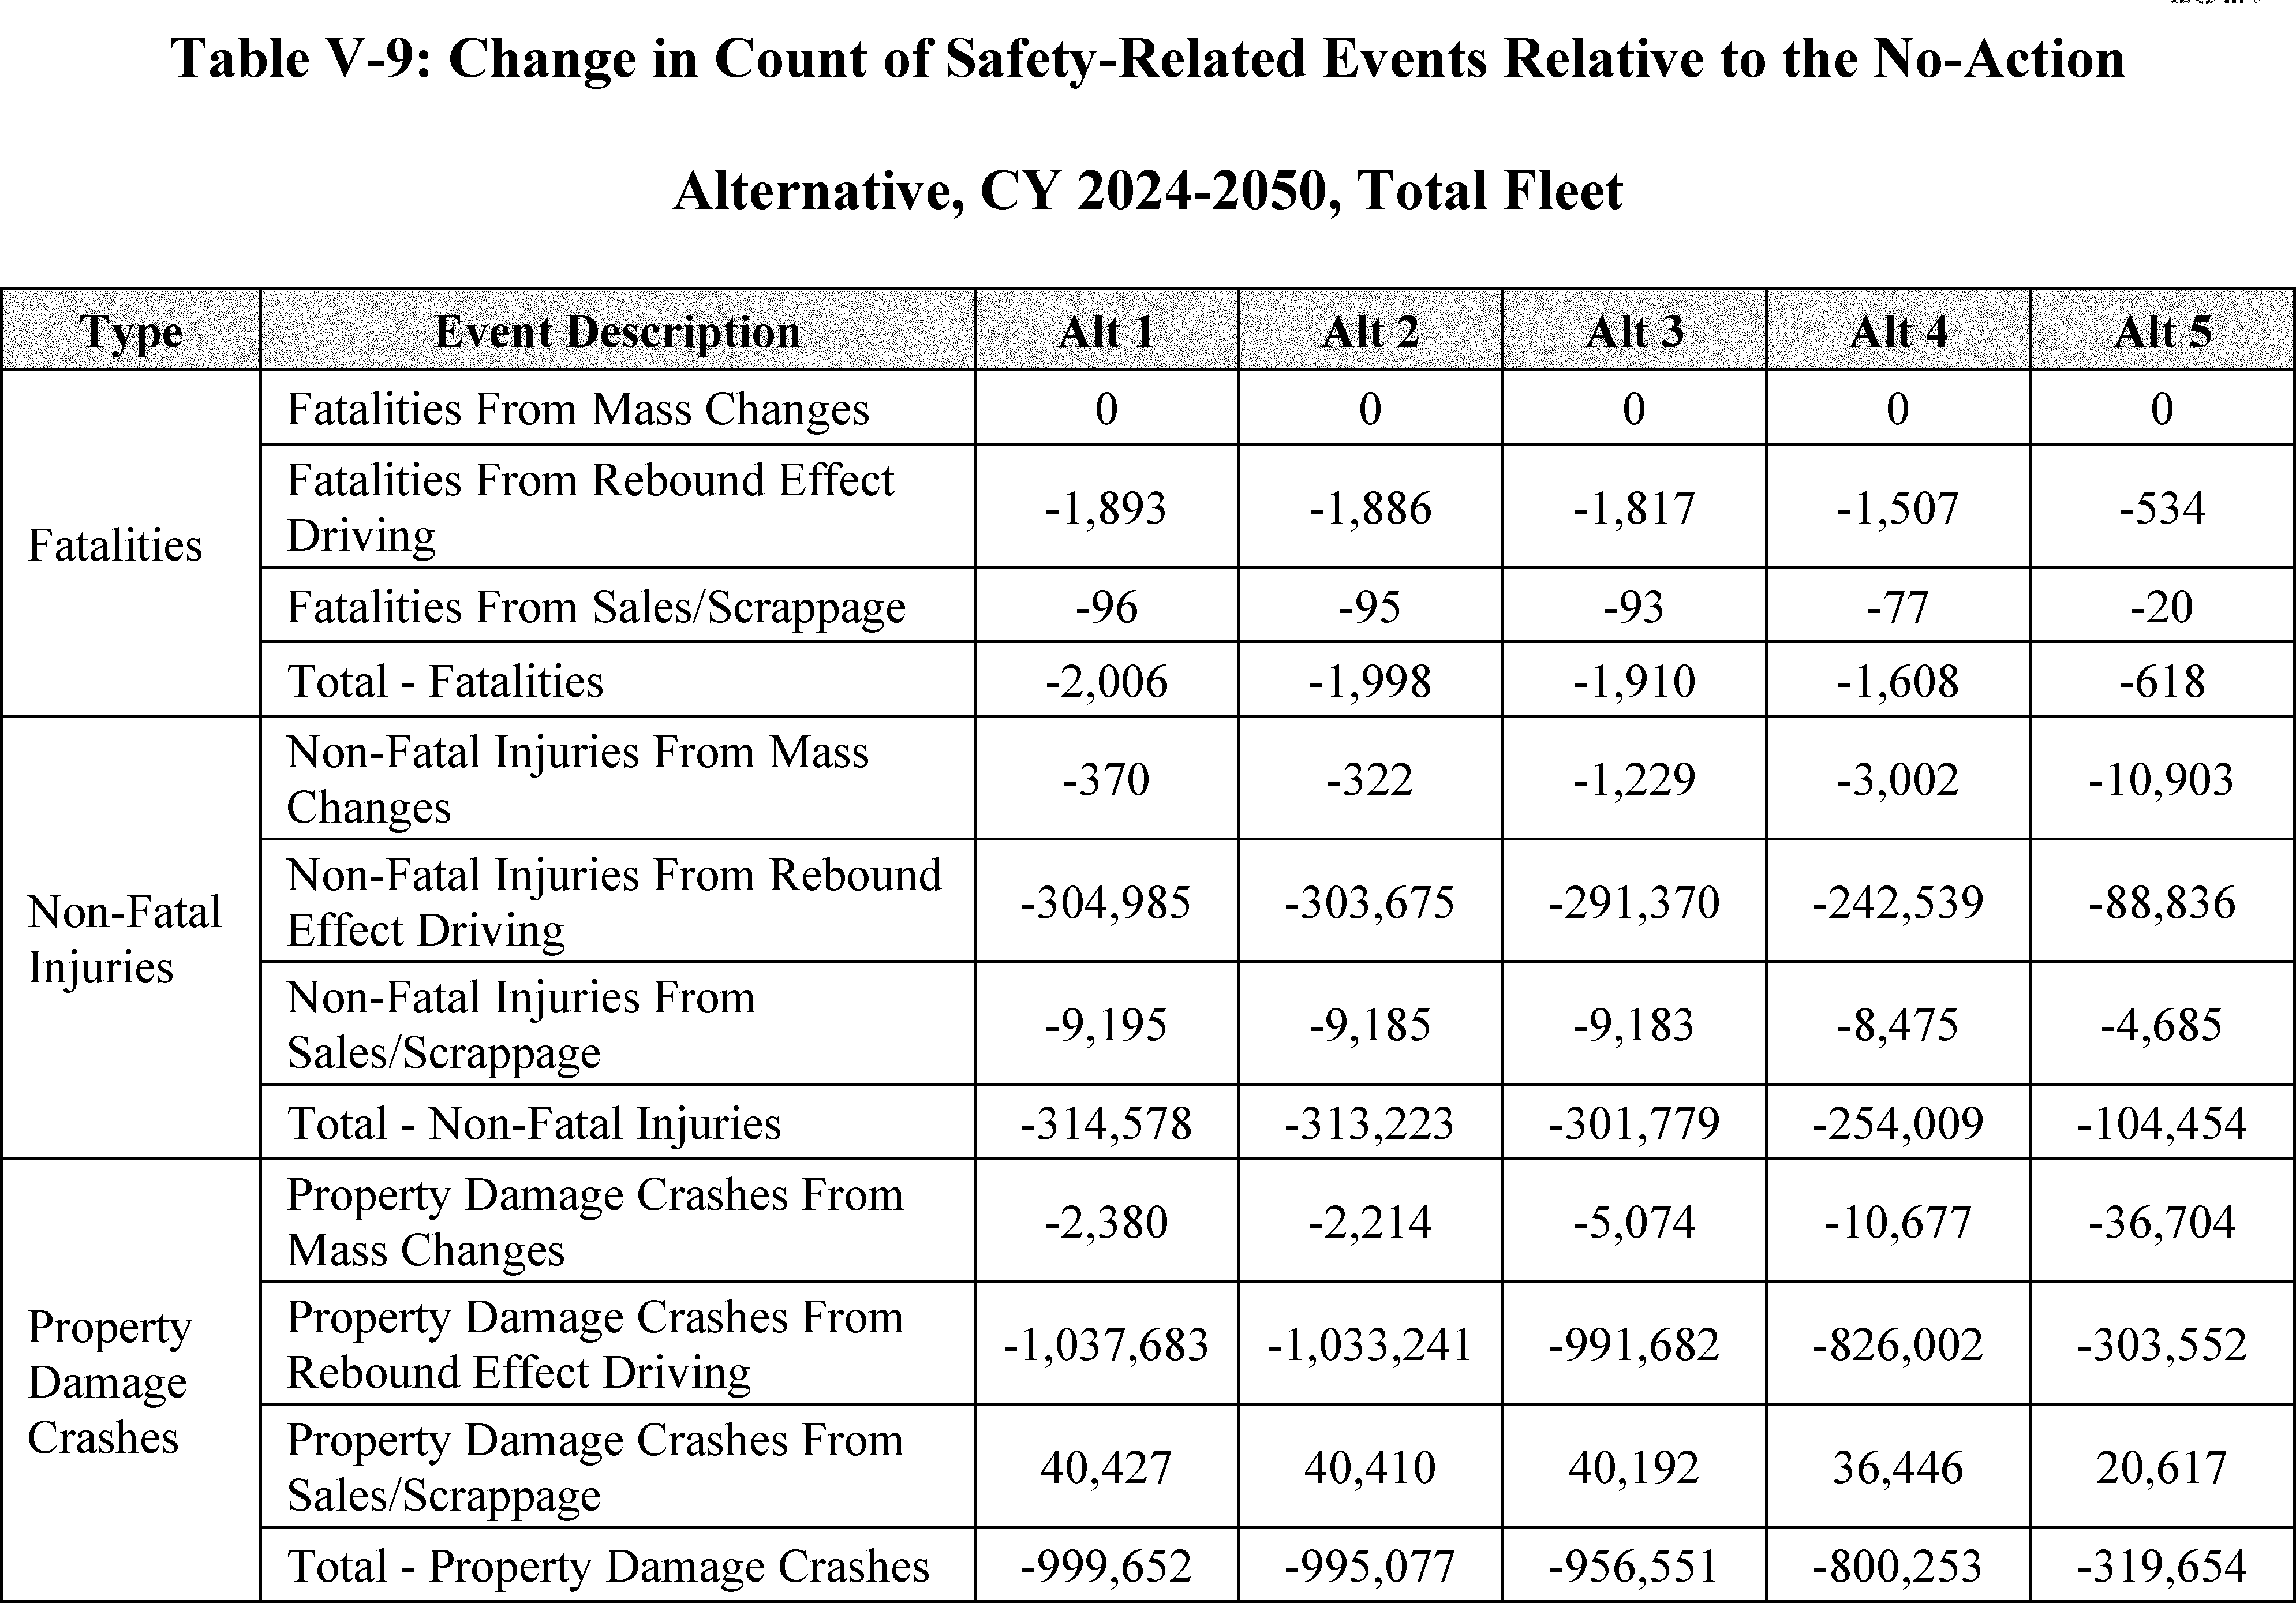
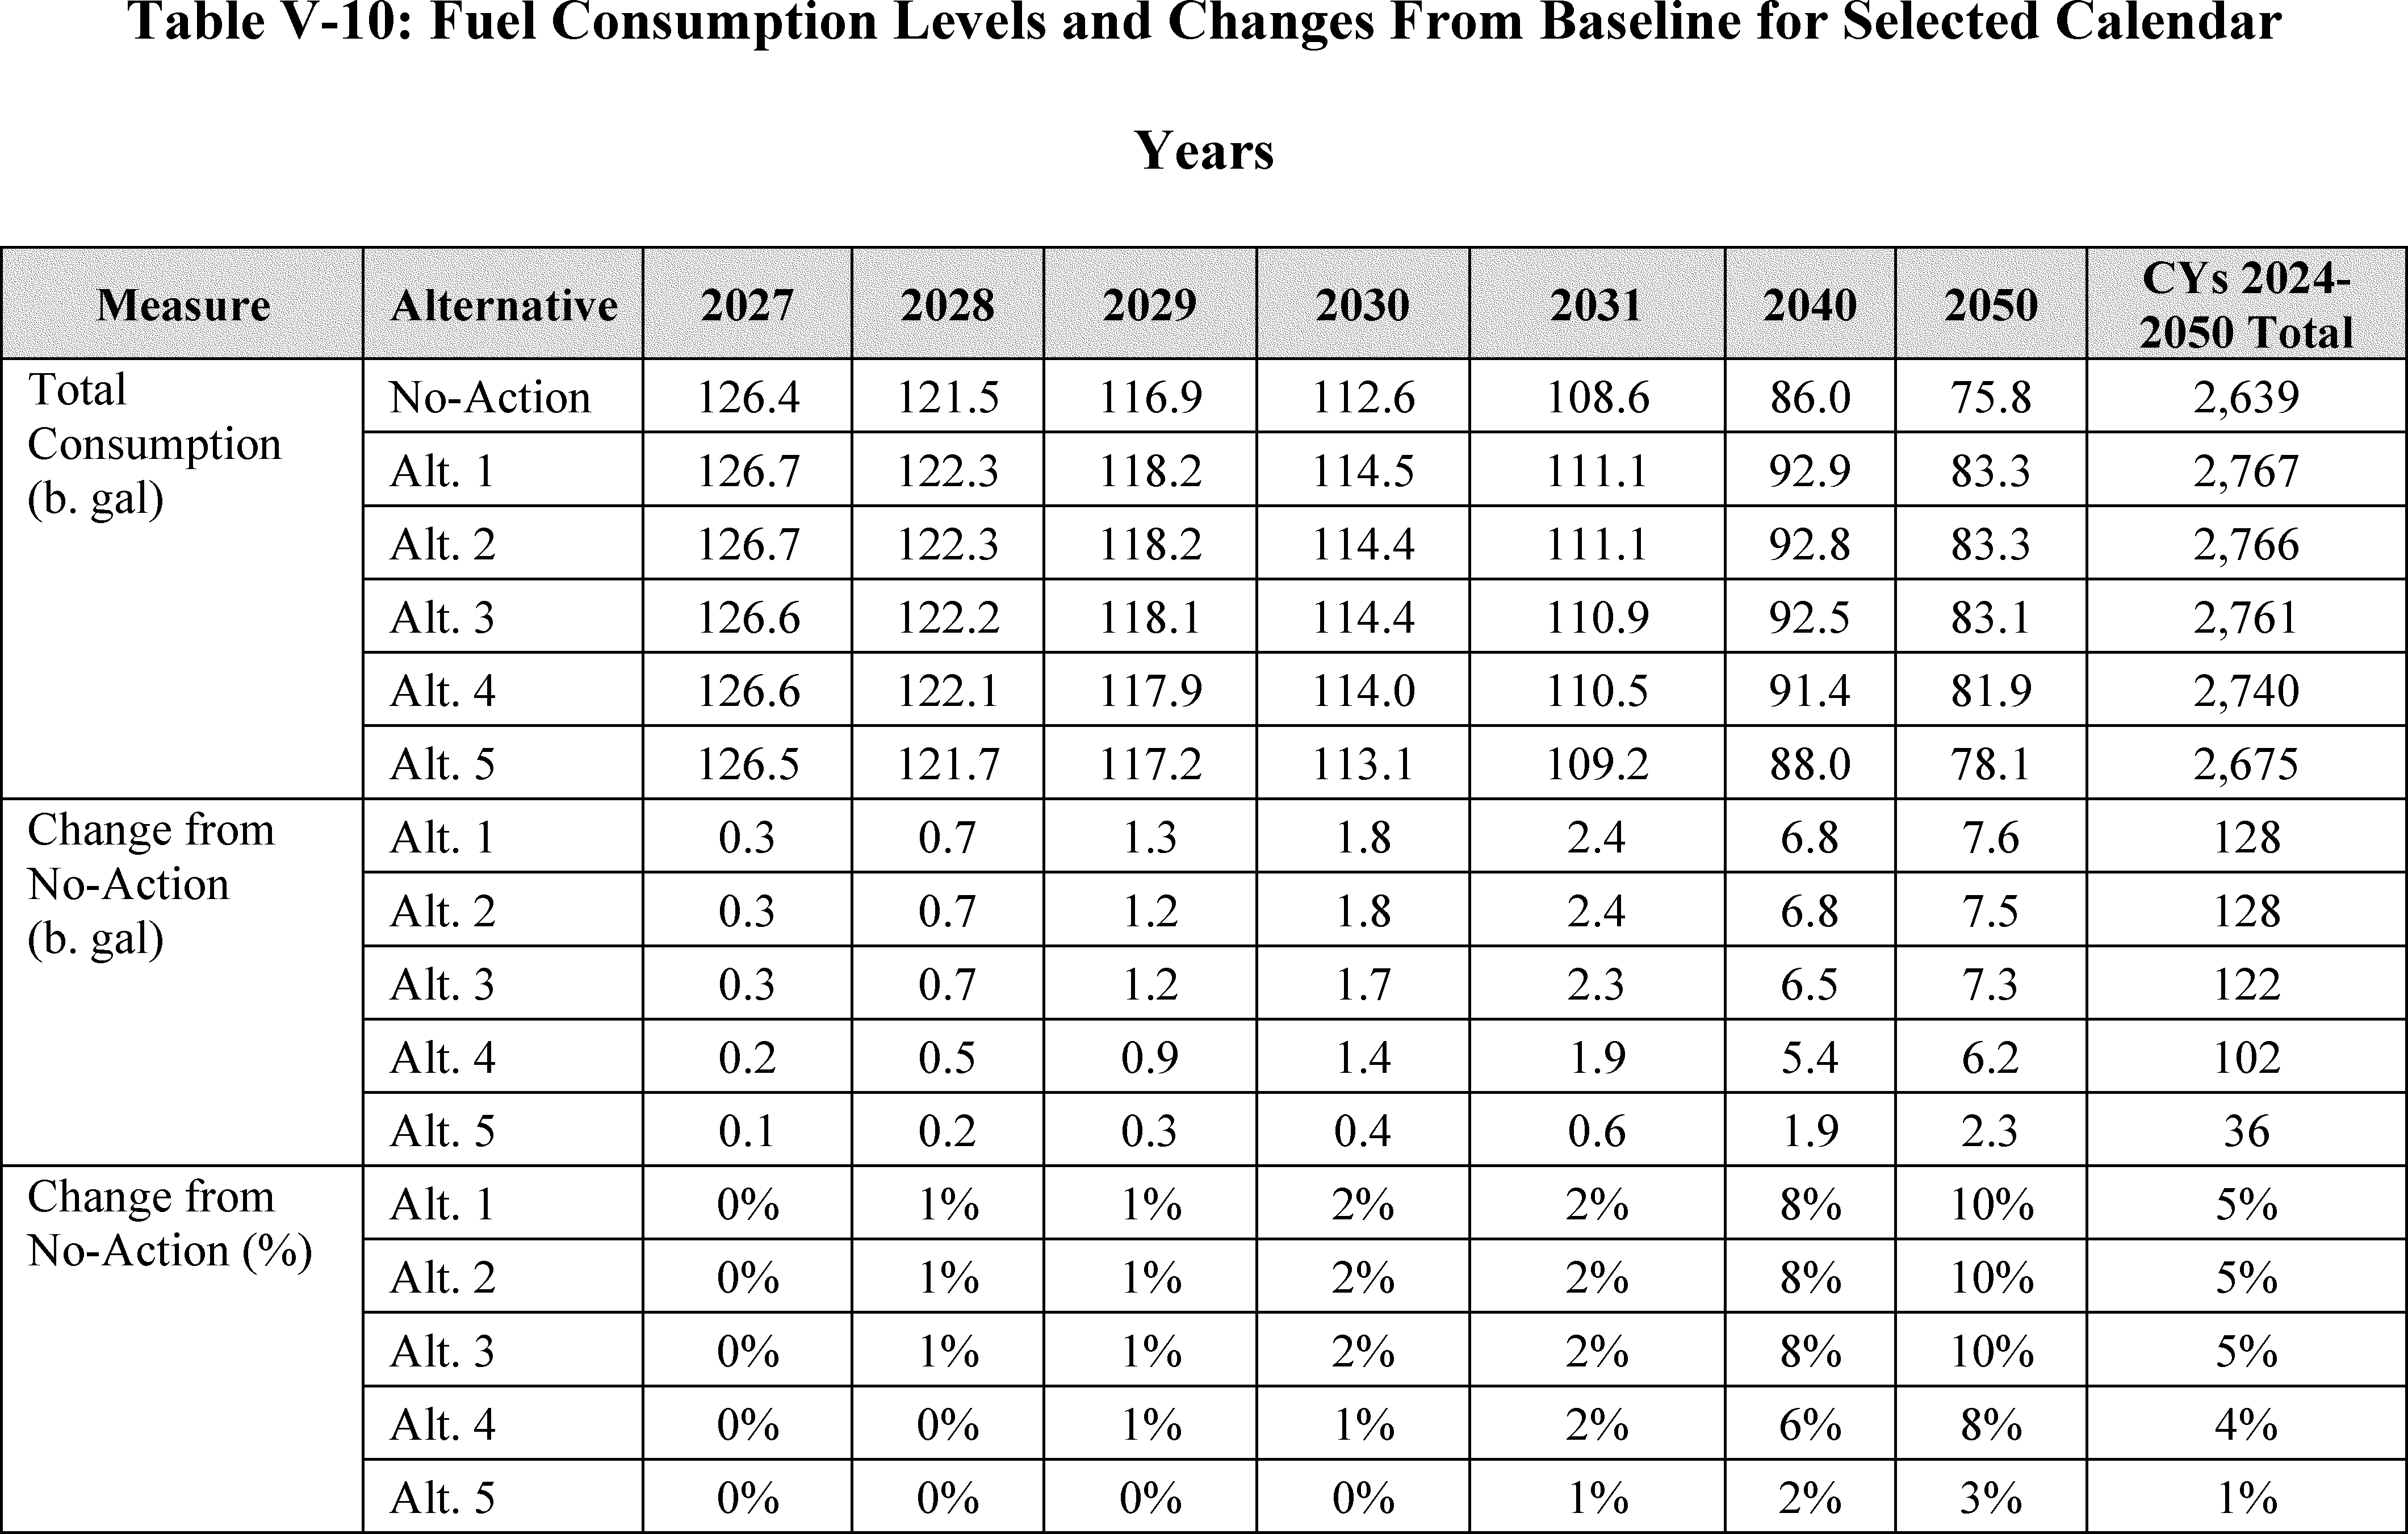
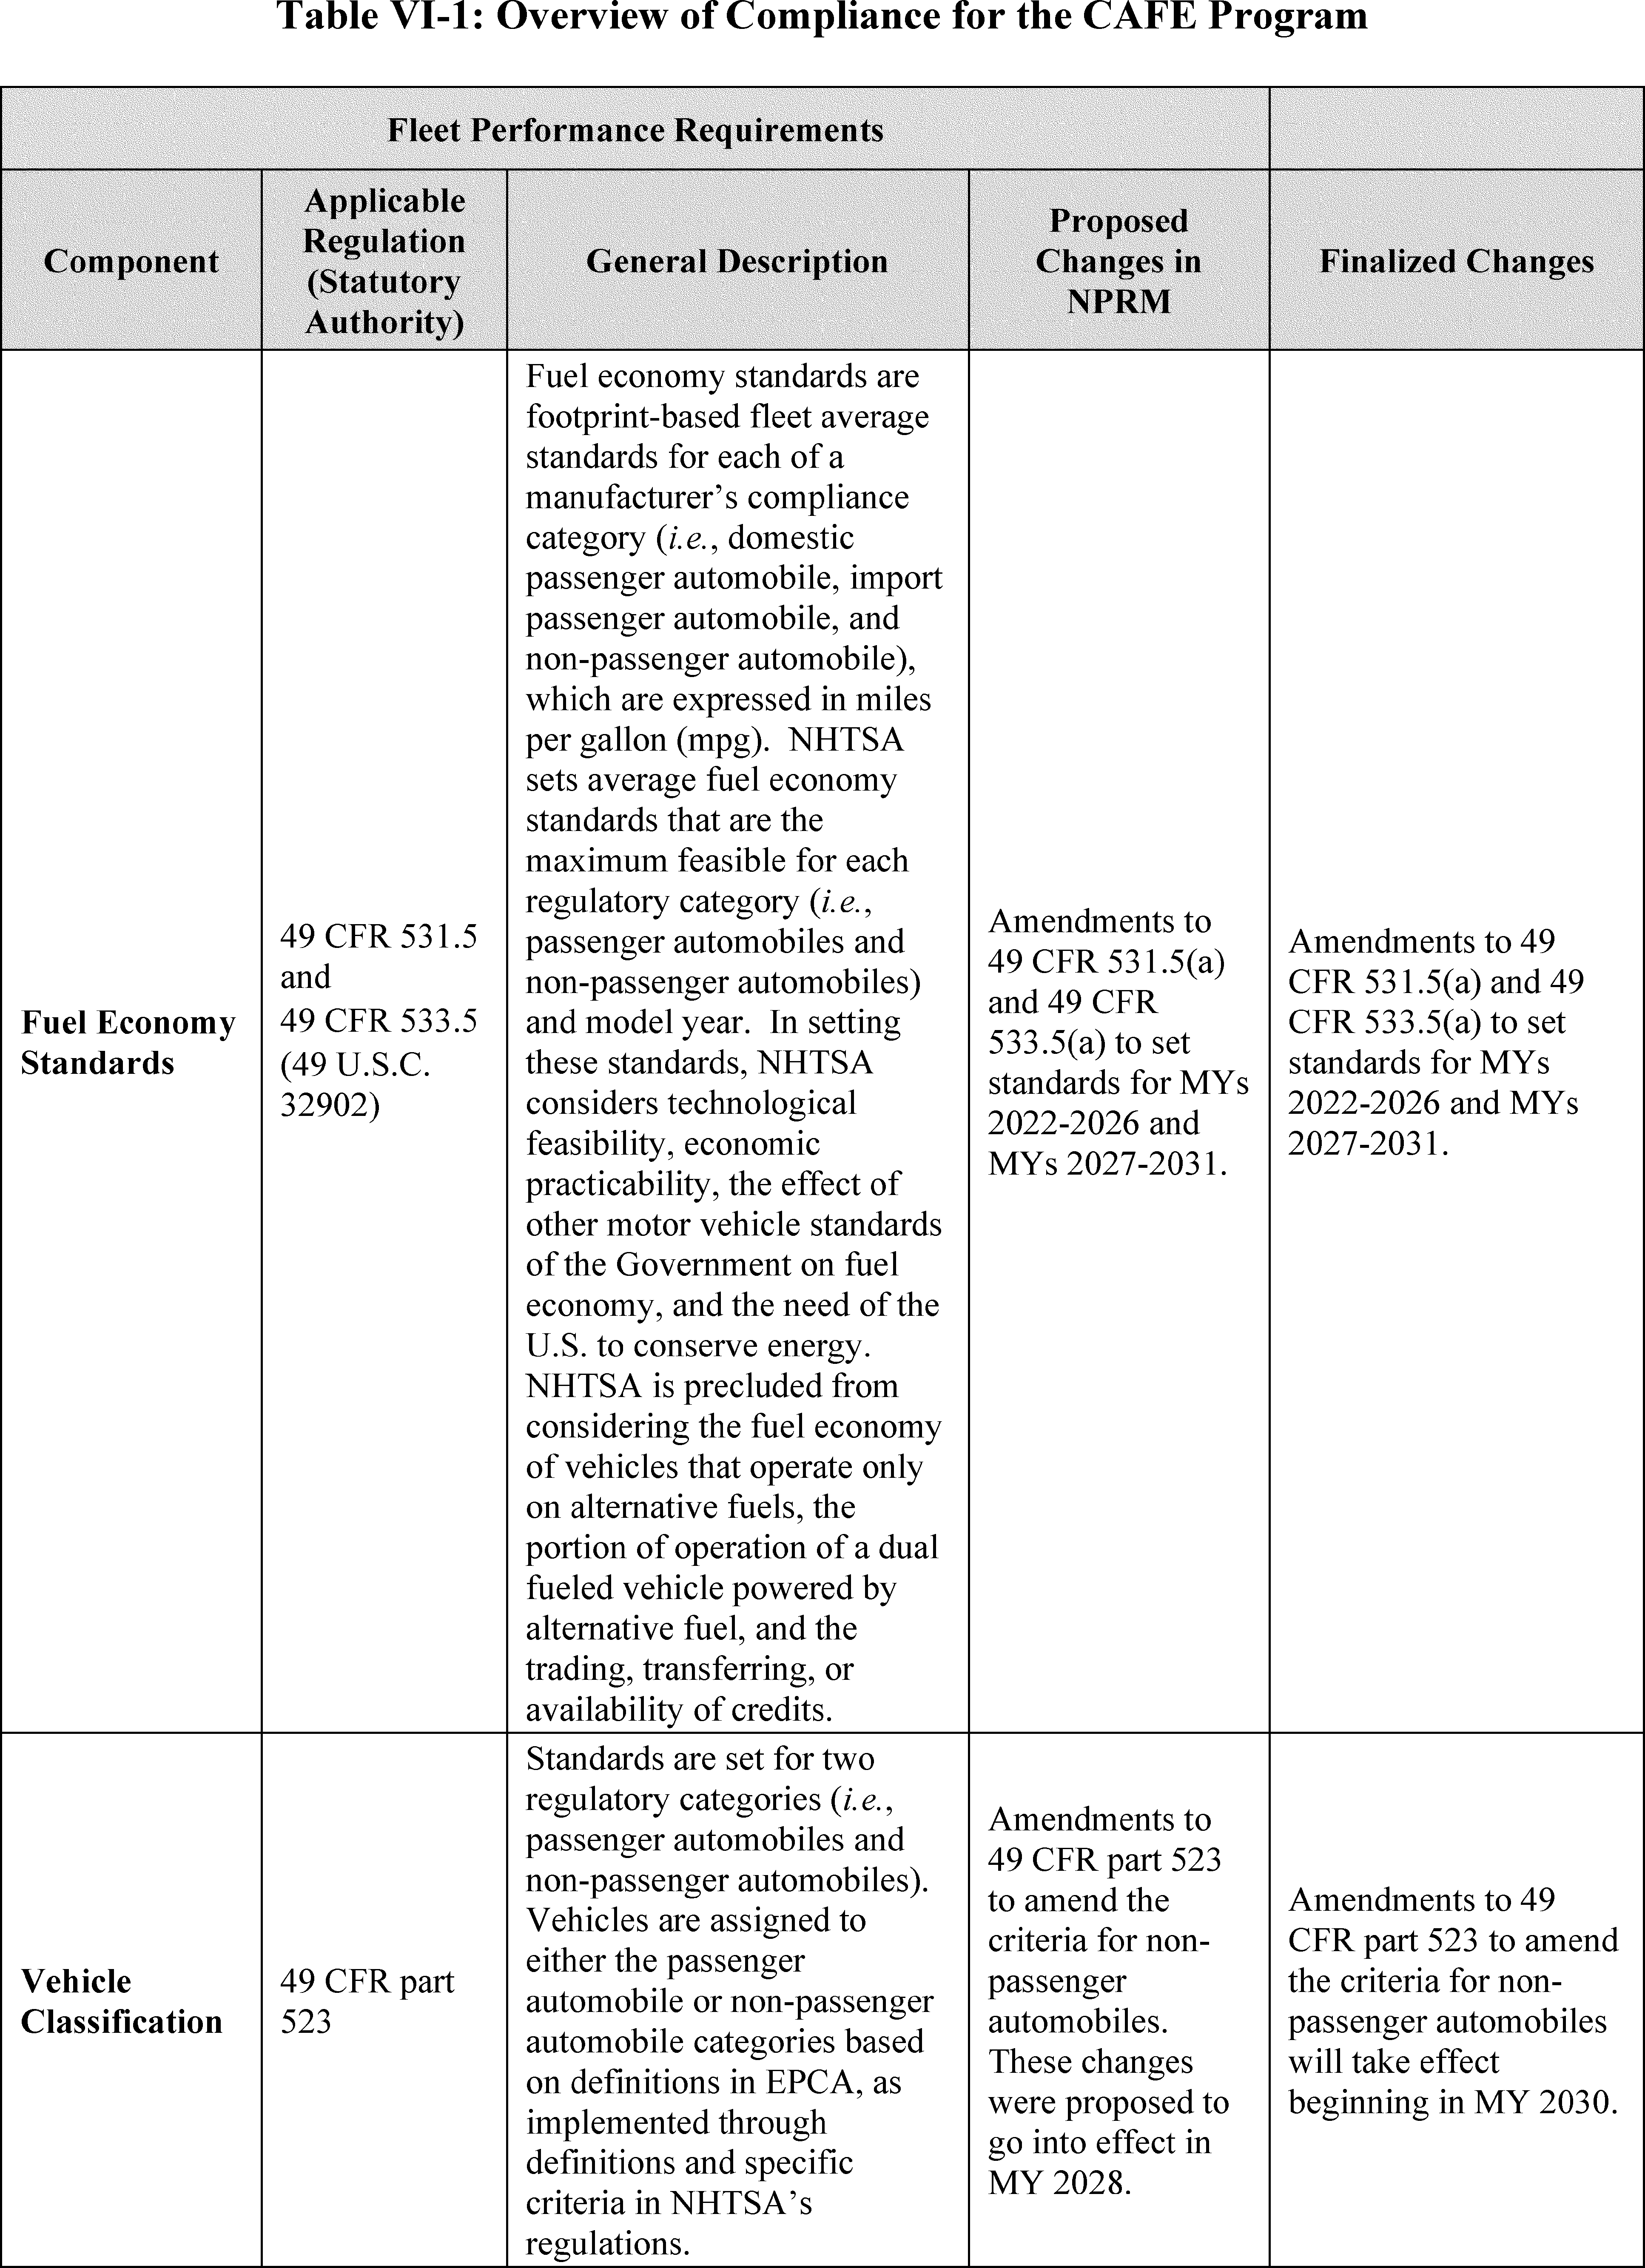
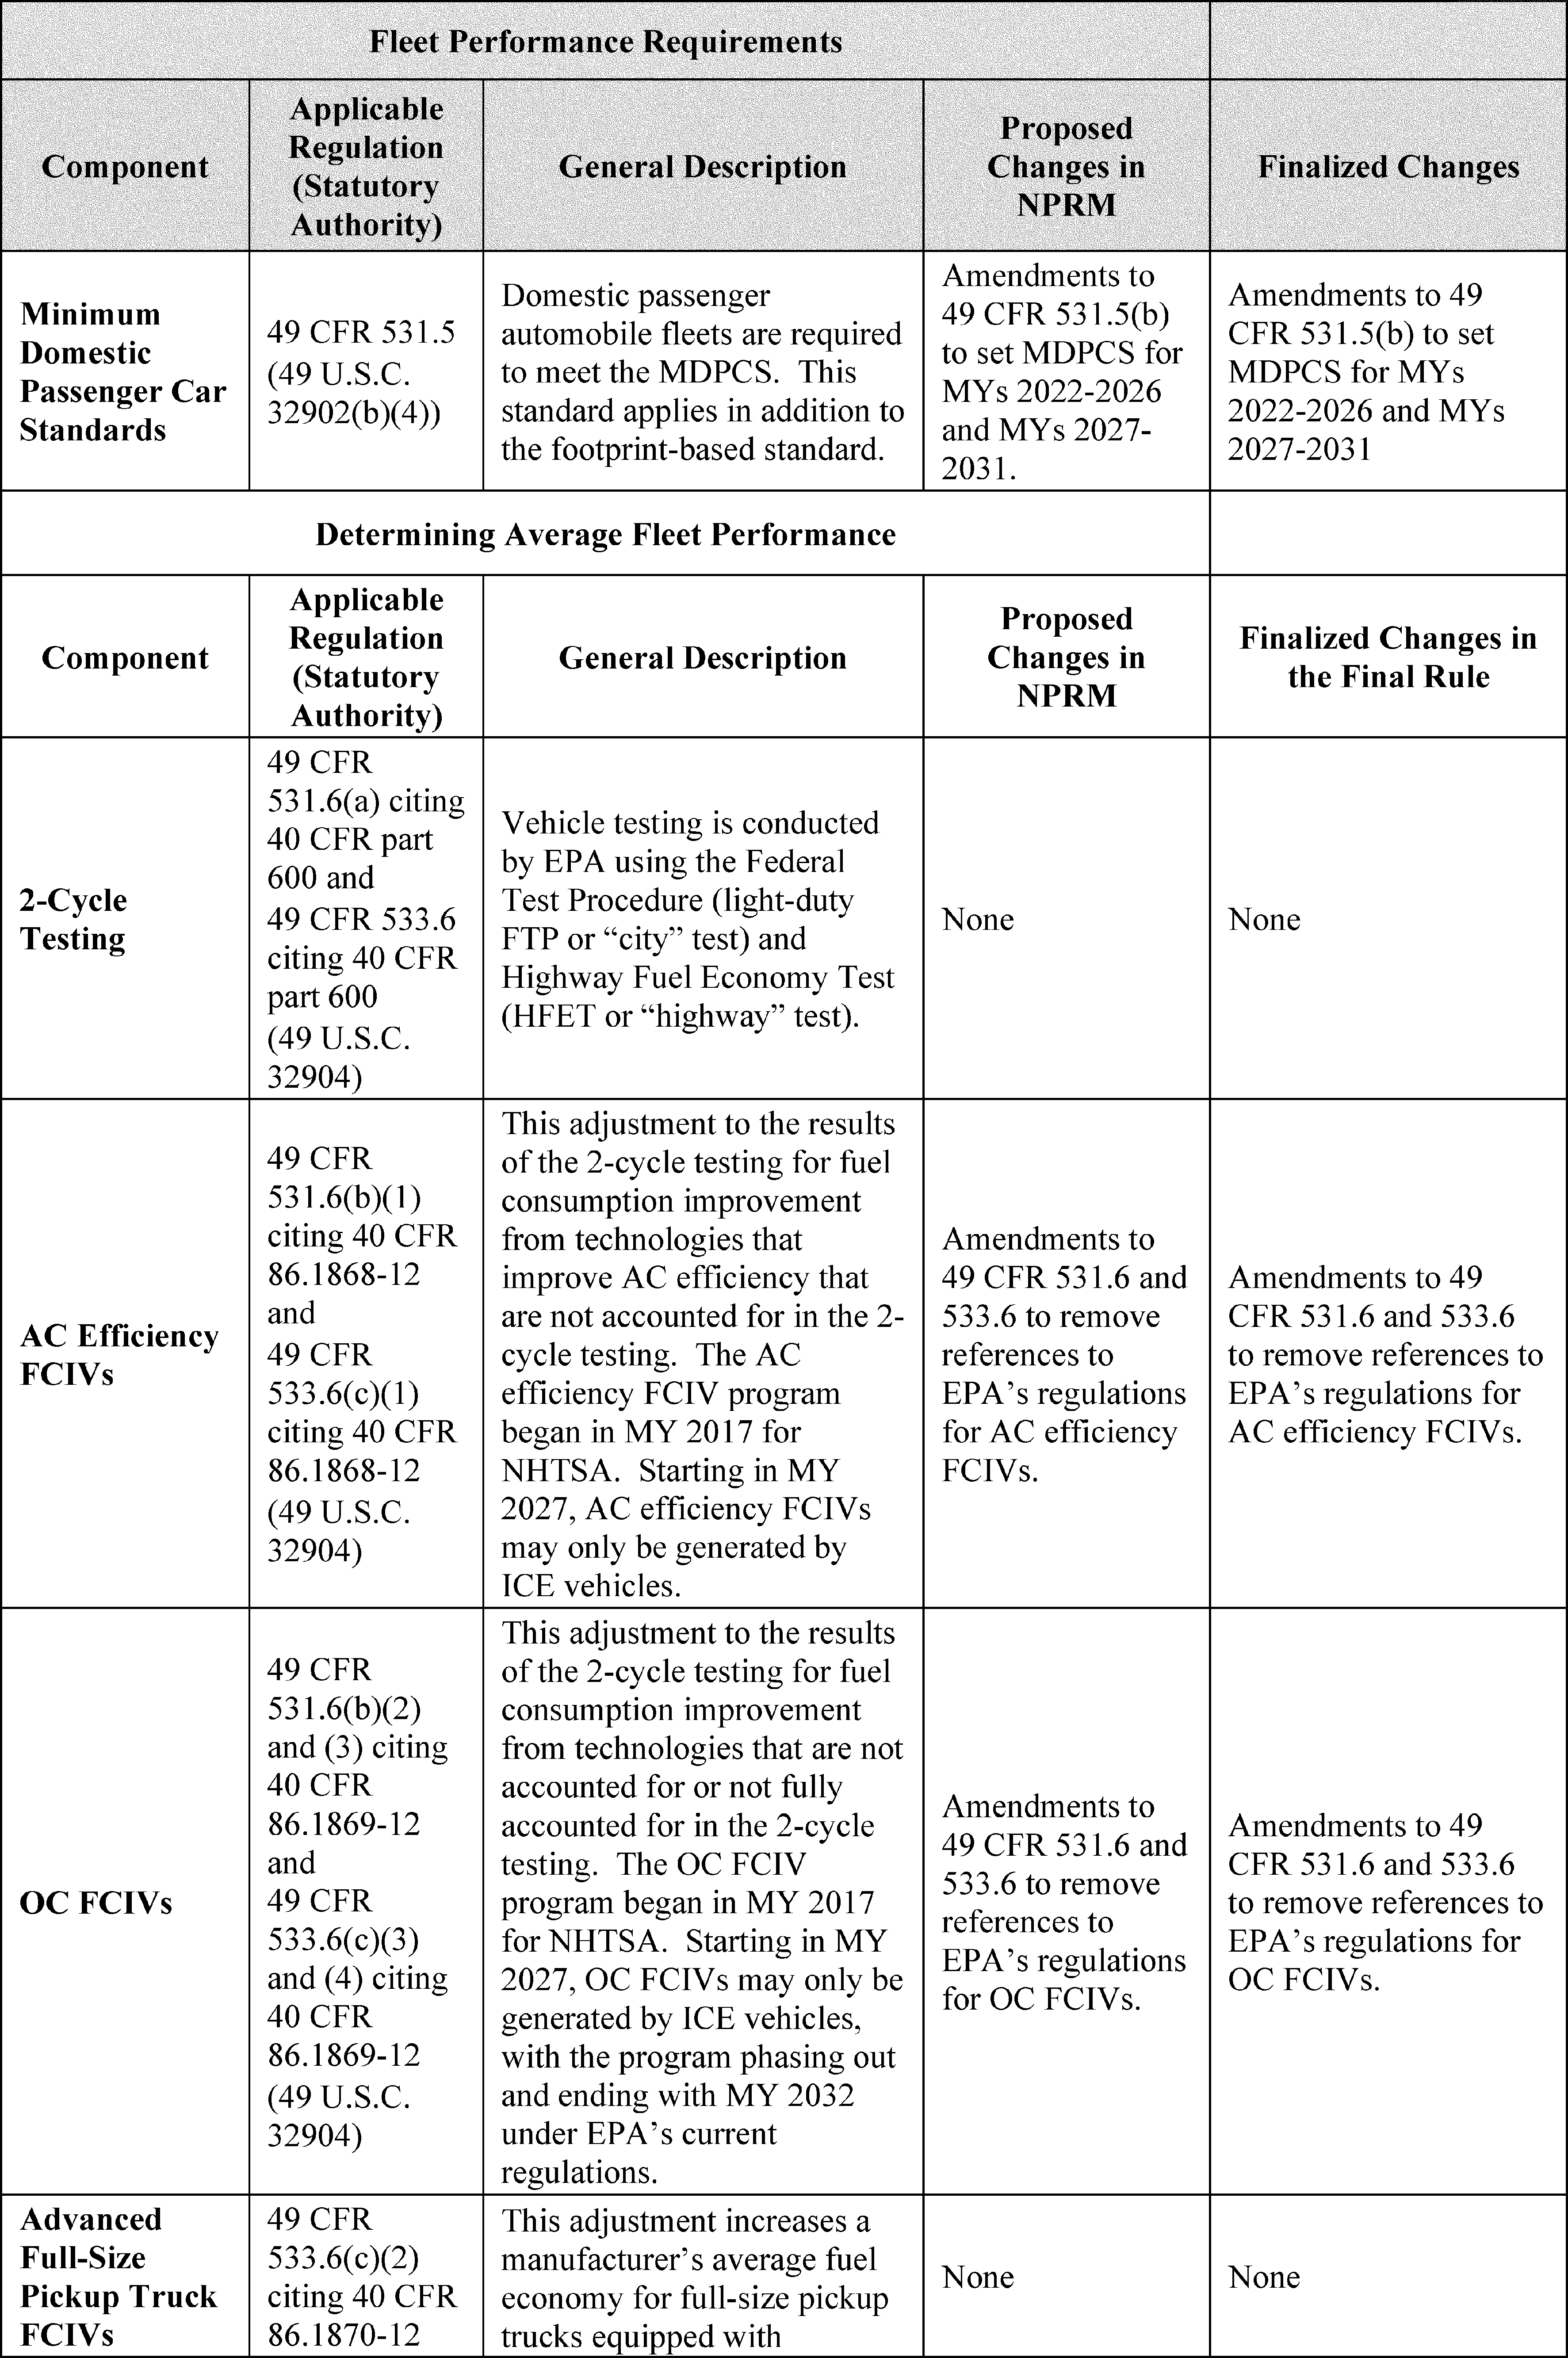
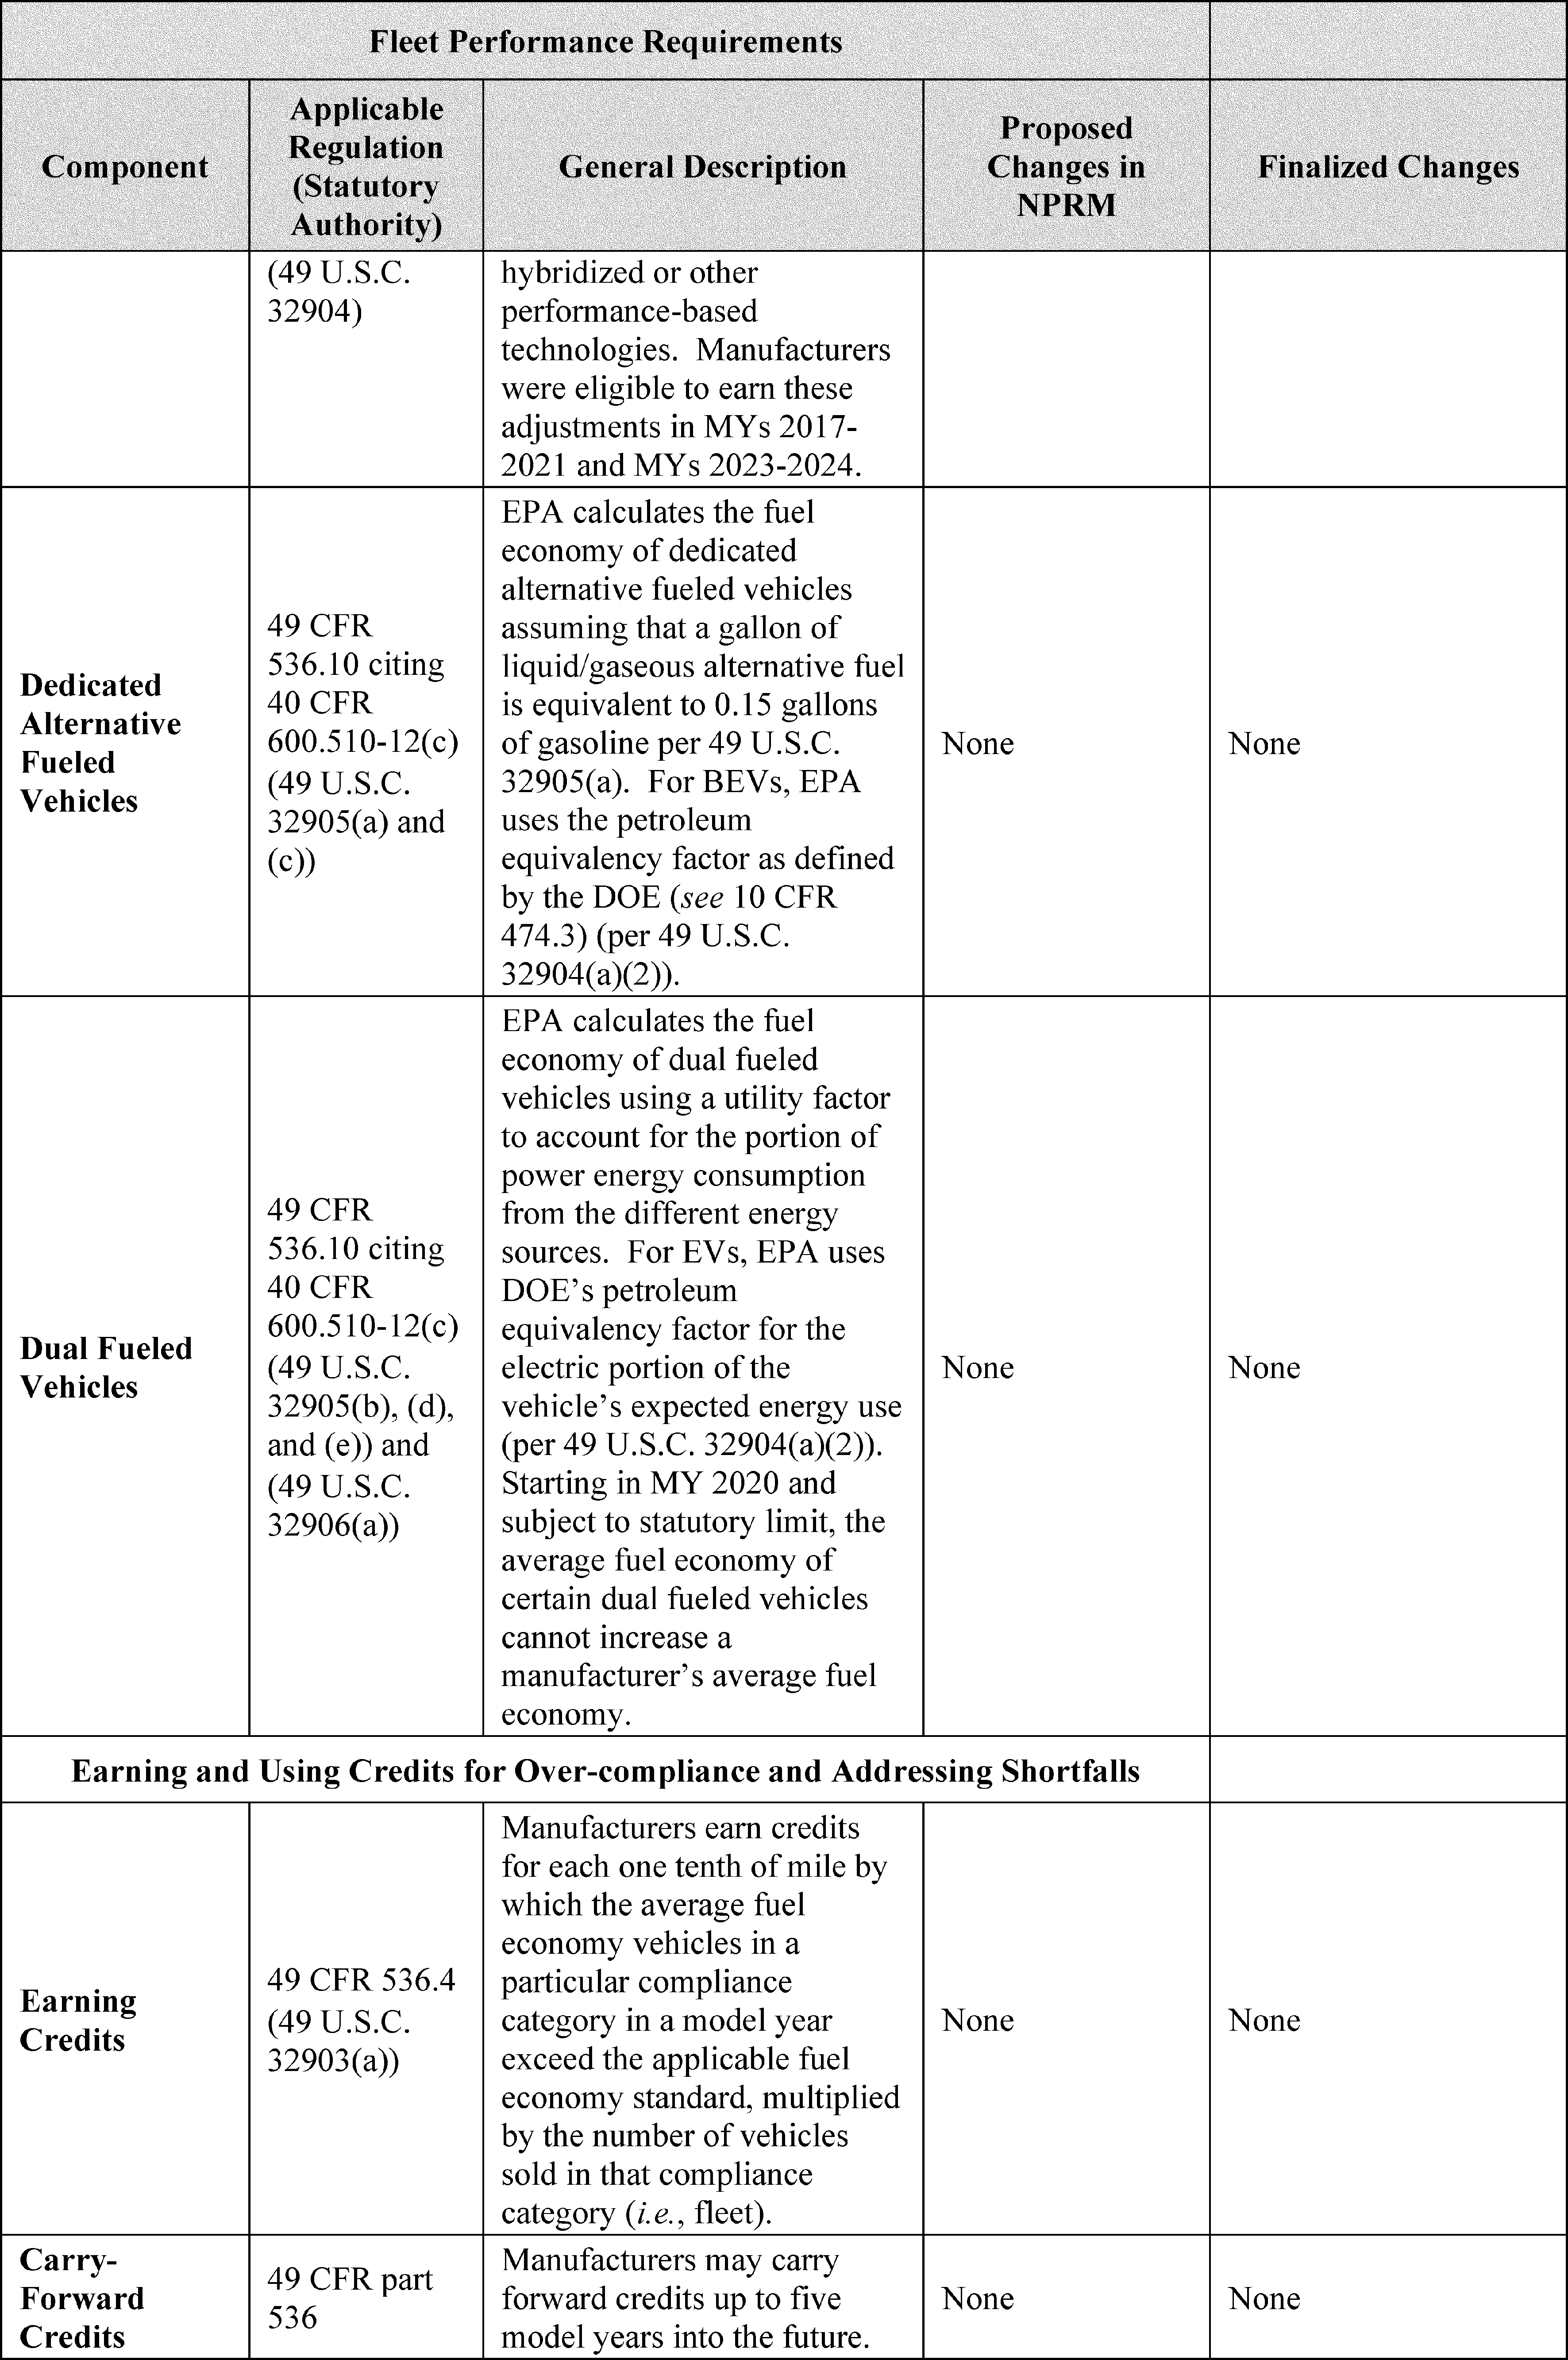
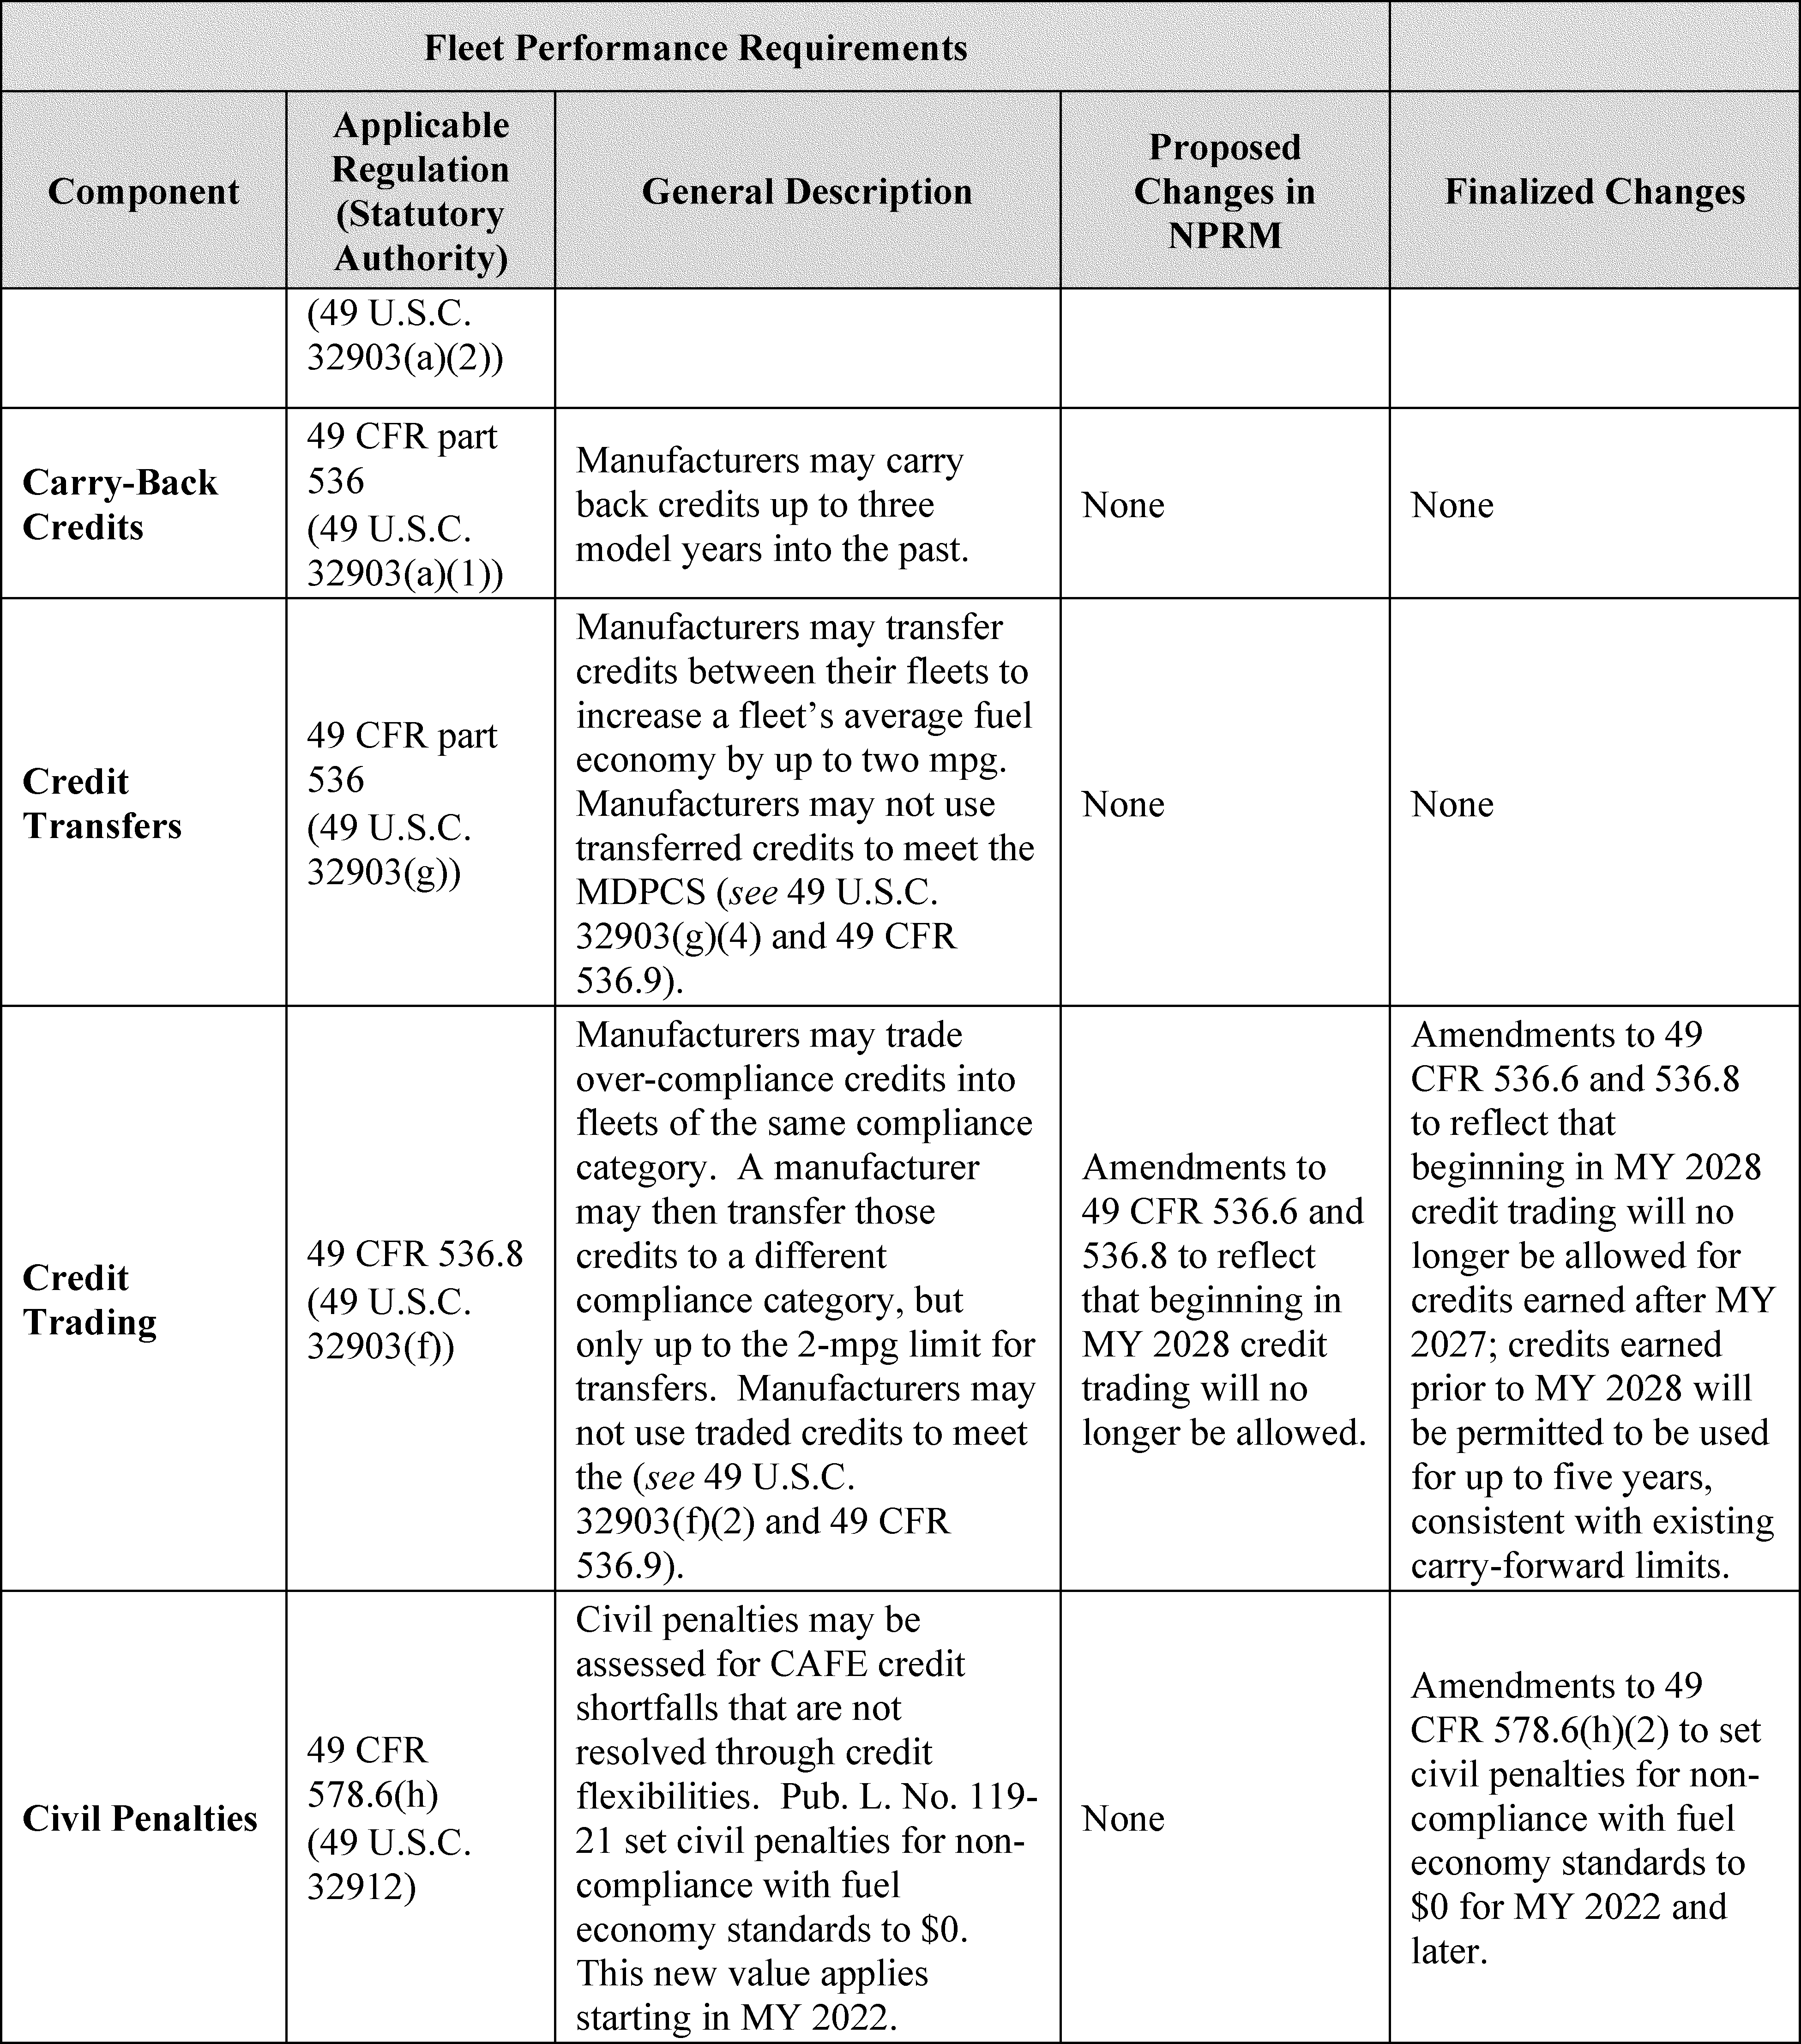
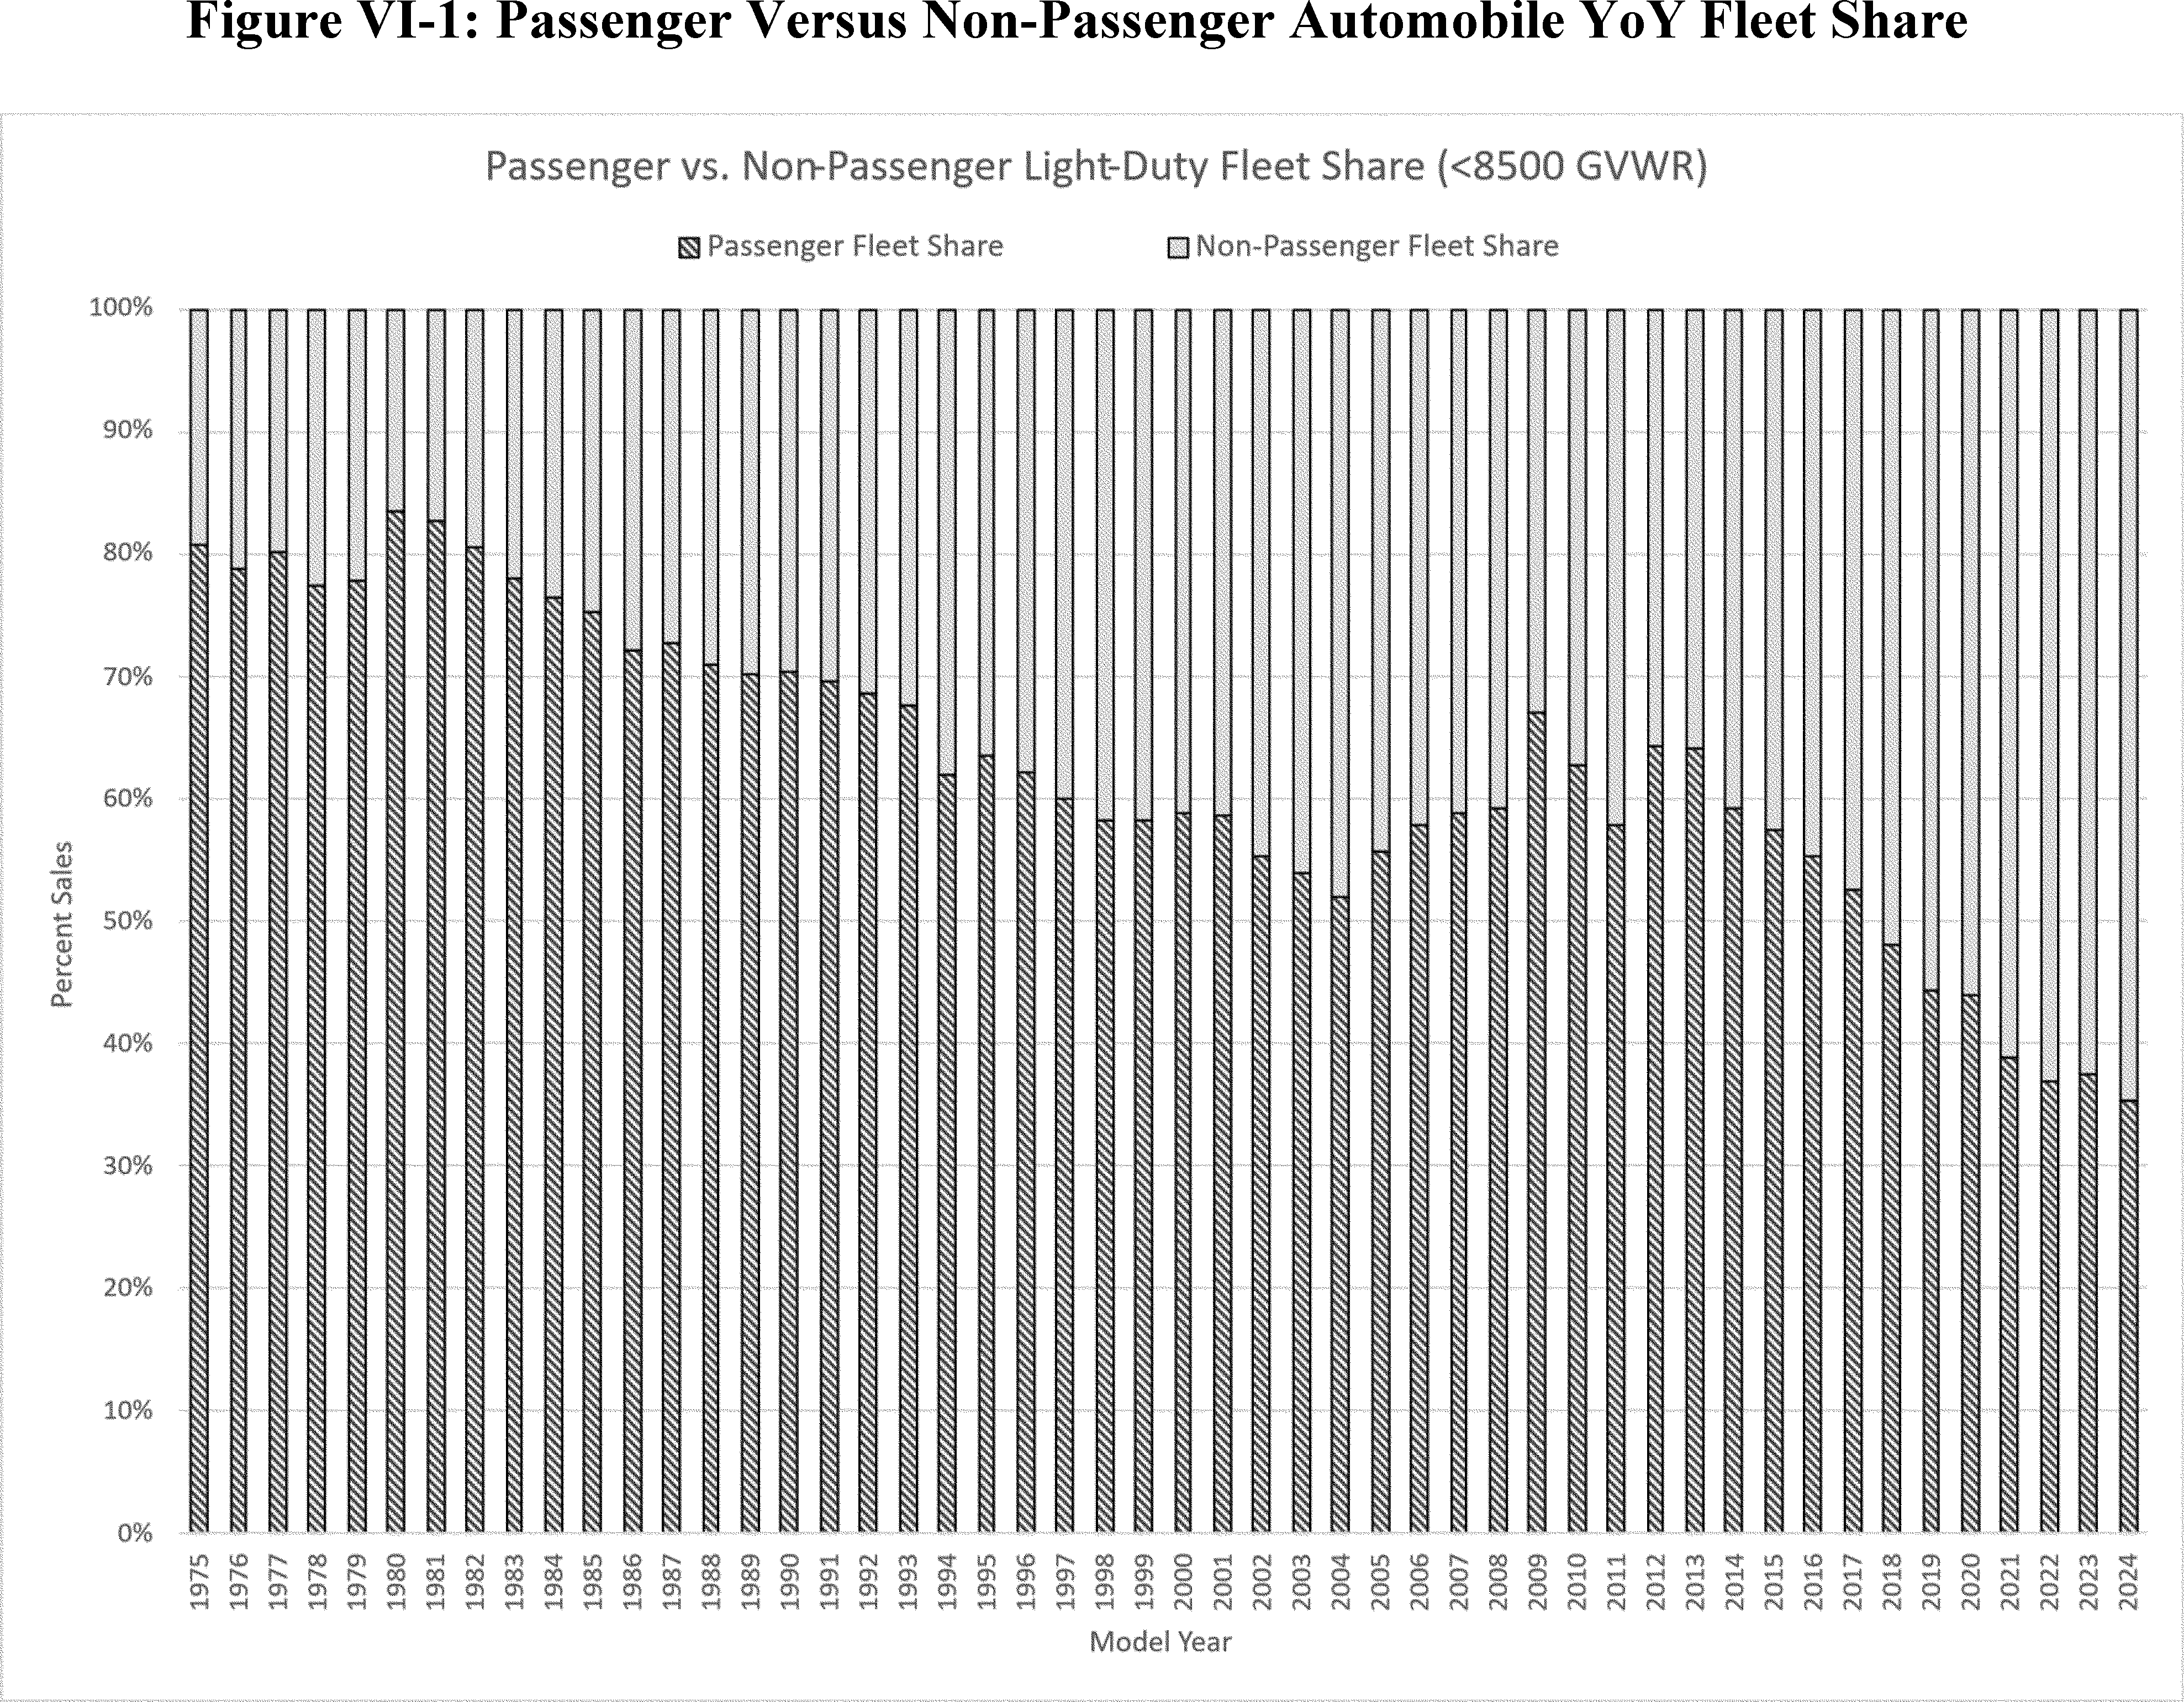
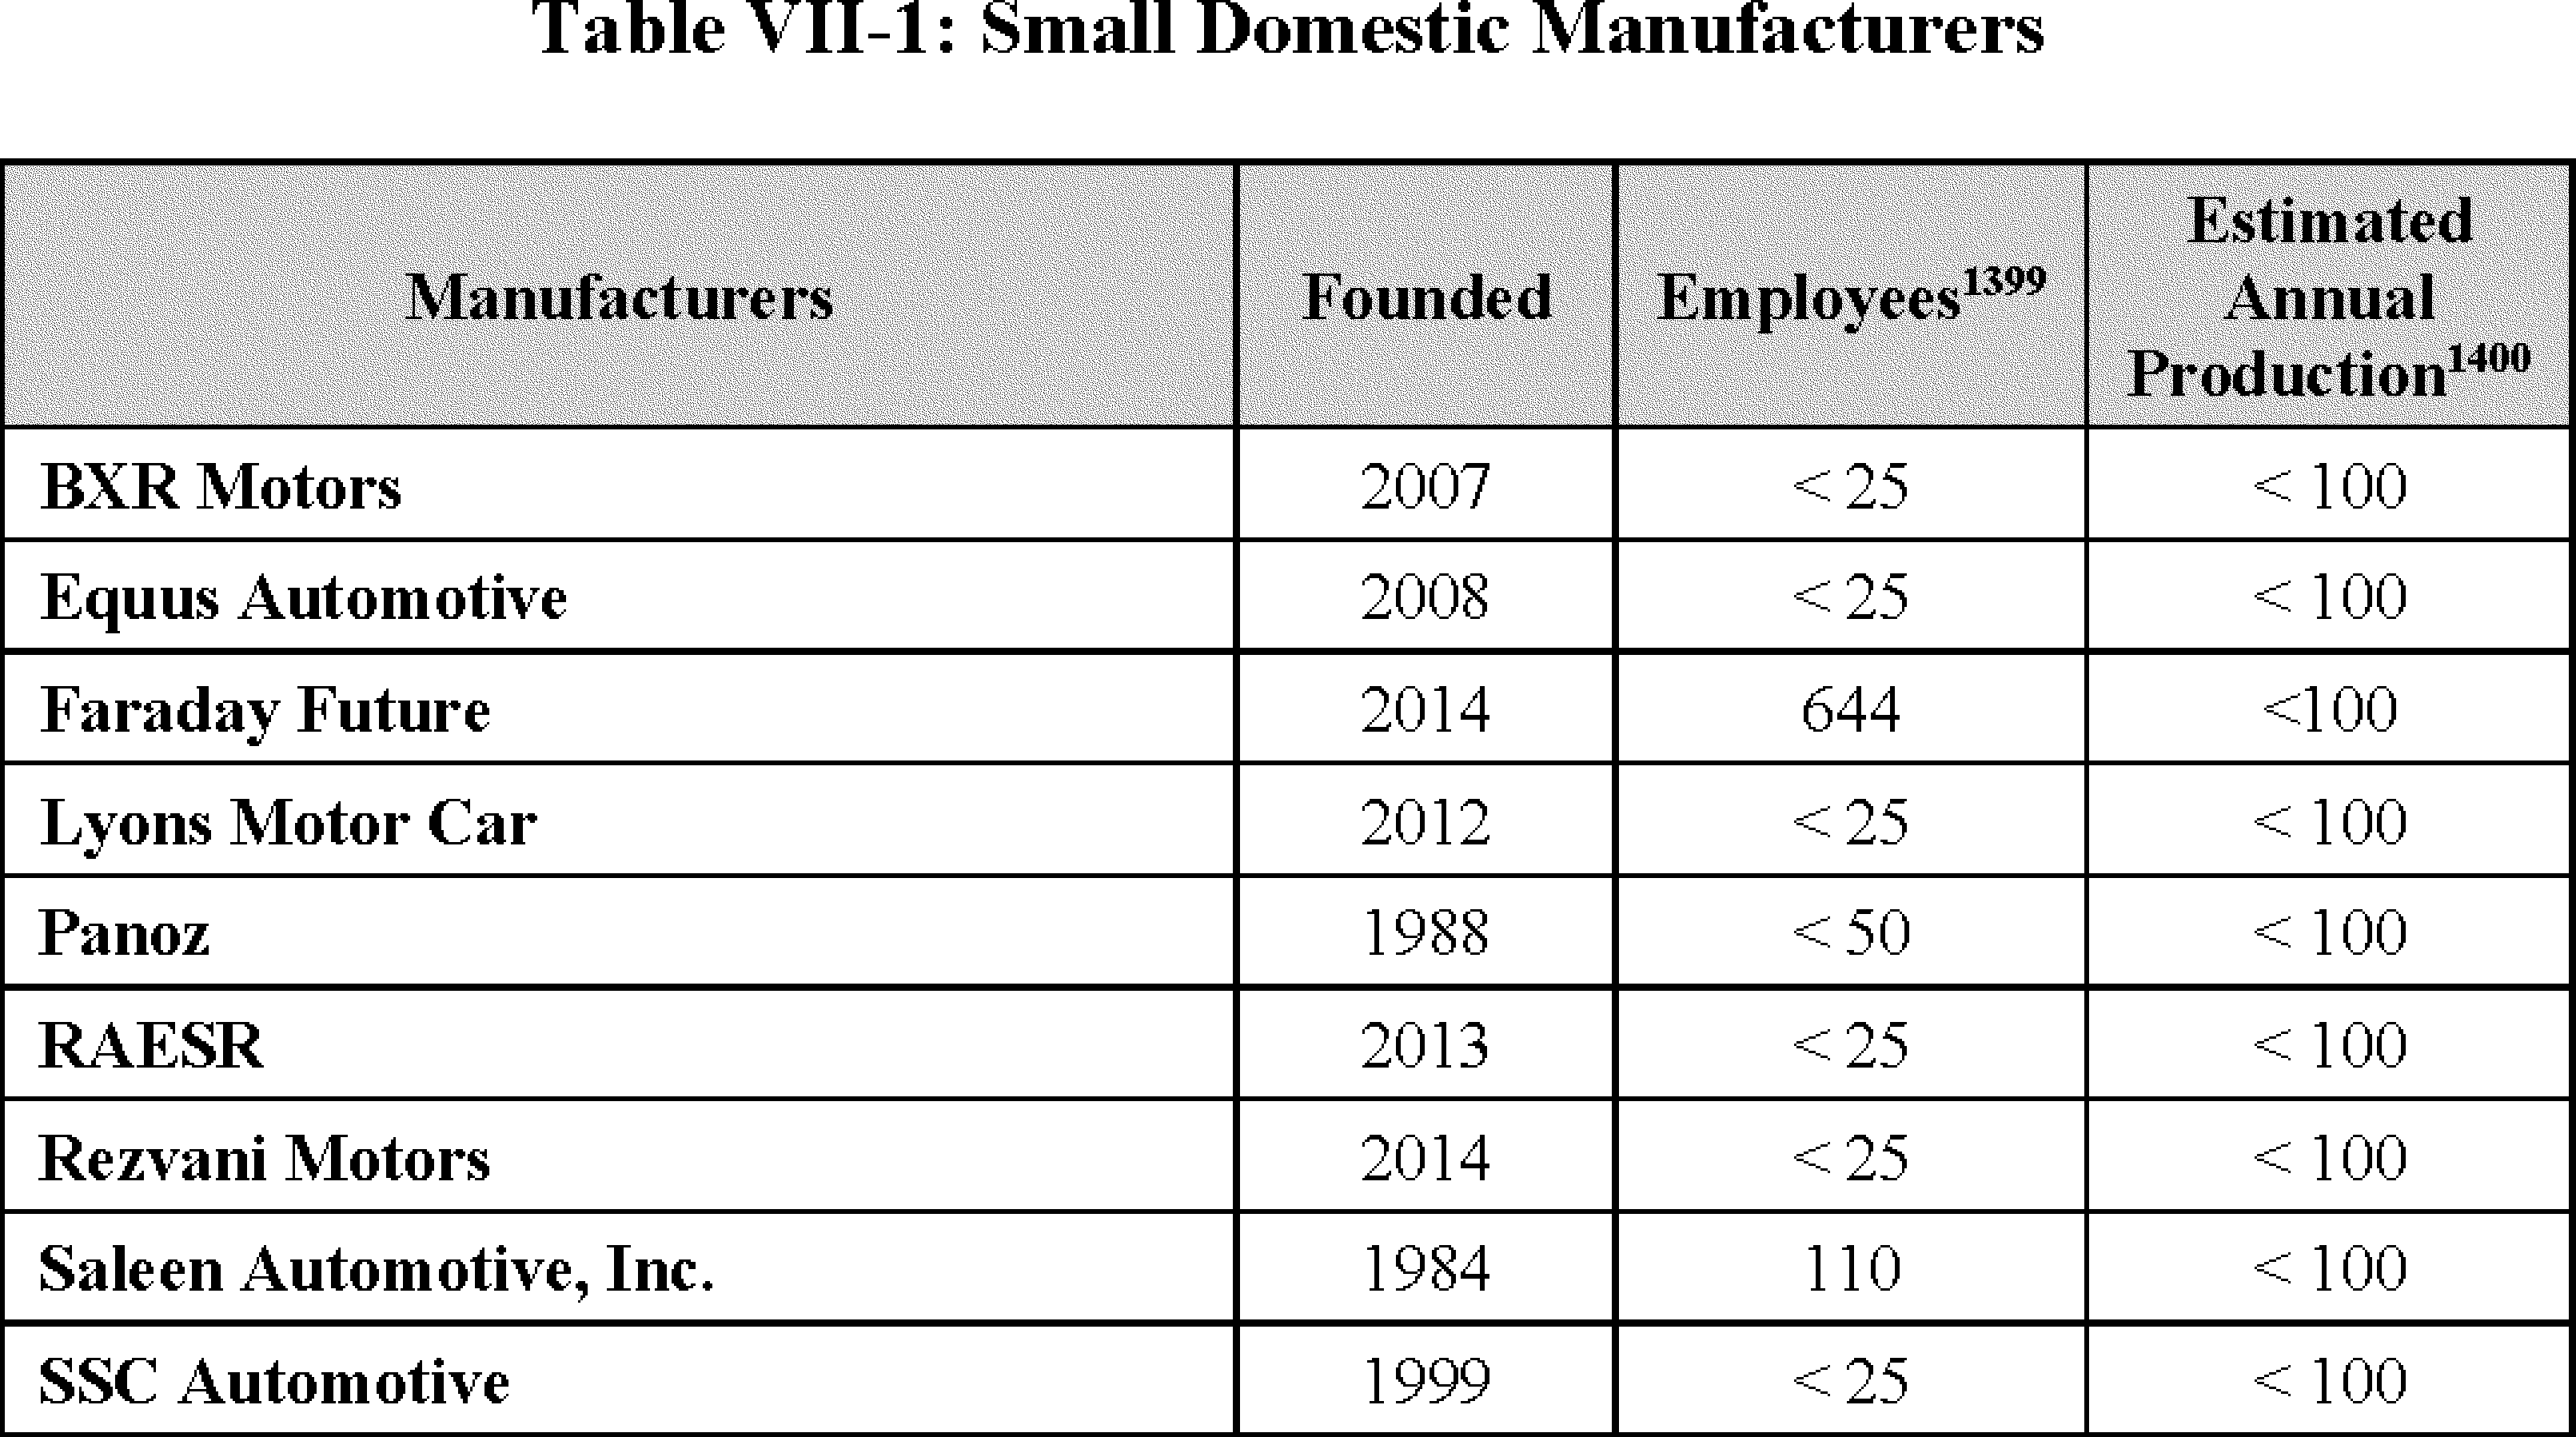
 www.sae.org/standards/sae-reading-room
 www.nhtsa.gov
 www.archives.gov/federal-register/cfr/ibr-locations.html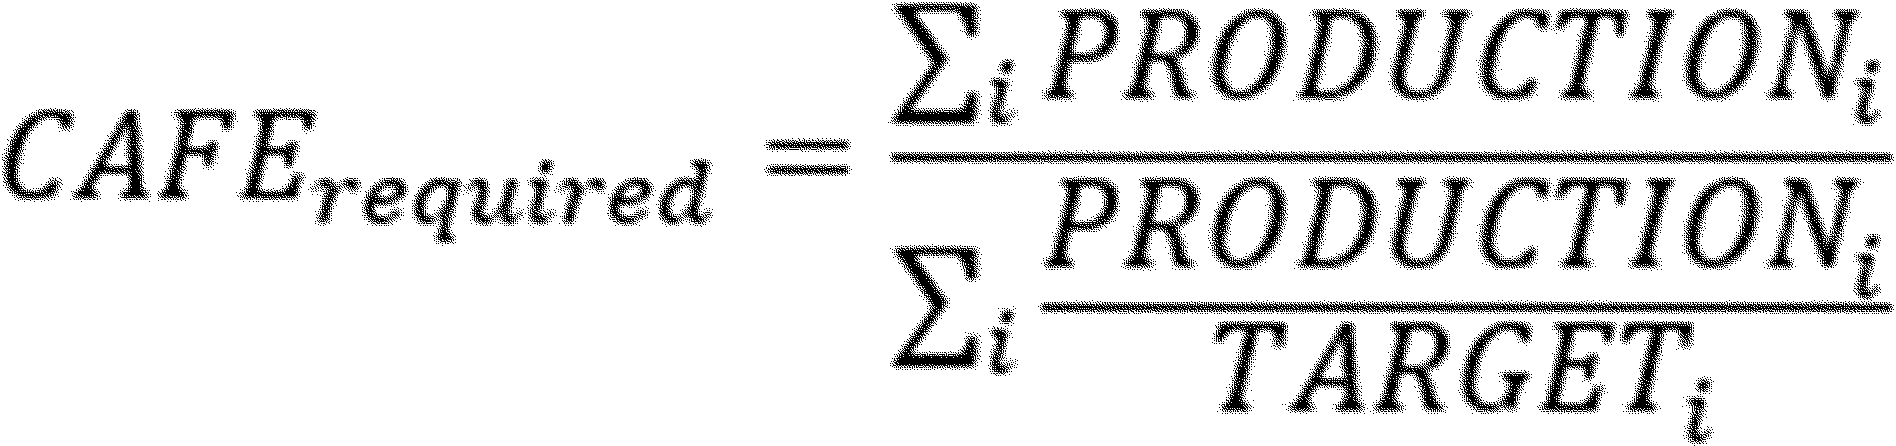

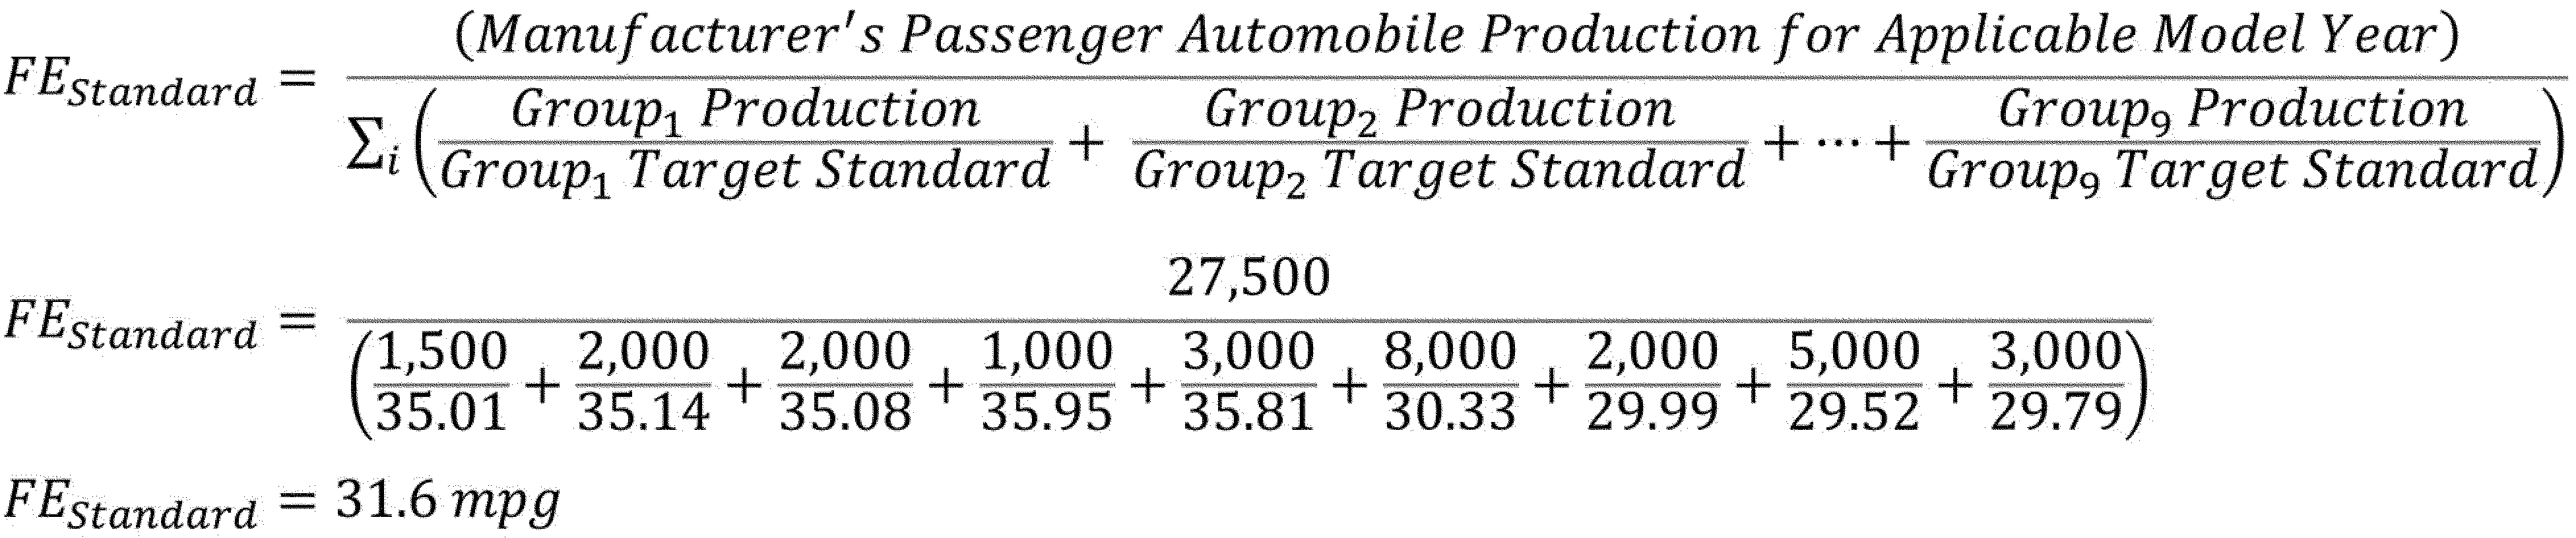
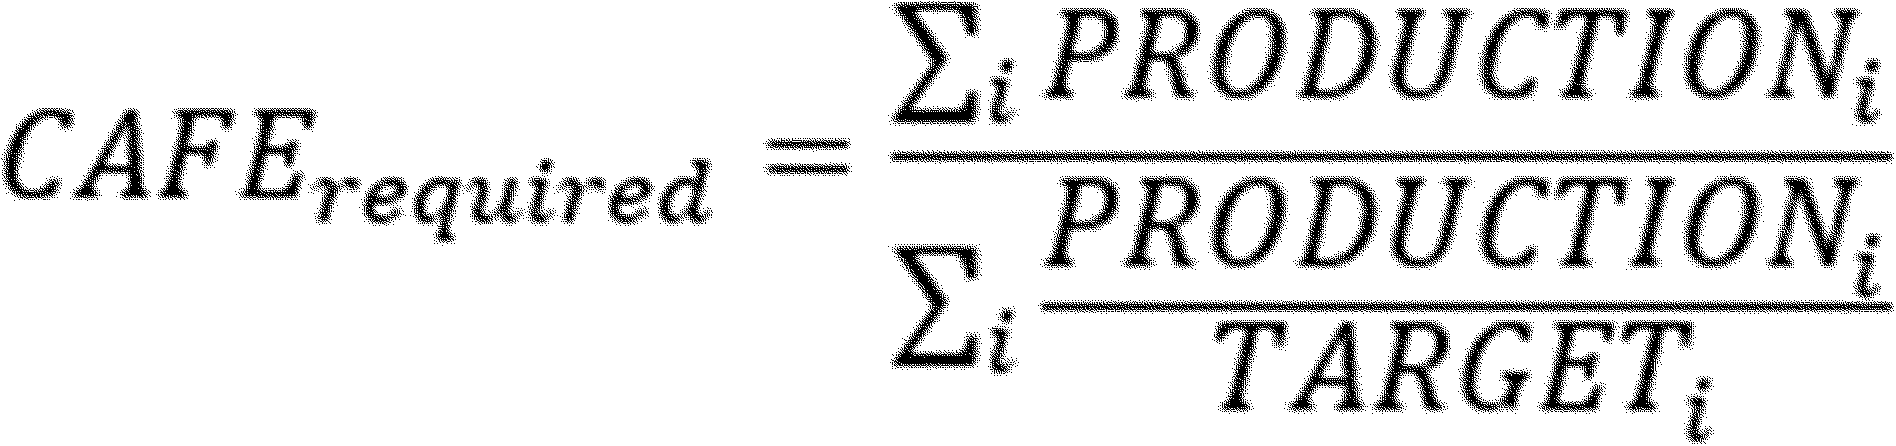

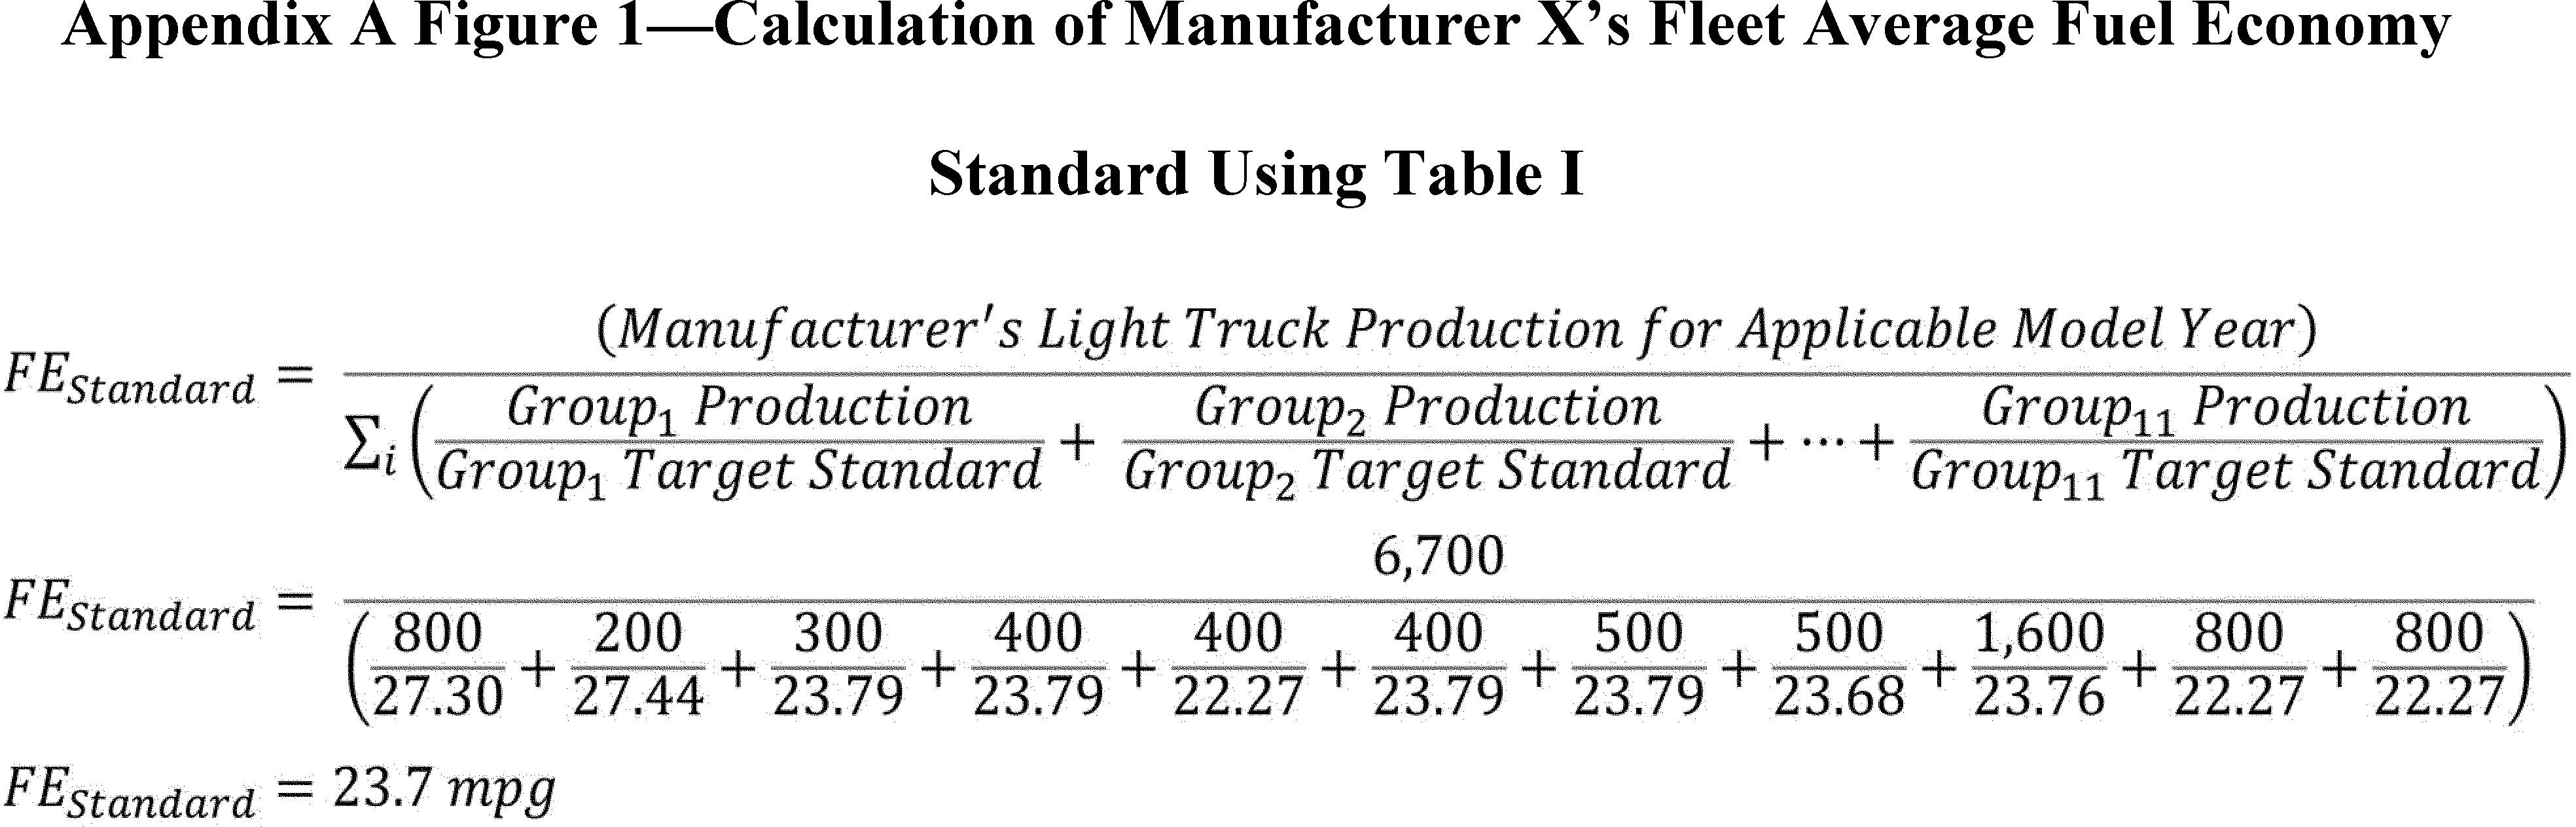

 www.nationalacademies.org/publications/10172
 www.transportation.gov/briefing-room/memorandum-fixing-cafe-program
 www.whitehouse.gov/wp-content/uploads/2025/08/CircularA-4.pdf
 www.epa.gov/moves
 www.eia.gov/outlooks/aeo/
 greet.anl.gov/
 www.anl.gov/cse/electrochemical-chemical-TEA
 www.gtisoft.com/gt-power/
 doi.org/10.1080/01621459.1992.10475190
 www.wiwiss.fu-berlin.de/fachbereich/bwl/pruefungs-steuerlehre/loeffler/Lehre/bachelor/investition/Friedman_the_methology_of_positive_economics.pdf
 gmauthority.com/blog/gm/chevrolet/silverado/2022-chevrolet-silverado/
 www.a2mac1.com
 downloads.regulations.gov/EPA-HQ-OAR-2022-0829-0230/attachment_1.pdf
 www.nacfe.org/research/overview
 www.merriam-webster.com/dictionary/regression%20analysis
 nepis.epa.gov/Exe/ZyPDF.cgi/P100AGJ1.PDF?Dockey=P100AGJ1.PDF
 www.mckinsey.com/~/media/McKinsey/Business%20Functions/McKinsey%20Digital/Our%20Insights/New%20horizons%20for%20multinational%20company%20investment/MGI_Multinational_company_investment_in_developing_economies_Full_Report.ashx
 nap.nationalacademies.org/catalog/10172/effectiveness-and-impact-of-corporate-average-fuel-economy-cafe-standards
 publications.anl.gov/anlpubs/2000/05/36074.pdf
 www.aeaweb.org/articles?id=10.1257/aer.90.4.1034
 www.jstor.org/stable/2634939
 ideas.repec.org/a/inm/oropre/v44y1996i1p77-86.html
 www.nber.org/papers/w18017
 www.congress.gov/crs-product/R47202
 www.irs.gov/pub/taxpros/fs-2022-42.pdf
 www.bts.gov/content/new-and-used-passenger-car-sales-and-leases-thousands-vehicles
 www.eenews.net/articles/the-untimely-death-of-americas-most-equitable-ev-rebate/
 www.tulatech.com/combustion-engine/
 pressroom.toyota.com/2024-toyota-tacoma-makes-debut-on-the-big-island-hawaii/
 www.kbb.com/car-advice/payload-guide/#link3
 www.motortrend.com/how-to/1502-sae-j2807-tow-tests-the-standard/
 www.iav.com/
 www.swri.org
 www.fueleconomy.gov/feg/octane.shtml#:~:text=You%20should%20use%20the%20octane%20rating%20required%20for,others%20are%20designed%20to%20use%20higher%20octane%20fuel
 lindseyresearch.com/wp-content/uploads/2021/09/NHTSA-2021-0053-0002-20190430_ANL_Eng-22-26-Updated_Docket.pdf
 theicct.org/publication/downsized-boosted-gasoline-engines-2/
 www.nesccaf.org/documents/rpt040923ghglightduty.pdf
 www.ramtrucks.com/electric/1500-rev.html
 omdia.tech.informa.com/om132144/us-car-and-light-truck-specifications-and-prices-22-model-year
 info.ornl.gov/sites/publications/files/Pub31483.pdf
 www.energy.gov/eere/vehicles/electric-drive-systems-research-and-development
 rhomotion.com/
 about.bnef.com/insights/clean-transport/electrified-transport-market-outlook-4q-2023-growth-ahead/
 benchmarkminerals.com/
 iea.blob.core.windows.net/assets/ad8fb04c-4f75-42fc-973a-6e54c8a4449a/GlobalElectricVehicleOutlook2022.pdf
 neo.ubs.com/shared/d1ZTxnvF2k
 portal.a2mac1.com/
 www.iea.org/reports/global-ev-outlook-2023
 www.caranddriver.com/reviews/a22815325/2019-ram-1500-etorque-hybrid-pickup-drive
 www.fromtheroad.ford.com/content/dam/fordmediasite/us/en/library/2021/specs/2021-F-150-Technical-Specs.pdf
 www.edmunds.com/ford/f-150/2014/features-specs/
 www.compositesworld.com/articles/carbon-fiber-suppliers-gear-up-for-next-gen-growth
 static.nhtsa.gov/nhtsa/downloads/CAFE/2017-25_Final/811666.pdf
 ww2.arb.ca.gov/sites/default/files/2020-04/13_313_ac.pdf
 www.sciencedirect.com/science/article/abs/pii/S0965856417308546
 mediaroom.kbb.com/2026-05-12-Kelley-Blue-Book-Report-Annual-New-Vehicle-Price-Gains-Slow-in-April-as-Market-Hits-Headwinds
 www.census.gov/data/tables/time-series/demo/income-poverty/historical-income-households.html
 www.spglobal.com/mobility/en/research-analysis/average-age-vehicles-united-states-2024.html
 cfpub.epa.gov/si/si_public_record_Report.cfm?Lab=OTAQ&dirEntryId=352754
 media.rff.org/documents/WP_19-01_rev_2021.pdf
 www.nada.org/nada/research-data/nada-data
 dx.doi.org/10.1787/8516ab3a-en
 resources.environment.yale.edu/gillingham/Gillingham_ReboundFuelEconomyStds.pdf
 www.federalregister.gov/documents/2025/08/01/2025-14572/reconsideration-of-2009-endangerment-finding-and-greenhouse-gas-vehicle-standards
 19january2017snapshot.epa.gov/benmap/estimating-benefit-ton-reducing-pm25-precursors-17-sectors_.html
 policyintegrity.org/files/publications/Cars_Hidden_Externalities_Report.pdf
 www.npr.org/2025/06/25/nx-s1-5444030/oil-prices-iran-israel
 www.jlr.com/download-centre?_gl=1*1nnalls*_ga*MTkyNDk3NDUzNy4xNzUyNTk3MDE4*_ga_G78VTFVFM0*czE3NTI1OTcwMTckbzEkZzEkdDE3NTI1OTcwNTYkajIxJGwwJGgw
 investor.gm.com/static-files/f5f872bd-9612-47f9-a5e1-d6c0ce1e6772
 www.toyota.com/content/dam/tusa/usa/our-story/code-of-conduct-en.pdf
 csr.honda.com/longform-content/honda-corporate-responsibility-statement/
 www.stellantis.com/content/dam/stellantis-corporate/group/governance/code-of-conduct/Stellantis_CoC_EN.pdf
 www.cnn.com/2024/04/24/business/ford-earnings-ev-losses
 www.instituteforenergyresearch.org/renewable/hurricane-ian-is-not-a-friend-of-electric-vehicles/
 www.iafc.org/topics-and-tools/resources/resource/iafc-s-fire-department-response-to-electric-vehicle-fires-bulletin
 abcnews.go.com/US/gas-hits-highest-price-years-fuel-outages-persist/story?id=77735010
 www.rff.org/documents/1541/RFF-DP-03-59.pdf
 afdc.energy.gov/data/10306
 autocatalogarchive.com/index-brand/
 www.jeepdatabase.com/
 www.reuters.com/business/autos-transportation/teslas-easy-money-regulatory-credits-set-dry-up-amid-weakening-sales-2025-07-22/
 www.doi.gov/sites/doi.opengov.ibmcloud.com/files/uploads/M-37017.pdf
 www.sba.gov/document/support-table-size-standards
 apps.bea.gov/iTable/?reqid=19&step=2&isuri=1&categories=survey